Embed Size (px)
Citation preview

Page 1 of 6
N E W S R E L E A S E
Investors: Brett Manderfeld John S. Penshorn Media: Tyler Mason Vice President Senior Vice President Vice President 952-936-7216 952-936-7214 424-333-6122 (For Immediate Release)
UNITEDHEALTH GROUP REPORTS FIRST QUARTER RESULTS
• First Quarter Revenues of $55.2 Billion Grew 13.3% Year-Over-Year
• Earnings from Operations Increased 18.8% to $4.1 Billion, with Every Business Reporting
Double-Digit Percentage Earnings Growth
• Cash Flows from Operations were $8.4 Billion in First Quarter; Adjusted Cash Flows from
Operations were $3.2 Billion
• First Quarter Net Earnings of $2.87 Per Share Grew 28.7% Year-Over-Year
• First Quarter Adjusted Net Earnings of $3.04 Per Share Grew 28.3% Year-Over-Year
NEW YORK, NY (April 17, 2018) – UnitedHealth Group (NYSE: UNH) reported first quarter results, led by
continued strong, broad-based performance across the enterprise.
“Through the intense focus our 285,000 colleagues bring to helping people live healthier lives and helping make the
health system work better for everyone, we have grown to serve more people in more ways than ever, including
through innovative uses of advanced technologies, data analytics, and modern clinical approaches that improve
quality, lower cost and advance consumer and care provider satisfaction,” said David S. Wichmann, chief executive
officer of UnitedHealth Group.
Based on first quarter results and the business outlook for the balance of the year, UnitedHealth Group has increased
its outlook for 2018 net earnings to a range of $11.70 to $11.95 per share and adjusted net earnings of $12.40 to
$12.65 per share.

Page 2 of 6
Quarterly Financial Performance
Three Months Ended
March 31, March 31, December 31,
2018 2017 2017
Revenues $55.2 billion $48.7 billion $52.1 billion Earnings From Operations Net Margin
$4.1 billion 5.1%
$3.4 billion 4.5%
$4.0 billion 6.9%1
1 Fourth quarter 2017 included a $1.2 billion favorable non-cash revaluation of the Company’s U.S. net deferred tax liability, increasing net margin by 230 basis points in that quarter.
• UnitedHealth Group’s first quarter 2018 revenues grew 13.3 percent or $6.5 billion year-over-year to
$55.2 billion.
• First quarter earnings from operations grew $640 million or 18.8 percent year-over-year to $4.1 billion. Adjusted
net earnings of $3.04 per share grew 28.3 percent.
• Adjusted cash flows from operations of $3.2 billion were 1.1x net income in first quarter 2018, compared to
$2.0 billion and 0.9x net income in first quarter 2017.
• The revenue effect from the return of the health insurance tax in first quarter 2018 was the primary driver of the
100 basis point year-over-year decrease in the consolidated medical care ratio to 81.4 percent. Medical cost
reserves developed favorably by $290 million in first quarter 2018.
• The operating cost ratio of 15.4 percent in the first quarter of 2018 increased 100 basis points year-over-year in
response to the return of the health insurance tax.
• The first quarter 2018 income tax rate of 21.5 percent reflected the reduced federal statutory rate and seasonally
higher stock-based compensation activity, partially offset by the return of the nondeductible health insurance tax.
• First quarter 2018 days claims payable of 49 days were essentially flat sequentially and year-over-year; first
quarter days sales outstanding rose two days sequentially and one day year-over-year to 19 days, due to the
addition of Empresas Banmédica and growth in government-based offerings.
• UnitedHealth Group repurchased 11.6 million shares for $2.65 billion in the first quarter and paid $722 million in
dividends to shareholders, an increase of 21.1 percent over first quarter 2017.
• Annualized return on shareholders’ equity increased 210 basis points year-over-year to 23.8 percent in the first
quarter. Debt to total capital of 41.6 percent at March 31, 2018 decreased 190 basis points year-over-year, while
increasing 270 basis points sequentially due principally to the Empresas Banmédica merger.
Page 3 of 6
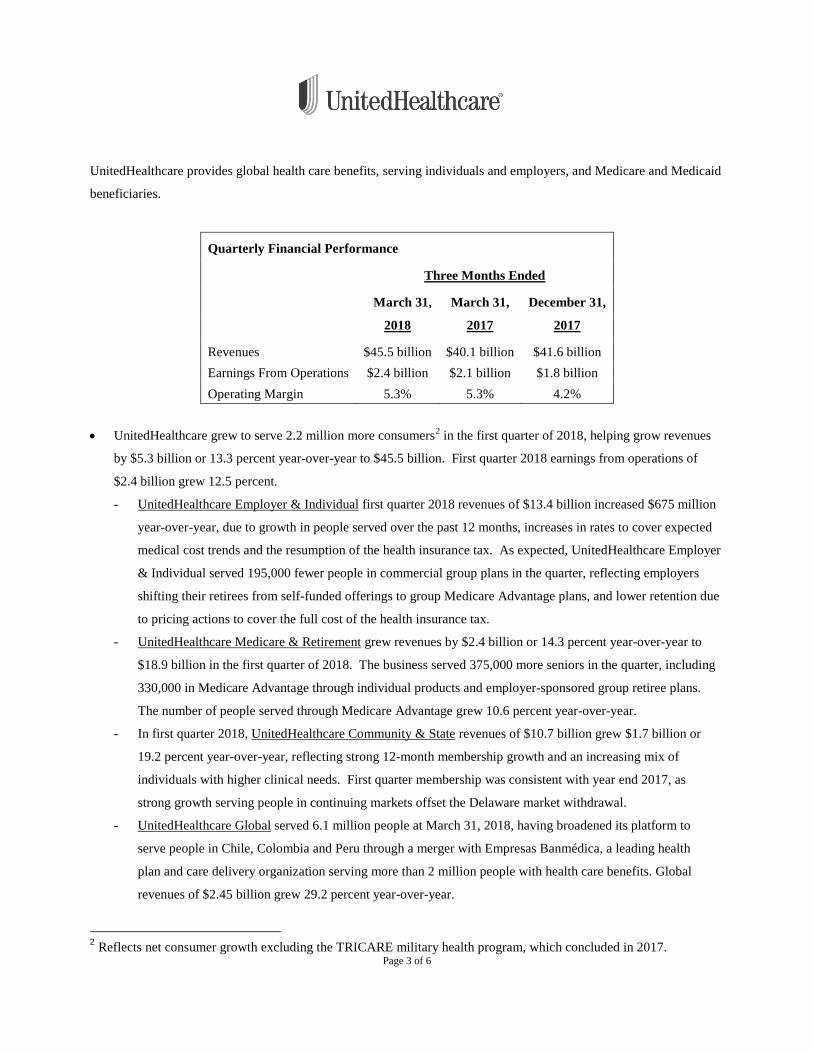
UnitedHealthcare provides global health care benefits, serving individuals and employers, and Medicare and Medicaid
beneficiaries.
Quarterly Financial Performance
Three Months Ended
March 31, March 31, December 31,
2018 2017 2017
Revenues $45.5 billion $40.1 billion $41.6 billion Earnings From Operations $2.4 billion $2.1 billion $1.8 billion Operating Margin 5.3% 5.3% 4.2%
• UnitedHealthcare grew to serve 2.2 million more consumers2 in the first quarter of 2018, helping grow revenues
by $5.3 billion or 13.3 percent year-over-year to $45.5 billion. First quarter 2018 earnings from operations of
$2.4 billion grew 12.5 percent.
- UnitedHealthcare Employer & Individual first quarter 2018 revenues of $13.4 billion increased $675 million
year-over-year, due to growth in people served over the past 12 months, increases in rates to cover expected
medical cost trends and the resumption of the health insurance tax. As expected, UnitedHealthcare Employer
& Individual served 195,000 fewer people in commercial group plans in the quarter, reflecting employers
shifting their retirees from self-funded offerings to group Medicare Advantage plans, and lower retention due
to pricing actions to cover the full cost of the health insurance tax.
- UnitedHealthcare Medicare & Retirement grew revenues by $2.4 billion or 14.3 percent year-over-year to
$18.9 billion in the first quarter of 2018. The business served 375,000 more seniors in the quarter, including
330,000 in Medicare Advantage through individual products and employer-sponsored group retiree plans.
The number of people served through Medicare Advantage grew 10.6 percent year-over-year.
- In first quarter 2018, UnitedHealthcare Community & State revenues of $10.7 billion grew $1.7 billion or
19.2 percent year-over-year, reflecting strong 12-month membership growth and an increasing mix of
individuals with higher clinical needs. First quarter membership was consistent with year end 2017, as
strong growth serving people in continuing markets offset the Delaware market withdrawal.
- UnitedHealthcare Global served 6.1 million people at March 31, 2018, having broadened its platform to
serve people in Chile, Colombia and Peru through a merger with Empresas Banmédica, a leading health
plan and care delivery organization serving more than 2 million people with health care benefits. Global
revenues of $2.45 billion grew 29.2 percent year-over-year.
2 Reflects net consumer growth excluding the TRICARE military health program, which concluded in 2017.
Page 4 of 6
Optum is a health services business serving the global health care marketplace, including payers, care providers,
employers, governments, life sciences companies and consumers. Using market-leading information, data analytics,
technology and clinical insights, Optum’s people help improve overall health system performance: optimizing care
quality, reducing health care costs and improving the consumer experience and health system performance.
Quarterly Financial Performance
Three Months Ended
March 31, March 31, December 31,
2018 2017 2017
Revenues $23.6 billion $21.2 billion $24.4 billion Earnings From Operations $1.7 billion $1.3 billion $2.2 billion Operating Margin 7.0% 6.0% 9.1%
• In the first quarter of 2018, Optum revenues grew year-over-year by $2.4 billion or 11.1 percent to $23.6 billion.
Optum’s operating margin of 7 percent increased 100 basis points year-over-year in total, with performance
improvements at each business. First quarter earnings from operations grew $374 million or 29.2 percent year-
over-year to $1.7 billion, with double-digit percentage increases for every business segment.
- OptumHealth revenues of $5.8 billion grew $1 billion or 21.7 percent year-over-year, driven by growth in
care delivery and behavioral, digital consumer engagement and health financial services. OptumHealth
served 91 million people at quarter end, having grown by 9 million people3 or 11 percent over the past year.
- OptumInsight revenues grew 12.3 percent to $2.1 billion in first quarter 2018, driven by growth and
expansion in payer technology and services and care provider advisory services. OptumInsight’s contract
backlog of $15.2 billion grew year-over-year by $2.1 billion or 16 percent.
- OptumRx first quarter 2018 revenues grew 7.8 percent year-over-year to $16.1 billion. OptumRx fulfilled
332 million adjusted scripts in first quarter 2018, growing 3.1 percent over the prior year, with favorable
mix in specialty pharmacy and home delivery services.
3 Reflects net consumer growth excluding the TRICARE military health program, which concluded in 2017.

Page 5 of 6
About UnitedHealth Group
UnitedHealth Group (NYSE: UNH) is a diversified health and well-being company dedicated to helping people live
healthier lives and helping make the health system work better for everyone. UnitedHealth Group offers a broad
spectrum of products and services through two distinct platforms: UnitedHealthcare, which provides health care
coverage and benefits services; and Optum, which provides information and technology-enabled health services. For
more information, visit UnitedHealth Group at www.unitedhealthgroup.com or follow @UnitedHealthGrp on Twitter.
Earnings Conference Call
As previously announced, UnitedHealth Group will discuss the Company’s results, strategy and future outlook on a
conference call with investors at 8:45 a.m. Eastern Time today. UnitedHealth Group will host a live webcast of this
conference call from the Investors page of the Company’s website (www.unitedhealthgroup.com). Following the call,
a webcast replay will be available on the same site through May 1, 2018. The conference call replay can also be
accessed by dialing 1-800-753-8878. This earnings release and the Form 8-K dated April 17, 2018 can also be
accessed from the Investors page of the Company’s website.
Non-GAAP Financial Information
This news release presents non-GAAP financial information provided as a complement to the results provided in
accordance with accounting principles generally accepted in the United States of America (“GAAP”). A reconciliation
of the non-GAAP financial information to the most directly comparable GAAP financial measure is provided in the
accompanying tables found at the end of this release.
Forward-Looking Statements
The statements, estimates, projections, guidance or outlook contained in this document include “forward-looking”
statements within the meaning of the Private Securities Litigation Reform Act of 1995 (PSLRA). These statements are
intended to take advantage of the “safe harbor” provisions of the PSLRA. Generally the words “believe,” “expect,”
“intend,” “estimate,” “anticipate,” “forecast,” “outlook,” “plan,” “project,” “should” and similar expressions identify
forward-looking statements, which generally are not historical in nature. These statements may contain information
about financial prospects, economic conditions and trends and involve risks and uncertainties. We caution that actual
results could differ materially from those that management expects, depending on the outcome of certain factors.
Some factors that could cause actual results to differ materially from results discussed or implied in the forward-
looking statements include: our ability to effectively estimate, price for and manage our medical costs, including the
impact of any new coverage requirements; new laws or regulations, or changes in existing laws or regulations, or their
enforcement or application, including increases in medical, administrative, technology or other costs or decreases in
enrollment resulting from U.S., Brazilian and other jurisdictions’ regulations affecting the health care industry; the
outcome of the Department of Justice’s legal actions relating to risk adjustment submission matters; our ability to
maintain and achieve improvement in CMS star ratings and other quality scores that impact revenue; reductions in
revenue or delays to cash flows received under Medicare, Medicaid and other government programs, including the
Page 6 of 6
effects of a prolonged U.S. government shutdown or debt ceiling constraints; changes in Medicare, including changes
in payment methodology, the CMS star ratings program or the application of risk adjustment data validation audits;
cyber-attacks or other privacy or data security incidents; failure to comply with privacy and data security regulations;
regulatory and other risks and uncertainties of the pharmacy benefits management industry; competitive pressures,
which could affect our ability to maintain or increase our market share; changes in or challenges to our public sector
contract awards; our ability to execute contracts on competitive terms with physicians, hospitals and other service
providers; failure to achieve targeted operating cost productivity improvements, including savings resulting from
technology enhancement and administrative modernization; increases in costs and other liabilities associated with
increased litigation, government investigations, audits or reviews; failure to manage successfully our strategic alliances
or complete or receive anticipated benefits of acquisitions and other strategic transactions; fluctuations in foreign
currency exchange rates on our reported shareholders’ equity and results of operations; downgrades in our credit
ratings; the performance of our investment portfolio; impairment of the value of our goodwill and intangible assets if
estimated future results do not adequately support goodwill and intangible assets recorded for our existing businesses
or the businesses that we acquire; failure to maintain effective and efficient information systems or if our technology
products do not operate as intended; and our ability to obtain sufficient funds from our regulated subsidiaries or the
debt or capital markets to fund our obligations, to maintain our debt to total capital ratio at targeted levels, to maintain
our quarterly dividend payment cycle or to continue repurchasing shares of our common stock.
This list of important factors is not intended to be exhaustive. We discuss certain of these matters more fully, as well as
certain risk factors that may affect our business operations, financial condition and results of operations, in our filings
with the Securities and Exchange Commission, including our annual reports on Form 10-K, quarterly reports on Form
10-Q and current reports on Form 8-K. Any or all forward-looking statements we make may turn out to be wrong, and
can be affected by inaccurate assumptions we might make or by known or unknown risks and uncertainties. By their
nature, forward-looking statements are not guarantees of future performance or results and are subject to risks,
uncertainties and assumptions that are difficult to predict or quantify. Actual future results may vary materially from
expectations expressed or implied in this document or any of our prior communications. You should not place undue
reliance on forward-looking statements, which speak only as of the date they are made. We do not undertake to update
or revise any forward-looking statements, except as required by applicable securities laws.
UNITEDHEALTH GROUPEarnings Release Schedules and Supplementary Information
Quarter Ended March 31, 2018
• Condensed Consolidated Statements of Operations
• Condensed Consolidated Balance Sheets
• Condensed Consolidated Statements of Cash Flows
• Supplemental Financial Information - Businesses
• Supplemental Financial Information - Business Metrics
• Reconciliation of Non-GAAP Financial Measures

1
UNITEDHEALTH GROUPCONDENSED CONSOLIDATED STATEMENTS OF OPERATIONS
(in millions, except per share data)(unaudited)
Three Months Ended March 31,
2018 2017RevenuesPremiums ....................................................................................................................................................................... $44,084 $38,938Products ......................................................................................................................................................................... 6,702 6,129Services .......................................................................................................................................................................... 4,104 3,434Investment and other income ......................................................................................................................................... 298 222 Total revenues ........................................................................................................................................................... 55,188 48,723Operating costsMedical costs .................................................................................................................................................................. 35,863 32,079Operating costs .............................................................................................................................................................. 8,506 7,022Cost of products sold ...................................................................................................................................................... 6,184 5,676Depreciation and amortization ........................................................................................................................................ 582 533 Total operating costs .................................................................................................................................................. 51,135 45,310Earnings from operations ............................................................................................................................................ 4,053 3,413Interest expense ............................................................................................................................................................. (329) (283)Earnings before income taxes ..................................................................................................................................... 3,724 3,130Provision for income taxes .............................................................................................................................................. (800) (939)Net earnings .................................................................................................................................................................. 2,924 2,191Earnings attributable to noncontrolling interests ............................................................................................................. (88) (19)Net earnings attributable to UnitedHealth Group common shareholders ............................................................... $2,836 $2,172Diluted earnings per share attributable to UnitedHealth Group common shareholders ........................................ $2.87 $2.23Adjusted earnings per share attributable to UnitedHealth Group common shareholders (a) ............................... $3.04 $2.37Diluted weighted-average common shares outstanding ................................................................................................. 987 975
(a) See page 6 for a reconciliation of the non-GAAP measure

2
UNITEDHEALTH GROUPCONDENSED CONSOLIDATED BALANCE SHEETS
(in millions)(unaudited)
March 31, 2018
December 31, 2017
AssetsCash and short-term investments ................................................................................................................. $22,041 $15,490Accounts receivable, net ............................................................................................................................... 11,512 9,568Other current assets ..................................................................................................................................... 14,800 12,026
Total current assets .............................................................................................................................. 48,353 37,084Long-term investments .................................................................................................................................. 29,441 28,341Other long-term assets .................................................................................................................................. 77,775 73,633
Total assets ............................................................................................................................................. $155,569 $139,058Liabilities, redeemable noncontrolling interests and equityMedical costs payable ................................................................................................................................... $19,589 $17,871Commercial paper and current maturities of long-term debt .......................................................................... 7,379 2,857Other current liabilities .................................................................................................................................. 40,699 29,735
Total current liabilities ........................................................................................................................... 67,667 50,463Long-term debt, less current maturities ......................................................................................................... 28,206 28,835Other long-term liabilities .............................................................................................................................. 7,770 7,738Redeemable noncontrolling interests ............................................................................................................ 1,890 2,189Equity ............................................................................................................................................................ 50,036 49,833
Total liabilities, redeemable noncontrolling interests and equity .............................................................. $155,569 $139,058
3
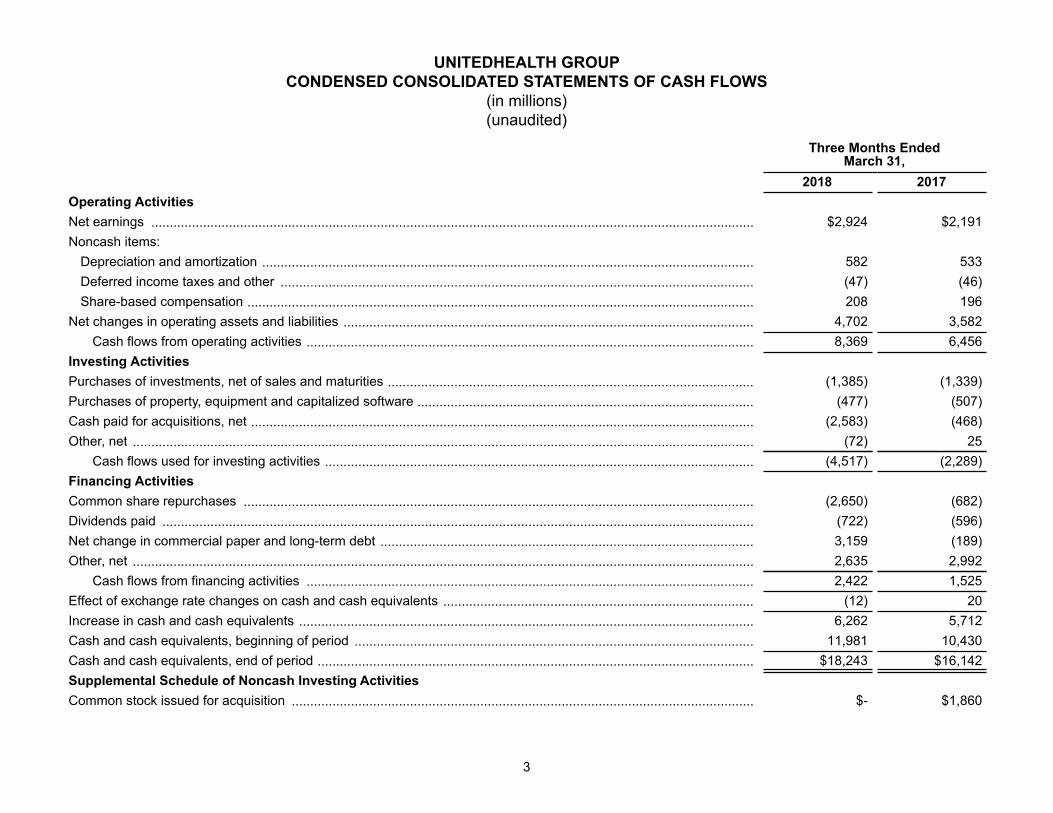
UNITEDHEALTH GROUPCONDENSED CONSOLIDATED STATEMENTS OF CASH FLOWS
(in millions)(unaudited)
Three Months Ended March 31,
2018 2017Operating ActivitiesNet earnings ................................................................................................................................................................... $2,924 $2,191Noncash items:
Depreciation and amortization ..................................................................................................................................... 582 533Deferred income taxes and other ................................................................................................................................ (47) (46)Share-based compensation ......................................................................................................................................... 208 196
Net changes in operating assets and liabilities ............................................................................................................... 4,702 3,582Cash flows from operating activities ......................................................................................................................... 8,369 6,456
Investing ActivitiesPurchases of investments, net of sales and maturities ................................................................................................... (1,385) (1,339)Purchases of property, equipment and capitalized software ........................................................................................... (477) (507)Cash paid for acquisitions, net ........................................................................................................................................ (2,583) (468)Other, net ........................................................................................................................................................................ (72) 25
Cash flows used for investing activities .................................................................................................................... (4,517) (2,289)Financing ActivitiesCommon share repurchases .......................................................................................................................................... (2,650) (682)Dividends paid ................................................................................................................................................................ (722) (596)Net change in commercial paper and long-term debt ..................................................................................................... 3,159 (189)Other, net ........................................................................................................................................................................ 2,635 2,992
Cash flows from financing activities ......................................................................................................................... 2,422 1,525Effect of exchange rate changes on cash and cash equivalents .................................................................................... (12) 20Increase in cash and cash equivalents ........................................................................................................................... 6,262 5,712Cash and cash equivalents, beginning of period ............................................................................................................ 11,981 10,430Cash and cash equivalents, end of period ...................................................................................................................... $18,243 $16,142Supplemental Schedule of Noncash Investing ActivitiesCommon stock issued for acquisition ............................................................................................................................. $- $1,860

4
UNITEDHEALTH GROUPSUPPLEMENTAL FINANCIAL INFORMATION - BUSINESSES
(in millions, except percentages)(unaudited)
Three Months Ended March 31,
2018 2017RevenuesUnitedHealthcare ........................................................................................................................................................... $45,459 $40,136Optum ............................................................................................................................................................................ 23,601 21,237Eliminations .................................................................................................................................................................... (13,872) (12,650)
Total consolidated revenues .................................................................................................................................... $55,188 $48,723Earnings from OperationsUnitedHealthcare ........................................................................................................................................................... $2,400 $2,134Optum (a) ....................................................................................................................................................................... 1,653 1,279
Total consolidated earnings from operations ............................................................................................................ $4,053 $3,413Operating MarginUnitedHealthcare ........................................................................................................................................................... 5.3% 5.3%Optum ............................................................................................................................................................................ 7.0% 6.0%
Consolidated operating margin ................................................................................................................................ 7.3% 7.0%
RevenuesUnitedHealthcare Employer & Individual ........................................................................................................................ $13,414 $12,739UnitedHealthcare Medicare & Retirement ...................................................................................................................... 18,925 16,552UnitedHealthcare Community & State ............................................................................................................................ 10,671 8,949UnitedHealthcare Global ................................................................................................................................................ 2,449 1,896
OptumHealth .................................................................................................................................................................. $5,759 $4,733OptumInsight .................................................................................................................................................................. 2,069 1,843OptumRx ........................................................................................................................................................................ 16,106 14,947Optum eliminations ......................................................................................................................................................... (333) (286)
(a) Earnings from operations for Optum for the three months ended March 31, 2018 and 2017 included $488 and $332 for OptumHealth; $395 and $294 for OptumInsight; and $770 and $653 for OptumRx, respectively.
5
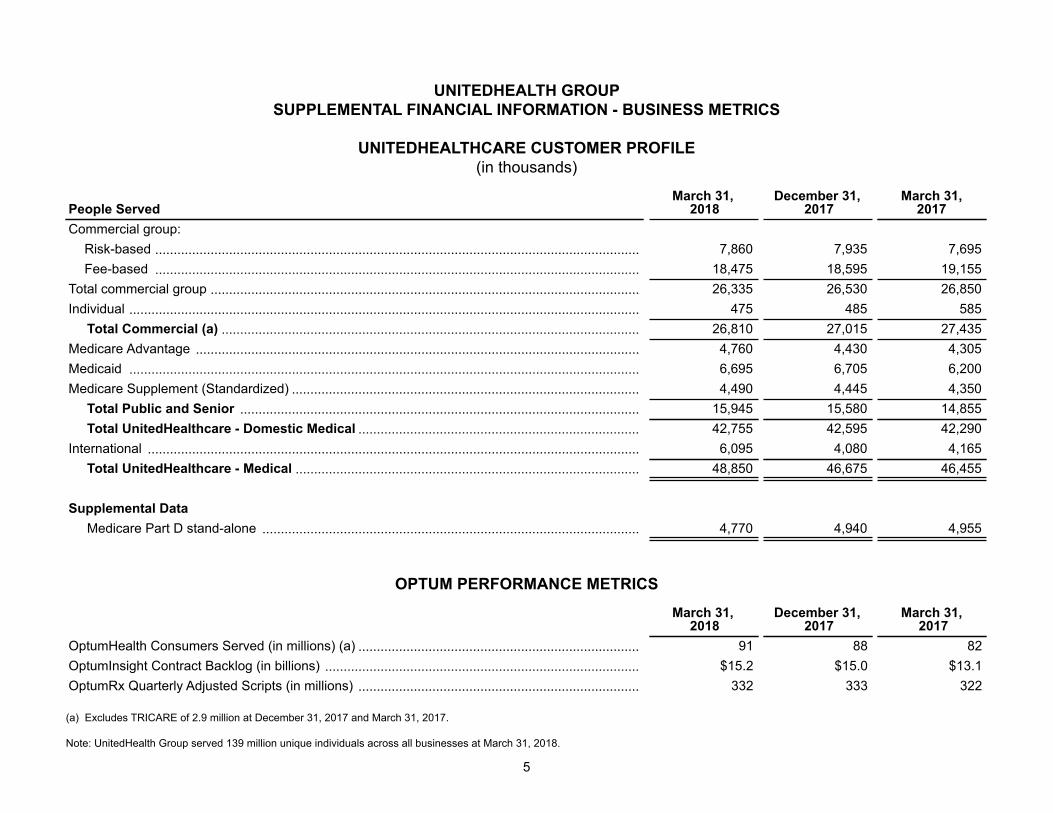
UNITEDHEALTH GROUPSUPPLEMENTAL FINANCIAL INFORMATION - BUSINESS METRICS
UNITEDHEALTHCARE CUSTOMER PROFILE(in thousands)
People ServedMarch 31,
2018December 31,
2017March 31,
2017Commercial group:
Risk-based ................................................................................................................................... 7,860 7,935 7,695Fee-based ................................................................................................................................... 18,475 18,595 19,155
Total commercial group .................................................................................................................... 26,335 26,530 26,850Individual .......................................................................................................................................... 475 485 585 Total Commercial (a) ................................................................................................................. 26,810 27,015 27,435Medicare Advantage ........................................................................................................................ 4,760 4,430 4,305Medicaid .......................................................................................................................................... 6,695 6,705 6,200Medicare Supplement (Standardized) .............................................................................................. 4,490 4,445 4,350 Total Public and Senior ............................................................................................................ 15,945 15,580 14,855 Total UnitedHealthcare - Domestic Medical ............................................................................ 42,755 42,595 42,290International ..................................................................................................................................... 6,095 4,080 4,165 Total UnitedHealthcare - Medical ............................................................................................. 48,850 46,675 46,455
Supplemental Data Medicare Part D stand-alone ...................................................................................................... 4,770 4,940 4,955
OPTUM PERFORMANCE METRICS
March 31, 2018
December 31, 2017
March 31, 2017
OptumHealth Consumers Served (in millions) (a) ............................................................................ 91 88 82OptumInsight Contract Backlog (in billions) ..................................................................................... $15.2 $15.0 $13.1OptumRx Quarterly Adjusted Scripts (in millions) ............................................................................ 332 333 322
(a) Excludes TRICARE of 2.9 million at December 31, 2017 and March 31, 2017.
Note: UnitedHealth Group served 139 million unique individuals across all businesses at March 31, 2018.
6
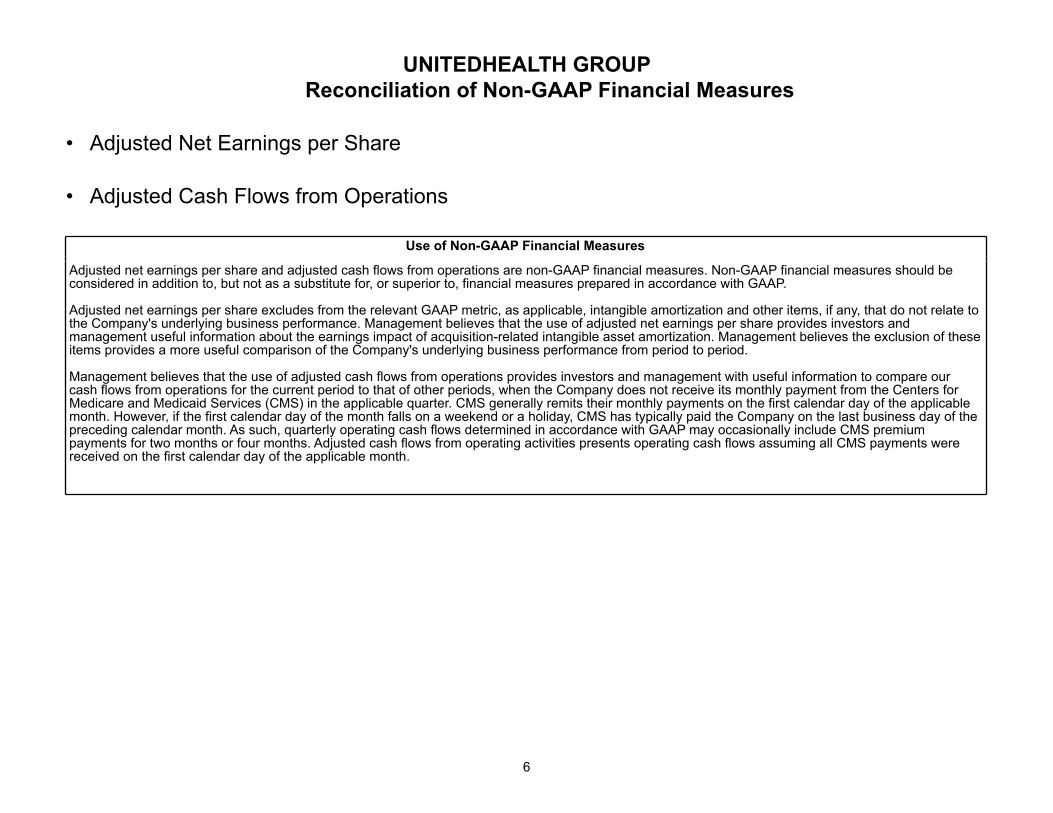
UNITEDHEALTH GROUPReconciliation of Non-GAAP Financial Measures
• Adjusted Net Earnings per Share
• Adjusted Cash Flows from Operations
Use of Non-GAAP Financial Measures
Adjusted net earnings per share and adjusted cash flows from operations are non-GAAP financial measures. Non-GAAP financial measures should be considered in addition to, but not as a substitute for, or superior to, financial measures prepared in accordance with GAAP.
Adjusted net earnings per share excludes from the relevant GAAP metric, as applicable, intangible amortization and other items, if any, that do not relate to the Company's underlying business performance. Management believes that the use of adjusted net earnings per share provides investors and management useful information about the earnings impact of acquisition-related intangible asset amortization. Management believes the exclusion of these items provides a more useful comparison of the Company's underlying business performance from period to period.
Management believes that the use of adjusted cash flows from operations provides investors and management with useful information to compare our cash flows from operations for the current period to that of other periods, when the Company does not receive its monthly payment from the Centers for Medicare and Medicaid Services (CMS) in the applicable quarter. CMS generally remits their monthly payments on the first calendar day of the applicable month. However, if the first calendar day of the month falls on a weekend or a holiday, CMS has typically paid the Company on the last business day of the preceding calendar month. As such, quarterly operating cash flows determined in accordance with GAAP may occasionally include CMS premium payments for two months or four months. Adjusted cash flows from operating activities presents operating cash flows assuming all CMS payments were received on the first calendar day of the applicable month.

7
UNITEDHEALTH GROUPRECONCILIATION OF NON-GAAP FINANCIAL MEASURES
(in millions, except per share data)(unaudited)
ADJUSTED NET EARNINGS PER SHARE
Three Months Ended March 31,
ProjectedYear Ended
December 31,2018 2017 2018
GAAP net earnings attributable to UnitedHealth Group common shareholders .................. $2,836 $2,172 $11,525 to $11,775Intangible amortization ........................................................................................................ 220 219 ~885Tax effect of intangible amortization .................................................................................... (55) (82) ~(220)
Adjusted net earnings attributable to UnitedHealth Group common shareholders ....... $3,001 $2,309 $12,200 to $12,450
GAAP diluted earnings per share ........................................................................................ $2.87 $2.23 $11.70 to $11.95Intangible amortization per share ........................................................................................ 0.22 0.22 ~0.90Tax effect per share of intangible amortization .................................................................... (0.05) (0.08) ~(0.20)
Adjusted diluted earnings per share ............................................................................. $3.04 $2.37 ~$12.40 to $12.65
ADJUSTED CASH FLOWS FROM OPERATIONS
Three Months Ended March 31,2018 2017
GAAP cash flows from operations ................................................................................................................ $8,369 $6,456Add: April CMS premium payments received in March ................................................................................ (5,144) (4,442)
Adjusted cash flows from operations ..................................................................................................... $3,225 $2,014