Embed Size (px)
Citation preview

My Top 3 Order Flow Trade Set Ups
Every trader should have set ups that they are on the lookout for each and
every trading day. I have several setups I am always scanning the market for.
When you trade with order flow you constantly see the market developing and
presenting you opportunities.
If you are trading only using indicators you don’t get setups, you get strict rules
to follow on when to take a trade even if it makes no sense to take a trade. For
example, if you trade using MACD, you take a trade when the MACD line
crosses zero on the histogram. Besides lagging the market, by the time the
MACD line crosses zero the market may have already made its major move and
by the time you get in to the market it’s too late you are just picking up the
table scraps left of the move. But you have no choice you have to take the
trade because your setup is when the MACD crossing the zero line. You don’t
take into account what the market is doing. That’s not trading.
Order flow trading allows me to see setups that are invisible to probably 99.5%
of traders because they are only using bar charts or candlestick charts. Those
traders are completely missing the market dynamics that are occurring.
I created the Orderflows Trader in order to help me see more these trade
setups more easily. The problem with most order flow trading software out
there is that they complicate things by taking a clean beautiful chart and
drawing lots of arrows, dots, circles, etc. that confuses the trader. When you
understand what moves the market you don’t need all sorts of flashing lights
on your screen. Keep it clean and simple.
Here are my top 3 trade setups that I look for every trading day. These setups
can only be seen on an order flow chart. You won’t see them in a traditional
bar or candlestick chart and that’s what makes them more powerful. You are
seeing things in the market that 99.5% of the other traders are not watching.
They are all busy looking at their squiggly MACD or RSI lines and forgetting that
the market is made up of real people buying and selling.
Some days there may be more than one set up, other days there might be
none. By having several setups your chances of having a profitable trading day
are higher.

SETUP #1
My first set up is called a “Purge”. There are two types of purges, there is a
Sellers Purge which occurs when the market has reached a low and there is a
Buyers Purge which occurs when the market reaches a high.
Purges are caused when there are multiple stacked buying and selling
imbalances in a bar that reverses.
For a Sellers Purge the market should be trading near a low (it can be a swing
low) and at the bottom of the bar there should be at least 2 selling imbalances
at the bottom. Structurally, the bar then needs to close higher than it opened
which is caused by buying and there should then be at least 2 buying
imbalances on the way up. What is occurring is traders are thinking the market
is going to break out to new lows so they begin selling the market aggressively
causing the selling imbalances on the low. These sellers are met with passive
institutional buyers who are supporting the market. Once the market cannot
go any lower it starts to bounce up, the sellers who sold at the low have no
choice but to cover their sales by buying back aggressively causing prices to go
higher. These sellers have been purged from the market and they are left to
lick their wounds.
In a falling market, you expect to see selling imbalances occurring on the
bottoms of the bars and the bars closing lower than their open. However, at
some point the market will reverse and bounce off a low. This often occurs
when there is a Sellers Purge. One of the signs is the market closing higher
than where it opened after sellers tried to push it lower to no avail and then
start to cover their sales.

Let’s take a look at a chart so it is easier to understand.
Here you see the purge occurring at the bottom at 1.1196 and 1.1197. There
are 132 and 38 lots sold at the low before the market turned around a rallied
in the same bar. Just by eyeballing it you can see that 132 lots is the highest
volume that traded on the bid side. Once the market got past that level
another 38 lots traded before the market turned and went higher. Once
traders realized the market was not going any lower they started to scramble
and aggressively buy what was on the offer and it even spilled over into the
next bar. The result was a nice trade of about 30 ticks. The stop placement
would go right below the low of 1.1196 at 1.1195. Your entry would be on the
bar immediately after at around 1.1204 – 1.1205. You are risking 10 ticks. But
in reality the trade only went against you about 4 ticks.
The opposite is true when the setup happens at a high. For a Buyers Purge the
market should be trading at or near a high (it can be a swing high) and at the
top of the bar there should be at least 2 buying imbalances. Structurally, the
bar then needs to close lower than it opened which is caused by selling
imbalances and there should then be at least 2 selling imbalances on the way
down. What is occurring is traders are thinking the market is going to break out
to new highs so they begin buying the market aggressively causing the buying
imbalances on the high. These sellers are met with passive institutional sellers
who are capping the market. Once the market cannot go any higher it starts to
trade lower, the buyers who bought at the high have no choice but to cover
their buys by selling back aggressively causing prices to go lower. These buyers
have been purged from the market and left to wonder what just happened to
them.
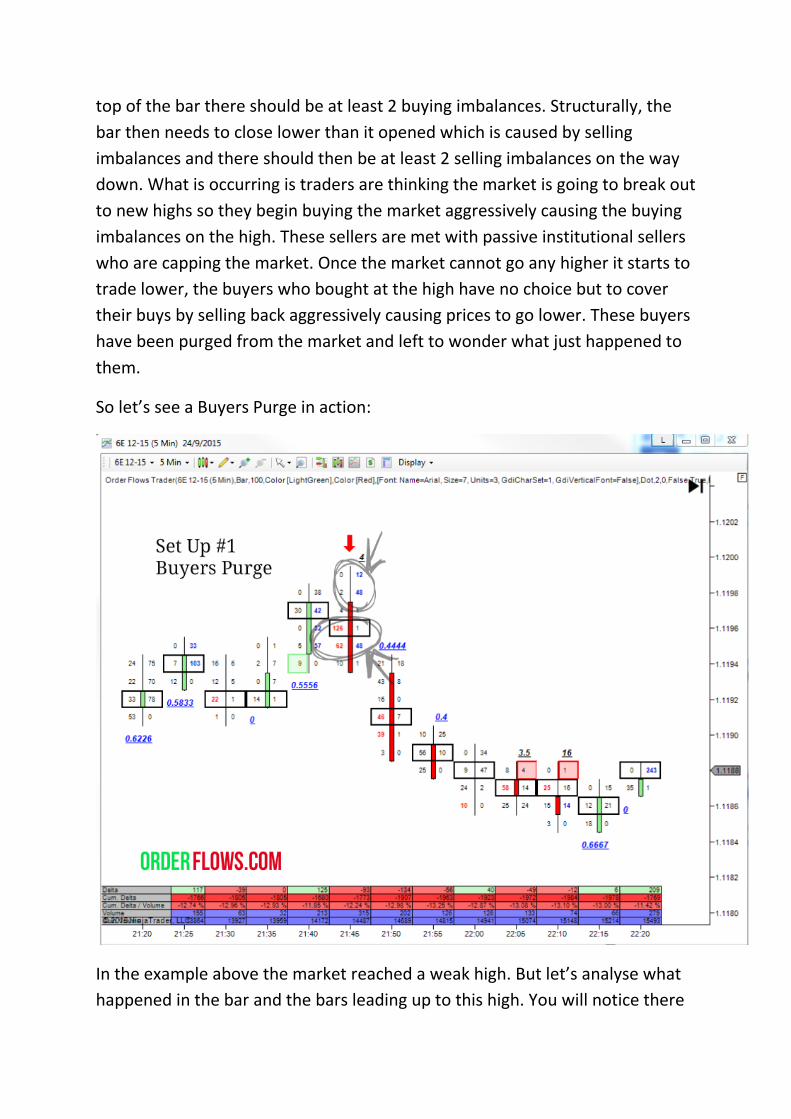
So let’s see a Buyers Purge in action:
In the example above the market reached a weak high. But let’s analyse what
happened in the bar and the bars leading up to this high. You will notice there

were plenty of buying imbalances on the way up and at the high there were
buying imbalances of 12 and 48 lots, but the market just couldn’t sustain its
upward momentum and dropped, but when it dropped there was some
support at 1.1196 and 1.1195 to the tune of 126 lots and 62 lots which the
market just blew through. Clearly there was a bigger outside force willing to
sell the market through about 200 lots which is more volume than normal. The
buyers at the high were Purged out of the market and were forced to cover
their longs in order to not lose more money.
Basically with a purge you have 2 opposing forces in the period in the market
at extreme ends of each other. One side is inherently stronger and will cause
the market to move in that direction.

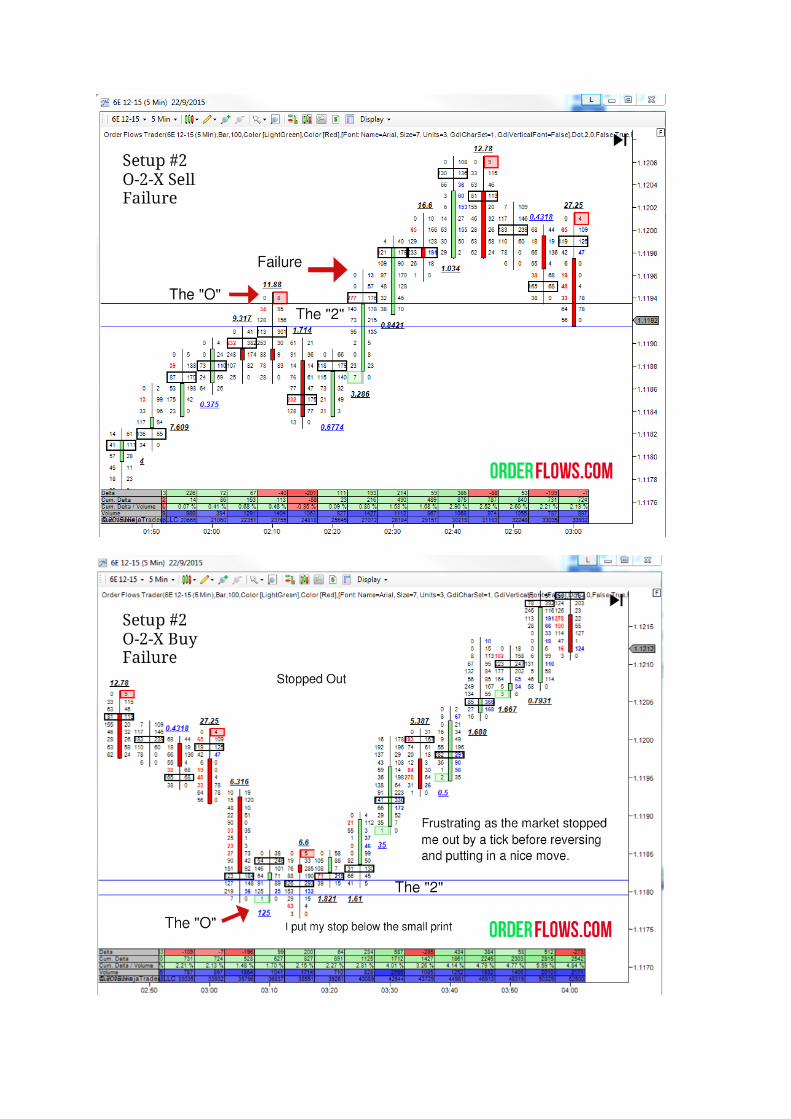
SETUP #2
My second setup is called the O-2-X and it occurs when there is a small print at
or near a high (low) and the market retraces back to it within 2 ticks before
moving in its original direction.
Let me break it down for you. For an O-2-X Sell there needs to be a small print
(the O) needs to occur at a high or just off a high, then look for the market to
retrace back towards it within 2 ticks (the 2), then move in the opposite
direction (the X). The beauty of this trade is that you can use extremely tight
stops of 3 ticks with profit targets of 10x the risk.
Let’s look at a few examples:
For an O-2-X Buy setup, there needs to be a small print (the O) needs to occur
at a low or just off a low, then look for the market to retrace back towards it
within 2 ticks (the 2), then move in the opposite direction (the X).

There will times that you miss the entry by a tick or a few ticks and there will
be times when the market retraces past the small print by just 1 tick before
continuing on to its original direction.
I like to place my stop not at the level of the small print, but 1 tick past it.
There are times when the market will retrace exactly to the price level of the
small print before reverse. The whole concept behind the small print is that the
last buyer/seller has bought/sold and that level saw no more follow through so
technically if the market trades to that level again there is a fair chance it will
be rejected again.

So how long should you wait for the market to retrace to the small print? I
usually use 5 or 6 bars. I saw 5 or 6 because if on the fifth bar it is kind of close
I give it a little more time to develop.
Not all the trades are winners. There are losers, but when risking just a few
ticks that’s fine. Its expected when trading with tight stops. But the winners
more than offset the losers.
Setup #3
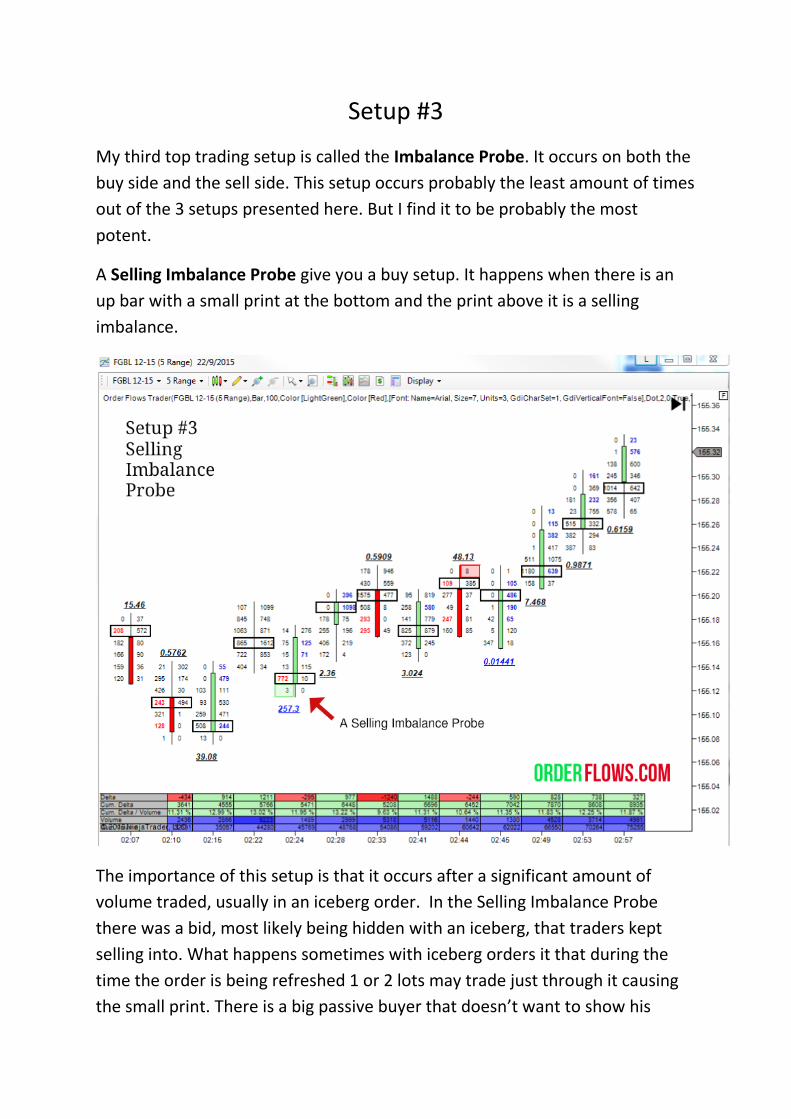
My third top trading setup is called the Imbalance Probe. It occurs on both the
buy side and the sell side. This setup occurs probably the least amount of times
out of the 3 setups presented here. But I find it to be probably the most
potent.
A Selling Imbalance Probe give you a buy setup. It happens when there is an
up bar with a small print at the bottom and the print above it is a selling
imbalance.
The importance of this setup is that it occurs after a significant amount of
volume traded, usually in an iceberg order. In the Selling Imbalance Probe
there was a bid, most likely being hidden with an iceberg, that traders kept
selling into. What happens sometimes with iceberg orders it that during the
time the order is being refreshed 1 or 2 lots may trade just through it causing
the small print. There is a big passive buyer that doesn’t want to show his

hand, so he is trying to hide the size of his order with an iceberg order. But
with order flow, you can see exactly how much as bought and sold.
A Buying Imbalance Probe gives you a sell setup. It happens when there is a
down bar with a small print at the top and the print below it is a buying
imbalance.
I prefer to see buy setups near a low or swing low and sell setups near a high
or swing high. When I see sell setups after a move down, I am a bit hesitant to
take them. The same is true with buy setups after the market has moved up.
It’s all about catching the move, when you are buying you want to do it when
price is low not high. The same is true about sells, you want to sell at higher
prices rather than lower prices.
The next example highlights the importance of taking sell setups near a high
and buy setups near a low. The market was in a clear down trend then
bounced and gave a signal. I find when the setup occurs like that it is not that

strong. As you can see the market did go down initially but then just sort of
range traded afterwards.
The example above is not so much a failure as it is a weak set up. It is a sell
setup occurring at the end of a sell off. At the end of a sell of I am looking for
buy setups not more sells.
Wrap Up
The beauty of trading with order flow is that you are able to see inside the bar
or candlestick to see what is actually happening and see why the market is
moving.
These 3 trade setups can only be seen and traded by trader who use order
flow. None of these trades can be seen using traditional bar or candlestick
charts.
Being a successful trader is about managing risk and keeping loses to a
minimum. These 3 setups have tight stop placements, with setup #2 having a 1
or 2 tick stop placement. How many systems have you seen with a 1 tick stop
placement? The answer is NONE. Why risk 10 ticks to make 10 ticks when you
can risk 1 or 2 ticks to make 20 ticks?
Happy Trading.
Mike Valtos Founder – Orderflows Trading
>>>> http://www.orderflows.com <<<<< Visit Orderflows For More Information