Embed Size (px)
Citation preview
1 March 2019
MY ASSESSMENT AND REPORTING KIT
Guide to Access Maths
Tests/ Access Reading Tests
online analysis and reports
Before you can use the analysis and reports, your school’s Access Co-ordinator will need to
set up your school on the platform and grant you access. For a simple set-up guide, visit
http://rsassessment.com/mark-online-support.
2 March 2019
Contents Guide to Access Maths ............................................................................................................................. 1
Using the Marksheets .......................................................................................................................... 3
Export test mark input file / CSV export and import ........................................................................ 4
Navigating between marksheets ......................................................................................................... 6
Gap Analysis ........................................................................................................................................ 7
Generating reports ........................................................................................................................... 9
Pupil Reporting .................................................................................................................................. 11
Pupil Progress Report ..................................................................................................................... 11
Individual Pupil Report ................................................................................................................... 12
Academic Year, Class or Group Reporting ......................................................................................... 13
Academic Year, Class or Group Listing ........................................................................................... 13
Academic Year, Class or Group Progress Report ............................................................................ 14
3 March 2019
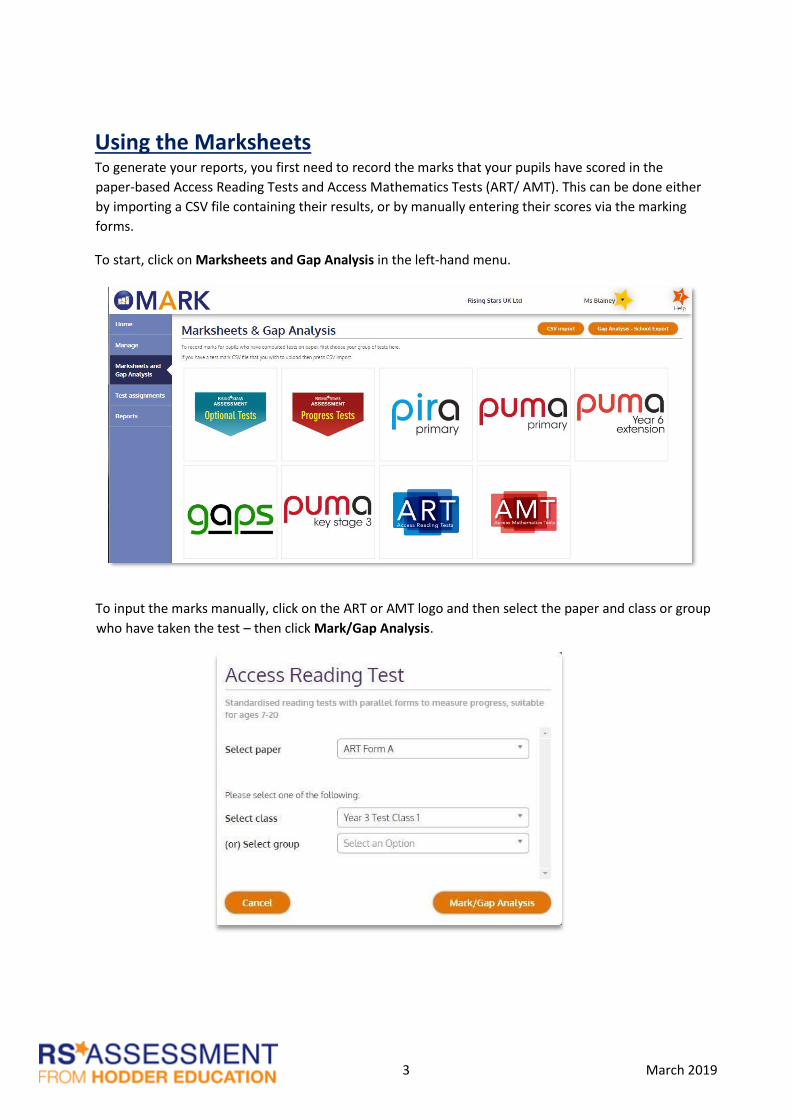
Using the Marksheets To generate your reports, you first need to record the marks that your pupils have scored in the
paper-based Access Reading Tests and Access Mathematics Tests (ART/ AMT). This can be done either
by importing a CSV file containing their results, or by manually entering their scores via the marking
forms.
To start, click on Marksheets and Gap Analysis in the left-hand menu.
To input the marks manually, click on the ART or AMT logo and then select the paper and class or group
who have taken the test – then click Mark/Gap Analysis.
4 March 2019
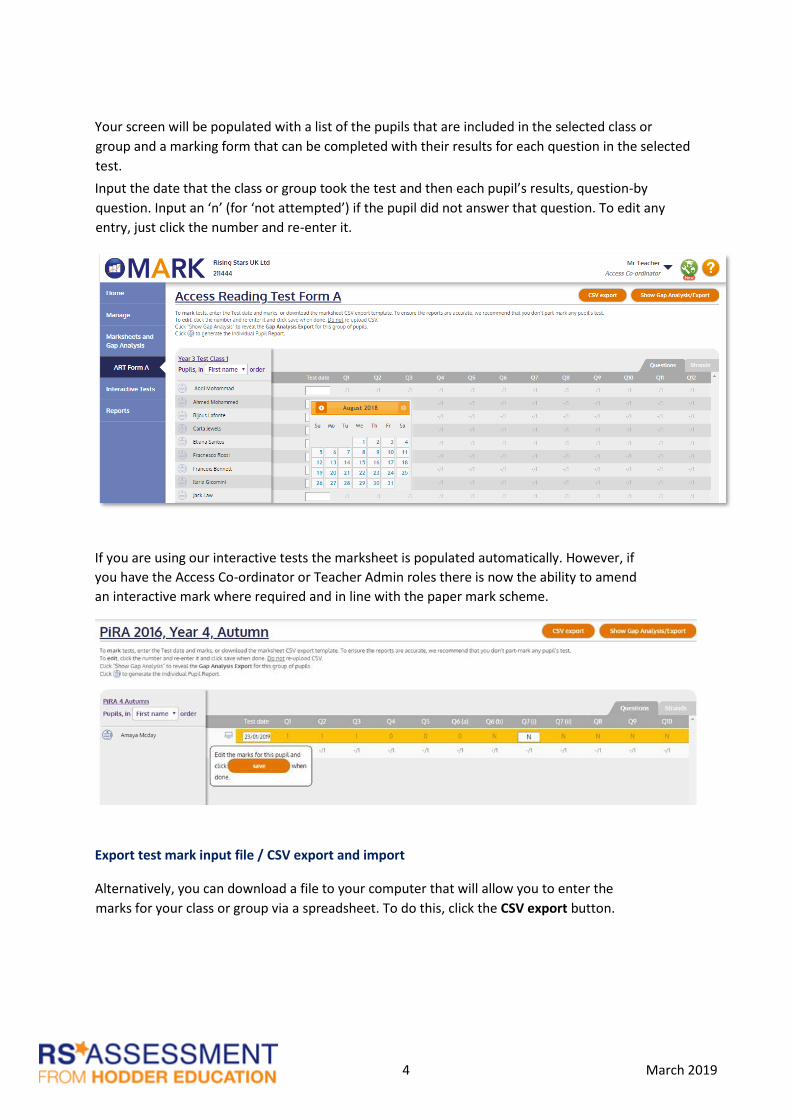
Your screen will be populated with a list of the pupils that are included in the selected class or
group and a marking form that can be completed with their results for each question in the selected
test.
Input the date that the class or group took the test and then each pupil’s results, question-by
question. Input an ‘n’ (for ‘not attempted’) if the pupil did not answer that question. To edit any
entry, just click the number and re-enter it.
If you are using our interactive tests the marksheet is populated automatically. However, if
you have the Access Co-ordinator or Teacher Admin roles there is now the ability to amend
an interactive mark where required and in line with the paper mark scheme.
Export test mark input file / CSV export and import
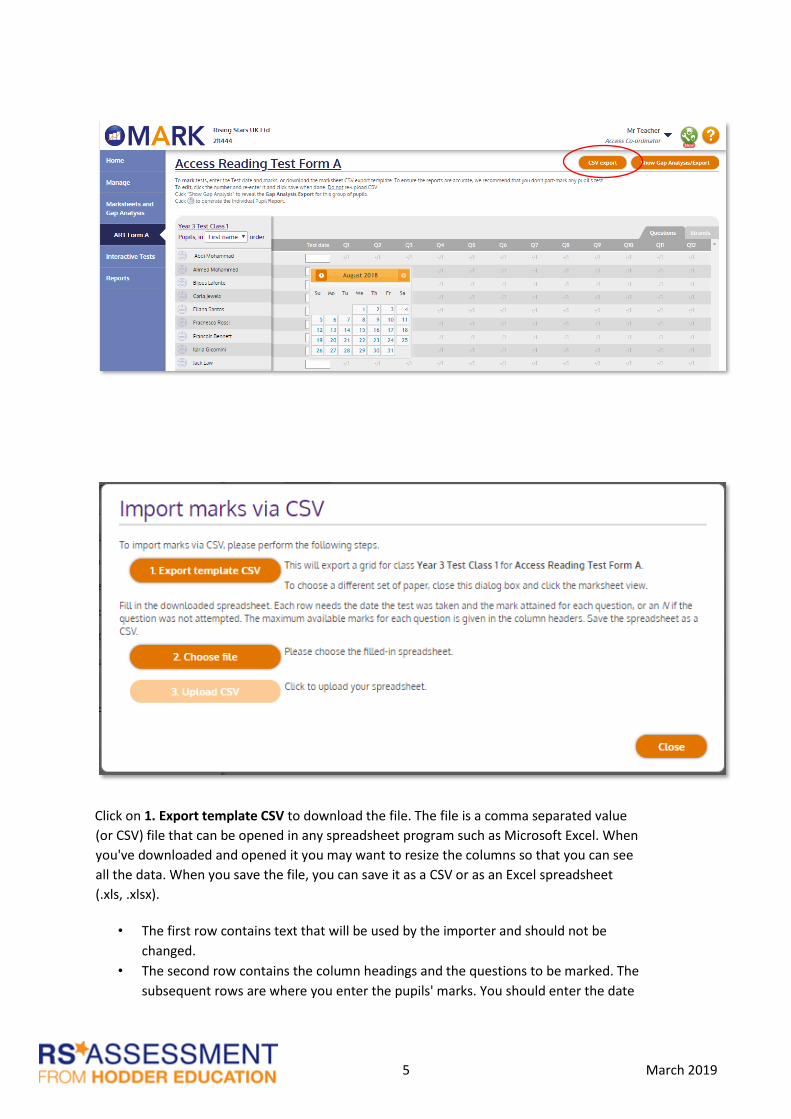
Alternatively, you can download a file to your computer that will allow you to enter the
marks for your class or group via a spreadsheet. To do this, click the CSV export button.
5 March 2019
Click on 1. Export template CSV to download the file. The file is a comma separated value
(or CSV) file that can be opened in any spreadsheet program such as Microsoft Excel. When
you've downloaded and opened it you may want to resize the columns so that you can see
all the data. When you save the file, you can save it as a CSV or as an Excel spreadsheet
(.xls, .xlsx).
• The first row contains text that will be used by the importer and should not be
changed.
• The second row contains the column headings and the questions to be marked. The
subsequent rows are where you enter the pupils' marks. You should enter the date
6 March 2019
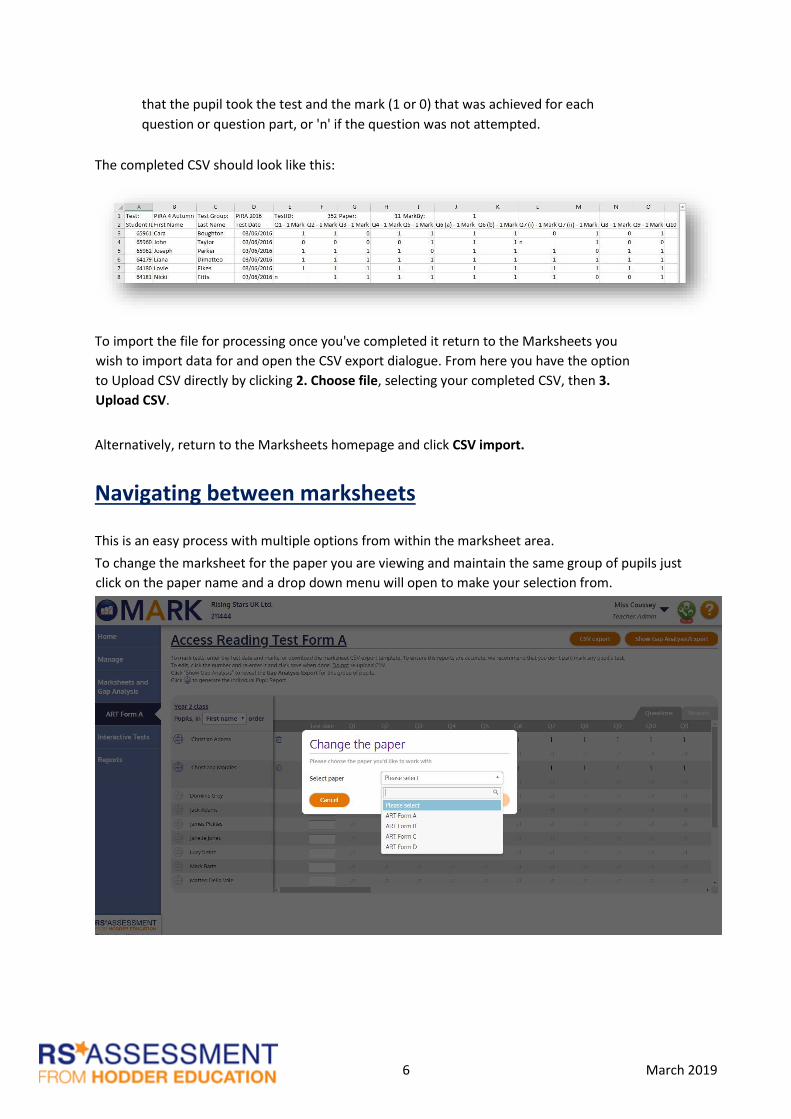
that the pupil took the test and the mark (1 or 0) that was achieved for each
question or question part, or 'n' if the question was not attempted.
The completed CSV should look like this:
To import the file for processing once you've completed it return to the Marksheets you
wish to import data for and open the CSV export dialogue. From here you have the option
to Upload CSV directly by clicking 2. Choose file, selecting your completed CSV, then 3.
Upload CSV.
Alternatively, return to the Marksheets homepage and click CSV import.
Navigating between marksheets
This is an easy process with multiple options from within the marksheet area.
To change the marksheet for the paper you are viewing and maintain the same group of pupils just
click on the paper name and a drop down menu will open to make your selection from.
7 March 2019
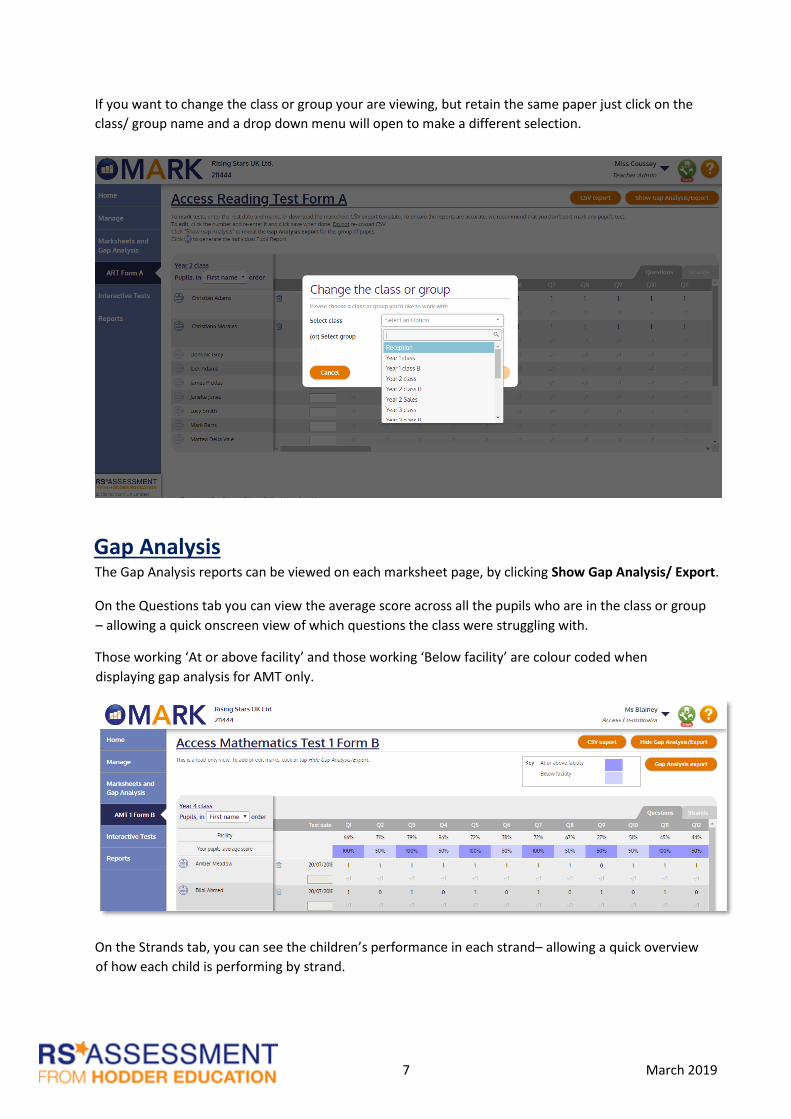
If you want to change the class or group your are viewing, but retain the same paper just click on the
class/ group name and a drop down menu will open to make a different selection.
Gap Analysis The Gap Analysis reports can be viewed on each marksheet page, by clicking Show Gap Analysis/ Export.
On the Questions tab you can view the average score across all the pupils who are in the class or group
– allowing a quick onscreen view of which questions the class were struggling with.
Those working ‘At or above facility’ and those working ‘Below facility’ are colour coded when
displaying gap analysis for AMT only.
On the Strands tab, you can see the children’s performance in each strand– allowing a quick overview
of how each child is performing by strand.
8 March 2019
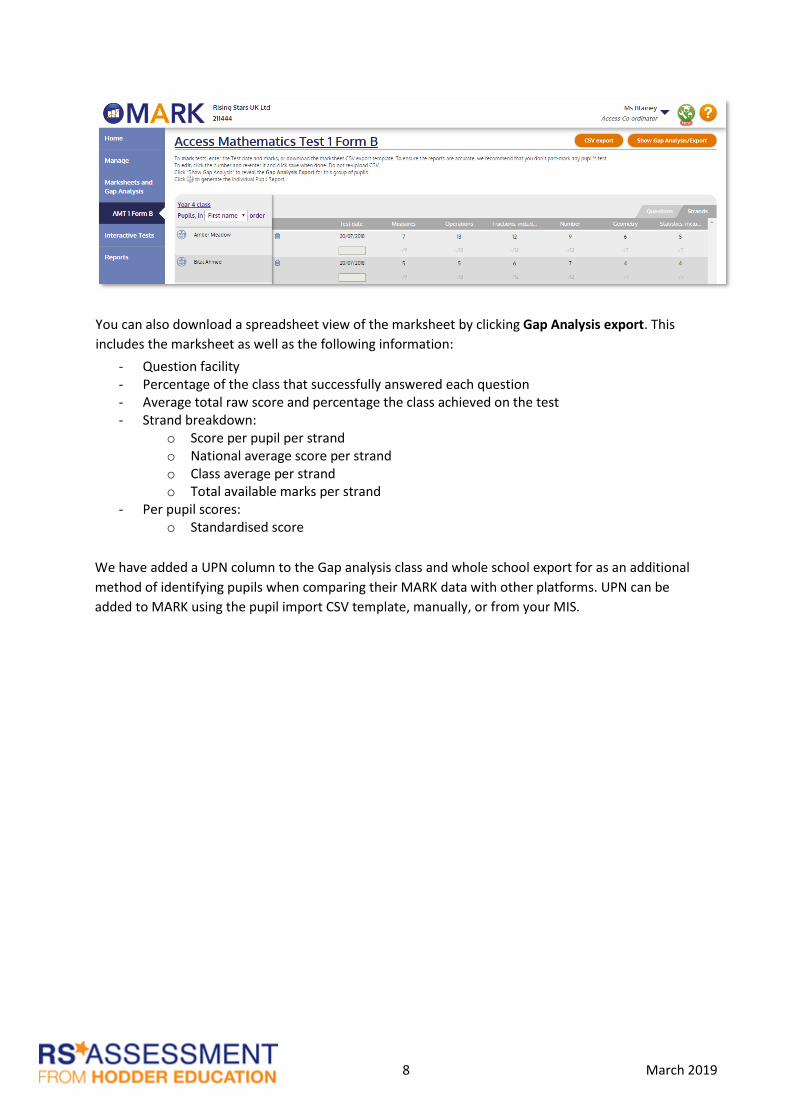
You can also download a spreadsheet view of the marksheet by clicking Gap Analysis export. This
includes the marksheet as well as the following information:
- Question facility - Percentage of the class that successfully answered each question - Average total raw score and percentage the class achieved on the test - Strand breakdown:
o Score per pupil per strand o National average score per strand o Class average per strand o Total available marks per strand
- Per pupil scores: o Standardised score
We have added a UPN column to the Gap analysis class and whole school export for as an additional
method of identifying pupils when comparing their MARK data with other platforms. UPN can be
added to MARK using the pupil import CSV template, manually, or from your MIS.
9 March 2019
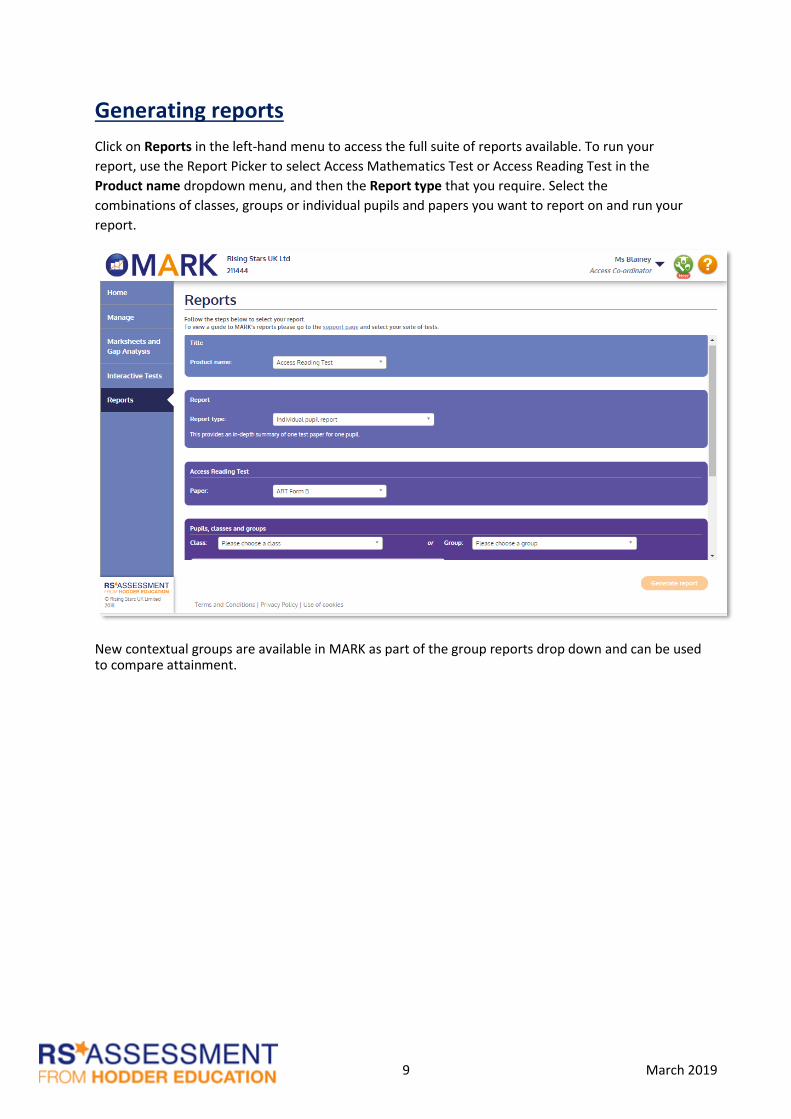
Generating reports
Click on Reports in the left-hand menu to access the full suite of reports available. To run your
report, use the Report Picker to select Access Mathematics Test or Access Reading Test in the
Product name dropdown menu, and then the Report type that you require. Select the
combinations of classes, groups or individual pupils and papers you want to report on and run your
report.
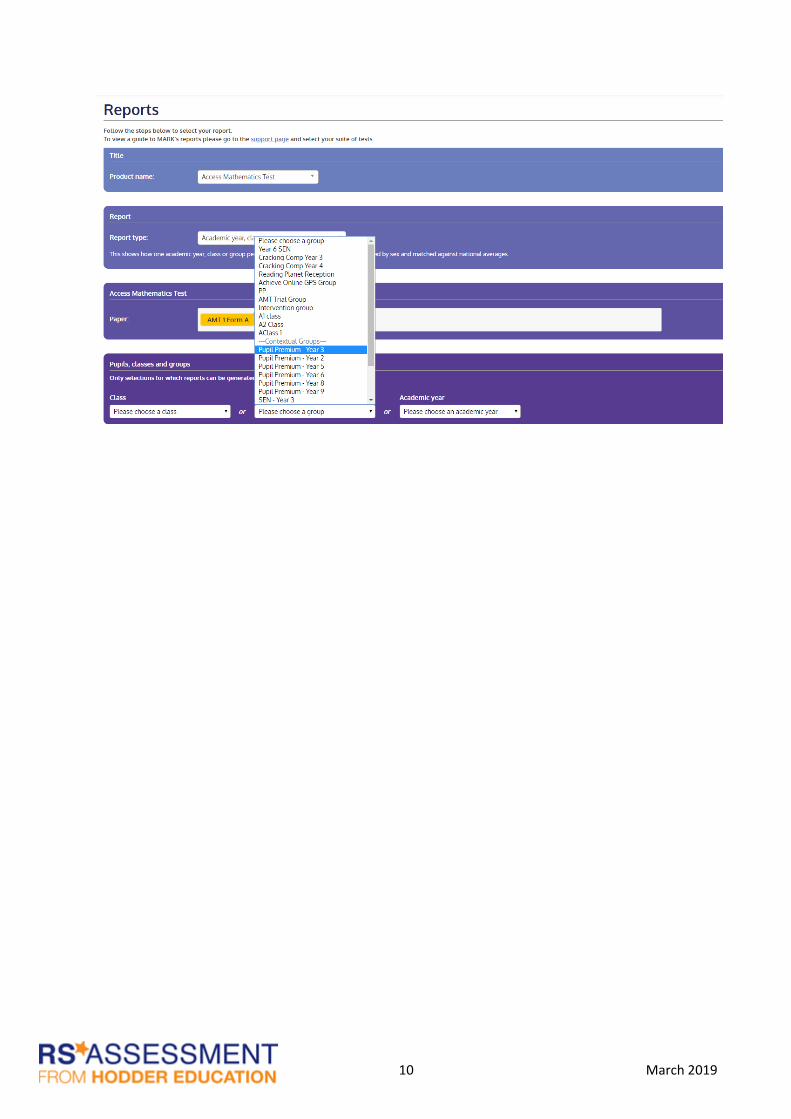
New contextual groups are available in MARK as part of the group reports drop down and can be used to compare attainment.
10 March 2019
11 March 2019
Pupil Reporting
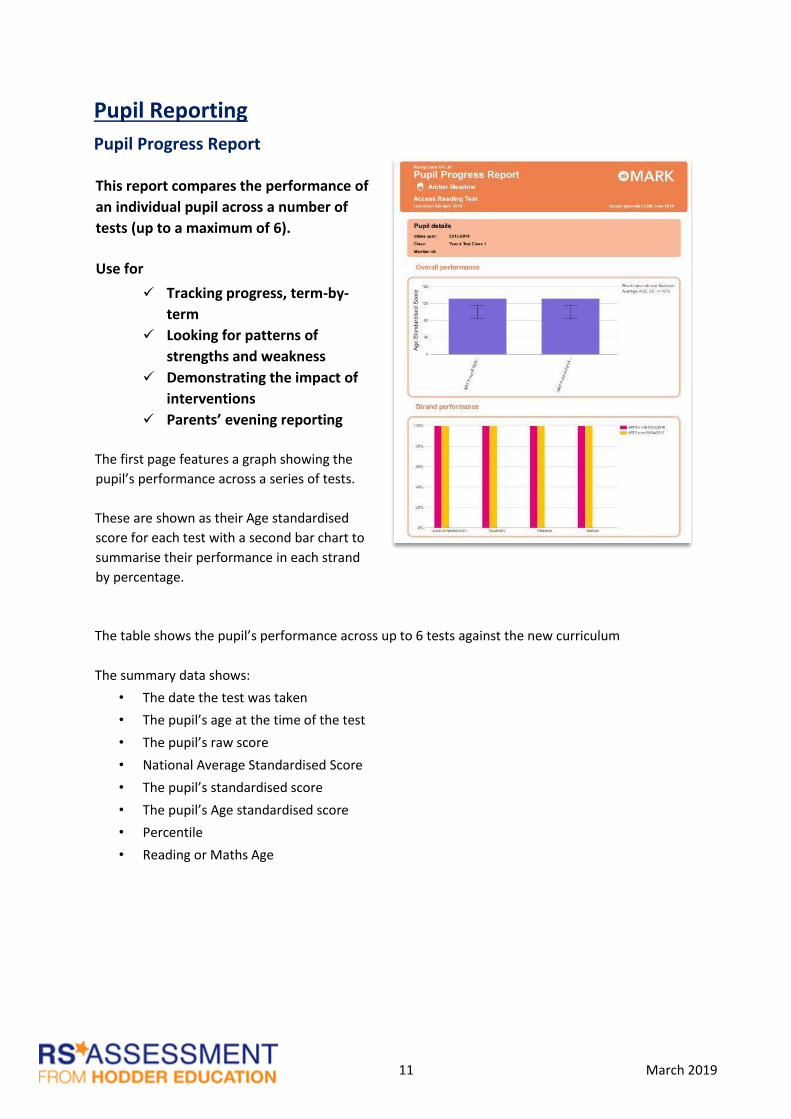
Pupil Progress Report This report compares the performance of
an individual pupil across a number of
tests (up to a maximum of 6).
Use for
✓ Tracking progress, term-by-
term
✓ Looking for patterns of
strengths and weakness
✓ Demonstrating the impact of
interventions
✓ Parents’ evening reporting
The first page features a graph showing the
pupil’s performance across a series of tests.
These are shown as their Age standardised
score for each test with a second bar chart to
summarise their performance in each strand
by percentage.
The table shows the pupil’s performance across up to 6 tests against the new curriculum
The summary data shows:
• The date the test was taken
• The pupil’s age at the time of the test
• The pupil’s raw score
• National Average Standardised Score
• The pupil’s standardised score
• The pupil’s Age standardised score
• Percentile
• Reading or Maths Age
12 March 2019
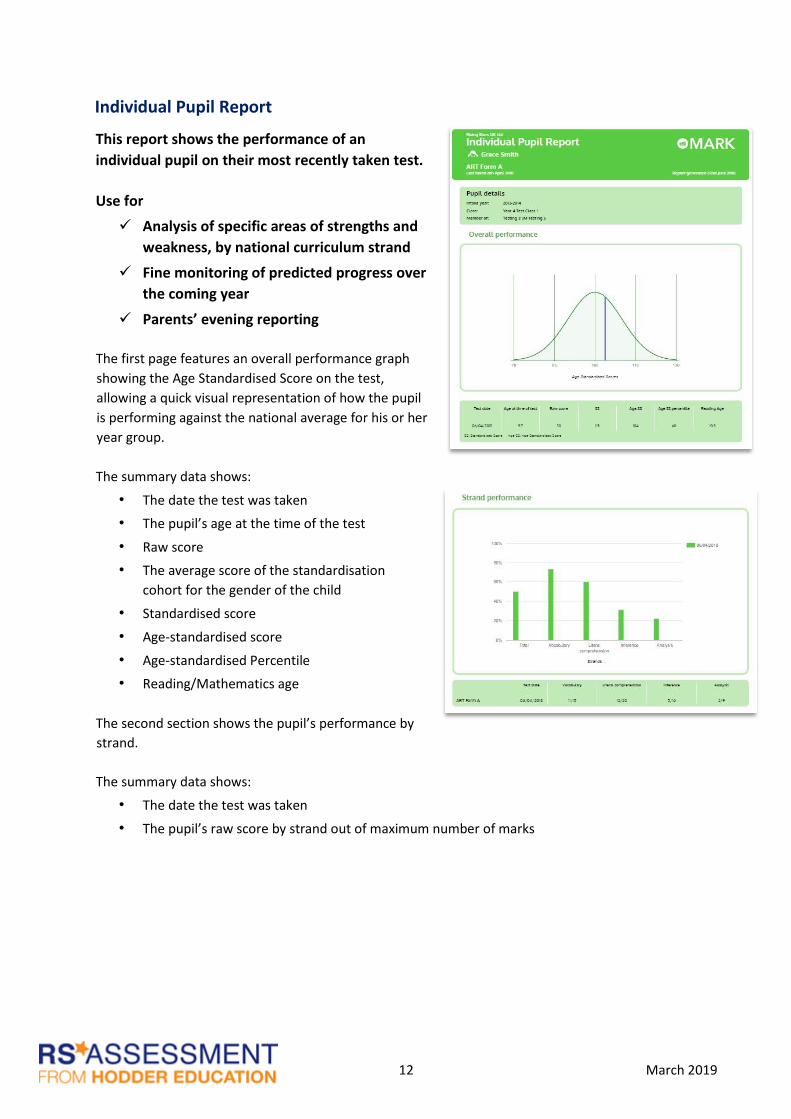
Individual Pupil Report
This report shows the performance of an
individual pupil on their most recently taken test.
Use for
✓ Analysis of specific areas of strengths and
weakness, by national curriculum strand
✓ Fine monitoring of predicted progress over
the coming year
✓ Parents’ evening reporting
The first page features an overall performance graph
showing the Age Standardised Score on the test,
allowing a quick visual representation of how the pupil
is performing against the national average for his or her
year group.
The summary data shows:
• The date the test was taken
• The pupil’s age at the time of the test
• Raw score
• The average score of the standardisation
cohort for the gender of the child
• Standardised score
• Age-standardised score
• Age-standardised Percentile
• Reading/Mathematics age
The second section shows the pupil’s performance by
strand.
The summary data shows:
• The date the test was taken
• The pupil’s raw score by strand out of maximum number of marks
13 March 2019
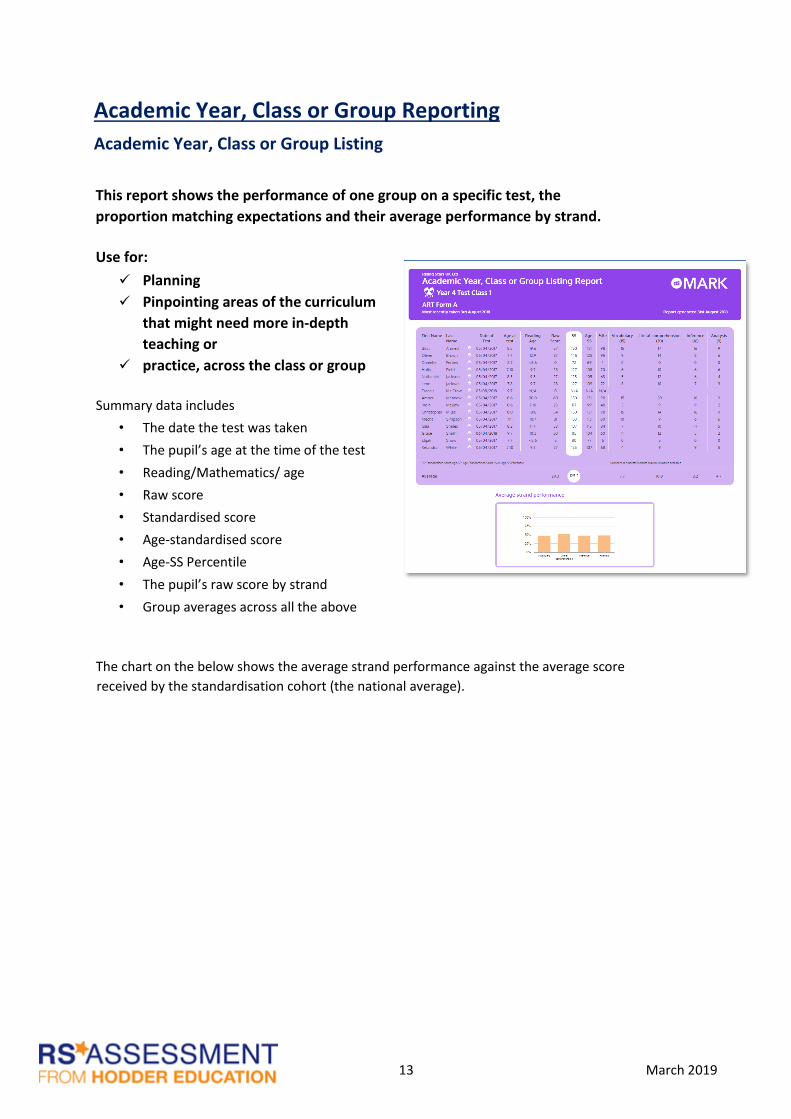
Academic Year, Class or Group Reporting
Academic Year, Class or Group Listing
This report shows the performance of one group on a specific test, the
proportion matching expectations and their average performance by strand.
Use for:
✓ Planning
✓ Pinpointing areas of the curriculum
that might need more in-depth
teaching or
✓ practice, across the class or group
Summary data includes
• The date the test was taken
• The pupil’s age at the time of the test
• Reading/Mathematics/ age
• Raw score
• Standardised score
• Age-standardised score
• Age-SS Percentile
• The pupil’s raw score by strand
• Group averages across all the above
The chart on the below shows the average strand performance against the average score
received by the standardisation cohort (the national average).
14 March 2019
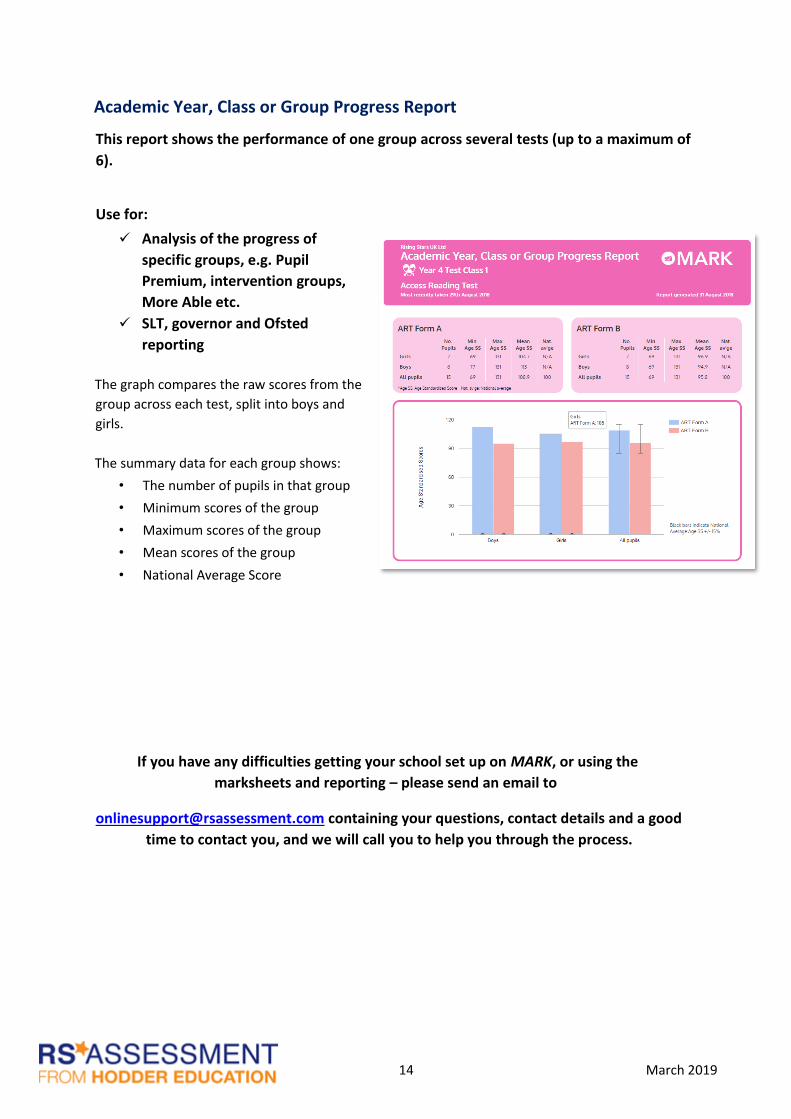
Academic Year, Class or Group Progress Report
This report shows the performance of one group across several tests (up to a maximum of
6).
Use for:
✓ Analysis of the progress of
specific groups, e.g. Pupil
Premium, intervention groups,
More Able etc.
✓ SLT, governor and Ofsted
reporting
The graph compares the raw scores from the
group across each test, split into boys and
girls.
The summary data for each group shows:
• The number of pupils in that group
• Minimum scores of the group
• Maximum scores of the group
• Mean scores of the group
• National Average Score
If you have any difficulties getting your school set up on MARK, or using the
marksheets and reporting – please send an email to
[email protected] containing your questions, contact details and a good
time to contact you, and we will call you to help you through the process.