Embed Size (px)
Citation preview
Massachusetts Water Resources Authority
Presentation to
MWRA Board of Directors
MWRA Energy Efforts & Savings FY02 to FY11 Ten Year Summary Report
January 18, 2012
•
Energy Savings and revenue total approximately $177M during FY02
–
FY11
•
Increase annual energy savings and revenue from $6M in FY02 to $24M in FY11
•
Aggressive pursuit of rebates and grants – over $12M awarded to date
•
About 45% of MWRA’s total energy cost profile derived from renewable sources
•
Process optimization and implementation of energy audit recommendations
projected to save almost $2M annually
•
Recognition for energy program leadership and projection completion – MWRA
awarded 8 regional and national awards (2005 –
2011)
MWRA Energy Program - Summary of Accomplishments
2
3
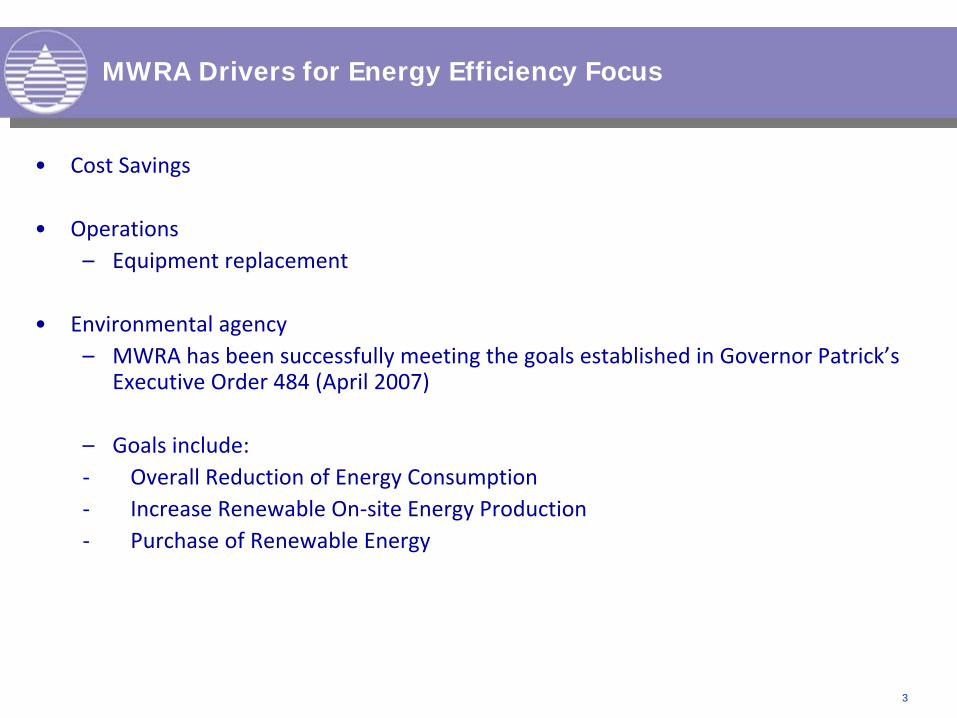
MWRA Drivers for Energy Efficiency Focus
•
Cost Savings
•
Operations –
Equipment replacement
•
Environmental agency–
MWRA has been successfully meeting the goals established in Governor Patrick’s
Executive Order 484 (April 2007)
–
Goals include:‐
Overall Reduction of Energy Consumption‐
Increase Renewable On‐site Energy Production‐
Purchase of Renewable Energy
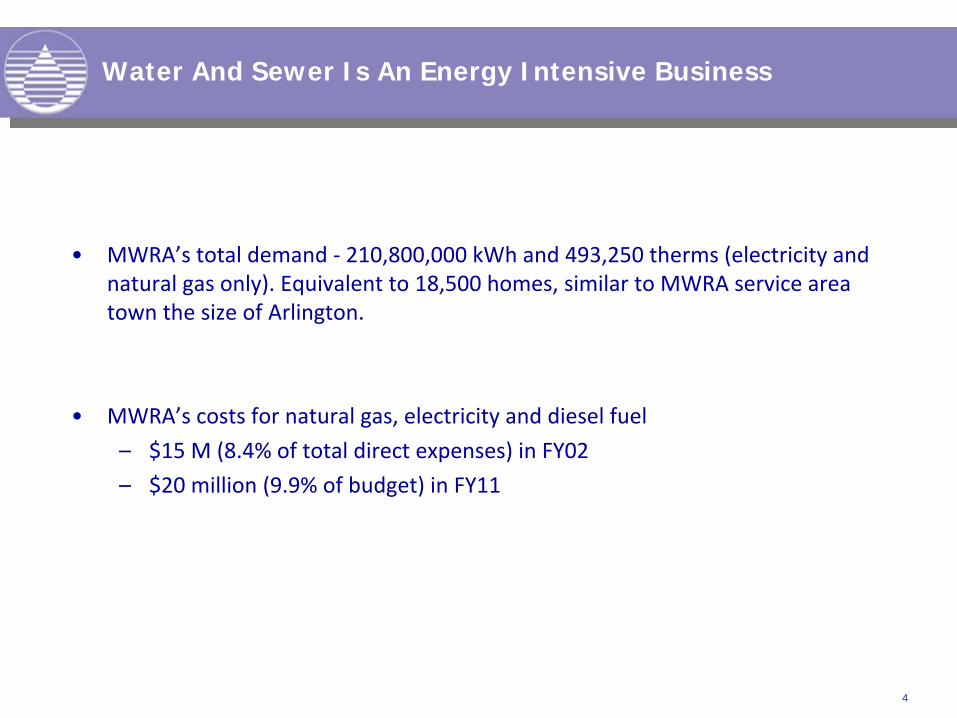
•
MWRA’s total demand ‐
210,800,000 kWh and 493,250 therms (electricity and
natural gas only). Equivalent to 18,500 homes, similar to MWRA service area
town the size of Arlington.
•
MWRA’s costs for natural gas, electricity and diesel fuel
–
$15 M (8.4% of total direct expenses) in FY02
–
$20 million (9.9% of budget) in FY11
Water And Sewer Is An Energy Intensive Business
4
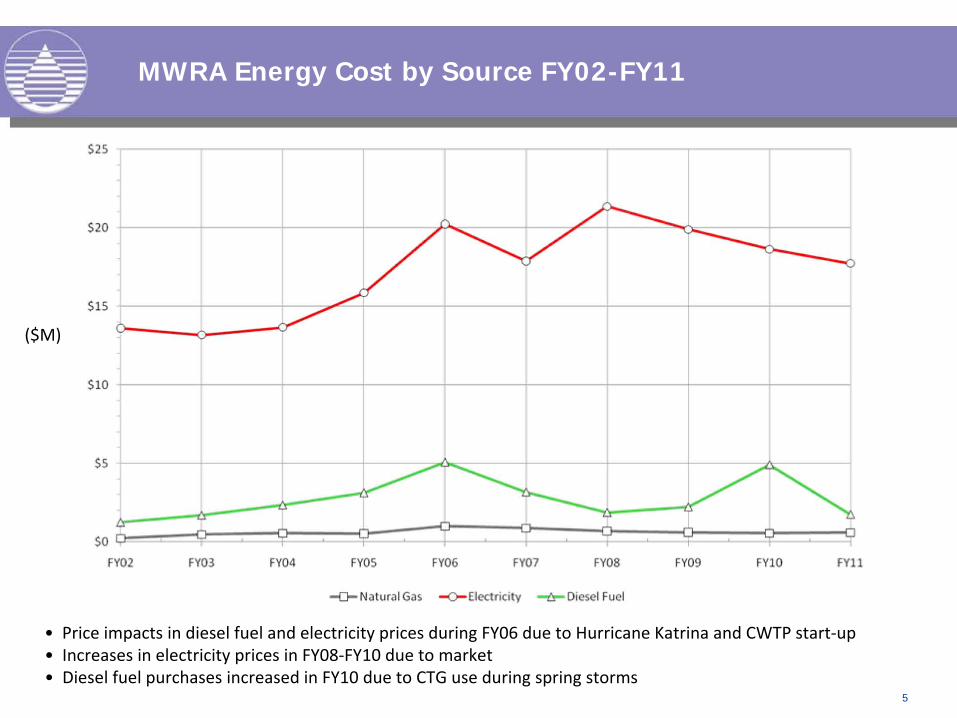
MWRA Energy Cost by Source FY02-FY11
5
• Price impacts in diesel fuel and electricity prices during FY06 due to Hurricane Katrina and CWTP start‐up• Increases in electricity prices in FY08‐FY10 due to market• Diesel fuel purchases increased in FY10 due to CTG use during spring storms
($M)
$25
$20
$15
$10
$5
$oQ~~==~9~~~~~9==~~~~t==::::~~i ==::::~~~::::~9~i ======~9~==~~9~i ====~9 FY02 FY03 FY04 FYOS FY06 FY07 FY08 FY09 FYlO FYll
~NaturaIGa> -o-Electricity -o-Oiesel Fuel
6
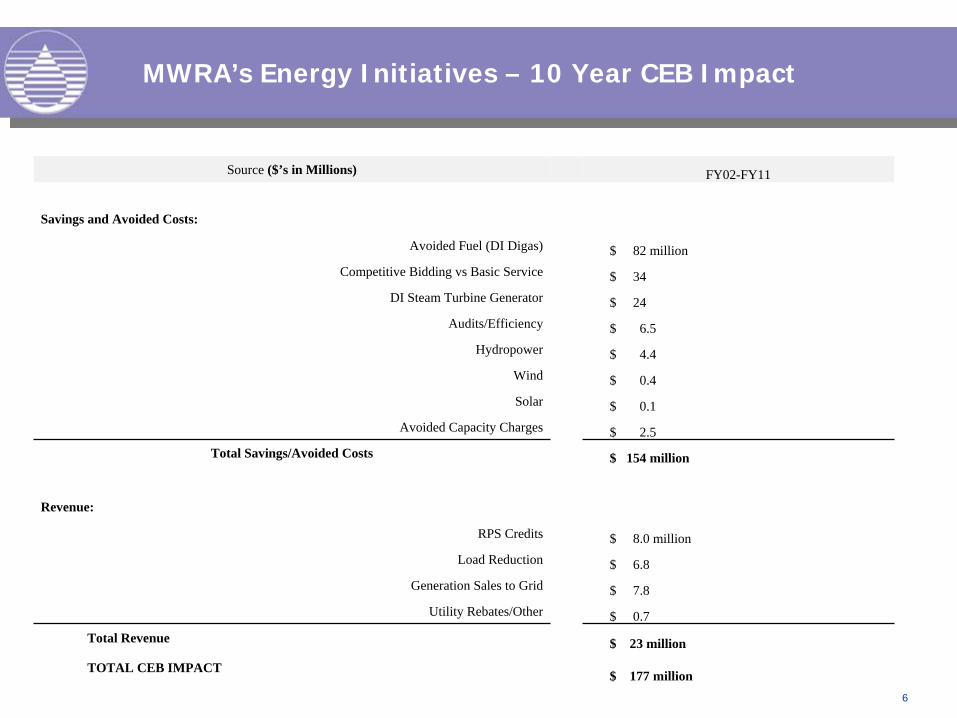
MWRA’s Energy Initiatives – 10 Year CEB Impact
Source ($’s in Millions) FY02-FY11
Savings and Avoided Costs:
Avoided Fuel (DI Digas) $ 82 million Competitive Bidding vs Basic Service $ 34
DI Steam Turbine Generator $ 24Audits/Efficiency $ 6.5
Hydropower $ 4.4Wind $ 0.4Solar $ 0.1
Avoided Capacity Charges $ 2.5Total Savings/Avoided Costs $ 154 million
Revenue:
RPS Credits $ 8.0 millionLoad Reduction $ 6.8
Generation Sales to Grid $ 7.8Utility Rebates/Other $ 0.7
Total Revenue $ 23 million
TOTAL CEB IMPACT $ 177 million
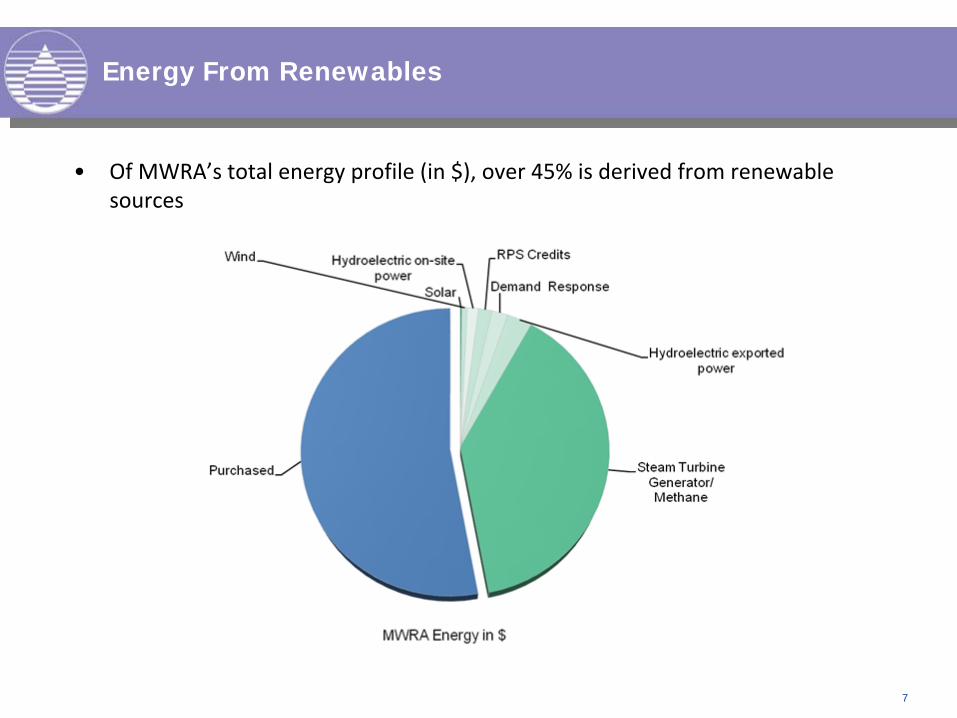
Energy From Renewables
•
Of MWRA’s total energy profile (in $), over 45% is derived from renewable
sources
7
8
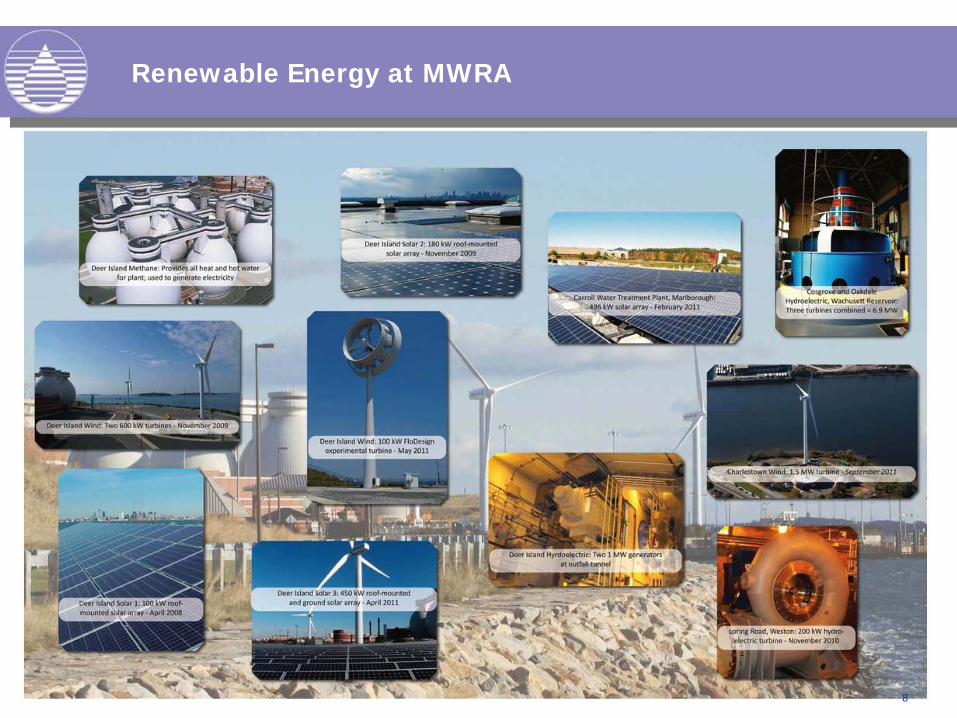
Renewable Energy at MWRA
9
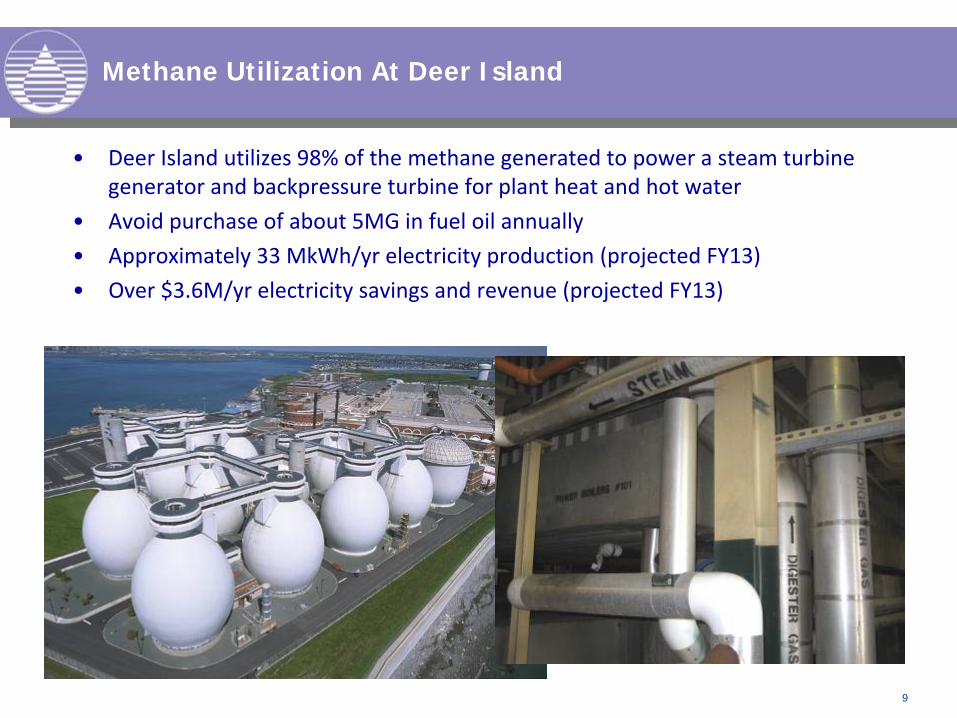
Methane Utilization At Deer Island
•
Deer Island utilizes 98% of the methane generated to power a steam turbine
generator and backpressure turbine for plant heat and hot water
•
Avoid purchase of about 5MG in fuel oil annually
•
Approximately 33 MkWh/yr electricity production (projected FY13)
•
Over $3.6M/yr electricity savings and revenue (projected FY13)
101010
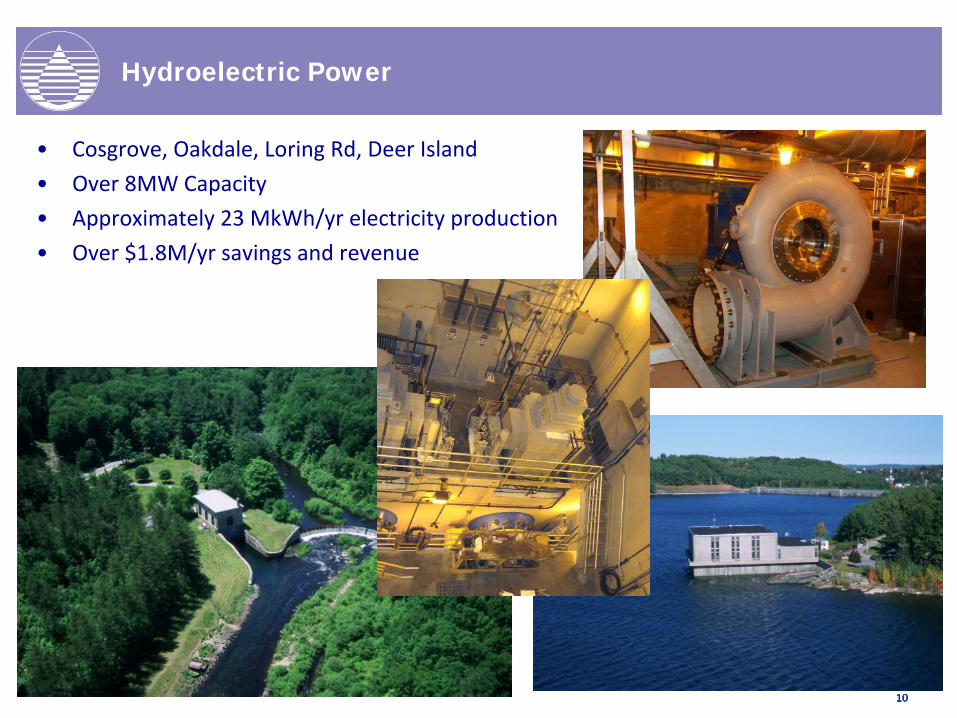
Hydroelectric Power
•
Cosgrove, Oakdale, Loring Rd, Deer Island
•
Over 8MW Capacity
•
Approximately 23 MkWh/yr electricity production
•
Over $1.8M/yr savings and revenue
11
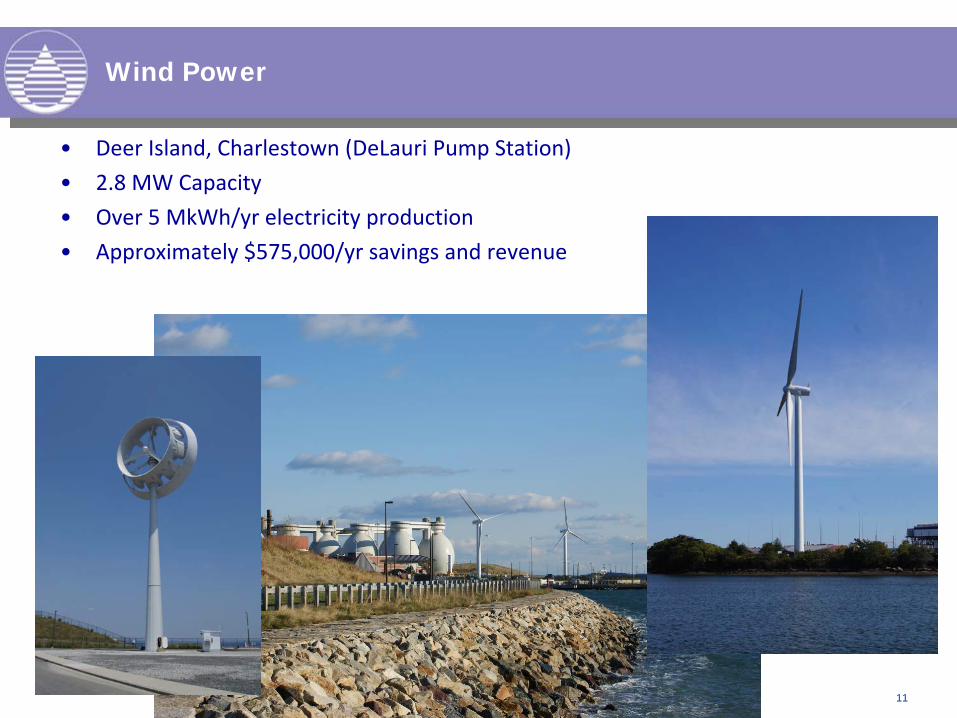
Wind Power
•
Deer Island, Charlestown (DeLauri Pump Station)
•
2.8 MW Capacity
•
Over 5 MkWh/yr electricity production
•
Approximately $575,000/yr savings and revenue
12
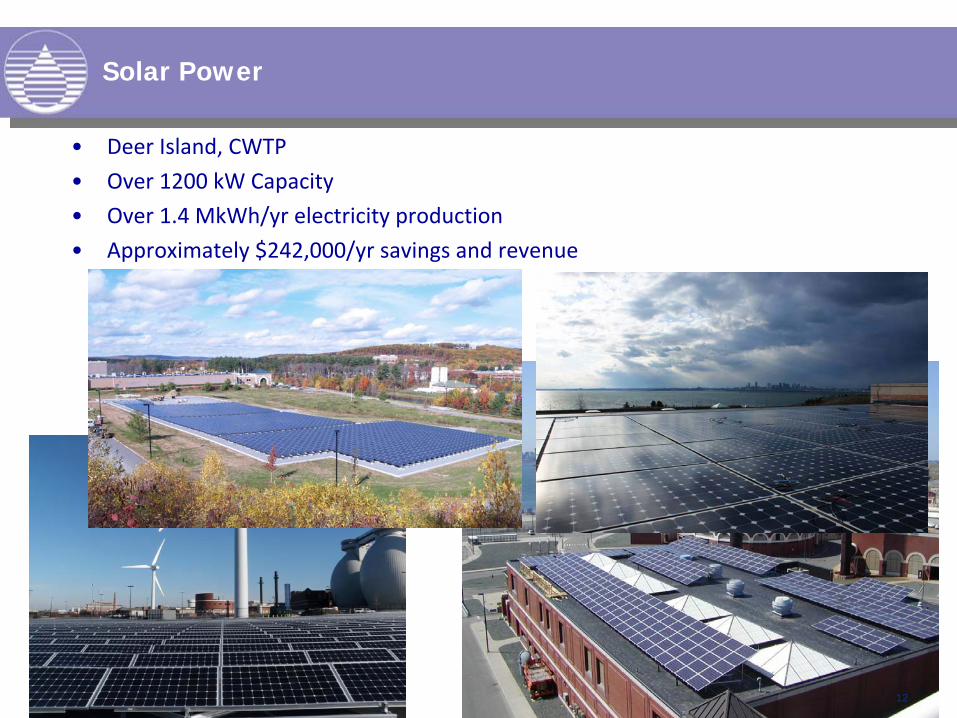
Solar Power
•
Deer Island, CWTP
•
Over 1200 kW Capacity
•
Over 1.4 MkWh/yr electricity production
•
Approximately $242,000/yr savings and revenue
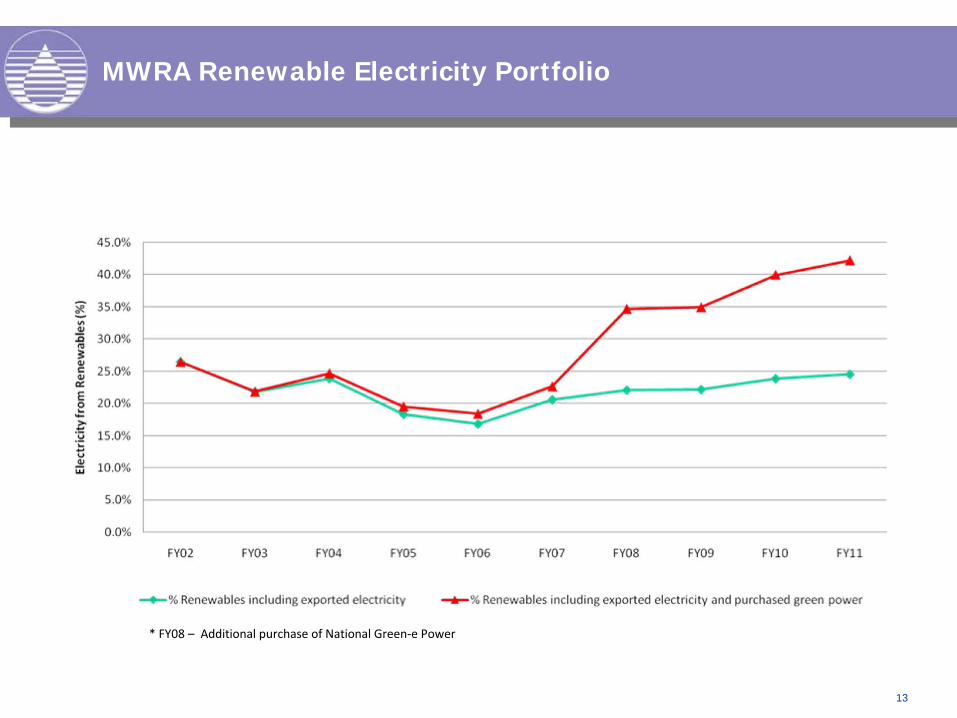
MWRA Renewable Electricity Portfolio
13
* FY08 –
Additional purchase of National Green‐e Power
45 ,0%
40,0%
'il 35.0% ~
2 30.0% '" r--..
~ .... OJ .: 25 ,0% OJ .............. <x: E
20.0% ~
~
/ A
-1: '0 ';:
15.0% .. v OJ
10.0% .....
5.0%
0.0% '--
FY02 FY03 FY04 FYOS FY06 FY07 FYOB FY09 FYlO FY11
-+-% Renewables including e.ported electrici ty ....... % Renewables including exported electricity and purchased green power
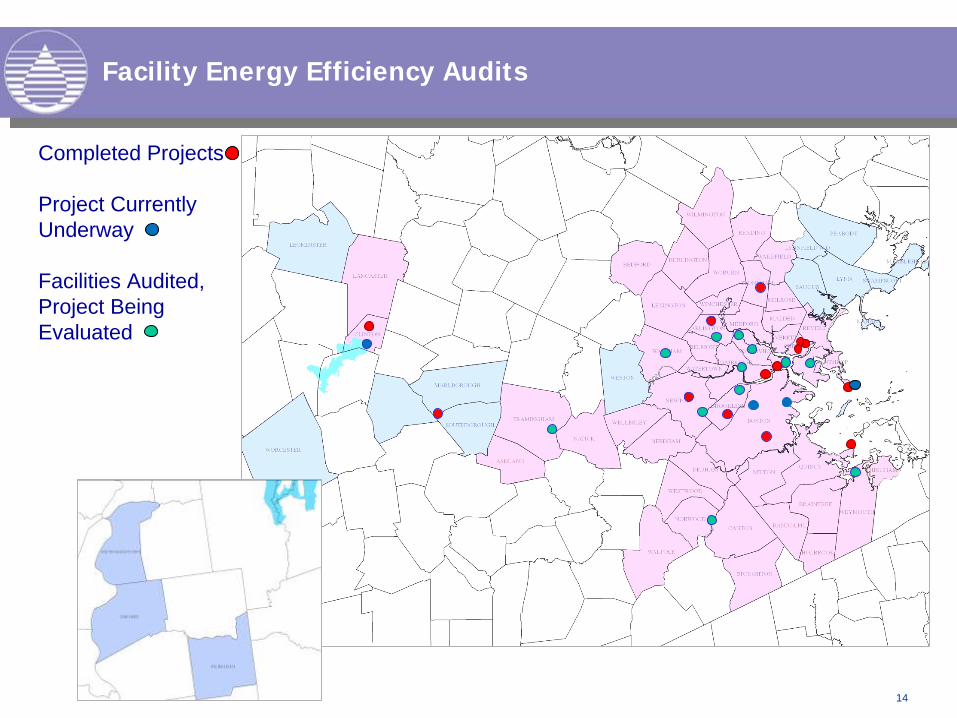
Facility Energy Efficiency Audits
14
Completed Projects
Project Currently Underway
Facilities Audited, Project Being Evaluated
Maximizing Grants and Rebates
•
When the American Reinvestment and Recovery Act was announced,
MWRA had a number projects “shovel ready”
•
MWRA received $33M in ARRA funds for water and sewer projects of
which nearly $10M for renewable energy projects
•
Over $2.5M various state grants
•
Approximately $680,000 energy efficiency project rebates to date
15
•
Hydro – Continue to explore hydropower development potential
•
Wind –
Conducting feasibility study for 4th
wind turbine at Deer Island
•
Solar –
Comprehensive solar assessment ongoing
•
Demand Side Management –
Continue energy audits, process control
optimization, demand response, EMS installation
•
Grants/Rebates – Seek funding assistance opportunities
•
Other Sustainable Efforts – alternative fuel vehicles, green power purchase,
energy efficient computing, recycling
MWRA Future Energy Initiatives
16