Embed Size (px)
Citation preview

Massachusetts Water Resources Authority Environmental Quality Department Report 2021-10
––2
2020 Outfall Monitoring Overview

Citation: Werme C, Codiga DL, Libby PS, Carroll, SR, Charlestra L, Keay KE. 2021. 2020 outfall monitoring overview. Boston: Massachusetts Water Resources Authority. Report 2021-10. 55 p.
Cover photos by Alex Mansfield: (Top) Water quality sampling in Massachusetts Bay (Bottom) Whale breaching in Massachusetts Bay

2020 Outfall Monitoring Overview
prepared by
Christine Werme Independent Consultant Oakland, CA 94612
Daniel L. Codiga Massachusetts Water Resources Authority Environmental Quality Department 100 First Avenue Charlestown Navy Yard Boston, MA 02129
P. Scott LibbyBattelle72 Main StreetTopsham, ME 04086
Sally R. Carroll, Lucner Charlestra, Kenneth E. Keay Massachusetts Water Resources Authority Environmental Quality Department 100 First Avenue Charlestown Navy Yard Boston, MA 02129
November 10, 2021

2020 Outfall Monitoring Panel and Committees
Outfall Monitoring Science Advisory Panel (OMSAP)
Judith Pederson, Massachusetts Institute of Technology Sea Grant (chair) Robert Beardsley, Woods Hole Oceanographic Institution Peter Burn, Suffolk University Virginia Edgcomb, Woods Hole Oceanographic Institution Loretta Fernandez, Northeastern University Robert Kenney, University of Rhode Island Mark Patterson, Northeastern University Jeff Rosen, Corona Environmental Juliet Simpson, Massachusetts Institute of Technology Sea Grant Juanita Urban-Rich, University of Massachusetts, Boston
Inter-Agency Advisory Committee (IAAC)
Massachusetts Coastal Zone Management Massachusetts Department of Environmental Protection Massachusetts Division of Marine Fisheries Stellwagen Bank National Marine Sanctuary U.S. Army Corps of Engineers U.S. Environmental Protection Agency U.S. Geological Survey
Public Interest Advisory Committee (PIAC)
Association to Preserve Cape Cod Boston Harbor Now Conservation Law Foundation Massachusetts Audubon Society MWRA Advisory Board MWRA Wastewater Advisory Committee Safer Waters in Massachusetts Save the Harbor/Save the Bay
i
Executive Summary Looking at Boston Harbor today, it is hard to imagine the level of pollution it once received. For nearly 400 years, the harbor was a dumping ground for raw and poorly treated sewage. During heavy rain, the system would become overwhelmed and release untreated sewage into the harbor. Three decades ago, when two aging treatment plants processed 400 million gallons of sewage per day from Greater Boston’s fast-growing population, the disinfected liquid sewage effluent and the solid material, called sludge, were discharged into the harbor. Sludge was discharged off the Town of Winthrop with the outgoing tide and swept into Massachusetts Bay. Harbor sediments were said to resemble “black mayonnaise.”
The Massachusetts Water Resources Authority (MWRA) was established by court order in 1984 to rebuild and upgrade this inadequate sewage system. Most phases of the plan, dubbed the “Boston Harbor Project,” were completed by 2002. By then MWRA had separated “scum” skimmed from the raw sewage effluent, including floating trash, oil, and grease, putting it into a landfill instead of the harbor (1988); improved and increased pumping capacity to treat more sewage (1989); begun recycling sludge into fertilizer and decreasing solids discharged into the harbor by 40 dry tons per day (1991); rebuilt the primary treatment plant (1995); implemented improved, secondary treatment (1997); and, to reduce contaminants in the harbor, built a long tunnel to divert all effluent from Boston Harbor to an outfall 15 kilometers (9 miles) offshore, in Massachusetts Bay. September 2020 marked 20 years since the startup of this bay outfall.
The $3.8 billion MWRA spent to reach these goals has proven to be a sound investment. The harbor clean-up is widely recognized as one of the nation’s greatest environmental achievements.
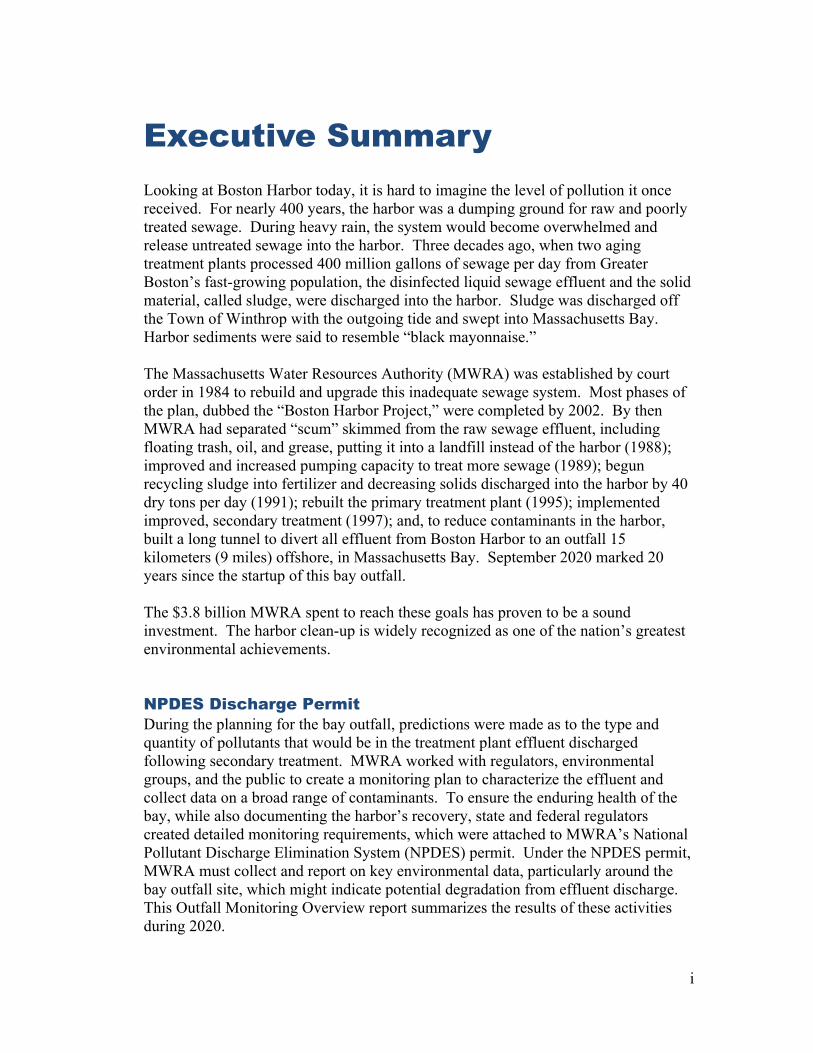
NPDES Discharge Permit During the planning for the bay outfall, predictions were made as to the type and quantity of pollutants that would be in the treatment plant effluent discharged following secondary treatment. MWRA worked with regulators, environmental groups, and the public to create a monitoring plan to characterize the effluent and collect data on a broad range of contaminants. To ensure the enduring health of the bay, while also documenting the harbor’s recovery, state and federal regulators created detailed monitoring requirements, which were attached to MWRA’s National Pollutant Discharge Elimination System (NPDES) permit. Under the NPDES permit, MWRA must collect and report on key environmental data, particularly around the bay outfall site, which might indicate potential degradation from effluent discharge. This Outfall Monitoring Overview report summarizes the results of these activities during 2020.

ii
Treatment plant maintenance, something that was lacking before MWRA was created, is also an important part of MWRA’s NPDES permit. As of 2020, the Deer Island Treatment Plant achieved 100% compliance with permit conditions over 14 consecutive years, earning MWRA a Platinum 14 Peak Performance Award from the National Association of Clean Water Agencies. Annual solids discharges, that portion of the MWRA effluent that contains most of the persistent organic and inorganic contaminants, remained low in 2020, only a small fraction of what was discharged to Boston Harbor in the 1990s (Figure i).
Figure i. Annual solids discharges in 2020 remain low.
Twenty Years of Monitoring: Results Surpassed Expectations Pollutant loads typically associated with wastewater effluent have been far lower in MWRA effluent than had been predicted during planning for the Massachusetts Bay outfall. That process, conducted during the 1980s, predicted the loads of conventional, metal, and organic pollutants expected to be discharged in 2020, then more than 30 years in the future. Actual 2020 loads were only a fraction of the projections, a result of MWRA’s strong industrial pretreatment program and better removal of contaminants at the treatment plant (Figure ii).
0
20
40
60
80
100
120
140
160
1990 1995 2000 2005 2010 2015 2020
Sewage solids discharged to Boston Harbor until 12/1991.
9/2000 – present: Full secondary treatment removes over 80% of solids before discharging effluent to Massachusetts Bay.
1998‐2000: Deer Island Treatment Plant put in place the first battery of secondary treatment, which more effectively removes solids and contaminants than primary.
1995‐1998: Improved primary treatment removed more solids.
Total Suspended Solid
s Load
(tons/day)

iii
Figure ii. Actual 2020 loads of contaminants in MWRA effluent are below original predictions. BOD = biochemical oxygen demand, TSS = total suspended solids
Water Quality: Nutrients are Higher at Sites Nearest the Outfall but Far Lower in Boston Harbor An important focus of outfall monitoring is to prevent eutrophication, a condition that Boston Harbor showed before the discharge was diverted to Massachusetts Bay. Protecting the bay against eutrophication means ensuring that nutrients from the effluent discharge do not fuel an overgrowth of phytoplankton and other plant life, which could deplete dissolved oxygen when it decays. The nutrient ammonium is watched closely, because it is the largest component of the total nitrogen in wastewater; it is also the form of nitrogen most readily taken up by phytoplankton and is less likely to be removed by secondary treatment than other sewage components.
Ammonium concentrations plummeted in Boston Harbor when harbor discharges ended (Station F23 in Figure iii). As had been anticipated, elevated concentrations of ammonium have been consistently detected at stations close to the outfall, and intermittently at stations within 10 to 20 kilometers (6 to 12 miles), but not at stations farther away. The deeper water of the bay protects against eutrophication, because the pycnocline, a naturally occurring mid-depth layer separating colder deep water from warmer shallow water, confines the summer outfall discharge to beneath the well-lit depths where most phytoplankton growth occurs.
iv
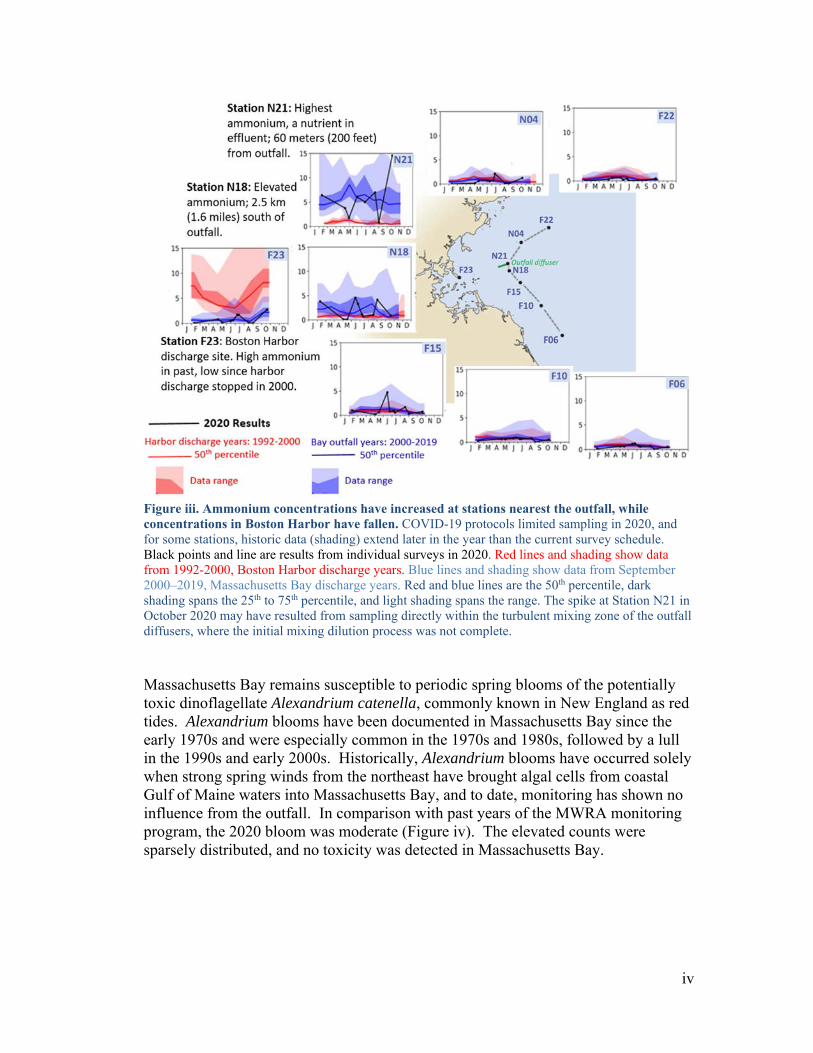
Figure iii. Ammonium concentrations have increased at stations nearest the outfall, while concentrations in Boston Harbor have fallen. COVID-19 protocols limited sampling in 2020, and for some stations, historic data (shading) extend later in the year than the current survey schedule. Black points and line are results from individual surveys in 2020. Red lines and shading show data from 1992-2000, Boston Harbor discharge years. Blue lines and shading show data from September 2000–2019, Massachusetts Bay discharge years. Red and blue lines are the 50th percentile, dark shading spans the 25th to 75th percentile, and light shading spans the range. The spike at Station N21 in October 2020 may have resulted from sampling directly within the turbulent mixing zone of the outfall diffusers, where the initial mixing dilution process was not complete.
Massachusetts Bay remains susceptible to periodic spring blooms of the potentially toxic dinoflagellate Alexandrium catenella, commonly known in New England as red tides. Alexandrium blooms have been documented in Massachusetts Bay since the early 1970s and were especially common in the 1970s and 1980s, followed by a lull in the 1990s and early 2000s. Historically, Alexandrium blooms have occurred solely when strong spring winds from the northeast have brought algal cells from coastal Gulf of Maine waters into Massachusetts Bay, and to date, monitoring has shown no influence from the outfall. In comparison with past years of the MWRA monitoring program, the 2020 bloom was moderate (Figure iv). The elevated counts were sparsely distributed, and no toxicity was detected in Massachusetts Bay.

v
Figure iv. Nearfield abundance of Alexandrium catenella, commonly known as a “red tide” phytoplankton, 1992–2020; the 2020 bloom was moderate. The nearfield is a 12 by 10-kilometer (7 by 6-mile) area centered on the outfall. Note log scale.
Alexandrium cells spend part of their life cycle as cysts, overwintering in the sediments before germinating. The long-established cyst beds in coastal Maine have been the source of past blooms in Massachusetts waters. However, Alexandrium cysts were detected in Massachusetts Bay in the fall of 2019 and again in the fall of 2020, prompting some concern that a future bloom could originate locally, from within Massachusetts Bay rather than offshore. The moderate and geographically sparse bloom in 2020 did not provide sufficient evidence to establish a source. MWRA is working with regional experts on the biology of Alexandrium to evaluate the potential influence of this local cyst bed on future blooms.
Seafloor Communities: Life Remains Diverse and Abundant Seafloor communities in Massachusetts Bay have remained unaffected by the relocated outfall. A bacterial effluent tracer, Clostridium perfringens spores, can be detected in sediment samples at stations closest to the outfall but there has been no evidence of increased organic carbon content, which would indicate disturbed conditions. Total abundances, numbers of species, and diversity measurements of bay soft-bottom communities have remained within expected ranges over the 29 years of harbor discharge and bay discharge monitoring. Community assemblages appear to be structured by sediment grain size and water depth rather than by proximity to the outfall. Likewise, hard-bottom communities have continued to flourish throughout the bay. Lush growth occurs on the outfall diffusers, without negatively affecting discharge (Figure v).

vi
Figure v. Marine life thrives on an outfall riser in 2020 without impeding discharge.
Winter Flounder Remain Healthy In the 1980s and 1990s, many flounder from Boston Harbor showed precancerous conditions and tumors. Improvements in harbor flounder health began in the first years of the Boston Harbor Project, and incidence of cancer precursors has also declined rather than increased at the Massachusetts Bay outfall site. In 2020, few fish taken from near the bay outfall showed precancerous conditions, and no tumors have been found in fish from any location since 2004 (Figures vi and vii). The improvement in flounder health correlates well with declines in total solids and organic-contaminant discharges and has been one of the most notable successes of the Boston Harbor Project.

vii
Figure vi. Winter flounder monitoring locations. Four sites were sampled to collect winter flounder for histological analyses: Outfall Site (OS), to detect potential impacts from MWRA’s treated wastewater; Deer Island Flats (DIF) in Boston Harbor, historically impacted by contaminants; off Nantasket Beach (NB), a coastal reference station near Boston Harbor; and East Cape Cod Bay (ECCB), a clean coastal reference station.
Figure vii. Flounder precancerous disease and tumors have declined. Annual prevalence of the precancerous condition, centrotubular hydropic vacuolation (CHV), 1991–2020.

viii
Special Studies: Dissolved Oxygen in Cape Cod Bay In addition to carrying out its mission to provide water and sewer services to Greater Boston while safeguarding the health of the affected environment, MWRA participates in focused studies that respond to a variety of environmental concerns. These investigations can stem from permit requirements, emerging scientific questions, or input from regulators and the public.
For example, in 2020, MWRA found that dissolved oxygen fell to low levels, less than five milligrams per liter, at one of its routine monitoring stations, F02, in Eastern Cape Cod Bay (Figure viii). Even lower oxygen levels had been found in the shallower, nearshore waters of southwestern Cape Cod Bay in 2019. In 2020, MWRA partnered with other interested parties to investigate, finding concentrations lower than four milligrams per liter at some of those shallow stations. Fortunately, the hypoxia was short-lived in 2020 and did not produce the fish and lobster mortality of 2019.
Figure viii. Dissolved oxygen concentrations in 2020. Dissolved oxygen was measured continuously at the instrumented buoy off Cape Ann (50 m depth) and at near-bottom samples from Station N18 near the outfall, Station F22 northeast of the outfall, and Station F02 in Cape Cod Bay. In late August, Station F02 fell below the 6.0 mg per liter state water quality standard for dissolved oxygen in these waters.
Several factors triggered the low-oxygen events in Cape Cod Bay in 2019 and 2020. In both years, warm temperatures led to strong and persistent summer stratification, which separated surface from bottom waters and led to low dissolved oxygen levels in those bottom waters. Observations show that Massachusetts Bay temperatures have been warming since 1990, consistent with trends seen region-wide.

ix
Another possible contributor to low oxygen is the phytoplankton species Karenia mikimotoi, first observed in Massachusetts Bay in 2017 (Figure ix). Karenia was present in Cape Cod Bay during both the 2019 and 2020 low-oxygen events. While the intensities of Karenia blooms were insufficient to strongly affect deeper areas, such as the MWRA sampling stations, they may have been large enough to influence shallow, inshore Cape Cod Bay. MWRA continues to work with its monitoring partners to better understand the processes that lead to these hypoxic events and other environmental challenges.
Figure ix. Image of the dinoflagellate Karenia mikimotoi collected from Boston Harbor in 2019. This single-celled photosynthetic organism is approximately 20-25 micrometers in diameter (about one quarter the thickness of a typical sheet of copy paper). Although invisible to the naked eye, under certain conditions, Karenia can accumulate to form water-discoloring blooms having millions of cells in a liter of seawater. Image courtesy of the National Centers for Coastal Ocean Science.
x
Table of ContentsExecutive Summary ....................................................................................................... i
1. Introduction .............................................................................................................. 1 2. Effluent ............................................................................................................... 2
2020 Effluent Characterization ................................................................................. 2 Contingency Plan Thresholds ................................................................................... 7
3. Water Column ........................................................................................................... 8 COVID-19 Pandemic Protocols ................................................................................ 9 Physical Conditions ................................................................................................ 10 Water Quality .......................................................................................................... 13
Nutrients .............................................................................................................. 13 Phytoplankton Biomass ...................................................................................... 16 Dissolved Oxygen ............................................................................................... 18
Phytoplankton Communities ................................................................................... 19 Zooplankton Communities...................................................................................... 23 Stellwagen Bank National Marine Sanctuary ......................................................... 24 Boston Harbor Water Quality ................................................................................. 25 Contingency Plan Thresholds ................................................................................. 26
4. Sea Floor ............................................................................................................. 27 Sediment Characteristics and Tracers ..................................................................... 29 Soft-bottom Communities ....................................................................................... 31 Hard-bottom Communities ..................................................................................... 34 Stellwagen Bank National Marine Sanctuary ......................................................... 35 Boston Harbor Seafloor Monitoring ....................................................................... 35 Contingency Plan Thresholds ................................................................................. 37
5. Fish and Shellfish .................................................................................................... 38 Flounder Health ...................................................................................................... 39 Contingency Plan Thresholds ................................................................................. 41
6. Special Studies ........................................................................................................ 42 Predicted vs. Actual Effluent Loads ....................................................................... 42 Estimating Water-Column Contaminants ............................................................... 45 Bays Eutrophication Model Updates ...................................................................... 47 Hypoxia in Cape Cod Bay ...................................................................................... 49
References ............................................................................................................. 52 List of Acronyms ........................................................................................................ 55

xi
List of Figures Figure i. Annual solids discharges in 2020 remain low ...................................... ii Figure ii. Actual 2020 loads of contaminants in MWRA effluent are below
original predictions .............................................................................. iii Figure iii. Ammonium concentrations have increased at stations nearest the
outfall, while concentrations in Boston Harbor have fallen ................ iv Figure iv. Nearfield abundance of Alexandrium catenella, commonly known as a
“red tide” phytoplankton, 1992–2020 ................................................... v Figure v. Marine life thrives on an outfall riser in 2020 without impeding
discharge .............................................................................................. vi Figure vi. Winter flounder monitoring locations ................................................. vii Figure vii. Flounder precancerous disease and tumors have declined ................. vii Figure viii. Dissolved oxygen concentrations in 2020. ........................................ viii Figure ix. Image of the dinoflagellate Karenia mikimotoi collected from Boston
Harbor in 2019 ..................................................................................... ix
Figure 2-1. Annual and average rainfall in Boston, 1990–2020.............................. 2 Figure 2-2. Annual full primary- and secondary-treated effluent flows and
primary-blended flows, 1999–2020 ...................................................... 3 Figure 2-3. Monthly full primary- and secondary-treated and primary-blended
flows and rainfall during 2020 .............................................................. 3 Figure 2-4. Annual solids discharges, 1990–2020................................................... 4 Figure 2-5. Annual nitrogen discharges, 1996–2020, and population, 2006–2020 . 5 Figure 3-1. Water-column monitoring stations and instrumented buoys in
Massachusetts and Cape Cod bays ....................................................... 8 Figure 3-2. Flows of the Merrimack and Charles rivers ........................................ 10 Figure 3-3. Surface-water temperature at the NDBC Buoy in 2020 compared to
prior years ........................................................................................... 11 Figure 3-4. Mid-June through mid-August air and surface-water temperatures at
the NDBC Buoy, 1992–2020 .............................................................. 12 Figure 3-5. Stratification at nearfield Station N18 in 2020 compared to prior years
............................................................................................................. 12 Figure 3-6. Station-average ammonium concentrations at selected stations in 2020
compared to prior years. In 2020, as in past years, effluent discharge increased concentrations only near the outfall .................................... 14

xii
Figure 3-7. (Left) Surface- and bottom-water ammonium on February 11, 2020 at the monitoring stations during mixed conditions. (Right) Cross-sections of concentrations throughout the water column along transects connecting selected stations ................................................................ 15
Figure 3-8. (Left) Surface- and bottom-water ammonium on June 18, 2020 at the monitoring stations during stratified conditions. (Right) Cross-sections of concentrations throughout the water column along transects connecting selected stations ................................................................ 15
Figure 3-9. Station average areal chlorophyll concentrations at selected stations in 2020 compared to prior years ............................................................. 16
Figure 3-10. Moderate-Resolution Imaging Spectroradiometer satellite imagery of surface chlorophyll concentrations in 2020 ........................................ 17
Figure 3-11. Near-bottom water dissolved oxygen concentrations in 2020 compared to prior years ....................................................................................... 18
Figure 3-12. Near-bottom water dissolved oxygen concentrations at Cape Cod Bay stations in 2020 compared to prior years ............................................ 19
Figure 3-13. Total phytoplankton abundance at selected stations in 2020 compared to prior years ....................................................................................... 20
Figure 3-14. Abundance of Karenia mikimotoi at the surface and at the depth of maximum chlorophyll of all MWRA samples, 2017–2020 ................ 21
Figure 3-15. Nearfield abundance of Alexandrium catenella, 1992–2020. The bloom was moderate in 2020 .............................................................. 22
Figure 3-16. Abundance of non-copepod zooplankton including and excluding radiolarians .......................................................................................... 23
Figure 3-17. Dissolved oxygen at the NERACOOS Buoy A01, Station F22 in Stellwagen Basin, and at Station N18 in the nearfield ........................ 25
Figure 4-1. Soft-bottom monitoring stations ......................................................... 27 Figure 4-2. Hard-bottom monitoring stations ........................................................ 28 Figure 4-3. Concentrations of Clostridium perfringens spores, corrected for
sediment grain size, in 2020................................................................ 30 Figure 4-4. Total organic carbon at selected stations, 1992–2020 ........................ 30 Figure 4-5. Total abundance by region, 1992–2020 .............................................. 31 Figure 4-6. Ordination plot of 2020 Massachusetts Bay samples by location ...... 32 Figure 4-7. Percent fine sediments and depth superimposed on the ordination plot
of the 2020 infauna samples ............................................................... 33 Figure 4-8. Lush growth, primarily sea anemones, on an active outfall diffuser in
2020..................................................................................................... 34 Figure 4-9. Total organic carbon in Boston Harbor, 1992–2020 .......................... 36

xiii
Figure 4-10. Mean number of species per sample in Boston Harbor, 1991–2020 .. 36 Figure 5-1. Fish-and-shellfish monitoring stations ................................................ 38 Figure 5-2. Annual prevalence of centrotubular hydropic vacuolation in winter
flounder, 1991–2020 ........................................................................... 40 Figure 5-3. Annual prevalence of liver tumors in winter flounder, 1991–2020 .... 40 Figure 6-1. Observed and updated-model simulated chlorophyll levels at northern
stations in 2016 ................................................................................... 48 Figure 6-2. Dissolved oxygen concentrations at four locations in 2020 ............... 49 Figure 6-3. Bottom water dissolved oxygen concentrations, September 2020 ..... 50 Figure 6-4. Schematic depicting the circumstances leading to hypoxia in shallow
Cape Cod Bay ..................................................................................... 51
List of Tables Table 2-1. Contingency Plan threshold values and 2020 results for effluent
monitoring ............................................................................................. 7 Table 3-1. Contingency Plan threshold values and 2020 results for water-column
monitoring ........................................................................................... 26 Table 4-1. Contingency Plan threshold values and 2020 results for seafloor
monitoring ........................................................................................... 37 Table 5-1. Contingency Plan threshold values and 2020 result for fish-and-
shellfish monitoring ............................................................................ 41 Table 6-1. Projected and actual 2020 loads of contaminants in MWRA influent 44 Table 6-2. Projected and actual 2020 loads of contaminants in MWRA effluent.44 Table 6-3. Concentrations of chemical contaminants estimated from mussel
bioconcentration factor and from effluent dilution compared to water quality criteria for the protection of human health ............................. 46

1
1. IntroductionThis annual Outfall Monitoring Overview report fulfills a requirement of the Massachusetts Water Resources Authority (MWRA) permit to discharge municipal sewage effluent to Massachusetts Bay. It provides an annual summary of monitoring results, part of the commitment to ensure the bay is not degraded by the effluent discharge. The annual overview also serves as a reminder of the immense recovery of Boston Harbor over the past decades and summarizes MWRA’s other important environmental findings. MWRA, often in cooperation with other agencies, studies issues such as changing air and water temperatures, fluctuating dissolved oxygen levels, and new types of sewage contaminants, all of which are important to understanding the complex harbor and bays system.
For more than 36 years, MWRA has worked to minimize adverse effects of municipal discharges on the marine environment. One of the most important steps took place in September 2000, when the effluent discharge from Deer Island Treatment Plant was diverted from the harbor to Massachusetts Bay, so this year’s overview also marks 20 years of Massachusetts Bay discharge. The deep-water outfall operates under a National Pollutant Discharge Elimination System (NPDES) permit, jointly issued by the U.S. Environmental Protection Agency (EPA) and the Massachusetts Department of Environmental Protection (MassDEP). An independent Outfall Monitoring Science Advisory Panel (OMSAP) provides technical review to EPA and MassDEP.
The NPDES permit requires MWRA to monitor the effluent before discharge, as well as the bay water, sediments, and marine life that could be affected. Monitoring assesses compliance with the permit and its Contingency Plan, which is specifically designed to protect the environmental health of the bay and requires comparing measured conditions against two types of thresholds. If a caution threshold is exceeded, MWRA must investigate, while a warning threshold is a higher level of concern that could require responsive action. Background information about the monitoring program (Werme et al. 2012), the most current monitoring plan (MWRA 2021) and Contingency Plan (MWRA 2001), past plans and overviews, and study-specific technical reports are available on MWRA’s technical report list, http://www.mwra.state.ma.us/harbor/enquad/trlist.html.
Long-term environmental monitoring by MWRA in Boston Harbor and Massachusetts Bay has documented both the improvements to the harbor and continued good health of the bay. This year’s report for 2020 presents information relevant to permit and Contingency Plan requirements in the effluent, water column, sea floor, and fish and shellfish. There is also a section on special studies conducted in response to permit conditions and environmental concerns.

2
2. Effluent Despite the disruptions of the COVID-19 pandemic, Deer Island Treatment Plant continued to operate as designed through 2020, earning MWRA the National Association of Clean Water Agencies (NACWA) Platinum 14 Peak Performance Award. This NACWA award recognizes facilities with 100% compliance with effluent permit limits over 14 consecutive years.
2020 Effluent Characterization Wastewater influent to Deer Island Treatment Plant includes not only municipal sewage but also groundwater infiltration and stormwater inflow. Consequently, rainfall is an important factor determining wastewater flows and contaminant concentrations in the wastewater effluent. The Boston area received only 38 inches of rain in 2020, well below the 50 inches of rain in 2019 and also below the 1990–2020 average (Figure 2-1).
Figure 2-1. Annual and average rainfall in Boston, 1990–2020. With low rainfall, effluent flow in 2020 was less than the 1999–2020 average, those years since all influent flow was transferred to Deer Island for treatment (Figure 2-2). Virtually all the flow received full primary and secondary treatment in 2020, with only trace amounts of primary-treated effluent blended with fully treated effluent prior to discharge, as is sometimes necessary during high flows caused by large storms (Figure 2-3). Blended effluent meets standards for discharge.

3
Figure 2-2. Annual full primary- and secondary-treated effluent flows (light blue) and primary-blended (dark blue) flows, 1999–2020. During large storms, flow exceeding the secondary capacity of the plant is diverted around the secondary process; these primary-treated flows are blended into fully treated flows before discharge.
Figure 2-3. Monthly full primary- and secondary-treated (light blue) and primary-blended (dark blue) flows and rainfall during 2020.
0
1
2
3
4
5
6
0
50
100
150
200
250
300
350
400
450
500
Jan Feb Mar Apr May Jun Jul Aug Sep Oct Nov Dec
Rainfall (inches)
FLOW (MGD)
Secondary flows Primary‐blended flows Rain

4
The total suspended solids load to Massachusetts Bay in 2020 was about 12.4 tons per day, also lower than in 2019 and well below the levels discharged into Boston Harbor before the outfall diversion to Massachusetts Bay in 2000 (Figure 2-4). In recent years, the total solids load has averaged about 10% of what had been discharged to Boston Harbor in 1990–1991, and variability in the suspended solids load has corresponded to variability in rainfall and effluent flow.
Figure 2-4. Annual solids discharges, 1990–2020. Biochemical oxygen demand, a measure of the amount of oxygen consumed by microorganisms, also remained low (not shown), well below levels that would be expected to affect dissolved oxygen concentrations in the environment. Carbonaceous biochemical oxygen demand, the portion of the total oxygen demand that has weekly and monthly permit limits, has consistently remained lower than those limits.
0
20
40
60
80
100
120
140
160
1990 1995 2000 2005 2010 2015 2020
Sewage solids discharged to Boston Harbor until 12/1991.
9/2000 – present: Full secondary treatment removes over 80% of solids before discharging effluent to Massachusetts Bay.
1998‐2000: Deer Island Treatment Plant put in place the first battery of secondary treatment, which more effectively removes solids and contaminants than primary.
1995‐1998: Improved primary treatment removed more solids.
Total Suspended Solid
s Load
(tons/day)

5
The total nitrogen load for 2020 was below the Contingency Plan caution-level threshold of 12,500 metric tons, which is set at about 90% of the warning level of 14,000 metric tons (Figure 2-5). The caution level was exceeded in 2019; however, modeling has suggested that even greater discharges, up to 120% of the more stringent warning level or higher, would not adversely affect Massachusetts Bay (Zhao et al. 2017). MWRA regularly updates its plans for nitrogen-removal strategies, should they be needed (most recently in Ellis-Hibbett and Hunt 2021). The total nitrogen load (total bar height, Figure 2-5) has remained more consistent throughout the years of monitoring than other effluent constituents, partly because it is not as readily removed in treatment as other constituents. However, it has increased only slowly over the past 15 years, despite population increases in the MWRA service area. (Note that the caution level would have been exceeded in the baseline year 1996, had the NPDES permit been in place.) Loads of all nitrogen species were relatively low in 2020, mainly due to the low flow, even though the population continued a steady increase. The portion of the effluent composed of ammonium, the component most readily taken up by phytoplankton, has increased over the past 15–20 years. This mostly steady increase has been a result of the treatment processes for both biosolids and effluent. The 2020 ammonium load, however, was lower than it had been for more than a decade.
Figure 2-5. Annual nitrogen discharges, 1996–2020, and population, 2006–2020. The warning threshold is 14,000 metric tons per year; the caution threshold was set at 90% of the warning threshold. Modeling has shown that there would be no detectable environmental effects at 120% of the warning threshold (Zhao et al. 2017).

6
Metals loads also remained low in 2020 (Figure 2-6). Zinc continued to be the most abundant metal in the annual discharge, followed by copper. Both are present in water pipes and fixtures. Other notable sources of zinc to wastewater include commercial enterprises, such as beauty shops, automobile-repair shops, and hospitals; residential household products, such as shampoos, ointments, and laundry detergent; and street runoff (MWRA, unpublished data).
Figure 2-6. Annual metals discharges, 1990–2020.
Total loads of all metals remained small percentages of what had been anticipated during planning for the Massachusetts Bay outfall. Except for copper, metals meet water quality standards prior to discharge, where initial dilution further reduces concentrations. Copper discharges meet the standard after initial dilution and have declined over time, a result of drinking-water corrosion control, which decreases leaching from water pipes, and other source-reduction efforts.
Polycyclic aromatic hydrocarbon and other organic contaminant loads were also low and only a small fraction of what had been anticipated during planning for the outfall, as they have been throughout the monitoring program. Discharges of organic contaminants have varied slightly from year to year but have been well below levels historically discharged into Boston Harbor. For some compounds, such as 4,4’-DDE, one of the most prevalent breakdown products of the pesticide DDT, there is some evidence (not shown) of the very slow declines anticipated after those persistent substances were banned.
The great differences between projected and actual loads of conventional, metal, and organic contaminants are discussed further in Section 6, Special Studies.

7
Contingency Plan Thresholds There were no permit violations in 2020 (Table 2-1). Effluent threshold exceedances based on permit conditions have been rare, and none have occurred in the past 14 years. Table 2-1. Contingency Plan threshold values and 2020 results for effluent monitoring.
Parameter Baseline Caution Level Warning Level 2020 Results Permit Condition and Contingency Plan Thresholds pH NA None <6 or >9 Not exceeded
Fecal coliform NA None >14,000 fecal coliforms/100 mL Not exceeded
Chlorine, residual NA None >631 µg/L daily, >456 µg/L monthly Not exceeded
Suspended solids NA None >45 mg/L weekly >30 mg/L monthly Not exceeded
cBOD NA None >40 mg/L weekly, >25 mg/L monthly Not exceeded
Acute toxicity NA None LC50 <50% Not exceeded
Chronic toxicity NA None NOEC <1.5% effluent Not exceeded
PCBs NA Aroclor>0.045 ng/L None Not exceeded
Plant performance NA 5 violations/year Compliance <95% of the time Not exceeded
Flow NA None >436 MGD average dry days Not exceeded
Oil and grease NA None >15 mg/L weekly Not exceeded Contingency Plan Thresholds
Total nitrogen load NA >12,500 mtons/year
>14,000 mtons/year 11,600 mtons
NA = not applicable cBOD = carbonaceous biological oxygen demand LC50 = 50% mortality concentration NOEC = no observable effect concentration PCB = polychlorinated biphenyl Plant performance = compliance with permit conditions
8
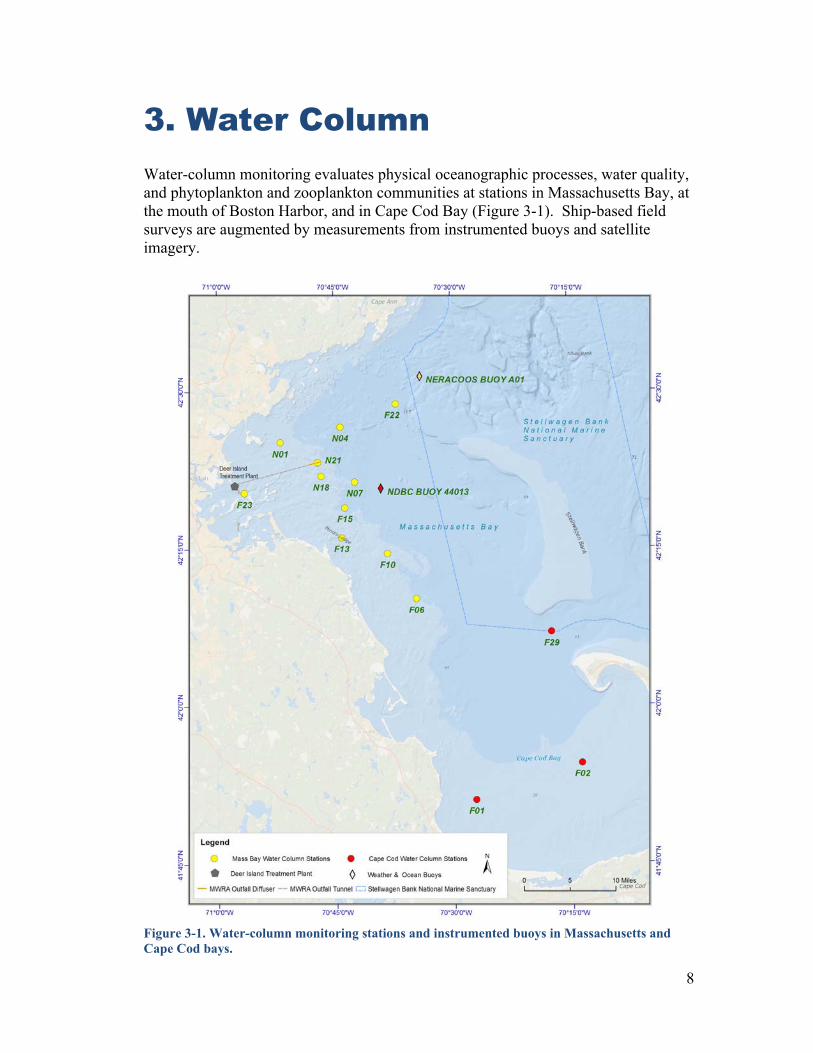
3. Water Column Water-column monitoring evaluates physical oceanographic processes, water quality, and phytoplankton and zooplankton communities at stations in Massachusetts Bay, at the mouth of Boston Harbor, and in Cape Cod Bay (Figure 3-1). Ship-based field surveys are augmented by measurements from instrumented buoys and satellite imagery.
Figure 3-1. Water-column monitoring stations and instrumented buoys in Massachusetts and Cape Cod bays.

9
Typically, nine regular surveys are conducted in February–October of each year. Five stations are in the nearfield (a 12 km by 10 km area centered on the outfall, where some effects of the effluent were expected and have been observed), and nine are in the more distant farfield, including the mouth of Boston Harbor, Cape Cod Bay, and near Stellwagen Bank National Marine Sanctuary. Additional surveys may be triggered by elevated abundance of the potentially toxic dinoflagellate Alexandrium catenella. These Alexandrium Rapid-Response Study surveys (Libby et al. 2013) provide in situ hydrographic data and water samples for measuring inorganic nutrients and Alexandrium abundance from up to 19 stations. Data from another set of ten stations in Boston Harbor, sampled as part of MWRA’s harbor water-quality monitoring, are included in analyses when sampling dates are within a few days of the outfall-monitoring surveys. The program benefits from collaboration with the Center for Coastal Studies at Provincetown, Massachusetts, which samples the water-column stations in Cape Cod Bay and near Stellwagen Bank National Marine Sanctuary. Regulators have set a target that, whenever possible, sampling in Cape Cod Bay should occur within 48 hours of the Massachusetts Bay sampling. The surveys are supplemented by measurements on two instrumented buoys: the Northeastern Regional Association of Coastal and Ocean Observing Systems (NERACOOS) Buoy A01 off Cape Ann, and the National Oceanic and Atmospheric Administration’s National Data Buoy Center (NDBC) Buoy 44013 in central Massachusetts Bay. The National Aeronautics and Space Administration provides Moderate Resolution Imaging Spectroradiometer satellite imagery of chlorophyll.
COVID-19 Pandemic Protocols The COVID-19 pandemic brought its first recorded case to Massachusetts in early February 2020, shortly before MWRA’s first survey of the year. On March 10, when the governor of Massachusetts declared a state of emergency, mobilization for the regular March survey had begun. Sampling was completed at the three Cape Cod Bay stations, but the larger part of the March survey was canceled, and the April survey was postponed. Most research vessels in the Gulf of Maine, including those that MWRA uses for monitoring, remained at dock during those months. During that time, MWRA, its regulators, and its sampling partners developed safe alternative protocols to allow monitoring to resume. Eventually, what would have been the April survey was conducted in early May, and the year ended with eight rather than the usual nine completed survey dates. Field staffing was decreased from six to three during May–July to accommodate social distancing; a fourth scientist was added in August. Particulate organic carbon, zooplankton, and marine mammal observations were dropped from the program in May–July, giving priority to samples and measurements necessary to address Contingency Plan thresholds. Adding an additional field scientist in August allowed for re-introducing particulate organic carbon measurements and zooplankton studies.

10
The absence of March and April data precluded calculation of Contingency Plan thresholds for annual and winter/spring chlorophyll and winter/spring presence of the nuisance algae Pseudo-nitzschia spp. There were sufficient data to calculate all other threshold parameters.
Physical Conditions Monitoring has shown that the water quality in the vicinity of the outfall and throughout Massachusetts and Cape Cod bays is heavily influenced by weather, river inflows, and other physical factors. Information about physical conditions has proven key to interpreting the annual water-column monitoring data. After two relatively rainy years, 2020 was dry (see Figure 2-1, page 2), with lower-than-average flow from both the Merrimack and Charles rivers during much of the year (Figure 3-2; Libby et al. 2021). Summer flow from the Merrimack River was only in the 16th percentile of the long-term flow, approaching drought conditions. Low riverine discharge can result in high surface-water salinity, and station-average salinity measurements were close to or above the historic median values during every survey. While year-to-year variability in rainfall and river discharge can exert large effects on bay conditions, no unusual patterns have been detected.
Figure 3-2. Flows of the Merrimack (top) and Charles (bottom) rivers. Red lines are 2020 data. Results from 1992–2019 are in light blue. The quarterly percentiles represent the 2020 flows in comparison to the entire record.
11
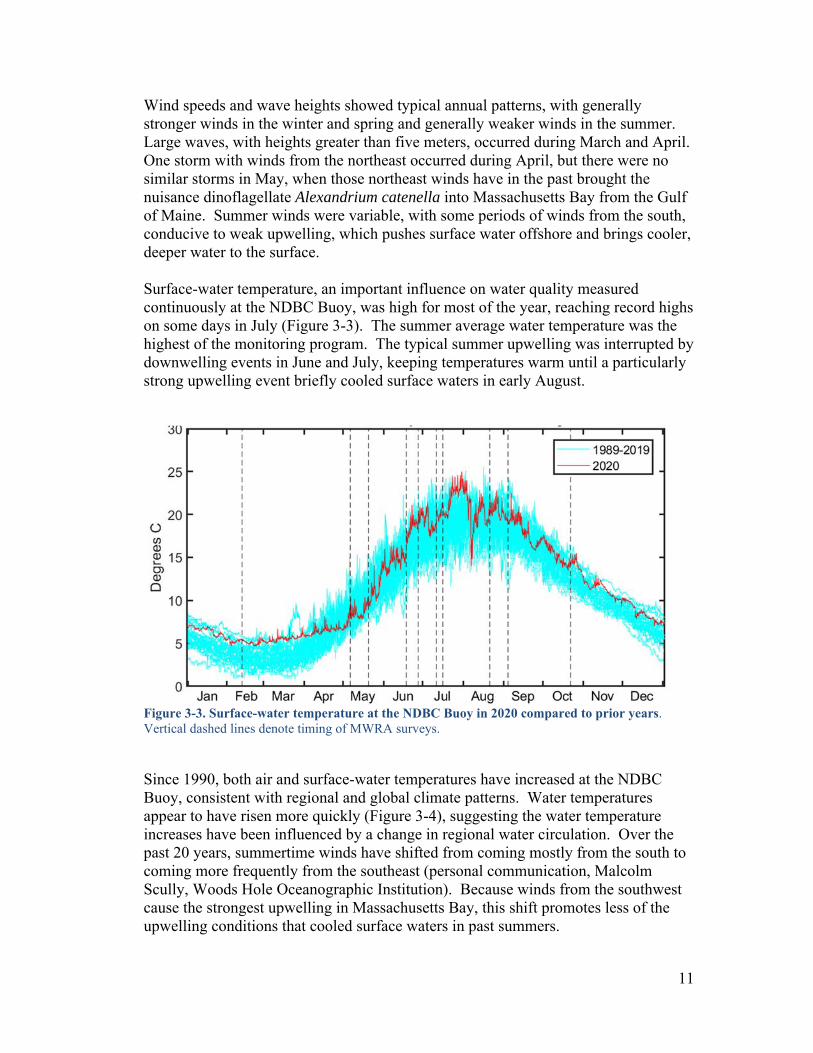
Wind speeds and wave heights showed typical annual patterns, with generally stronger winds in the winter and spring and generally weaker winds in the summer. Large waves, with heights greater than five meters, occurred during March and April. One storm with winds from the northeast occurred during April, but there were no similar storms in May, when those northeast winds have in the past brought the nuisance dinoflagellate Alexandrium catenella into Massachusetts Bay from the Gulf of Maine. Summer winds were variable, with some periods of winds from the south, conducive to weak upwelling, which pushes surface water offshore and brings cooler, deeper water to the surface. Surface-water temperature, an important influence on water quality measured continuously at the NDBC Buoy, was high for most of the year, reaching record highs on some days in July (Figure 3-3). The summer average water temperature was the highest of the monitoring program. The typical summer upwelling was interrupted by downwelling events in June and July, keeping temperatures warm until a particularly strong upwelling event briefly cooled surface waters in early August.
Figure 3-3. Surface-water temperature at the NDBC Buoy in 2020 compared to prior years. Vertical dashed lines denote timing of MWRA surveys. Since 1990, both air and surface-water temperatures have increased at the NDBC Buoy, consistent with regional and global climate patterns. Water temperatures appear to have risen more quickly (Figure 3-4), suggesting the water temperature increases have been influenced by a change in regional water circulation. Over the past 20 years, summertime winds have shifted from coming mostly from the south to coming more frequently from the southeast (personal communication, Malcolm Scully, Woods Hole Oceanographic Institution). Because winds from the southwest cause the strongest upwelling in Massachusetts Bay, this shift promotes less of the upwelling conditions that cooled surface waters in past summers.

12
Figure 3-4. Mid-June through mid-August air and surface-water temperatures at the NDBC Buoy, 1992–2020. The spring and summer stratification, which separates the Massachusetts Bay water column into distinct shallow and deep layers, was less intense than average during some months, but more intense in June, followed by a decrease due to a downwelling event in early July (Figure 3-5). August cooling and late summer winds further weakened stratification. Shallower inshore stations were well mixed by the October survey, while data from the NERACOOS Buoy showed that deeper waters remained stratified until late November.
Figure 3-5. Stratification at nearfield Station N18 in 2020 compared to prior years. Stratification is the difference in density (kg per cubic meter) between the near-seafloor and the near-surface measurements. Black points and line are results from 2020. Results from 1992–2019 are in blue: line is 50th percentile, dark shading spans the 25th to 75th percentile, light shading spans the range.

13
Water Quality Water quality measurements for 2020 included quantification of nutrients, phytoplankton biomass, and dissolved oxygen. Results continued to confirm predictions of measurable outfall influence on some parameters, but only at stations very near the outfall. There were no unexpected or environmentally adverse findings (Libby et al. 2021).
Nutrients Dissolved inorganic nutrient concentrations in the nearfield stayed mostly within the ranges measured in previous years. Concentrations of nitrate, phosphate, and silicate continued to show the typical seasonal patterns that were present before the offshore outfall began to discharge and that are related to phytoplankton uptake, exchange with the Gulf of Maine, and inputs from river discharge.
Nitrogen, including nitrate and ammonium, is the most important nutrient for phytoplankton growth in Massachusetts Bay. Ammonium is also the largest fraction of the total nitrogen in wastewater (see Figure 2-5, page 5), making it a good effluent tracer. The 2020 outfall ammonium signature was typical of the years since the discharge relocation, differing from the seasonal patterns observed for other nutrients at stations within 10–20 kilometers of the outfall (Figure 3-6; Reilly et al. 2018). As in other years since the outfall began to discharge in 2000, episodic peaks in ammonium concentrations were detected at Station N21, located just 60 meters from the outfall; at Station N18, 2.5 kilometers to the south; and during some surveys, at Station F15, nine kilometers to the southeast. A particularly high spike at Station N21 in October may have resulted from the sample being taken within the turbulent mixing zone of the outfall diffusers and therefore not having completed the initial-dilution process.
Conversely, ammonium concentrations remained consistently low at Station F23 at the mouth of Boston Harbor, at other Massachusetts Bay stations, and in Cape Cod Bay. Concentrations at Station F23 remained well below those measured when wastewater was discharged into Boston Harbor, one of the most noticeable improvements following the transfer of discharge from the harbor to the bay.

14
Figure 3-6. Station-average ammonium concentrations at selected stations in 2020 compared to prior years. In 2020, as in past years, effluent discharge increased concentrations only near the outfall. COVID-19 protocols limited sampling in 2020, and for some stations, historic data (shading) extend later in the year than the current survey schedule. Black points and line are results from individual surveys in 2020. Red lines and shading show data from 1992-2000, Boston Harbor discharge years. Blue lines and shading show data from September 2000–2019, Massachusetts Bay discharge years. Red and blue lines are the 50th percentile, dark shading spans the 25th to 75th percentile, and light shading spans the range. The spike at Station N21 in October 2020 may have resulted from sampling directly within the turbulent mixing zone of the outfall diffusers, where the initial mixing dilution process was not complete. As predicted by numeric model runs before the outfall began to discharge in 2000 and observed during each year of monitoring, the effluent plume’s ammonium signature was evident in surface waters during the winter surveys, when the water column was relatively well-mixed (Figure 3-7). (In 2020, due to the COVID-19 protocols, this result was evident only during the February survey. No surveys were completed in Massachusetts Bay during March or April 2020, and the water column had begun to stratify in May.) The plume was confined beneath the pycnocline, below where maximum phytoplankton growth occurs, during the summer, stratified season (Figure 3-8). The ammonium signature could be detected to distances of about 10–15 kilometers from the outfall during both stratified and unstratified seasons, remaining consistent with past years and predictions made during planning for the outfall.

15
Figure 3-7. (Left) Surface- and bottom-water ammonium on February 11, 2020 at the monitoring stations during mixed conditions. (Right) Cross-sections of concentrations throughout the water column along transects connecting selected stations. Station N21 is directly over the outfall.
Figure 3-8. (Left) Surface- and bottom-water ammonium on June 18, 2020 at the monitoring stations during stratified conditions. (Right) Cross-sections of concentrations throughout the water column along transects connecting selected stations. The yellow line denotes the pycnocline.

16
Phytoplankton Biomass Despite the localized ammonium concentration increases that could have the potential to fuel phytoplankton growth (e.g., Libby et al. 2020), no increases in phytoplankton biomass have been detected, even at stations closest to the outfall, and none were measured in 2020 (Figure 3-9). Phytoplankton biomass is reported as areal chlorophyll, which represent chlorophyll concentrations summed from measurements collected through the water column. Seasonal peaks typically occur in the winter or spring and again in the fall. During the 2020 survey season, areal chlorophyll levels peaked during the early May survey at several stations and increased again in August–October.
Figure 3-9. Station average areal chlorophyll concentrations at selected stations in 2020 compared to prior years. COVID-19 protocols limited sampling in 2020, and for some stations, historic data extend later in the year than the current survey schedule. The black points and lines are results from 2020; the blue lines and shading are results from 1992–2019: the line is the 50th percentile, dark shading spans the 25–75th percentiles, and the light shading spans the range. Data from the instrumented NERACOOS Buoy and satellite imagery were particularly useful in 2020, as they helped fill the COVID-19-related gaps in the MWRA survey schedule. Satellite imagery showed a large increase in chlorophyll fluorescence in late February and early March, when MWRA could not sample (Figure 3-10). Imagery also showed high chlorophyll levels in mid-April through early May, possibly indicative of a Phaeocystis pouchetii bloom. Chlorophyll levels were again elevated in October–December, after the end of the field-sampling season. These characteristics are typical of observations in past years.

17
Figure 3-10. Moderate-Resolution Imaging Spectroradiometer satellite imagery of surface chlorophyll concentrations in 2020. These images are highly weather-dependent and do not represent consistent intervals of time. In 2020, they were particularly useful in filling in gaps in information caused by the COVID-19 pandemic. The numbers show the time of the MWRA surveys. (Survey 2* included only Cape Cod Bay stations.)

18
Dissolved Oxygen Massachusetts Bay bottom-water dissolved oxygen concentrations began the year with relatively low levels in February (Figure 3-11). Levels remained relatively low in May and June, a result of the strong water-column stratification. There was no definitive event, but in July, stratification decreased and bottom-water oxygen levels increased throughout the region. Dissolved oxygen concentrations then remained typical of the historic record throughout the late summer and early fall. Measurements from the instrumented buoys indicated that the minima were moderate, typical for the monitoring program. (Observations from the NERACOOS Buoy are presented in Figure 3-17, page 25.)
Figure 3-11. Near-bottom water dissolved oxygen concentrations (milligrams per liter) in 2020 compared to prior years. COVID-19 protocols limited sampling in 2020, and for some stations, historic data extend later in the year than the current survey schedule. The black points and lines are results from 2020; the blue lines and shading are results from 1992–2019: the line is the 50th percentile, dark shading spans the 25–75th percentiles, and the light shading spans the range.

19
Cape Cod Bay stations exhibited similar patterns in dissolved oxygen concentrations to those seen in Massachusetts Bay during most of the year, with a low start in February, an initial decline due to strong stratification, and then a recovery in July. As in 2019, levels fell steeply in late August and early September, reaching relatively low levels at Station F01 in western Cape Cod Bay and even lower levels, 4–5 milligrams per liter, at Station F02 to its east (Figure 3-12). Higher but still record low dissolved oxygen levels for those stations and surveys were recorded at Station F01 in June and September. Also as in 2019, even lower concentrations were found by other researchers in shallow, southern nearshore waters. Ongoing evaluation of hypoxia in shallow coastal Cape Cod Bay waters is discussed in Section 6, Special Studies.
Figure 3-12. Near-bottom water dissolved oxygen concentrations (milligrams per liter) at Cape Cod Bay stations in 2020 compared to prior years. The black points and lines are results from 2020; the blue lines and shading are results from 1992–2019: the line is the 50th percentile, dark shading spans the 25–75th percentiles, and the light shading spans the range.
Phytoplankton Communities During the months when sampling could be completed, the 2020 total phytoplankton abundances throughout Massachusetts Bay were relatively low, comparable to those months in other recent years (Figure 3-12, Libby et al. 2021). The COVID-19 protocols did not allow for sampling during March and April when centric diatoms and the nuisance colonial flagellate Phaeocystis pouchetii are often abundant. Satellite imagery showed increased phytoplankton biomass, measured as chlorophyll, during those months, and Phaeocystis was present at moderate abundance in May samples. The spring increase was typical of past years. The May–October abundances of diatoms and microflagellates were lower than in many other years. Microflagellates, the most abundant phytoplankton group in Massachusetts Bay, were present at levels near the long-term mean for much of the summer, but greatly decreased in the late summer and fall (not shown).

20
Figure 3-13. Total phytoplankton abundance (million cells per liter) at selected stations in 2020 compared to prior years. COVID-19 protocols limited sampling in 2020, and for some stations, historic data extend later in the year than the current survey schedule. The black points and lines are results from 2020; the blue lines and shading are results from 1992–2019: the line is the 50th percentile, dark shading spans the 25–75th percentiles, and the light shading spans the range. While abundance of both centric and pennate diatoms was low, as in 2019, the potentially toxic genus of pennate diatoms Pseudo-nitzschia was present in somewhat elevated numbers in 2020 compared to recent years. Levels did not reach the higher abundances observed in the 1990s and remained well below Contingency Plan thresholds. At particularly high abundance, domoic acid produced by some species of Pseudo-nitzschia can cause amnesic shellfish poisoning (ASP), a life-threatening illness. Pseudo-nitzschia delicatissima, the species that dominated in 2020, does not produce much toxin, and there were no shellfish-bed closures due to ASP toxicity. The only phytoplankton group present in higher-than-average numbers was dinoflagellates. However, within that group, some commonly dominant species groups, such as Ceratium spp., were present in only low numbers.

21
The increased dinoflagellate abundance was mostly due to presence of Karenia mikimotoi, a species first observed by MWRA in 2017 and that has since become abundant from Maine to Rhode Island. Karenia mikimotoi has been categorized as a harmful species, but its toxins are not well-characterized, and it is not expected to exert any harmful effects on human health (personal communication, J. Kennedy, Massachusetts Department of Marine Fisheries). At very high abundances, three to ten million cells per liter, it has been known to harm fish and shellfish.
Maximum abundances in the MWRA study area approached one million cells per liter in all regions, except the most northern stations and Station F29, off Race Point at the tip of Cape Cod, where they were lower. Cells were present in MWRA samples taken from February–October, extending the seasonal range compared to 2017–2019 (Figure 3-14). Abundance at the depth of maximum chlorophyll was typically four times and as much as 20 times the surface abundance.
The observed abundances were not sufficient to increase biological oxygen demand and lead to low oxygen levels in most of Massachusetts and Cape Cod bays. However, in combination with warm, shallow waters and the added oxygen demand of dead and decaying phytoplankton cells, Karenia is a likely contributor to the hypoxia observed in inshore Cape Cod Bay, which is discussed in Section 6, Special Studies.
Figure 3-14. Abundance of Karenia mikimotoi at the surface (SURF) and at the depth of maximum chlorophyll (CMAX) of all MWRA samples, 2017–2020. Cells first appeared in 2017 and were present for increasingly longer portions of the year in 2019 and 2020. Each dot represents one sample. Note log scale.

22
Sufficient cells of the potentially toxic red tide dinoflagellate Alexandrium catenella were detected in samples from near Boston’s South Shore in June to trigger rapid-response surveys. Two such surveys, which are conducted weekly until the bloom subsides, were completed in late June and early July. Large Alexandrium catenella blooms can cause paralytic shellfish poisoning (PSP), a life-threatening condition for marine mammals and humans who consume shellfish. The elevated counts were fairly widely spatially scattered in 2020, and no PSP toxicity was detected in Massachusetts Bay. In comparison to other years, the 2020 bloom was considered moderate (Figure 3-15).
Figure 3-15. Nearfield abundance of Alexandrium catenella, 1992–2020. The bloom was moderate in 2020. Note log scale. Alexandrium red tide blooms have been noted in Massachusetts Bay since the early 1970s and were particularly common in the 1970s and 1980s, followed by a lull in the 1990s and early 2000s. In years when they have occurred, the blooms have originated from cells from established cyst beds off the coast of Maine (Anderson et al. 2013). The cells have entered Massachusetts Bay when winds from the northeast pushed water from coastal Gulf of Maine waters into the bay. Somewhat unusually, in 2020, Alexandrium abundance was low in the Gulf of Maine, and there was no well-timed storm that would have transported cells to Massachusetts Bay. Alexandrium cysts had been detected in Massachusetts Bay in the 2019 seafloor survey, following a strong and protracted bloom and prompting some concern that a future bloom could originate from local sources. The moderate bloom in 2020 did not provide sufficient evidence to establish a source. However, cysts were again found in Massachusetts Bay in 2020, and MWRA is working with regional experts to evaluate the potential effects of a local cyst bed on future blooms.

23
Including Radiolarians Excluding Radiolarians
Zooplankton Communities COVID-19 restrictions severely hampered zooplankton monitoring in 2020, and samples were taken during just four surveys, in February, August, September, and October (Libby et al. 2021). As is typical, copepod life stages, particularly the small species Oithona similis, dominated in every survey, and analyses from the February and October samples suggested that community structure and seasonal abundance patterns were largely similar to prior years.
The August and September samples, however, included an unprecedented number of radiolarians (Figure 3-16), single-celled protozoans that build ornate silica exoskeletons. Radiolarians had not been observed in prior years of the monitoring program, but are known to be prevalent in offshore waters. Another offshore taxon, the marine cladoceran Penila avirostris, was also present, suggesting an influx of more water originating from outside the bay than during typical past years. Such an offshore influx could be related to the shift in the direction of the summer winds, discussed earlier in this section.
Figure 3-16. Abundance of non-copepod zooplankton including (left) and excluding (right) radiolarians. Radiolarians, an offshore taxon, had not been previously observed in the Massachusetts Bay monitoring program but were abundant across the bays in 2020, accounting for about half the non-copepod zooplankton collected in 2020.

24
Radiolarians feed largely on microflagellate phytoplankton, which were present in particularly low abundance in 2020. Predation by radiolarians may, at least partially, account for an abrupt decrease in microflagellate abundance between the August and September surveys, during the late summer and fall period when radiolarians were present.
Stellwagen Bank National Marine Sanctuary The NPDES permit to discharge from Deer Island Treatment Plant into Massachusetts Bay requires annual reporting on results relevant to Stellwagen Bank National Marine Sanctuary. Water column Station F22 is in Stellwagen Basin, just to the west of the sanctuary, and is considered to be representative of northern, offshore conditions. The instrumented NERACOOS Buoy is located within the sanctuary. Ammonium levels have remained low at Station F22 since the outfall began to discharge (see Figure 3-6, page 14). Levels have also remained low at Station F06, located 29 kilometers southeast of the outfall and west of the sanctuary. Sampling at Station F22, as well as data from the NERACOOS Buoy and satellite imagery, detected no unusual chlorophyll levels in offshore regions in 2020. No effects on chlorophyll levels in the offshore, including the sanctuary, were predicted as a result of moving the discharge from Boston Harbor to the bay, and none have been measured. Dissolved oxygen concentrations at Station F22 in Stellwagen Basin were healthy throughout 2020. Both survey observations and data from the NERACOOS Buoy showed the typical decline during the stratified season (Figure 3-17). Data from the buoy documented the rapid return to oxygenated conditions following fall mixing events.

25
Figure 3-17. Dissolved oxygen at the NERACOOS Buoy A01, Station F22 in Stellwagen Basin, and at Station N18 in the nearfield.
Boston Harbor Water Quality Water quality in Boston Harbor has greatly improved during the decades of the Boston Harbor Project, and those improvements were sustained in 2020. MWRA’s in-house Boston Harbor monitoring program confirmed that harbor-wide concentrations of total nitrogen and phosphorus remained low, as they have since effluent discharges to the harbor ended.
Perhaps the most dramatic improvement in Boston Harbor was the decrease in ammonium levels (see Figure 3-6, page 14). Ammonium concentrations dropped precipitously in 2000, when the effluent discharge was diverted from the harbor to the bay, and have remained low. The decreases in nutrient inputs have been accompanied by decreases in primary production and phytoplankton biomass, an abatement of the harbor’s historic high level of eutrophication, which was the result of over-stimulation of phytoplankton growth in urban waters (Werme et al. 2018, Taylor et al. 2020).
The summer 2019 Karenia mikimotoi bloom was particularly strong in Boston Harbor, temporarily discoloring the water. Karenia was also present in the harbor in 2020, at levels comparable to those observed in Massachusetts Bay (discussed above, page 21).

26
Contingency Plan Thresholds There were no water-column threshold exceedances for the parameters that could be calculated for 2020 (Table 3-1). The altered survey schedule, a result of COVID-19 protocols, precluded calculation of three thresholds: annual and winter/spring chlorophyll levels and winter/spring Pseudo-nitzschia counts. Table 3-1. Contingency Plan threshold values and 2020 results for water-column monitoring.
Parameter Baseline Caution Level
Warning Level 2020 Results
Dissolved oxygen* Nearfield concentration 6.05 mg/L <6.5 mg/L <6.0 mg/L 6.69 mg/L
Nearfield percent saturation 65.3% <80% <75% 73.1%
Stellwagen concentration 6.23 mg/L <6.5 mg/L <6.0 mg/L 7.14 mg/L
Stellwagen percent saturation 67.2% <80% <75% 74.3 %
Nearfield depletion rate 0.024 mg/L/d >0.037 mg/L/d >0.049 mg/L/d 0.018 mg/L/d
Chlorophyll Annual 72 mg/m2 >108 mg/m2 >144 mg/m2 NV
Winter/spring 50 mg/m2 >199 mg/m2 None NV
Summer 51 mg/m2 >89 mg/m2 None 53.7 mg/m2
Autumn 90 mg/m2 >239 mg/m2 None 102 mg/m2
Nuisance algae nearfield Pseudo-nitzschia Winter/spring 6,735 cells/L >17,900 cells/L None NV
Summer 14,635 cells/L >43,100 cells/L None 366 cells/L
Autumn 10,050 cells/L >27,500 cells/L None 1,150 cells/L
Nuisance algae nearfield Alexandrium catenella
Any nearfield sample
Baseline maximum 163 cells/L
>100 cells/L None 44.5 cells/L†
PSP toxin extent NA New incidence None No new incidence
*Dissolved oxygen caution and warning levels represent numerical criteria, with the caveat “unless background conditions are lower.” Results are therefore compared to the baseline rather than to the caution and warning levels. †Alexandrium catenella not sampled in March or April due to COVID-19 protocols. PSP = paralytic shellfish poisoning NA = not applicable NV = no value because the of the cancellation of one or more surveys due to COVID-19 protocols
27
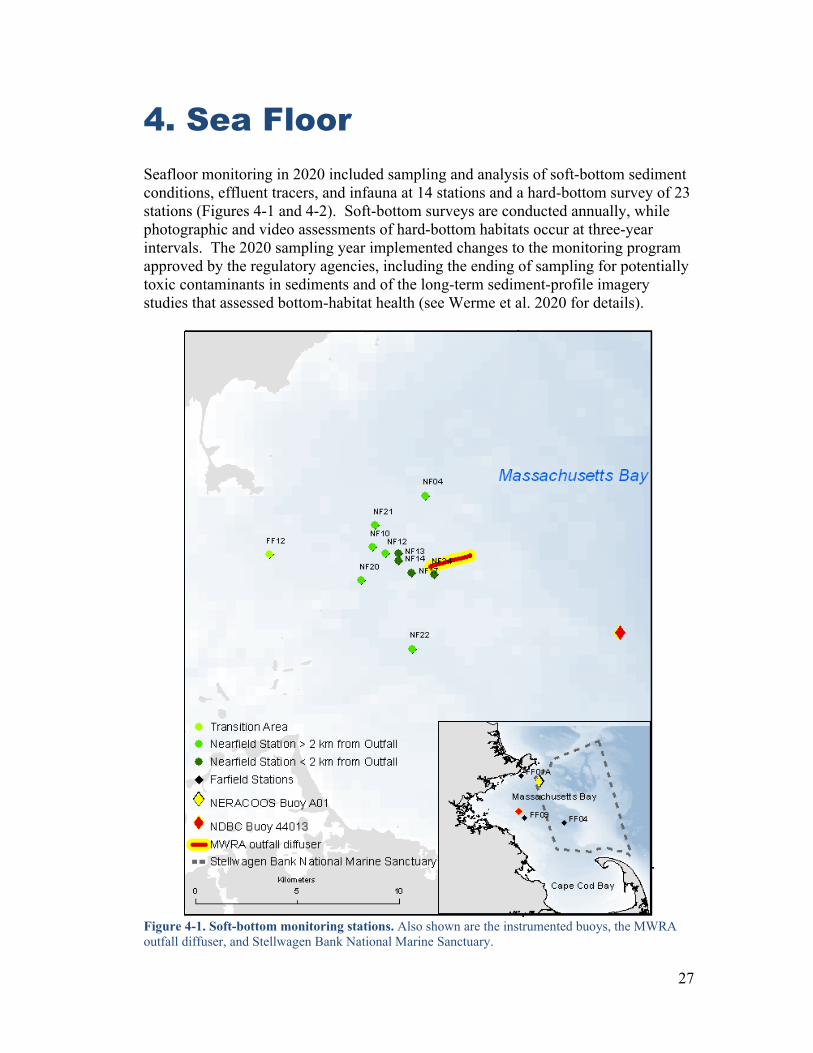
4. Sea Floor Seafloor monitoring in 2020 included sampling and analysis of soft-bottom sediment conditions, effluent tracers, and infauna at 14 stations and a hard-bottom survey of 23 stations (Figures 4-1 and 4-2). Soft-bottom surveys are conducted annually, while photographic and video assessments of hard-bottom habitats occur at three-year intervals. The 2020 sampling year implemented changes to the monitoring program approved by the regulatory agencies, including the ending of sampling for potentially toxic contaminants in sediments and of the long-term sediment-profile imagery studies that assessed bottom-habitat health (see Werme et al. 2020 for details).
Figure 4-1. Soft-bottom monitoring stations. Also shown are the instrumented buoys, the MWRA outfall diffuser, and Stellwagen Bank National Marine Sanctuary.

28
Figure 4-2. Hard-bottom monitoring stations. Also shown are the instrumented buoys, the MWRA outfall diffuser, and Stellwagen Bank National Marine Sanctuary.

29
Soft-bottom sediment sampling was completed in August 2020, with samples analyzed for grain-size distribution, the effluent tracer Clostridium perfringens spores, total organic carbon, and benthic infauna abundance and species composition. The 14 stations included four nearfield stations within two kilometers of the outfall; six nearfield stations in western Massachusetts Bay but farther from the outfall; one station in the “transition” area between Boston Harbor and the nearfield; and three farfield reference stations in Massachusetts and Cape Cod bays. For the purposes of threshold testing, “nearfield” included the transition station, as well as both nearfield groups, for a total of eleven stations. Hard-bottom video surveys were completed in July 2020, two weeks later than in past years, due to COVID-19 protocols. A Fugro Seaeye Falcon remotely operated vehicle with side-scan sonar allowed for rapid location of the outfall risers. It was equipped with both analog and GoPro Hero 6 digital HD video recording capability, which allowed for simultaneous still and video photography.
Sediment Characteristics and Tracers As in past years, sediment grain-size distributions in 2020 varied broadly among stations, ranging from silt and clay at some stations (particularly Station FF04 within Stellwagen Basin) to almost entirely sand at others (Rutecki et al. 2021). Sediment textures have remained generally consistent at individual stations over the years of the monitoring program. As in other years since the offshore outfall began to discharge, it was possible to detect elevated levels of Clostridium perfringens spores at some stations located closest to the outfall (Figure 4-3). Clostridium are anaerobic bacteria that are found in mammalian (including human) digestive tracts and that form persistent spores in oxygen-rich conditions. In most years, Clostridium spore counts are elevated only at stations located within two kilometers of the outfall. Counts at those stations were lower in 2020 than they had been in 2019, but were somewhat higher at nearfield stations slightly farther from the outfall. The highest counts were found at Station NF04, a sandy station just over two kilometers to the north of the outfall. This result is not of concern, as Clostridium spore abundance has declined over time or remained similar to the baseline at all stations (e.g., Rutecki et al, 2021). Percent organic carbon content analyses were consistent with past results, with no increased organic carbon in any area (Figure 4-4). In general, stations with finer sediments, such as Station FF04 within Stellwagen Basin, have higher mean total organic carbon concentrations, while stations with coarser sediments, such as Station NF17 just to the south of the outfall have lower concentrations. Total organic carbon concentrations continue to show no signs of organic enrichment from the outfall. These findings are consistent with a detailed special study of sediment metabolism that ended in 2010. That study documented reductions in total organic carbon and rates of metabolism in Boston Harbor sediments but found no changes in sediments near the Massachusetts Bay outfall (Tucker et al. 2010, Tucker et al. 2014).

30
Figure 4-3. Concentrations of Clostridium perfringens spores, corrected for sediment grain size, in 2020.
Figure 4-4. Total organic carbon at selected stations, 1992–2020. Station FF01A is the northern reference station; FF04 is within Stellwagen Basin; NF12 is >2km northwest of the outfall; and NF17 is in close proximity and southwest of the outfall, where the effects of the discharge might be expected.

31
Soft-bottom Communities The 14 soft-bottom samples collected and analyzed in 2020 yielded 22,889 organisms, classified into 178 species and 23 other discrete taxonomic groups (Rutecki et al. 2021). Total abundance of organisms was lower in 2020 than in 2019 in both nearfield station groups and at the one transition station between Boston Harbor and the nearfield (Figure 4-5). Diversity measures were slightly higher than in 2019, but all measurements remained within the ranges measured throughout the monitoring program (not shown). Polychaete worms continued to dominate at most stations, and the spionid polychaete Prionospio steenstrupi remained the numerically dominant species at several nearfield stations. Prionospio was more abundant in 2019 and 2020 than it had been for the past ten years. Other dominant polychaetes, including Aricidea catherinae and Tharyx acutus were less abundant than in recent years. Such minor species changes from year to year are typical of the region.
Figure 4-5. Total abundance by region, 1992–2020. Regions include the nearfield within two kilometers of the outfall, the nearfield farther than two kilometers from the outfall, the transition area between Boston Harbor and the outfall, and the farfield.

32
Community analyses continued to show no effects of the outfall on relative abundance or community composition. A series of multivariate analyses assessed spatial and temporal patterns in the soft-bottom benthic communities and found no particular species or type of community specifically associated with the outfall. A cluster analysis continued to identify two main infauna assemblages and one outlier group, based on species composition and abundance. Group I was dominated by crustaceans and polychaete worms, Group II by a greater abundance of polychaetes and also mollusks, and the outlier Group III represented the offshore station located within Stellwagen Basin, which has consistently supported a unique polychaete community. Ordination analysis continued to show no indication of any relation of species composition to proximity to the outfall, with stations closest to the outfall represented in both of the two larger main assemblages (Figure 4-6). Analyses further continued to demonstrate that variations in species distributions largely followed differences in sediment grain size and depth (Figure 4-7).
Figure 4-6. Ordination plot of 2020 Massachusetts Bay samples by location. Each point on the plot represents one of the 14 stations; similarity of species composition is indicated by proximity of points on the plot. Faunal assemblages (Groups I-II, and sub-groups) identified by cluster analysis are circled on the plot. FF = farfield, Tran = transition area between Boston Harbor and the outfall, NF<2k = nearfield within two kilometers of the outfall, NF>2k = nearfield farther than two kilometers from the outfall. “2D Stress” (upper right corner) is a measure of how well the distances between the stations on the plot reflect patterns in the raw data; a stress of 0.05 indicates excellent agreement.

33
Figure 4-7. Percent fine sediments (top) and depth (bottom) superimposed on the ordination plot of the 2020 infauna samples. Presented as in Figure 4-6, with the size of each station marker indicated the percentage of fine sediments (top) or water depth (bottom).

34
Hard-bottom Communities All 23 hard-bottom stations, including an active and an inactive diffuser cap, were surveyed in early July 2020, and 487 minutes of analog video were collected for analysis (Rutecki et al. 2021). A total of 57 taxa were identified from the video, including four algal species, 37 invertebrate species, eight fish species, and eight more general groups. The hard-bottom environment continued to be spatially variable but to support relatively stable communities over the monitoring period, 1996–2020. Lush growth continued to thrive on the inactive and active diffusers (Figure 4-8), without negatively affecting effluent discharge.
Figure 4-8. Lush growth, primarily sea anemones, on an active outfall diffuser in 2020. Some changes have been noted throughout the region, including decreases in some species of upright algae, decreases in percent cover of coralline algae, and increases in densities of blue mussels at some stations. These changes have been geographically widespread, so they are not thought to be related to the outfall discharge.

35
Stellwagen Bank National Marine Sanctuary The NPDES permit to discharge from Deer Island Treatment Plant into Massachusetts Bay requires annual reporting on results relevant to Stellwagen Bank National Marine Sanctuary. MWRA’s deep-water reference Station FF04 lies within the depositional part of the sanctuary, Stellwagen Basin, where long-term accumulation of pollutants and their effects could be detected if they were to occur. Station FF04 is typical of the deep waters offshore from the outfall, representative of a number of stations monitored in earlier years of the program, and it continues to support an infauna community typical of what had been found at the larger suite of deep-water stations. These deep-water stations, including Station FF04, have always shown distinct differences from those found at shallower stations, probably due to their depth, their fine-grained sediments, and their distance from shore. Superimposing percent grain size and depth on the ordination plot for 2020 infauna samples continued to show these natural differences (see Figure 4-7, page 33).
Boston Harbor Seafloor Monitoring While the chemistry and biology of the sea floor of Massachusetts Bay have not been adversely affected by the relocated outfall, conditions have greatly improved and continue to improve in Boston Harbor. MWRA has conducted ongoing seafloor monitoring in Boston Harbor since 1991. Annual sediment and infauna samples are taken from nine stations, and sediment-profile imaging is carried out at 61 stations throughout the inner and outer harbor. Sediment textures within the harbor have been generally stable over time, ranging from mostly sand at some stations to silt and clay at others. Concentrations of total organic carbon in harbor sediments have declined over time, reflecting the improvements made throughout the Boston Harbor Project (Figure 4-9). In 2020, concentrations of total organic carbon were similar to other recent years and consistently lower than levels reported during the 1990s. During the same time, number of species per sample (Figure 4-10) and infauna diversity measures have increased and become stable over several years, a response to continued improvement in benthic habitat conditions. In 2020, 18 samples yielded 26,265 specimens, classified into 136 species and 10 other discrete taxonomic groups. As in past years, the infauna community varied along an outer- to inner-harbor gradient, reflecting the greater tidal flushing at the outer harbor stations. Sediment-profile imaging has also confirmed an outer- to inner-harbor gradient and clearly documented improvements to habitat conditions throughout the duration of the Boston Harbor Project.
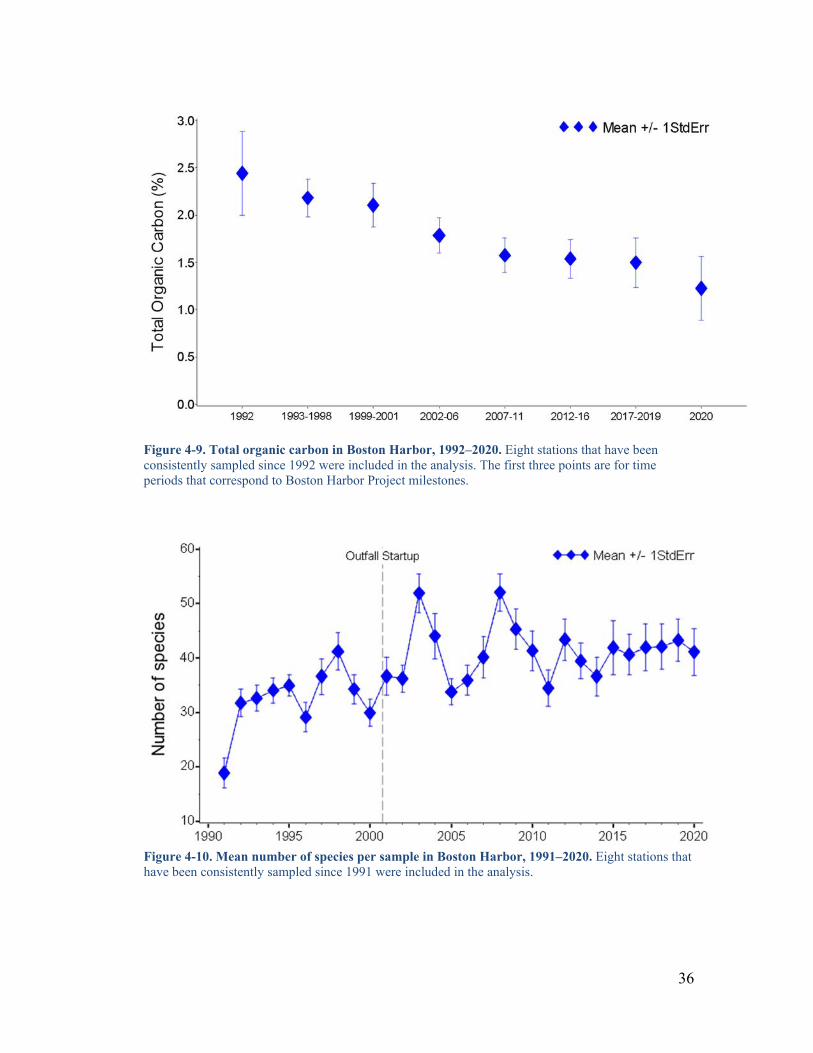
36
Figure 4-9. Total organic carbon in Boston Harbor, 1992–2020. Eight stations that have been consistently sampled since 1992 were included in the analysis. The first three points are for time periods that correspond to Boston Harbor Project milestones.
Figure 4-10. Mean number of species per sample in Boston Harbor, 1991–2020. Eight stations that have been consistently sampled since 1991 were included in the analysis.

37
Contingency Plan Thresholds There were no threshold exceedances for the five nearfield Contingency Plan parameters (Table 4-1). (Recall that for the purposes of threshold testing, “nearfield” includes both sets of nearfield stations and the station in the transition area between Boston Harbor and the Massachusetts Bay outfall.) The four diversity and evenness parameters were higher than Contingency Plan limits, while the percent opportunistic species remained far below any level of concern, less than 0.2% compared to a caution level of less than 10%. All parameters continued to show healthy seafloor habitat. Table 4-1. Contingency Plan threshold values and 2020 results for seafloor monitoring.
Parameter Baseline Caution Level
Warning Level 2020 Results
Nearfield benthic community parameters Species per sample NA <42.99 None 63.18
Fisher’s log-series alpha NA <9.42 None 13.48
Shannon diversity NA <3.37 None 3.93
Pielou’s evenness NA <0.57 None 0.66
% opportunists NA >10% >25% 0.17% NA = not applicable

38
5. Fish and Shellfish MWRA monitors winter flounder health each year and conducts chemical contaminant analyses of flounder, lobster, and cage-deployed blue mussel tissues every three years, most recently in 2018. Sampling and deployment sites vary by species (Figure 5-1). Annual flounder monitoring, the only fish and shellfish study conducted in 2020, focuses on external condition and the presence of liver disease, precancerous conditions, and tumors.
Figure 5-1. Fish-and-shellfish monitoring stations. Only flounder were sampled in 2020. Also shown are the two instrumented buoys, the MWRA outfall diffuser, and the boundaries of Stellwagen Bank National Marine Sanctuary.

39
Flounder Health A full complement of 50 fish was collected from three of the four sites sampled in 2020: near the former Boston Harbor outfall at Deer Island Flats, the Massachusetts Bay outfall site, and eastern Cape Cod Bay. Despite three hours of trawling, the time limit designated in the work plan, only 25 fish were taken from off Nantasket Beach. (The Nantasket Beach site will no longer be sampled after 2020, an efficiency that reflects the overall good health of fish throughout the region. Sampling in eastern Cape Cod Bay will continue through 2021.) Across the sites, mean age of fish ranged from 3.9 to 5.1 years, and standard length ranged from 272 to 315 millimeters, within the ranges observed in recent years (Moore et al. 2020). As in past years and as is common throughout northeast coastal populations (Moore et al. 2016), the catches were dominated by females, with the highest proportion of females in the eastern Cape Cod Bay catch. Measures of external condition, such as bent fin rays and occurrence and severity of fin erosion, continued to suggest improved conditions since the 1980s and 1990s. In 2020, incidence of bent fin rays was highest in fish from Nantasket Beach and Deer Island Flats, while incidence of fin erosion was highest in fish from Deer Island Flats, a consistent finding throughout the monitoring program. Blind-side ulcers, a condition that remains poorly understood, were present only in one fish in 2020, taken from eastern Cape Cod Bay. The incidence of centrotubular hydropic vacuolation (CHV), a mild condition associated with exposure to contaminants and a tumor precursor, remained lower than the baseline observations at all sites (Figure 5-2). CHV incidence remained lower than in any baseline year at the outfall site and lower than in any year except 2014 at Deer Island Flats. Tumors have not been observed by the monitoring program since 2004 and have never been found in fish taken from the outfall site (Figure 5-3; see also Moore et al. 2018).

40
Figure 5-2. Annual prevalence of centrotubular hydropic vacuolation (CHV) in winter flounder, 1991–2020. DIF = Deer Island Flats, ECCB = Eastern Cape Cod Bay, NB = Nantasket Beach, OS = Outfall Site
Figure 5-3. Annual prevalence of liver tumors in winter flounder, 1991–2020. DIF = Deer Island Flats, ECCB = Eastern Cape Cod Bay, NB = Nantasket Beach, OS = Outfall Site

41
Contingency Plan Thresholds There was no Contingency Plan threshold exceedance for the only threshold parameter measured in 2020, annual presence of CHV in fish taken from near the Massachusetts Bay outfall (Table 5-1). Incidence of CHV, the most common indicator of liver disease in winter flounder of the region, was 8% in fish taken from the vicinity of the outfall, much lower than the 44.9% caution threshold and less than one third of the 24.4% baseline average. Table 5-1. Contingency Plan threshold values and 2020 result for fish-and-shellfish monitoring.
Parameter Baseline Caution Level Warning Level 2020 Results Flounder disease Liver disease (CHV) 24.4% >44.9% None 8%
CHV = centrotubular hydropic vacuolation

42
6. Special Studies Besides monitoring the effluent and the water column, sea floor, and fish and shellfish in Massachusetts Bay, MWRA conducts special studies in response to specific permit requirements, scientific questions, and public concerns. This year’s report on special studies focuses on the 1980s predicted vs. 2020 actual pollutant loads in MWRA sewage influent and effluent; estimates of contaminant concentrations in the water column near the outfall using effluent-dilution analyses and data from mussel bioaccumulation; updates to the Bays Eutrophication Model; and a second early fall hypoxic event in coastal Cape Cod Bay.
Predicted vs. Actual Effluent Loads Planning for a new Deer Island Treatment Plant and for a deep-water outfall began as soon as MWRA was established in 1984. The process included developing an Environmental Impact Statement (EPA 1985) for siting the new wastewater treatment facilities eventually constructed at Deer Island and a Supplemental Environmental Impact Statement (SEIS; EPA 1988) for the then-proposed deep-water outfall tunnel and diffuser system eventually built to Massachusetts Bay. The SEIS assessed the proposed location, routes, and methods for transporting and discharging treated effluent and the environmental impacts of the discharge. One part of preparing the SEIS was to project the loads of conventional contaminants, such as suspended solids and biological oxygen demand; toxic heavy metals; and organic contaminants in both the influent received to the Deer Island Treatment Plant and in the effluent to be discharged to Massachusetts Bay. The projections were made for the year 2020, at that point more than 30 years in the future. Estimates were based on an average projected flow of 390 million gallons per day and a potential maximum flow of 1080 million gallons per day. Estimated influent pollutant loads were drawn from a draft secondary-treatment facilities plan that had been developed by MWRA in 1987. Actual average flow for 1998–2020 was 332 million gallons per day, lower than the projected average and reflecting declining water demand in the region. During the 1970s and most of the 1980s, consumers had used more water than the water-supply system could safely provide. Demand exceeded supply, and there were also many leaks within the aging pipe infrastructure. MWRA instituted an aggressive water- conservation program in 1986, bringing water use to a safe level by 1989. Continued conservation, as well as efforts to control infiltration and inflow to the sewer system, have further reduced water demand and wastewater influent and effluent flows.

43
The reduction in effluent flow is impressive, as MWRA simultaneously worked to reduce discharges that had bypassed the sewage treatment plant through combined sewer overflows (CSO). Increased pumping capacity and other system improvements reduced an estimated 3 billion gallons of CSO discharges in 1988 by 87% in 2020 (Kubiak et al. 2016; AECOM 2021). Actual 2020 influent loads were lower than the projected loads for all effluent constituents that EPA considered in the SEIS (Table 6-1). Loads of the conventional pollutants, biochemical oxygen demand and total suspended solids, were closest to the projections, which could be anticipated, as these parameters are closely associated with population size. Influent loads of metals were approximately half or less of what had been projected, a testimony to the effectiveness of MWRA’s Toxic Reduction and Control program (TRAC). TRAC administers MWRA’s industrial pretreatment program, which both regulates industrial dischargers and further encourages voluntary reductions in toxic chemical use. Effluent loads have been further reduced from what had been projected in 1988, due to the removal efficiencies at the Deer Island Treatment Plant. Removal efficiencies for the conventional pollutants were at or above 90% in 2020, and removal efficiencies for metals, except for nickel, were similarly high. Because of the low influent loads and the high removal efficiencies, actual 2020 effluent loads discharged to Massachusetts Bay were lower than those that had been projected in the SEIS (Table 6-2). Metals discharges were less than one quarter of what had been projected and for most metals, much less. Influent and effluent loads of organic contaminants, such as PCBs and banned organochlorine pesticides are difficult to calculate with confidence, as analyses are less frequent than for conventional pollutants and metals, and measured values are usually below detection limits. The most accurate possible estimates of effluent discharges are, however, well below those projected in the SEIS.

44
Table 6-1. Projected and actual 2020 loads of contaminants in MWRA influent.
Parameter Projected 2020 Influent Load
Actual 2020 Influent Load
Percent Projected Load
Conventional Pollutants (mton/year) BOD 94,370 72,938 77% TSS 85,264 81,505 96% Metals (kg/year) Chromium 14,683 1,480 10% Copper 66,330 31,406 47% Lead 11,531 3,936 34% Mercury 830 56 7.0% Nickel 13,123 1,387 11% Silver 2,986 180 6.0% Organic Contaminants (kg/year) PCB 531 0.38 0.07% 4,4’-DDE* 33 0.16 0.48%
*Projected load was for the pesticide DDT; 4,4’-DDE is one of the more common degradationproducts of DDT.BOD = biochemical oxygen demandTSS = total suspended solidsPCB = polychlorinated biphenyl
Table 6-2. Projected and actual 2020 loads of contaminants in MWRA effluent.
Parameter Projected 2020 Effluent Load
Actual 2020 Effluent Load
Percent Projected Load
Conventional Pollutants (mton/year) BOD 8,709 6,997 87% TSS 8,079 4,100 51% Metals (kg/year) Chromium 3,517 209 5.9% Copper 11,945 2,530 21% Lead 4,961 279 5.6% Mercury 216 2 0.9% Nickel 8,926 759 8.5% Silver 299 21 7.0% Organic Contaminants (kg/year) PCB 50 0.06 0.12% 4,4’-DDE* 0 0.13 Not calculated
*Projected load was for DDT; 4,4’-DDE is one of the more common degradation products of DDT. Table 6.4.4.c of the SEIS projected a load of 0. An appendix SEIS Table A.3.1 presented a separate projected effluent load of 2.8 kg/year; the percent projected load using that estimate would be 4.7%BOD = biochemical oxygen demandTSS = total suspended solidsPCB = polychlorinated biphenyl
45
Estimating Water-Column Contaminants Many chemical contaminants in Deer Island effluent occur at levels below detection limits (Charlestra et al. 2020). Even lead, for example, a routinely monitored and ubiquitous environmental contaminant, was detected in only 21% of more than 1,500 samples taken over 21 years. One of the most common breakdown products of the banned pesticide DDT, 4,4’-DDE, was detected in just slightly more than half the samples. Arsenic and other contaminants were never detected.
Because many chemical contaminants measured in MWRA effluent occur at such low concentrations, determining their concentrations in the water column after discharge is logistically difficult, expensive, and in many cases, not feasible. Contaminants have been periodically measured in sediments and fish and shellfish tissues, but these measurements are also very expensive. Consequently, MWRA, with encouragement from OMSAP, has reviewed methods for using effluent concentration and other data to estimate contaminant concentrations in the water column. This review is one step towards determining whether effluent analyses alone, or reduced monitoring in the environment, can be sufficient measurements to assure environmental protection.
One obvious method for estimating concentrations of chemical contaminants in the water column near the Massachusetts Bay outfall is to use the concentration within the effluent and apply a 70:1 initial dilution factor. A minimum initial dilution of 70:1 was predicted during the outfall-planning process and confirmed by dye studies during both stratified and unstratified conditions (Hunt et al. 2010).
An independent estimate works in the other direction, using contaminant-concentration data from mussels deployed at the outfall every three years, with established bioconcentration factors. This method was used early in the monitoring program to evaluate a Contingency Plan threshold exceedance and refine the placement of the caged mussel arrays (Hunt et al. 2002).
MWRA recently used both methods to estimate water-column concentrations for a suite of organic contaminants and compared the results from both methods to existing water quality criteria for the protection of human health (Table 6-3). The two methods resulted in good agreement for some contaminants and disparity for others. However, both methods showed that expected concentrations of all contaminants were far below the water quality criteria.
These results and other evaluations improve our understanding of the relationships between contaminant concentrations in MWRA effluent and those near the outfall. Such understanding can help to optimize effluent and environmental monitoring of these “legacy” contaminants.

46
Table 6-3. Concentrations of chemical contaminants estimated from mussel bioconcentration factor (BCF) and from effluent dilution compared to water quality criteria for the protection of human health.
Chemical Mussel BCF Effluent Dilution Water Quality
Criteria nanograms per liter
Acenaphthene 0.443 0.117 90,000 Anthracene 0.049 0.053 400,000 Fluorene 0.125 0.158 70,000 Benzo(a)anthracene 0.001 0.077 1.3 Benzo(a)pyrene ND 0.049 0.13 Benzo(b)fluoranthene 0.001 0.091 1.3 Benzo(k)fluoranthene 0.002 0.027 13 Chrysene 0.009 0.102 130 Dibenzo(a,h)anthracene ND 0.005 0.13 Fluoranthene 0.074 0.004 20,000 Indeno(1,2,3-c,d)pyrene 0.000 0.090 1.3 Pyrene 0.117 0.245 30,000 PCB Aroclor 138 0.001
0.011 0.64 PCB Aroclor 153 0.002
ND = Not detected; below detection level.

47
Bays Eutrophication Model Updates The Massachusetts Bay outfall NPDES permit requires maintenance and annual runs of the Bays Eutrophication Model (BEM), a combined circulation and water-quality model. The model simulates the parameters and processes affecting potential eutrophication and subsequent low dissolved oxygen levels in Massachusetts Bay, Boston Harbor, and Cape Cod Bay, such as water temperature, salinity, circulation, nutrients, and phytoplankton biomass. A precursor to the BEM was instrumental in siting the outfall, and annual simulations have continually confirmed the early predictions that the nutrient inputs from the outfall would not lead to eutrophication in Massachusetts or Cape Cod bays. The BEM has been periodically updated, and the most recent update is now ready for use (Deltares 2021). The updated model takes advantage of the great strides in computational power since the BEM was first developed and represents a transition to widely used, commercially available, software (DELFT3D-FM), which is fully owned by MWRA and is run on MWRA in-house computing systems. The former and updated models are similar in many respects, as they both include riverine, atmospheric, and offshore conditions; track a range of nutrients; represent multiple phytoplankton groups; simulate decomposition of organic matter at the sea floor; and use a grid that captures the complex coastline. One improvement in the updated model is that it does not rely on corrections based on field data, what is known as “data assimilation.” The former version of the model assimilated daily satellite-based sea-surface temperature data and both temperature and salinity data from instrumented buoys and sampling surveys. The updated model achieves good agreement with observations without needing to be guided by data assimilation, meaning that it better represents physical processes. Another improvement is that the updated water-quality model spans a geographic domain from Massachusetts Bay and inshore to the entire Gulf of Maine. Years of monitoring have shown that the conditions in the Gulf of Maine strongly affect Massachusetts Bay. Expansion of the geographic domain allows for improved simulation of exchange between the bay and farther offshore waters. The updated model was tested by comparing its results to those of the former model for the year 2016. It performed well for all parameters. Modeled temperature, for example, matched observations without the need for data assimilation. The updated model also better captured observed differences in chlorophyll concentrations between surface and bottom waters (Figure 6-1). The updated model continued to confirm the conclusions from former model iterations and field observations, that the outfall is a minor influence on Massachusetts and Cape Cod bays. Both the updated and former models accurately simulate increased levels of dissolved inorganic nitrogen very near the outfall, while chlorophyll levels remain unaffected by the discharge.
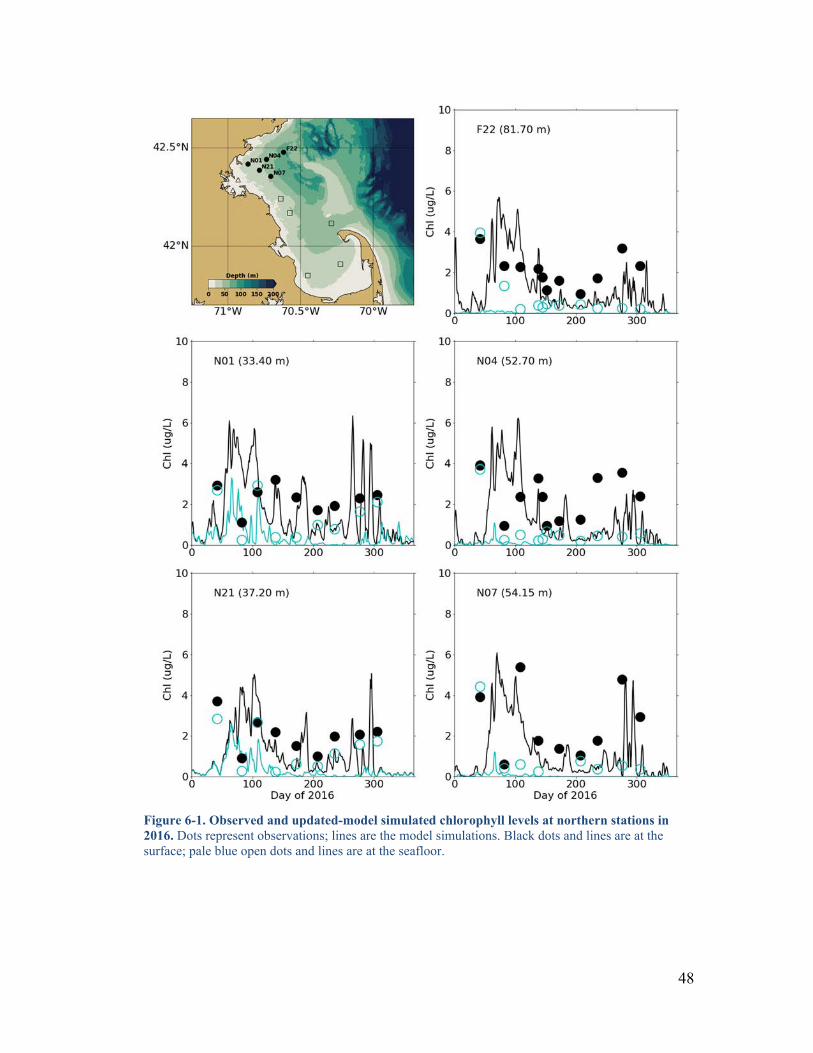
48
Figure 6-1. Observed and updated-model simulated chlorophyll levels at northern stations in 2016. Dots represent observations; lines are the model simulations. Black dots and lines are at the surface; pale blue open dots and lines are at the seafloor.

49
Hypoxia in Cape Cod Bay In 2020, as in 2019, late summer dissolved oxygen fell to low levels in a shallow, near-shore portion of Cape Cod Bay, lower than those found at the MWRA stations. Bottom-water dissolved oxygen levels typically fall throughout the summer when the water is stratified, reaching minima just before fall mixing re-aerates the water column. This typical pattern was evident throughout the MWRA sampling area in 2020 (Figure 6-2, see also Figures 3-11 and 3-12, pages 18 and 19). Continuous records from the NERACOOS Buoy, off Cape Ann in the northeast part of the sampling area, showed the typical decline, tracking well with MWRA stations near the outfall, which remained at healthy levels throughout the year. Dissolved oxygen levels fell to a less healthy level, below the six milligrams per liter Massachusetts water quality standard, at MWRA Station F02 in eastern Cape Cod Bay.
Figure 6-2. Dissolved oxygen concentrations at four locations in 2020. Dissolved oxygen was measured continuously at the instrumented buoy off Cape Ann (50 m depth) and at near-bottom samples from Station N18 near the outfall, Station F22 northeast of the outfall, and Station F02 in Cape Cod Bay. Levels at Station F02 fell below the state water quality standard for dissolved oxygen in these waters, 6.0 mg per liter.
The 2019 shallow-water hypoxia event, inshore from the MWRA monitoring stations, resulted in fish and lobster mortality. In 2020, the National Oceanic and Atmospheric Administration Sea Grant program funded MWRA monitoring team members from the Woods Hole Oceanographic Institution and the Center for Coastal Studies to investigate that shallow, inshore area. The funding was provided through the National Sea Grant American Lobster Initiative, which was created in 2019 to understand ecosystem changes affecting lobsters and share findings that can benefit management of the lobster fishery. The Massachusetts Department of Marine Fisheries coordinated with the Sea Grant participants for the 2020 studies.

50
Similar to 2019, inshore dissolved oxygen concentrations reached very low levels in early September 2020 (Figure 6-3). Dissolved oxygen concentrations lower than four milligrams per liter were found within the shallow inshore area. Fortunately, the hypoxia was short-lived, and 2020 did not produce the fish and lobster mortality observed in 2019.
Figure 6-3. Bottom water dissolved oxygen concentrations, September 2020. Solid colored circles: MWRA stations, sampled September 2. Colored circles with white dot centers: sites sampled September 10 for non-MWRA research study in southwestern Cape Cod Bay, credit Tracy Pugh (Massachusetts Department of Marine Fisheries). Legend colormap includes 4.5 mg/l to aid in perception of colors near yellow.

51
Several factors triggered these low-oxygen events in 2019 and 2020 (Figure 6-4). In both years, but particularly in 2019, warm temperatures had caused strong and persistent summer stratification, which effectively separated surface from bottom waters and led to low dissolved oxygen levels in near-bottom waters. In waters this shallow, the thermocline tends to be nearer to the surface, so light can penetrate to it and fuel phytoplankton growth within and even below it. When those phytoplankton die and sink, their decomposition further consumes oxygen in the already-depleted, relatively thin layer of bottom waters.
Figure 6-4. Schematic depicting the circumstances leading to hypoxia in shallow Cape Cod Bay. Plankton blooms at and above the thermocline, dies, and sinks into bottom waters, where it consumes oxygen as it decomposes.
This situation appears to have been aggravated by the presence of Karenia mikimotoi, a dinoflagellate plankton species first observed by MWRA in 2017 and apparently increasing both in numbers and length of seasonal occurrence (see Figure 3-14, page 21). A large Karenia bloom occurred across Boston Harbor and Massachusetts and Cape Cod bays in 2020. While the intensity of the bloom was insufficient to strongly affect deeper areas, it is thought to have been large enough to influence shallow, inshore Cape Cod Bay.
Analyses have shown that the shallow waters of Cape Cod Bay remain unaffected by nutrient additions from the MWRA outfall. However, MWRA will continue to work with its monitoring partners and the regulatory agencies to better understand and respond to the physical, chemical, and biological conditions that have promoted these hypoxic events. Sea Grant funding to MWRA partners is expected to continue in 2021.

52
References AECOM. 2021. CSO post construction monitoring and performance assessment: Task 5.3 water quality assessment. Boston: Massachusetts Water Resources Authority. Report 2021–09. 68 p. plus appendices. Anderson DM., Keafer BA, Kleindinst JL, McGillicuddy DJ, Martin JL, Norton K, Pilskaln CH, Smith JL, Sherwood CR, Butman B. 2014. Alexandrium fundyense cysts in the Gulf of Maine: long-term time series of abundance and distribution, and linkages to past and future blooms. Deep-sea Research, Part II, Topical Studies in Oceanography 103:6–26. Charlestra L, Keay KE, Lambert MT. 2020. Assessing contaminant concentrations and trends in Deer Island Treatment Plant effluent using survival analysis techniques. Boston: Massachusetts Water Resources Authority. Report 2020–06. 47 p. Deltares. 2021. Demonstration of the updated Bays Eutrophication Model. Boston: Massachusetts Water Resources Authority. Report 2021–02 135 p. Ellis-Hibbett D, Hunt C. 2021, 2020 technical survey of nitrogen removal alternatives for the Deer Island Treatment Plant. Boston: Massachusetts Water Resources Authority. Report 2021–03. 48 p. EPA. 1985. Siting of wastewater treatment facilities for Boston Harbor. Final Environmental Impact Statement. Boston, Massachusetts. United States Environmental Protection Agency Region I. EPA. 1988. Boston Harbor wastewater conveyance system. Final Supplemental Environmental Impact Statement (SEIS). Boston, Massachusetts. United States Environmental Protection Agency Region I. Hunt CD, Abramson SL, Lefkovitz LF, Neff JM, Durell GS, Keay KE, Hall MP. 2002. Evaluation of 2001 mussel tissue contaminant threshold exceedance. Boston: Massachusetts Water Resources Authority. Report 2002–05. 48 p. Hunt CD, Mansfield AD, Mickelson MJ, Albro CS, Geyer WR, Roberts PJW. 2010. Plume tracking and dilution of effluent from the Boston sewage outfall. Marine Environmental Research 70:150–161. Kubiak DA, Smoske NS, Coughlin K, Rando L, Wu D, Whittaker E. 2016. Combined sewer overflow control plan annual progress report 2015. Boston: Massachusetts Water Resources Authority. 58 p.

53
Libby PS, Rex AC, Keay KE, Mickelson MJ. 2013. Alexandrium rapid response study survey plan. Revision 1. Boston: Massachusetts Water Resources Authority. Report 2013–06. 13 p. Libby PS, Borkman DG, Geyer WR, Turner JT, Costa AS, Taylor DI, Codiga DL. 2020. 2019 Water column monitoring results. Boston: Massachusetts Water Resources Authority. Report 2020–08. 60 p. Libby PS, Borkman DG, Geyer WR, Turner JT, Costa AS, Taylor DI, Wang J, Codiga D. 2021. 2020 water column monitoring results. Boston: Massachusetts Water Resources Authority. Report 2021–07. 57 p. MWRA. 2001. Massachusetts Water Resources Authority Contingency Plan, Revision 1. Boston: Massachusetts Water Resources Authority. Report 2001–-ms–071. 47 p. MWRA. 2021. Ambient monitoring plan for the Massachusetts Water Resources Authority effluent outfall, Revision 2.1, August 2021. Boston: Massachusetts Water Resources Authority. Report 2021–08. 107 p. Moore MJ, McElroy AE, Geoghegan P, Siskey MR, Pembroke A. 2016. Flounder monitoring report: 2015 results. Boston: Massachusetts Water Resources Authority. Report 2016–05. 40 p. Moore, M, Pembroke A, Nestler E, Hall M, Lefkovitz L, Lambert M, Keay K. 2018. Toxics source reduction and sewage upgrades eliminated winter flounder liver neoplasia (1984–2017) from Boston Harbor, MA, USA. Diseases of Aquatic Organisms. 131:239-24 Moore MJ, Madray ME, Rutecki DA. 2020. Flounder monitoring report: 2020 results. Boston: Massachusetts Water Resources Authority. Report 2020–13. 19 p. Reilly B, Charlestra L, Codiga D, Keay K. 2018. 25 years of monitoring, what have we learned? Nutrient levels in Massachusetts Bay and Boston Harbor. Proceedings of the Water Environment Federation. 2018: 5808–5818. Rutecki DA, Hecker B, Nestler EC, Madray ME. 2021. Outfall benthic monitoring report: 2020 results. Boston: Massachusetts Water Resources Authority. Report 2020–DRAFT. 65 p. Taylor DI, Oviatt CA, Giblin AE, Tucker J, Diaz RJ, Keay K. 2020. Wastewater input reductions reverse historic hypereutrophication of Boston Harbor, USA. Ambio 49:187–196. Tucker J, Kelsey S, and Giblin A. 2010. 2009 Benthic nutrient flux annual report. Boston: Massachusetts Water Resources Authority. Report 2010–10. 27 p.
54
Tucker J, Giblin AE, Hopkinson CS, Kelsey SW, Howes BL. 2014 Response of benthic metabolism and nutrient cycling to reductions in wastewater loading to Boston Harbor, USA, Estuarine, Coastal and Shelf Science 151:54–68. Werme C, Rex AC, Hunt, C. 2012. Outfall monitoring overview background: 2012 update. Boston: Massachusetts Water Resources Authority. Report 2012–02. 59 p. Werme C, Keay KE, Libby PS, Codiga DL, Taylor DI, Charlestra L, Carroll SR. 2018. 2017 outfall monitoring overview. Boston: Massachusetts Water Resources Authority Report 2018– 07. 53 p. Werme C, Keay KE, Libby PS, Codiga DL, Taylor DI, Charlestra L, Carroll SR. 2020. 2019 outfall monitoring overview. Boston: Massachusetts Water Resources Authority Report 2020–11. 58 p. Zhao L, Beardsley RC, Chen C, Codiga DL, Wang L. 2017. Simulations of 2016 hydrodynamics and water quality in the Massachusetts Bay system using the Bays Eutrophication Model. Boston: Massachusetts Water Resources Authority Report 2017-13. 111p.

55
List of Acronyms
ASP Amnesic shellfish poisoning BCF Bioconcentration factor BEM Bays Eutrophication Model BOD Biochemical oxygen demand cBOD Carbonaceous biochemical oxygen demand CHV Centrotubular hydropic vacuolation DDT Dichlorodiphenyltrichloroethane DIF Deer Island Flats DO Dissolved oxygen ECCB Eastern Cape Cod Bay EPA U.S. Environmental Protection Agency FF Farfield IAAC Inter-Agency Advisory Committee LC50 50% mortality concentration MassDEP Massachusetts Department of Environmental Protection MGD Million gallons per day MWRA Massachusetts Water Resources Authority NA Not analyzed/not applicable NACWA National Association of Clean Water Agencies NB Nantasket Beach NDBC National Data Buoy Center NERACOOS Northeastern Regional Association of Coastal and Ocean Observing Systems NF Nearfield NOEC No observed effects concentration NPDES National Pollutant Discharge Elimination System OMSAP Outfall Monitoring Science Advisory Panel OS Outfall site PAH Polycyclic aromatic hydrocarbon PCB Polychlorinated biphenyl PIAC Public Interest Advisory Committee PSP Paralytic shellfish poisoning SEIS Supplemental environmental impact statement TRAC Toxic Reduction and Control TSS Total suspended solids

Massachusetts Water Resources Authority 100 First Avenue • Boston, MA 02129
www.mwra.com 617-242-6000