Embed Size (px)
Citation preview
PB89-218739
Global Tropospheric ChemistryChemical Fluxes in the Global Atmosphere
National Center for Atmospheric Research, Boulder, CO
Prepared for:
National Science Foundation, Washington, DC
May 89
_ mwmmm e _mmmImmm___
https://ntrs.nasa.gov/search.jsp?R=19900002793 2018-11-25T23:36:31+00:00Z
/
PB89-218739
Goba/Tropospheric
ChemistryCHEMICALFLUXESIN THEGLOBALATMOSPHERE
May1989 :,
7
REPRODLICED BY
U.S.DEPARTMENTOFCOMMERCEi NATIONAL TECHNICAL INFORMATION SERVICE
SPRINGFIELD, VA, 22161
i.......... , .................
1990002793-002
il
0,,, . " .tS'7 'gSMELT
4. Tide sad Subtlde 5. P,epon D*ceMay 1989
|. i|iGlobal Tropospheric Chemistry: 6.'Chemical Fluxes in the Global Atmosphere
i
7. Author,s) 8. PerforminI Orlsolzsttoa Rep_.
Donald H. Lenschow and Bruce B. Hicks No.9. Performs I OrlsnlsstLon Name ud Add:es, 10. Prolecc/Tesk/Vork Uo_t No.
National Center for Atmospheric Research 11.Conul_/GrsncNo.P. O. Box 3000
Boulder, CO 80307-3000 NSF ATM-8709659i
|2. Sponsorla80rsen_zscioo Name end Address 13. Type of Report k Peno_CoveredNational Science Foundation
1800 G Street
Washington, DC 20550 I_
1.5. $_ppiemencsry No ces
• -. , HMMi
'16. Abscrs©ul
• Report of the Workshop on Measurements of Surface Exchange and Flux Divergence ofChemical Species in the Global Atmosphere.
In October 1987, NSF, NASA, and NOAAjointly sponsored a workshop at Columbia _'University to assess the experimental tools and analysis procedures in use andunder development to measure and understand gas and particle flu_es across thiscritical air-surface boundary. This report, Global Tropospheric Chemistry: ChemicalFluxes in the Global Atmosphere, presents the results of that workshop. It ispublished to summarize our present understanding of the various measurementtechniques that are available, identify promising new technological developmentsfor improved measurements, and stimulate thinking about this important measurementchallenge.
17. Key Vords ,rid Document Ans_ysAs. 17e. Descnpcom
171,. Iden,LiLers/Open-EsdedTerns
l?e. COSATI Field "Group
--" llV..Secuttty C_8s (Th_8 _31. No. ot PulesReponi I
I
13g. security class (TI_s J2
_o_'**Tli.se ,Jtsv. ,o-7_ ENDOP.SI[DllY ANSiAi_L_uNrsco. THIS FOIUdIdAYIll IU[PILODUCZD uscob,_oc 8a,s.m_,
1990002793-003
GlobalTropospheric
Chemistr /CHEMICAL FLUXES IN THE
GLOBAL ATMOSPHERE
Report of the Workshop on Measurements ofSurface Exchange and Flux Divergence of
Chemical Species in the Global AtmosphereD
Prepared by theNational Center for Atmospheric ResearchP.O. Box 3000, Boulder, Colorado 80307
for
the National Science Foundation,the National Aeronautics and Space Administration,
and the National Oceanic and Atmospheric Administration
Edited by
Donald H. Lenschow and Bruce B. Hicks
May 1989
I¢
........... .,. ,......... i
1990002793-004
ACKNOWLEDGEMENTS
We gratefully acknowledge the contribution of Frances Huth in producing thisworkshop report. Lucy Warner edited the report and advised us on various other details ofits production. We thank Ruth Levenson, Columbia University, for the excellent supportand arrangements for the workshop, and M;ke Prather for his assistance in providing thetools to document the workshop proceedings.
The opinions, findings, conclusions, and recommendations expressed in this workshopreport represent those of the authors and workshop participants, and do not necessarily _'reflect the views of the National Science Foundation, the National Oceanic and AtmosphericAdministration, or the National Aeronautics and Space Administration. NCAR is operatedby the University Corporation for Atmospheric Research and is sponsored by the NationalScience Foundat!on.
Cover based on a design by Pamela Steele forGlobal Tropospheric Chemistry: A Plan forAction, National Academy Press, 1984
1990002793-005
TABLE OF CONTENTS
Page
Preface .................................... v
Organization of Workshop ............................ vii1
Executive Summary ..............................
Introduction .................................. 5
1 Key Aspects of Species Related to Global Biogcochemical Cycles ........ 9
Oxidant and Odd Nitrogen Group .................... 9
Sulfur Group ............................. 17
Carbon Group ............................. 23Research Needs ............................ 27
2 Flux Measurement Techniques ........................ 31
Tower-Based Flux Measurement Systems ................. 32
Aircraft-Based Flux Measurement Systems .............. 37
Enclosure-Based Flux Measurement Systems ............... 41 _'Conclusions .............................. 46
3 Status of Chemical Sensors for Flux Measurements ............... '.'7
Chemical Sensors for Oxidant and Odd Nitrogen .............. 47
Carbon Monoxide, Methane, and Nonmethane Hydrocarbon Sensors ..... 57
Sulfur Species Chemical Sensors ..................... 59Aerosol Detectors ........................... 68
694 Flux Measurement Program Plan ......................
Nitrogen and Ozone Group ....................... 6974Sulfur Group .............................
Carbon Group ............................. 78
Species Concentration Budget Experiment ................ 79
Exchange between the PBL and the Free Troposphere ........... 80
Modeling and Parameterization ..................... 81
Development of Techniques ....................... 81
5 New Opportunities for Flux Measurement ................... 83
Improvements in Chemical Scnsing ................... 83Flux Measurement Technology ...................... 84
Appendix ................................... 87
References .................................. 91
List of Participants ............................... 105
iii
1990002793-006
PREFACE
The looming possibility of major changes in the earth's climate system as a directconsequence of increasing concentrations of atmospheric gases has attracted intense interestin both atmospheric science journals and the general press. This "greenhouse gas effect"has joined acid rain and ozone depletion on the list of well-known environmental impactsthat can arise from human activities and changing natural conditions, and that may affectthe earth on a global scale. Understanding these impacts and their underlying causes wellenough to develop effective national and international policies to mitigate and/or to copewith them is one of the major challcngcs facing the people of the world in the 1990s.
The National Academy of Sciences has recommended a major national program ofresearch under the leadership oi NSF, NASA, and NOAA, which have ongoing programsin global tropospheric chemistry, as an essential step in mee!ing that challenge. One of themost important elements of that program must be the s_udy of the interaction betweenthe atmosphere and the surface of the planct. It is there that gases and particles are
introduced into the atmosphere and, usually after chemical transformation, removed from _it. Measuring the fluxes of material acr_>ss the air-surface interface and understandingthe myriad processes that give rise to those fluxes is a central problem in atmosphericchemistry.
In October 1987, NSF, NASA, and NOAA jointly sponsored a workshop at ColumbiaUniversity to assess the experimental tools and analysis procedures in use and underdevelopment to measure and understand gas and particle fluxes across this critical air-surface boundary. This report, Global Tropospheric Chemistry: Chemical Fluxes hi theGlobalAtmosphere, presents the results of that workshop. It is published to summarize ourpresent understanding of the various measurement techniques that are available, identifypromising new technological developments h)r improved measurements, and stimulatethinking about this important measurement challenge.
The Center for the Study of Global Habitability at Columbia University and theGoddard Institute h)r Space Studics wcrc local hosts for the workshop. We wish to thankthem for their excellent arrangements. We wish also to thank the many scientists whoparticipated in the workshop and contributed their expertise to the preparation of thisreport. The report was edited by Donald Lcnschow and Bruce Hicks, who deserve specialthanks for their extensive, careful, and patient efforts in bringing the report ,qogcther.
Robert J. McNeal
ManagerTropospheric Chcmistry Program
National Aeronautics and Space Administration
Jarvis MoycrsProgram Director h_r Atmospheric Chemistry
National Science Foundation
Vernon E. DerrDirector
Environmental Research Laboratories
National Oceanic and Atmospheric Administration
Precedingpageblank
1990002793-007
ORGANIZATION OF WORKSHOP
CHEMICAL SPECIES WORKING GROUPS
Ozone and Odd Nitrogen Working Group
F. L. Fchscnf¢ld (chairman) S.L. LiuJ. A. Logan
S. M. Anderson R. Pearson, Jr.A. C. Delany M.J. Prather
O. T. Denmead B.A. RidleyC. W. Fairall J.A. Ritter
G. K. Greenhut M.O. RodgcrsG. L. Gregory D.H. StcdmanB. J. Huebcrt M.L. Wesely ';_!
Sulfur Working Group
C. E. Kolb (chairman) P.D. Goldan
M. O. Andreae G.E. TaylorD. D. Baldocchi R.G. Zika
Methane, NMHC, CO, and Tracers Workin_ Group
L. E Steele (chairman) R.C. HarrissC. S. Martens
J. A. Businger G.W. SachseR. L. Desjardins W. Shaw
C. Farmer A.M. ThompsonD. R. Fitzjarrald H. WestbergI. Fung S.C. Wofsy
vii
Precedingpageblank
1990002793-008
FLUX TECHNIQUE WORKING GROUPS
Tower Micrometeorology Working Group
M. L. Wescly (chairman) A.C. Delany
J. A. Busingcr D.R. FitzjarraldD. D. Baldocchi B.J. Huebert
Enclosure Working Group
O. T. Denmead (chairman) P.D. GoldanR. C. Harriss
Airplane Flux Measurements Working Group
C. W. Fairall (chairman) R.L. DesjardinsG. K. GrcenhutJ. A. Ritter "rW. Shaw
Invited Presentations
M. O. Andreae -- Sulfur species S.C. Liu -- Ozone
O. T. Denmead -- Enclosure techniques J.A. Logan -- Nitrogen speciesD. R. Fitzjarrald and R. C. Harriss
-- Results from ABLE-2B C.S. Martens -- Hydrocarbons and tracersD. H. Lcnschow -- Airplane techniques M.L. Wesely -- Tower techniques
viii
1990002793-009
EXECUTIVE SUMMARY
Great strides have been taken in recent years in and micrometcorology, and to dei..,:_... : _.:_s )fdevek)i,ing technolog 5, for measuring concentrations technological development that should L._ .:., . ;:, ,,of trace chemical species in the atmosphere, for The workshop brought together rep,, ...... ..lvesinvestigating the role that various species play in from many different disciplines, from instrumentationthe chemistry of the atmosphere, and for monitoring specialists to numerical modelers, with intereststrends in atmospheric concentrations. Measurement ranging from the pristine atmosphere to regionsof trends is well recognized to be important not only affected by air pollution. The success of the workshopfor understanding how the quality of our atmosphere itself underlines the major conclusion that was drawn:is changing but also for predicting climate. We nowhave a broad general ,nderstanding of the links that ll_e problems confronting the prediction of
changes in global air chemJstry atut relatedmany species have to other species within the separate climate change are necessarily multMisciplinaryfamilies of chemical species: the nitrogen and ozonegrt, up, the sulfur group, and the carbon group. Yet, and must be addressed by teams of researchetxto be able to model and predict the chemical behavior from many specialties.of the atmosphere, we need to have a much better Related to this is the need to consider the ,understanding of how and where the species are wide range of exchanges that occur, because of bothgenerated and lost and how they are transported and dill'crences in surfaces and differences in atmosphericmixed. Indeed, the study of atmospheric chemistry structure. Therefore, workshop participants concludedis the study of sources, sinks, transformations, and that:transports of trace reactive chemical species in theatmosphere. A continuhzg _eries of fieM experime_as is
needed, to span the spectrum of chemicalWe cannot, therefore, escape the necessity of exchanges atul interactions that occur through-
looking into the details of the processes involved in out the biosphere and which impact thesurface exchange of trace species and their subsequent troposphere.transport and mixing throughout the troposphere.The flow patterns that are involved are t')mplex and Field studies cannot be conducted to address allmuitiscaic. In the boundary layer, which is the layer surfaces and all exchange processes---only a subset ofof the atmosphere that interacts with the surface on representative examples is possible. Accordingly, wea time s_ale of a few hours or less, the motions concluded that:
arc so chaotic that we call it turbulence and deal Models are required to bzterpolate amongwith its effects statistically. Adding chemical reactions existing results, to extrapolate to situations thatto this already complex behavior means that many have notyet been studied _rperimentally, at_l toobservational and modeling approaches are intractable, bzcorporate the appropriate parameterizations.Fortunately, there are techniques fi)r mcasuring these The models shouM then be verified withexchange and mixing processes that have proven useful, subseque_u observational studies.particularly near the earth's surface.
The most direct technique fer measuring a verticalStudies that have been conducted so far have been flux, which is the rate at which trace species are
able to address ,rely a limited number of species in a transported through a specified reference level perlimited set of circumstances. At present, most is known unit area, is by eddy correlation--computing theabout exchange over land of those few trace species average of the instantaneous product of verticalthat can be measured with ease at trace levels (ditCh velocity and fluctuations in concentration of a tracein mixing ratio concentrations of less than 10-9). constituent. At this time, this is the only fundamentally
A specialists' workshop was txmductcd in New direct tt_chnique for flux measurement that is inYork City, in October 1987, to review air-surface wide use and can measure changes of flux withexchange and flux measurement of trace species in light height. The main disadvantage of eddy-correlationof what we know about their distributions and reaction measurement is its difficulty, it requires fast-respondingrates, to develop plans for observational studies making and sensitive detection of trace species, and concurrentuse of recent technological advances in both chemistry measurements of vertical velocity. 'It) date, it is
1
1990002793-010
7/
2 CHEMICAL _?LUXES
possible to measure eddy-correlation Iluxes of only a methods of llux measurement in intensive experimenta!few species e.g., 03, NO, NO2, CO, and CH4 The programs; the vaciety of available methods is such thatresults obtained from these measurements point to many different scientific questions can be addressedthe desirability of developing this capability for more if an appropriate selection of methods is made fromspecies. We therefore recommend the following: among the set of available techniques.
For some trace species, measurement techniques1. ,4 major limitation to research on sucface e,x- are already well advanced. Ozone is a notable example.
change tuul fhtr measuremetus is tile lack of Fast response sensors are already available to permitsensitive, reliable, aml fast-re.wol_e chemical use of eddy-correlation methods (both on towers andspecies sem or_ that can be used for eady- aboard aircraft), and sensitivity is sufficient to resolvecorrelation flux measurement. "lherefore, small vertical cxmcentration dill'erenccs, as is requiredwe recommemt that contbu,ed effort aml for the application of tower gradient techniques. Noresoarcesbe expemledbt del,elopingchemical ether trace gas can yet be investigated with the._pecies sensors with the responsiveness at_l confidence that is now attached to measurements
sensitivity required for direct eddy-correlation of ozone and ozone flaxes; the existing set offlux measureme:us, ozone deposition data is large in comparison to that
Candidate species for continved elfort include SOz, for all other trace reactive gases, yet even in thisH202, and nonmcthane hydrocarbons. At the samc special case the availab'e body of information consiststime, all of the existing instruments for species flux largely of spot measurements of a few catcgories ofmeasurement by eddy correlation are not without surfaces, predominantly in the mid-latitudes. Theseweaknesses; continued improvements in all the existing include several agricultural surfaces, forests, rangeland,sensors, as well as existing water vapor sensors, would and ocean. The Atmospheric Boundary Layerbc valuable. In particular, sensors that mcasurc mixing Experiments (ABLE) have been successful in obtaining {ratio with respect to dry air obviate the need for llux measurements of O3, CH4, CO, and NO,corrections to mea'_..dcd fluxes due to mass flux and, over the tropical rain forest and the Arctic tundra.on aircraft, flow distortion. These experiments have demonstrated the feasibility
Although eddy correlation is the most funda- of carrying out intensive lield investigations, utilizingmental llux measuring technique, many times it is several complementary measurement techniques for anot feasible because of instrument limitations or suite of species, to obtain a more complete picture oflack of a proper experimental site, or because the chemical behavior of particular biomes.it is too expensive or sophisticated for particular In recognition cf the limited circumstances thatapplications. Therefore, other techniques also need have been investigated so far, we recommend that:
to bc developed and implemented. The._ include the 3. l'iaure e_periments be plmmed for surfaces ofgradic,nt technique, which requires measurement of aconcentration dillcrence across a vertical displacement, importance to gh)bal budgets. "lhese include
tropical atul boreal forests, turn.Ira, taiga,and ,:nclosure techniques, which require mean ctmcen-tratitm measurements within an enclosure that acts as agricultural croplmuls such as rice pa,hlies
a re._rvoir h)r species emitted from or deposited to a that toter large areas, wintertime continentalsurface covered by the enclosure. This means there is a areas (_now colbert.d), alul especially therequirement for accurate measurement of an ab_flute oceam', i'2qmrimcnls need to span bothconcentration or concentration difference that can be diurnal atul seasonal cycles.
averaged over .,,eyeful minutes; fast iesponse is not Studies ovui the oceans should receive particularimportant. Therefore, we further recommend that: emphasis; even if average exchange rates are much
2. Contimwd development be pursued to obtain lower than over land, the much grcatcr surface area ofthe world's oceans raises them to prime importance.
acctlrate ,_ictOl cetlc'etllralioti or concetura- It is particularly important lo obtain data from areastion difference measurements, patlicularly fi_rspecies for which no immediate possibility with differing biological productivity as a function of
meteorological conditions and season. The primary_ists for ethly-cotrelation filet measllrt'menls, platform h_r measurements over ocean is ihe aircraft.
In contrast to enclosure methods, gradient and Existing aircraft measurements demonstrate that iteddy-correlation methods do not interfere with the is feasible to measure surface exchange by eddyexchange at the surface; they measure the flux at currelation, bat few data have thus far been obtained.u)me height above the surface, which may not, in some Measurements over the tropical oceans and in highca_s, be the same as the surface Ilux. Furthermore, wind conditions are of particular importance.llux measured above the surface may be affected by It is clear that diurnal and seasonal changesthe characteristics of the surface, the mean wind, and are not sufficiently well understood even twer morethe hydrodynamic stability. A major linding of the commonly studied surfaces. Carrying out studiesworkshop was the importance of combining several t,_ investigate these changes requires commitment to
1990002793-011
EXECUTIVE SUMMARY 3 i
It development of facilities for surface flux measurements over a broad range of scales. Further work onthat can bc deployed for extended periods. Moreover, limitations in measurement accurac3_ and eva!uationscompari_nsbetween different sets of data are dilficult, of measuremen! strategies Js also needed whenbecau_: of the common failure to report results in a designing tield programs and determining instrumentm.,mcr that can be used in a surface-specific son_. specilications. Therefore we recommend that:We recommend, therefore, that:
6. Aerodynamic flux measuring methods must4. "lTzeresults of surface exchange studies be contbme to be e_luated and extended to
reported, as much as possible, bz ways that address situations of inhomogeneous landgeneralize the results for application to a surfaces atul routbze measurement o_er thewide range of meteorological colulitions. For c.pt'n ocean, provide guidance for insmamentexample, a usefid way to specify deposition design atut developmelu, and determhze limitsrates is by means of surface resistances, of applicability for the different techniques.l'i_nhermore, the state of surface vegetation New flux measurement techniques need to besho, hl be rtT.orted whenever possib& because eaplored in light of new sensor technology andof its strong effect on surface exch,nge, the requirements of the modeling communi_
A critical step in the development of measurement The use of enclosures to investigate emissionscapabilities, and in attaining conlidcnce in the from specific surfaces received intensive attention, withresults, is to obtain agreement between concurrent spociai scrutiny of the need for replication of mea-measurements of a flux using independent techniques, surements and for techniques that eliminate problemsThis step not only provides assurance that different associated with imposed pressure differentials. We
i techniques provide valid results but also allows recommend that:extension of flux measurements in time and space; forexample, combining airplane and tower measurements 7. Enclosure studies be conducted specifically
i permits vertical flux proliles from near the surface to reveal details of the subsurface processes! through the top of the boundary layer. The workshop contributing to emissions.i gave a resounding endorsement of the continuing need
for comparison studies and concluded that: Finally, the ultimate goal of much of the effortin measuring surface exchange and vertical fluxes is
5. l"requetu comparison studies be carried to provide useful parameterizxttions for models of theout, especially bl conjunction with fieM atmosphere, from regional to global scales, and from
l studies ,tii&ing extensi_e micrometeoroiogical several-hour forecasts to climate prediction. Th.erefore,capabilities, we recommend that:
Although the workshop concluded that the 8. Close hueractions with the chemical, me-+ highest short-term payoff in improved flux measuring teorologicai, utul ecological modeling corn-
capabilities lies in development of chemical sensors, munities be included in all phases ofparticipants also emphasized that there is need forfieM investigations, from the design of the
further development of micrometeorological tools and e_.rperiment through the analysis of the datatcchni;lucs. Improved understanding of the physics atut presentation of the results. At thet,f turbulent exchange is essential in the devek)pment
same tb,;e, modelers need to be aware ofand application of methods tha;, might simplify flux itd_erent limitations in spatial and temporaimeasurement from moving plath)rms (e.g., ships and resolution of flux dezem_inations h_ specifyingairplancs_ and make flux measurements F_ssible in their requiremetus/'or fltor data.situations that arc currently no! acceptable. Mo._t lieldsituations arc far from perfect for flux measurement. Wc hope that these conclusic,_s ,rod recom-Limiting flux measurement to "ideal" conditions is mcndations provide a framework to move forwardimpractical and unnecessary. We need to measure over in the development of new tech_ologies for fluxcomplex terrain and in situations of rapid time changes measurement, the design of field prog"ams, theand large horizontal advective fluxes. Wavelengths acquisition and use of flux data, and the applicationof eddies responsible for vertical transFx,rt extend of field results to modeling studies.
1990002793-012
/
INTRODUCTIOND. H. Lenschow and B. B. Hicks
The impact of man's activities on the globa; Extrapolation requires understanding me processesatmosphere is becoming increasingly evident. On that determine the concentrations. The Globallocal scales, the most noticeable changes an those Trt;pospheric Chemistry Program emphasizes the needassociated with pollution released as a by-pru luct of for better knowledge of exchange processes, especiallymanufacturing, transport:aion, agriculture, residential in those biological and surface environments thatheating, and other factors directly related to the constitute the sources and sinks of the chemical speciesmodern way of life. Areas with high population density of major interest. The relevant atmosphere-surfacetend to be most affected by air pollution. But it exchange environments vary from the tropical oceanis becoming increasingly evident that the health of (for chemical species such as dimethyl sulfide) tothe atmosphere is more than just a local problem; subarctic tundra (for many orgz.nic species such asrecent emphasis on the long-term consequences of methane). The range of environments is sufficient that _continued emissions of chlorofluorocarbons and so- considerable difficulties in measurement are imposed:called greenhouse gases (including carbon dioxide) has dry and wet tropical land regions, agricultural regions,awakened the public to the vulnerability of the climatic oceans, areas where vegetation is periodically burned,regimes that we know. On a global scale, many of the and subpolar land regions. Many chemical speciestrace gases are likely to play an influential role in the must also be considered: CI-I4 and other majorclimatic trends that are now being predicted, hydrocarbons, CO and CO2, a variety of aldehydes
The Global Tropospheric Chemistry Program and ketones, NO, NOz, and HNO3, organic nitrates,amines and acids, N20 and NH3, dimethylsulfide _nd(GTCP) grew out of these concerns. The program
is in its infancy, but plans are already wcP. advanced, other sulfur species, (e.g., H2S, SO2, OCS, and CSz),The scope of GTCP is global, even though recent O3, H202, and a number of organoperoxy compoundsemphasis has been more on local and regional impacts and organohalogens.of pollutants such as "acid rain." The initial report Monitoring programs, whose main role is to keep(from the National Research Council, 1984) on the track of changes as they happen, are already in placeneed for a large-scale research elfort on the chemistry at a small number of carefully selected locations whereof the troposphere was well received and spawned a high-quality data on key indicators of the state ofsecond report on proposed plans for the U.S. research the remote atmosphere are routinely measured Thecontribution (UCAR, 1986). Activities elsewhere data provided by these monitoring programs cannot behave paralleled the U.S. efforts. In particular, both used to predict future situations with confidence; suchthe European and U,S. plans call attention to the ,nguided extrapolation of curren, trends is well knowniadisputable need for better understanding of chemical to bc dangerous. Instead, an additional capabilityinteractions in the atmosphere in order to identify is required. We need to predict the concentrationscauses of changes in the quality of the atmosphere that of relevant chemical species in ak, so that thehave now been detected and to predict future trends, consequences of uncontrolled chemical emissions andWe must identify and quantify the sources and sinks modihcations of the biosphere, as well as the impactsof important chemical species and determine how the of control strategies, can be assessed. These issuesrelated fluxes and concentration fields vary with time can be addressed with models that incorg _rate bothand hc',ightin the troposphere, meteorological and chemical processes. The need Io
We are faced with the need to measure the develop and utilize these models underlies the need to
chemical state of the troposphere and to extrapolate improve out' understanding of air-surface exchange offrom available measurements in order to assess trace gases.
conditions at other locations and to predict changes The atmosphere is normally near chemical steady-that might occur. In gene,al, measurements of air state, with input fluxes _,,pplying trace chemicals atchemistry at remote locations call for high-quality about the same rate as chemical reactions and surfaceipstrumentation, often nnt yet adequately developed, sinks remove them. A change in any one of these
5
Precedingpageblank
1990002793-013
6 CHEMICAL FLUXES
factors (reactions, input rates, and removal rates) will iution in the measurement of species concentrationsdisrupt the existing balance. The trends that are over half-hour averaging times to those with fractional-now being observed correspond to such disruptious, second response times and high signal-to-noise ratios.caused largely by steadily changing emissions of the There is no single technique that can satisfy flux men-by-products of society into the atmosphere. Increased surement needs for all trace gases in all situations, noremissions will necessarily cause an increase in air is there any flux-measuring capability yet in existenceconcentrations, but estimation of the eventual steady- that will generate a long-term average for a largestate level is far from simple. Any such computation area. Furthermore, micrometeorological techniquesmust also take into account the appropriate rates of have been developed for conserved variables; this isremoval, due to chemical reactions "in the air and the not the case for chemically reactive species.removal rates to the surface. Improved modeling capabilities need to be
Most of what we know about atmosphere- developed and tested on both regional and globalsurface interaction has resulted from studies involving scales for utilizing surface exchange measurementsconventional meteorological quantities---momentum, to predict species concentrations. This should beheat, and water vapor. Water vapor is of special done in parallel with the development and deploymentinterest as an analog for the exchange of other trace of improved flux-measurement techniques. Oncegases and because of its role (along with CO2) in proven acceptable, these models must then be usedphotosynthesis. The process known as transpiration to assess the large-area, long-time averages of speciesinvolves biological tissue, stomatal openings, and concentrations that are required by global programs.turbulen! exchange. Many trace gases exchange via The major goals of experimental programs mustthe same pathways as CO2 and water vapor, but therefore be:
others are surface-reactive and transfer efficiently to 1. to identify those processes which must be included _.all available surfaces with which air comes in contact, in the models,Another set of trace gases is emitted from foliageas a by-product of evapotranspiration. Among such 2. to provide reference data sets to use in modelgases are reduced hydrocarbons (e.g., ethylene). Yet development, andanother set of trace gases derives from soils--nitrogenoxides, reduced sulfur species, etc. There is no general 3. to provide independent data sets for testing theset of trace gases that is derived from all surfaces, models that are developed.Instead, different surfaces emit different sets of trace The overall strategy that results is to employ detailedchemical species at different rates. These differences experimental methods at carefully selected locatiu,,can sometimes be used as indicators of specific surface to develop models, which are then used t _ interpretconditions; ethylene, for example, can be used as an information obtained using simpler methods at otherindicator of plant water stress. Similarly, different locations and at other times. It is not the intent tha_surfaces have different deposition properties. A major complicated and expensive research methods be usedquestion in global atmospheric chemistry concerns the directly to obtain the global averages that are sought,quantification of the average fluxes of such trace species but instead that they provide a sound foundation forat the surface of the earth. It is clear that the exchange developing the tools by which the desired informationis highly variable both in space and in time. The can then be derived.answers that are needed relate to the total input In general, there is mor= confiden,_c in _; :gto (and removal from) the global atmosphere. To models to interpolate among existing data setsobtain relevant data requires more than just a few than in extrapolating beyond the bounds of existingexperimental data points. In fact, a concerted and understanding. Thus, the data sets generated to helpcarefully orchestrated strategy is required, develop process-related models of air-surface exchange
The capability to measure atmosphere-surface should be obtained in a wide variety of conditions,exchange rates experimentally is limited. Chamber spanning the range of situations that the models arcmethods are usefid to measure emission rates of required to address. Individual studies should besome chemical species from soils and sometimes from designed to demonstrate which processes are mostvegetation. However, these methods are limited by important and then to yield formulations of thosetheir inability to measure deposition to the surface, processes. Once developed, these detailed processThe flux measured by chambers is thus the gross flux models must be tested; independent sets of fieldfrom the surface, not the net exchange between the observations obtained in new experimental siluationssurface and the air. must be used to quantify uncertainties and limitations
Micrometeorologicai methods (i.e., methods that in the general applicability of the tools that aremeasure flux in the air) measure the net exchange developed. The models also play an important role inrather than the gross flux, as with chambers. Many evaluating the sensitivity of concentrations to changesdifferent kinds of micrometeorological methods are in the inputs and thus in determining the most relevantavailable, ranging from methods requiring high reso- variables and sets of species to be studied.
1990002793-014
/
INTRODUCTION 7
In general, the process modcls that are devei- 4. What especially promising tcchr.iques are bestopcd are designed to derive flux information from suited for exploratory investigation at this time?relatively simple data obtained at places where directflux measurements are not feasible. The driving The specific goals were to explore ways ininformation is usually concentration data, for tile air which recent technological developments might be ofand for the surfacz (or subsurface), together with assistance, to identify especially promising methodssufficient additional information to quantify the rate currently being developed oi considered, and toof exchange between the surface and the atmosphere, suggest field programs optimally designed to capitalizeAt sea, for example, the "tool" that is needed is a flux upon these new developments. Experts from therelationship between the atmosphere and the surface atmospheric chemistry community (including thosein terms of concentrations in air, concentrations in interested in both polluted and pristine atmospheres)water, and atmospheric and oceanic conditions that joined with experts on relevant surface exchangeinlluence the diffusion in each medium and across and atmospheric transport mechanisms to categorize
the boundary between them. In the pre_nt context, and clarify problems of flux measurement of tracethe focus is on exchange through the atmosphere, chemical species. Discussion focused on those chemicalwith measurement techniques limited to those that species for which fluxes can bc measured by availableare applied above the surface. Other measurement techniques and on those circumstances for whichmethods are feasible, in some circumstances, but are improvements could be anticipated in the near future.not addresscd here. For the oceans, fluxes through the Discussion mainly concerned exchange between thewater below the surface may sometimes be measured atmosphere and the surface and flux divergence withinmore easily than through the air above it. Similar the planetary boundary layer, although measurementsrelations will then apply, using concepts that parallel at higher levels in the atmosphere were also discussedthe lincs of this document. Relationships thal involve when techniques used for measurements in theboth abovc-surfaco and below-surface concentrations boundary layer seemed suitable for this purpose. ,,$'necessarily involve the Ilenry's Law constant, applied The workshop took place from 19 to 23 Octoberto concentrations in the medium corresponding to the 1987 in New York, New York, on the campus ofmeasurements or to the location of the controlling Columbia University. An appendix identifies theprocesses, participants. Their membership on several working
groups was arranged to concentrate attention on ozoneand odd nitrogen species (F. C. Fehsenfeid, chairman);
Workshop Details sulfur species (C. E. Kolb, chairman); and methane,nn.n.methane hydrocarbons, carbon monoxide, andThe workshop summarized here focused on the tracer materials (P. Steele, chairman). Consideration
need for detailed air-surface exchange information, of specilic measurement methods was divided amongas is required to develop and test exchange process enclosure techniques (O. T. Denmead, chairman);models. The methods by which routine data can tower methods (M. L. Wesely, chairman); and aircraftbe used by those models to assess global averages methods (C. W. Fairall, chairman).of air-surface exchange were not discussed. This The following chapters of this document willworkshop focused on three sets of techniques: tower present the results of the workshop deliberations.micrometcorological methods, aircraft techniques, and
the use of chambers. Most attention was paid to 1. Key Aspects of Species Related to Globalthe availability of trace chemical detection methods by Biogeochemical Cycles.which flux measurements could be made. No attention
was givt,n to several techniques that have been well The concentrations and fluxes of chemical speciessurveyed elsewhere. In particular, the special case of important in the context of biogeochemicaldry deposition from polluted atmospheres has been cycles: ozone and odd nitrogen, sulfur, methane,addressed extensively in other recent workshops, of nonmethane hydrocarbons, and carbon monoxide.which proceedings summaries are now available. Inconsequence, the present document concentrates on 2..qux Measurement Techniques.
surface fluxes at remote locations. More specifically, Advantages and shortcomings of enclosure tech-the workshop was designed to answer four questions: niques, towers, and aircraft.
1. How can we best address the goals specified in theGlobal Tropospheric Chemistry Program plans'? 3. Status of Chemical Sensors for Flux Measurement.
2. How should an optimal experimental program be Sensors with long averaging times, as required forstructured?measurements involving enclosures and gradients,
3. What new experim:_ntal capabilities are now and sensors with rapid response as required foravailable for exploitation_ eddy correlation and variance methods.
1990002793-015

8 CHEMICAL FLUXES
4. Flux Measurement Program Plan. opportunities related to the development of newsensors and new experimental approaches.
Specilic program plans designed to make optimaluse of existing capabilities. The success of the workshop and this report will
5. New Opportunities for Flux Measurement. depend on how correct we are in our assessments, howwell we have foreseen the emerging needs in studyingKey dilficulties and challenges in the use of the chemical behavior of the atmosphere, and howmeasurement techniques as well as needs and fluently we have expressed our conclusions.
1990002793-016
/
1 KEY ASPECTS OF SPECIES RELATED TOGLOBAL BIOGEOCHEMICAL CYCLES
M. Andreae. A. C. Delany, S. Liu, J. Logan, L. P. Steele, H. Westberg,and R. Zika
The important roles played by various trace species at night over land, and 500 m to 1 km deep over thein global biogeochemical cycles have bccn discussed ocean. The PBL is that part of the lower tropospherein Global Tropospheric Chemistry: Plans ]'or the U.S. that responds to changes at the earth's surface withinResearc?: Effort (UCAR, 1986). In this chapter, we a few hours and consequently over land exhibits awill limit discussion to the surface exchange and pronounced diurnalcycleofverticalmixing. During theflux divergence of the key trace species, and related daytime, convection causes strong mixing, and the PBLresearch needs. The species included are classified is often called the convective boundary layer (CBL). Atinto three major groups--the oxidant and odd nitrogen night, vertical mixing is relatively weak, shallow, andgroup, the sulfur group, and the carbon group. Critical i.ntermittent, and the PBL is often called the nocturnal
studies for each group ,viii be identified and discussed, boundary layer (NBL). The structures of these variousWe note, however, that many of the studies are related layers vary with terrain, latitude, seasons, etc., in waysto each other;, therefore, carrying out concurrent that complicate the overall behavior of trace speciesstudies addressing several species at the same time and inject a strong meteorological component intooffers considerable attraction, any description of species concentrations, as well as
The surface exchange rate of a chemical species of the change of species fluxes with height, called fluxis usually a function of surface properties such as divergence.the kind and condition of vegetation, nutrient level, Flux divergence plays a crucial role in studyingtemperature, and moisture. Since measurements of the budgets and distribution of many trace chemicalsurfa_ exchange rates are limited in their temporal species. For example, flux divergences of speciesand spatial coverage, extrapolation to other locations like NO, and 03, whose concentrations can differand times is usually needed. Detailed understanding of greatly between the boundary layer and the freehow exchange rates depend on prevailing environmen- troposphere, need to be estimated in order to evaluatetal conditions will greatly facilitate this extrapolation, their budgets. For the most part, however, fluxThe ultimate goal of studying surface exchange is to divergence measurements will not be discussed inunderstand the basic biogeochemical mechanisms that great detail since the techniques for measoring llux bycontrol the exchange processes. A full discussion of eddy correlation apply equally well to multiple levels,these issues, however, is beyond the scope of this work. as required for flux divergence estimates, and to aIn the following discussions, the emphasis will be on single level as required for measuring surface exchange.the phenomenological aspects of surface exchange. Other than eddy correlation, flux measuring techniques
Discussion of the bellavior of different chemical that can be used for estimating surface exchange are, inspecies in the troposphere necessarily involves consid- general, not applicable for measuring flux divergence.eration of both chemical and physical aspects of the
air-surface system, and sometimes biological factors Oxidant and Odd Nitrogen Groupas well. The discussion will use commonly accepteddescriptions of different parts of the atmosphere. The The nonradical oxidants 03 and H202 and theair in closest contact with the surface forms a constant family of odd nitrogen compounds, including NO, NO2,flux layer, called the surface layer, some tens of meters NO3, N205, HNO3, HNO2, PAN, and NH3, play a keythick, irl which there is little flux divergence. This and closely interconnected role in the oxidative stateconstant ilux layer is the lowest part (less than about of the atmosphere. Because the chemistry of these10%) of the planetary boundary layer (PBL), which is species is so closely interrelated, it is convenient totypicall_ i to 2 km deel_ in daytime, 100 to 500 m deep consider them together as a family.
1990002793-017
!1|
10 CHEMICAL FLUXES|
Table I.I
Estimated Photochemical Lifetimes (in Summer)
of 03, H202, NH3, and N;')y
REGION
(1) (2) (3)Tropical marine Rural continental Upper
LIFETIME boundary layer boundary layer troposphereGreater Os, HaOa, Same as (I) Same as (1)than HNOa, NHs plus PAN, NaOs,I day other organic
nitrates, NHa
1 hour to NO=, NOa, Same as (1) Same as (1)1 day some organic plus NOs, N205,
nitrates 5[02
10 min. to PAN, some Same as (1) Noneto 1 hour organic nitrates,
HNO2*less than NO, NO2*, and Same as (1) Same as (1)
10 rain. [ NOn*I
*During the daytime
Table 1.2
Estimated Lifetimes of 03, HzOz, NIt3, and NO r for Incorporation intoCloud Water and/br Aerosols
REGION
(1) (2) (3)Tropical marine Rural eon;inental Upper
LIFETIME boundary layer boundary layer troposphere
Greater PAN, NO., "Same as (1) Same as (1)than Os, organic plus HaOa, HNO4,1 day nitrates N;Os, NOs, HNOa,
and NHs
1 hour to None H2Oa, NaOs, None
1 day NOn, HNO2,HNOs, NHs
10 rain. to H202, NaOs, None Noneto 1 hour NOn, HNOa,
HNOn, NHaless than None None None10 rain.
1990002793-018
KEY ASPECTS OF SPECIES 11
The major precursors of ozone can be divided are used to estimate the flux of such chemical species, ainto two groups: NO. (i.e., NO + NO2), and correct estimate of the gas flux dependson maintaininghydrocarbons and CO. Since CO and CH4 are readily gas concentrations in the air within the enclosure veryavailable in the troposphere, NO= usually is the rate- close to ambient. "Closed" enclosure systems arelimiting ozone precursor. The distribution of NO= is thus unsuitable, and "open" systems will require largevery inhomogeneous (see Fehsenfeld et al., 1988), as ventilation rates, so that leaf boundary layer resistancesexpected from its short photochemical lifetime and will be much smaller than stomatal resistances.highly localized sources. As a result, the ozone Emission rates of N20 are relatively smallproduction rate should be a very strong function of compared to those of NH3 and NO t (Keller etlocation, al., 1986). Natural sources are likely to be the
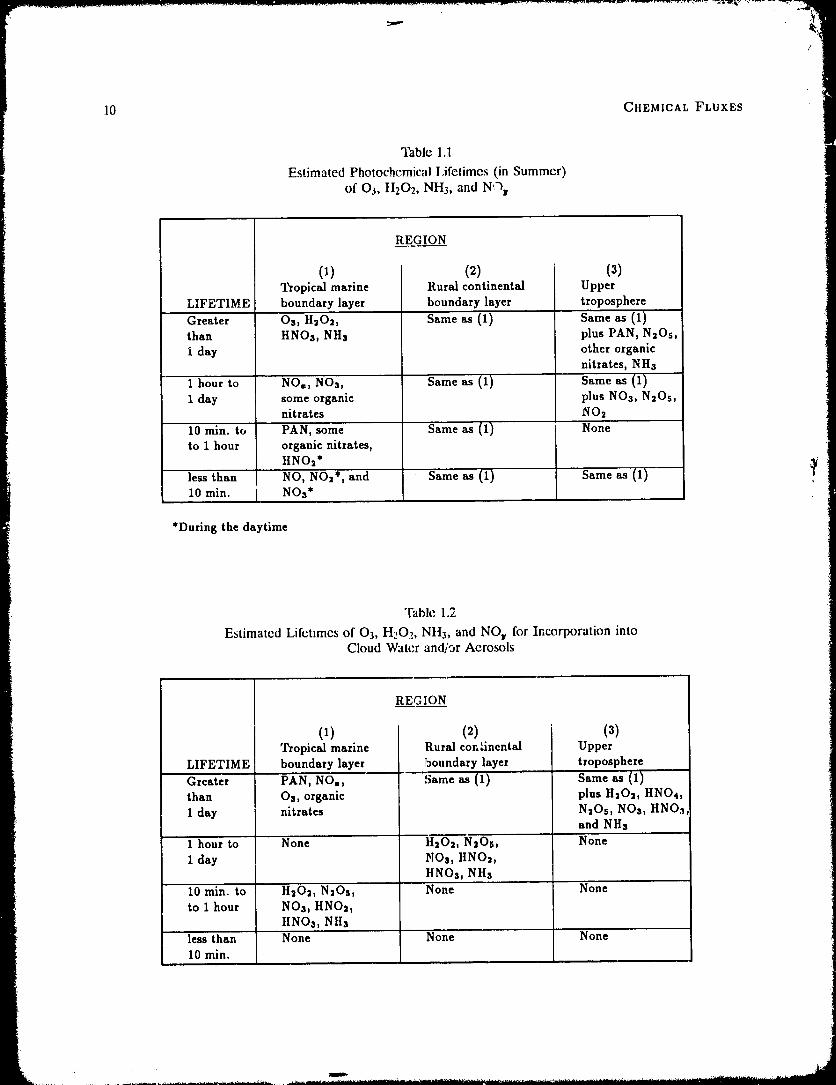
Table 1.1 gives a list of photochemical lifetimes primary contributor, although there is probably someof ozone, H202, NO r species, and NH3, while Table anthropogenic contribution. The only known N201.2 gives the estimated lifetime for the loss of these, sinks are in the stratosphere; surface deposition of N20compounds by incorporation into cloud water and is negligible.aerosols. The lifetimes of these species range from lessthan ten minutes to more than a day. Therefore, their Sources of NOr, 03, and 11202distributions and exchange fluxes depend on transportproce:,ses of various time scales. Table 1.3 lists the important sources and sinks
We need to consider here not only surface of NO.. Most of the sources are on land and nearexchanges but also exchanges between the boundary the surface. Anthropogenic sources appear morelaver and the frec atmosphere; except for a few highly important than natural sources, especially in winter,when there are fewer natural sources. Emissions ofreactive species that originate from surface emissions,boundary layer concentrations of trace chemical species NO= are primarily in the form of NO. Once emitted,are detcrmined by both interaction with the surface and NO is oxidized quickly to a mixture of NO and NO2 in _'entrainment of air from the free atmosphere. This is photochemical equilibrium, and then to other reactiveparticularly true in stu_'y;ng the global distributions and nitrogen species, such as HNO3, PAN, NO3, andbudgets of O3, H202, NOy species, and Ntt3. N205. As pointed out by Lenschow and Delany (1987),
the rapid photochemical reactions involving NO, NO2,Exchange of boundary layer air with the free and 03 have a considerable impact on their flux and
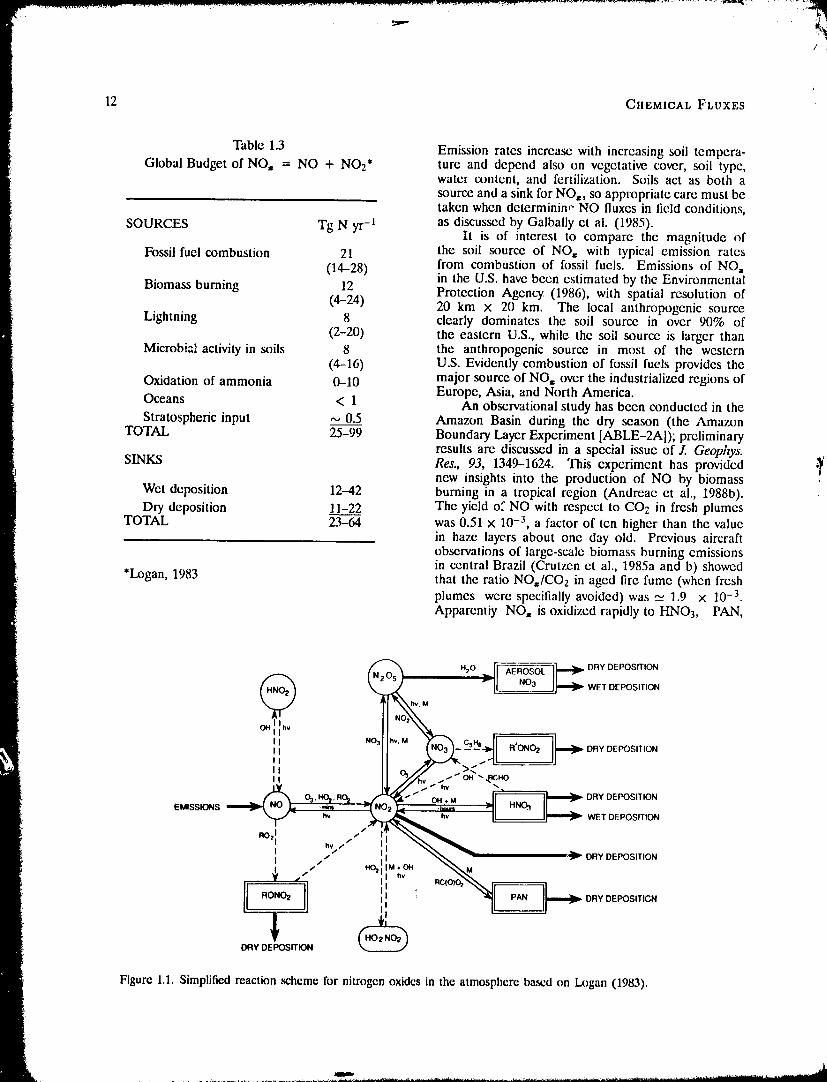
atmosphere takes place through a variety of mecha- concentration profiles in the surface layer. Figure 1.Inisms. On a large (vertical) scale, convective cloudscan transport boundary layer air up to near the top shows a simplified reaction scheme of nitrogen species;of the troposphere within a few minutes and can also a discussion of these reactions and time constants canbring air from the free atmosphere down to the surface be found in l_x)gan (1983).
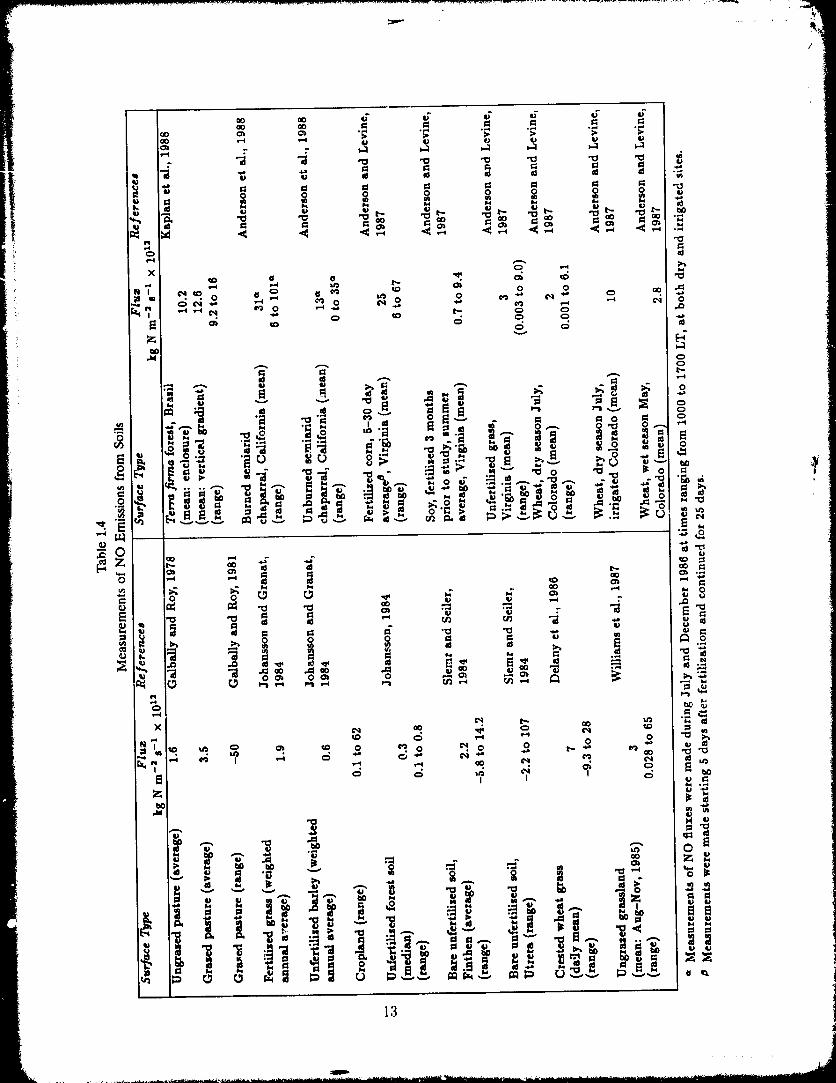
The emission rate of NO, from soils has beenin evaporation-driven downdrafts. On a small scale, measured primarily by the enclosure technique, asboth shear and convection can generate turbulence to discussed by Galbally (1985) and as summarizedovercome the static stability of the free atmosphere in a recent report of the World Meteorologicaland cause entrainment of air into the boundary layer. Organization (WMO, 1986; see Chapter 3). ResultsSince the chemical lifetimes of H202, NO=, andNH3 are less than or comparable to the residence are summarized in Table 1.4, updated from the WMOtime of air in the boundary layer, the amount of these report.
Recent comparisons of the enclosure techmqucspecies exchanged between the boundary layer and the and a local budget tcchniquc indicate thai the methodsfree troposphere may be consid,'.rably less than the give similar results (Parrish et al., 1987; Kaplan et al.,amount introduced into the PBL. In addition, chemical 1988). The budget technique relies on the fact thatprocessing in the PBL serves to convert NO. to a at night the reaction of NO with O3 is the dominantvariety of other NO_ species. Thus, both theoretical removal process for NO and that atmospheric reactionsand experimental studies should be made to assess this reforming NO from NO2 are negligible. Hence, theexchange for 03, NO t, and NH3. net flux of NO from the soil must balance ti_e total
A complication for measuring the emission or column loss of NO by reaction with O3, which may bedeposition flux for species such as NH3, NO,, and calculated from vertical profiles of NO and O3 at night.amines (Farquhar et al., 1983), and perhaps also for At Icast one study of soil emissions has employed theother gases, is that a compensation point exists, a non- eddy-correlation technique (Delany et al., 1986).zero gas concentration in the leaf air spaces, which The majority of NO flux measurements have beenis in equilibrium with metabolitcs in plant cells. If at mid-latitudes. As discussed in Chapter 3, emissionthe ambient concentration exceeds the compensation rates measured with enclosures are highly variable,point, the gas is taken up by the plant from theatmosphere, but if the ambient concentration is less averaging about 1-2 x 10-12 kg N m-2s -I at mid-than the compensation point, the gas is emitted to the latitudes, while the few studies in the tropics give valuesatmosphere. If enclosure techniques (see Chapter 2) of 8-11 × 10-12 kg N m-2s -l, at least h)r dry soils.
1990002793-019
12 CHEMICAl, FbUXES
Table 1.3 Emission rates increase with increasing soil tempera-Global Budget of NO. = NO + NO2* ture and depend also on vegetative cover, soil type,
water content, and fertilization. Soils act as both a
source and a sink for NO,,, so appropriate care must betaken when dcterminin¢" NO fluxes in field conditions,
SOURCES rig N yr-1 as discussed by Galbally ct al. (1985).It is of interest to compare the magnitude of
Fossil fuel combustion 21 the soil source of NO, with typical emission rates(14-28) from combustion of fossil fuels. Emissions of NO,
in the U.S. have been estimated by the EnvironmentalBiomass burning 12 Protection Agency (1986), with spatial resolution of
(4-24) 20 km x 20 km. The local anthropogcnic sourceLightning 8 clearly dominates the soil source in over 90% of
(2-20) the eastern U.S., while the soil source is larger thanMicrobial activity in soils 8 the anthropogenic source in most of the western
(4-16) U.S. Evidently combustion of fossil fuels provides theOxidation of ammonia 0-10 major source of NO, over the industrialized regions of
Oceans < 1 Europe, Asia, and North America.An observational study has been conducted in the
Stratospheric input ,,, 0.5 Amazon Basin during the dry season (the AmazonTOTAL 25-99 Boundary Layer Experiment [ABLE-2A]); preliminary
results are discussed in a special issue of J. Geophys.
SINKS Res., 93, 1349-1624. This experiment has providednew insights into the production of NO by biomass
Wet deposition 12-42 burning in a tropical region (Andreae et al., 1988b).Dry deposition 11-22 The yield o._ NO with respect to CO2 in fresh plumes
TOTAL 23-64 was 0.51 × 10⁻³, a factor of ten higher than the valuein haze layers about one day old. Previous aircraftobservations of large-scale biomass burning emissions
*Logan, 1983 in central Brazil (Crutzcn ct al., 1985a and b) showedthat the ratio NO®/COz in aged fire fume (when freshplumes were specifially avoided) was ,_ 1.9 x 10⁻³.Apparently NO, is oxidized rapidly to HNO3, PAN,
H_O Ii AEROSOL l'l=_b- DRY DEPOSITIONN205 , -,, ,,,o,WFT°E"OS,,,O"'_.J 'rl" \_,,M ----, il
OH ,v If \'x_I NO3 hv W CsHII R'ON
'I _10311hv_ _O3_-- ---- 4 02 i-_ DRY DEPOSITION
II II .,_P'-_>c"_ _ 'JLY hb• / .._ hv _,
NO O.s. ,R ._ s '_" OH* M JI'_B_B)" DRY DEPOSITION
EMISSIONS _ -.._ -_ "h_" ql '"'v3 I_ WETDEPOSIT1ON
RO2 .s / I I
,, ..- :; . o..O.OS,T,ONII .... II i! , °_'"'_\',,dr_--_tII no.oII i: ' "11"" I 'o oE os'Tl-
DRY DEPOSITION
Figure 1.1. Simplified reaction scheme for nitrogen oxides in the atmosphere based on l.x)gan (1983).
1990002793-020
1990002793-021
14 CHEMICAL FLUXES
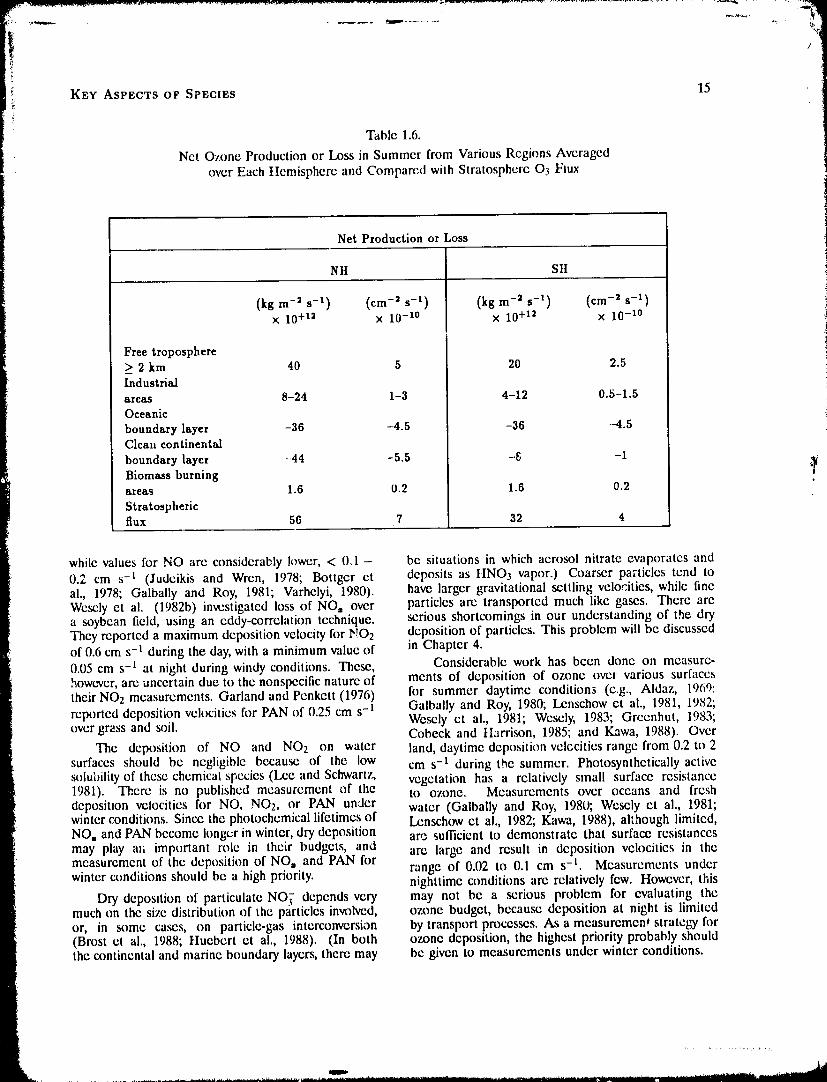
or nitrates in the tropical environment. Background deposition of ozone. This emphasizes the importanceconcentrations of NO over the Amazon region of measuring ozone flux divergence as well as surfaceincreased by about 25% during the month-long deposition.expedition, as burning activity increased within and Table 1.6 shows that ozone production in theto the south of the study region (Torrcs and Buchan, free troposphere also has a significant impact on1988). Thus, while biomass burning was the dominant the global ozone budget; yet the sources of freesource of NO,. in the vicinity of fires and within plumes, tropospheric NO,, which plays an essential role in freeit appeared that emissions from soils provided the tropospheric ozone production, are poorly understood.major source in the mixed layer and in the convective In addition to the contribution from industrial regions,cloud layer. Andreae et al. (1988b) used the ABLE- the large biomass fires in the tropics also contribute2A data to estimate that the global source of NO, from to the production of ozone on a global scale (Dclanybiomass burning was 7.6 Tg N yr -l, about 2/3 of the et al., 1985). In order to evaluate the impact ofestimate given in Table 1.3. The latter figure was based anthropogenic activities on tropospheric ozone, theon estimates of the nitrogen content of various biomass vertical flux divergences of NO,, PAN, and otherfuels, asscssmcnts of the extent of burning, and the reactive nitrogen species emanating from the boundaryassumption that 25% of fuel nitrogen is converted to layer in industrialized regions must be measured.NO. The ozone budget in the winter half of the
Elevated concentrations of NO were observed in year and the seasonal variation of ozone are not
the vicinity of electrically active clouds over the Pacific understood. This may have important implications forOcean during the first Chemistry Instrumentation Test assessing the role of anthropogenic emissions on ozoneExperiment (CITE-l) expedition (Davis et al., 1987; concentration fields and for estimating possible adverseRidley et al., 1987). Chameides et al. (1987) used effects on ecosystems by exposure to high ozonethese data in combination with estimates of the mass concentrations. Measurements of surface exchange _/
flux of air through convective clouds to estimate a rates and flux divergences of ozone and its precursorsglobal source for NO,. from lightning of 7 Tg N yr '1. in the winter season will resolve some of the keyThis estimate is very similar to that given in Table 1.3, questions involved.wh_,chresults from ground-based observations of NO2 H202 is produced in both gas-phase and aqueous-from lightning and satellite data for the to(al number phase chemical reactions that involve odd hydrogenof lightning flashes per year. The good agreement for species. Like ozone, H202 formation depends stronglythe independent methods is remarkable, since both arc on the distributions of NO, and hydrocarbons. Thebased on very limited observations of NO. production photochemical lifetime of H202 is relatively short--
about two days in summer at mid-latitudes. As a result,by electrical activity, we expect considerable spatial and temporal variation
Table 1.5 in the distribution of H202. Therefore, as in the case
Tropospheric NO, Distributions in the Planetary of ozone, flux divergence plays a major role in theBoundary Layer (PBL) and Above* budget and distribution of H202.
Regions NO,. (ppbv) Deposition of NOt, 03, and H202Industrialized PBL 0.5 - 10 Wet and dry deposition are the major sinks for
Oceanic PBL (0 ,., 2 i:m) 0.001- 0.01 reactive nitrogen species. Soluble species such asClean continental PBL 0.05 -0.2 HNO3, NO3, and N20._ are readily scavenged by
Biomass burning PBL 0.5 -10 precipitation. Ehhalt and Drummond (1982) andFrcc troposphere (2 ,,, 12 km) 0.02 - 0.2 Logan (1983) estimate that more than half of the total
loss of reactive nitrogen species occurs through wet*Fehscnfeid et al., 1987 deposition. Huebert and Rob6rt (1985) have found
virtually no surface resistance to t1NO3 exchange from
Table 1.5, adopted from Fehsenfeld et al. (.1987), the atmosphere to grass; under these conditions, itsgives typical observed NO. levels in five major regions deposition is determined by aerodynamic resistance.
In some circumstances, HNO3 deposition may beof the troposphere and reflects our current knowledgeof thedistributitm of NO, sources. The inhomogenei b controlled by phase equilibria (Brost et al., 1988;in NO. distributions implies that some regions act Hucbert et al., 1988). The same can be expectcdas ozxme sourt_'s while others act as ozone sinks for N205, which is readily converted to HNO3 in the(Liu, 1988). The net ozone production (or loss) presence of surface moisture.rates for .,cse regions are shown in Table 1.6. In Deposition velocities (v_the ratios of surfacesteady-state conditions, the net ozone production (or fluxes to air concentrations at some reference level,loss) equals the flux divergence in a particular region, typically 2 m height) h_r NO2 in the range of 0.3-0.8and the estimated flux 'divergences are comparable cm s-l have been inferred for cement, soil, grass, andto the stratospheric flux divergences and the surface agricultural crops from field and laboratory studies,
1990002793-022
............................. ..............̧ /i...........
KEY ASPECTS OF SPECIES 15
Table 1.6.
Net Ozone Production or Loss in Summer from Various Regions Averaged
over Each Hemisphere and Compared wilh Stratosphere O3 Flux
Net Production or Loss
NH SIt
(kg m -2 s -x) (cm -2 s-1) (kg m -2 s -1) (cm -2 s-x)x 10+12 x 10-1° x 10+t2 x 10-1°
Free troposphere> 2 km 40 5 20 2.5Industrialareas 8-24 1-3 4-12 0.5-1.5Oceanic
boundarylayer -36 -4.5 -36 -4.5Cleancontinental
boundarylayer -44 -5.5 -_, -1Biomass burningareas 1.6 0.2 1.6 0.2
Stratosphericflux 56 7 32 4
while values h)r NO are considerably lower, < 0.1 - be situations in which aerosol nitrate evaporatcs and
0.2 cm s-l (Judeikis and Wren, 1978; Bottger et deposits as HNO3 vapor.) Coarser particles tend toal., 1978; Galbally and Roy, 1981; Varhelyi, 1980). have larger gravitational settling velocities, while fineWescly et al. (1982b) investigated loss of NO, over particles are transported much like gases. There area soybean field, using an eddy-correlation tcchnique, serious shortcomings in our understanding of the dryThey rcportcd a maximum dcposition vclocity for I'_O2 deposition of particles. This problem will be discussedof 0.6 cm s -1 during the day, with a minimum valuc of in Chapter 4.0.05 cm s-l at night during windy conditions. These, Considerable work has bccn done on measure-howcwer, are uncertain due to the nonspecific nature of ments of deposition of ozone over various surfacestheir NO2 measurements. Garland and Penkett (1976) for summer daytime condition_ (e.g., Aldaz, 196'9:
reported deposition veh)citics for PAN of 0.25 cm s-1 Galbally and Roy, 1980; Lenschow et al., 1981, 19_2;Wescly ct al., 1981; Wcsely, 1983; Grecnhut, 1983;over grass and soil. Cobeck and Harrison, 1985; and Kawa, 1988). Over
The deposition of NO and NO2 on water land, daytime deposition vole,cities range from 0.2 to 2surfaces should bc negligible because of the low cm s-l during the summer. Photosynthetically activesolubility of these chemical species (Lee and Schwartz, vegetation has a relatively small surface resistance1981). 'I_.ere is no published measurement of the to ozone. Measurements over oceans and freshdeposition velocities h)r NO, NO2, or PAN under water (Galbally and Roy, 1980; Wesely et al., 1981;winter conditions. Since the photochemical lifetimes of Lcnschow et al., 1982; Kawa, 1988), although limited,NO, and PAN become longer in winter, dry deposition arc sufficient to demonstrate that surface resistancesmay play a_ important role in their budgets, and are large and result in dcposition velocities in the
measurement of the deposition of NO, and PAN for range of 0.02 to 0.1 cm s -l Measurements underwinter conditions should be a high priority, nighttime conditions are relatively few. However, this
Dry deposition o1 particulate NO_ depends very may not be a serious problem for evaluating themuch on the size distribution of the particles involved, ozone budget, because deposition at night is limitedor, in some ca_s, on particle-gas interconversian by transport proces_s. As a mcasuremen_ strategy for(Brost et al., 1988; Huebert et al., 1988). (In both ozone deposition, the highest priority probably shouldthe continental and marine boundary layers, there may be given to measurements under winter conditions.
"1990002793-023
/
16 CIIgMICAL FLUXES
Both wet and dry dcpositior, are significant sinks attributes tt_ S6dcrlund and Svensson (1976) thefor H202. There have been few measurements of statement that NH_ is a surpri:singly stable compoundeither, because reliable instruments for measuring in combustion systems, and Galbally (1985) expressesH2Oz have been available only recently (Heikes et al., the view that a significvnt fraction of the nitrogen1986). must be volatilized as NH3 duriog the heating and
burning of plant material. Recent measurements ofAmmonia NII_ emissions from laboratory-scale biomass fires
Ammoma, the main nitrogen-containing com- yield an estimate of 3.2 Tg N (NH3) yr -l for the globalpound in primordial earth's atmosphere, is now present annual emission (And_cae, personal communication,only in trace amounts. It is unique among atmospheric 1989; da;.a from W. M. Hap, Max Planck Institute fortrace species as the only basic gaseous species present Chemistry, Mainz, FRG).in significant concentrations (typically 0.1 to 19 ppbv Fhe next largest N:I3 source suggestcd by Crutzen
[7.7 x 10-ll to 1.5 x 10-_ kg m -3 STP]) near ground is relea_ from natural (unfertilized) fields, up to 30level. For this reason, its accession to the atmosphere, Tg N yr -_. As discussed by Cratzen and by Galballythe dispersion and transformations it undergoes (1985), this is difficult to estimate becaus_ soils andthere, and its sub_quent deposition are of great plants can be either sources or sinks. Crutzer.'sinterest in many earth sciences, including meteorology, estimate is based on a model of NH3 productionatmospheric chemistry, soil science, agronomy, and and transport in soils developed by Dawson (1977).ecolo_, The model predicts that the concentration of NtI3
Concentrations in "clean" air over land are con_,aincd in air within the soil is always very muchtypically in the range of i.3 to 13 ppbv (10-9 to largcr than in the free atmosphere (by a factor of
10-8 kg m -3 STP) (Ayers and Gras, 1980), although between 70 and 3(X)), so that the soil is always a sourceconcentrations in rural areas with much livestock of atmospheric NH3. ]/
production may be very much higher, up to 330 ppbv Malo and Purvis (1964) and ltannawalt (1969),(2.5 x 10 7 kg m -3 STP) as a daily average however, concluded from laboratory and field cx-(Vermetten et al., 1985). Concentrations in clean air periments that soils could be substantial sinks
h)r atmospheric NH3. Although the atmosphcricover the oceans are quite low, < 0.13 ppbv (10-l° kg concentrations they employed in the laboratory andm-3 STP) (Aycrs and Gras, 1980).
A precursor o _ . le chemical subunits of early life, measured in the field (39 to 78 ppbv [3 to 6 x 10-_ammonia is now tom;ed in nature from the biological kg m -3 STPI) were rather larger than normal ambientdegradation of protei_:s in soil organic matter, plant values, they were, nevertheless, still much smaller thanresidues, and animal wastes. Smaller amounts are also the values Dawson predicts for soil.emitted from fertilizer bleakdown and from industrial Dawson's model also ncglccts the possible absorp-
and combustion processes, tion of NII3 from air as it dil[u_s through the canopyThere is considcrable guesswork in publishcd space. Hutchinson ct al. (1972) have shown that plants
estimates of NH3 emissions. Galbally (1985) discuses can absorb NIt3 gas by diffusion through stomata, andsome of the problems. Among more recent estimates Denmead et al. (1970) fi)und slnmg evidence Ior theare those made by Crutzcn (1983)in an up-date of an existence of a closed NIt3 c3'clc in plant canopies,earlier ammonia budget of S6derlund and Svensson whereby NH._ released from the decomposition tff _iltcr(1976). Crutzcn's estimates of annual global emissions at the soil surface is reabsorbcd by the foliage above.arc: In other work, Denmcad et al. (1978) h,und that at
normal concentrations (up to 13 ppbv lit) -8 kg m -3Biomass bulning < (_(1Tg N/year STP]), atmospheric ammonia was taken up by a cornEmission!i from natural fields < 30 Tg N/year crop (plant plus soil) when the soil ,_;urface was dry, butExcreta from domestic animals 10 to 20 Tg N/year sustained NH3 losses from tt.e crop occurred when theCoal burning 4 to 12 Tg N/year s,rh_ce was moist. They suggest that the net exchangeExcreta from wild animals 2 u)6 Tg N/year is a balance bctv,_cen absorption by the plants andEmissions from fertilized fields < 3 Tg N/year emission from the u)il. The lattcr is strongcst when
"I'l_e biggest source, biomass burning, is probably water is being evaporated. Crutzcn (1983) suggeststhe most uncertain, st) it is important that its that a significant release of NH3 to the atmospheremagnitude be verified. Vines et al. (1971) were unable could occur in early spring, when the soil is moist, freshto detect NH3 in the smoke of bushlires, small fires vegetation is not well developed, but dead material onin the laboratory, or large forest fires. They suggest the ground is abundant and the soil is being heatedthat NH3 that formed during the pyrolysis of nitrogen strongly.compounds would probably be oxidized to water Whether plants themselves lose or gain ammoniaand molecular nitrogen at the flame temperatm'cs aplx:ars to be controlled by the NtI3 compensationprevailing in bushlires. Crutzen, on the other hand, point. Farquhar et al. (198(I) have found that fo, the
1990002793-024
KEY ASPECTS OF SPECIES 17
plant species they examined, the compensation point on fertilizer type, soil, weather conditions, and methodsis close to normal clean-air concentrations, although it of application.increases with increasing temperature, partly because Two trends in modern agricultural practice arcof the ell'ccts of temperature on the equilibrium vapor worth noting here. One is the increasing u_ of urea aspressure of NH3 solutions and increases also during a fertilizer. Buijsman et al. (1987) suggest an emissionsenescence, presumably because of changes in plant factor of 10% fi)r urea, which is twice Crutzcn'smetabolism (Farquhar et al., 19791. The temperature figure. The second is a shift to minimum cultivationdependence has becp suggested as a reason fi)r the practices, which means that more fertilizer ix spreadapparently higher atmospheric concentrations of NH3 on ,'..hes:_il surface, where its ga._ous decompositi(,nin tropical regions, products can be easily lost to the atmosphcre, instead
The fact .*hat compensation points are normally of being in=orporated within the soil, where releasedclose to ambient concentrations makes considerable NH3 can be quickly fixed by the soil exchange complex.
sense. Plants with higher compensation points would Additionally, the use of more nitrogen fertilizers inbe at an ecological disadvantage. Given all this, it developing countries, where agricultural practices arcseems that in normal clean air, atmospheric exchange often inclficient, will probably lead to I'ighcr NII3of NH._ will be of small consequence to the nitrogen cmissions.budgct of many agricultural crop_, except during Ammonia is returned to the earth's surface asperiods of elevated tcmperaaure or in senescence, NH_ and NH4+ very elHciently by both wet and dry.but atmospheric exchange may bc more important in deposition, so thai the majority of emitted NH3 isnatural communities with smaller nitrogen turnovers, probably deposited in the vicinity of its sources. While
Excreta from domestic animals is the ncxt largest the flux dens(tics of nitrogen from these sourcesso)tree on Crutzcn's list and the one that many believe (typically, 1 to 2 x 10⁻³ kg N m-2 yr -l [3.2 to
C" ' '_may be the largest. _rutzens estimate is ba.,,cd on 6.4 x 10-hI kg N m-2 s-_]) compared with fcrtihzer )average rates of urea excretion in urine arid feces by applications of ,-..1(}-2 kg N m -2 yr -l (3.2 x 1(}-l°
livestock, and an assumption that 3(1% of the nitrogen kg N m -2 s -11 are relatively small in comparisonin the urea would be volatilized as NtI._. Estimates with inputs of nitrogen It) fertilized fields, they arc,)f the latter range from 10 to 45% (Lcnhard and certainly of consequence in the nitrogen balance ofGravcnhorst, 19801. natural ecosystems.
From aircraft measurements of the concentration .,_ new envixonmcntal elfect of atmospheric NtI.,of NH3 and NI-I_ in the air at I(X) m and 700 m is now emerging, particularly in regions of high NII_above a rural area in western Germany, Lenhard turnover, as in Europe (Buijsman ct al., 19871. Seriousand Gravcnhorst (19801 estimated upward fluxes of sAI-acidifying effects have been ob_rvcd, which couldNH> and NH4+ and concluded that these could be attributed to wet deposition of NH4+ and drybc maintained entirely by NH_ volatilization from dell)sit(on of Nlq_ and amm,)nium aerosols.domestic animal excreta, again assuming that 3(1% The role of the oceans is largely unknown. Someof the excreted urea nitrt)gcn is volatilized as NIt_. measurements of NIt3 in marine air by Aycrs andGalbally et ,_. (19801 also c_timatcd that the major Gras (19801 suggest that the atmospheric concentrationemissions of NH_ to the atmosphere in Australia were is ck)sc to the equilibrium gas concentration to befrom this source, some 7(}%. The most detailed expected for g:awater, which sugg,ests that the oceansestimates currently available are those of Buijsman are unlikely to be net sources or :dnks. At pre._m,ctal. (1987), who cal'.'ulatcd that 81% of the total there are likely too few measurements of Nll t inanthrt)pogennc NH._ emissions in Europe were from surface air over the oceans or in ocean surface waterslivestock wastes. They also estimated that natural to decide this question (Galbally, 19851.emissions ,)f NIt_ in Europe (from uncultivated land
areas) contribute only I)._) Tg N yr 'n, compared SIllfur Groupwi:h livestock emissions of 4.3 Tg N yr-I and total
anthropogenic emissions of 5.3 Tg N yr- i. Both natural and anthropogenic sources contributeOther minor sources include coal burning, excreta to the global sulfur budget. Anthrolx)gcnic sulfur
from wild animals, emissions from fertilized fields, emissions are dominated by the release of SO: from
and industrial emissions (< I Tg N yr-I). Apart fossil-fuel burning. Several authors have recentlyfrom excreta from wild animals, these are the best- t'cviewed these emissions and presented detailed sourcedocumented sources, but, even so, there are still some alh)cations (e.g., M{)ller, 1984; and Cullis and tlirschler,unknowns. In calculating cmis:..,)ns from fertilizJzd 1980); the estimates fall ipto a relatively narrow rangefields, for instance, Crutzcn takes the Nlt._ contribution of about 70 to 1111)qg S yr-t.as about 5% of the annual fertilizer u_ t)f almost Various attempts to derive a global atmospheric60 Tg N, but published estimates of Ntl._ h)ss from budget for sulfur have suggested that natural emissionsfertilizer applicatien range from 0 to 5()_, depending of a magnitude comparable to man-made emissions
1990002793-025
/
18 CHEMICAL FLUXES
arc nece_ary to balance this budget (for a review, mctabolites in biota either thn)ugh the formation andscc Frcncy ct al., 1983). However, since the release of volatile sulfur metabolitcs in healthy livingcalculations of natural emissions from the dilrcrence cells or as a consequence of decomposition. The mostbetween anthropogenic emissions and total deposition important product released from live cells, cspeciallyfluxes involve very large uncertainties, they cannot be by plants, is dimethylsuifide (DMS), which is discussedexpected to provide a meaningful estimate, rater in s,,me detail. The major pathway to the
This section is an overview of the proces_s that xormation of H2S, however, is lhrougl, dissimilatoryresult in the natural emissions of sulfur species and sulfate reduction. Under favorable conditions, the rateprovides, where possible, estimates of thcse fluxes, of sulfate reduction to H,S ca,, _e quite high, on theOnly fluxes of natural gaseous sulfur species are given order of several tens of #g m -2 s-t. Howcver, thisextensive coverage here. For detailed discussions of process occurs only when a mixing barrier preventsother emissions, such as sea salt sulfate and volcanic oxygen from entering the system. (The escape of H2Semissions, the reader is referred to the rcviews by from the system is, of course, limited by the sameAndrcae (1985, 19861. barrier.) Furthermore, in the presence of oxygen,
H2S can be consumed by bacteria in a layer only a
Production of Volatile Biogenic Sulfur Compounds fraction of a millimeter thick. Consequently, the largeamounts of t-12S that are produced in the coastal and
Sulfur is an essential element to biological marine environment are not usually transferr=d to theorganisms. Two biological pathways lead from sulfate atmosphere (Antireae, 19841. Only a small fraction(the major sulfur source for almost all organisms) of the H2S produced can escape under exceptionalto reduced sulfur compounds: assimilatorv and conditions in shallow water. H2S emissions from thedissimilatory sulfate reduction. Volatile organosulfur marine environment are, therefore, limited to suchcon,pounds arc produced from nonw_latile sulfur near-shore environments as estuaries and salt m_rshes. _
Table 1.7
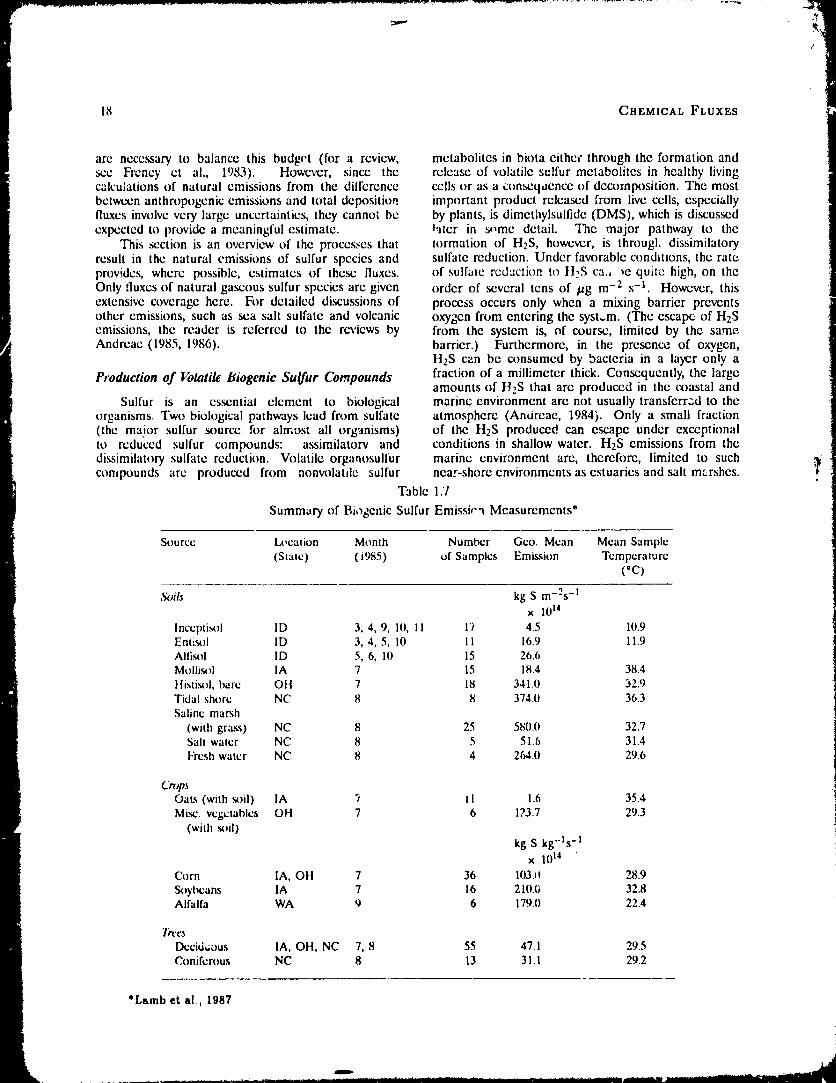
Summary of Biogenic Sulfur Emissi,"_ Measurements*
Source I.x,cation Month Number Geo. Mean Mean Sample(State) ( i9851 of Samples Emission Temperature
(*C)
Soils kg S m-2s -tx 1014
Inceptisol ID 3, 4, 9, 10, 11 17 4.5 10.9Entisol ID 3, 4, 5, 10 I1 16.9 11.9Alli.sol ID 5, 6, 10 15 26.6Molli._l IA 7 15 18.4 38.4Histi_fl, bare OH 7 18 341.0 32.9Tidal shore NC 8 8 374.0 36.3Saline marsh
(with graxs) NC 8 25 580.0 32.7Salt water NC 8 5 51.6 31.4Fresh water NC 8 4 264.0 29.6
C'mp_Oats (with _)il) IA "_ 11 1.6 35.4Mi._. vegetables OH 7 6 123.7 29.3
(with ._il) tkg S kg-ls -I !x 1014
Corn IA, O11 7 36 I03.0 28.9Soylx:ans IA 7 16 2111.6 32.8Alfalfa WA 9 6 179.0 22.4
lh't'._Decide;tins IA, OH, NC 7, 8 55 47.1 29.5Coniferous NC 8 13 31.1 29.2
*Lamb et al., 1987
1990002793-026
KEY ASPECTSOF ,_.PECIES 19
Sulfur Emi_'sionsfrom Continental Ecosystems m-2 s-l, (2.2:1: 0.5)× 10-t4 kg S(CtI3Stt) m-2 S-1
Due to the lack of representative data, estimates and (3.7 + 1.7) × 10-14 kg S(H2S) m -2 s -1. Theseof the flu,'_,of biogenic sulfurgases from terrestrial soils values give a total flux of short-lived sulfur speciesand plantshave been highly uncertain, ranging from 3 of (2.7 + 0.a3) x 10-13 kg S in-2 s-l (Andreae andto 110Tg S yr -1 (Andreae, 1986). Hele, we will focus Andreae, 1988) During the wet seasons, even loweron the e.sults cf recent measurements of emissions values were observed. However, due to the smallfrom freshwater wetlands, inland soils, and terrestria! number of measurements and sites involved, our abilityplants, to extrapolate from these data is very limited.
The concentrations of dissolved volatile sulfur The emission of sulfur gases from vegetation,compounds in freshwater bodies tend to be much including trees, is well established. The emissionlower than those in the surface layer of the oceans of H2S from leaves is light-dependent; it increases(Adams et ai., 1981; Froelich et al., 1985; Iverson strongly with the intensity of light and drops to veryet al., 1989). However, based on measurements of low values in the absence of light (Wilson et al., 1978;DMS concentrations in water from freshwater wetlands Filner et al., 1984). Emission of H2S also increasesin Ontario, Nriagu et al. (1987) recently proposed a as a result of root injury, high levels of atmosphericDMS emission rate of 2.5 x 10⁻¹² kg S m-2 s-t for SO2, and increased levels of soil water sulfate orsuchecosystems and suggested that HzS emissions of bisulfite. Based on studies with various crop plants,a similar magnitude may be occurring. These fluxes Filner et al. (1984) estimated a wor!dwide emissionmay, however, be overestimated, sinc_ the exchange of volatile sulfur from plants on the order of 7.4 Tgcoefficient appropriate for the hydrodynamic regime yr-1, whereas Winner et al. (1981) estimate ,,,50 Tgof the bog is not known and a rather high value was yr-1. Adjusting these values to the leaf areas andassumed. It is also likely that very high sulfate loading biomass values characteristic of tropical forests, fluxesfrom anthropogenic pollution may have enhanced of about 2.7 x 10 -12 to 27 x 10 -12 kg S m-2 s-1 ,)sulfur flux from these wetlands. Recent studies in can be predicted. Filner et al. (1984) also report theAlaska suggest extremely low emissions of volatile emission of CH3SH by plants under some conditions.sulfur from bog and tundra ecosystems (Martens, The emission of DMS from trees was observed bypersonal communication, 1988). Lovelock et al. (1972); a flux of 5 x 10-13 to 10-lt kg S
Adams et al. (1981) determined the flux of sullur m-2 s-1 is estimated from their data for a forest with aga_s from soils in the eastern and southeasternUnited States. Their flux data showed several orders leaf mass of ,_2 kg (d,y weight) m-2. In a recent studyof magnitude variability between sites and between on sulfur gas em_ssiois from plants and soils, Lambsampling periods at the same site; for nonsaline soils, et al. (1987b) found emission fluxes in the range ofthey ranged from 6.6 x 10⁻¹⁴ to 1.1 × 10-lt kg S m-2 10-13 to 10-12 kg S m-2 s-1 from various crops andtrees. The mean sulfur flux from deciduous trees wass-l. Most of the fluxfrom inland soils was in the form 5 x 10-13 kg S m-2 s-1 during summer conditionsof H2S (66%); the rest was COS (13%), CS2 (13%), (mean sample temperature: 29.5'C). Emissions fromDMS (7%), and a trace of DMDS (2%). Delmas et al. soybeans and corn were dominated by DMS, while(1980) measured an average H2S flux of 2.2 x 10⁻¹² deciduous trees emitted similar amounts of H2S andkg S m-2 s-1 from oxic lawn soils in France. Jaeschke DMS. These fluxes are comparable to or greater thanet at. (1980) found fluxes of H2S between 3.3 x 10⁻¹⁴ the sulfur gas emission fluxes that have been reportedand 3.3 x 10⁻¹¹ kg S m-2 s-1 from marshland soils from vegetated inland soils.in the Ems River regi,m of northern Germany. Much Comparison of the emissions of COS from barehigher fluxqswere estimated from tropical soils in the and vegetated soils showed that the vegetation canopyIvory Coast by Dclmas et al. (1980): 9.7 x 10⁻¹² to was a sink for this gas, reducing the flux of COS from2.8 x 10 -11 kg S m-2 s-t. soils to the atmosphere (Goidan et al., 1987; Fall ct
Most recent studies have found much lower flux al., 1988). The uptake of COS by vegetation has bccnestimates from soils. In a large study of soil emissions proposed as the major global sink for this compoundconducted partly at the same sites as those used (Brown and Bcll, 1986).by Adams and coworkers, values about ten times The fuxes of DMS, HES, and CH3SH fromlower than those reported previously were obtained the soil/plant system of the Amazon forest wereby Goldan et al. (1987) and Lamb et al. (1987b) determined during tbq 1985 dry season by a(Table 1.7). The differences between these values gradient/flux technique (Andreae and Andreae, 1988).and those reported prcviot,sly are belie,,ed to be The mean fluxes were4.2x 10 -13 and 2.2x lC 13kgSdue largely to experimental problems in the older m-2 s-1 for DMS and CH3SH respectively (Andreaestudies. Preliminary results from measurements of seil et al., 1989a). Since these fluxes are much larger thanemissions in wet tropical forests in Brazil during the the observed soil Iluxes, most of the sulfur emissionsdry season as follows: (2.2d: 0.2) x 10-13 kg S(DMS) must come from the plant canopy. In the case of DMS,
...... __ 1' ,lalllli ........................................... _'lir ......... i ..... Ill ............................
1990002793-027
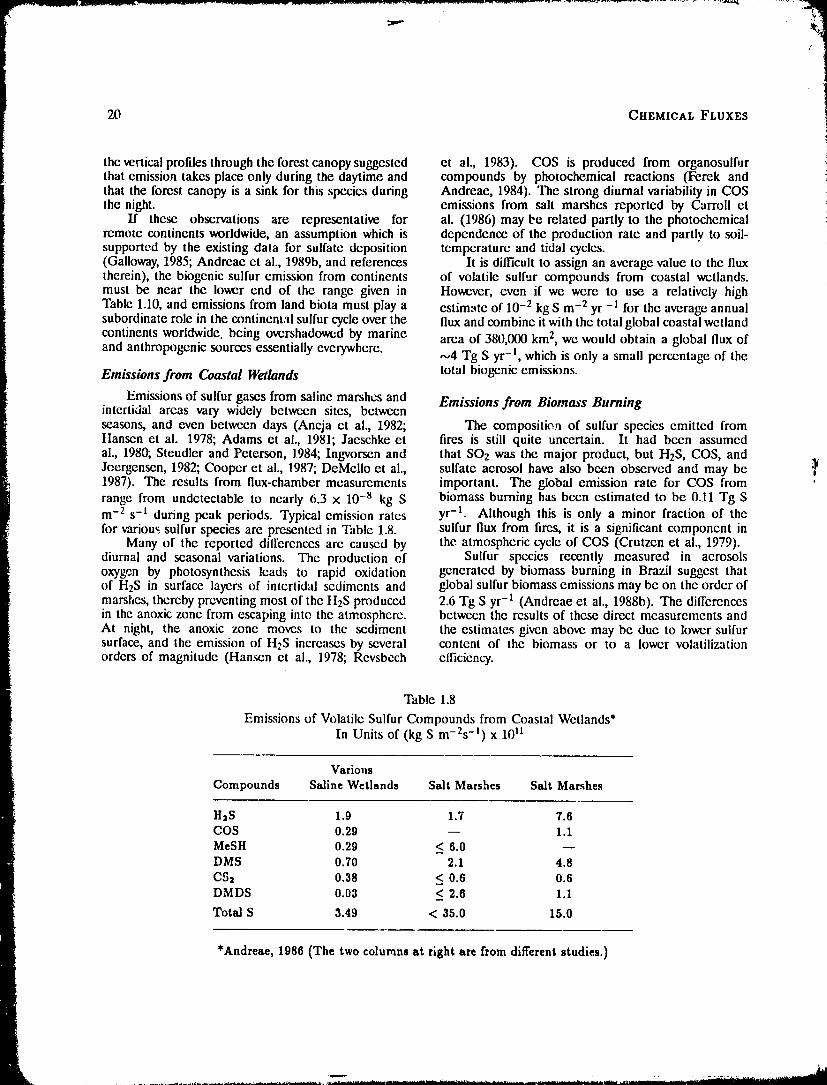
20 CHEMICAL FLUXES i
the vertical profiles through the forest canopy suggested et al., 1983). COS is produced from organosulfurthat emission takes place only during the daytime and compounds by photochemical reactions (Ferek and ithat the forest canopy is a sink for this species during Andreae, 1984). The strong diurnal variability in COSthe night, emissions from salt marshes reported by Carroll et
If these observations are representative for al. (1986) may be related partly to the photochemical :iremote continents worldwide, an assumption which is dependence of the production rate and partly to soil-supported by the existing data for sulfate deposition temperature and tidal cycles.(Galloway, 1985; Andreae et al., 1989b, and references It is dilGcult to assign an average value to the fluxtherein), the biogenic sulfur emission from continents of volatile sulfur compounds from coastal wetlands.must be near the lower end of the range given in However, even if we were to use a relatively highTable 1.10, and emissions from land biota must play a estimate of 10-2 kg S m -2 yr -1 for the average annualsubordinate role in the continental sulfur cycle over the flux and combine it with the total global coastal wetland
continents worldwide, being overshadowed by marine area of 380,000 km 2, we would obtain a global flux ofand anthropogenic sources essentially everywhere. ,-.,4 Tg S yr-1, which is only a small percentage of the
Emissions from Coastal Wetlands total biogenic emissions.
Emissions of sulfur gases from saline marshes and Emissions from Biomass Burningintertidal areas vary widely between sites, betweenseasons, and even between days (Aneja et al., 1982; The composition of sulfur species emitted fromHansen et al. 1978; Adams et al., 1981; Jaeschke et fires is still quite uncertain. It had been assumedal., 1980; Steudler and Peterson, 1984; Ingvorsen and that SO2 was the major product, but HzS, COS, andJoergensen, 1982; Cooper et al., :1987; DeMello et al., sulfate aerosol have also been observed and may be _1987). The results from flux-chamber measurements important. The global emission rate for COS from
range from undetectable to nearly 6.3 x 10⁻⁸ kg S biomass burning has been estimated to be 0.I1 Tg Sm -2 s -l during peak periods. Typical emission rates yr -1. Although this is only a minor fraction of thefor various sulfur species are presented in "Ihble 1.8. sulfur flux from fires, it is a significant component in
Many of the reported dilrerenccs are caused by the atmospheric cycle of COS (Crutzen et al., 1979).diurnal and seasonal variations. The production of Sulfur species recently measured in aerosolsoxyg,zn by photosynthesis leads to rapid oxidation generated by biomass burning in Brazil suggest thatof H2S in surface layers of intertidal sediments and global sulfur biomass emissions may be on the order ofmarshes, thereby preventing most of the H2S produced 2.6 Tg S yr -t (Andreae et ai., 1988b). The differencesin the anoxic zone from escaping into the atmosphere, between the results of these direct measurements andAt night, the anoxic zone moves to the sediment the estimates given above may be due to lower sulfursurface, and the emission of H2S increases by several content of the biomass or to a lower volatilizationorders of magnitude (Hansen et al., 1978; Revsbech efficiency.
Table 1.8
Emissions of Volatile Sulfur Compounds from Coastal Wetlands*In Units of (kg S m-2s -l) x l0 II
Various
Compounds SalineWetlands SaltMarshes SaltMarshes
H2S 1.9 1.7 7.6
COS 0.29 -- 1.1MeSH 0.29 < 6.0
DMS 0.70 2.1 4.8
CS2 0.38 < 0.6 0.6DMDS 0.03 < 2.6 1.1
Total S 3.49 < 35.0 15.0
*Andreae,1986(Thetwo columnsatrightarefromdifferentstudies.)
.... _....... _ i̧ - ,=:r=_ .............i,_,'*.... _
1990002793-028
KEY ASPECTS OF SPECIES 21
Emissions of Volatile Sulfur Species from the Oceans to the global flux as those from localized "hot spots"of high productivity, e.g., upwelling areas.Bingemer (1984) has made the only measurements
of sulfur gas flux from seawater in a chamber system Based on a large data set from a wNe varietyat zero wind speed using the DMS naturally present of oceanic biogeographical zones, And:....: and
Raemdonck (1983) have calculated an average DMSin seawater. For DMS concentratio,as of 4 x 10-a concentration for each zone and a global sea-to-to 9 x 10 -7 kg S(DMS) m -3, he found fluxes thatcompare reasonably well with the predictions from air flux of ,-,40 Tg S yr -1. This estimate istheory. For other gases, however, we have to rely subject to an uncertainty of about -t-20 Tg, most
: entirely on extrapolations based on relatively poorly of which derives from the uncertainties involved indeveloped theories. The uncertainties involved in using the "stagnant film" model to estimate air-seaestimating transfer fluxes with this approach introduce transfer. Other researchers have recently publisheda potential error of as high as a factor of two into the comparable flux estimates based on geographicallyestimates of oceanic sources of most species, limited concentration data sets (Ngayen et al., 1984;
Alternative methods to measure the flux (e.g., Bingemer, 1984; Ciine and Bates, 1983).eddy correlation or gradient techniques)are difficult. To verify these estimates, it is important toNo fast-response sulfur gas sensors suitable for eddy- find independent checks on the flux of DMScorrelation measurements are yet available for any from the oceans. DMS concentrations of 100 tosulfur gas in the remote atmosphere. Nguyen et 300 pptv (2.8 x 10-l° to 8.4 x 10⁻¹° kg DMSal. (1984) have used the gradient method onboard m -3 STP) arc consistently found from a numbership by taking samples at different levels above the of measurements in remote marine atmosphereswaterline. Although the results are comparable to (Andreae and Raemdonck, 1983; Andreae et al., 1985).the predictions from gas-transfer calculations, they may These concentrations are consistent with the measuredcontain substantial errors because of the influence of reaction rate of DMS with OH and a sea-to-air flux _'the ship on airflow charac,cristics. Since a realistic of the same magnitude as estimated above (Graedel, _wave climate is difficult to simulate inside an enclosure, 1979; Chatfield and Crntzen, 1984).
sulfur-gas fluxes across me air/sea interface have not Cencentrations of one to a few x 10-9 kg S(COS)been measured by this technique. Therefore, in the m -3 of COS are found in surface seawater (Rasmussenfollowing diseussion of the fluxes of individual sulfur et al., 1982; Ferek and Andreae, 1984; Turner and Liss,species, predictions are made using the transfer model, 1985). Since observed concentrations are almost alwayswhich uses gas concentrations measured in s._awater higher than the equilibrium concentration relative toand boundary-layer air. the overlying atmosl_here, a net sea-to-air flux exists
In open ocean waters, DMS is the predominant essentially across the entire ocean surface. Usingvolatile sulfur compound (Barnard et al., 1982; samples collected without considering the diurnal cycleAndreae et al., 1983; Andreae and Barnard, 1984; and only separated into coastal and open-ocean values,Nguyen et al., 1984; Clir,c and Bates, 19R3; Bingcmer, Rasmus_n et al. (1982) estimate a global COS flux
1984). Although other compounds, especially CS2 from the oceans of 0.3 Tg S yr-1. Based largelyand CH3SH, may also be present in coastal waters on coastal data and interpolation from an observed(Turner and Liss, 1985), their limited distribution relationship of DMS and COS. Ferck and Andrcaeand relatively low concentrations allow for onlyminor contributions to the global atmospheric sulfur (1984) estimate a global flux of 0.5 Tg S yr -I.budget. DMS is produced near the ocean surface Carbon disulfide in seawater was first foundby phytoplankton from an intracellular biochemical by Lovelock (1974), who measured an averageprecursor, dimethylsulhmium propionate, concentration of 4.4 x 10⁻¹° kg S(CS2) m -3 in 35
The analysis of large data sets and of the vertical samples taken from the open Atlantic. Inshore valuesdistribution of DMS in the marine water column clearly were about an order of magnitude higher. Recentshow that the DMS concentration in seawater is related measurements by Kim and Andreae (1987) have been
to the abundance of phytoplankton. Nevertheless, a used to estimate an oceanic CS2 flux of 0.2 Tg S yr -1,direct correlation between total plankton abundance which is small relative to the oceanic DMS flux.and DMS corcentration within a given region has Although H2S, CH3SH, and DMDS have occasion-not yet been es_.ablished because of the substantial ally been reported, their concentrations appear to bedifferences in the DMS output rate of different insignificant relative to other oceanic sulfur emissions.plankton species (Andreae et al., 1983; Barnard et A recent report of sulfur-containing amino acids inal., 1982). As Table 1.9 shows, when emissions of the marine boundary layer (Mopper and Zika, 1987)DMS from different marine biogeographic regions are indicates that they and their atmospheric oxidationcompared, emissions from large oceanic regions of products could be another significant source of sulfurrelatively low productivity appear to be as important over the oceans.
1990002793-029
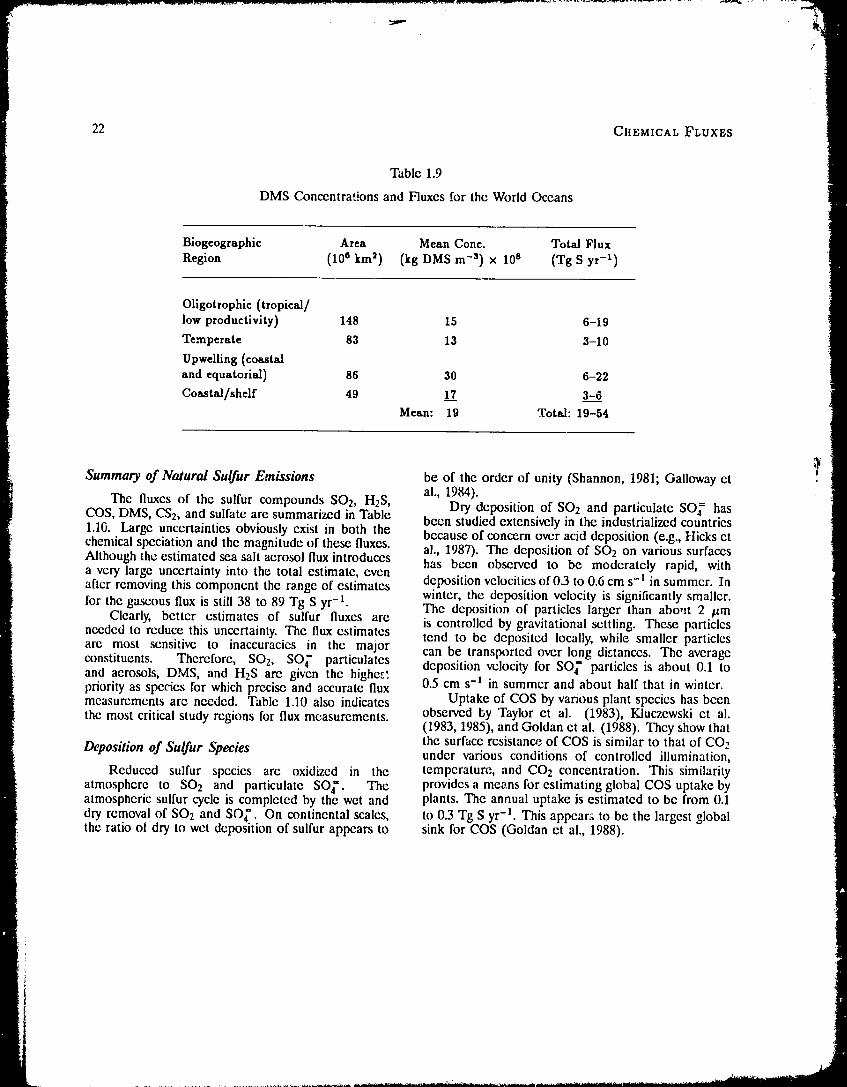
22 CHEMICAL FLUXES
Table 1.9
DMS Concentrations and Fluxes for the World Oceans
Biogeographie Area Mean Cone. Total Flux
Region (10e km=) (kg DMS m -s) × l0 s (Tg S yr -x)
Oligotrophie (tropical/low productivity) 148 15 6-19
Temperate 83 13 3-10
Upwelling (coastaland equatorial) 86 30 6-22
Coastal/shelf 49 1..].7 3-6 ]Mean: 19 Total: 19-54
1
5'Summary of Natural Sulfur Emissions be of the order of unity (Shannon, 1981; Galloway et m
The fluxes of the sulfur compounds SO2, H2S, al., 1984). ]Dry deposition of SO2 and particulate SO 4 has
COS, DMS, CS2, and sulfate are summarized in Table been studied extensively in the industrialized countries !1.10. Large uncertainties obviously exist in both the because of concern over acid deposition (e.g., Hicks etchemical speciation and the magnitude of these fluxes, al., 1987). The deposition of SO2 on various surfacesAlthough the estimated sea salt aerosol flux introduces has been observed to be moderately rapid, witha very large uncertainty into the total estimate, evenafter removing this component the range of estimates deposition velocities of 0.3 to 0.6 cm s-1 in summer. In
winter, the deposition velocity is significantly smaller.for the gaseous flux is still 38 to 89 Tg S yr -1. The deposition of particles larger than abo,_t 2 pm
Clearly, better estimates of sulfur fluxes are is controlled by gravitational settling. These particlesneeded to reduce this uncertainty. The flux estimates tend to be deposited locally, while smaller particlesare most sensitive to inaccuracies in the major can be transported over long dktances. The averageconstituents. Therefore, SO2, SO_" particulates deposition velocity for SO_" particles is about 0.1 toand aerosols, DMS, and H2S are given the higher.",'priority as species for which precise and accurate flux 0.5 cm s-1 in summer and about half that in winter.measurements are needed. Table 1.10 also indicates Uptake of COS by various plant species has beenthe most critical study regions for flux measurements, observed by Taylor et al. (1983), Kluczewski et al.
(1983, 1985), and Goldan et al. (1988). They show that
Deposition of Sulfur Species the surface resistan_ of COS is similar to that of CO2under various conditions of controlled illumination,
Reduced sulfur species are oxidized in the temperature, and CO 2 concentration. This similarityatmosphere to SO2 and particulate SO_'. The provides a means for estimating global COS uptake byatmospheric sulfur cycle is completed by the wet and plants. The annual uptake is estimated to be from 0.1dry removal of SO2 and SO_'. On continental scales, to 0.3 Tg S yr-l. This appear_ to be the largest globalthe ratio ot dry to wet deposition of sulfur appears to sink for COS (Goldan et al., 1988).
1990002793-030
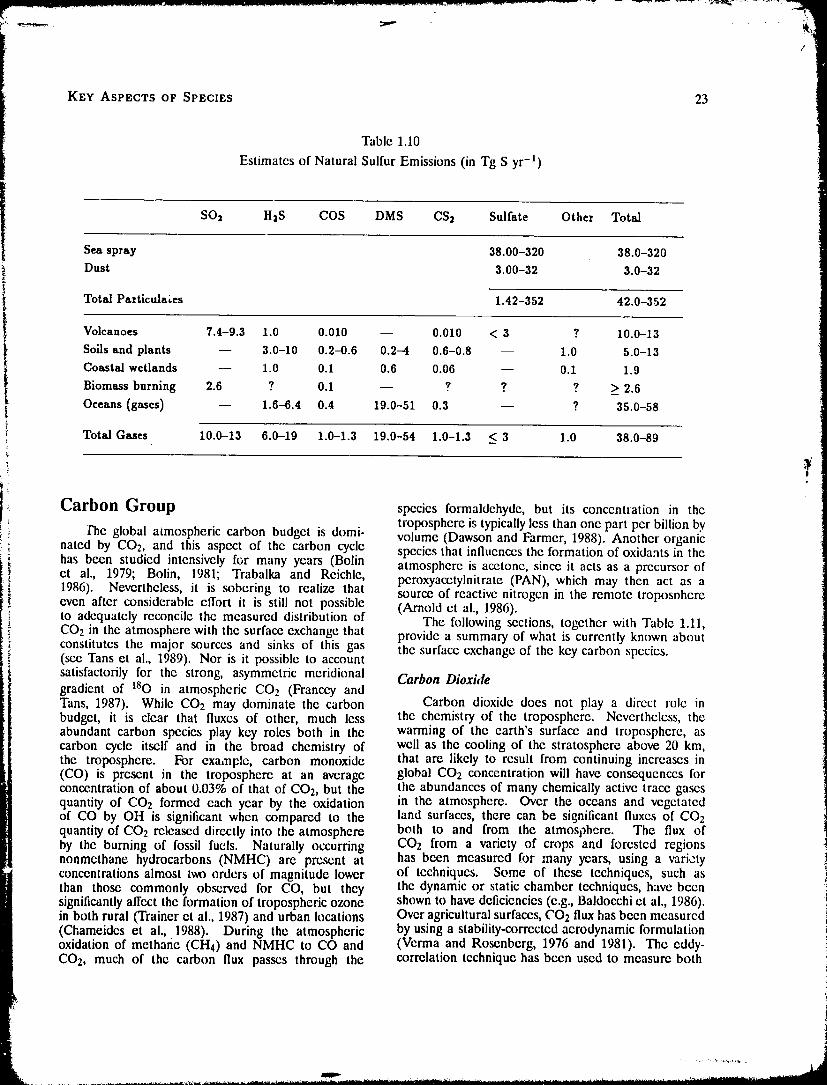
/
KEY ASPECTS OF SPECIES 23
Table 1.10
Estimates of Natural Sulfur Emissions (in Tg S yr-1)
SO2 H2S COS DMS CS_ Sulfate Other Total
Sea spray 38.00-320 38.0-320
! Dust 3.00-32 3.0-32F
Total Particulates 1.42-352 42.0-352
Volcanoes 7.4-9.3 1.0 0.010 -- 0.010 < 3 ? 10.0-13
i Soils and plants -- 3.0-10 0.2-0.6 0.2-4 0.6-0.8 -- 1.0 5.0-13Coastal wetlands -- 1.0 0.1 0.6 0.06 -- 0.1 1.9
Biomass burning 2.6 ? 0.1 -- ? ? ? > 2.6
I Oceans (gases) -- 1.6-6.4 0.4 19.0-51 0.3 -- ? 35.0-58
Total Gases 10.0-13 6.0-19 1.0-1.3 19.0-54 1.0-1.3 < 3 1.0 38.0-89!
it t
i l Carbon Group species formaldehyde, but its conccntration in thetroposphere is typicallyless than one part per billion by
, _ De global atmospheric carbon budget is domi- volume (Dawson and Farmer, 1988). Another organici hated by CO2, and this aspect of the carbon cycle species that influences the formation of oxidants in the
has been studied intensively for many years (Bolin atmosphere is acetone, since it acts as a precursor ofet al., 1979; Bolin, 1981; Trabaika and Reichle, peroxyacctylnitrate (PAN), which may then act as a1986). Nevertheless, it is sobering to realize that source of reactive nitrogen in the remote troposphereeven after considerable effort it is still not possible (Arnold et al., 1986).to adequately reconcile the measured distribution of The following sections, together with Table 1.11,
._ CO2 in the atmosphere with the surface exchange that provide a summary of what is currently known aboutconstitutes the major sources and sinks of this gas the surface exchange of the key carbon species.(see Tans et al., 1989). Nor is it possible to account
satisfactorily for the strong, asymmetric meridional Carbon Dioxidegradient of 180 in atmospheric CO2 (Francey andTans, 1987). While CO2 may dominate the carbon Carbon dioxide does not play a dircct role inbudget, it is clear that fluxes of other, much less the chemistry of the troposphere. Nevertheless, theabundant carbon species play key roles both in the warming of the earth's surface and troposphere, ascarbon cycle itself and in the broad chemistry of well as the cooling of the stratosphere above 20 km,the troposphere. For example, carbon monoxide that are likely to result from continuing increases in(CO) is present in the troposphere at an average global CO2 concentration will have consequences forconcentration of about 0.03% of that of CO2, but the the abundances of many chemically active trace gasesquantity of CO2 formed each year by the oxidation in the atmosphere. Over the oceans and vegetatedof CO by OH is significant when compared to the land surfaces, there can be significant fluxes of CO2quantity of CO2 released directly into the atmosphere both to and from the atmosphere. The flux ofby the burning of fossil fuels. Naturally occurring CO2 from a variety of crops and forested regionsnonmethane hydrocarbons (NMHC) are present at has been measured for many years, using a varietyconcentrations almost I.woorders of magnitude lower of techniques. Some of these techniques, such as ithan those commonly observed h)r CO, but they the dynamic or static chamber techniques, have beensignificantlyaffect the formation of tropospheric ozone shown to have deficiencies (e.g., Baldocchi et al., 1986). !in both rural (Trainer et al., 1987) and urban locations Over agricultural surfaces, CO2 flux has been measurcd !(Chameides et a1.,.1988). During the atmospheric by using a stability-corrected aerodynamic formulation !oxidation of methane (CH4) and NMHC to CO and (Verma and Rosenberg, 1976 and 1981). The eddy- t
CO2, much of the carbon flux passes through the correlation technique has been used to measure both _i
_J
"1990002793-03"1
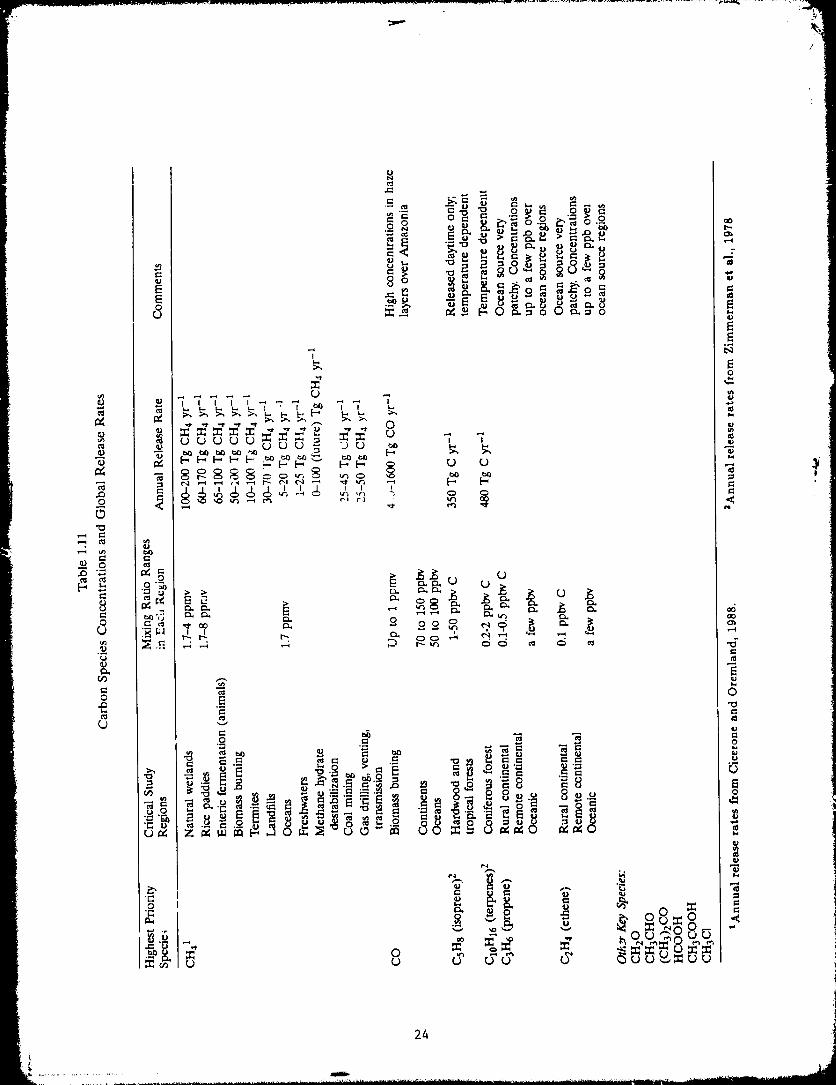
/
24
1990002793-032
the CO, emission from the floor of a deciduous forest compiling global invcntories of the sources and sinks of(Baldocchi et al., 1986), and the CO2 flux above the atmospheric methane. Over the past decade there haveforest canopy (Vcrma et al., 1986). Eddy-correlation been several attempts to understand the global budgetmeasurements of C02 flux from an aircraft have of methane in this way (Ehhalt and Schmidt, 1978;been reported by Desjardins et al. (1982 and 1989). Sheppard et al., 1982; Khalil and Rasmussen, 1983;Micrometeoroiogical techniques have also been used Scilcr, 1984; Blake, 1984; Crutzen, 1987; Bingemer andto measure COz flux over coastal ocean sites (Smith Crutzcn, 1987; Cicerone and Oremland, 1988). Givenand Jones, 1985; Wesely et al., 1982a), but the values the very large unccrtainlies involved in extrapolatingwere significantly largcr than those found by isotopic to the global scale from fluxes measured over areas oftechniques (Broeckcr et al., 1986). The diserepancy perhaps a few square meters, it is not surprising thathas been discussed by Wesely (1986) and Smith and there remain significant disagreements over the relativeJones (1986). Measurements of CO2 concentrations in importaJace of various global sources of methane.conjunction with other trace gases has sometimes beenthe basis for making estimates of the fluxes of these Carbon Monoxidetrace gases, as in the case of biomass burning (Crutzcnct al., 1979; Sciler and Crutzcn, 1980; Crutzen el al., The global atmospheric budget of carbon monox-1985). ide, and its associated uncertainties, have been
thoroughly' discussed (Logan et al., 1981; WMO,1986; Seilcr and Conrad, 1987; Warneck, 1988). As
Methane much as 40% of the global source is attributed toanthropogenic activities, such as the burning of fossil
Fluxes of methane to the atmosphere have been fue!s, agricultural burning, and the clearing of forests.measured or estimated from many known source types: One important feature of the CO budget is thatwetlands (Svensson and Rosswall, 1984; Harriss and
at least 50% of the sources do not involve surface ._Sebacher, 1981; Sebacher et al., 1986), rice paddies exchange of CO itself. Rather, the CO is produced J(Cicerone and Shetter, 1981; Cicerone et al., 1983; in the atmosphere by oxidation of both biogenic andHolzapfeI-Pschorn and Seiler, 1986), animals (Crutzcn anthropogenic hydrocarbons. In addition, perhapset al., 1986), municipal solid waste (Bingemer and 40% of the glt)bal CO production occurs in tropicalCrutzen, 1987), termites (Zimmcrman et al., 1982;
regions (Sachse et al., 1988; Andreae et al., 1988b).Seller et al., 1984; Fraser et ai., 1986b), biomass Manyofthe terms in the global CO budget are notburning (Grccnberg et al., 1984; Crutzcn et al., based upon dirc,ct measurement of CO fluxes. In fact,1985), and fossil fuel utilization (Ehhalt and Schmidt, much of the information we have about the CO budget1978; Crutzen, 1987). Virtually all of the direct flux has been inferred from considerations of gas-phasemeasurements have relied upon some variation of chemistry (l.x_gan et al., 1981), the measurement ofthe enclosure tcchnique. A notable feature of the CO emission factors from various types of combustionresults for wetland environments is the large range (Logan et al., 198_; Crutzen ct al., 1985b; Greenberg et(approximately two orders of magnitude) of measured al., 1984; Andrcae et al., 1988b), and estimates of thefluxes. For a variety of wetland sites in Alaska, production and release of nonmethane hydrocarbonsSebacher ct al. (1986) h_und that the methane fluxes
(Zimmerman et al., 1988). Since the tropics arewere significantly related to the water depth at each thought to be such an important region for COsite. Large variations in methane fluxes have also production, direct measurement of CO fluxes overbeen observed for termites, where the flux is strongly large areas of the tropics would be very desirable. Thedependent upon the species of termite (e.g., Fraser et first set of such measurements was made during theal., 1986b). In some cases fluxes of methane from ABLE-2B flights over the Amazon Basin during thethe atmosphere into the soil have been measured wet season (April-May) of 1987 using airborne eddy-(Keller et al., 1983; Seiler et al., 1984). More recently, correlation techniques.fluxes of methane were measured with eddy-correlation The dominant sink mechaltism for CO is oxidation
techniques during the ABLE-3A experiment held in to CO2 by the hydroxyl radio' _ccounting for aboutthe Alaskan Arctic during July-August 1988. A fast- 90% of the total. The remainct_., i_ 'hought to be lostresponse methane sensor based upon the use of ahelium-neon gas laser (Kolb et al., 1986) was used for by uptake in soils.
flux measurements from an instrumented W. 'or, while Nonmethane Hydrocarbonsanother fast-response _nsor using a tun;_ble diodelaser (Sachse et al., 1987a,b) was used on board the It is now clear that the global flux of carbonNASA Electra to measure fluxes over large expanses into the atmosphere as nonmethane hydrocarbonsof tundra. (NMHCs) greatly exceeds the flux of carbon as CH4.
In many cases the methane fluxes have an intrinsic This flux is dominated by the release of biogenicinterest, but usually the fluxcs are extrapolated to NMHCs from vegetation, principally trees. The mostthe regional or global scale for the purpose of important of these biogenic NMHCs are isoprene
1990002793-033
.!
26 CHEMICAL FLUXES
(CsHs) and the monotcrpcncs (C10HI6) such as a- al., 1986). The three methods give good agreemcnt inpinene. In some tree species, such as pines and firs, measuring isoprene emission rates (Lamb et al., 1986).the primary NMHCs emitted are the monoterpcnes, The principal sink for atmospheric NMIICs iswhile in other species (e.g., oaks and aspens) the oxidation by the hydroxyl radical. Oxidation by speciesprimary NMHC product ix i_prene. Some species, such as ozone and by the gaseous nitrate radical (NO3)such as spruce and eucalyptus, produce both isoprene during the night does occur but constitutes a smallerand monotcrpcnes (Rasmussen, 1981). Zimmerman sink (Winer et al., 1984). The reaction betweenet al. (1988) estimated that in the Amazon forest, isoprene and the hydroxyl radical is so rapid that duringisoprene accounted for approximately 20% of the the daytime in the mixed layer over a tropical forest,gas-phase carbon of the NMHCs and that isoprene isoprene controls the concentration of hydroxyl radicalsemissions were equivalent to approximately 2% of the (Jacob and Wofsy, 1988). Such oxidation of NMHCsnet primary productivity of the h)rest (the net amount leads to the formation of a variety of oxygenatedof carbon lixcd during photosynthesis). The global substances such as aldehydes, organic acids, ketones,annual release of isoprene from vegetation has been and organic nitrates (Lloyd et al., 1983; Kamens et al.,estimated as 450 Tg, with almost half of this total 1982), which may undergo further rapid reactitms tocoming from tropical forests (Rasmussen and Khalil, eventually produce carbon monoxide. Such oxidation1988). of isoprene and other NMHCs over tropical forests
There have been relatively few attempts to has been observed to cause significant increases in themeasure fluxes of NMHCs into the atmosphere from CO levels in the boundary layer (Gregory et al., 1986;the world's oceans. The available measurements Zimmerman et al., 1988). Oxidation of NMHCs canindicate that the fluxes are small relative to those seen also lead to the formation of particulate matter.
from land vegetation. Bonsang et al. (1988) have Direct deposition of NMHCs to the surface mayestimated an annual global release from the oceans to also occur, but it probably provides a relatively smallthe atmosphere of 5.2 Tg (as carbon) of the C2 to C6 sink compared to oxidation. The effectiveness of wetalkanes and aikenes, deposition for any particular species would depend
The total annual emission into the atmosphere of upon its solubility in water as well as the pH of thebiogcnic NMHCs from the contiguous United States precipitation droplets.has been estimated as 31 Tg, with an uncertainty of a
factor of three (Lamb et al., 1987a). By contrast, these Organicsauthors estimate the anthropogcnic NMHCs releasedfrom the U.S. in 1983 as 18 Tg. There is a strong The species included in this category are thoseseasonal and regional dependence of the biogenic carbon-containing compounds (both vapor phase andemissions, with over half of the U.S. total occurring particulate) other than CH4, CO, the NMHCs, andin the three summer months and approximately half the entirely man-made chlorofluorocarbons. Relativelythe U.S. total coming from the southeastern and little is known about this class of compounds in thesouthx_rcstern regions of the country (Lamb et al., atmosphere. For an extensive survey of the literature1987a). The total anthropogenic NMHC emissions in on the subject, the reader is referred to Duce et al.the U.S. are lower than the biogenic emissions; the (1983). In this section we will concentrate on thoseanthropogcnic releases occur principally from urban areas where there have been recent advances in ourand industrial locations, which account for about 3% understanding.of the total land area, correspoading to areal fluxes Formic acid and acetic acid are known toabout 20 times larger than tho_ for biogenic source contribute to the acidity of precipitation, particularly inregions (Lamb ct al., 1987a). areas remote from significant anthropogenic influences
A variety of methods has been used to measure (Keene and Galloway, 1988). Recent measurementsdirectly the lluxes of biogenic NMHCs. Some by several investigators have greatly improved ourdata are from measurements on live plants in a understanding of the sources of these acids. Vaporlaboratory environment (Tinge),, 1981), but most phase concentrations of these acids typically rangereported fluxes are from measurements made in the from less than 1 ppb to a few ppb (Dawson et al.,,,eld. The laboratory measurements showed that higher 1980; Talbot et al., 1988; Andreae et al., 1988a). Ittemperatures increase the release of both isoprene and is known that both acids are emitted from burningmonoterpenes. Isoprene emissions occur only during biomass and from motor vehicle exhausts (Talbot etdaylight, with an increasing emission rate as the light al., 1988). Formic acid is produced by the oxidationintensity is increased. Monoterpenc emissions do not of isoprene, while acetic acid is not (Jacob and Wofsy,vary with light intensity (Tinge),, 1981). Field methods 1988). It is likely that both acids are also emittedwhich have been used are an enclosure technique directly from vegetation (Oraedel et al., 1986). Over(Zimmcrman, 1979a and b), a micrometeorological the Amazon Basin, Andreae et al. (1988a) showed thatapproach (Knoerr and Mowry, 1981; Lamb et al., over 98% of the total formic acid and over 99% of the1985), and an atmospheric tracer technique (Lamb et total acetic acid are present in the gas phase, with
1990002793-034
KEY ASPECTS OF SPECIES 2,'/
very small amounts present as aerosol. They found sulfur, and hydrocarbon group species for which surfacethe highest concentrations of aerosol formate and exchange needs to be studied. For each of the threeacetate in haze layers associated with biomass burning, groups the species are ranked into two priorities--At a site in eastern Virginia, Talbot ct al. (1988) highest priority species and other key species. Thealso found both organic acids almost completely (> critical regions for study are listed for each species.98%) in the gas phase, and that there were significant Although not specified, it is obvious that measurementsseasonal variations in the acid concentrations. The of temporal variations of the fluxes are essential,
current knowledge of formic and acetic acids in the especially when surface exchange is related to biogenictroposphere has recently been reviewed by Keene and processes.Galloway (1988). Typical mixing ratio ranges in each region are
listed as a guide for the required instrumental
Research Needs sensitivity and dynamic ranges. Also included are theexpected ranges of surface flux or surface deposition
Based on the above discussion, we list in Tables velocity. In certain cases, surface resistance instead of1.1i, 1.12, and 1.13 the important nitrogen and ozone, deposition velocity is listed.
1990002793-035
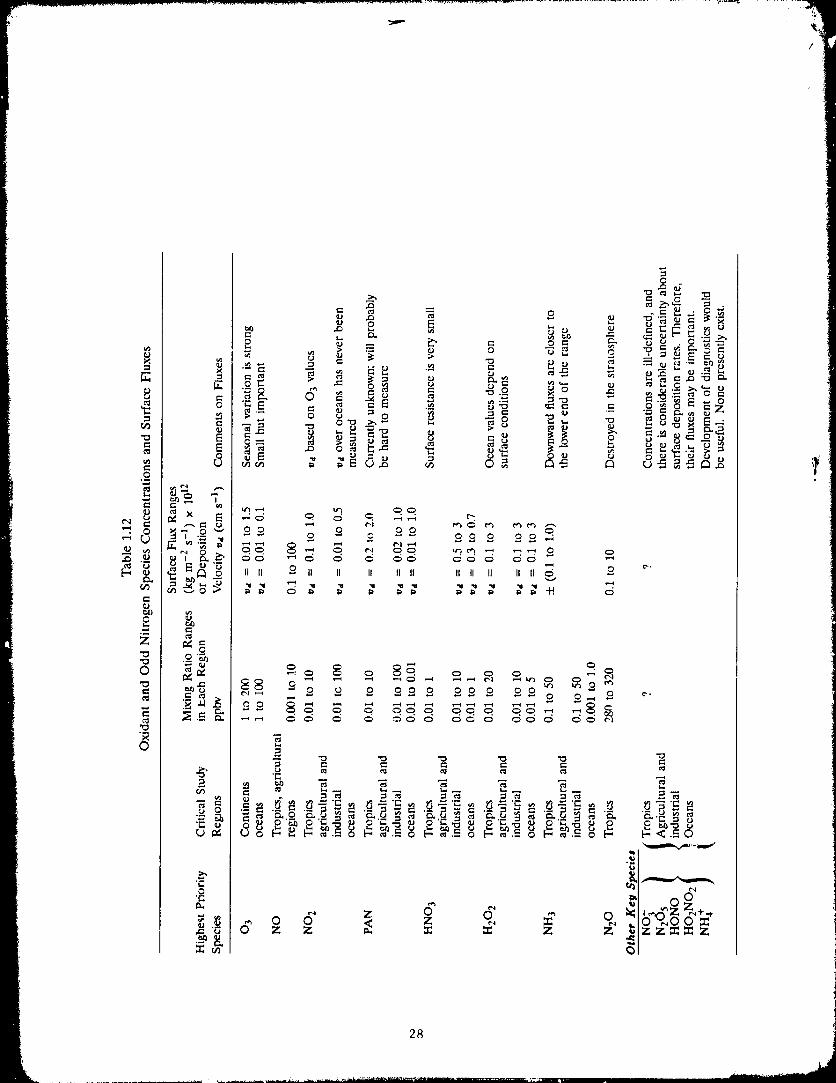
/
28
1990002793-036
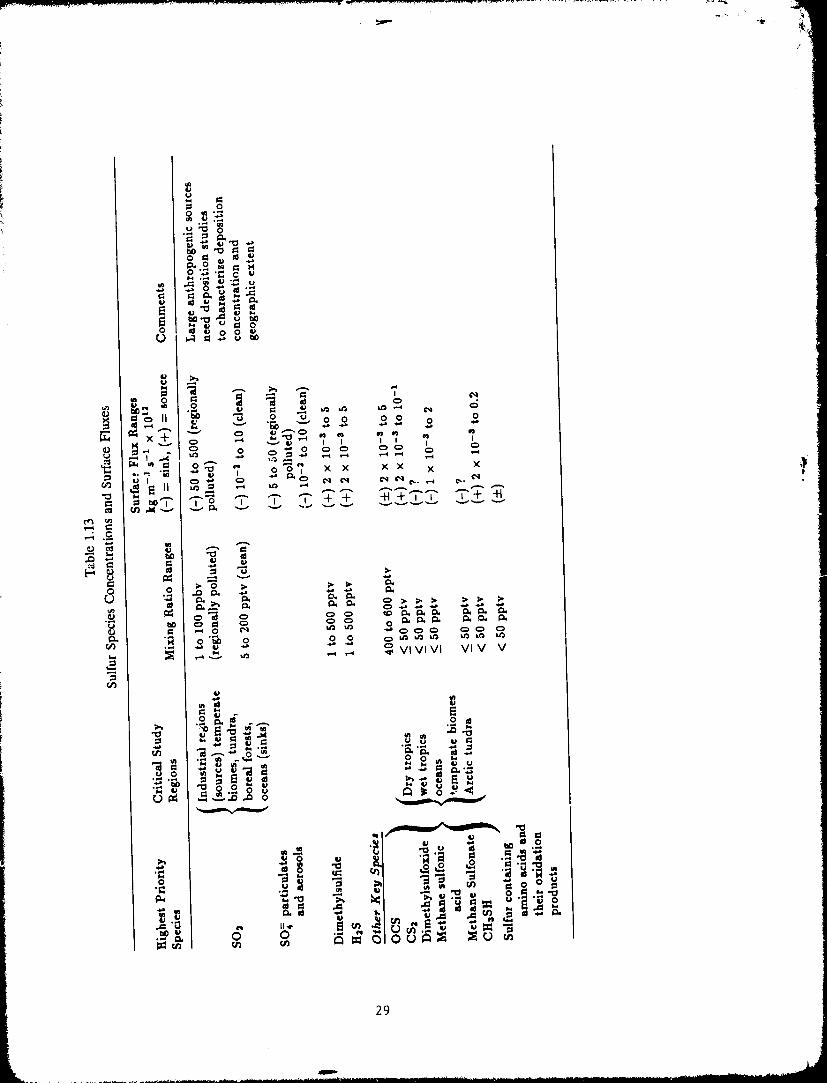
oo m'_
°_ _
o'_._ c _.=• _'_ ._
i _opg
29
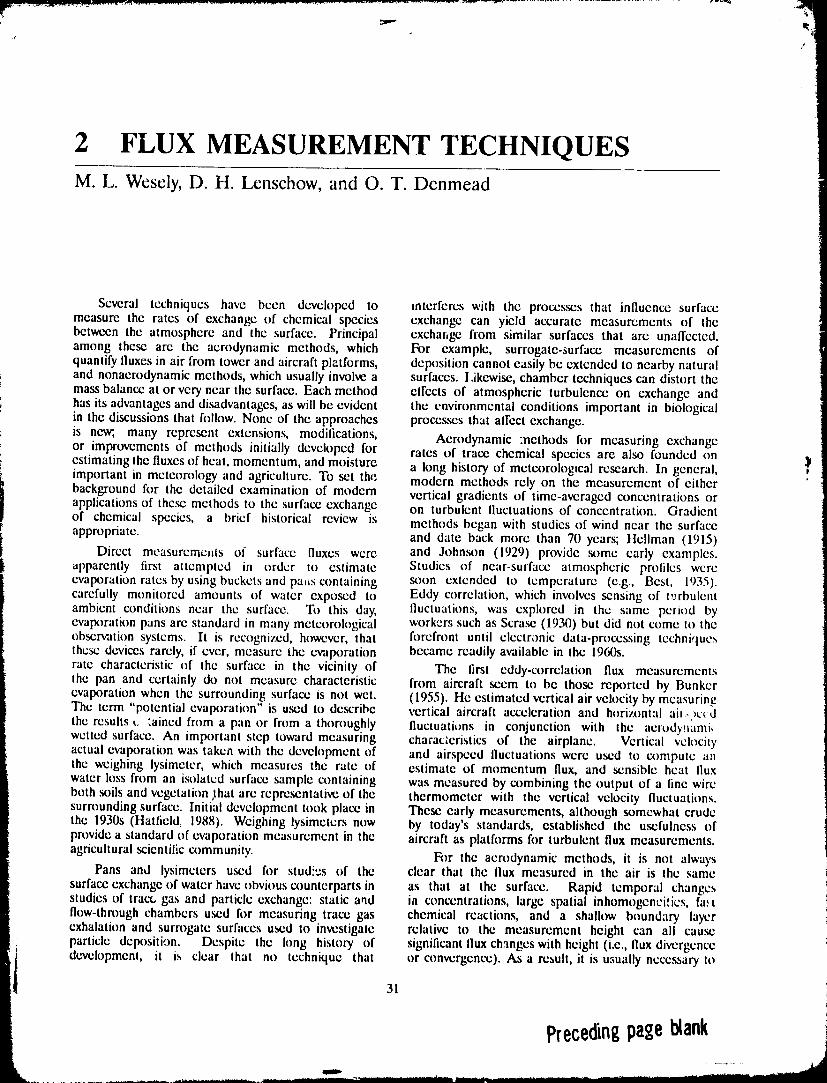
/
2 FLUX MEASUREMENT TECHNIQUESM. L. Wescly, D. H. Lcnschow, and O. T. Dcnmead
Several techniques have been developed to interferes with the processes that influence surfacemeasure the rates of exchange of chemical species exchange can yield accurate measurements of thebetween the atmosphere and the surface. Principal exchange from similar surfaces that are unaffected.among these arc the aerodynamic methods, which For example, surrogate-surface mcasuremcnts ofquantify fluxes in air from tower and aircraft platforms, deposition cannot easily be extended to nearby naturaland nonaerodynamic methods, which usually involve a surfaces. I,ikcwise, chamber techniques can distort themass balance at or very near the surface. Each method cil'ects of atmospheric turbulence on exchange andhas its advantages and disadvantages, as will be evident the environmental conditions important in biologicalin the discussions that follow. None of the approaches processes that affect exchange.
is new; many represent extensions, modifications, Aerodynamic :ncthods for measuring exchangeor improvements of mcthods initially developed for rates of trace chcmical species are also foundcd onestimating the fluxes of heat, momentum, and moisture a long history of meteorological research. In general, ]Jimportant in meteorology and agriculture. To set the modern methods rely on the measurement of eitherbackground for the detailed examination of modem vertical gradients of time-averaged concentrations orapplications of the_ mcthods to the surface exchange on turbulent fluctuations of concentration. Gradientof chemical species, a brief historical review ns methods began with studies of wind near the surfaceappropriate, and date back more than 70 years; llellman (1915)
Direct measuremc,ts of surface fluxes were and Johnson (1929) provide some early examples.apparently first attempted in order to estimate Studies of near-surface atmospheric profiles wereevaporation rates by using buckets and pa,s containing soon extended to temperature (e.g., Best, 1935).carefully monitored amounts of water exposed to Eddy correlation, which involves sensing of t,_rbulcntambient conditions near the surface. To this day, lluctuations, was explored in the same period byevaporation pans are standard in many meteorological workers such as Scrase (1930) but did not come to theobservation systems. It is recognized, however, that forefront until electronic data-processing techniquesthese devices rarely, if ever, measure the evaporation became readily available in Ihe 1960s.
rate characteristic of the surface in the vicinity of The first eddy-correlation flux measurementsthe pan and certainly do not measure characteristic from aircraft seem to be those reported by Bunkerevaporation when the surrounding surface is not wet. (1955). He estimated vertical air velocity by measuringThe term "potential evaporation" is used to describe vertical aircraft acceleration and horizontal aiJ.?ctdthe results _. :ained from a pan or from a thoroughly fluctuations in conjunction with the aerody_mmi,wetted surface. An important step toward measuring characleristics of the airplane. Vertical velocityactual evaporation was taken with the development of and airspeed fluctuations were used to compute anthe weighing lysimeter, which measures the rate of estimate of momentum flux, and sensible heat fluxwater loss from an isolated surface sample containing was measured by combining the output of a fine wireboth soils and vegetation that are representative of the thermometer with the vertical velocity fluctuations.surrounding surface. Initial development took place in These early measurements, although somewhat crudethe 1930s (Hatlield, 1988). Weighing lysimetcrs now by today's standards, established the usefulness ofprovide a standard of evaporation measurement in the aircraft as platforms for turbulent flux measurements.
agricultural scientilic cemmunity. For the aerodynamic methods, it is not alwaysPans and lysimcters used h)r stud!es of the clear that the flux measured in the air is the same
surface exchange of water have obvious counterparts in as that at the surface. Rapid temporal changesstudies of tract, gas and particle exchange: static a,ld in concentrations, large spatial inhomogencitics, fa.,tflow-through chambers u_d h)r measuring trace gas chemical reactions, and a shallt_v boundary layerexhalation and surrogate surfaces u_d to investigate relative to the measurement height can all cau_particle depositi,)n. Despite the long history of significant flux changes with height (i.e., flux divergence
i development, it is clear Ihat no technique that or convergence). As a result, it is u_ually necessary to31
Precedingpageblank
1990002793-038
32 CHEMICAL FLUXES
es.timatc or measure the spatial and temporal trcnds in mixing) can be accurately estimated. Extrcmely stablelocal concentrations and wind licld, the characteristic atmospheric conditions or dense vegetative canopiestimes of chemical reactions relative to verticai turbulent can provide the opportunity h)r such mass balancemtxing, and the temporal and spatial variability of studies. Carefully designed dual tracer methodsboundary-layer height, provide another alternative. The sampling strategies
It is often best to use more than one method to must be preci._ly t.ailorcd to the physical conditionsmeasure Iluxes, to powide independent evaluations and of the experiment. Similarly, special tracers can beto a:,_ss errors cau:_d by _me of problems mentioned employed. For example, 222Rn or 22°Rn can, mabove. The following three ._ctions discuss s_me special circumstances, provide information on exchangeof the more promising methods now available, using coclficients for nonreactive gases. Finally, numericaltowers, airplanes, and enc!osurcs. To_:r and aircraft dillusion models can be used to obtain estimatestechniques are discussed separately, bccau_ they of air-surface exchange with rather simple samplingfeud to orovide complementary spatial and temporal strategies, if a small, isolated area of uniform emissionscoverage and their technological requiremerts are or uptake is well defined._mewhat different. Inferential methods of surface exchange are
designed to obtain operational estimates of dryTower-Based Flux Measurement deposition for which standard micromcteorological
Systems methods may bc too dilficult or too expcnsive to applyroutinely. Inferential approaches are nol considered
Tower-based instrumentation systems fi_r measur- here becau_ they are not sulliciently direct; theying air-surface exchange arc well proven, convenient, are, in fact, ba,.,cd on parameterization experimentsand e,:onomical. Measurements at several meters that employ more direct approaches. Surrogate _'above the surface can bc used to quantify the average surfaces may sometimes be appropriate fl)r routinevertical exchange over _veral hundred .square mete:s, measurement of drv deposition but are not consideredalong a path extending _vcral hundred meters upwind hcrc becau_ they do not measure fluxes that arcand with a cross-wind breadth that increa_s with directed upward.distance from the sampling _owcr. This "f, mtprint" Several requirements fl_r micrometeorologicalis not delined preci._ly, causing _me dilliculty when measurements of vertical fluxes should be kept in mind.attempting to evaluate the air-surface exchange above Substantial atmospheric nonstationary or horizontala particular type of surhlce that borders other types advection should be avoided, or the effects should benearby. The measured exchange rate incorporates taken into account by appropriate measm_ments andfluxes to aad fn_m individual plants, surfaces beneath calculations. Flux divergences resulting from changesplant cat.opics, and individual portions of the surface in the mean concentrations, entrainment throughsuch as Icaw._ in a canopy. In summary, the sampling the top of thc PBL, or mesoscale divcrgcncc mayperh_rmcd by tower-based flux mea.,,uring systems is have to be evaluated, or at Icast detected, so thatreprc._ntative of bulk surface properties over an area errors in micrometcorological flux estimates can bethat depends on the height of the measurements, identilied. IA_r substances that undergo very rapid
Many tower-based methods of measuring the chemical reactions in air, measurements must be takenair-_,t,[facc exchange of trace substances have bccn sufficiently close to the surface that the resultingreviewed in recent publicati, _ concerucd _ith dry changes of I!u': with height are small, if the intentdeposilion and surlacc energy balance (Kanemasu is to evaluate exchange rates at the surface. Thisctal., 1979; Bu.,,inger, 198(); llicks, 1986; llicks et problem has arisen for measurement of fluxes of O.,.,al., 19,"¢6b) Much of the discussion here is based NO, and NO,, and may be most easily addressed by useon Ihe rpore detailed deseriptions available in these of both flux and prolile mcasurements combined withpublications and the references cited in them. modeling of chemical reactions, tqt_r mz,ny purposes,
Traditional micrometeorological appn_aches are the complications of the chemistry can be avoided byfrequently u_d to measure air-surface exchange of measuring NO,, which is a conserved parameter withtrace chemicals. The methods addressed here fall respect to ozone oxidation and fast photochemistry.most clearly into the category of micrometcorological Measurement of fluxes over nonuniform terraintechmqucs: eddy correlation, use of vertical gradients requires especially careful analysis. In eddy correlationor prolilcs, and calculations of Iluxcs from variances over sloping terrain, the proper distinction must beof turbulent fluctuations. In .,atom specilic situations, made between cross-streamline turbulent flux andho_'vcr, alternatives may be required. Small-_'ale mean transport. Established flux-gradient relationshipsmass balances may be computed by integration may not be valid over nonunih_rm surfaces or complexof vertical prolilcs in horizontally homogeneous topography. Likewise, the relationships betweenconditions, when vertical mixing is weak and the height turbulent Iluctuations and fluxes above nonurih_rmof the upper boundary of the mechanically mixed surfaces may be different from those over uniformlayer in contact with the surface {the "lid" on vertical surfaces.
1990002793-039
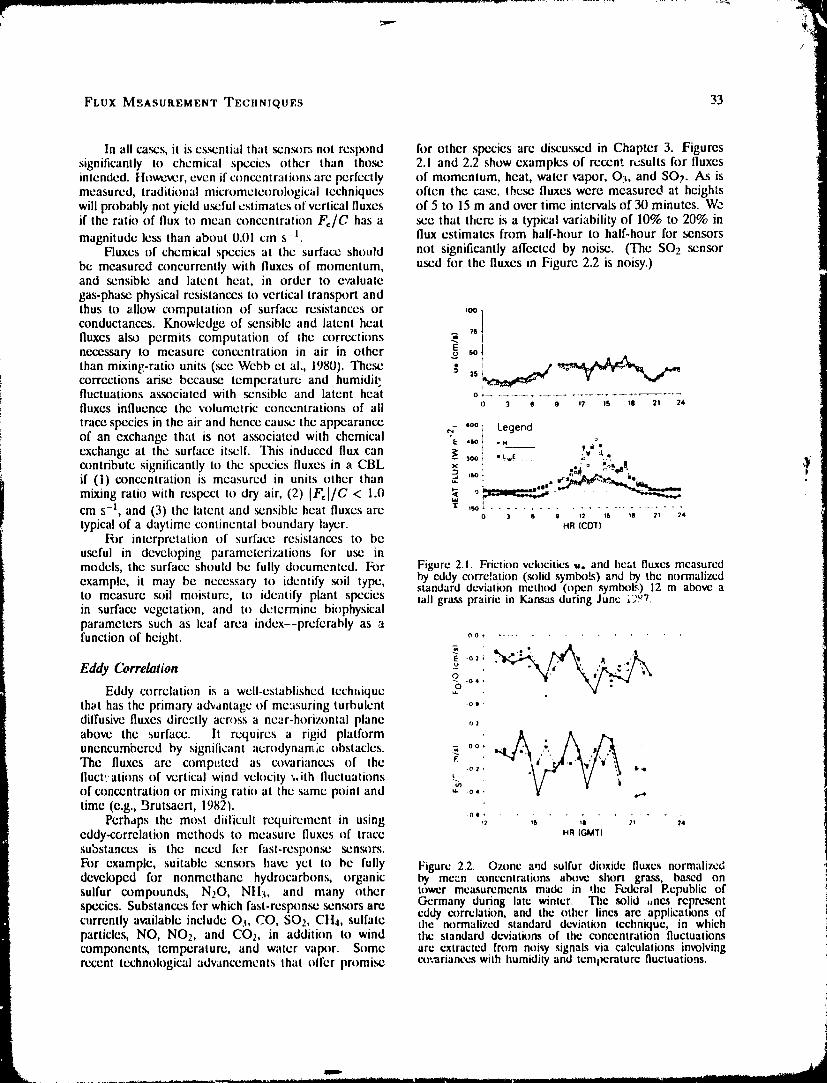
/
FLUX M_ASUREMENT TECIINIQUES 33
In all cases, it is es_ntial that sen_)rs not respond fi)r othcr species are diseu_d in Chapter 3. Figuressignificantly to chemical species other than those 2.1 and 2.2 show examples of recent results for fluxesintended. However, even if c,)ncentratit)ns are perfectly of momentum, heat, water _tpor, O:_. and SO7. As ismeasured, traditional micromeleorok)gicai techniques often the case, these fluxes were, measured at hcightswill probably not yield useful estimates of vertical fluxes of 5 to 15 m and over time intervals of 30 minutes. Weif the ratio of flux t,) mean concentration FJC has a see that there is a typical variability of 10% to 20% in
magnitude less than about 0.01 cm s-l. flux estimates from half-hour to half-hour for sensorsFluxes t)f chemical species at the surface should not significantly affected by noise. (The SOz sensor
be measured concurrently with fluxes of momentum, used for the fluxes m Figure 2.2 is noisy.)and sensible and latent heat, in order to e'raluategas-phase physical resistances to vertical transport andthus to allow computation of surface resistances or ,oo1
conductances. Knowledge of sensible and latent heat _ ,6]fluxes also permits computation of the corrections _ Inecessary to measure concentration in air in other E _
than mixing-ratio units (see Webb et al., 1980). These _. !__, _corrections arise becau_ temperature and humidit, _5! fluctuation:i associated with sensible and latent heat o+...... , ....
fluxes influence the volumetric concentrations of all o 3 6 9 ,7 ,s ,a 2, _4
trace species in the air and hence cau_ the appearance ,.,,- .oo_ Legendof an exchange that is not associated with chemical '_ ,_ol ,exchange at the surface itself. This induccd flux can _: ,,,,,i .L.t ., _t.
t contribute signilicantly It) the species fluxes in a CBL g ' ._ o _,'%_. _'if (l) concentration is measured in units other than .,-e ,,o, ,,¢__ i. Jmixing ratio with respect to dry air, (2) IF.I/C < 1.0 ,_ - _
cm s -t, and (3) the latent and sensible heat fluxes arc _ .,,o_ ..........................0 "1 a g 12 15 tO 21 24
typical of a daytime continental boundary layer. HR(COT)For interpretation of surface resistances to be
useful in developing parameterizations for use inmodels, the surface should be fully documented. For Figure2.1. Frictionvelocitiesu° and heat fluxesmeasuredexample, it may be necessary It)identify soil type, by cddy tn_rrcIation (_)lid symlx}Ls)and by the normalizedstandard deviation metht_l (()pen symbols) 12 m above ato measure _)il moisture, to identify plant species tall gra._sprairie in Kansas during June j,3y7in surface vegetation, and to determine biophysicalparameters such as leaf area index--preferably as afunction of hcight, o.................
o,Eddy Correlation g "k[" %_.; "]%y-Lff;_
Eddy correlation is a well-established tech,ique _-o, .,4:.th_t has the primary ad_,antagc of measuring turbulent ° °diffusive fluxes directly acr_)ss a near-horizontal plane o,
above the surface. It requires a rigid platform .._t_ . _ r.._ ' _V''/_
unencumbered by signilicant aerodynam;c obstacles. - ooThe fluxes are computed as covarianccs of the _ .o_. ,.fluct,.'ations of vertical wind velocity ,.ith fluctuationsof concentration or mixing ratio at the same point and d" o, ..,.time (e.g., Brutsaert, 1982L
Perhaps the most diilicult requirement in using o,,. . ,_ ' " ,, " " ;, " " i.eddy-correlation methods to measure fluxes t)f trace HR(GM'r)substances is the need fer fast-response ._n_)rs.For example, suitable sensors have yet to be fully Figure 2.2. Ozone and sulfur dioxide fluxes normalizeddevek)ped for nonmcthane hydrocarbons, organic by mean concentrations above short grass, ba._d onsulfur compounds, NzO, NH:,, and many other tower measurements made in d_c Federal Republic ofspecies. Substances fl:r which fast-response sensors are Germany during late winter. The solid ,,ncs representeddy correlation, and the other lines are applications ofcurrently available include O:_, CO, SO_, Ctt4, sulfate the normalized standard deviatk)n technique, in whichparticles, NO, NOz, and COz, in addition to wind the standard d_.wiations of the concentration fluctuationscompa)nent_ temperature, and water vapor. Some are extracted from noisy signals via calculations involvingrecent technological advancements that olfcr promi_ co;ariances wilh humidity and temperature fluctuations.
1990002793-040
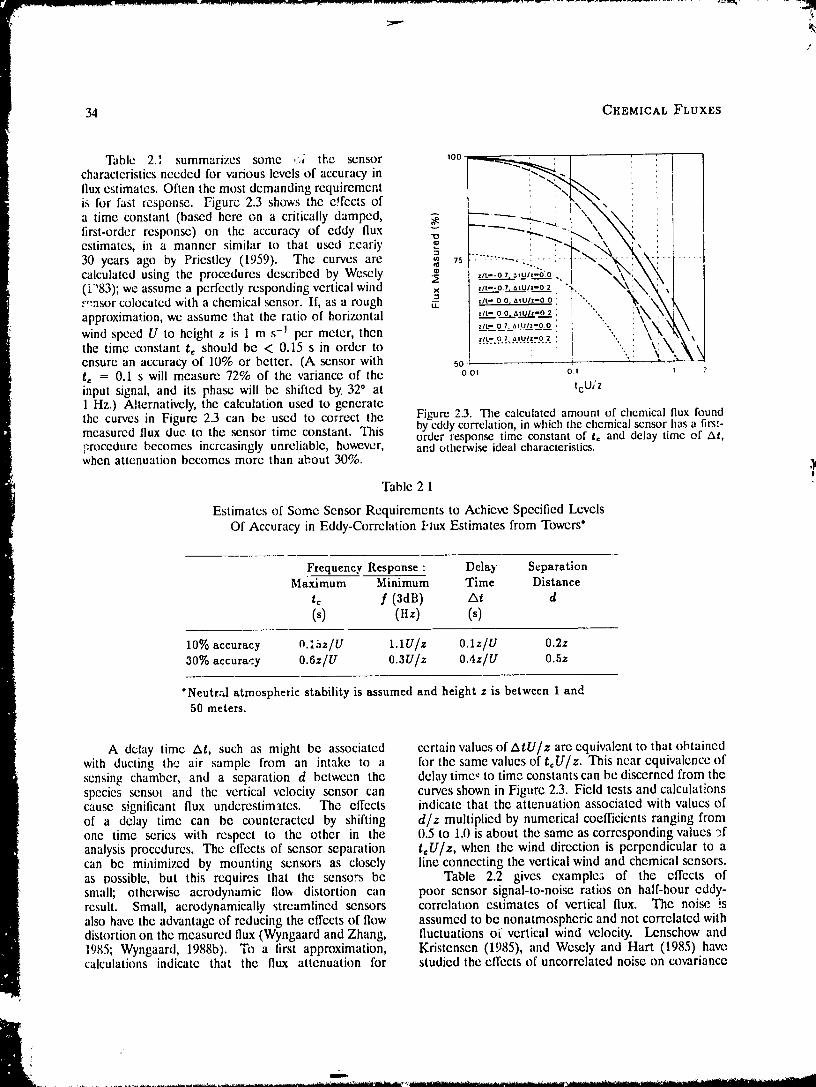
/
34 CHEMICAL FLUXES
,c2.' summ r, cssomc.,h ns,,richaracteristics necdcd for various levels of accuracy inIlux estimates. Often the most demanding requiremcntis for fast respond. Figure 2.3 shows the effects ofa time constant (based here on a critically damped,lirst-order response) on the accuracy of eddy flux
estimateS,yearsagoina manner similar to that used r.cariy _.,_ i ! t q x'_(''NX_i30 by Pricstlcy (1959). The curves are 7s :-_ ....... ...:_- - -_ ........
calcu,atcd using the procedures dcscribcd by Wcsc'y __ _!. x_!\X_
(V_83); we assume a perfectly rcsponding vertical wind _ ,t- o o,_,u_,-oo : j ....ro.nsor colocated with a chemical sensor. If, as a rough __ _,N.\z/L-- 00. alOll--O 2 i ; •approximation, wc assume that the ratio of horizontal .... ,:,\\ \\
wind speed U to height z is I m s-J per meter, then zlL-Ol,ato/z-o2 : I ". Xthe time constant t_ should be < 0.15 s in order to .............. i..... / "'.ensure an accuracy of 10% or better. (A sensor with so _ -t_ = 0.1 s will measure 72% of the variance of the o_ o_input signal, and its phase will be shifted by. 320 at tcU/Z1 Hz.) Alternatively, the calculation used to gcneratethe curves in Figure 2.3 can be used to correct the Figure 2.3. The calculated amount of chemical flux foundmeasured flux due to the sensor time constant. This by cddy correlation, in which the chemical scnsor has a first-
order response time constant of t, and delay time of At,procedure becomes increasingly unreliable, however, and otherwise ideal characteristics.
when attenuation becomes more than about 30%.!
Table 2 1
Estimates of Some Sensor Requirements to Achieve Specified LevelsOf Accuracy in Eddy-Correlation I_lux Estimates from Towers"
Frequency Response : Delay SeparationMaximum Minimum Time Distance
_, / (3dB) At d(s) (Hz) (s)
10% accuracy O.lbz/U 1.1U/z O.lz/U 0.2z30% accuracy 0.6z/U 0.3U/z 0.4z/U 0.5z
'Neutr:,,1 atmospheric stability is assumed and height z is between 1 and50 meters.
A delay time At, such as might be associated certain values of AtU/z are cquivalcnt to that obtainedwith ducting the air sample from an intake to a for the same valuesoft,U/z. This near equivalence ofsensing chamber, and a separation d between the delay times to time constants can be discerned from thespecies scnsol and the vertical velocity sensor can curves shown in Figure 2.3. Field tests and calculationscause significant flux underestimates. The effects indicate that the attenuation associated with values ofof a delay time can be counteracted by shifting d/z multiplied by numerical coefficicnts ranging fromone time series with respect to the other in the 0.5 to 1.0 is about the same as corresponding values _fanalysis procedures. The effects of sensor separation t,U/z, when the wind direction is perpendicular to acan be minimized by mounting sensors as closely line connecting the vertical wind and chemical sensors.as oossible, but this requires that the sensors be Table 2.2 gives examplc._ of the effects ofsmall; otherwise aerodynamic Ilov, distortion can poor sensor signal-to-noise ratios on half-hour eddy-result. Small, aerodynamically streamlined sensors correlauon estimates of vertical flux. The noise !salso have the advantage of reducing the effects of flow assumed to be nonatmospheric and not correlated withdistortion on the measured flux (Wyngaard and Zhang, fluctuations of vertical wind velocity. Lenschow and1985; Wyngaard, 1988b). To a lirst approximation, Kristensen (1985), and Wesely and Hart (1985) havecalculations indicate that the flux attenuation for studied the effects of uncorrelated noise on covariance
1990002793-041
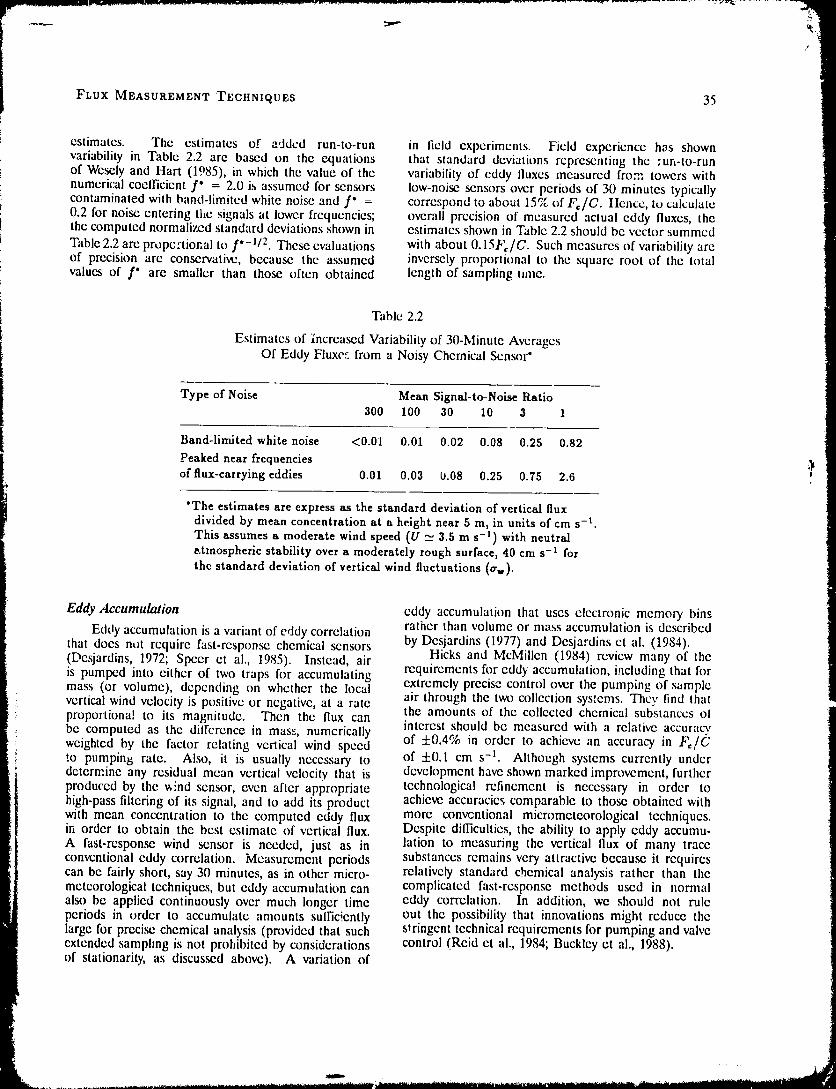
/
FLUX MEASUREMENT TECIINIQUES 35
estimates. The estimates of added run-to-run in field cxperimems. Field experience has shownvariability in Table 2.2 are based on the equations that standard deviatitms representing the :un-to-runof Wesely and Hart (1985), in which the value of the variability of eddy lluxcs measured from towers withnumerical coefficient f° = 2.0 is assumed for sensors low-noise sensors over periods of 30 minutes typicallycontaminated with band-limited white noise and f° = correspond to about 15% of F,/C. Ilcncc, to calculate0.2 for noise entering the signals at lower frequencies; overall precision of measured actual eddy fluxes, thethe computed normalized standard deviations shown in estimates shown in Table 2.2 should be vector summed
Table 2.2 are proportional to f°-t/2. These evaluations with about 0.15P,:/C. Such measures of variability areof precision are conservative, because the assumed inversely proportional to the square root of the totalvalues of f" are smaller than those often obtained length of sampling time.
Table 2.2
Estimates of increased Variability of 30-Minute AveragesOf Eddy Fluxe': from a Noisy Chemical Sensor"
Type of Noi-¢,e Mean Signal-to-Noise Ratio300 100 30 10 3 1
Band-limited white noise <0.01 0.01 0.02 0.08 0.25 0.82
Peaked near frequenciesof flux-carrying eddies 0.01 0.03 0.08 0.25 0.75 2.6
°The estimates are express as the standard deviation of vertical fluxdivided by mean concentration at a height near 5 m, in units of cm s -l.This assumes a moderate wind speed (U _ 3.5 m s -1) with neutralatmospheric stability over a moderately rough surface, 40 cm s -1 for
the standard deviation of vertical wind fluctuations (_w).
Eddy Accumulation eddy accumulation that uses electronic memory bins
Eddy accumulation is a variant of eddy correlation rather than volume or mass accumulation is describedthat does not require fast-response chemical sensors by Dcsjardins (1977) and Desjardins ct al. (1984).(Desjardins, 1972; Spccr et al., 1985). Instead, air Hicks and McMillen (1984) review many of theis pumped into either of two traps fi_r accumulating requirements fi_reddy accumulation, including that formass (or volume), depending on whether the local extremely precise control over the pumping of sample
? vertical wind velocity is positive or negative, at a rate air through the two collection systems. They find thatthe amounts of the collected chemical substances ol: proportiona! to its magnitude. Then the flux can
be computed as the dilrcrence in mass, numerically interest should be measured with a relative accuracyweighted by the factor relating vertical wind speed of +0.4% in order to achicvc an accuracy in F,/Cto pumping; rate. Also, it is usually necessary to of +0.1 cm s -1. Although systems currently undcrdetermine any residual mean vertical velocity that is development have shown marked improvement, furtherproduced by the v,ind sensor, even after appropriate technological refinement is necessary in order tohigh-pass filtering of its signal, and to add its product achieve accuracies comparable to those obtained withwith mean concentration to the computed eddy flux more conventional micrometeorological techniques.in order to obtain the best estimate of vertical flux. Despite difficulties, the ability to apply eddy accumu-A fast-response wind sensor is needed, just as in lation to measuring the vertical flux of many traceconventional eddy correlation. Measurement periods substances remains very attractive because it requirescan be fairly short, say 30 minutes, as in other micro- relatively standard chemical analysis rather than themeteorological techniques, but eddy accumulation can complicated fast-response methods used in normalalso be applied continuously over much longer time eddy correlation. In addition, we should not ruleperiods in ordcr to accumulate amounts sufficiently out the possibility that innovations might reduce thelarge for precise chemical analysis (provided that such stringent technical requirements for pumping and valveextended sampling is not prohibited by considerations control (Reid et al., 1984; Buckley et al., 1988).of stationarity, as discussed above). A variation of
1990002793-042
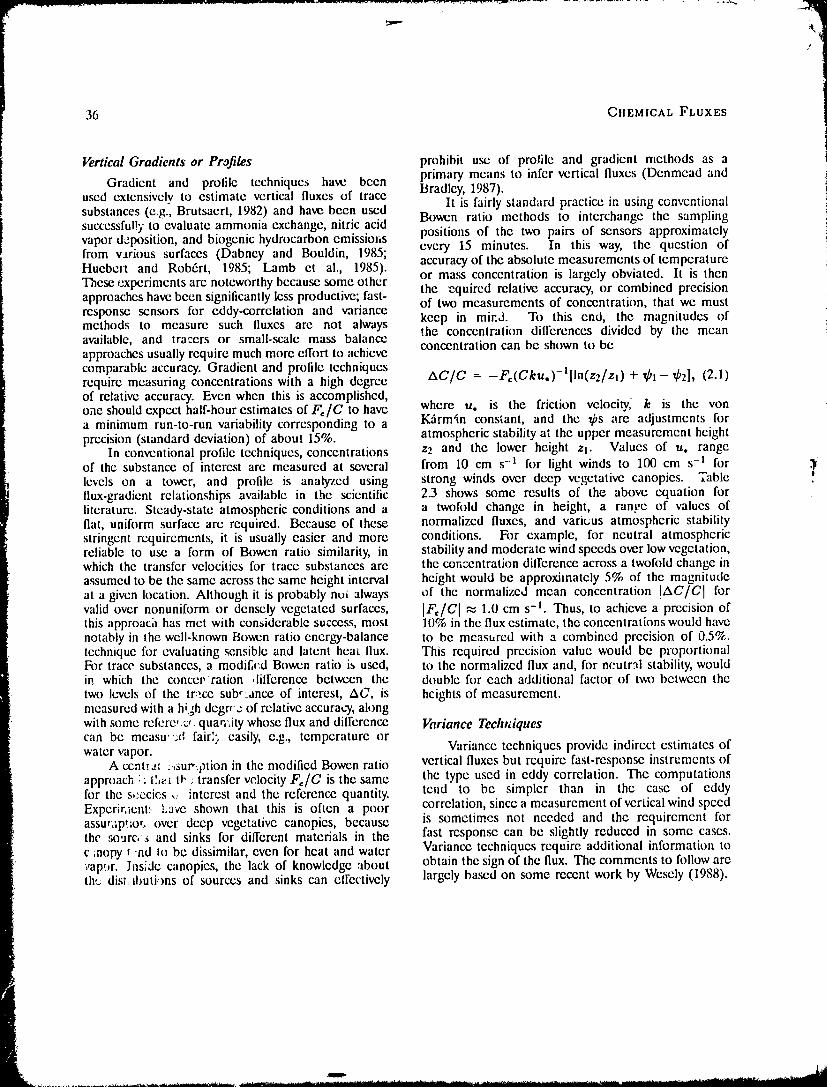
36 CIIEMICAL FLUXES
Vertical Gradients or Profiles prohibit use of protile and gradient methods as aprimary means to infer vertical fluxes (Denmead and
Gradient and profile techniques have been Bradley, 1987).used extensively to estimate vertical fluxes of trace It is fairly standard practice in using conventionalsubstances (e.g., Brutsaert, 1982) and have been used Bowcn ratio methods to interchange the samplingsuccessfully to evaluate ammonia exchange, nitric acidvapor deposition, and biogenic hydrocarbon emissio,s positions of the two pairs of sensors approximatelyfrom various surfaces (Dabncy and Bouldin, 1985; every 15 minutes. In this way, the question ofHucbert and Rob6rt, 1985; Lamb et al., 1985). accuracyof the absolute measurements of temperatureThese experiments are noteworthy because some other or mass concentration is largely obviated. It is thenapproaches have been significantly less productive; fast- the cquired relative accuracy, or combined precisionof two measurements of concentration, that we mustresponse sensors for eddy-correlation and variancemethods to measure such fluxes are not always keep in mind. To this end, the magnitudes ofthe concentration differences divided by the meanav'ailable, and tracers or small-scale mass balance concentration can be shown to beapproaches usually require much more effort to achieve
comparable accuracy. Gradient and profile techniques AC/C = -Fc(Cku.)-l[In(zz/zl) + _bl - ez], (2.1)require measuring concentrations with a high degreeof relative accuracy. Even when this is accomplished,oae should expect half-hour estimates of F, / C to have where u. is the friction velocity, k is the vona minimum run-to-run variability corresponding to a K,Srm'in constant, and the es are adjustments forprecision (standard deviation) of about 15%. atmosphcric stability at the upper measurement hcight
In conventional profile techniques, concentrations z2 and the lower height zl. Values of u. rangeof the substance of intcrest are measured at several from 10 cm s-_ for light winds to 100 cm s-_ for _
levels on a tower, and profile is analyzed using strong winds over deep vcgetative canopies. Table )flux-gradient relationships available in the scientific 2.3 shows some results of the above equation forliterature. Steady-state atmospheric conditions and a a twofold change in height, a range of values offiat, uniform surface arc required. Because of these normalized fluxes, and varit;us atmospheric stabilitystringent requirements, it is usually easier and more conditions. For example, for neutral atmosphericreliable to use a form of Bowen ratio similarity, in stability and moderate wind speeds over low vegetation,which the transfer velocities for trace substances are the concentration difference across a twofold change inassumed to be the same across the same height interval height would be approximately 5% of the magnitudeat a given location. Although it is probably not always of the normalized mean concentration !AC/C I forvalid over nonuniform or densely vegetated surfaces, I ',/Cl _. 1.0 cm s -1. Thus, to achieve a precision ofthis approaci_ has met with considerable success, most 10% in the flux estimate, the concentrations would havenotably in the well-known Bowcn ratio energy-balance to be measured with a combined precision of 0.5%.technique for evaluating sensible and latent heat flux. This required precision value would be proportionalFor trace substances, a modified Bowcn ratio is used, to the normalized flux and, for neutr:al stability, wouldin which the concev ration ,liflerence between the double for each additional factor of two betwccn the
two levels of the trace sub_:.ance of interest, AC, is heights of measurement.measured with a hi.3h degrFz of relative accuracy, alongwith some rcfl.'re',c, quar,,,ity whose flux and dilference Variance Techniquescan be measu":d fair',;, easily, e.g., temperature orwater vapor. Variance techniques provide indirect estimates of
A ccntra: :.,sur_.ption in the modified Bowen ratio vertical fluxes but require fast-response instruments ofapproach "; t_,,t 0' _transfer velocity F,/C is the same the type used in eddy correlation. The computationsfor the s,;ecics, interest and the reference quantity, tcud to be simpler than in the case of eddyExpcrir.icnt:, !.ave shown that this is often a poor correlation, since a measurement of vertical wind speedassu,:_ptio_, over deep vegetative canopies, because is sometimes not needed and the requirement forthe sourc, s and sinks for different materials in the fast response can be slightly reduced in s,_me cases.
c mopy t 'nd so be dissimilar, even for heat and water Variance techniques require additional information tovap,,r. Inside canopies, the lack of knowledge about obtain the sign of the flux. The comments to follow areth,+ dis_ dmti:)ns of sources and sinks can effectively largely based on some recent work by Wesely (1988).
1990002793-043
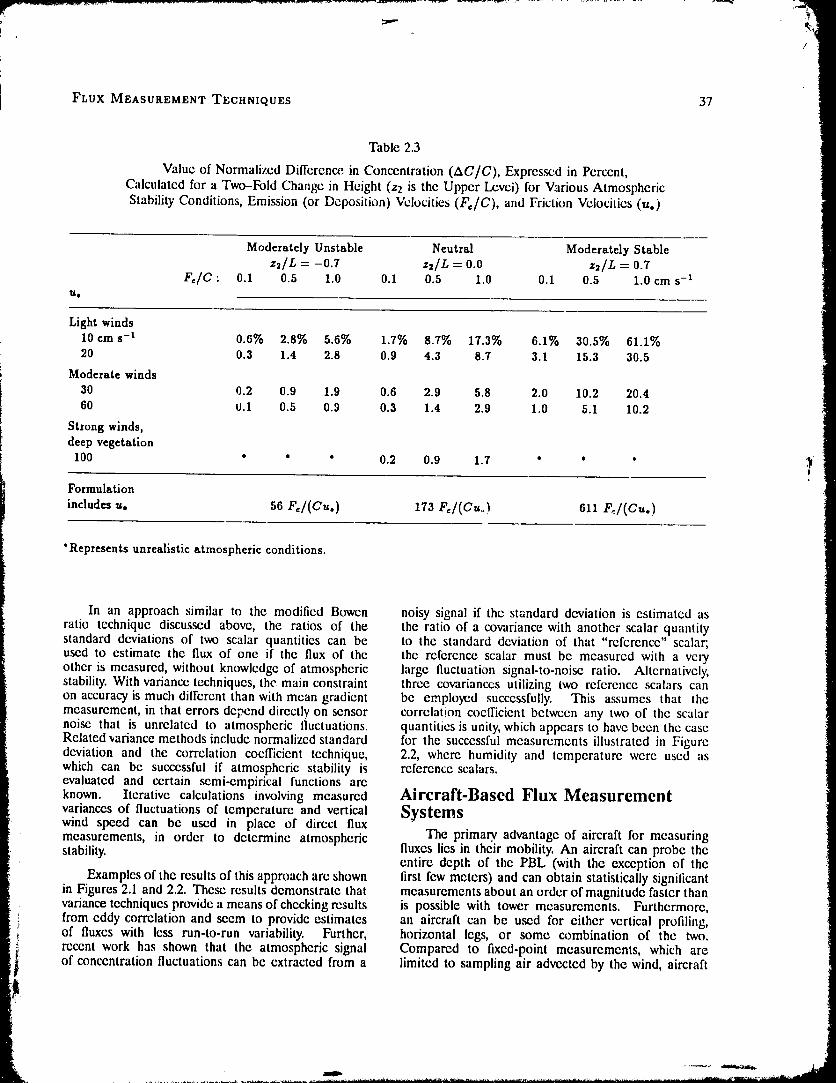
FLUX MEASUREMENT TECHNIQUES 37
Table 2.3
Value of Normalized Dillcren_ in Concentration (AG/C), Expres_;d in Percent,Calculated for a Two-Fold Change in Height (z2 is the Upper Level) for Various AtmosphericStability Conditions, Emission (or Deposition) Velocities (F,/C), and Friction Velocities (u,)
Moderately Unstable Neutral Moderately Stablez2/L = -0.7 z2/L = 0.0 z2/L : 0.7
FdC : 0.1 0.5 1.0 0.1 0,5 1.0 0.1 0.5 1.0 cm s-*U,
Light winds
10 cm s -1 0.6% 2,8% 5.6% 1.7% 8.7% 17.3% 6.1% 30.5% 61.1%20 0.3 1.4 2.8 0.9 4.3 8.7 3.1 15.3 30.5
Moderate winds
30 0.2 0.9 1.9 0.6 2.9 5.8 2.0 10.2 20.460 0.1 0.5 0.9 0.3 1.4 2.9 1.0 5.1 10.2
Strong winds,deep vegetation
100 * * * 0.2 0.9 1.7 * * * ._!
Formulation
includes u, 56 Fc/(Cu,) 173 Fc/(Cu,) 611 F,/(Cu,)
"Represents unrealistic atmospheric conditions.
In an approach similar to the modified Bowen noisy signal if the standard deviation is estimated asratio technique discussed above, the ratios of the the ratio of a covariancc with another scalar quantitystandard deviations of two scalar quantities can be to the standard deviation of that "reference" scalar,used to estimate the flux of one if the flux of the the reference scalar must be measured with a veryother is measured, without knowledge of atmospheric large fluctuation signal-to-noise ratio. Alternatively,stability. With variance techniques, the main constraint three covarianccs utilizing two reference scalars canon accuracy is much difl'crent than with mean gradient be employed successfully. This assumes that themeasurement, in that errors depend directly on sensor correlation coefficient between any two of the scalarnoise that is unrelated to atmospheric fluctuations, quantities is unity, which appears to have been the caseRelated variance methods include normalized standard for the successful measurements illustrated in Figuredeviation and the correlation coefficient technique, 2.2, where humidity and temperature were used aswhich can be successful if atmospheric stability is reference scalars.evaluated and certain semi-empirical functions areknown. Iterative calculations involving measured Aircraft-Based Flux Measurementvariances of fluctuations of temperature and vertical Systemswind speed can be used in place of direct fluxmeasurements, in order to determine atmospheric The prima.ry advantage of aircraft for measuringstability, fluxes lies in their mobility. An aircraft can probe the
entire depth of the PBL (with the exception of theExamples of the results of this approach are shown first few meters) and can obtain statistically significant
in Figures 2.1 and 2.2. These results demonstrate that measurements about an order of magnitude faster thanvariance techniques provide a means of checking results is possible with tower measurements. Furthermore,
i from eddy correlation and seem to provide estimates an aircraft can be used for either vcrtical profiling,i of fluxes with less run-to-run variability. Further, horizontal legs, or some combination of the two.
recent work has shown that the atmospheric signal Compared to fixed-point measurements, which areof concentration fluctuations can be extracted from a limited to sampling air advected by the wind, aircraft
............ f.i
1990002793-044
38 CHEMICAL FLUXES
can measure along a path at any arbitrary angle with a small difference between two large numbers.respect to the wind and can measure in a frame of The airp!anc velocity can be obtained fromreference that moves with the wind. This makes it integrated accelerometer outputs on an inertialpossible to use aircraft in budget studies: evaluating navigation system (INS), from radiation transmittingthe transport and time rates of chang;: of a particular and receiving devices such as Doppler radars or radarspecies and thereby obtaining as a residual the rate altimeters, or by radio navigation techniques. Forof production or loss by chemical reactions. For the turbulence measurements, the components of airplanemost part, towers are not very suitable for obtaining velocity can be measured with sufficient resolution andflux measurements over inhomogcneous terrain and response time with the available INS. Furthermore, theare dilficult to use in remote land areas (e.g., forests, INS can also provide the fast-response, high-resolutionswamps, and tundra)and over the ocean. By contrast, attitude angles that are required to transform airthese situations prescnl ito particular problems for velocity measurements into an earth-based frame ofaircraft; indeed, low-level measurements are generally reference.caster to carry out over sparsely populated regions and The longitudinal component of air velocity (truethe ocean than over populated regions, airspeed) is usually obtained from the pressure
Unfortunately, the aircraft's mobilily also has its difference between the dynamic pressure port of adisadvantages. Aircraft motion needs to be accurately Pitot tube and the static press-J_'e from either themeasured and corrections applied to the data. Since Pitot tube or a static port on the aircraft fuselage.aircraft need to fly relatively fast compared to the The pressure dillcrence must be correctcd for airmean wind speed in order to stay airborne, faster density, which is calculated from static pressure and airinstrument response is required than for fixed-point temperature, before computing the true airspeed. Themeasurements. Furthermore, corrections may have to transverse (lateral and vertical) air velocity componentsbe made for compressibiiity, adiabatic and frictional are usually measured either by means of vanes or from _'heating, and flow distortion induced by the aircraft, pressure differences between ports separated by 600l_xmg uninterrupted time series and changing or to 90* on a hemispherical probe or on the nose ofmodifying instruments in flight are also not possible, the aircraft itself. If vanes or a hemispherical probeGenerally, instrument packaging requirements are are used, the sensors are usually mounted on a boomalso more stringent on an aircraft than at fixed- forward of the aircraft to reduce as much as possiblepoint sites, for example, constraints on size, weight, the airflow distortion induced by the aircraft. This is apower consumption, and operation in a vibrating and convenient location as well for other sensors, such asturbulent -nvironmcnt. thermometers or hygrometers, whose outputs may be
It is clear that fixed-point and aircraft mea- affected by flow distortion.surements are complementary--the disadvantages of Instead of trying to minimize the flow distortionone are compensated Ior by the advantages of the effects of the fuselage, it is possible to make useother. The effective design of field programs will, of measurements of pressure perturbations on thetherefore, often include both techniques. There nose of the aircraft that are caused by the fuselage.are numerous examples of coordinated experiments Since these pressure perturbations are approximatelythat have included both aircraft and fixed-point flux linearly related to the flow angles, they can be used tomeasuring systems. Recent cases are the Amazon measure the flow angles. As pointed out by WyngaardBoundary Layer Experiment (ABLE-2B) and the (1988b), flow distortion can seriously contaminate fluxFirst ISL.SCP (International Satellite Land-Surface measurements from aircraft if species densities areClimatology Project) Field Experiment (FIFE). measured in regions of strong flow distortion, such
as dear the fuselage. Thus, measuring the transverse
Eddy Correlation velocity by means of ports on the aircraft nose, withoutusing a nose boom, may not obviate the need for some
Flux measurement from aircraft entails obscr- kind of structure that would allow the measurement of
_.,'tions of both the air velocity and the quantity species density fluxes in a region not strongly affectedwhose llux is being measured. Because the by flow distortion. Flow distortion effects do notaircraft is a mewing platfl_rm, air velocity is not a impact fluxes if mixing ratio is measured instead ofstraightfi_rward measurement (Lenschow, 1986). An partial density.aircraft has complete three-dimensional freedom to Another way to obtain airspeed and flow angles ismove, depending on control surface and power settings by measuring the Dopplcl shift of reflected laser beamand on velocity and density fluctuations of the air. transmissions in front of the aircraft (Keeler ct al.,Therefore, the velocity and angular orientation of the 1986). This offers the possibility of an absolute velocityaircraft reV_,.tiveto the earth as well as the velocity of the measurement in all weather conditions, including llightsair relative to the aircraft must be measured. Since the in clouds and precipitation.aircraft typically flies an order of magnitude faster than Because of the relatively high speed of aircraftthe wind, measuring the air velocity involves calculating relative to the wind, the requirement for accuracy of
1990002793-045
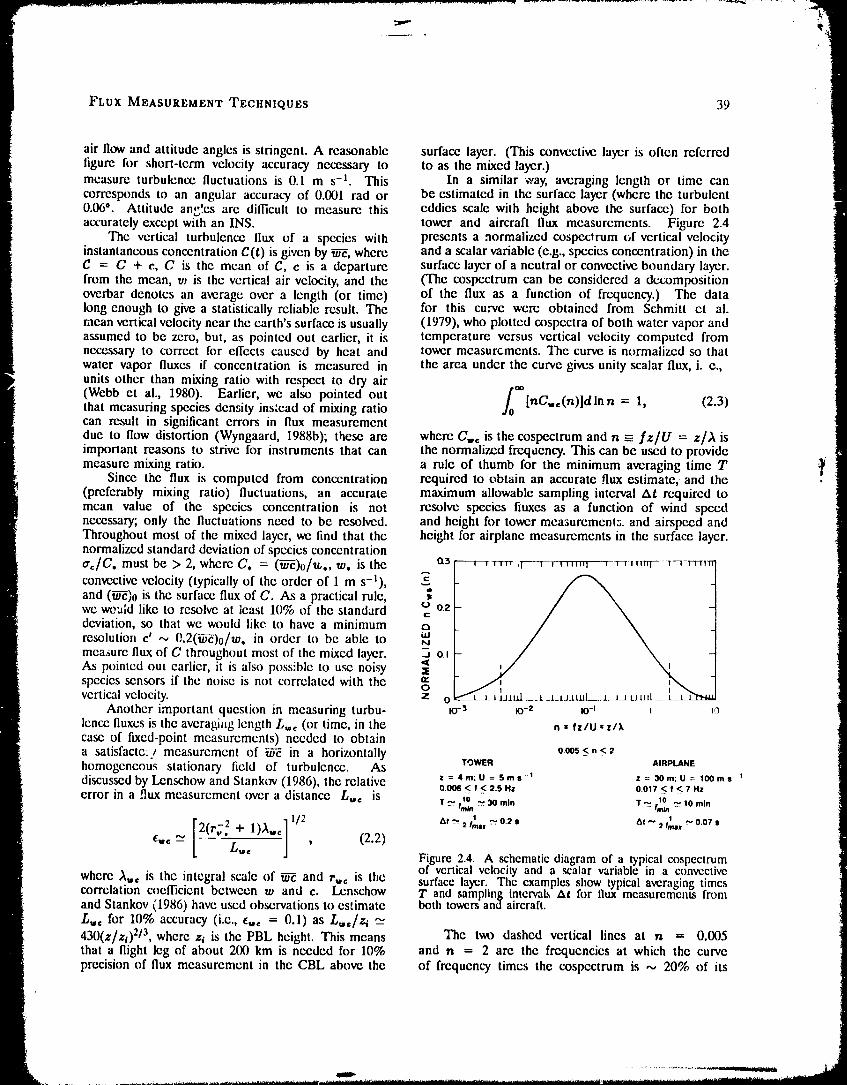
FLUX MEASUREMENT TECHNIQUES 39
air flow and attitude angles is stringent. A reasonable surface layer. (This convective layer is often referredfigure for short-term velocity accuracy necessary to to as the mixed layer.)measure turbulence fluctuations is 0.1 m s -]. This In a similar way, averaging length or time cancorresponds to an angular accuracy of 0.001 tad or be estimated in the surface layer (where the turbulent0.06*. Attitude an,3'.es are difficult to measure this eddies scale with height above the surface) for bothaccurately except with an INS. tower and aircraft flux measurements. Figure 2.4
The vertical turbulence flux of a species with presents a normalized cospeclrum of vertical velocityinstantaneous concentration C(t) is given by _--E,where and a scalar variable (e.g., species concentration) in theC = C + e, C is the mean of C, c is a departure surface layer of a neutral or convective boundary layer.from the mean, w is the vertical air velocity, and the (The cospectrum can be considered a decompositionoverbar denotes an average over a length (or time) of the flux as a function of frequency.) The datalong enough to give a statistically reliable result. The for this cu:'ve were obtained from Schmitt et al.mean vertical velocity near the earth's surface is usually (1979), who plotted cospectra of both water vapor andassumed to be zero, but, as pointcd out earlier, it is temperature versus vertical velocity computed fromnecessary to correct for effects caused by heat and tower measurements. The curve is normalized so thatwater vapor fluxes if concentration is measured in the area under the curve gives unity scalar flux, i. e.,units other than mixing ratio with respect to dry air
I"(Webb et al., 1980). Earlier, we also pointed out [nO.,(n)]dlnn = 1, (2.3)that measuring species density ins:ead of mixing ratiocan result in significant errors in flux measurementdue to flow distortion (Wyngaard, 1988b); these are where C,,_ is the cospectrum and n =__.,fz/U = z/A isimportant reasons to strive for instruments that can the normalized frequency. This can be used to provide
measure mixing ratio, a rule of thumb for the minimum averaging time TSince the flux is computed from concentration required to obtain an accurate flux estimate, and the
(preferably mixing ratio) fluctuations, an accurate maximum allowable sampling interval At required tomean value of the species concentration is not resolve species fluxes as a function of wind speednecessary; only the fluctuations need to be resolved, and height for tower measuremenl:;, and airspeed andThroughout most of the mixed layer, we find that the height for airplane measurements in the surface layer.normalized standard deviation of species concentrationtr,/C, must be > 2, where C. = (_--_)o/u,.,w. isthe ct3 ---r_rrr,,i , , ,,,,,, , _t-,r-, , ,,,,,,'
convective velocity (typically of the order of 1 m s-l),and (_E)0 is the surface flux of C. A.s a practical rule,we would like to resolve at least 10% of the standard o o zc
deviation, so that we would like to have a minimum t:,illresolution e' ,-.. 0.2(_-_)o/w. in order to be able to N
measure flux of C throughout most of the mixed layer. "i o lAs pointed out earlier, it is also possible to use noisy _<species sensors if the noise is not correlated with the n-overtical velocity, z o
Another important question in measuring turbu- io-3 _o-_ _o-' _ _._lcnce fluxes is the averagiL_g length L,,, (or time, in the n • fz/U _z/Xcase of fixed-point measurements) needed to obtaina satisfacte:/ measurement of _ in a horizontally o.0os_<, < 2homogeneous stationary field of turbulence. As tOWt, Amp_m_discussed by Lenschow and Stank_w (1986), the relative z -- ,_m;u = s m - _ z = 30,,,:u = 10om,0.006 < ! < 2.5 Hz 0.017 < I < 7 Hz
error in a flux measurement over a distance L,,,c is T _ i-o - T _ 10 t0 mln.... lral n _ 30 rain .._ im_n
1 1
2(r + I)A t/2 at" _t=,, _ o.2, _f~ _ o.o7,e,, _ (2.2)
LIlt C
Figure 2.4. A schematic diagram of a typical cospectrumof vertical velocity and a scalar variable in a convective
where ,,Xw,is the integral scale of _ and r,,, is the surface layer. The examples show typical averaging timescorrelation coefficient between w and e. Lcnschow T and sampling intervals At for flux measurements fromand Stankov (,1986) have used observations to estimate both towers and aircraft.L,,,, for 10% accuracy (i.e., _,,, = 0.1) as L,,/zi ":
430(z/zO 213, where z_ is the PBL height. This means The two dashed vertical lines at n = 0.005that a flight leg of about 200 km is needed for 10% and n = 2 are the frequencies at which the curveprecision of flux measurement in the CBL above the of frequency times the cospectrum is ,-, 20% of its
B
1990002793-046
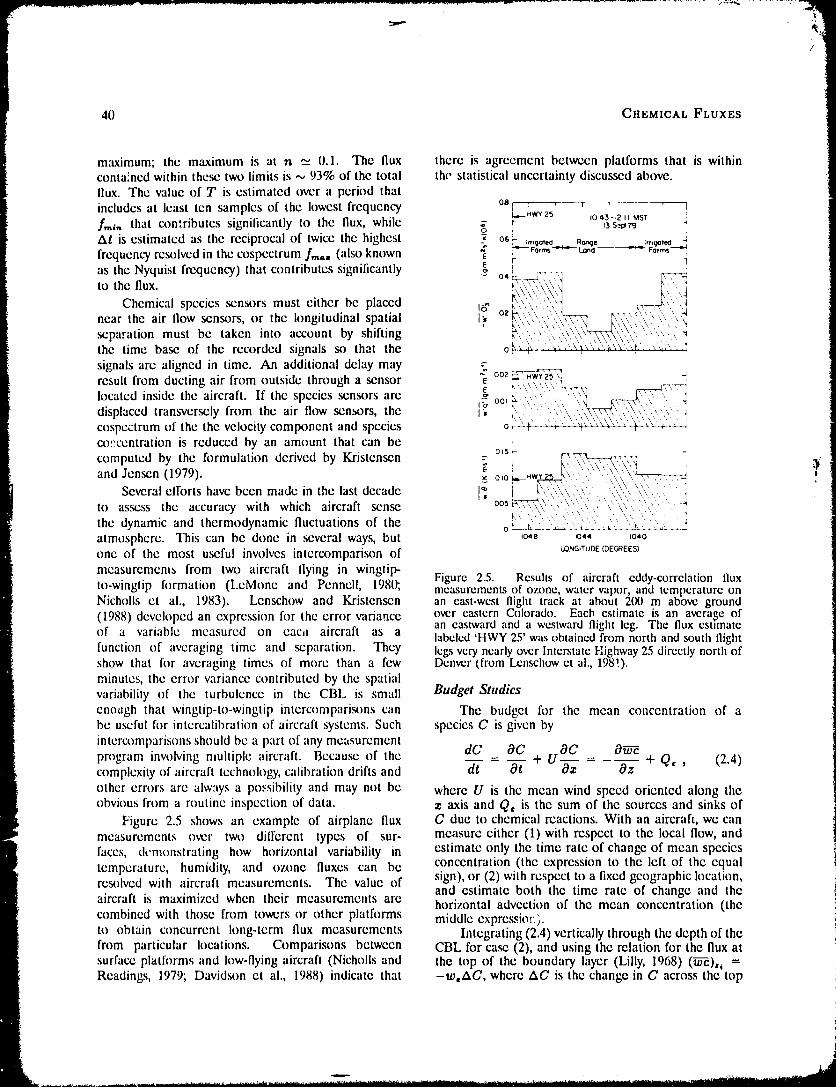
40 CHEMICAL FLUXES
maximum; the maximum is at n __ 0.1. The flux there is agreement between platforms that is withincontained within these two limits is -., 93% of the total the statistical uncertainty discussed above.Ilux. The value of T is estimated over a period thatincludes at least ten samples of the lowest frequency 0a_ _ , , -r----_
'_HWY 25 1043-,2 II MST !
f,,,i, that con'.ributcs significantly to the llux, while _- r _3s_
At is estimated as the reciprocal of twice the highest -." 06_-_.___o,,____,,,go,_R,_, ,,,,,_,_Fo,m,__..i_'frequency resolved in the cospectrum f,,,°= (also known "_ r 1
E
as the Nyquist frequency) that contributes significantly z o4_v__2S :qto the flux. _' ,_
Chemical specics sensors must either be placed Ib'. oz "_,',,',,,,L"'_..... _"," ' ", _'near the air flow sensors, or the longitudinal spatial ; _,,, ,_, ,_,,,q K,,\,,,\,,,,,,_,,separation must be taken into account by shifting _,,' ,'",\_C\\_z_-_',\, \' ,_\"the time base of the recorded signals so that the o_-\.-_.\'\,,\,-_ _ \,,' ....signals are aligned in time. An additional delay may _-
002 __H_V Z5 ',_-_result from ducting air from outside through a sensor E _,,,\'"' , r-_located inside the aircraft. If the spccies sensors are _ oo _",,, ..... _ _', -,displaced transversely from the air Ilow sensors, the _" ,, , ', ",, )\,,,\,,,,,\,,,,:',,_-_,_\',\,,, ,,',,,
i o_._._,, ._,__w._.+_:_ _cospectrum of the the velocity component and species ' ..... \ .... ' ' ' \''' '" '"" " :c_):_ccntration is reduced by an amount that can becomputed by the formulation derived by Kristensen o,5-
and Jen_n (1979). _ _,_.wY _(_-_-_-----_-'
Several elrorts have been made in the last decade I] _"" \ ''\ \\"' \\ ......to assess the accuracy with which aircraft sense oos_,_\\\ ..... \ ,,,, \,,,\, \, \,
k " _' ' ' " \ ,"'' \ • _ \ '
the dynamic and thermodynamic fluctuations of the ' " ..... \', ........atmosphere. This can be done in several ways, but ,o_o ,_,, ,o,oone of the most useful inw)lvcs intcrcomparison of _Or_,rO0E(t_EC_EES_
measurements from two aircraft flying in winglip- Figure 2.5. RcsulLs of aircraft cdcly-correlation fluxto-wingtip h)rmation (LeMone and Penncll, 1980; measurements of ozone, water vapor, and temperature onNicholls ct al., 19831. Lenschow and Kristensen an cast-west flight track at about 200 m above ground(1988) developed an exprcssion fi)r the error variance over eastern Colorado. Each estimate is an average of
an eastward and a westward flight leg. The flux esumateof a variable measured on eaca aircraft as a labeled 'HWY 25' was obtained from north and south flightfunction of averaging time and separation. They legs very nearly over Interstate Highway 2.5directly north ofshow that [or averaging times of more than a few Denver (from Lcnschow ct al., 198!).minutes, the error variance contributed by the spatialvariability of the turbulence in the CBL is small Budget Studiesenough that wingtip-to-wingtip intcrcomparisons can The budget for the mean concentration of abe useful for intercalibration of aircraft systems. Such species C is given byintercomparisons should bca part of any measurement
program inw)lving multiple aircraft. Because of the dC _ OC + UOC _ OWe + Q, , (2.4)complexity of aircraft technology, calibration drifts and dt Ot Oz Oz
other errors are always a possibility and may not be where U is the mean wind speed oriented along theobvious from a routine inspection of data. z axis and Q, is the sum of the sources and sinks of
Figure 2.5 shows an example of airplane flux C due to chemical reactions. With an aircraft, we canmeasurements o_cr two different types of sur- measure either (I) with respect to the local flow, andfaces, demonstrating how horizontal variability in estimate only the time rate of change of mean speciestemperature, humidity, and ozone Iluxes can be concentration (the expression to the left of the equalresolved with aircraft measurements. The value of sign), or (2) with respect to a fixed gcographic location,
and estimate both the time rate of change and theaircraft is maximized when their measurements are horizontal advection of the mean concentration (thecombined with those from towers or other platforms middle expression:).to obtain concurrent long-term flux measurements Integrating (2.4) vertically through the depth of thefrom particular locations. Comparisons between CBL for ca_ (2), and using the relation h)r the flux atsurface platlorms and low-flying aircraft (Nicholls and the top of the boundary layer (Lilly, 1968) (_--_),_ =Readings, 1979; Davidson et al., 1988) indicate that -w, AG, where AG is the change in C across the top
1990002793-047
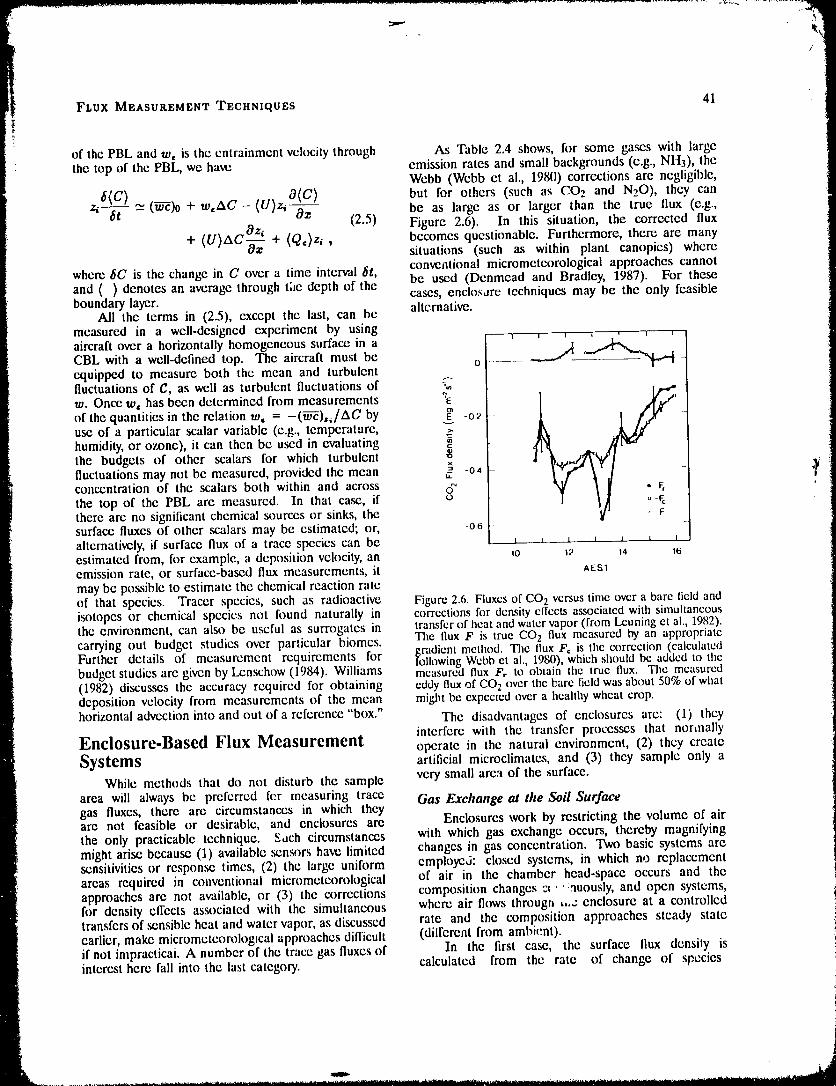
t FLUX MEASUR.EMENT TECHNIQUES 41
: of the PBL and w, is the entrainment velocity through As Table 2.4 shows, for some gases with largethe top of the PBL, we have emission rates and small backgrounds (e.g., NH3), the
Webb (Webb et al., 1980) corrections are negligible,
6(C),,, (_--_)o + w, AC (U)zO(C)_ but for othcrs (such as CO2 and N20), they can- - be as large as or larger than the true flux (e.g.,zi St ,9,.. (2.5) Figure 2.6). In this situation, the corrected flux
+ (U)AC_ + (Q,)z_ , becomes questionable. Furthermore, there are manyoz situations (such as within plant canopies) where
where 6C is the change in C over a time interval gt, conventional micrometeorological approaches cannotand ( ) denotes an average through the depth of the be used (Dcnmead and Bradley, 1987). For theseboundary layer, cases, enclos,Jre techniques may be the only feasiblealternative.
All the terms in (2.5), except the last, can bemeasured in a well-designed expcriment by using
aircraft over a horizontally homogeneous surface in a 'CBL with a well-defined top. The aircraft must be iequipped to measure both the mean and turbulent o ...... !fluctuations of C, as well as turbulent fluctuations of _
w. Once w, has been determined from measurements '_E l ' iof the quantities in the relation w, = -(W_),,/AO by _" -02use of a particular scalar variable (e.g., temperature, "_humidity, or ozone), it can then be used in evaluatingthe budgets of other scalars for which turbulent _,
fluctuations may not bc measured, provided the mean __ ,concentration of the scalars both within and across o_
the top of the PBL are measured. In that case, if o I II _-_there are no significant chemical sources or sinks, the _F
surface fluxes of other scalars may be estimated; or, -06alternatively, if surface flux of a trace species can be _ , t t t t Jestimated from, for example, a deposition velocity, an to _ t4 _6emission rate, or surface-based flux measurements, it AESTmay be possible to estimate the chemical reaction rateof that species. Tracer species, such as radioactive Figure 2.6. Fluxes of CO2 versus time over a bare field andisotopes or chemical species not found naturally in corrections h_r density cll'ects associated with simultaneousthe environment, can also be useful as surrogates in transfer of heat and water vapor (from Lcuning ct al., 1982).carrying out budget studies over particular biomcs. The flux F is true CO 2 flux measured by an appropriatcFurther details of measurement requirements for gradient mcthod. The flux F, is lhc correction (calculatedfollowing Wcbb et al., 1980), which should be added to thebudget studies are given by I.cnschow (1984). Williams measured flux F, to obtain the truc flux. The measured(1982) discusses the accuracy required for obtaining eddy flux of CO 2 over the bare field was about 50% of whatdeposition velocity from measurements of the mean might be expected over a healthy wheat crop.
horizontal advection into and out of a reference "box." The disadvantages of enclosures are: (1) theyinterfere with the transfer processes that nor,nally
Enclosure-Based Flux Measurement operate in the natural environment, (2) they createSystems artificial microclimates, and (3) they sample only a
While methods that do not disturb the sample very small area of the surface.
area will always be preferred fcr measuring trace Gas Exchange at the Soil Surfacegas fluxes, there are circumstances in which theyare not feasible or desirable, and enclosures are Enclosures work by restricting the volume of airthe only practicable technique. Such circumstances with which gas exchange occurs, thereby magnifyingmight arise because (1) available sensors have limited changes in gas concentration. Two basic systems aresensitivities or response times, (2) the large uniform employeJ: closed systems, in which no replacementareas required in conventional micrometeorological of air in the chamber head-space occurs and theapproaches are not available, or (3) the corrections composition changes c_'!auously, and open systems,for density effects associated with the simultaneous where air flows through ,,,e enclosure at a controlledtransfers of sensible heat and water vapor, as discussed rate and the composition approaches steady stateearlier, make micrometcorologlcal approaches difficult (different from ambient).if not impracticai. A number of the trace gas fluxes of In the first case, the surface flux densily is
r interest here fall into the last category, calculated from the rate of change of species
L O
1990002793-048
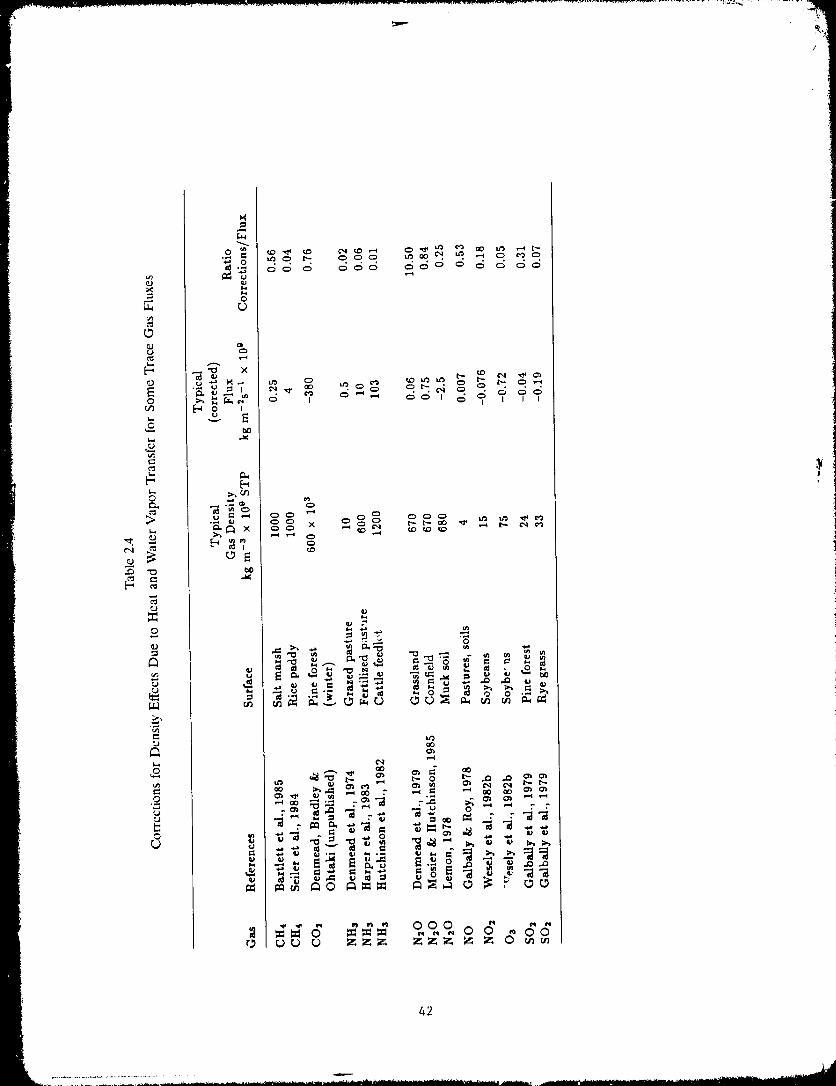
/
_ _ _= = o
42
1990002793-049
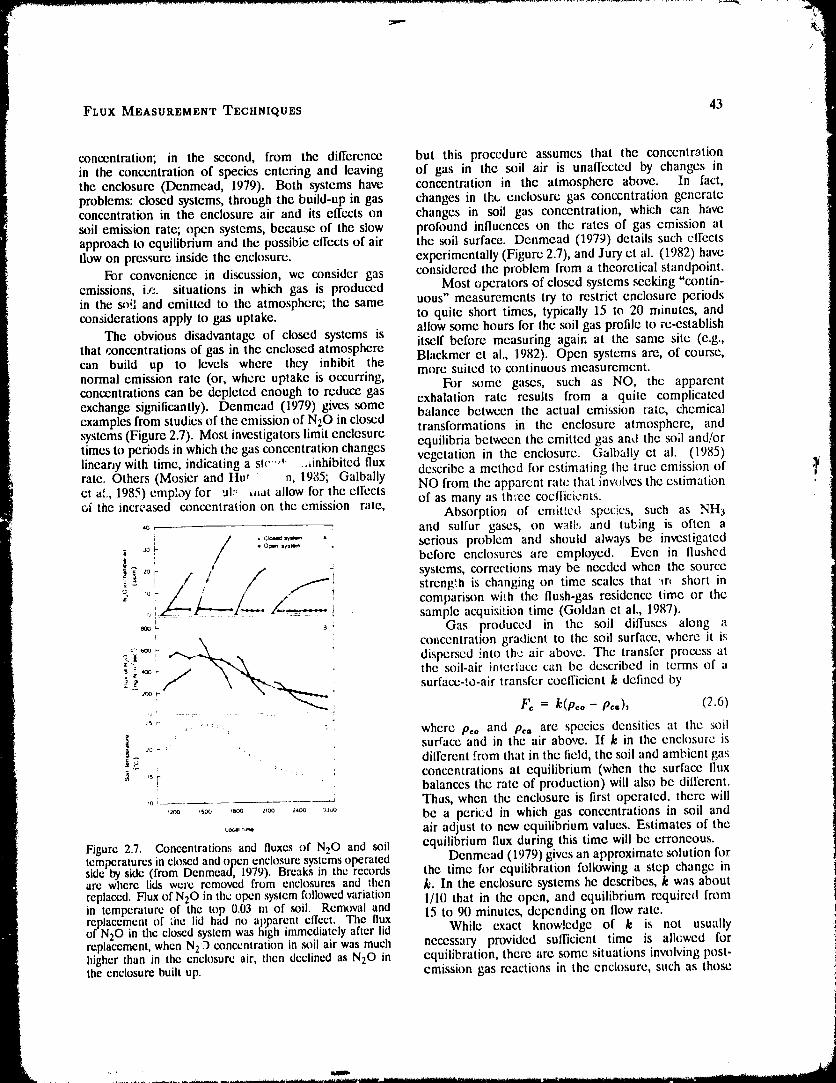
FLUX MEASUR.EMENT TECHNIQUES 43
concentration; in the second, from the difference but this procedure assumes that the conccntr-3tionin the concentration of species entering and leaving of gas in the soil air is unaffected by changes inthe enclosure (Denmead, 1979). Both systems have concentration in the atmosphere above. In fact,problems: closed systems, through the build-up in gas changes in th.t. enclosure gas concentration generateconcentration in the enclosure air and its effects on changes in soil gas concentration, which can havesoil emission rate; open systems, because of the slow profound influences on the rates of gas emission atapproach to equilibrium and the possible effects of air the soil surface. Denmead (1979) details such effectsflow on pressure inside the enclosure, experimentally (Figure 2.7), and Jury et al. (1982) have
For convenience in discussion, we consider gas considered the problem from a theoretical standpoint.emissions, i.e.. situations in which gas is produced Most _pcrators of closed systems .seeking "contin-in the s_il and emitted to the atmosphere; the same uous" measurements try to restrict enclosure periodsconsiderations apply to gas uptake, to quite short times, typically 15 to 20 minutes, and
The obvious disadvantage of closed systems is allow some hours for the soil gas profile to re-establishthat concentrations of gas in the enclosed atmosphere itself before measuring again at the same site (e.g.,can build up to levels where they inhibit the Blackmer et al., 1982). Open systems are, of course,normal emission rate (or, where uptake is occurring, more suited to continuous measurement.concentrations can be depleted enough to reduce gas For some gases, such as NO, the apparentexchange significantly). Denmead (1979)gives some exhalation rate results from a quite complicatedexamples from studies of the emission of NzO in closed balance between the actual emission rate, chemicalsystems (Figure 2.7). Most investigatorslimit enclesure transformations in the enclosure atmosphere, andtimes to periods in which the gas concentration changes equilibria between the emitted gas and the so;! and/orlineany with time, indicating a sic ''' ..dnhibited flux vegetation in the enclosure. Galbally ct al. (1985)rate. Others (Mosier and Hu, " n, I9;55; Galbally describe a method fi_r estimating the true emission of _'el aL, 1985) employ for ul"_ ,,at allow for the effects NO from the apparent rate that inw_tvcs the estimation
of as many as th'_ce coclliciems.t_f the increased concentration on the emission rate, Absorption of cmittctl species, such as NH3
'° I q and sulfur gases, on w:dl,_ and tubing is often a
"_..... serious problem and should always be investigated_ i before enclosures are employed. Even in llushcd
i _ / i systems, corrections may be needed when the sourcef ./
,.,'_i streng_,h is changing o, time scales that "_r, short in,0 i/ / / comparison wi_h the flush-gas residence time or the,_[_._--_-,]"-.--._1_.-- tL___ 3 sample acquisition rime (Goldan et al., 1987).
_ _ Gas produced in the .soil diffuses along a
_ ,_._ concentration gradicnt to the soil surface, whereitis
_.-t _ " dispersed into the air above. The transfer process at• _ ,,_ _ , the soil-air imerface can be described in terms of a-' _ surface-to-air transfer coefficient k defined by_dO0
.....:.:: ..... F_ = k(p,. - Pc=), (2.6)
' ..... :, where p_, and p,, are species densities at the soili surface and in the air above. If k in the enclosure is
i :i different from that in the lield, the soil and ambient gas"F .... . ; concentralions at equilibrium (when the surface flux
balances the rate of production) will also be different..0;_ I Thas, when the enclosure is first operated, there will
,= ,,oo ,,oo _.... o_ ...._ be a period in which gas concentrations in soil and....... air adjust to new equilibrium values. Estimates of the
Figure 2.7. Concentrations and fluxes '.ff N20 and soil equilibrium flux during this time will be erroneous.tcm_ratures in closed and open enclosure systems operated Denmead (1979) gives an approximate solution forside by side (from Dcnmead, 1979). Breaks in the records the time for equilibration h)llowing a step change inare where lids were removed from enclosures and then k. In the enclosure systems he describes, k was aboutreplaced. Flux of N20 in the: open system followed variation 1/10 that in the open, and equilibrium required fromin temperature of the top 0.03 m of ,coil. Removal andreplacement of tile lid had no ap,parent elfcct. The flux 15 to 90 minutes, depending on Ilow rate.of N20 in the closed system was lugh immediately after lid While exact knowledge of k is not usuallyr_placement, when N2 .3 concentration in .soilair was much necessary provided sufficient time is nile,wed forhigher than in the enclosure air, then declined as N20 in equilibration, there are some situations involving post-the enclosure built up. emission gas reactions in the enclosure, such as those
.............................._ _" ....................,.....................II,..........ix.................................................................rl.................I]II.....
199000279:3-050
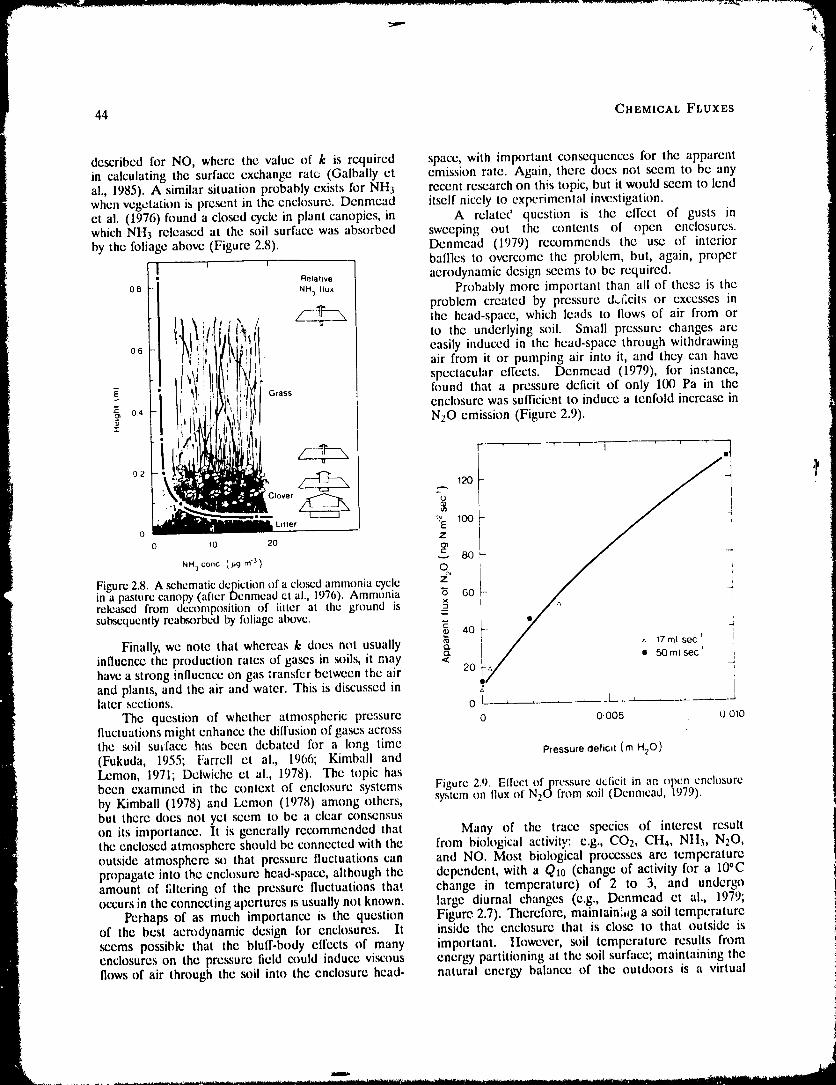
/
44 CHEMICAL FLUXES
described for NO, where the value of k is required space, with important consequences for the apparentin calculating the surface exchange rate (Galbally et emission rate. Again, there does not seem to be anyat., 1985). A similar situation probably exists for NH3 recent research on this topic, but it would seem to lendwhen vegetation is pre_nt in the enclosure. Denmead itself nicely to experimental investigation.et al. (1976) found a closed cycle in plant canopies, in A relateC question is the effect of gusts inwhich NH3 released at the soil surface was absorbed sweeping out the contents of open enclosures.by the foliage above (Figure 2.8). Denmead (1979) recommends the use of interior
] t , balllcs to overcome the problem, but, again, properRelahve aerodynamic design seems to be required.
0a !i {_'!)slli I!I_! _ _NH_t'°" Probably more important than all of these is the
problem created by pressure d,.Ccits or excesses inj , x ./ _ ._, the head-space, which leads to flows of air from or
.[_ $!_"!ii' to the underlying soil. Small pressure changes arc
06 easily induced in the head-space through withdrawingair from it or pumping air into it, and they can have
i !(ii!!_ 'l)!it' spectacular effects. Denmcad (1979), for instance,
_ Grass found that a pressure dclicit of only 100 Pa in the-- enclosure was sufficient to induce a tenfold increase in
o4 NzO emission (Figure 2.9).
lover _
0 _ Litter 100
0 10 20
NH3conC (pg m"3 ) 80
Figure 2.8. A schematicdepiction of aclosedammoniacyclein a pasture canopy (after Denmcad ctal., 1976). Ammonia 60
released from decomposition of litter at the ground is 40 LI / _ "" 1-7ml seci_' i
subsequently rcabsorbcd by foliage above, i • ,
Finally, we note that whereas k does not usually _
influenCCastrongtheproductiOnonrates of gases in soils, it may -/_/ • 50mlsec'have influence gas _ransfcr between the air 20 _/and plants, and the air and water. This is discussed inlater scclions. 0 I , , , _l ,
The question of whether atmospheric pressure 0 0.005 0o_0fluctuations might enhance the dill'usion ofgases acrossthe soil surface has been debated for a long time
Pressure defiot (m H20 )(Fukuda, 1955; I-arrcll et al., 1966; Kimball andLemon, 1971; Delwiche et al., 1978). The topic hasbeen examined in the context of enclosure systems Figure 2.9. Effect of prc_,_urcdeficit in an open enclosureby Kimball (1978) and Lemon (1978) among others, system on flux of NzOfrom soil (Dcnmcad, 1979).but there does not yet seem to be a clear consensuson its importance. It is generally recommended that Many of the trace species of interest resultthe enclosed atmosphere should be connected with the from biological activity: e.g., CO2, CH4, Nth, N20,outside atmosphere so that pressure fluctuations can and NO. Most biological processes are temperaturepropagate into the enclosure head-space, although the dependent, with a Ql0 (change of activity for a 10*Camount of filtering of the pressure fluctuations that change in temperature) of 2 to 3, and undergooccurs in the connecting apertures is usually not known, large diurnal changes (e.g., Denmead ctal., 1979;
Perhaps of as much importance is the question Figure 2.7). Therefore, maintain;,g a soil temperatureof the best aerodynamic design for enclosures. It inside the enclosure that is close to that outside isseems possible that the blull'-body elfects of many important. Ilowever, soil temperature results fromenclosures on the pressure field could induce viscous energy partitioning at the soil surface; maintaining theflows of air through the soil into the enclosure head- natural energy balance of the outdoors is a virtual
k ,_. j
1990002793-051
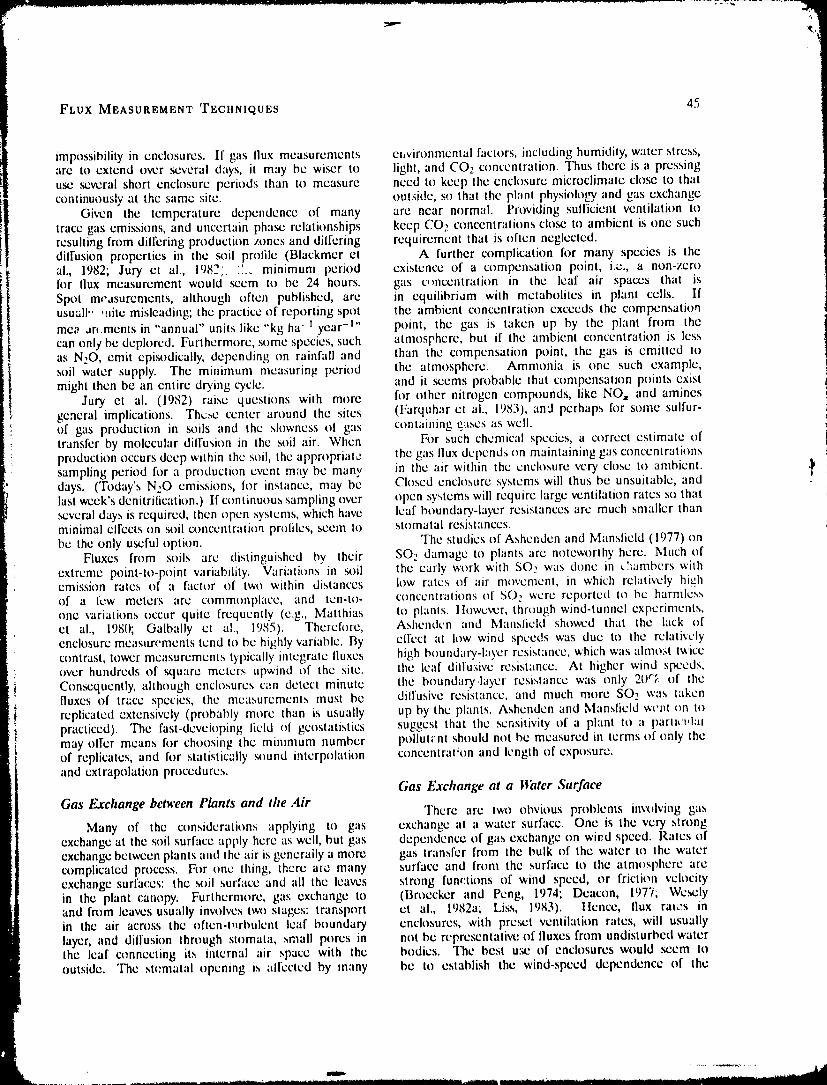
FLUX MEASUREMENT TECIINIQUES 45
impossibility in enclosures. If gas flux measurements ehvironmental factors, including humidity, water stress,are to extend over several days, it may be wiser to light, and CO2 concentration. Thus there is a pressinguse _veral short enclosure periods than to measure necd to kcep the enclosure microclimate close to that
It continuously at the same site. outside, so that the pl:mt physiolot, y and gas exchange
Given the temperature dependence of many are near normal. Providing sufficient ventilation totrace gas emissions, and uncertain phase relationships kccp CO2 conccntrations clo_ to ambient is one suchresulting from dill'cring production zones and dilrcring requirement that is often neglected.diffusion properties in the soil protile (Blackmer et A further complication for many species is the
_, al., 1982; Jury ct al., 1982_. :'._ minimum period existence of a compensation point, i.e., a non-zerofor flux measurement would seem to be 24 hours, gas c(_ncentration in the leaf air spaces that isSpot m+'asurements, although often published, are in cquilibriam with mctabolitcs in plant cells. Ifusuall,, ,uitc misleading; the practice of reporting spot the ambient concentration exceeds the compensationmea .,nments in "annual" units like "kg ha -z year -z'' point, the gas is taken up by the plant from thecan only be deplored. Furthermore, some species, such atmosphere, but if the ambient concentration is lessas N++O,emit episodically, depending on rainfall and than the compensation point, the gas is emitted tosoil water supply. The minimum measuring period the atmosphere. Ammonia is one such example,might then be an entire drying cycle, and it seems probable that compensation points exist
Jury et al. (1982) raise questions with more h)r other nitrogen compounds, like NO, and aminesgcncral implications. Thc.,,e center around the sites (Farquhar et al., 1983), and pcrhaps h)r some sulfur-of gas production in soils and the slowness ol gas containing gases as well.transfcr by molecular diffusion in the soil air. When For such chemical species, a correct estimate ofproduction occurs deep within the soil, the appropriate the gas flux dcpcnd_ on maintaining gas concentrationssampling period h)r a prt)duction event may be many in the air within the cnch)sure very close Io ambient. ,_days. (Today's N:O emissions, for instance, may bc Closed enclosure systems will thus be unsuitable, andlast week's denitritication.) If continuous sampling over open systems will require large ventilation rates so thatseveral days is required, then open systems, which have leaf bounda_-Iayer resistances are much smaller thanminimal ell'cots on soil concentratit_n prolilcs, seem to stomatal resistances.bc the only useful option. The studies of Ashenden and M_mslield (1977) t)n
Fluxes from soils are distinguished by their SO:, damage to plants are noteworthy here. Much ofextreme point-to-point variability. Variations in soil the early work with SO: was done in thambers withemission rates of a factor of two within distances low rates of air movement, in which relatively highof a low meters are commt)npl:lce, and ten-to- concentrations c)f SO2 were reported to be harmlessone varialions occur quite frequently (c.g., Matthias Io planls, llowcvcr, through wind-tunnel experiments,ct al., 1980; Galbally et al., 1985). Thcrefl)rc, Ashcnden and Manslield showed that the lack ofenclosure measurements tend tt) be highly variable. By ellcct at low wind speeds was due to the relativelycontrast, tower measurements typically integrate fluxes high boundary-layer resistance, which was almo:+t twiceover hundreds of square meters upwind of the site. the leaf dilluxive resistance. At higher wind speeds,Consequently, althc)ugh cnch).surcs can detect minute the boundary.layer resistance was only 2(1c_ of thefluxes of trace spccics, the measurements must bc dillusive resistance, and much more SO? was takenreplicated extensively (probably more than is usually up by the plants. Ashenden and Man.',lield wt'z_t _m to
' practiced). The fast-deveioping licld ol geostatistics suggest that the sensitivity of a plant to a partict,l:tl
i of replicates, and fl)r statistic::lly sound interpolation concentrat;on and length of exposure.may ollcr means h)r choosing the mimmum number pollut;:nt should not bc measured m terms of truly the
and extrapolation procedures.
Gas Exchange at a Water SurfaceGas Exchange between Plants and the Air
There arc two obvious problems involving gasMany of the consideration:_ applying to gas exchange at a water surface. One is the very strong
exchange at the soil surface apply here as well, but gas dependence of gas exchange on wind speed. Rates ofcxchange betwcen plants aud the air is generally a more gas transfer from the bulk of the water to the watercomplicated process. For one thing, there arc many surface and from the surh_ce to the atm<>sphere arcexchange surfaces: the soil surface and all the leaves strong fun_:tions of wind speed, or friction velocityin the plant canopy. Furthermore, gas exchange to (Brocckcr and Peng, 1974; Deacon, 197"/; Wcselyand from leaves usually involves two stages: transpt)rt et al., 1982a; Liss, 1983). Ilcnce, flux rmcs inin the air across the often-t,rbulent leaf boundary enclosures, with preset ventilation rates, will usuallylayer, and diffusion through stomata, small pores in not be represcntalivt: of fluxes from undisturbed waterthe leaf cennecting its internal air space with the bodies. The best u:+c of enclosures would seem tooutside. The st_matal opening is allcoted by many be to establish the wind-speed dependence of the
.................... -''Ill| [llll / [I ..... r ................ Ill I
1990002793-052
40 CIIEMICAL FLUXES
rclcv'ant transfer coclricients h)r application to "real- as well as surface gas concentrations. The greatworld" situations, as Sebachcr et al. (1983) have done importance of all the_ fitctors to gas transfer betweenh)r methane emission. However, as thc_ authors lhe bulk of the water and the surface in shallow bodies
point out, a limitation in this procedure is that it is of walcr has hccn demonstrated by Lcuning ct al.usually not possible to rcprodu-'c in enclosures the (1984) and Trevitt ctal. (1988).wind-wave interactions and bul '_le cscapcs of largerwater bodies, both of which art..:elicvcd to enhancega._ous emissions in high winds (e.g., Wc._ly ctal., Conclusions
1982a). The discussion ilere points out that there is noA second problem in the use of enclosures, single system or technique for flux measurement that
particularly over shallow bodies of water, is possible is universal. Rati,er, a combination of techniques mustchanges in the energy balance: changes in the receipt be used, depending on the environmental conditionsand loss of radiant energy because of the enclosure and the technology of species measurement. There arcwalls, changes in energy partitioning because of the also situations whclc llux measurements may not bedil[crcnt net radiation and dil[crcnt wind speeds, and feasible by any means known at present, for example,changes in the resulting surface temperature. In in cases of extreme horizontal inhomogcneify or ofturn, these can bc expected to inllucncc thermal species with extremely short lifctimcs or small fluxes.stratilication and convection patterns in the water
!
1990002793-053
/
3 STATUS OF CHEMICAL SENSORS FORFLUX MEASUREMENTS
S. M. Anderson, A. C. Delany, F. C. Fehsenl'cld, P. D. Goldan, C. E. Kolb,B. A. Ridley, and L. P. Steele
Typical mixing ratios f:)r the prierity atmospheric techniques fi)r carbon monoxide, methane, andtrace species discussed in Chapter 1 range from nonmethanc hydrocarbons. The third _ction presentsthe parts per million to the parts per trillion a summary of methods fi)rdetection of sulfurspccies,level. Accurate measurement of such sinai! chemical while the linal ._clion di._us_s particulate and aen)solconcentrations under lield conditions, particularly of detection.reactive species such as Nil.t, NO2, SO,,, It:O2, C! I,O,
and 03 is a major continuing challenge for atmospheric Chemical Sensors for Oxidant and!.;cienti_;ts. Odd Nitrogen 'The stringent requirements for chemical _nsors
utilized in the micrometeorological tlux measurement Becau_ of the close links between the chemistrylechnioucs presented in Chapter 2 pose an even of the nonradical oxidants O._ and H.,O:, and oddq)ugher challenge. The fast-response _nsors (I nitrogen compounds, including NO, NO:, NO3, N205, 1to 10 Hz) needed for tower- or aircraft-ba._d IINO_, IINO,, PAN, and NII._, it is frequentlyeddy-correlation measurements or tl", high-precision necessary it) measure concentrations and/or flexesta)ncentration measurements needed for gradient of many species simultaneously in order to acquireprolile studies (standard deviations of less than IU:) sufficient insight into atmospheric protests. This
I require _nsitivity and/or accuracy that is, in general, .v.:ction will review the status of de_ection technologie_beyond thecurrcntstateofthcart lol measurcmentsof %r Ihe._ species and identify Ihosc species thatmost trace species concen!rations. Although wc do not can adequately ",,olvc high-frequent3' fluctuations asexplicitly discusserrorsin Ilux measurement induced by required b) the eddy-correlation Ilux measurementnonlinear sensor response, they c;m also he :.,J_nilicanl Icchnique.in measuring means and Iluctuations of trace species.
Kristcnscn and Lcnschow (1_)8,_) have examined the Ozone Detectors and Flux Divergence Measurementseffects of nonlinear dyaamic ._n:,or resptm._ onmeasured means in a turbulent environment, but it In situ analyzers for ozone have been developedappears that no one i_asconsidered its ellcots on Ilux to the point where major li,:ld measurement programsmeasurements, arc feasible without new technology. Two kinds of
This chapter is a review of ;.l',_tilable chemical detecting mechanisms arc widely used: chenfilumines-licld measurement tecnntqucs for the trace .,,pcctes cencc and ultraviolet photometry. Chemiluminescence,currently recognizcdasimportant m thc e,.,olvmgg_obal using nmic oxide as a reagent, has been used toatmosphere. This review also includes discussion m:tke instruments with very. fast response (bandwidthsof capabilities now uadcrgoing development and greater than 20 tlz), high ._nsitivily (below 0.1 ppbv),testing that could be a_,ailable for Iield work in the high specilicity, and very low drift during operation.next year. Particular emphasis is placed on Iho,,c This melhod is preferred fl)r many eddy-correlaliontechnologies that _em most likely (either now or with measurements from both aircraft and towers.further development) to satisfy the requirements of It is of particular importance tba!. the completemicromctcorological Ilux measurement procedures, mechanism oi nitric oxide-ozone chemiluminescence
The following scctu)ns review contemporary tcch- is well known, including all important kinetic rateniques fl_r trace s,,xzcies n,easurement. The lirst section constants. Thus, it is possible, in principle,summarizes method:, fi_r the oxidants, ozone and to esiahlish a calibration and measured operatinghydrogen peroxide, and mt'.mht:rs o[ the odd nitrogen parameI.ers from the_ data. llowtzvcr, for practicalfamily. The folh)wing ,_ctton dl,,,cu,,._s measurement rea_ms, chenuluminesccnce instruments are normally
47
D J.ai
1990002793-054
48 CHEMICAL FLUXES
caiibrated against a photometric analyzer, which is an few ppbv) that gradient applications are precluded inabsolute standard, many ::ommon meteorological situations. The faster-
Nitric oxide-ozone chcmiluminc_ence has three responding versions are a!_o suitable for tower eddy-limitations that, fortunately, do not signilicantly reduce correlation measurements. It .should be noted thatits applicability. The first is a slight interference practical UV photometry is intrinsically a dill'crentialfrom water vapor, which is easily removed from eddy- measurement. This property can and ought to!lux measurements of ozone if simultaneous fast- bc applied to gradient measurements. The majorresponse humidity measurements arc made (Lcnschow interference of this category of instrument is lightel al., 1981). The second limitation is the shot scattering from ambient aerosols. While liltcrs arenoise arising from discrete photons detected by the employed by some im,estigators to remove particles,instrument. Since this noise is uncorrelated with h,cy can introduce additional uncertainties into themeasurements of vertical velocity, it does not bias measurements.estimates of the vertical flux by eddy correlation. In addition, tunable diode laser (TDL) IR absorp-Moreover, the current generation of instruments has finn spectrometers and luminol chemiluminescencesulltcicntly high sensitivity that shot noise does not detectors are under development for in situ men-contribute signilicantly to llux uncertainty. Shot suremcnts. The availability of satisfactory techniquesnoise does, however, contribute to both the power for in situ measurement lessens the requirement forspectrum and variance, of the ozone signal. Since dcvelopmoet ol-TDL and luminol techniques for fast-at high frequency (in the inertial subrange region response ozone r,teasureracnts. Furthermore, TDLof atmosphcric turbulence) the ozone spectrum is ozone instruments resemble those discussed for otherpioportional to the -5/3 power of frequency, shot species in later subscctions. Therclore, '.hey will notnoise, which is white, tcnds to obscure the power be discus_d further hcre.
!
spectrum for many typical atmospheric conditions. Remote sensors for tropospheric ozone con-This limits the use of dissipation techniques for ccntration proliles arc largely limited to IR andestimating ozone flux. Currently available sensitivities UV differential absorption lidar (DIAL) systems.are prob,',bly adequate for using diss,pation techniques Both types of systems have undergone extensivewithin a few meters of the surface over land but development in recent years, with the IR sensorsare likely to be inadequate for measurements over offering somewhat greater spatial resolution at thewater. If thcre is a strong need to cmpl,)y dissipation expense of greatly reduced range. UV DIALtechniques, the sensitivity of the nitric oxide-ozone systems have bccn used to obtain ozone prolilcanalyzers can probably bc increased to the point measurements at high resolution (50 m) through thewhere power spcctra over land could be measured to entire troposphere. The cxact performance of anfr,..qucncics a:, high as 10 tIz. The third limitation is ozone DIAL system is, however, more dependentthat the reagent nitric oxi,te is both toxic and difficult on atmospheric conditions than arc lidar windto remove from ti_e vacuum pump exhaust. Thus, thcre prolilers. Ozone concentration, temperature, aerosolis a potential h_r c_ntaminating NOy measurements in distributions, and the spatial and temporal resolutioncollocated surhtce experiments, requirements all affect the operational parameters
Chemiluminescence with ethylene or other olelins, selected for a particular measurement. This diversitysuch as cis-2-bute_:c, is also used to measure ozone, of operational parameters, although providing anThis technique has the fi)llowing disadvantages: (1) important means for optimizing the pcrft3rmancc tJf thethe reaction is slower and less sensitive than nitric instrument for a particular measurement, ncvcrth,:icssoxide chcmilurnincscencc, (2) the mechanism of light makes evaluating "typical" performance characteristicsproduction is much slower, and (3) the temperature difficult.dependence of light emission is much greater. Suitably
designed units can have a bandwidth as large as ! Hz, llydrogen Peroxide Detectorsmaking them suitable for tower-based eddy correlationat sampling heights of >5 m. An advantagc is A number of techniques arc emerging tothat the reagent oleiin does not interfere with NO_ measure H202. However, these techniques dodetection; however, it may bc a factor if hydrocarbon not yet have the sensitivity and/or response tinwsmeasurcmc_,ts are collocated with me ozone sensor, needed to measure It20., Ilux by eddy-correlation
Ultravk,let photometry is the basis of practical, techniques. Thus, experimental flux measurements areabsolute ozone measurements generally made at the currently restricted to gradient and enclosure studies.mercury 253.7 nm line. Commercial units have Instrument comparisons have been carried out usingbandwidths of 0.03-0.{}5 Hz, while state.of-the-art many of the currently available detection methods, butrc:;earch instruments have 1 Hz sampling (Prolitt and the results from these studies arc not yet available. TheMcLaughlin, 1983; Prolitt, 1985). Any of these devices newly emerging techniques include: (1) the cnzymecan be used h)r gradient measurements, although catalyzed dimcrization of p-hydroxyphenyl acetic acid
i the former typically have such a low precision (a with continuous Ilow concurrcnt extraction (Lazrus ct
1990002793-055
STATUS OF CHEMICAL SENSORS 49
al., 1986), (2) the same enzyme _nalytical technique Detectors for Odd Nitrogen Specieswith diffusion collection of the HzO2 (Hwang andDasgupta, 1986; Dasgupta and Hw:mg, 1985; Dasgupta Whereas specilic fast-response instruments haveet al., 1986), (3) the enzyme analytical technique with been developed and applied to micrometcorological
flux determinations of 03 (Pearson and Stcdman, 1980;nitric oxide prctitration of the ozone and subsequentcollectkm of the H202 in an i_.'4pinger (Tanner ctal., Lenschc)w et al., 1981; t_regory, 1987), instrument1986), (4) tunable diode laser absorption spectroscopy dcveh)pmcnt for odd nitrogen has bccn directed(Slemr ctal., 1986) and (5) cryogenic trapping with towards maximizing sensitivity and specificity forpcroxylatc chcmilumincscc_:cc detection (Jacob ctal., ambient conccntratkms. With a few exceptions (Dclany1986). Hartkamp and Backhausen (1987) review and ct al., 1986; Stcdman, personal communication),evaluate several techniques for measurement of H,O2. little attention has been given to the provision
" of fast response for eddy-correlation applications.A highly selective, general-purpose detection Conscquently, most measurements of the surface
method for many compounds is infrared TDL absorp- exchange of odd nitrogen constituents have usedtion spectrometry. A icau salt diode laser produces enclosure, gradient, or budget techniques (Galbatly andtunable radiation ha,,ing a lincwidth that is narrow Roy, 1978; Johansson, 1984; Williams et al., 1987;compared to the Doppler-broadened vibrational- tlucbert and Robcrt, 1985). The spccics listed inrotational lines for 1{_O2 and thus permits high selec- Table 3.1 can be divided into three categories. Thetivity. The laser repeatedly scans a single vibrational- first includes those that hold promise for near-futurerotational line: this serves to cancel background noise eddy-correlation mcasurcments using either towers orand allows me_:.,.arcmcnts of absorbances lower than aircraft. The second includes those species for which10-5. Absorption by H202 takes place within a White monitoring techniques currently remain restricted ,ocell having a base path of 1.5 m and is opcratcd at a slower sampling methods. The third includcs thosepressure _,f 25 torr to minimize pressure broadening spccics for which rcliablc tcchniqucs for evcn low ._of individual lines. Present instrument configurations sampling rates arc not yet available, whcre dctailspermit response times of 0.6 rain. with detection limits remain to be, resolved before application to fluxof approximately 0.3 ppbv H, O2 with extended (>5 measurements, or where fi_rther instrument tests arcmin.) signal averaging (c.f., Slemr et al., 1986). needed.
The enzyme-supported detection of H:,O2 is an The first catcgory includes the TDL, LIF, andinnovative approach to detection of trace species in chcmilumincscence instruments dcsigned to mcasurethe atmospherc. Lazrus ctal. (1986) -eport the NO. Many of these detcctors haveundcrgone measure-detection of H2Oz and organic peroxides (ROOH) mcnt comparison tests successfully and have imprc:_sive
sensitivities at low frequency (<1 Hz). Consequently,by first scrubbing them from the air into an aqueoussolution using a continuous llow concurrent extraction, for locations where the mean NO concentrations arc
near or in cxccss of 0.1 ppbv, these instrumentsNext, 0.4 ml m-_ of scrubbing solution is drawn may be adequate for moderately fa_t-rcsponse (<:.5with the air sample into a glass coil; the velocity Hz) llux measurement :,pproaches. For cxaml_l-c,of the air spins the scrubbing solution to the walls, the fast-response 03 instrument of Pearson ant]and the peroxides are dissolved into solution. The Stcdman (1980)utilizes the NO/O_ chemiluminesccncccollection efficiency for H:,O2 is estimated :3 be 100%;for methyl hydroperoxidc and peroxyacetic acid, it is technique with NO as the reactant. Although it ismuch easier to generate high-reactant cont,:ntr_,icmsabout 60%. The collection cll]cicncy is lower for the of NO than the reverse, where 03 is used as theorganic hydroperoxides with higher molecular weights.The analytical chemistry h)r H202 is based on the reactant, it shc;uld be possible to extend the frequcncyresponse of the chemiluminescence techniqe.e to 5-10reaction of pcroxidcs with p-hydroxyphenylacctic acid Hz. ttowever, it must bc emphasized that all but one(POPHA) in the pre.sencc of the enzyme pcroxidase, of the NO or NO2 instruments require an inlet systemThis reaction forms the dJ,ncr of POPHA, which for aircraft or tower applications. The exception isfluorcsceswith an cmission wavclc:agth of 42(} nm when the open cell, ambient pressure infrared diode laserexcited at 326 nm. Both H202 and .,,nort-chain organic technique, which is currently under development (Kolbhydropcroxides drive the analytical reaction. ct al., 1986; Anderson and Zahniscr, 1988). Most
Current instruments have detection limits of of these instruments arc large and are not "turn-key"approximately 0.15 ppbv. The principal artifact operable. Clearly, adequate investigation (on-sitc andidcntihcd is 03, which may h)rm some t-I202 in labor_,tory) of inlet lag times, surface effects, and tructhe solutions used in these instruments (> 0.1 ppbv frequency response are necessary. Such tests wouldH202 equivalents). At present, the response time also be required h}r the direct NO2 measurement(10% to 9(}% for squarc wave analyte injection) is instruments of Tablc 3.1 (i.e., TDL, luminol, and laser-approximately 100 s. induced fluorescence).
1990002793-056
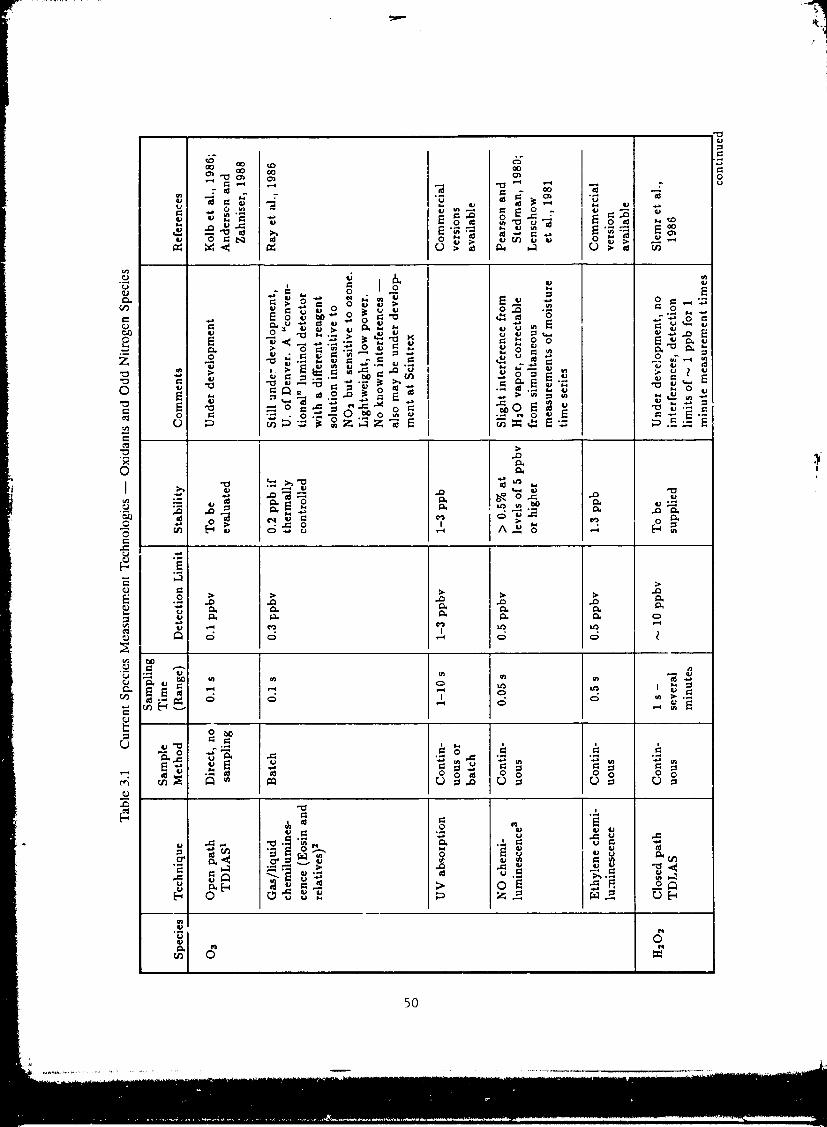
5O
1990002793-057
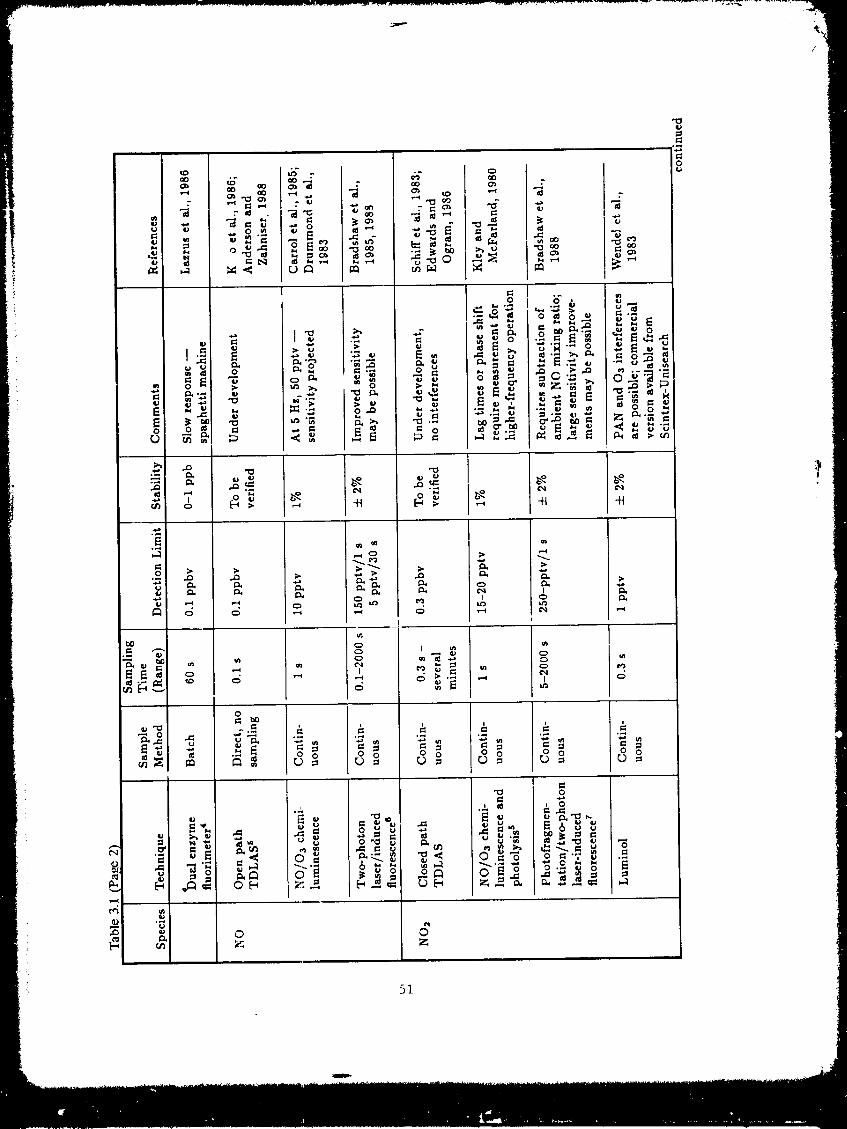
/
1990002793-058
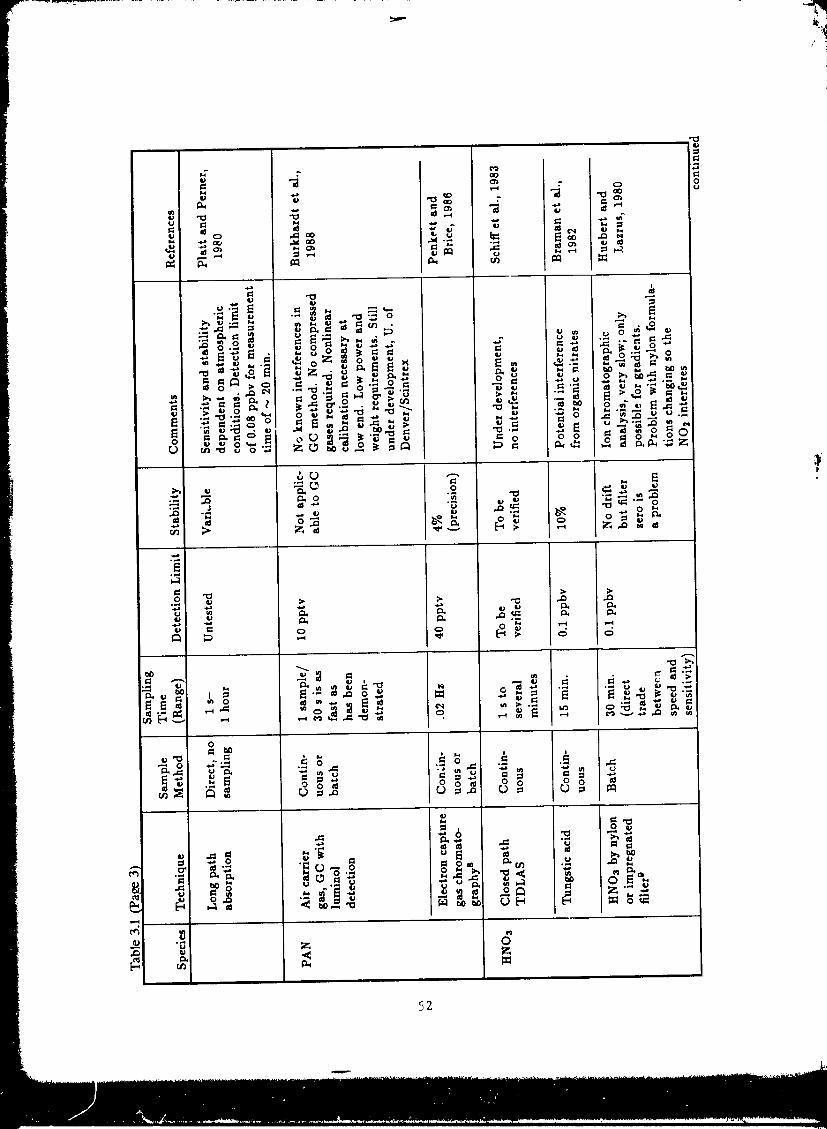
/
_2
1990002793-059
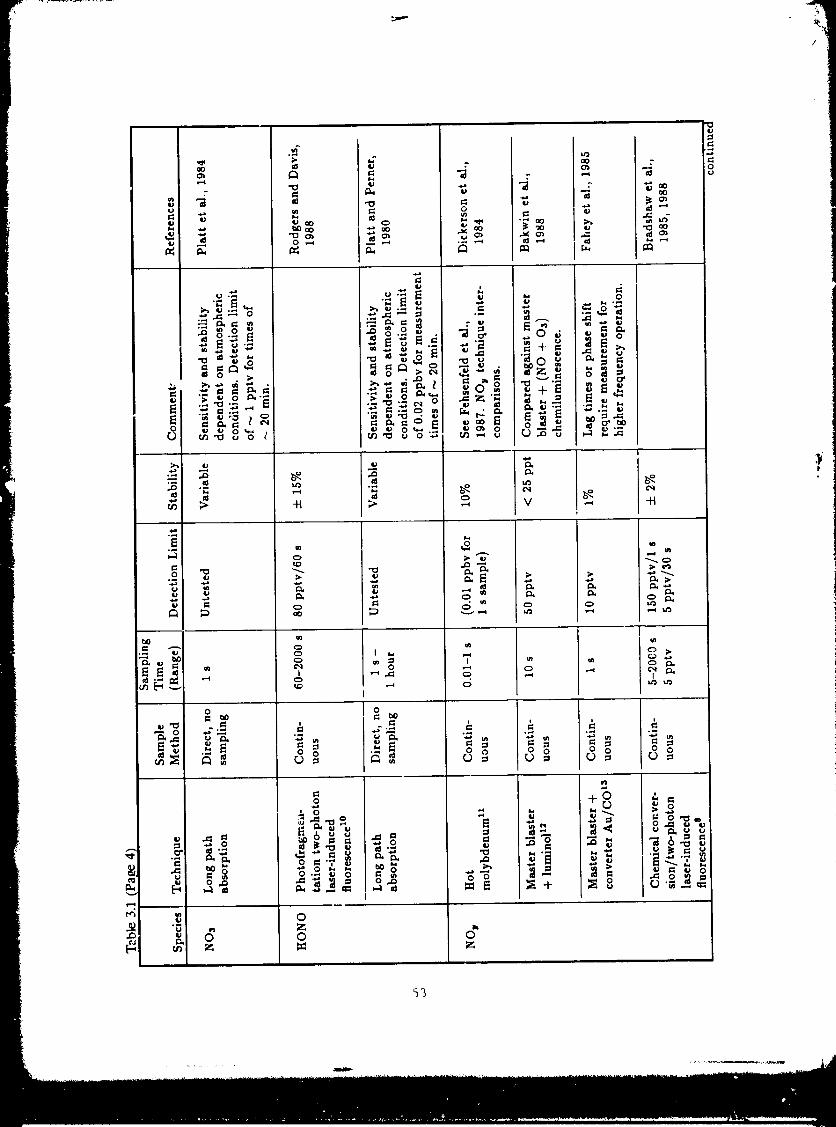
_3
1990002793-060
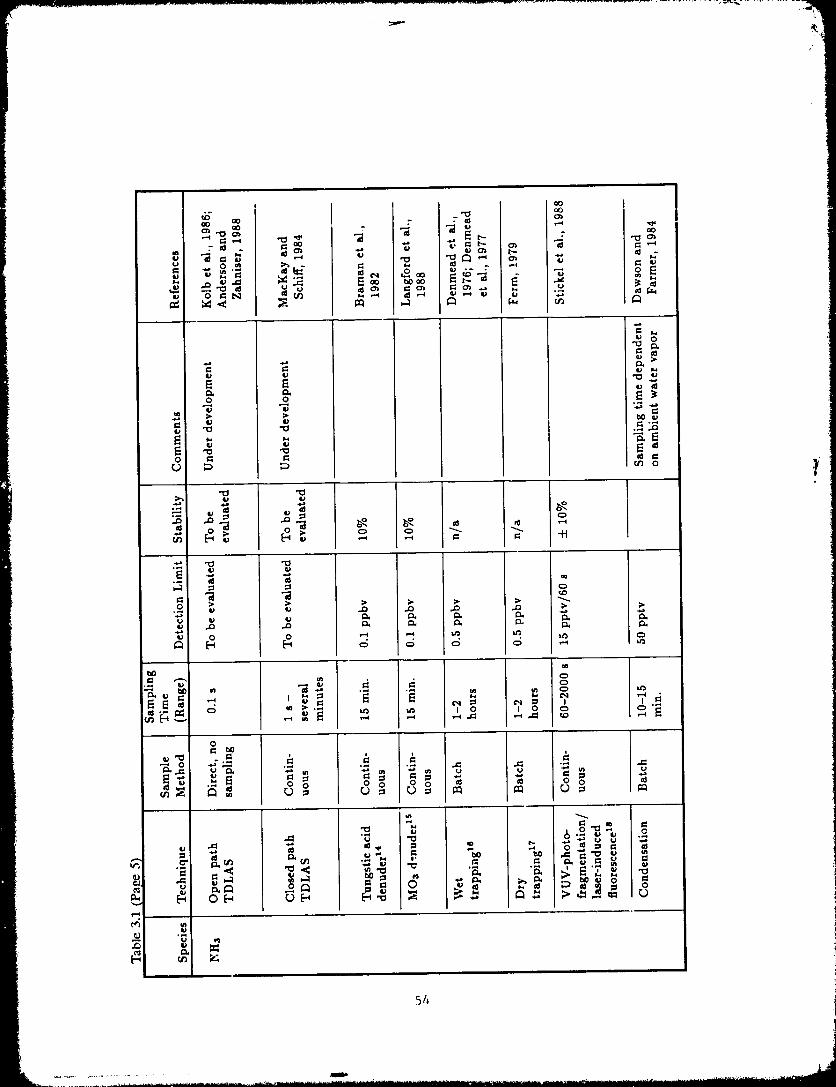
............................................................. ........................................... ........................................................................ Ill ....... iill I " "_ I'll[
1990002793-061
55
1990002793-062
56
1990002793-063
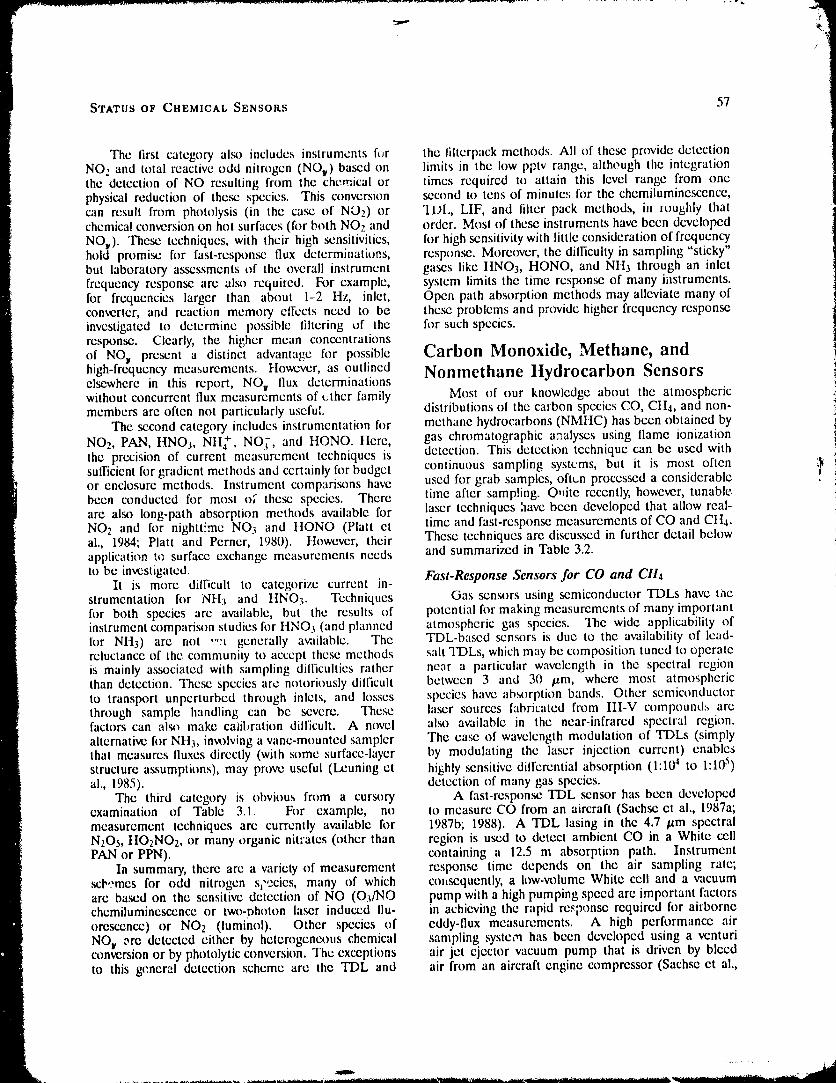
/
STATUS OF CHEMICAL SENSORS 57
The lirst category also includes instruments f_Jr the liltcrpack methods. All of these provide detectionNO2 and total reactive odd nitrogen (NO_) based on limits in the low pptv range, altheugh the integrationthe detection of NO resulting from the chemical or times required to attain this level range from onephysical reduction of thc_ species. This conversion second to tens of minutes for the chemiluminescence,can result from photolysis (in the case of NO2) or "[DL, LIF, and liltcr pack methods, in roughly thatchemical conversion on hot surfaces (for both NO2 and order. Most of the_ instruments have been developed
NO_). These techniques, with their high _nsitivitics, h_r high sensitivity with little consideration of frequencyhold promise for fast-respon_ flux determinations, response. Moreover, the difficulty in sampling "sticky"but laboratory assessments of the overall instrument gases like HNO3, HONO, and NH3 through an inletfrequency response are also required. For example, system limits the time rcsponso of many iilstrumcnts.for frequencies larger than about 1-2 Hz, inlet, Open path absorption methods may alleviate many ofconverter, and reaction memory eftcots need to be these problems and provide higher frequency responseinvestigated to determine possible filtering of the for such species.response. Clearly, the higher mean concentrationsof NO_ present a distinct advantage for possible Carbon Monoxide, Methane, andhigh-frequency measurements, tlowcvcr, as outlined Nonmethane ltydrocarbon Sensorselsewhere in this report, NOy flux determinationswithout concurrent flux measurements of t-ther family Most of our knowledge about the atmosphericmembers are often not particularly useful, distributions ol the carbon species CO, CH_, and non-
The second category includes instrumentation for methane hydrocarbons (NMHC) has been obtained byNO2, PAN, HNO3, NH_, NO_, and HONO. tlcre, gas chromatographic analyses using flame ionizationthe precision of current mcasurcmcm techniques is detection. This detection technique can be used withsufficient for gradient methods and certainly for budget continuous sampling systems, but it is most often ;_or enclosure methods. Instrument comparisons have used for grab samples, oftt_n processed a considerable tbeen conducted h_r most of the_ species. There time after sampling. O,ite recently, however, tunableare also long-path absorption methods available h_r laser techniques have been developed that allow real-NO2 and for nighttlmc NO3 and IIONO (Plattct time and fast-response measurements of CO and CH4.al., 1984; Platt and Perncr, 198(}). However, their These techniques are discussed in further detail belowapplication t_ surface exchange measurements needs and summarized in Table 3.2.
to be investigated. Fast-Response Sensors for CO and CH4It is more difficult to categorize current in-
strumentation h_r NH3 and HNO3. Techniques Gas sensors using semiconductor TDLs have thefor both species arc available, but the results of potential h_r making mcasurementsof many importantinstrument comparison studies for I|NO3 (and planned atmospheric gas species. The wide applicability of10r NH3) are not ,":t generally a_dlable. The TDL-bascd sensors is due to the a_dlability of lead-reluctance of the community to accept these methods salt TDLs, which may be composition tuned to operateis mainly associated with sampling difficulties rather near a particular wavelength in the spectral regionthan detection. These species arc notoriously difficult between 3 and 30 p.m, where most atmosphericto transport unperturbed through inlets, and losses species have absorption bands. Other semiconductorthrough sample handling can be severe. These laser sources fabricated from III-V compound:, arefactors can als,_ make caiibration difficult. A novel also available in the near-infrared spectral region.alternative h)r NH3, involving a vane-mounted sampler The ease of wavelength modulation of TDLs (simplythat measures fluxes directly (with some surface-layer by modulating the laser injection current) enablesstructure assumptions), may pnwe useful (Lcuning et hishly sensitive differential absorption (1:10 _ to 1:105)al., 1985). detection of many gas species.
The third category is obvious from a cursory A fast-response TDL sensor has bccn developedexamination of Table 3.1. For example, no to measure CO from an aircraft (Sachse et al., 1987a;measurement techniques arc currently available for 1987b; 1988). A TDL lasing in the 4.7 p.m spectralN205, HO2NOz, or many organic nitrates (other than region is used to detect ambient CO in a White cellPAN or PPN). containing a 12.5 m absorption path. Instrument
In summary, there arc a variety of measurement response time depends on the air sampling rate;scb,-mes for odd nitrogen s_'ccies, many of which c¢mscquently, a low-volume White cell and a vacuumare based on the sensitive detection of NO (O3/I"10 pump with a high pumping speed are important factorschemiluminescence or two-ohoton laser induced flu- in achieving the rapid response required for airborne
orescence) or NO2 (luminol). Other species of cddy-llux measurements. A high performance airNOy ere detected either by heterogeneous chemical sampling system has bccn developed using a vcnturiconversion or by photolytic conversion. The exceptions air jet ejector vacuum pump that is driven by bleedto this gc.neral detection scheme are the TDL and air from an aircraft engine compressor (Sachse ct al.,
1990002793-064
58 CHEMICAL FLUXES
1987b). This TDL sensor has achieved a l/e response allows variations in the flux rate during the samplingtime of 70 ms using a 1.5 liter White cell volume and a period to be readily identilied. The rapid response2,500 t min- 1 pumping speed (at I(X}torr). Substantial of the technique, combined with the chamber design,reductions (by a factor of three or moze) in White cell allow any disturbances to natural systems during lluxvolume are readily achievable and will res,llt in further measurements 1¢)bc kept to a minimum.improvements in the time response of TDL gas sensors.
Recent modifications of this instrument have Slow-Response Methods for llydrocarbonsenabled it to make simultaneous, fast-responsemeasurements of CO and Ctt4 during the ABLE- Currently, fast response sensors for NMtICs arc3A expedition to Alaska. Methane detection is not available. Measurement of species such asaccomplished using an additional TDL lasin_ in the ethylene, propene, isoprene, and the monoterpcncs7.6 /_m spectral region. By beam combining the requires collection of discrete samples of sufficientradiation from the 4.7 /_m and 7.6 ,urn TDLs using volume to permit quantification by gas chromatog-a dichromic beam splitter, the two laser beams follow raphy. Coosequcntly, enclosure and tower (gradient)a common path through the White cell, permitting procedures arc applicable to the measurement ofsimultanca)us differential absorption measurement of NMIIC fluxes but eddy-correlation methods currentlyCO and CH4. A "two-color" detecter consisting of are not. Table 1.11 lists the ranges for ambienta sandwich structure of InSb on HgCdTe enables hydrocarbon concentrations observed in various envi-independent detection of the differential absorption ronments. Concentrations of many NMHCs in cleansignals occurring at the two wavelengths, oceanic air masses may be as low as 0.1 ppbv (Bonsang
While TDLs are extremely versatile, they require el al., 1988), which is close to the detection limitcareful handling and significant talent ! >operate. Fur- of current methods. In contrast, ambient isoprene ,_thermore, they consume considerable power, especially concentrations, which fall in the ppbv range in the )if the laser must operate at below 77 K (liquid nitrogen vicinity of hardwood forests on hot summer afternoons,temperature). Many of these problems can be avoided can be measured with certainty.if a gas laser can be substituted h)r the TDL. Grab-sample methods for NMHC and CIt4
measurements have existed for several years (SteeleRare gas laser infrared absorption detectors ct al., 1987; Sexton and Wcstberg, 1979; Roberts et
rely on accidental close coincidences between an al., 1983; Rudolph ct al., 1981; Singh et al., 1985).atomic line of the lasing medium and an appropriate Whole-air samples arc collected in either glass ormolecular transition. Such coincidences occur for clectropolishcd stainless steel containers. Analysis isHeNe and CH4 (2,947.9 cm-t), and HeXe and N20 by gas chromatography (GC) with flame-ionization(2,467.4 cm-l), among others. Zccman splitting of the detection. Preca)ncentration by cryogenic trapping oflaser gain line over a portion of the plasma column the NMHC is normally necessary prior to injection intoprovides three possible emission wavelengths, which the chromatograph. The sample collection methodare scanned by modulaling the cavity length to sense readily allows h)r sampling at dill'trent heights ondifferential absorption (Kolb ctal., 1986; McManus et a tower or aircraft. Tethered balloon samplingal., 1989). Depending on the nature of the laser power can be accomplished by collection into teflon bagscontn)l loop, the instruments can bc configured to (Zimmerman ct al., 1988).detect either absolute concentration or, with increased Techniques h)r carbonyl species sampling include.,_nsitivity, small concentration fluctuations as needed high-pressure liquid chromatography (HPLC) of sam-h)r eddy correlation. The lasers are small and rugged, pies collected on impregnated cartridges (Kuntz ct al.,and can be coupled to either ()pen- or closed-path 1980) and cryogenic collection into glass loops followedmultipass absorption cells. Detection levels arc similar by analysis wi:h a flame ionizalion detector (FID)-to those ob)ainable with TDL sys!ems, since similar equipped gas chromatograph (Snidcr and Dawson,diil'ercntial absorption signal processing is involved. 1985). The cartridge method collects carbonyl
A unique fast-response method that has been compounds by passing air through silica cartridgesused for CH4 chamber flux measurements utilizes a impregnated with 2,4.dinitrophenylhydrazone. Samplesgas-filter-correlation IR absorption analyzer coupled are then eluted from the cartridges and analyzedto either a closed or an open sampling chamber by high-pressure liquid chromatography (ItPLC). The(Scbacher, 1978; Sebacher and Ilarriss, 1982; Harriss GC technique provides measurement of many C2-et al., 1982; Harriss el al., 1985). This technique C5 carbonyls with detection limits in the lower pptprovides continuous sampling and analysis of the air range. Both of these methods are appropriate forin the chamber, with high precision (4-10 ppb for measurements on towers as well as aircraft.CH4) and a respon_ time of 1 s, enabling CH4 Several methods exist or are under dcvclopmcntIluxes as small as 10-12 kg CH4 m -2 s -t to be to measure organic acids. These include condensationmeasured in a 15-minute sampling and analysis period, sampling (Farmer and Dawson, 1982), _t mistThe continuous measurement of CIt4 in the chamber chamber (Talbot et ai., 1988), denuder tubes (Norton,
1990002793-065
/
STATUS OF CIIEMICAL SENSORS 59
198(,), and impregnated filters. Results from an excited sp,.cies whose subsequent radiation can servet intercomparison of these methods during June 1986 i_s a dci,'ction mechanism. Spurlin and Yeung (1982)! showed agreement between all systems except for the claim a detection limit of 3 ppbv for II28 by using! impregnated liltcrs (Kecne et al., 1989). Most of the its reaction with CIO2. Kelly ctal. (1983) obscn,cd
existing data have been collected by the u.,u.' of the the chemiluminescent reaction of a number of sulfur-condensation method--cooling a highly polished, clean bearing compounds with 03 and showed a detection ofsurface below the dew point temperature so that a DMS in the low ppbv range, with higher sensitivity forfilm of water collects on the surface, ttighly soluble CIt._SIt and much lower sensitivity for H:S. Perhapsgases are collected with essentially unit efficiency, the most promising of the chemiluminescent detectionIon chromatography or km exclusion chromatography techniques is that described by Nelson et al. (1983),provides measurement of organic acid concentratkms in which sulfur compounc, react with F2. Recent workin the condensate. The_ concentratkms are then u_d with this type of detector shows promi._ of achievingto calculate gas-phase levels of the acids. Tower and detection limits of ,.o1 pg S per sample, somewhataircraft measurements are possible with all current lower than that achieved with an SF6 doped FPD. Sincesystems with the exception of those that use the this response to different sulfur compounds varies acondensation technique, great deal (negligible response to SO2, COS, II2S, and
CS2 was reported), its use in the measurement of sulfur
Sulfur Species Chemical Sensors Iluxes in the atmosphere appears limited.A reccnt development in sulfur gas detection is the
As discussed in Chapter 1, the mixing ratios of use of v,I electron capture detector (ECD); (J_Jhn._'msulfur specizs in the atmosphere, in almost all regions and Lovclock, 1988). Sulfur-bearing o)mpoundsfrec of int':ustrial pollution, are < I ppbv. The may be conv.'.rted to SF6 at moderate temperaturesmeasurement of such low concentrations of reac',ive (,-, 2(X)*C) by reacting them with AgF2. Since theand labile sulfur compounds of interest, such as resulting SF_, has a large electron capture cross _ction, :_tl?S, CtI3SH, SO2, and CH_SCtl._ (DMS), and even it may be readily detected with an ECD, thereby taking *the more stable species COS and CS2, has been a advantage of that detector's extremely high sensitivity.serious challenge and the most signilicant motivation The AgF2 is replenished by supplying a small amountfor the development of sulfur-specific detectors. Those of Iluorinc gas to the sample stream. Since the ECDdetectors currently available or known to be under is also ._nsitivc to F2, the excess F2 must be removeddevelopment are listed in Table 3.3, together with the by reacting it with I12 on a hot palladium catalyst.sulfur species for which they are applicable, estimated Although this technique is in its infancy, the proccdaresensitivities, and sampling-related information, is fraught with technical dilliculties, and its application
is likely to be limited to skilled practitioners, it ollk'rsDetectors Sensitive to a Variety of Sttifttr Compounds great promise. The method should yield a detection
The oldest (,,,2{} years) of the listed detection limit some hundred times lower than even the dopedtechniques is the Ilamc photometric detector, or FPD, FPD.Its _nsitivity to sulfur compounds relies on thermaldccompositi,m of the compounds in an oxy.hydrogcn Application to Total Saltier Measurementsflame with the subsequent occasional fl)rrnation off an Since both the FPD- and ECD-bascd detectionelectronically excited $2 molecule that can radiate in schemes described above are sensitive to all sullt, -
the near UV. The detection of photons from mose bearing compounds, either may be used as a totalmolecules that escape collisionM de-excitation is thesignal-producing mechanism. Since the FPD relies sulfur dctectt:,r, as well as in systems where thesulfur compounds are spcciatcd. The undopcd FPDupon the formaiion of an $2 molecule, its sulfur is capable of detecting changes in sulfur Ilow orrcspon_ is inherently nonlinear. Recently, a numberof workers (D'Ottavio et al., 1981; Goldan ctal., approximately 3 x i11It molecules s-t and the doped1987) have lowered the detection limit of the FPD and FPD of approximately 4 x 10t° molecules s-t undercircumvented this nonlinearity by intentionally adding optimum circumstances. Since typical sample flows_)me con_nient volatile sulfur species to the flame may be made as high as 0.2 t rain -t STP, thesecombustion gases. If the detected sulfur s;)ccics correspond to mixing ratios of approximately 3 ppbvconcentrations are small compared to the added and0.5 ppbv, respectively. Thus, the FPD has sufficientspecies (commonly SF6), the differential response is sensitivity for total sulfur measurements, at least inquasi-linear, somewhat polluted environments, and much of the
A number of chemilumincscent sulfur detectors deposition Ilux work to date has utilized an FPD-that have recently been developed are also included in based system. By minimizing sample throughput times,Table 3.3. The_ depend upon the reaction of a specific response times of the order of a second (or slightly less)class of sulfur compounds wih. a gas-pha_ chemictl can be achie_,ed, but the FPD remains inherently noisy,reagent to produce electronically or vibrationally even for levels of sulfur gases (predominantly SO:)
19900027.q3-nRR
(_ CHEMICAL FLUXES
fi)und in moderately polluted air. Pressure fluctuations tcchhiquc. In this method, a parent sulfur speciesallcoting ;.he flame and collisional quenching by other (SOz, IIzS, or CS2) is photodissociatcd by 193 nmminor atmospheric species (such as C02 and H20) photons from a puled ArF excimcr laser. Thepre_nt operational problems thai were difficult to resulting molecular fragments (SO, ItS, or CS) areovercome in early applications of FPD techniques in then detected by induced lluor,:scence from a tunableeddy-flux studies, and which remain tt_e sources of dye laser. This innovative technique is estimated to becontinuing concern. FPD detectors opt .,/.ed for capable of a detectkm limit of ,-. 150 pptv but is morefast response have been utilized for eddy-correlation equipment intensive than the TDL approach.measurements of total sulfur deposition in many Botit of these techniques exploit the specificity ofstudies in moderate;y polluted environments (e.g., spectral delcction, along with the high sensitivity andHicks et al., 1986a). temporal resolution often possible with sophisticated
The inherently greater sensitivity of an ECD- laser techniques. It should be recognized, however,based system holds greater promise in that regard, that lasers arc expensive and frequently dillicultIts detection limit, estimated to fall in the range to incorporate in lield instrumentation, and usuallyof 5 x 1(_ tO 1(19 molecules s-Z, coupled with require advanced skills to operate successfully.a sample flow rate of ,-.. 20 cm 3 rain -_, results
in a detection limit of 50 to I(X) pptv. Detector Species-Speci_c _.,,.'r_ml"rt_ors -- Slow Responsetime constan!s < 1 s can be achieved by increasingthe sample flow rate and decreasing the detector No species-specilic detectors with su!ficient sen.volume with some loss of sensitivity. Since such a sitivity to measure ambient levels of biogcmca ",y_ystcm would be compatible with the requirements produced sulfur compounds on time scales suitable
of micrometcorological techniques, its development h_r eddy-correlation Ilux measurements arc currentlywould appear highly desirable. Using either an FPD available. The measurement of such compoundsor ECD detector.based system for the measurement (most not'_bly DMS) requires some type of sampleof volatile sulfur gas fluxes requires, of course, the concentration followed by analysis, with the possibleremoval of SO_- acrosols prior to analysis and dealing exceptioe of the ECD-based scheme dcscribcd above.with the problems associated with different sensitivities If the concentration step is species specific, it mayfor different sulfur compounds, be followed directly by detection. More generally,
however, the concentration step is followed by spccicsSpecies-Specific Detectors- Fast Response separation by some type of chromatography wilh
Table 3.3 al_ lists several lair and nc,nla_r subsequent individual species quantification. Such
spectral techniques that can be used to monitor specilic batch or grab sample processing techniques typicallysulfur compounds with detection limits expected to have time scales ranging from several minutes tofall in the (1.2 to 1 ppbv range. Of these, two _veral tens of minutes. Thus, flux measurements fi_rnew techniques show promise for the sensitive, rapid, these species will be restricted to gradient techniques.real-time detectmn neccssary for eddy-correlation flux Currently available analysis techniques of this typemcasurcments. The first of these u.'_s dill'erential arc also summarized in Table 3.3. The sampleoptical absorption of TDL radiation in either an open, concentration techniques utilizcd in the measurementsatmospheric pressure multipass region (Kolb ct al., referred to arc summarized in Table 3.4. Some of1986; Andcrmn and Zahniser, 1988), or a closed, lower these sample concentration techniques are amenablepressure, multipass absorption cell (Edwards ct al., to subsequent spccies-spccilic detection and some1984; Edwards and G_g,'am, 1986). This technique, only to clasps of sulfur compounds as noted in thewhich is expected to have a detection limit near 1 table. Tho_ techniques that utilize liqtlid extractionppbv h_r SO;, is currently under development for eddy- arc generally amenable only to ion chromatogravi:2ccorrelation Ilux measurements, analysis and lead to much higher (.-,,103) detection
The second approach is the vacuum UV flash limits. The flash valx_rization technique results in aphotolysis/laser-induced fluore_ence (VUV-FP/LIF) nonspecific "total sulfur" sample.
1990002793-067
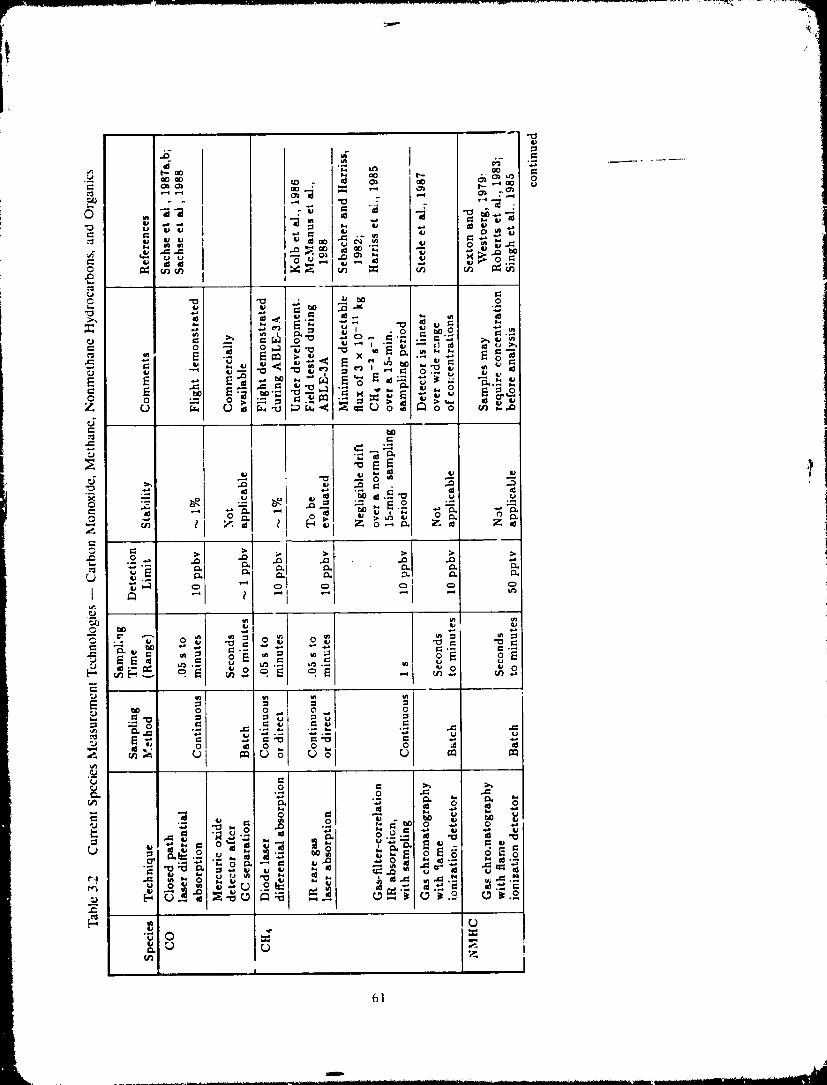
m
/
1990002793-068
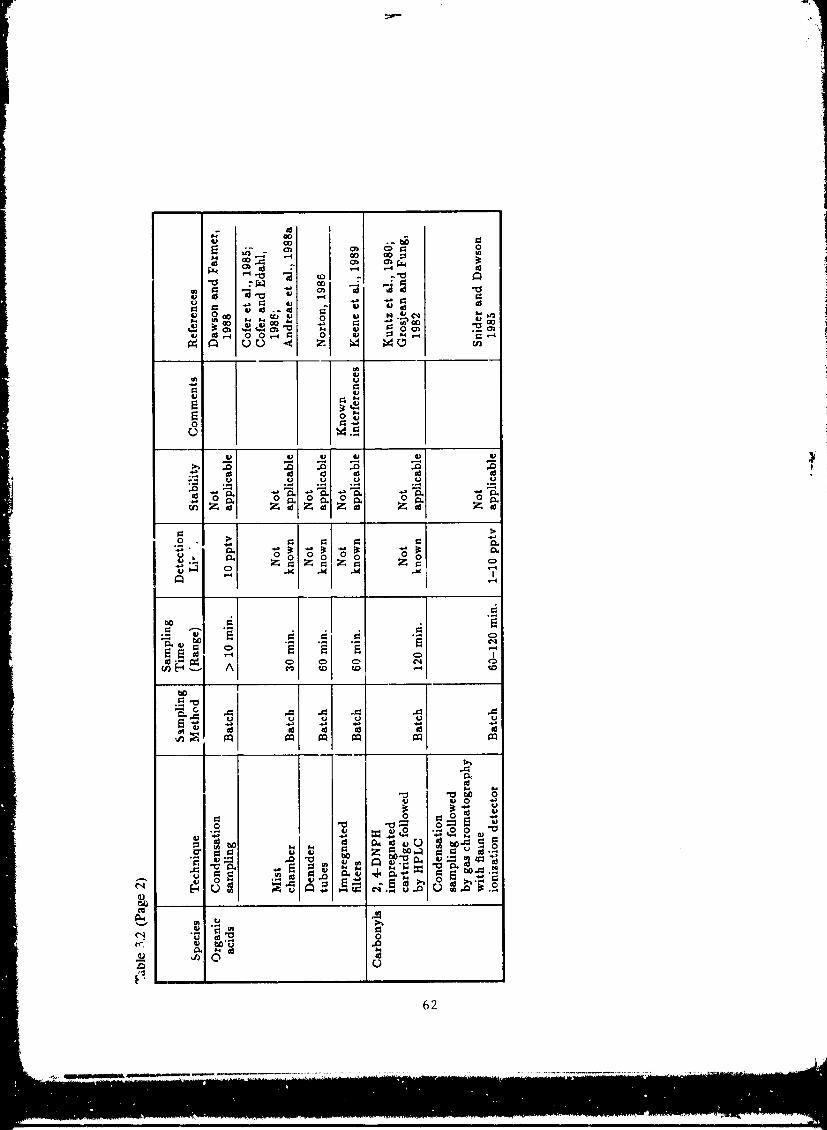
1990002793-069
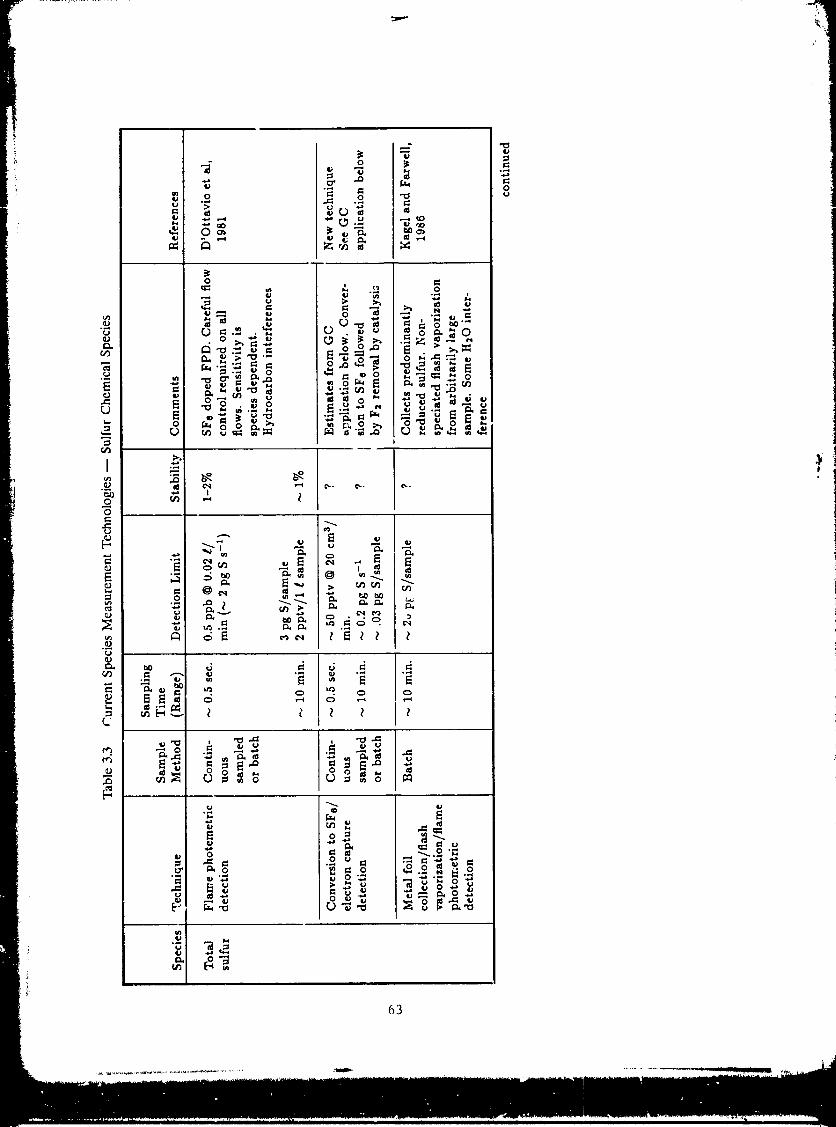
1990002793-070
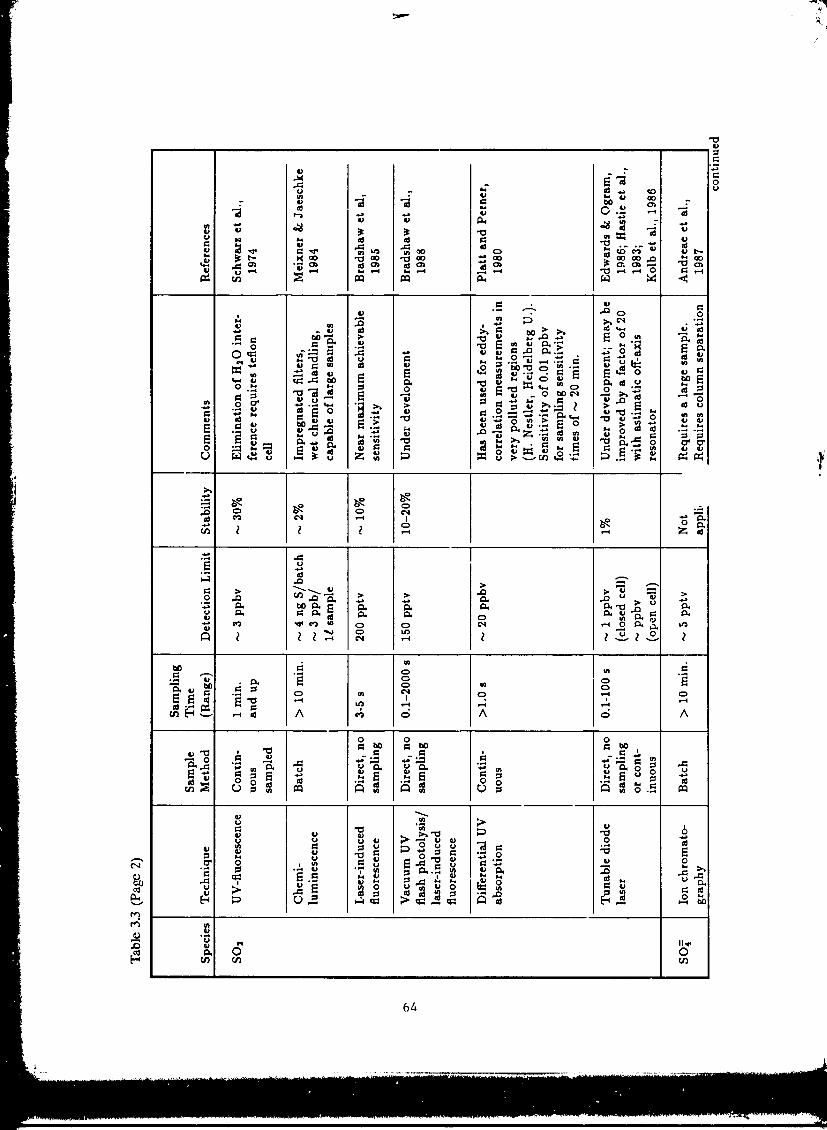
6_
1990002793-071
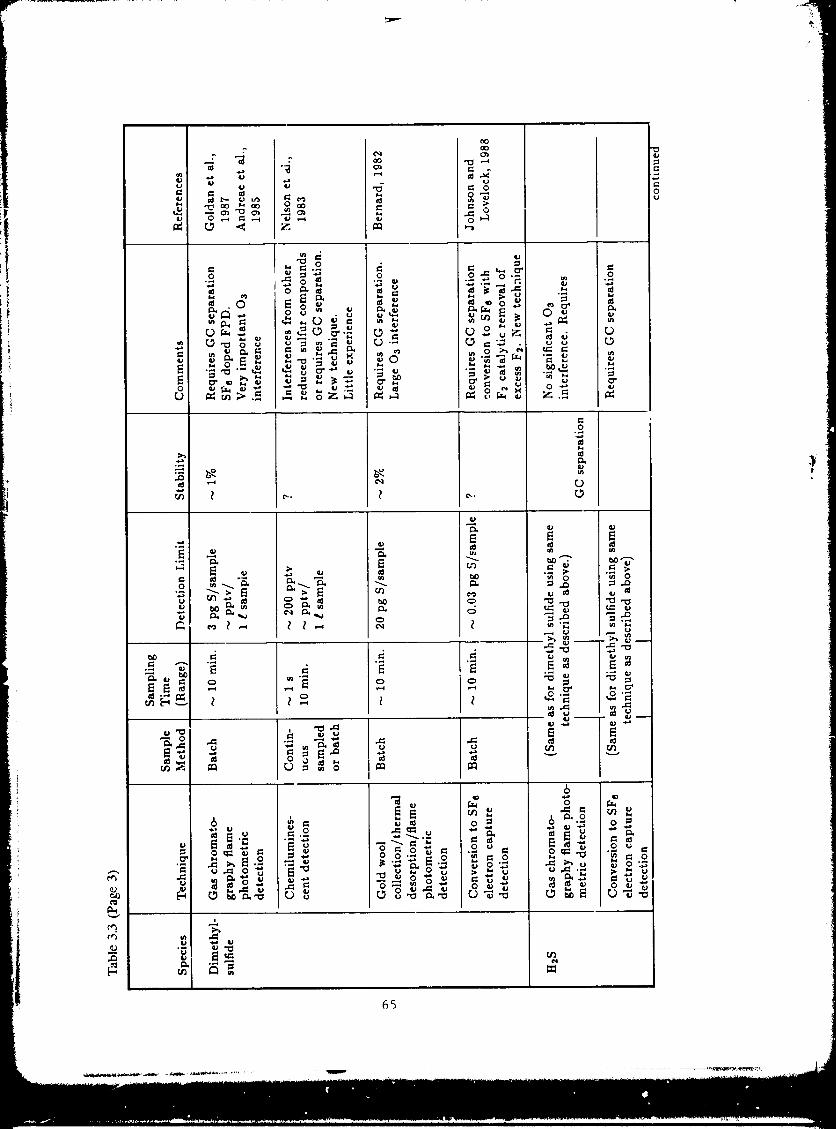
65
1990002793-072
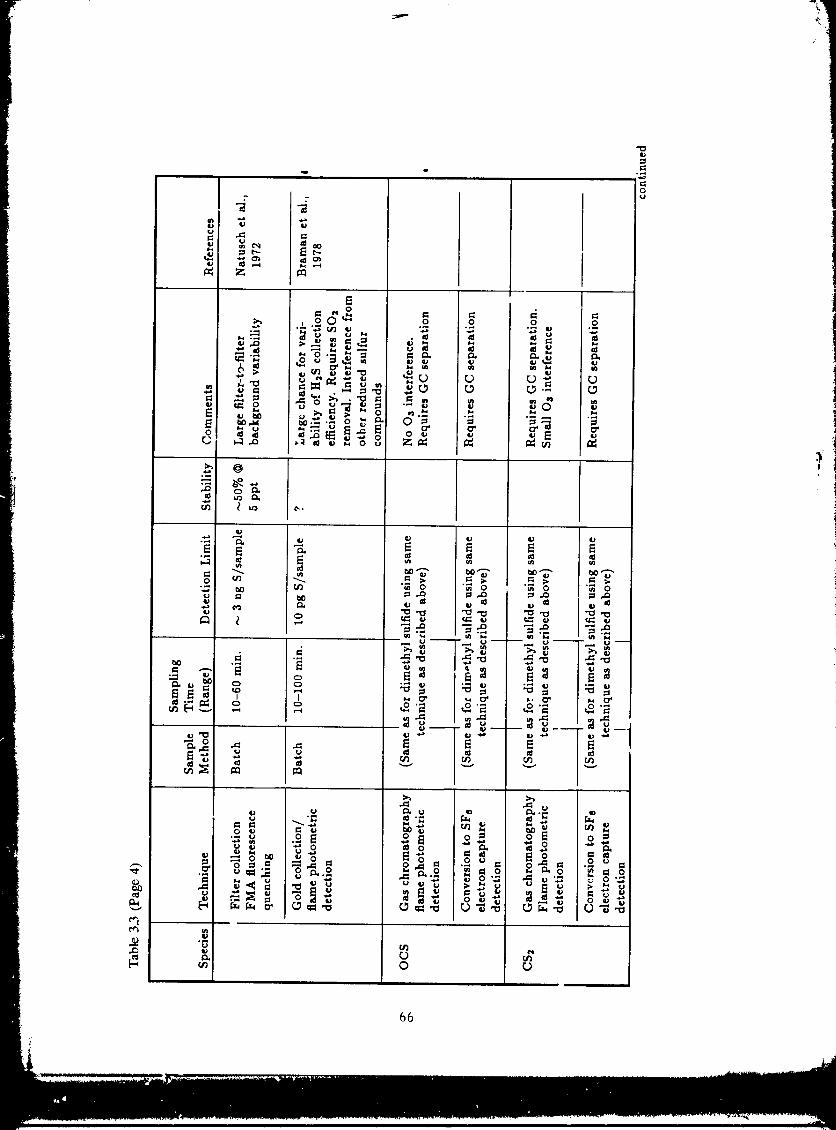
/
66
1990002793-073
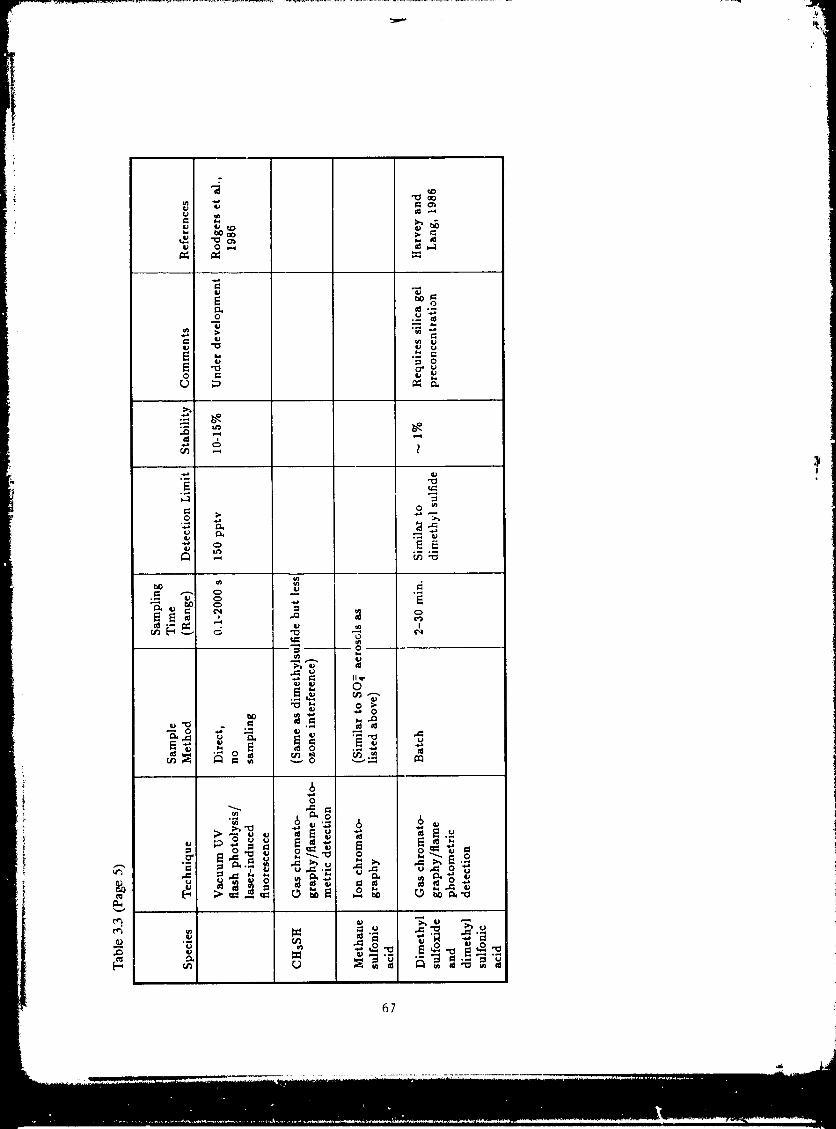
67 ;i
1990002793-074
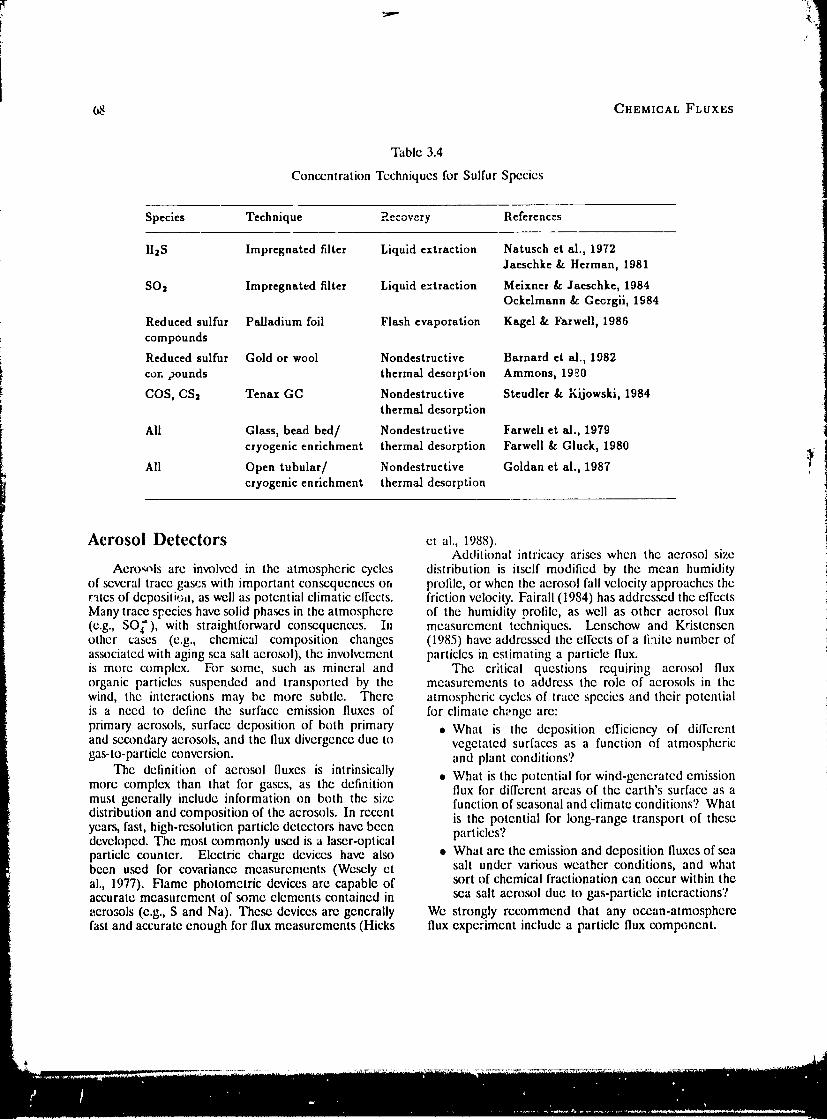
0_ CHEMICAL FLUXES
Table 3.4
Concentration Techniques for Sulfur Species
Species Technique Recovery References
IllS Impregnated filter Liquid extraction Natusch et al., 1972Jaeschke & Herman, 1981
SO2 Impregnated filter Liquid e=traction Meixncr & Jaeschke, 1984Ockelmann & Georgii, 1984
Reduced sulfur Palladium foil Flash evaporation Kagel & Farwell, 1986i compounds
i Reduced sulfur Gold or wool Nondestructive Barnard et al., 1982[ cor, pounds thermal desorption Ammons, 19_0
COS, CS2 Tenax GC Nondestructive Steudler & Kijowski, 1984thermal desorption
All Glass, bead bed/ Nondestructive Farweli et al., 1979
cryogenic enrichment thermal desorption Farwell & Gluck, 1980 9'All Open tubular/ Nondestructive Goldan et al., 1987 J
cryogenic enrichment thermal desorption
Aerosol Detectors ct al.,1988).Additional intricacy arises when the aerosol size
Aero_,qs are involved in the atmospheric cycles distribution is itself modified by the mean humidityof several trace gas_:s with important consequences on profile, or when the aerosol fall velocity approaches ther'ltcs of dcposili,;ll, as well as potential climatic ell'cots, friction velocity. Fairall (1984) has addressed the elfcctsMany trace sFecies have solid phases in the atmosphere of the humidity profile, as well as other aerosol flux(e.g., SO_), with straightforward consequences. Ill measurement techniques. Lenschow and Kristenscnother cases (e.g., chemical composition changes (1985) have addressed the effects of a fiaite number ofassociated with aging sea salt aerosol), the involvement particles in estimating a particle flux.is more complex. For some, such as mineral and The critical questions requiring aerosol fluxorganic particles suspended and transported by the measurements to address the role of aerosols in thewind, the interactions may be more subtle. There atmospheric cycles of trace species and their potentialis a need to define the surface emission fluxes of for climate change arc:
primary aerosols, surface deposition of both primary • What is the deposition efficiency of differentand secondary aerosols, and the flux divergence due to vegetated surfaces as a function of atmosphericgas-to-particle conversion, and plant conditions?
The definition of aerosol fluxes is intrinsically • What is the potential for wind-generated emissionmore complex than that h)r gases, as the definition flux for different areas of the earth's surface as amust generally include information on both the size function of seasonal and climate conditions? Whatdistribution and composition of the aerosols. In recent is the potential for long-range transport of theseyears, fast, high-resolutien particle detectors have been particles?developed. The most commonly used is a laser-opticalparticle counter. Electric charge devices have also • What are the emission and deposition fluxes of seabeen used for covariance measurements (Wesely et salt under various weather conditions, and whatal., 1977). Flame photometric devices are capable of sort of chemical fractionation can occur within theaccurate measurement of .some elements contained in sea salt aerosol due to gas-particle interactions?
aerosols (e.g., S and Na). The_ devices are generally We strongly recommend that any ocean-atmospherefast and accurate enough for flux measurements (Hicks flux experiment include a particle flux component.
1990002793-075
4 FLUX MEASUREMENT PROGRAM PLANC. E. Kolb, F. C. Fchsenfcld, L. P. Steele, and P. D. Goldan
The previous chapters review current understand- Nitrogen and Ozone Grouping of the sources, sinks, and distributions of manyof the track atmospheric species of global interest, Ozone
and of the techniques that can be used h)r measuring Ozone is one of the few species for which practicalvertical fluxes of the_ trace species. The next step is to and reliable fast-response scnso,-s arc available fl_routline and order important experiments for advancing direct eddy-correlation flux measurements at atmo-our understanding of the chemical behavior of the spheric concentrations.atmosphere, taking into account the limited sensing The existing set of ozone deposition data consistscapabilities and field resources currently available to largely of spot measurcmcnts of a few categories ofcarry out such cxpcrimcnts. As discussed in Ch_,ptcr 3, surfaces, predominantly in the mid-latitudes. These _one of the major limitations to research in this area include several agricultural surfaces, forests, rangcland,is the lack of rcliaolc, sensitive detectors that can and coastal waters of the U.S. Both extensivebe coupled with micrometeorological techniques to geographic surveys and intensive site measurementsmeasure lluxcs. Thercfl_rc, for many species, the have been made; there are no major disagreementslirst recommendation is that further development of between the rc._ults of these 1we types of measurement.instrumentation take place beh_re questions relating Only a very few of these measurements extend overto sources and sinks arc addressed. In other cases, dilrcrcnt seasons. A somewhat larger number includecxperiments have already been conducted, and further diurnal variability.proposed research largely uses the available technology Future experiments should be planned for surfacesm new locations and situations, of importance to the global ozone budget. These
One general requirement for flux measurement include tropical and boreal forests, tundra, taiga, andprograms is a capability for periodic comparisons agricult_:r_d croplands such as rice paddies that coverto verify the pcrfi)rmance of new sensors and large areas. In addition, it is not clear tha_ diurnal andmeasurement techniques. To optimize the utility seasonal changes are sulriciently well understood evenof the data obtained, whenever appropriate such over more commonly studied surfaces. To facilitate usecomparison studies should bc conducted with complete of the dala, the results of deposition studies shouldmicrometeorological capabilities. Facilities such as tie.." be reported as surface resistances, which rem_v,'.; atNCAR Atmosphere-Surface Turbuk'nt Exchange Re- least part of the dependency of deposition on lt_calsearch (ASTER) facility ollcr considerable attr:lctions microrncteorological conditions.in this regard. ASTER, now under development, Two situations deserve priority treatment b';causeis a tower-based portable micrometcorological facility of their potential importance to the global ozonedesigned to bc operated under a winery of conditions, budget and because of the fact that few measurementsIt is planned to be a_filable to the scientilic community have been made. The first of these is wintertimeafter mi'1-1989. The facility is designed to be used measurements over the continents, with particularwith a wide range of chemical and meteorological emphasis on areas with snow cover, partial snow cover,sensors, depending on experimental requirements. It and partial vegetative cover, over as wide a rangewill measure fluxes of momentum, moisture, and of meteorological conditions as possible. Both site-temperature, along with fluxes from user-supplied intensive tower measur_'.mcnts and wider-area aircraftinstrumentation. The utility of this approach has bccn measurements should be planned. Measurementswell demoe.strated elsewhere; periodic comparisons of should be taken throughout the boundary layer s') thatsensing techniques and of alternative llux-mcasuring Iluxcs at the surface and at the top of the boundarymethods have been conducted routinely as part of layer can bc obtained by linear extrapolation, and soearlier programs of this kind, as =omponcnts of that a mean conccntratio,T budget can be evaluated.research on the delivery of air polhdants to land The second category is measurements over opensurfaces (e.g., Hicks ct al., 198(ib, 198!)). oceans. It is particularly important to obtain data from
O9
1990002793-076
:4
/
70 CIlEMICAL FLUXES
areas with differing biological productivity as a function 3(10 m. 3his resolution may be sull]cient to be usefulof meteorological conditions and sea_)n. It is expected for measurement of eddy flux o[ ozone in the upperthat the primary platform h)r measurements over part of the convective PBL.ocean will be aircraft. Existing aircraft measurementsdemonstrate that it is feasible to measure the surface llydrogcn Peroxide
resistances, but only a few data points have thus The gas-phase oxidation proces_s of the oddfar been obtained. Measurements over the tropical hydrogen free radicals are terminated by radical-oceans and in high wind conditions are of particular radical reactions that form hydrogen peroxide andimportance, organic peroxide. The pcroxidcs thus formcd can
Because of its relatively slow reaction time (except be taken up by aqueous aerosols, cloud water,in highly polluted areas), ozone can also be a very an,] surface deposition. The peroxides in theuseful tracer for micrometcorological processes. In atmosphere, particularly in aerosols and cloud water,this respect, it is comparable to water vapor, with the are an important oxidant, notably responsible for theadvantages that no phase changes occur and that it conversion of SOz to SO_.has no ellcot on the buoyancy of the air. In addition, Because of the importance of the peroxides,it is not appreciably soluble in clouds and hence can there has been considerable effort directed toward thebe used as a conservative tracer for entrainment and development of instruments to measure HzO2 in themixing processes involving clouds, troposphere, including the gas phase, on aerosols, and
Since the flux and gradient are readily measured, in cloud water (Heikes ct al., 1982, 1987; Kelly ct al.,the ozone diffusivity (i.e., the ratio of the flux 1985). To date, however, there are no measurementsto the local gradient) can be obtained, which can publisl_,cd on the surface exchange or flux divergencethen bc used to estimate fluxes of other trace of ttzO2.gases from gradient measurements with slow-response Instruments that are currently available do not _instrumentation. Similarly, the ratio of the flux at have sufficient sensitivity to measure either I-t202the top of the mixed layer, which can be obtained deposition or flux divergence by eddy correlation.by extrapolation from the flux measured at several Moreover, the capability of available techniques, i.e.levels within the boundary layer, to the change in enzymatic fluorimetry (EF) and tunable diode laserconcentration across the top of the boundary layer is absorption spectrometry (TDLAS), fo quantitativelya direct measure of the velocity of entrainment _f air sample H_Oz or to distinguish between H202 infrom the upper troposphero, into the mixed layer. Once the gas phase and in aerosols has not yet beenthis entrainment velocity ns known, it can be used to established. For this reason, present technology shouldestimate tluxes of other species through the top of be aimed at improving and verifying these techniquesthe boundary layer. This information is of enormous and at their subsequent utilization to measure H202practical signilicance since most trace species can be deposition using gradient techniques near the surface.measured only with slow-response instrumentati(m. In addition, the use of these methods in aircraft studies
Remote sensors for tropospheric ozone con- to determine the tropospheric distribution of tt202 as accntration proliles are largely limited to IR and function of altitude, season, and latitude would provideUV DIAL systems. Both kinds of system have important information on the processes regulating theundergone extensive development in recent years (see, production, loss, and redistribution of H._O2 in thefor example, Browell et al., 1983), with the IR troposphere.sensors offering somewhat greater spatial resolutionat the expense of greatly reduced range. UV Reactive Nitrogen Oxides and AmmoniaDIAL systems have been used to obtain ozone According to our present understanding, NOyprolile meas_lrements (50 m resolution) through the compounds are introduced into the atmosphere ascomplete tn_posphcre. It is tempting to consider the NO,, which can then be converted to PAN and
possibility of combining remote species measurements HNO v by chemical processes. C(,,mbustion and soilwith remote wind proliling measurements (Hogg et emissions of NO, are the principal sources in theal., 1983) to measure fluxes remotely. The exact PBL. Lightning, aircraft, and transpor, of NO v fromperh_rmance of an ozone DIAL system is, however, the stratosphere are the _nown signilicant sources inmore dependent upon atmospheric conditions than is the free troposphere. The NOy is removed fromthe case for the wind profilers. Ozone concentration, the PBL by both dry and wet deposition. A criticaltemperature, aerosol distributions, and the spatial h_ctor regulating the lifetime of NOv compounds inand temporal resolution requirements all alloct the the atmosphere and, hence, the inlluence of NO. onmeasurements. Although the diversit)of operational tropospheric photochemistry is the exchange of _qOyparameters makes evaluating "typical" perh_rmance between the boundary layer and the free troposphere.characteristics difficult, their temporal and spatial Nitrogen oxides (NO + NO2 = NO,) are bothresolution appear to equal or exceed that of currently emitted from and deposited to the earth's surface.available wind prolilcrs for ranges greater than about For the most part, however, emission dominates,
1990002793-077
/
PROGRAM PLAN 71
and emissions from soils are recognized as being a a range of seasons and environmental conditions,signilicant source of atmospheric NO,, (Logan, 1983). throughout the diurnal cycle and, if possible, before,However, the magnitude of this source is subject during, and after precipitation.to considerable uncertainty. For example, tlahn Under certain conditions, rapid reactions maylind Crutzen (1982) estimate that soil may represent convert odd nitn)gcn from one species into another.bclwccn 0% and 20% of the Iota] global source. An example of this is the NO-NO2-O3 triad, which hasStcdman and Shettcr (1983) indicate a soil source of a reaction rate of the order of a minute. MeasuremenlsNO, that is between 13% and 50% of the global total, of the surface llux of a single spccics may thereforewhile Logan (1983) estimates that between 7% and be much less meaningful tha,i simultaneous llux30% of the global total NO_ originates from microbial measurements of the entire family of odd nitrogenactivity in soils, compounds. By measuring fluxes of the entire suite,
Much of this work was based on only onc set we can ensure that wc have not missed an importantof soil NO, emission data (Galbally and Roy, 1978). part of the total odd nitrogen cmission or depositionSince then, several other studies have been conduc!ed Ilux. On the other hand, Lcnschow and Dclany (1987)in dilfcrent areas and undcr a wide variety of climatic have shown that h)r two species for which thc chemicaland soil conditions (Johansson, 1984; Johansson and reaction time is much shorter than thc dill'usion timcGranat, 1984; Slemr and Seller, 1984; Delan/ et from their source, the ratio of the fluxcs is equal toal., 1986; Anderson and I_vinc, 1987; Williams ct the ratio of the concentrations. Thercfore, it is onlyal., 1987). The results demonstrate that there is necessary to measure the llux of one of the speciesconsiderable variability and i,ncertainty in NO, soil concurrently with the mean concentrations of both toemission estimates, obtain the Iluxes of both species.
In order to reline the estimates, emission rates There are virtually no cxisting data on themust be related to soil pr_pcrties such as temperature, deposition of PAN; there are limited mcasurcmcnts of _'type, moisture, pH, percent organic matter, and NO2 and HNO3 dry surface Iluxes. Nitric acid tluxcsnitrate and ammonium concentrations. Knowing the have been estimated over a few surfaces using gradientdependence of NO= emission on these factors gives techniques (ttuebert and Rob6rt, 1985; Huebert et al.,insights into the biogenic mechanisms responsible for 1988), but the coverage is by no means representative.the NO, generation. Because of the variability of Artifiict-frce NOt Ilux measurements are also rare, butthese factors in nature and the complexity of the some do exist. We know of no measurements of thebiogcnic response It) them, additional detailed licld Ilux of NO_, although this valuable measurement wouldstudies covering all seasons, as well as investigations help us place bounds on all the other odd nitrogenunder controlled laboratory conditions, are required, lluxcs.Ancillary atmosphcric measurements should include For each of these species, measurements overambient air, dew point, and soil temperatures, wind a much broader range of biomes than has currentlyspeed and direction, prcs.,,arc, solar radiation, and been rcportcd is essential in order to estimate lluxesprecipitation, to significant portions of the globe. Wnencvcr
Since NO is both emitted and deposited at possible, these measurements sh(mld be ()blaincdthe surface, _0nd fast-response, sensitive detectors are concurrently with measurements of the other signilicantcurrently available to measure its Ilux, NO is us_:ful odd nitrogen species. We recognize two ramilicationsfl)r undertaking a systematic evaluation of several of of this recomnaendati,m: (1) few I'dvx:m_r;:'_ :,r,_"the methods currenlly used for llux measurement, expert lit all these techniques, so that mul,igroupTherch)rc, NO would be fin excellent candidate for cooperation will often be required, and (2) the hmitedlicld comparison of enclosure, gradient, and eddy- a,,_ailability of state-of-the-art measuring systems willcorrelation techniques. The site for such a study needs make it necessary to plan practicH experiments thatto be careft, lly considered, since obtaining a unifi_rm may not be as complete as ideal ones.known ._urface llux of NO is dillicult. Thc area must A. desirable experimental format would includebe accessible and horizontally uniform with respect to gradient measurements of ammonia/nitrate and PAN,both NO emission and micromcteoroh_gical quantities, coupled with eddy-correlation measurements of NO,This is critical when using dilfcrcnt techniques because NOt, and NO_ Iluxes. Figure 4.1 shows a schematicof the intrinsic dillercnces in the sample area to of a proposed experiment. Although the precisionwhich the dillcrt.nt techniques respond. It is especially aw,,lilahle for measuring PAN may be marginal for tluxchallenging for Nu, since its surface Ilux is known to measurement (assuming "t deposition vclocity in thebe extremely variable, both spatially and temporally, range of a few tenths of acm s-t), it may bc adequateThe choice of the spccilic biome (natural grassland, to cstablish an upper limit to the PAN llux. The NO_scrubland, cropland, short or tall vegetation, etc.) measurements would also be useful h_r estimating theneeds to be carefully considered, and the sCull,microbe, tectal surface Ilux of odd nitrogen species.and vegetation parameters need re, be carcful!y It is obvious, from the discussion in Chapter 1,documented. The intercomparison should extend over that there is still much scope for research into the
1990002793-078
72 CHEMICAL FLUXES
sources and sinks of NH3 at the surface. Even the NIt3 llux is conserved, bat the individual species fluxesbest documented sources have uncertainties of I(X)%. may not be. The vapor species diffuses and adheres toBecause of the many processes that can generate NH3, the surface as a phase change near the surface suppliesaircraft measurements of NH_ inputs over large areas, fresh vapor to the depleted laminar sublayer.as described by Lenhard and Gravenhorst (1980), for To obtain the most realistic picture of nitrateexample, seem to offer much promise. Emissions and Ntt3 fluxes, therefore, all four species should befrom biomass burning and natural lields obviously need measured concurrently. The rapid adjustment timebetter quantilication, of this equilibrium between phases makes it difficult
Most NH3 cycling in the atmosphere is thought to make rigorous statements about the distributionto occur close to the earth's surface (involving of material between phases, but it is relatively e'_syaerosol formation, incorporation in cloud water, and to measure the total nitrate and total ammoniumdeposition), and a preponderance of gas-phase NH3 is gradicnts with filter packs, from which the total fluxthought to be located in the planetary boundary layer, can be estimated.However, this supposition has yet to be conlirmed by Most of these experiments appear to be feasiblemeasurements. Thus, measurements of ambient NII3 in the very near future, although not all the necessarylevels are needed in order to understand the processes instrument development has been completed. Forthat control NH3 exchange and the tropospheric NII3 example, the response times of NOu detectors needdistribution, to be demonstrated before we can confidently use
Such ,aeasurements are relatively scarce, however, them for eddy correlation. The precision of PANdue to a variety of experimental difficulties. Ammonia instruments needs to be improved in order to measureforms strong hydrog..n bonds and adheres tenaciously vertical gradients. Development work should continueto any unheated surface. This often leads to on fast interference-free NO2 and NO,, instraments.memory elfects and sample losses, a particularly Filter measurements of nitrate and ammonia should _serious problem for optical techniques that require bc supplemented with denuders whenever appropriate.absorption or excitation cells, and leads to high Since all of these developments seem achie_lblebackground levels in filter packs, bubblers, and in the near future, experiments could be plannedacid.coated d_.auder tubes, which necessitates long immediately. An example of such an experimentwas carried out in the Amazon Basir, as part of thecollecting times. Hydration of NH3 by atmosphericwater vapor at high relative humidities further limits the NASA/GTE/ABLE-2A (during the dry season) andusefulness of highly spccitic spectroscopic techniques. ABLE-2B (during th, ct season). Preliminary resultsNevertheless, several techniques have been proposed from ABLE-2A are discussed in a special issuc of J.to measure gas-phase NH3. In order to establish the Geophys. Res., 93, 1349-1624. Advectivc transport ofability of these techniques to quantify tropospheric NII3 chemical species from surrounding pollution sourceslevels, a thorough lest of NH_ measuring techniques is and agricultural land posed a problem for the experi-• ment. Detailed mesoscale meteorological infor:nationrequired, was useful for identifying pollution sources. Large-scale
Although present sensors do not have response mean concentrations measured by the aircraft weretimes fast enough for eddy-correlation flux measure- critical to establishing that the distribution patterns ofmcnts, they are sufficiently sensitive to determine NH3 chemical species observed at the micromcteo,ologicallevels throughout much of the earth's troposphere, tower site were characteristic of the regional f_)restMeasurements of NH3 levels as a function of altitude, environment.season, and latitude would constitute an important tirst A similar experimental design was tested duringstep in placing limits on the exchange mechanisms the summer of 198_ ia the Yukon Delta region ofand chemical processes that regulate this distribution. Alaska during the NASA/GTE/ABLE-3A. This regionThese measurements should be accompanied, where was well suited for the experiment due to relativelypossible, by mcasurcmcntsofltNO3 and aerosol NIt4_, persistent meteorological patterns over an extensiveNO_, and SO_'. llat tundra. Particular attcnlion was paid to spatial
Measuring fluxes of the HNO3fNH3 couple scale factors inw)lving biogcnic source distribution.presents some unique problems. When the product of Enclosures, towers, and aircraft were used to measureIhe ItNO3 and NH3 concentrations exceeds a particular concentrations and lluxes of NO over a broad spcctrumvalue, a fraction of these gases will condense to form of spatial scales. Tower and aircraft measurementsammonium nitrate aerosol (H.tcbert et al., 1988; Brost of NO, NO2, NOu, 03, CO2, CHa, ti20, winds,et al., 1988). Under these conditions, the flux of nitrate temperature, and humidity addressed spatial andis carried both by ttNO3 vapor and by nitrate aerosol; temporal scales of variability, and serial launches ofsimilarly, the total NIt3 flux is transported by NII3 free balloons provided measurements of boundary-vapor and ammonium aerosol. The total nitrate and layer height through the experimental period.
1990002793-079
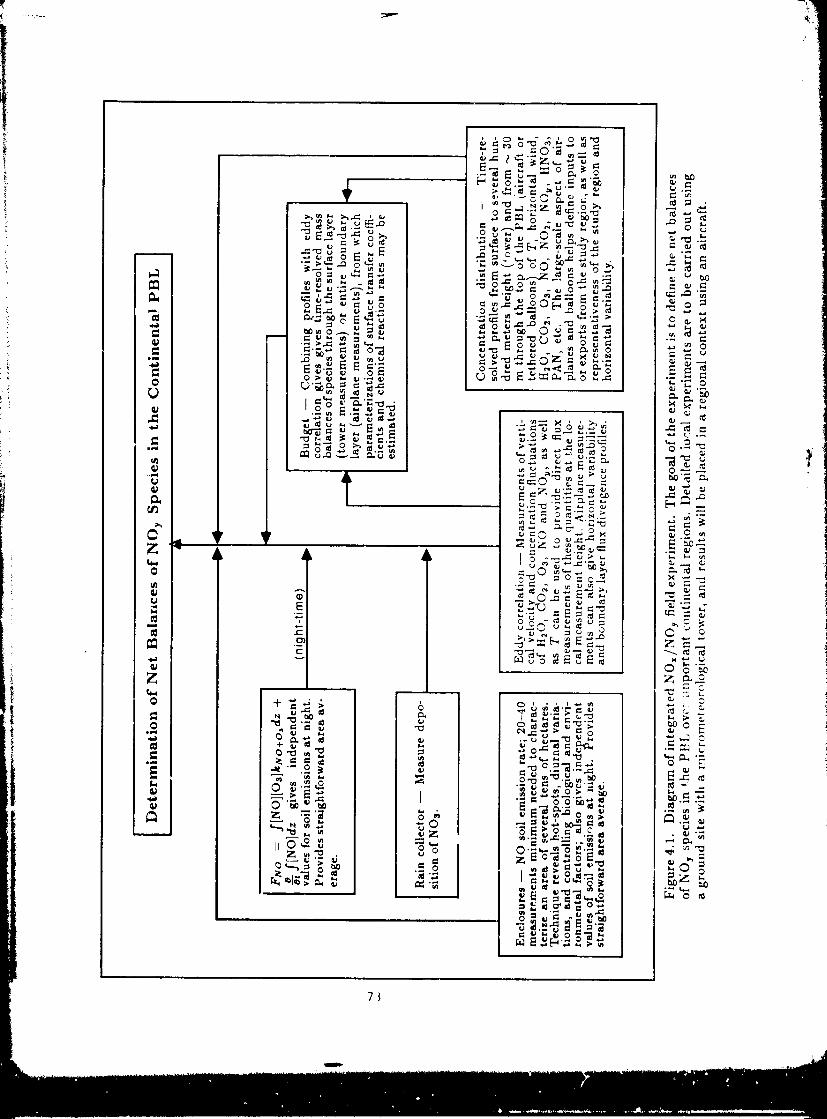
' I
71
1990002793-080
74 CHEMICAL FLUXES
SIllfllr Group mechanisms, whereas flux determination is biomc-specilic and requires in situ measurements as well as
The recommendations discussed here outline in appr.,priate sulfur compound speciation.j_reater detail the specific types of re,;_;_rch neededto chararterize sl,rface exchange of sulfur species. Air-Sea Gas Exchange Rates: Process-Level SludyThe plan h)r trace sulfur species studies suggests ah_cus on six important research areas, which share While large Ilu×es of volatile sulfur gases havea number of considerations. First, the emphasis been observed coming from some plant species inmust be on exchange, so that both deposition and terrestrial and near-shore aquatic environments, it isemission fluxes are addressed. While studies at any one thought that the majority of biogcnic sulfur input intoarea might well focus on a particular flux.generating the troposphere occurs from the '_pen ocean. Anprocess, the interpretation of acquired daia must be increasing budy of data indicates that supersaturationincorporated into a more complete characterization of DMS exists in the ocean and that transport into theof the global surface exchange. Second, studies are atmosphere may be responsible for fluxes significant onsuggested for a variety of continental and oceanic a global scale. While measuremcnts of atmosphericbiomcs, the particular regional focus of any given mixing rates of DMS support this view and arc inresearch topic being based upon either existing data general agreement with estimated transport rates, theor knowledgeable estimates of the potential global transport of DMS acro:_s the air-sea interface and itssignilicance of that region. Third, whereas several dependence upon physical variables such as wind spccdtrace sulfur gases arc estimated to be of highest are poorly understood. For the_ reasons, studyingpriority based apon the currently available data, other this transport as a globally significant process is highlytrace sulfur species should not be dismissed without recommended.Since detection of DMS at the observed 100 ._
justification based on defensible data. pptv level currently requires sample preconccntrationFourth, there is a need fl)r interdisciplinaryresearch that incorporates a mix of expertise and and analysis on a time scale of ,-,, 30 minutes,methodologies in any attempt to characterize a given such flux measurements appear to be approachableflux. This is necessary no_ only to determine the only by means of the vertical gradient technique.- Such measurements would require the use of towcrsflux per se of a given species from a particular in an open water environmcnt under a varietybiomc, but also to provide the basis fi_r predictive of atmospheric and sea-surface conditions. Thecapabilities that can often come only from in-depth coincident measurement of a suite of atmospheric trace
undcrstanding and appropriately designed process- gases, some of which arc amcnal"c to measurementlevcl studies. Consequently, the plan calls for acombination of lield and laboratory studies, with the by eddy-correlation techniques, would aid considcrablymix depending on the question being examined, in the interprctalion of results and would be highlydcsirablc. Wllile deep ocean measurements would
One further major recommendation is the nced ultimately be desirable, more modest platforms into interface, both physically and conceptually, the study sLa'/,owcr waters would yield important results.of sulfur gas exchange with studies being planned forother clasps of _race gases (i.e., NO,, ozCme, and Oceanic Production of Volatile Sulfur Specieshydrocarbons). This is especially important sinc_ manysurface exchange issues are common to all classes of In order to extend the site-specific sulfur ,._;_cecompounds, and any one experiment could greatly gas exchange rates from oceanic systems, derived frombenclit from ellorts expended to characterize tluxcs studies such as discussed above, to global estimates ofof other trace species and from shared experimental net production, it is necessary to identify the principalplatforms and technologies, biota inw)lvcd and the major controlling environmental
The specilic suggested experiments are summa- factors and then to integrate the results into arizcd in Table 4.1. For each of tht. ,_ix critical areas predictive model. Process.level studies are necessary
identilicd, specific studies are suggcstt.J lo address to cl:.aracterize the taxonomy of the important sulfureither process level studies or Ilux measurements, emitting species, followed by studies that address theThe critical areas f_cus on the general issues that role of cn,nronmental factors in modulating both theirrequire resolution in order to accurately estimate emff,sion ::,tcs and geographic distribution. The secondglobal exchange rates. As such, the descriptions ar" phase of this process-based approach would bc thephrased in a general, rather than a highly spccilic, way. developme-t of a mode! to predict exchange ratesThe experimental approaches deemed necessary to h_r spccilic sulfur gases under a variety of naturallyaddress the critical areas are briclly described as either occurring conditions.process-level or llux measuremcnts in the appropriate This modeling cll'ort would require :ld validation.column. Process-level studies may be conducted under Flux measurements in a_.lectcd biomcs with appropri-controlled laboratory conditions and ate intended to ate geographic and temporal scales, as suggested by theelucidate basic production, uptake, or transformation model, should be undertaken. The underlying focus
1990002793-081
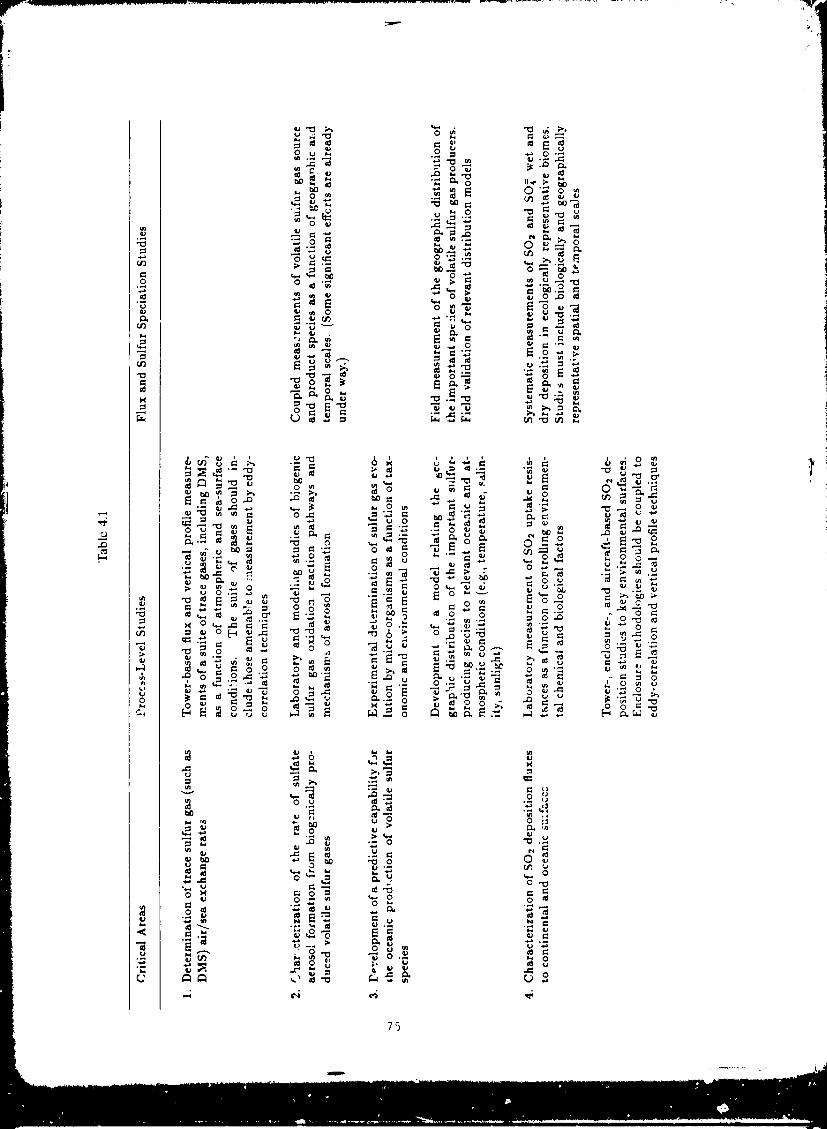
75
1990002793-082
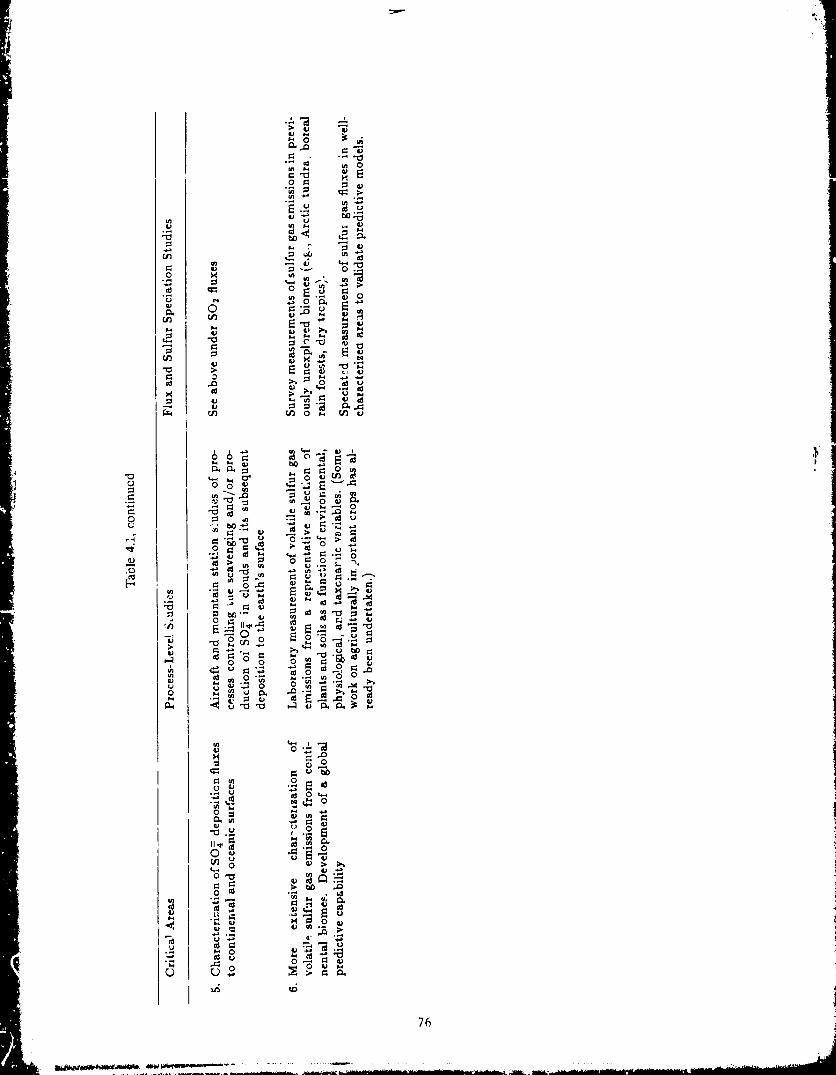
-__ _o_ o _ _
0
r_ _ 0 _ r_
._,._ _,_ o0
._._ _
r_ 0 _ ;_ _.
o._ ,_
.c, o o,_ "
7_
1990002793-083
PROGRAM PLAN 77
_- should be the development of predictive capabilities S02 deposition rates; since the ptI of such a liquidrather than an exhaustive inventory of all biomcs. Iilm may be expected to decrease as SO2 absorption
proceeds, uptake may change dramatically with time,Aerosol Formation from Volatile Sulfur Compourds and laboratory expcrimcut_ ate required to address
this question.The emission of volatile sulfur compounds into An:dogous questions apply to oceanic systems.
the tJoposphere leads t,ltimately to the fl)rmalion Studies arc needed to de;.ermin,2 the factors controllingof sulfate aerosols. These aerosols may bt; the SO,, uptake to ocean waters with dilferent wave, and,dominant form of sulfur deposition in remote regions therefore, surface characteristics.of the globe and may also be the predominantsource of condensation nuclei responsible h)r cloud Sulfate Deposition to Continental and Oceanicformation in marine environments. The processes Su.-faces
leading to the formation of sulfa!e aerosol from DMS Sulfate exists in the atmosphere in both particulateemitted by marine biota are very poorly understood, and aqueous forms, as well as in gaseous form.as is the global and temporal distribution of the Consequently, pf.x:c:,.-,t:., governing '.he sulh_te SO_aerosol. Consequently, both process-level and survey deposition must be distinguis_:_d from those associatedmeasurements arc recommended to understand this with SO2 deposition. Data pertaining to theproblem, magnitudes of both dry and wet SO 4 ,!cr_osition
Process-level experiments would involve modeling to different biomes and ocean surfaces is needed.
and laboratory studies Ol the mcchanisms, reaction Unfortunately, dcposi'.Jt:n rate measurements of sulfatepathways and rates of formation of sulfate aerosols particles arc dilficult. Since deposition velocitiesthrough the oxidation of reduced volatile sulfur gasesof biogenic origin. While not limited to DMS, are a function of particle size, deposition rates aresuch studies should initia!ry h)cus on I_MS, as it is a complicated function of particle size distributions. ?Signilicant improvements in methods used to measurethought to bc of prime importance. In addition, field sulfate particle fluxes appear to be needed.determination of the spatial and temporal distribution Sulfate deposition to sites adjacent to signilicantof both ;.he subsurface sources anti the a:mosphcric orographic features poses a special problem. SO_ isdistribution of volatile sulfur species arc necessary, deposited not only by dry processes aad precipitationWhile some such field measurements have bccn made, but also by cloud impaction on mountainous terrainconsiderably more coupled data of precursor and and vegetation. Studies are further burdened byaerosol atmospheric conc'.mtrations would be of grt.,t complicated airllow patterns in such terrain. It ,vouldvalue in understanding Ibis interaction betw_:en the appear that aircraft and mountaintop studies wouldtroposphere and the underlying biologic community, have to be closely coupled to address the problem.
S02 Fluxes to Continental and Ocean Surfaces Studies of cloud sc:rtenging and transformation wouldhave :o bc perf.)treed, since both affect the SO_Although many measurc,nents of SOz Iluxes deposited by clouu:;. Concentrations of oxidants such
have been made, many important questions involving as 11202 arc expected to play a major role in thisthe rates and processes governing these exchanges regard.need to be resolved. One pressing question relates From a bi:_geochcmical standpoint, fluxes of I-,,_thto the role of scaling point measurements of SO2 SO2 and SO4= are needed It) construct a t,lo%,] .irtlluxes to larger areas, associated with model grids or budget. Variations in temporal and spat,;I sc::k:_, o'ecosystems used in budget computations. Difficulties both of these important species need to be bottomarise due to spatial variation in surface vegetation and characterized. Data from existing monitoring networksterrain complexity; thus, )really averaged fluxes over may be utilized, but _t_t... networks are in,adequatea complex topographic mosaic of underlying surfaces for extension tt_ ,: _Ic_-,,alscale. Additional monitoningmay or may not equal the weighted average based stations in .c[_r,.'._cn'ativc continental and oceanicon the individual compone,_ts of the surface ,aosaic. sites, provid l_., ._ata on chemical concentrations,Experiments coupling aircraft flux measur:ments meteorology, and surface characteristics, are sorelywith a spatial average of tower-based SO2 flux needed.measurements are required to address this problem.
A theoretical fra,ncwork exists for describing the Volatile Sulfur Gas Entissions from ConKnenlalprocess governing the transfer of SO2 to vegetated Biontessurfaces. Unfortunately, some of the pathways Several previously completed licld mcasurcmcmpostulated in this framework arc not well quantified, programs indicate that soils and vegetation in bothParticular attention needs to be paid to factors intcrtidai and upland regimes contribute signilicantlygoverning SO2 deposition to soils, detritus, and moist to the production of reduced trace s:flfur gases.canopies. Many questions remain about the cll'ccts of These observations are, however, very sparse. Thus,surface wetness resulting from dew, rain, or snow on it is difficult to extend these measurements to a
Ilk --- J,ii
199000279:3-084
78 CHEMICAL FLUXES
global scale with any degree of certainty. It is be about 4,300 Tg; the distribution of methane in theimportant to extend such measurements to other troposphcrc hasbeen measured bySteeleet al. (1987).continental regions ol suspected interest in order to By using estimates of the average concentration ofdevelop reliable predictions for a variety of sites and hydroxyl radical in the atmosphere, Prinn et al. (1987)environmental conditions. This task requires attention deduced the a',erage atmospheric lifetime of methaneboth to flux measurement per se and to the chemical to be 9.6 (+2.2, -1.5) years, where the uncertaintiescharacterization of the sulfur species being released, refer to one standard deviation. While most of the
For several biomcs that are potentially signilicant long-term increase in methane is probably due to anon a global scale, few or no sulfur gas flux increase in the magnitude Gf the sources, the closemeasurements have been performed. These include chemical coupling between CH.s, CO, and OH in thetundra, wet and dry tropics, and boreal rain forests, atmosphere means that increasing levels of CO in theSurveys in these areas "_re recommended in order to atmosphere can also lead to an increase in the level ofassess their contribution to the global sulfur budget, methane (Thompson and Cicerone, 1986).
Process-level studies are also recommended to While we may have compiled considerable in-examine both vegetation and soils as emission sources formation about atmospheric methane, there stillunder controlled laboratory and field conditions. These exist significant uncertainties in our knowledge of theellotis should identify taxonomical, and physiological sources of methane. There is a growing consensus thatand environmental variables alfecting sulfur gas the magnitude of the annual_clcase to the atmosphereemissions. Some studies of this type have already bccn is in the range 400 to 600 Tg (e.g., Bingemcr andundertaken but were restricted to agricultural crops; Crutzen, 1987; Cicerone and Orcmland, 1988), buta considerable broadening of scope is required. The the rcla:ive contributions from known sources is h_rprincipal methodology used in such studies to date has from settled. In a recent paper, Lowe et al. (1988)
been enclosure systems. These should bc augmented interpreted 14C/lzC ratios in atmospheric methane to ._with other micromcteoroiogical approaches as soon as deduce that about 7,o% of this trace gas derives fromthe requisite sensitivity and temporal resolution have fossil carbon sou" cs. This perccnta_;e is much higherbeen developed, than had been sugges, ! previously. A consequence ,
This research must result in a capability to predict of the uncertainty is that it is still not possiblefluxes and to account for th_ considerable spatial and to quantitatively account for the observed long-termtemporal (i.e. diurnal, seasonal, and annual) variability increase.in emissions from coJJtincntal biomes. I_ order to fully A dctermioation of the uncertainties in the various
validate this predictive capability, additio,tal studies in methape sources will not be easy. Success willsome well-charactcrized source region should be useful, almost certainly have to depend on a combination
of several activities: atmospheric measurements ofCarbon Group mean concentrations; direct flux ,.ncasurcmcnts over
Methane known or suspected source regions; process stodiesto belier quantify total and isotopic releases from
Of all the hydrocarbon species found in the atmo- known sources; measurements of the different isotopicsphere, currently methane i:_the best understood. The species of methane, "both as carbon and hydrogen; andgrowth of methane concentrations in the atmosphere atmospheric modeling studies to aid in the integrationhas been dcmonstraicd by direct measurements on and interpretation of our knowledge about methane.atmt_sphcric samples over the past decade (Blake and Many of these activities are already under way butRowland, 1988; Rasmussen and Khalil, 1986; Fraser may have to be expande¢t or augmented. Most of theet al., 1986a), spectroscopic measurements of the total atmospheric measurements of methane arc currentlycolumn amount of methane (Rinsland et al., 1985), taken in the boundary layer. Regular determinationsand by the measurement of air bubbles extracted of vertical profiles in the troposphere at a number offrom polar ice cores (Etheridge ctal., 1988; Pcarman locations wouht aid considerably in constraining modelctal., 1986; Stauffer ct al., 1985; Rasmussen and calculations. Direct flux measurements have usuallyKhalil, 1984). The increase in methane has bccn been carried out for relatively brief periods of time. Itoccurring fl)r the past two centuries, over which time would be desirable to measure lluxes at some locationsthe concentrations have more than doubled from a for at least a year. This would provide inh)rmationpreindustrial level of about 700 ppbv to the present about possible seasonal variations in fluxes and help tovalue of about 1650 ppbv. Recently the ice-core record reduce uncertainties when estimating annual releases.for methane has been extended back to 160,000 years Such an exercise would probably require that the fluxesdP by Raynaud ctal. (1988) and to 100,(}00 years I_P be measured by a noninvasive technique such as eddy(Stauffer et al., 1988). Both investigations showed theft correlation.d _ring glacial times the methane concentrations _vcre The measurement of the isotopic compositionabout half of those found lit interglacial periods. The ,)f atmosphctic methane is potentially very valuablepresent atmospheric burden of methane is known to in understanding the sources of methane, because
/
PROGRAM PLAN 79
different s, mrces may relea_ i:,otopically distinct Nonmethane tlydrocarbons and Organics
methane (Stevens and Engelkemeir, 1988). The At present there are no fast-respon_ sensorscontribution of fossil methane to the total budget can, for NMHCs and organics. Their presence in thein theory, be deduced by measurements of 1_C/!-'C atmosphc:-e at concentrations of about 1 ppbv or lessratios in atmospheric methane, but as l_xlwe ct al. makes the development of fast-response sensors a(1988) point out, the continuing production of lzClrl4 daunting task. "I'hcrcfi)re, for the foreseeable future,from nuclear power plants will complicate the issue in tluxes of NMttCs will be estimated by gradient orcoming years. One area that has received relatively budget techniques, which require only measurementslittle attention is the hydlogen isotopic composition of of mean concentration or concentration dilferences.
methane. Such measurements could impose valuable Because of the large number of species in this class,constraints on the relative magnitudes of various any effort to d(zvcl,.)p fast-response sensors shouldsources in the global methane budget. Process studies perhaps focus on isoprene, since from the point ofcan elucidate the mechanisms of methane production view of atmospheric chemistry, it is arguably the mostand relea_ and the factors that can inllucncc those important member of this class. Since the productionmechanisms (Martens et al., 1986; Blair et al., 1987). of isoprene by plants is known to be related to
The compilation of high-resolution global data photosynthesis, further studies of plant metabolismbases for methane emissions from natural wetlands may yield critical information that can be used to(Matthcws and Fung, 1987) and from animals (Lcrner predict isoprene emissions to the atmosphere.et al., 1988) is a very positive development, sincethey can be used as inputs :t) three-dimensionaltracer transport models of the atmosphere to test Species Concentration Budgethypotheses about the source terms in the global Experimentmethane budget. Unpublished simulations of variousmethane sources with such a model by Fung and Under certain circumstances, the emissive Iluxcoworkcrs at NASA/GISS show that some methane from an important source region can be derivedsources arc large enough to raise the annual mean by making measurements of the elevated mixingconcentration over large regions by tens of parts per ratio of a given species in the downwind plumebillion. These model results could be readily tested from the region. Concentrations measured in theby routine measurements of methane concentrations air downwind of the source rellect (1) the originalat appropriate locations within or near to tile source composition of the air, (2) the addition of speciesregions, from local sources to the near-surface layer, (3) the
amount of entrainment/mixing with the backgroundCarbon Monoxide air, and (4) photochemical evolution in the air
As mentioned earlier in the report, perhaps parcel. A well-designed experiment would include50% of the sources of carbon monoxide are in spatially/temporally correlated mcasurcmcnl:_ ,' :_tropical regions. This estimate is not based upon number of chcmical spccicsboth, upwind and d_,wnwinddirect measurements of fluxes. Using airborne eddy- of a major source region; it would allow for thecorrelation techniques and tht: fast-response CO sensor empirical calculalion of re!alive tluxcs, including', th_sedescribed by Sachse ctal. (1987b), it should now such as ozone that are cw)lved as the pl,,mc ofbe feasible to test directly the cstimalcs of carl)on NO, and hydrocarbons ages and mixes _,_ lhmonoxide production in the tropics. This would environment.require measurements of the eddy Ilux and the The time scales involved would fall in the rangemean CO concentrations at dillerent heights in the of 0-5 days, and thus conserved tracers would includeboundary layer over a tropical forest, as well as CFCs, CO2, ClI4, CO, N20, SF6, black carbon, "'ndCO concentrations in the free troposphere above alkancs; whereas the chemically evolving species wouldthe boundary layer. It would be desirable, but not include 03, NO, NO,, PAN, NOa,, I I20_, SO,. andabsolutely necessary, to measure the CO levels and the shorter-lived hydrocarbons. The calibration of al_'solutcCO Ilux at the ground while the aircraft measurements Ilux can be based on (1) a conserved tracer with awere bcir_g made. Sil,ce much of the CO in the known rate of emission, or (2) meteorological analysistropics is thought to ucrive from oxidaliol: of NMtlCs, of the growth and mixing of the plume. Similaily, theit would also be dc:dr_d_lc to measure the vertical photochemical time scale for aging of the parcel (e.g.,gradient of the NMHCs in the boundary layer its part NO,/N(_,u ratio) could be based on (1) a species withof the experiment. Observations of this type have a known decay rate or (2) the meteorology. In eitheralready been carried out over the Amazon Basin as case, the background environraent (or air upwind ofpart of NASA/GTE/ABLE-2A and 2B, as reported the region)must have a well-characterized compositionh)r ABW,E-2A in the J. Geopl,ys Re,_., 93, 1349-1624, and low wlrianccs for species mixing ratios. It may beand have demonstrated that the technology is at hand possible (and necessary) to consider two dilrcrent mixesto address this question, of background air, such as boundary layer air and free
/
80 CIIEMIC.A.LFLUXES
troposphcricair, cachwith a characteristic composition. [CCOPE]). A major goal of thcso programs wasAn important requirement is that the spa- to develop parametcrizations for the formation,
tial/temporal correlations be resolved in order to extent, and impact of cumulus convection. Althougheliminate high-frequency variations that ma 7 be causod these parameterizations are an essential ingredient inby separation of source or instrumental noise. Relative mesoscale and global scale atmospheric models, theyenhancements would not be derived by the cross- are still very crude, case specific, and only looselycovariance of two species at zero lag but rather based on the underlying physics. More recently, cloudby their values at some lagged time that would be transport of chemical species was estimated over therepresentative of some fraction of the integral scale. Amazon region during the rainy season in ABLE-2B.There is a need to sample far enough downwind so Many of the previous atmospheric studies ofthat different point sources in the region have had a convection have emphasized the internal dynamicschanc_ to mix partially. Empirical definition of the of the process rather than the effective transportintegral scales is needed for specific cases, properties of a field of cloud elements. From
The multivariate statistics resulting from such an a chemical pe, spective, Rittcr (1984), Ching ct al.experiment could be usod in conjunction with simple (1985), and Greenhut (1986) have investigated thequasi-Lagrangian models of the chemical evolution of transport by cumulus clouds between the mixedemissions as they mix and evolve with the background layer (subcloud baso) and a capping inversion atair. They could be used to define what happens cioudtop using aircraft, surface-based measurements,chemically to such emissions as they pass from the and tracers.boundary layer into the free atmosphere by convective It is now clear that a study of these proccssos
processes and how much ozone is produced in the should be undertaken using a combination of aircraft .],open troposphere as these layers dispcrso. The more and ground-based rcm_,te sensors, in addition to thespecies that arc measured simultaneously, the greater direct sonsing capabilities mentioned above. Thethe numberofconstraintswith regard to absolute fluxes remote sensors should include the complementaryand photochemical age could bc applied to reduce the pairing of a chemical measuring (DIAL or Raman)uncertainty of the results, lidar with a vertical velocity Doppler lidar or
radar profiling system. Such an experiment would
Exchange between the PBL and the be integrated with a high-resolution satellite ck)udmap (e.g., from LANDSAT), which would allowFree Troposphere cxhapolation to model grid s_.alcs.
We propose that fulure experiments of this typeA key issue is the rate of exchange of chemical bc done in two phases. The first phase would bc in
species between the PBL and the frec troposphere, dry convective conditions (few or no clouds), in whichMeteorologists usually divid,." this exchange into the flux divergence of spccilic species within the PBLtwo separate processos: "entrainment," where free would be related to the characteristics of the transition
tropospheric air is brought into the PBL by small- (inversion) layer as a function of synoptic conditions.scale turbulence processes (i.e., spatial extent less Data from such a study will enable top-down andthan a few hundred meters) across a clearly defined bottom-up dill'usion theories (Wyngaard and Brost,density discontinuity, and "cloud venting," where large 1984) for the vertical profiles of scalar fluxes to beorganized convective elements, powered by latent-heat evaluated and related to larger-scale c,mditio_:s.induced buoyancy, transport substantial amounts of The second phase would occur in an _,ctivePBL air throughout the troposphere (as high as the convective cloud field. Airborne fast-responsetropopausc for deep convection). Both processes have instruments would be used Lelow and within the cloud
received considerable attention from meteorologists layer to determine updraft/downdraft statistics andbecause of the obvious importance of the vertical the transport of chemical spocies within the cloudstransport of momentum, sensible heat, and moisture, and in the region between clouds. Vertical meanThe entrainment process has bccn studied most concentration profiles within and above the PBL toextensively for the clear and stratocumulus-topped determine the concentration jump at the inversionconvec,ive PBL. The entr:.'inmcnt rate for marine are important for undc_st,,nding the observed cloudstratocumulus is typically in the range of 0.05 to transport. These can be determined from aircraft1.0 cm s-t, while in the clear, continental PBL it may ascents and descents and by ground-based prolilingbe as large as several tens of centimeters per second techniques.near midday. Satellite data obtained simultaneously would be
Cloud transport has been studied in a variety of used to determine the representativeness of the cloudlarge field programs (e.g., the Global Atmospheric Re- field sampled by the aircraft o_r a larger region, thussearch Program Atlantic "lYopical Experiment [GATE I making a connection between the flux d;vergence ofand the Cumulus Cloud and Precipitation Experiment species within the PBL to the larger synoptic scale.
1990002793-087
PROGRAM PLAN 81
Modeling and Parameterization region). The need to consider the consequencesof random variability in ihe atmosphere requires a
The objective of field experiments is the quan- more statistical description of processes in modeltilication of chemical budgets over particular areas calculations. One way to do this is to develop stochasticand times. Modeling is essential to provide an descriotions of selected processes for incorporationinterpretive framework fi)r Ilux measurements that into a coupled transport-chemical model (Stewart etare often fragmentary and unrepresentative in space al., 1988). Obsercations are used as a basis for theand time, even in experiments that include a broad statistical description of the phenomenon to be studiedspectrum of measurements from enclosures, towers, (e.g., wind statistics for turbulence or advection flaxes),and aircraft in carefully chosen test areas. Models that and repetitive model simulations are carried out, eachare speciIic to the experimental region cannot only one with a different but statistically equivalent scenariofill in the sampling gaps, but also help to develop of individual events to calculate means ar.d variances.empirical parameterizations that can then be usedfor global scale chemical transport models which, asemphasized in GTC-Plans for the U.S. Research Effort Parameterization Experiments
(UCAR, 1986), are essential tools for understanding A major goal for lield research is the developmentand predicting changes in the earth's chemical system, of parametcrizations that can then be used in modeling
studies on a variety of temporal and spatial scales fromRole of Models in Experimental Design and Analysis local to global, and from a few hours to thousands of
Models that relate concentrations and fluxes years. Some of the most difficult problems in this
are essential complements to expeliments. Their area deal with paramcterizing fluxes over real-worldrole is twofold: to help plan future measurement surfaces, such as forests, hills, and oceans.strategies and to interpret observations. On the Development of metho,lologics for examining air-scale of a given cxperimcnt, models are used to test surface exchange within and above deep vegetativeassumptions about processes and mechanisms affecting canopies should be continued. This includes cvalu-trace species distributions. Both observational and ation of micromctcorological approaches, te._'ing themodeling studies are conducted to evaluate budgets adequacy of measuremcnts from single towers, dcvel-o," species concentration, as given by (2.6) or by opment of sitc-specilic, simplilicd sampling strategies,an intcgratcd form of this equation. Basically, and fundamental studies of exchange among dillcrcntthese rclations cquate the time rate of change of portions of the canopy and underlying surface. Forconcentration to the sum of horizontal advcction, example, standard turbulence flux-gradient approachesvertical flux divergence, and chemical sources and inside canopies are usually not successful, which implicssinks. For a chemically inert gas (e.g., CO_,), chemical that resistance models of cxchangcs within the canopysources and sinks ate negligible. Therefore, Iluxes are not realistic.can bc measured by either enclosure methods or, if Dcvelopmcnt and extensive testing of Ilux mea-a sufficiently fast-response high-rcsohmon sensor is surement tcchniqucs over hilly terrain are also needed.available, from towers or aircraft. Likewise, the inlluencc of isolated surf:,,e irregularities
For species that arc chemically rc:tctive on a time ,'e.g., windbreaks) needs to be evaluated. Thesescale comparable to the transport and mixing time and related problems of scale are best in_cstigatcdscales of the atmosphere, encl¢_suro methods may not with a combi,_ation of measurements from towers .tl_Jbe feasible, and llux divergence may bt_ appreciable in aircraft, with additional contl'ibutions from cnclosurcthe surf;,ce layer, which greatly complicates the use of studies.micrometcorological techniques for flux n_casurcmcnt. Estimates of air-sea cxchange ratcs of many traceIn this situation, modeling may play an important chemical species are _ecessary. Water surface skinrole in estimating terms in the budget equation conductance needs to be studied, particularly for windand evaluating observational s_rategies. Sometimes, speeds greater than about 15 m s-1. Althoughalthough individual tract: species may not bc conserved, initial studies may be prolitably carried out in shallow-the sum of several species may be (e.g., NO,,). w'ttcr a, :as, cxtcnsiol: to the open sea, whcre the
An important problem in dctcrmini'lg chemical parametcrizations Lave to be applied, will eventuallybudgets from licld studies concerns the inherent be required.variability of the atmosphere. A predictable or
systematic variability duc to seasonal and diurnal Development of Techniqueschanges can be dealt with by a combination of lieldstudies and modeling. Random wlriability presents Research on fundamental aspects of the propertiesgreater dill'iculty (e.g., convective turbulcnce that can of turbulence involving chemical species is nccessat 7cause large intermittent fluxes of matctml over small Io advance the state of the art of micrometcorologicalareas, or precipitation that can quickly deplete the techniques. For example, further studies to accuratelyatmosphere's soluble gases and aerosols in a small determine the Kohnogorov inertial subrangc constant
1990002793-088
82 CHEMICAL FLUXES
h)r trace species will lead to better accuracy of the with improw',! pcrh)rmance, other improvements todissipation technique ('Fairall and Larsen, 1986), which instrument_,,ion are needed. Sensors that are smaller,can be used on moving platforms such as ships. Studies reliable, easy to operate, and more durable wouldof the influence of rapid chemical reactions on both be useful for working in vegetative canopies. Themean and tuioulcnce variables obtained from chemical application of remote-sensing techniques to measurespecies, including flux-prolile relationships, statistical proliles of vertical flu,_.:_sshould be pursued. Tetheredquanti'.ics such as variances, covariances, skewness, balloons and blimps oll'¢;r some advantages as well.and other higher-order mt_mcnt.',, and _pcctla and Inertial plath)rms might be deployed on ships so thatcospcctra of chemical species and related variables eddy correlation could be applied at sea without rigid(e.g., velocity components, temperature, and humidity) platforms.should improve our understanding of the limitations Some major facilities need to be developedof flux measurement techniques and yield useful new or exploited. Existing tall towers (heights of 100approaches to flux measurement, to 300 m) should be utilized when appropriate;
Statistical measures such as the integral scale or worldwide inventory of their locations, surroundings,spectral shapes of trace species fluctuations should be and availability should be taken so that they may bcinvestigated as tracers h)r PBL entrainment and for considered when needed. Construction of a major seaadvcOion associated with nonuniformities in surface platform should be considered. Possibilities include aexchange. As well-dclincd situations are examined and deep-sea spar buoy and jack up platforms, with spacedocumented, derived statistical measures of behavior and facilities adequate for operation of sophisticatedcould be applied to chemical species whose vertical chemical instrumentation.exchange characteristics are still poorly understood. Although remote measurc,-nent of trace speciesApplication of saturation-point theory developed by fluxes seems fcasibile, to date we know of no such _'Betts (see Bocrs and Betts [1988] and references attempts. We mcr, tion the possibility occause of tthe ,n) may give useful information h)r e_timating the t;otcntial importance of being able Lo measurePBL entrainment rates, flux profiles from either the ground r an aircraft.
Work should continue on dew:loping eddy- This would obviate the need h)r tall towers, eliminateaccumulation techniques into operational flux- flow distortion errors, and permit low-level fluxmeasuring tools. Further rclinemcnts arc neces- measurements from aircraft. Range-resolved remotesary to obtain precision comp:trable to established measurements of bc)th wind fields and trace gasmicrometcorological techniques; in particular, flow cc._nc,;ntrations h:_;'e be_:n carried out, although notcontrol must be improved or parameterizations concurrently. Remote measurements of ozos_ebased on micromcteorological concepts developed to concentration have been discussed previously. In theallow al'ernative realizations of the eddy-accumulation case of wind proliling systems, several types of sensorstechnique utilizing simpler fluid Ilow principles, are in various stages of development and application.
The criteria h)r use of path-averaged conccn- These systems include conventional acoustic s¢_undcrstrations, such as obtained by optical absorption (SODARs), higher-frcqucncy "mini" acoustic sounders,measurements over tens of meters, need to be phased-array clear-air UHF (400 MHz) radar systems,established for gradient techniques. It appears that the and Doppler lidars. Conventional acoustic soundersrcquin area of horizontally unih)rm conditions would _,ave vertical range reso!ution on the order of 50 m f_rincrease as the path length increases. Certainly, criteria a three-minute integration over a range of _b¢}u_ It)0concerning siting and accuracy of measurements to 500 m. The resolution of the UHF radar system iscannot be relaxed, as compared to traditional gradient range-dependent with 1()_)m resolution over the rangemethods. For example, relined understanding is from 300 to 2600 m typical h)r a two-minute integrationneeded of the way in which uncertainty in the height period. Over an extended range of 600 to 7,000 m, adifference between any two horizontal averaging paths similar two-minute integration would typically provide aaffects the accuracy of the eddy Ilux c¢_mputcd fiom range resolution of about 300 m. Doppler lidars offerthem, and of the consequences of operating too near the promise of even better pcrh)rmance at extendedthe zero-plane displacement height, ranges than the UHF radar, although they are at a
In addition to the need fl)r chemical sensors much earlier .,;lage of development.
] 990002793-089
/
5 NEW OPPORTUNITIES FOR FLUXMEASUREMENT
B. B. Hicks, C. E. Kolb, and D. H. Lenschow
The preceding discussion indicates that the status important component of many spectral detectionof instrumentation for mczasuring species concentration techniques, especially those utilizing tunable lasersvaries greatly for different species. On the one hand, for differential absorption measurements. Most suchfor some species such as ozone and NO, current devices currently use traditional White-cell geometriesinstruments can bc used to measure flux by eddy that typically allow 20 to 40 passes. Recently,correlation and other techniques. At the other ex- researchers at Aerodyne Research, Inc. have beguntrcme, for many species no foreseeable development_ to utilize off-axis resonator cells, which were originallyappear likely to provide means for tlux measurement, developed as optical delay lines for early computerBetween these extremes, for many species techniques applications (Herriott and Schulte, 1965)_ to increase
on the horizon offer considerable potential. Generally, the number of passes. _'no single method promises to be a breakthrough for Such off-axis resonators can theoretically belarge numbers of species. Thcrcfl)re, rcscarch aimed con_gured in an "astigmatic" manner, which snouldat improved chemical species sensors needs to bc allow an increase of 10 to 30 in the number of passescarefully considered on a species-by-species basis; in and therefore in the absorption path Icngth and thesome cases, small improvements in existing techniques sensitivity h)r a given size sample cell. Such an ,_dvancemay besulricient to provide llux measurement; in other would make either airborne or ground-based eddycases, completely nc_, tcchnolog 5, will be necessaly, correlation or gradient measurements with tunable
Advances nn tunable laser sources can be laser absorption techniques possible for a much largerexpected to lead to signilicant improvements in number of gas_s.
detection techniques using dillcrential absorption or The .,,ensitivity of most tunable laser absorptionlaser-induced Iluoresccnce spectroscopy. Similarly, lield measurements is limited to dill'crential abs_rp-incremental improvement in both sample handling tions (AI/I, where I is the laser intensity on theand detection technologic.', fl_r chemilumincscent andchromatographic instruments are also clearly possible, detector) of 10-3 to 10-4. Differential absorptions
Beyond incremental improvements in existing in the 10-6 range have been reliably measured in thetechnology, it is important to identify and pursue laboratory but are often difficult to achieve becauseopportunities for improvements of an order ¢,f of the presence of Fabry-Pcro;. interference fringesm:,,._nitude or more in sensitivity or responsMty. It (ctalons) generated by multiple-beam iJ',tcr/crenccs i_,is also critical to identify new detection technologies the optical path.that may have been demc.lstlated in laboratory use Several signal processing techniques are currentlybut have not yet been evaluated for lickl use. being developed, particularly for tunable diode laser
While it is difficult to predict where the next systems, which promise to allow routine measurements
breakthroughs in sensor technology will no:cur, it is of A1/1 in the 10-5 to 10-7 range, greatly increasingpossible to cite a few examples from current laboratory the sensitivity of TDL-based instruments. Tl_ese newwork that hold great promise. Other novel detection techniques include the two-tone optical heterodynetechniques for the priority species discussed in earlier or two-tone frc:.uency modulation :_,cthod underchapters are certainly possible, and research into a development at IBM, SRI International, and NASAwide variety of new detcc.tion schemes should be (Gchrtz, et al., 1986; Cooper and Warren, 1987; Chouencouraged, and Sachsc, 1987); the sweep integration techniques for
fringe subtraction developed at McMastcr UnivcnsityImprovements in Chelnical Sensing (Cassidy and Reid, 1982; Beckwith ct al., 1987);
and the Brewslcr-plate spoiler technique for fringeIR Absorption Sensor _reakthroughs rcduct!gn developed at tile Jet P_'opulsion Laboratory
Multipass optical paths, whether inside closed (Webster, 1985). Coupling one or mere: of thesesampling cells or open to the atmosphere, are an fringe reduction techniques with the lo',¢cr-magnitude
83
1990002793-090
84 CHEMICAL FLUXES
fringes typically found in the oil:axis rcsonatof Applications of this technique for molecularmirror geometries noted above should greatly extend species have been reviewed by Johnson and Otisthe capability of TDL and related tunable laser (1981), while exlcn_ions to free radical spcciesinstrumcms, have reccqtly been reviewed by Hudgcns (1987).
At sufficiently low pressure, the technique can bcSensor Breakthroughs for S_:lfur Species coupled to mass spectrometric detection, providing a
second level of spccilicity (Schlag and Ncusscr, 1983;Chromatographic separation is an important Bernstein, 1982). This technique, with or with_,ut mass
tcchniquc for many high-priority but low concentration spcctrometric ion selection, may eventually bc usefultrace species--particularly volatile sulfur species, forflux measurement.
Because of the current low detection capability for Detection technologies that can measure a numberstandard llamc photometric detection (FPD), as of species simultaneously areclearlydcsirable. Fourieroutlined in Chapter 3, many species can bc quantiiicd transform infrared (FTIR) instrumcnts have oftenonly by lengthy batch concentration tcchniqucs. Evcn been uscu in quantifying infrared-active gas mixturesgradient tlux measurement methods require a much in laboratory studies, heavily pel?utcd atmospheres,morc efficient detection system for sulfur compounds, and industrial process strcams (GrilI'iths, 1983;
At least twolaboratorics arc currcntly in,_cstigating Thcophanidcs, 1984); they have also bccn used intechniques that promise at least a factor of 100 incrcase tield infrared emission an_.lyses of hot gas sourcesin sensitivity for gaseous sulfur species. Investigators (Wormhoudt ct el., 1985), and in thc upper atmosphcreat Dcnvcr University arc dcvOoping a hydrogen llame (Kundc ct al., 1987). Significant advanccs arc now
tcchnique for convcrting sulfur spccics to SO, followed being made in engineering small, rugged, and highly .,_by chcmilumincscent dctcction of SU_, formed by sensitive I--TIR instrumenvs. Furthermore, the advcntreaction of SO with 03. of microprocessors allow,., real-time calculation of
In,estigators at the Georgia Institute of Tcch- Fourier transforms and data display, even under fieldnoiogy are attempting to adapt a microwavc-induccd conditions. It may be possible to couple _-I'IR sensorsplasma/cmnssion spectroscopy (MIP/ES) technique to with other multispecics sensing capabdities and to usehigil-cfficiency sulfur detection. A plasma consisting novel multipass or long path cells to allow si:nultaneousof atoms and ions of the sample gas is produced gradient measurements of several species.by a microwave generator, and the plasma emissionis monitored by a photomultiplicr at a wavelengththat is specific for thc sample gas. The advantage Fhlx Measurement Technologyof MIP/ES over conventic,nal FPD is the relativelyhigh excitation cnergy, which cre:'tcs a wcll-dclined For the most part, the micrometeorological
technology necessary for flux mcasuremept is availableplasma; by comparison: flame excitation produces avariety of atoms, molecules, and radicals at dilfcrcnt and relatively mature compared with chemical sensorenergy levels, which are strong functions of the tlame technology. Therefore, we fccl that the atmosl_hericcharacteristics. Another advantage of MIP is that chcmistry community need not direct a great dealplasma emission is much stronger than Ilame emission of attcnti.m to improvements in this area. Clearly,and therefore promises a substantially lower detection the greatest impact on the capabilities for Ih:xlimit, possibly down to levels that make the real-time mcasurcment will come from development of hi!,h-q_onitoring of sulfur and other gases in the atmosphere speed, high-resolution chemical sensors that arc
adequate for eddy-correlation tlux measurements, andpossible, fr_;ia very accurate high-resolution sensors for mean
measurements that are nee:led for flux measurement
Laser Ionization Sensors by thc gradient technique and 0y budget techniques.Spectral detection techmqucs have an enormous Since the most fundanlcntal and direct technique is
value, since they can often be dcsigncd to display very eddy corrclation, v,c fccl that if there scorns somehigh specilicity h_r the target species. On the other hope of developing sensors capable of cddy-correlationhand, thc collection and detection of photons can be Ilux measurement, this is the preferred course torelatively inefl'icicnt. Individual ions at low pressure pursue. This development is especially importantcan, howcvc,, bc reliably detected. The combination for flux measurement from aircraft, because of lheof spectral specificity (c×ploiting curr,'ntly a_filablc impracticality of Ilying sulficicntly close to the surfiicclaser technology) and unit detcctivity can currently be to use surface layer similarity mcthods (c.g., the surfacec,_mbincd in lab_;ratory studies in the technique of layer Ilux--gradient relationship)for cstin'mting the llux.resonance.enhanced multiphoton ioni':ation (REMPI). There are, however, a few areas whcrc improve-In REMPI, one or more relatively high-powercd, mcnts in airplanc technology for Ilux measurement arctunable lasers arc used to photoionizc the target desirable--_'nd anticipated. The Global Positioningspecicsvia absorption of two or more photons through System (GPS), a satellite-based radio navigationan iatcrmcdialc excited electronic state, system, can provide more accu,,atc aircraft position
1990002793-091
NEW OPPORTUNITIES 85
and velocity than the currently used inertial navigation dcsirablc to dcvclop sensors that measure mixingsystem (INS). On the other hand, INS has beVtcr ratio--particularly h)r aircraft but also for ground-time response and can make accurate measureme._ts of based Ihnx measurements.
_ airplane attitude angles that are required for accurate In the more distant future, development ofmeasurements of vertical air velocity. The combination airborne remote sensors has the potential of rcvolu-of GPS and INS will improve the accuracy of mean tionizing the use of aircraft as a mesoseale measuringwind measurements and, to a lesser extent, of velocity platform. Airborne DIAL has already been developedfluctuations. The most pressing need in species and used for proliling mean ozone and humidityconcentration measurement from aircraft is a reliable structure in the atmosphere. Raman techniques alsoand robust low-drift, fast-response humidity sensor, offer some potential for remote species measurementThis is an active area of techn logical exploration. The in the atmosphere. Ground-based and airbornesolu:ion has been just around the corner for the past Doppler lidars have been developed. It is conceivable20 years. We still believe that within a few years, that eventually they can be combined with remotethe promise will be realized with new optical humidity species measurements and provide a remote eddy-detectors (infrared or ultraviolet). Recently, several correlation flux measurement capability, both from thecommercial IR hygrometers have become available ground and from aircraft. In this way, flux profilesand a UV hygrometer has been under development, might be measured remotely, without the need ofbut these have not yet been thoroughly tested by multiple measurement levels.the meteorological community, nor have they been Obviously, other new developments to improvedesigned for aircraft use. A UV hygrometer for aircraft flt_x measurement not even anticipated at thi._ timeuse is now under development at NCAR. arc certain to emerge. Because of this, it is
An important consideration for chemical species important to monitor developments iv',instrumentationflux measurements from aircraft is the error that not immediately applicable to llux measurement that _'can bc introduced into the measured eddy-correlation may sometime provide a key h)r further advancc-llux by dov, distortion and air density fluctuations if ment. Inertial nagivation systems, for example, weresp,'cies dcnsit.' is measured (as is the case for radiation developed for self-contained military guidance andabsorption or emission sensors). As Wyngaard navigation applications. Without this application, the(1988a) points out, this error is potentially signilicant, technology would likely ncvcr have become avaW,bleparticularly if the species measurement is in a strongly to the scientific communi:y. Yet they provided the keydistorted flow region such as near the aircraft fuselage, h_r accurate eddy.correlation flux mcasurcmcnt fromThere is no error, however, if instead species mixing aircraft. Similarly, there arc likely other technologicalratio is measured. As pointed out earlier, measuring breakthroughs that may someday give us capabilitiesmixing ratio with respect to dry air also obviates the that are now jr, st imagined. Wc hope that this reportnccd for correcting h)r mass fluxes resulting from is of some help in summarizing the current state-of-the-sensible and latent heat lluxcs. Therefore, it is highly art and encouraging developments in flux technology.
1990002793-092
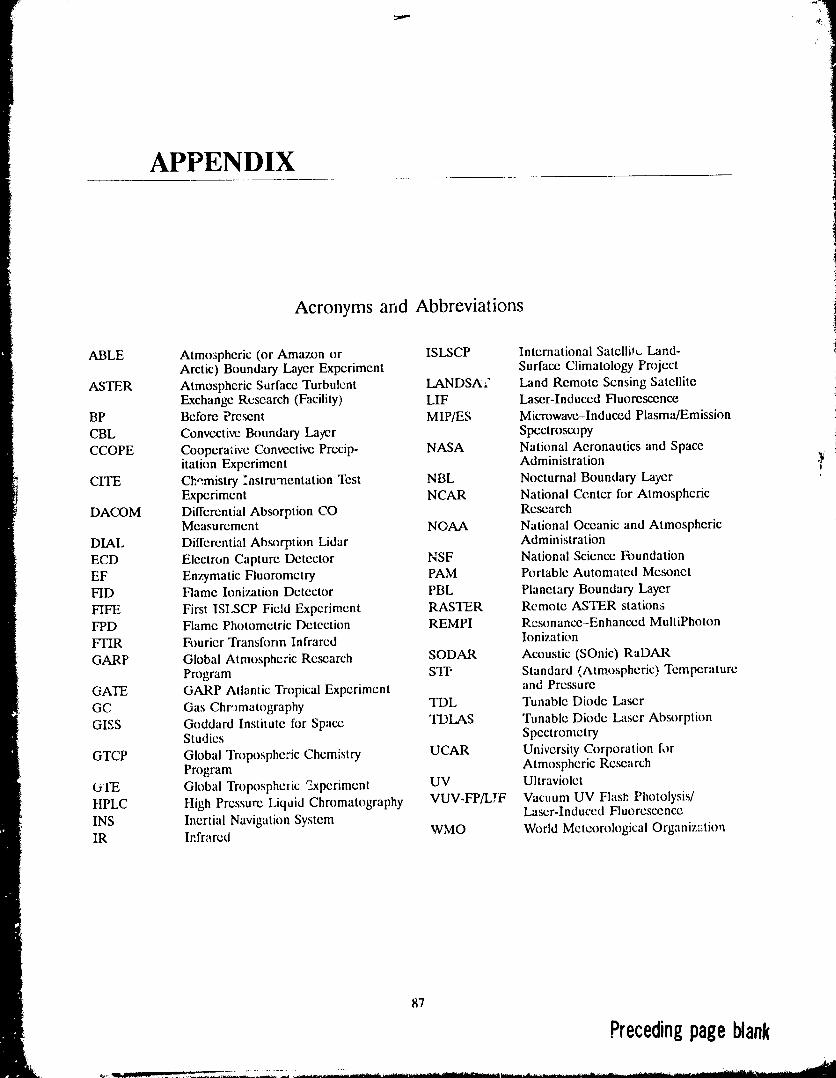
APPENDIX
Acronyms and Abbreviations
ABLE Atmospheric (or Amazon or ISLSCP International Satclli_t. Land-Arctic) Boundary Layer Experiment Surface Climatology Project
ASTER Atmospheric Surface Turbulent LANDSA_" Land Remote Sensing SatelliteExchange Research (Facility) LIF Lair-Induced Fluorescence
BP Before Prcscnt MIP/ES Microwave-Induced Plasma/Emission
CBL Convective Boundary Layer Spectroscopy
CCOPE Coopcralivc Convective Prccip- NASA National Aeronautics and Spaceitation Experiment Administration _
CITE Chemistry :nstrumentation Test NBL Nocturnal Boundary LayerExperiment NCAR National Center for Atmosphcric
DACOM Differential Absorption CO ResearchMeasurement NOAA National Oceanic and Atmospheric
DIAL Dill ercntial Absorption Lidar AdministrationECD Electron Capture Detector NSF National Science Foundation
EF Enzymatic Fluoromctry PAM Portable Automated MesonetFID Flame Ionization Detector PBL Planetary Boundary Layer
FIFE First ISLSCP Field Experiment RASTER Remote ASTER station_FPD Flame Photometric Detection REMPI Resonance-Enhanced MultiPhoton
FTIR Fourier Transh)rm Infrared Ionization
GARP Global Atmospheric Research SODAR Acoustic (SOnic) RADARProgram STP Standard (Atmospheric) Temperature
GATE GARP Atlantic Tropical Experiment and Pressure
GC Gas Chr')matography TDL Tunable Diode LaserGIc_S Goddard Institute h)r Space TI)LAS Tunable Diode Laser Absorption
Studies Spectrometry
GTCP Global Tropospheric Chemistry UCAR University Corporation forProgram Atmospheric Research
t_ilE Global Troposphelic Experiment UV Ultraviolet
HPLC High Pressure Liqoid Chromatography VUV-FP/LYF Vacuum UV Flasl_ Photolysis/Laser-Induced Fluorescence
INS Inertial Navigation System WMO World Meteorological Organiz:tioqIR Irfr_red
87
Precedingpageblank
"1990002793-093
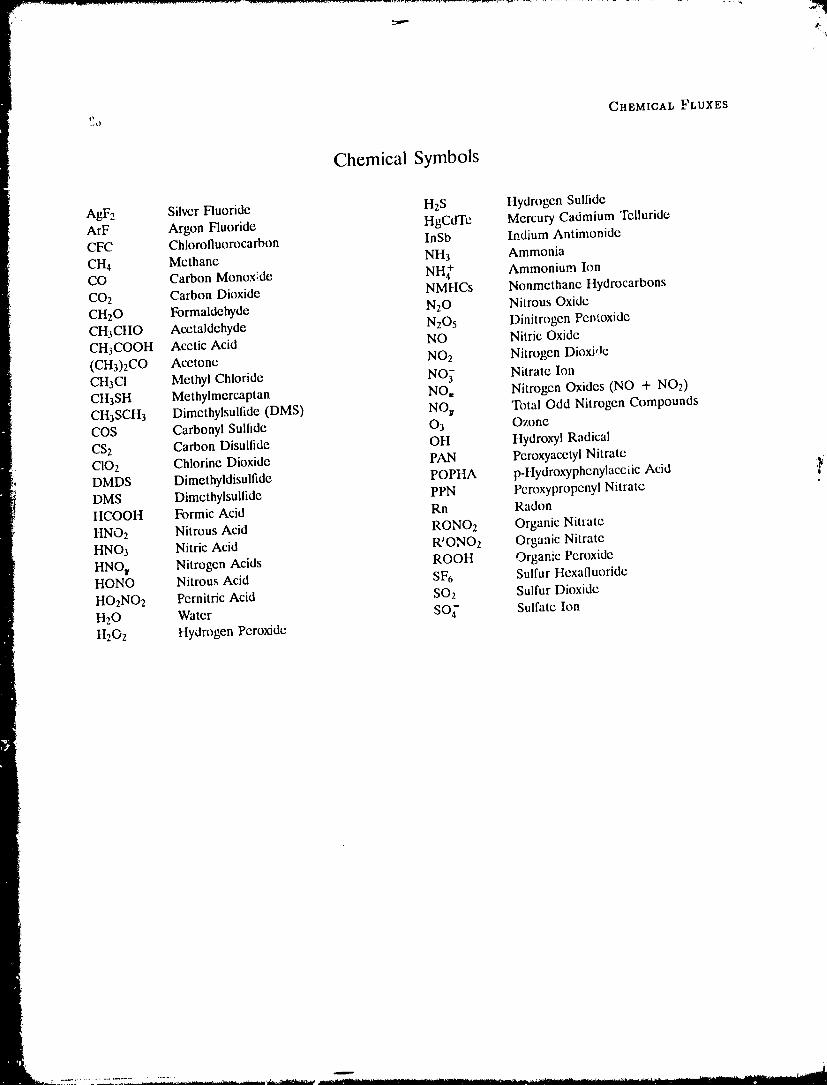
/
'_]o CHEMICAL FLUXES
Chemical Symbols
AgF2 Silver Fluoride H2S Hydrogen SullideArF Argon Fluoride HgCdTe Mercury Cadmium TellurideCFC Chlorofluorocarbon InSb Indium Antimonide
CH4 Methane NH3 Ammonia
CO Carbon Monoxide NH 2- Ammonium IonCO2 Carbon Dioxide NMHCs Nonmethanc Hydrocarbons
CH20 Formaldehyde N20 Nitrous Oxide
CH3CHO Acetaldehyde N205 Dinitrogen Pen_,oxideCH3COOH Acetic Acid NO Nitric Oxide
(CH3)2CO Acetone NO2 Nitrogen Dioxi,_c
CH3CI Methyl Chloride NO/ Nitrate IonCH3SH Methylmercaptan NO,, Nitrogen Oxides (NO + NO2)
CH3SCH3 Dimethylsulfide (DMS) NOy Total Odd Nitrogen CompoundsCOS Carbonyl Sullide 03 Ozone
CSz Carbon Disulfide OH Hydroxyl Radical
CIO2 Chlorine Dioxide PAN Peroxyacetyi Nitrate
DMDS Dimethyldisulfide POPHA p-Hydroxyphenylacctic Acid 'iDMS Dimethylsullide PPN Pcroxypropenyi NitrateHCOOH Formic Acid Rn Radon
HNO2 Nitrous Acid RONO2 Organic NitrateHNO3 Nitric Acid R'ONO2 Organic Nitrate
HNOy Nitrogen Acids ROOH Organic PeroxideHONO Nitrous Acid SF6 Sulfur Hcxafluoride
HOzNO2 Pernitric Acid SOz Sulfur Dioxide
H20 Water SO_' Sulfate Ion11202 Hydrogen Peroxide
1 _q_qNnno7a'a_naA
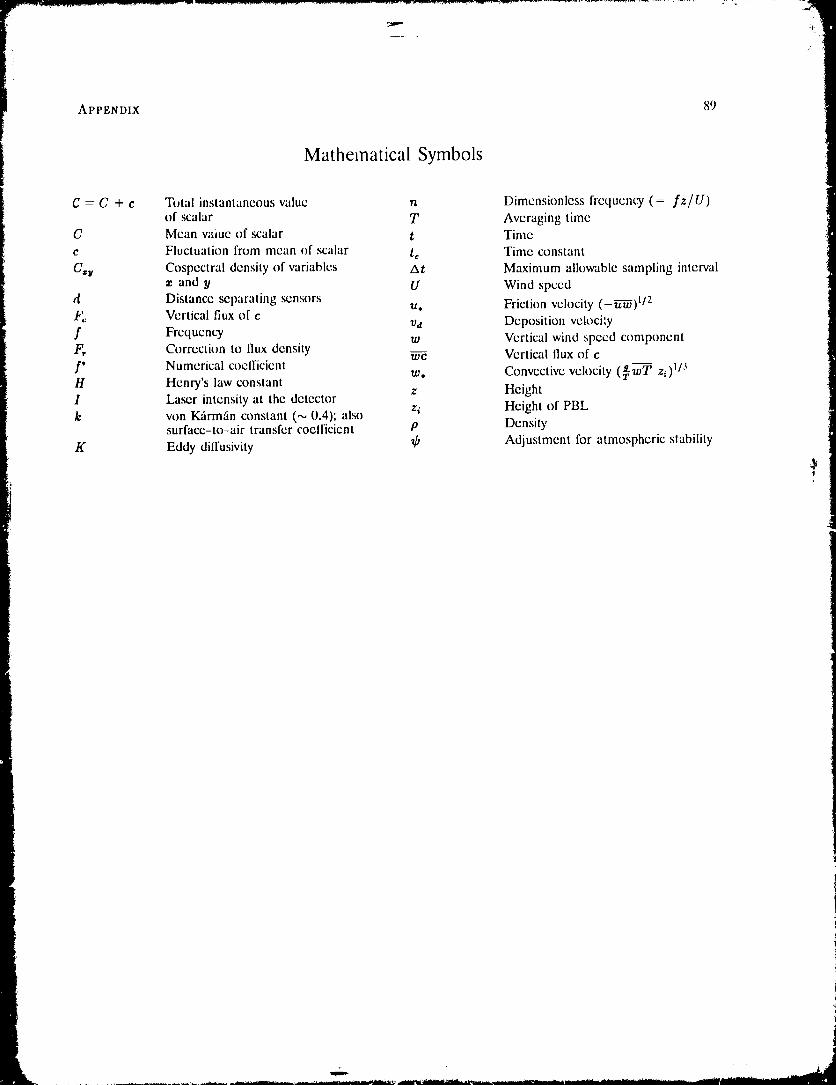
APPENDIX 89
Mathematical Symbols
C _--C + ¢ Total instantaneous value n Dimensionless frequency (= fz/U)
of scalar T Averaging timeC Mean vaiuc of scalar t Time
c Fluctuation from mean of scalar tc Time constant
Czy Cospectral density of variables At Maximum allowable sampling intervalz and y U Wind speed
d Distance separating sensors u, Friction velocity (__--_)x/z
F_ Vertical flux of c v,, Deposition vcloci:.yf Frcqucncy w Vertical wind speed componentF, Correction to Ilux density we Vertical Ilux of c
f' Numerical cocll'icicnt w. Convective velocity (_wT z_)1/3H Henry's law constant
z HeightI Laser intensity at the detectork w)n Kfirm,'in constant (,-, 0.4); also zl Height of PBL
surface-to-air transfer coefficient P Density
K Eddy diffusivity _, Adjustment for atmospheric stability
!
.... _ ............. _ .......... w,m_ ....... _ ...... ,m,,f................. /.................. II......... i1111_,IIII
1990002793-095
!
/
REFERENCES
Adams, D. F., S. O. Falwcll, E. Robinson, M. R. Pack, , H. Bcrrcshcim, and M. Dingcmcr, 1989a: Tileand W. L. Bamcsbergcr, 1981: Biogenic sulfur .'_mrce atm')sphcric sulfl_r cycle over the Amazon Basin. Un-strengths, l'_nviron. Sci. Tedmol. 15, 1493-1498. published manuscript
Aldaz, L., 1969: Flux mcasurcmcms of atmosphtzric ozone ..... E. V. Browcll, M. Garstang, G. L. Gregory, R.over land and water. J. Geophys. l',es. 75, 6943-6946. C. llarriss, G. F. tlill, D. J. Jacob, M. C. t'creira, G.
W. Sachsc, A. W. Sct:;cr, P. L. Silva Dias, R. W. Talbot,Ammons, J. M, 1980: Prcconccntration methods fl)r the
determination of ga .ous sulfur compounds in air. PhD A.L. Forrcs, and S. C. Wof:;y, 1988b: Bioma_s-burningdissertation, University of South Florida, Tampa. cmis,sions and axsociatcd haze layers over Amazonia. J.
Geophyg. Res. 93, 15(,_)-1527.Andc_m, !. C., and J. S. Levinc, 1'187: Simultancous iicld
mcasurcmcnts of biogcnlc emi._ior, s of nitric oxide and , R. J. Fcrek, F. Bcrmond, K. P. Byrd, R. T. Eng-nitrous oxide. J. Geophys Res. 92 965-976. slr,,,'Tl S. Hardin, P. D. lhmmcrc, F. LcMarrec, and
' H. Racmdonck, 1985: Dimcthyl sullidc in the marine., , M. A. Poth, and P. J. Riggan, 1988: almosphcrc. J. Geophvs. Res. 90, 12891-12_)0.
Enhanced biogenic cmKsions of nitric oxide and nitrous ", an_; H. Racmdonck, 1983: Dimclhyl:;u!fidc in the
,),,ride h)llowing surface bioma_s burning. J. (;eoph).s. surface ocean and tile marine atmosphcre: A gk_balRes. 93, 3893-3898. view. Science 221, 744-747.
Andc_m, S. M., av.d M. S. Z :,:iscr, 1989: Open pathdiode la_:r abs," ,'ion measurcnlcnts of trace gas fluxes , R. W. Talbot, and R. C. Harris, '."hgb: Pro-using eddy correlation :Jnpub,shcd manuscript, cipitation chcmlstLy in central Amazonia. Unp,:blishcd
manu._ript.
Andrcac, M. O., 1984: Atmospheric ctfccts of microbial Ancja, V. P., A. P. Ancja, and D. F. Adams, 1982: Bio_cnicmats. In Microbial Mats: Stromatolites (Y. Cohen, R.W. Castenholz, and H. O. ttalvcr_m, Eds.), Alan R. sulfur compounds and the global sulfur cwcL. JAI'C?ALixs, New York, 455-466. .:/2, 803-807.
, 1985: The ch,ixsim of sulfur to the remote at- Arnold, F., G. Knop, and H. Ziercis, _986: Acelone inca.nlospherc. In 1"he Biogco¢'hemical Cycling of SulJitr and surcmcnts in the upper troposphere and lower strai_-Nitrogen in dw Remote Am,_sphere (J. N. Galloway, R. sphere - !replications h,r hydroxyl radical abund,,.tc_.s.J. Charlson, M. O. Andrcac, and H. Rodhc, Eds.), D Nt, tttre 321, 505-597.
Reidcl Publishing Company, Dordrcchl, the Netherlands, Asai, K. "I. ltabc, and T. 13aras!'i, 1983: Optical al ,1 l.aser5-25. I¢,'mote Sensi:t. (13. K. Killlinger arid A. Mo_adiap.
, 1',_86: Tile ocean as a source of atmoSldleric Eds.), Springcr-Vcrlag, New York.sulfur compou,.o.. In 1he Role of Air-Sea I'rchange in Ashcndcn, T. W., and T. A. Manslield, 1977: Inllucnce t,'."Geodwmical C'ycting (P. Buat-Mcnard, Ed.), D. Rcidcl wind speed ('n the sensitivity t)f rye gra_s to SO-,. J. I"W.Publishing Company. Dordrccht, the l':,'tllcrlands, 331- I :)t. 28, 72'1-735.
362. Aycrs, G.P., and J. L. Gras, 1980: Ammonia gas conczmr:_ -__, and T. W. Andrcac, 19h,-,: Th,: cycle of biogcnic tit)ns over the S()uthcrn Ocean. Nature 284, 539-540.
sulfur compounds over th,: Ama/c,n Basin. Part 1: Dry Bakwi:l, P. S., S C. Wofsy, S.-M. Fan, M. Keller, S. Ftmm-_a_)n. J. (ieopl,ys Rex. 93, 1487-1497. bore, and J. M. Da Costa, 1989: Emixsiou of NO by
..................... and R. C. llarri:_, 1988a: Formic and forest soils and removal of odd nitrogen by the canopyacetic acid twer the central Amazt)t region, Brazil. Part of the Amazonian h)rest in the w,.:t season Ur, publishcd1: Dry _a,'_m. J. Geophy_. Rcs. Z:/, 1616-.1¢,24. manu_ript.
__ _ ,',nd W. R. Barnard, 1984: The mari_lc chemistry Baldocchi, D. D., S. 3. Verma, D. R. Matl, and D. E. Amof dlmethylsullide. Marine Chem. 14, 267-279. dcrson, 1986: Edcy-correlatioa measurcm_:nts t)f carbon
........ and J. M. Ammons, b_83: The b!o- dioxide clllux frord the lloor of a deciduous fi)rest. J.Iog:cal productl,m- " of dimcthylsullide in the ocean and ,,ll_pl. I:'colo,k,v 2_, .:67-t;75.its "o! in tll'_ :, .,hal atmt_sphcric sulfur budget. Ecol.Bull. (btoc',,'holm).]'5, 167-1T7.
91
Precedingpageblank
1990002793-096
REFERENCES
Adams, D. F., S. O. Farwcll, E. Robinson, M. R. Pack, , H. Bcrresheim, and M. Dingcmcr, 1989a: The
and W. L Bamesbcrger, 1981: Biogenic sulfur source atmospheric sulfur cycle over the Amazon Basin. Un-
F strengths, l:)tviron. Sci. TechnoL 15, 1493-1498. published manuscript.
i Aldaz, L., 1969: Flux measurements of atmospheric ozone , E. V. Browcll, M. Garstang, G. L. Gregory, R.over land and water. J. Geophys. Res. 75, 6943-6946. C. Harriss, G. F. Hill, D. J. Jacob, M. C. P ._-ira, G.
W. Sachsc, A. W. Setzer, P. L. Silva Dias. R. W. Ta"_ot,Ammons, J. M., 1980: Prcconcentration methods for the
dctermioation of gaseous sulfur compounds in air. Ph.D A.L. Torrcs, and S. C. Wofsy, 1988b: Biomass-burningdissertation, University of South Florida, Tampa. emi_ions and associatcd haze layers over Amazonia. J.
Geophys. Res. 93, 1509-1527.Anderson, I. C., and J. S. Levine, 1987: Simultancous field
measuremcnm of biogenic emissions of nitric oxide and , R. J. Fcrek, F. Bcrmond, K. P. Byrd, R. T. Eng-nitrous oxide. J. Geophys Res. 92, 965-976. strom, S. Hardin, P. D. Houmcre, F. Lclvlarrcc, and
H. Raemdonck, 1985: Dimcthyl sulfide in the marine, , M. A. Poth, and P. J. Riggan, 1988: atmosphere. J. Geophys. Res. 90, 12891-12900.
Enhal_ced biogenie emissions of nitric oxide and nitrous ]/oxide following surface biomass burning. J. Geophys. __., and H. Racmdonck, 1983: Dimcthylsulfidc in theRes. 93, 3893-3898. surface ocean and the marine atmosphere: A global
view. Scietlce 221, 744--747.Anderson, S. M., and M. S. Zahniscr, 1989: Open path
diode laser absorption measurements of _rac_; gas fluxes , R. W. Talbot, and R. C. Harris, 1989b: Prc-using eddy correlation. Unpublished manuscriF', cipitation chemistry in central Amazot_ia. Unpublisi_ed
manuscript.Andrcae, M. O., 1984: Atmosplteric effects of microbial
mats. In Microbial Mat_." Stromatolites (Y. Cohen, R. Ancja, V. P., A. P. Ancja, and D. F. Adams, 1982: BiogcnicW. Castcnholz, and H. O. Halverson, Eds.), Alan R. sulfur compounds and the global sulfur cycle. JAI'CALis.s, New York, 455--466. 32, 803-807.
, 1985: The cmissior_ of sulfur to the remote at- Arnold, F., G. Knop, and H. Ziercis, 1986: Acctone mca-mospherc. In The Biogeochemical C),cling of Stdfttr and surcments it, the upper troposphcrc and lower strato-Nitrogen itz the Remote Atmosphere (J. N. Galloway, R. sphere I implications for hydroxyl radical abundanct.s.J. Charlson, M. O. Andrcac, and H. Rodhc, Eds.), D. Natttt'e 321, 505-507.Reidcl Publishing Company, Dordrccht, the Ncthcrlands, Asai, K. T. ltabc, ; _1 T. Igarashi, 1983: Oi_tical altd Laser5-25. Remote Setlsillg, (19. K. Killlinger and A. Mooradian,
_, 1986: The occan as a _urce of atmospheric Eds.), Springer-Vcrlag, Ncw York.sulfur compounds. In llae Role of Air-Sea l_'change in Ashenden, T. W., and T. A. Mans2_:ld, 1977: lnlluence ofGeochemical C_,cling (P. Buat-Menard, Ed.), D. Reidel wind speed on the sensitivity of rye gra_ to SO 2. J. bgal_.Publ!shing Company, Dordrccht, the Netherlands, 33l- Bot. 28, 729-735.
362. Aycrs, G.P., and J. L. Gras, 1980: Ammonia gas concentre-, and T. W. Andreae, 1988: The cycle of biogenic tions over the Southern Ocean. Nature 284, 539-540.
sulfur compounds o'er the Amazon Basin. Part 1: Dry Bakwin, P. S., S. C. Wofsy, S.-M. Fan, M. Keller, S. Toum-season. J. Geophys. Res. 93, 1487-1497. bore, and J. M. Da Costa, 1989: Emission of NO by
. , and R. C. Harris, 1988a: Formic and h_rcst soils and removal of odd nitrogen by the canopyaccti"_'acid over thc ccntral Amazon region, Brazil. Part of the Amazonian forest in the wct season. Unpublished1: Dry season. J. Geophys. Res. 93, 1616--1624. manuscript.
, and W. R. Barnard, 1984: The marine chemistry Baldocchi, D. D., S. B. Verma, D. R. Matt, and D. E, An-of dimcthylsulfide. Manlae Chem. 14, 267-279. derson, 1986: Eddy-correlation measurements of carbon
...____..__, ..... and J. M. Ammons, 1983: The bio- dioxide efflux _,'om the £oor of a deciduous forest. Zlogical production of dimethylsullidt: in the ocean and Appl. F.coloA.,v23, 967-975.its role in the global atmospltcric sulfur budget. Ecol.Ihdl. (Ztockltolm)35, 167-177.
91
Precedingpageblank
............................................................................................................................................1990002793-097
92 CHEMICAL FLUXES :
Barnard, W. R., M. O. Andreae, W. E. Watkins, H. Binge- induced fluorcsccnce field instrument for ground basedmcr, and H.-W. Georgii, 1982: The flux of dimcthyl- and airborne mca.surcmcnLs of atmospheric NO. J. Geo-sulfide from the oceans to the atmosphere. J. Geophys. phys. Res. 90, 12861-12873.
Res. 87, 8787-8793. I, S. T. Sandholm, C. Van Dajk, M. O. Rodgcrs,Bartlett, K. D., R. C. Harriss, and D. I. Sebacher, 1985: and D. D. Davis, 1988: An advanced airborne
Methane flux from coastal salt marshes. J. Geophy._. photofragmcntation/two-photon laser induced _uores-Res. 90, 5710-5720. cence instrument for the in situ dctection of the at-
Beckwith, P. H., C. E. Brown, D. J. Donagher, D. R Smith, mospheric trace gases NO, NO2, NOy, and SO 2. Inand J. Reid, 1987: High sensitivity detection of transient Proceedings of the Third hltemational Laser Science Con-infrared absorption. Appl. Optics 26, 2643--2649. ference (Paper 67), American Institute of Physics, New
York.Bernstein, R. B., 1982: Systematics of multiphoton
ionization-fragmentation of polyatomic molecules. J. Braman, R. S., J. M. Ammons, and J. L. Brickcr, 1978:Pllys. Chem. 86, 1178--1184. Prcconccntration and determination of hydrogcn sulfide
in air by flame photometric detection. Anal. Chem. 50,Best, A. C., 1935: Transfer of lleat and Momentum in the 992-996.
Lowest Layers of the Atmosphere. Gcophysical Memoirs, F. J. Shelley, and W. A. McClenny, 1982:
No. 65, British Meteorological Office, London, U.K. Tungstic acid for preconccntration and determinationBingemer, H. G., 1984: Dimethylsulfid in ozcan of gaseous and particulate ammonia and nitric acid in
und marincr atmosphfire-Experimentelle Untersuchung ambient air. Anal Chem 54, 358--364.einer natrarlichen Scbwcfelquelle for die Atmosph_ire.Ph.D. dissertation, J. W. Gocthe University, Frankfurt Brinkmann, W. L. F., and V. de M. Sant,_s, 1974: The
am Main, Federal Republic of Germany. emissiOnnianfloodplain°fbiogeniClakes,hydrogenTellus26, sulphide262_267,from Amazo-, and P. J. Crutzen, 1987: The production of
methane from solid wastes. J. Geophys. Res. 92, 2181- Broccker, W. S., J. R. Lcdwcll, T. Takallashi, R. Weiss,2187. L. Merlivat, L. Memery, T.-H. Peng, B. Jahne, and K.
O. Munnich, 1986: Isott_pic versus micrometcorologieBlackmer, A.M., S. G. Robnins, and J. M. Brcmncr, 1982: ocean CO 2 fluxes: A serious conflict. J. Geoph)_. Res.
Diurnal variability in rate of emission of nitrous oxide 91, 10517-10527.from soils. Soil Sci. Soc. Am. J. 46, 937-942.
, and T. H. Pcng, 1974: Gas exchange r_.tes be-Blair, N. E., C. S. Martens, and D. J. Des Marais, 1987: tween air and sea. Tellus 26, 21-35.
Natural abundances of carbon isotopes in acetate froma coastal marine sediment. Science 236, 66-68. Brost, R. A., B. J. Hucbert, and A. C. Dclany, 1988: Nu-
merical modeling of concentrations and fluxes of HNO3,Blake, D. R., 1984: Increasing concentrations of almo- NH 3 and NH4NO 3 near the surface../. Geophys. Res.
spheric methane, 1978-19_q3. Ph.D. dissertatk, n, Uni- 93, 7137-7152.vcrsity of California at lrvive, 213 pp.
Browcll, E. V., A. F. Carter, S. T. Shiplcy, R. J. Allen, C._____.__._ and F. S. Rowland, 1988: Continuing worldwide F. Butler, M. N. Mayo, J, H. Siviter, Jr., and W. M.
incrca.,,e in tropospheric methane, 1978 to 1987. Science Hall, 1983: NASA multipurpose airborne DIAL system239, 1129-1131. and measurements of ozone and aerosol profilcs. Appl.
Boers, R., and A. K. Bctts, 1988: Saturation point structure Optics 22, 522-534.
of marine stratocumulus clouds. J. Atmos. Sci. 45, Brown, K. A., and J. N. B. Bell, 1986: Vcgetationith,.:1156-1175. missing link in the global cycle of carbonyl sulphide
Bolin, B., Ed., 1981: Carbon Cycle Modelling. J. Wiley & (COS). Atmos. Environ. 20, 537-540.
Sons, Chichester, U. K., 390 pp. Brutsaert, W., 1982: Evaporation into the Atmosphele. D., E. T. Degens, S. l:empe_ and P. Ketncr, Eds., Rcidel Publishing Company, Dordrecht, the Netherlands,
1979: The Global Carbon Cycle. J. Wiley & Sons, Chich- 299 pp.
ester, U. K., 491 pp. Buckle),, D. J., R. L. Desjardins, J. L. M. Lalonde and R.Bonsang, B., M. Kanakidov, G. Lambert, and P. Monfray, Burnke, 1988: A linearizcd fast response gas sampling
1988: The marine source of C2-C 6 aliphatic hydrocar- apparatus for cddy accumulation studies. Computers andbons./. Atmos. Chem. 6, 3-20. Electronics in AgTic. 2, 243-250.
Bottger, A., G. Gravenhorst, and D. H. Ehhalt, 1978: At- B'.djsman, E., H. F. M. Maas, and W. A. It. Asman, 1987:mospherische kreislaufe yon stickoxidcn und ammoniak. Anthropogcnic NH 3 emissions in Europe. Atmos. En-Ber. Kemforschungsanlage Julich, 1558. viron., 21, 1009--1022.
Bradshaw, J. D., M. O. Rodgers, S. T. Sandholm, S.KeSheng, and D. D. Davis, 1985: A two-photon laser
1990002793-098
1REFERENCES 93 I
i
Bunker, A.F., 1955: Turbulence and shearing stress mea- Cline, J. D., and T. S. Bates, 1983: Dimcthylsulfide in thesured over the North Atlantic by an airplane accelera- equatorial Pacific Ocean: A natural source of sulfur totion technique. J. McteoroL 12, 445--455. the atmosphere. Geophys. Res. Left. I0, 949-952.
Burkhardt, M. R., N. I. Maniga, D. H. Stedman, and R.J. Cofer, W. R., Ill, V. G. Cg][ins, and R. W. Talbot, 1985:Paur, 1989: Gas chromatographic method for measuring Improved aqueous scrubber for collection of soluble at-nitrogen dioxide and pcroxyacetylnitrate in air without mospheric trace gases. Environ. Sci. Technol. 19, 557-compressed gas cylinders. Anal Chem., in press. 560.
Businger, J. A., 1986: Evaluation of the accuracy with which __, and R. A. Edahl, Jr., 1986: A new technique fordry deposition can be measured with current microme- collection, concentration, and determination of gaseousteorological techniques. J. Clim. and Appl. Meteor. 25, tropospheric formaldehyde. /.trans. Environ. 20, 979-1100-1123. 984.
Carroll, M. A., L. E. Heidt, R. J. Cicerone, and R.G. Cooper, D. E., and R. E. Warren, 1987: Frequency modu-Prinn, 1986: OCS, HaS , and CS 2 fluxes from a salt lation spectrosco_ with lead-salt diode lasers: A corn-water marsh. J. Atmos. Chem. 4, 375-395. parison of single-tone and two-tone techniques. Appl.
, M. McFarland, B. A. Ridley, and D. L. Albritton, Optics 26, 3726--3732.1985: Ground-based nitric oxide measurement_ at Wal- Cooper, W. J., D. J. Cooper, E. S. Saltzman, W. Z. DeMcllo,lops Island, Virginia. J. Geophys. Res. 90, 12853-12860. D.L. Savoie, R. G. Zika, and J. M. Prospero, 1987:
Cassidy, D. T., and J. Reid, 1982: High scnsilivity detection Emissions of biogenic sulfur compounds from severalof trace gases using sweep imegration and tunable diode wetland soils in Florida. Atmos. Era'iron. 21, 1491-lasers. Appl. Optics 21, 2527-2530. 1495.
Chameides, W. L., D. D. Davis, M. O. Rodgers, J. Brad- Crutzen, P. J., 1983: Atmospheric interactions _ homo-shaw, S. Sandholm, G. Sachse, G. Hill, G. Gregory, and geneous gas reactions of C, N, and S containing corn- fR. Rasmussen, 1987: Net ozone photochemical produc- pounds. In Scope 24: The Major Biogeochemical Cyclesuon over the eastern and central north Pacific as in- and Their blteractions (B. Bolin and R, B. Cook, Eds.)
ferred from GTE/CITE 1 observations during fall 1983. John Wiley & Sons, New York, 67-111.J. Geophys. Res. 92, 2131-2152. ___., 1987: Role of the tropics in atmospheric chcm-
__, R. W. Lindsay, J. Richardson, and C. S. Kiang, istry. In The Geop_ysiology ofAmazonia (R. E. Dickin-1988: The role of biogenic hydrocarbons in urban pho- son, Ed.), John Wiley & Sons, New York, 107-130.tochemical smog: Atlanta as a ca_ study. Science 241 .... I. Aselmann, and W. Seller, 1986: Methane pro-1473-1475. duction by domestic animals, wild ruminants, other hcr-
Chatfield, R. B., and P. J. Crutz.en, 1984: Sulfur dioxide in bivorous fauna, and humans. Telh:_ 38B, 271-284.remote oceanic air: Cloud transport of reactive precur- , M. T. Coll'my, A. C. Dclany, J. Greenbcrg, P.sors. J. Geophys. Res. 89, 7111-7132. Haagensen, L. Heidt, R. Lueb, W. G. Mankin, W. Pol-
Ching, J. K. S., S. T. Shipley, E. V. Browell, and D.A. Inch, W. Seller, A. Wartburg, and P. Zimmerman, 1985a:Brewer, 1985: Cumulus cloud venting of mixed layer Observations of air composition in Brazil between theozone. Atmospheric Ozone (C.S. Zerefos and A. Ghazi, equator and 20 ° S during the dry season. Acta Ama-Eds.), Proceedings of Ouad. Ozone Symposium, Hik- zonica, 16, 77-119.ibiki, Greece, 745-749. , A. C. Dclany, J. Greenbcrg, P. Haagenson, L.
Chou, N.-Y., and G. W. Sachse, 1987: Single-tone and two- Heidt, R. Lucb, W. Pollock, W. Seller, A. Wartburg, andtone AM-FM spectral calculations for tunable diode P. Zimmerman, 1985b: Tropospheric chemical compo-laser absorption spectroscopy. Appl. Optics 26, 3584- sition measurements in Brazil during the dry season../.3587. Atmos. Chem. 2, 233-256.
Cicerone, R. J., and R. S. Oremland, 1988: Biogeochemical , L. E. Hcidt, J. P. Krasncc, W. H. Pollock, andaspects of atmospheric methane. Glob. Biogeochem. W. Seller, 1979: Biomass burning as a source of atmo-Cycles 2, 299-327. spheric gases CO, H2, N20, CH3CI, and COS. Nature
282, 253-256., and J. D. Shcttcr, 1981: Sources of atmospheric
methane: Measurements in rice paddies and a discus- Cullis, C. F., and M. M. Hirschlcr, 1980: Atmosphcric sulfur:sion. J. Geophys. Res. 86, 7203-7209. Natural and man-made sources. Atmos. Era,iron. 14,
' 1263-1278., , and C. C. Delwiche, 1983: Seasonal
variation of methane flux from a Californian rice paddy. Dabncy, S. M, and D. R. [k)uldin, 1985: Fluxes of ammoniao,,cr an alfalfa field. Agronomy Journal 77, 572-578.
I. Geophys. Res. 88, 11022-11024.
e
L _ ...........
1990002793-099
94 CHEMICAL FLUXES
Dasgupta, P. K., and H. Hwang, 1985: Application of a genie sulfur compounds from a Florida Spartina Altemi-nested loop system for the flow injection analysis of flora coastal zone. Atmos. l".m,iron.21, 987-990.
trace aqueous peroxides. Anal. Chem. 57, 1009-1012. Denmead, O. T., 1979: Chamber systems for measuring, W. L. McDowell, and J. S. l_hee, 1986: Porous nitrous oxide emissions from soils in the field. Soil Sci.
membrane-baseddiffusion scrubber .,_rthe sampling of Soc. Am. J. 43, 89-95.
atmospheric gases. Analyst (London) 111,87.-90. , and E. F. Bradley, 1987: Or. scalar transport, inDavidson,K. L., W. J. Shaw, and W. G. Large, 1988: Wind plant canopies, lrrig. Sci. 8, 131-149.
stress r_-'ts from multi-platform and _.ulti-sensormea- , J. R. Freney, and J. R. Simpson, 1976: Asurements in FASINEX. In preprint volume, Seventh closed ammonia cycle within a plant canopy. Soil Biol.Conference on Ocean-Atnugspherehzteraction, 1-5 Febru- Biochem. 8, 161-164.ary 1988, Anaheim, CA, American Meteorological So-ciety,Boston, 132-136. , , and ___ 1979. Studies of ni-
trous oxide emission from a grass sward. Soil Sci. Soc.Davis, D. D., J. D. Bradshaw, M. O. Rodgers, S. T. Sand- Am. J. 43, 726-728.
holm, and S. KeSheng, 1987: Free troposphere andboundary layer measurements of NO over the central _____._j R. Nulsen, and G. W. Thurtell, 1978: Ammoniaand eastern north Pacific Ocean. J. Geopbys. Res. 92, exchange over a corn crop. Soil Sci. Soc. Am. J. 42,2049-2070. 840-842.
Dawson, G. A., 1977: Atmospheric ammonia from undis- , J. R. Simpson, and J. R. Frcncy, 1974: Ammoniaturbed land. J. Geophys. Res. 82, 3125-3133. flux into the atmosphere from a grazed pasture. Science
185, 609-610.__, and J. C. Farmer, 1984: Highly soluble atmo-
spheric trace gases in the southeastern United States. , __, and , 1977: A direct fieldPart 1: Inorganic species: Ammonia, nitric acid, sulfur measurement of ammonia emission after injection of _'dioxide. 3'. Geophys. Res. 89, 4779--4787. anhydrous ammonia. Soil ScL Soc. Am. J. 41, 1001-
1004., and , 1988: Soluble atmospheric trace
gases in the southwestern United States. Part 2: Orgr.nic Desjardins, R. 1., 1972: A study of carbon dioxide andspecies HCHO, HCOOH, CH3COOH. J. Geophys. Res. sensible heat fluxes using the eddy correlation tech-93, 5200-5206. nique. Ph.D. dissertation, Cornell University, Ithaca,
N.Y. (available as #73-341 from University Microfilms,, , and J. L. Moyers, 1980: Formic and Ann Arbor, Mich.), 174 pp.
acetic acids in the atmosphere of the southwest U.S.A.Geophys. Res. Lett. 7, 725-728 .... 1977: Description and evaluation of a sensible
heat flux detector. Boundary-La)er Meteorol. H, 147-Deacon, E. L., 1977: Gas transfer to and across an air-water 154.
interface. Tellus29, 363-374.__., E. J. Brach, P. Alvo, and P. 1t. Schucpp, 1982:
Delany, A. C., D. R. Fitzjarrald, D. H. Lcnschow, R. Pear- Aircraft monitoring of surface carbon dioxide exchange.son, Jr., G. J. Wendel, and B. Woodruff, 1986: Direct Science 216, 733-735.measurements of nitrogen oxides and ozone fluxes overgrass land. J. Aonos. Chem. 4, 429--444. , D. Bucklcy, and G. St.-Amour, 1984: Eddy flux
measurements of CO2 using a microcomputer system., P. Haagensen, S. Waiters, A. F. Wartburg, and P. bat. J. of Agr. Meteorol. 32, 257-265.
J. Crutzen, 1985: Photochemically produced ozone inthe emission from large-scale tropical vegetation fires. , J. 1. MacPhcrson, P. H. Schuepp, and F. Karanja,J. Geophys. Res., 90, 2425-2429. 1989: An evaluation of airborne eddy flux measurements
of CO2, water vapor and sensible heat. Boundary-La_erDelmas, R., J. Baudot, J. Servant, and Y. Baziard, 1980: MeteoroL, 47. 55-69.
Emissions and concentrations of hydrogen sulfide in theair of the tropical forest of the Ivory Coast and of tom- Dickerson, R. R., A. C. Delany, and A. F. Wartburn, 1984:perate regions in France. J. Geophys. Res. 85, 4468- Further modification of a commercial NO. detector for4474. high sensitivity. Rev. Sci. Instr. 55, 1995-1998.
Delwiche, C.C., S. Bisscll, and R. Virginia, 1978: Soil and D'Ottavio, T., It. Garbcr, R. L. Tanner, and L. Newman,other sources of nitrous oxide. In Nitrogen in the Envi- 1981: Determination of ambient aerosol sulfur using arom,ent, Vol. 1 Nitrogen Behavior in Field Soil: ( D.R. continuous flame photometric detection system. I1: TileNielsen and J. G. MacDonald, Eds.), Academic Press, measurement of low-level sulfur concentrations underNew York, 459-476. varying atmospheric condition.,.. AOnos. Environ. 15,
197-203.De Mcllo, W. Z., D. J. Cooper, W. J. Cooper, E. S. Saltz-
man, R. G. Zika, D. L. Saveie, and J. M. Prospero, 1987:Spatial and diel variability in the emissions of some bio-
1990002793-100
/
REPERENCES 95
Drummond, J. W., A. Volz, and D. N. EhhalL 1985: An __, R. Wetselaar, and P. M. Firth, 1979: Ammoniaoptimized chemilumincsccnt detecto,- for tropospheric volatilization from senescing leaves of maize. ScienceNO measurements. J. Aonos. Chem. 2, 287-306. 203, 1257-1258.
Duce, R. A., V. A. Mobnen, P. R. Zimmerman, D. Grosjean ....... and B. Weir, 1983: Gaseous nitrogenW. Cautreels, R. Chatfield, R. Jaenicke, J. A. Ogren, E. losses from plants. In Gaseous Loss o/Nitrogen fromD. Pellizzari, and G. T. Wallace, 1983: Organic material Plant-Soil S_stems (J. R. Frency and J. R. Simpson, Eds.),in the global troposphere. Rev. Geophys. Space Phys. Martinus Nijboff, tile Hague, 161-180.
2/, 921-952. Farrell, D. A., E. L. Graecen, and C. G. Gurr, 1966: VapourEdwards, G. C., and G. L. Orgram, 1986: Eddy correlation transfer in soil due to air turbulence. Soil Sci. 102, 305-
measurements of dry deposition fluxes using a tunable 313.
diode laser absorption spectrometer gas monitor. Water Farwell, S. O., and S. J. Gluck, 1980: Glass surface deac-So:.lPollut. 30, 187-194. tivants for sulfur-containing gases. Anal. Chem. 52,
, , and J. Reid, 1984: The investigation 1968--1971.
of dry deposition processes -- Phase 1, development , W. I.. Bamesberger, T. M. Sefiutte,of an instrument package. Canadian Electrical Associ- and I). F. Adams, 1979: Determination of sulfur-ation Research Report no. CEA-187-G-194, Toronto, containing gases by a deactivated cryogenic enrichmentCanada, 75 pp. and capillary gas chromatographic system. Anal. Chem.
Ehhalt, D. H., and J. W. Drummond, 1982: The tropo- 51, 609-615.
spheric cycle of NO,,. In Chemistryofthe Unpolluted and Fehsenfeld, F. C., R. R. Dickerson, G. Htibler, W. T Luke,Polluted Troposphere (H. W. Georgii and W. Jaeschke, L.J. Nunnermacker, E. J. Williams, J. M. Roberts, J.Eds.), D. Reidel, Hingham, Mass.
G. Calvert, C. M. Curran, A. C. Delany, C. S. Eubank,, and V. Schmidt, 1978: Sources and sinks of D.W. Fahey, A. Fried, B. W. Gandrud, A. O. Langford,
atmospheric methane. Pure Appl. Geophys. //6, 452- P.C. Murphy, R. B. Norton, K. E. Pickering, and B. A.464. Ridley, 1987: A ground-based intercompariram of NO,
Environmental Protection Agency, 1986: Development of the NO,, and NO, measurement techniques. I. Geophys.1980NAPAP Emissions hwentory. EPAJr00/7-86-057a, U. Res. 92, 14710-14723.S. Environmental Protection Agency, Research Triangle , D. D. Parrish, and D. W. Fahey, 1988: ThePark, N.C. measurement of NO,, in the nonurban troposphere. In
Ethcridge, D. M., G. 1. Pearman, and F. de Silva, 1988: At- TroposphericOzone (I. S. A. lsaksen, Ed.), NATO ,,_SImospheric trace-gas variations as revealed by air trapped Series C, no. 227, D. Reidel Publishing Co., Dordrecht,in an ice core from Law Dome, Antarctica. Attn. the Netherlands, 185-216.Glaciol. 10, 28-33. Ferek, R. J., and M. O. Andreae, 1984: Pllotochemical
Fahcy,B. W., C. S. Eubank, G. Hubler, and F. C. Fchscnfeld, production of carbonyl sulfide in marine surface waters.1985: Evaluation of a catalytic reduction technique for Nature 307, 148-150.the measurement of total reactive odd-nitrogen, NOr, Form, M., 1979: Method for determination of atmospheric
i in the atmosphere. J. Atmos. Chem. 3, 435--468. ammonia. Atmos. F,m,iron. 13, 1385-1393.
i: Fairall, C. W., 1984: Interpretation of eddy-correlation mea- Filner, P., H. Rennenbcrg, J. Sekiya, R. A. Brc.s,_an,L G.
surcments of particulate deposition and aerosol flux. At- Will,m, L. l_,cCureux, and T. Shimei, 1984. BiosynfllcI rodS. Environ. 18, 1329-1337. sis and cmi.gsion of hydrogen sulfide by higher plants.I . In Gaseous Air Pollutants and l'lant Metabolism (M. J., and S. E. t.arscn, 1986: Inertial dissipation meth-
ods and turbulent fluxes at the air ocean i_ltcrfacc. Keziol and F. R. Whatlcy, Eds.), Butterwortl_, Stone-
Boundary-Layer Meteorol. 34, 287-301. ham, Mass., 291-312.
!, Fall, R., D. L. Albritton, F. C. Fehscnfeld, W. C. Kuster, and France),, R. J., and P. P. Tans, 1987: Latitudinal variation ini P.D. Goldan, 1988: Laboratory studies of,some environ- oxygen-18 of atmospheric CO2. Nature 327, 495--497.i mental variables controlling sulfur emissions from plants. Fraser, P. J., P. Hyson, R. A. Rasmussen, A. J. Crawford,
J. Atmos. Chem. 6, 341-362. and M. A. K. Khalil, 1986a: Methane, carbon monoxide,and metfiylchloroform in tire Southern Hemisphere. J.Farmer, J. C., and G. A. Dawson, 1982: Condensation sam-
pling of soluble atmospheric trace gases. J. Geophys. Atmos. Chem. 4, 3-42.Res. 87, 8931-8942. __._.._, g. A. Rasmuss_'.n,J. W. Crcffield, J. R. French,
Farquhar, G. D., P. M. Firth, R. Wetselaar, and B. Weir, and M. A. K. Khalil, 1986b: Termites and global1980: On the ga._ous exchange of ammonia between mcthane--another a._sc_sment. J. Amtos. Chem. 4,leaves and the environment: Determination of the am- 295-310.
monia compensation point, l'tam l'hysioL 66, 710-714.
................... 1990002793-101
96 CHEMICAL FLUXES
Freney, J. R., M. V. lvanov, and H. Rodhe, 1983: The sulfur Gefirtz, M., W. Lenth, A. T. Young, and H. S. Johnston,cycle. In SCOPE 24: The Major Biogeochemical C)_les 1986: High-frequency-medulation spectroscopy with aand Their hlteractiott_ (B. Bolin and R. B. Cook, Eds.), lead-salt diode laser. Optics Lett. 11, 132-134.J. Wiley & Sons, New York, 56--61. Goldan, P. D., R. Fall, W. C. Kuster, and F. C. Fehsenfeld,
Froelich, P. N., L. W. Kaul, J. T. Byrd, M. O. Andreae, 1988: Uptake of COS by growing vegetation: A majorand K. K. Roe, 1985: Arsenic, barium, germanium, tropospheric sink. J. Geophys. Res. 93, 14186-14192.
tin, dimethylsulfide, and nutrient biogeoehemistry in I___, W. C. Kuster, D. L. Albritton, and F. C. Fehsen-Charotte Harbor, Florida, a phosphorous-enriched es- feld, 1987: The mcasurcmcnt of natural sulfur emissions
tuary. Estuarine, Coastal arid Shelf Sci. 20, 239-264. from soils and vegetation: Three sites in the easternFukuda, H., 1955: Air and vapor movement in soil due to United States revisited. J. Atmos. Chem. 5, 439-467.
wind gustiness. Soil Sci. 79, 249-258. Graedcl, T. E., 1979: Reduced sulfur emission from the
Galbally, I. E., 1985: Emissions of fixed nitrogen compounds open oceans. Geophys. Res. Lett. 6, 329-331.
to the atmosphere in remote areas. In Biogeochemical , D. T. Hawkins, and L. D. Claxton, 1986: Atmo-Cycling of Sulfitr attd Nitrogen in the Remote Atmosphere spheric Chemical Compounds: Sources, Occurrence, and(2. N. Galloway, R. J. Charlson, M. O. Andreae, and H. Bioassay. Academic Press, Orlando, Fla., 732 pp.Radke, Eds), D. Reidel Publishing Company, Dordrccht,the Netherlands, 27-53. Greenbcrg, J. P., P. R. Zimmerman, L. Heidt, and W. Pol-
lock, 1984: Hydrocarbon and carbon monoxide emis-, J. R. Freney, O. T. Denmead, and C. R. Roy, sions from biomass burning in Brazil. J. Geophys. Res.
1980: Processes controlling the nitrogen cycle in the 89, 1350--1354.atmosphere over Australia. In Biogeoche, tistry of An-cient and Modem Environments (P. A. Trudinger, M.R. Greenhut, G. K., 1983: Resistance of a pine forcst to ozoneWalter, and B. J. Ralph, Eds.), Australian Academy of uptake. Boundary-Layer MeteoroL 27, 387-391.
I
Science, Canberra, 319-325. _____, 1986: Transport &" ozone between boundary
, J. A. Garland, and M. J. G. Wilson, 1979: Sul- layer and cloud layer by cumulus clouds. J. Geophys.
phur uptake from the atmosphere by forest and farm- Res. 9L 8613-8622.
land. Nature 280, 49-50. Gregory, G. L., R. C. Harriss, R. W. Talbot, R. A. Ras-
__, and C. R. Roy, 1978: Loss of fixed nitrogen from musscn, M. Garstang, M. O. Andrt:ae, R. R. Hinton, E.soils by nitric oxide exhalation. Nature 275, 734-735. V. Browcll, S. M. Beck, D. I. Scba.':her, M. A. K. Khalil,
R. J. Fcrck, and S. V. Harriss, 1986. Air chemistry over, and ,1980: Destruction of ozone at tile the tropical forest of Guyana. J. C_oohys. Res. 91,
earth's surface. Q. J. R. Meteorol. Soc. 106, 599-620. 8603-8612.
, and o 1981: Ozone and nitrogen oxides _._.__._._____,C. H. ltudgins, and J. A. Rittcr, 1987: In situin the southern hemisphere troposphere. In Proceed- oz,me instrumentation for 10 Hz measurements: Devcl-
ings of the Quadrennial International Ozone Symposium opmcnt and evaluation, l'roceeding. _ of the S&'th Sympo-(J. London, Ed.), National Center fi)r Atmospheric Re- sium on Meteorological Observations and blstmmentation,search, Boulder, Colo. American Meteorological Society, Boston, 136-139.
, , C. M. Elsworth, and H. A. H. Rabich, Grill'iths, P. R., 1983: Fourier transform infrared spt.ctro-1985: The Measurement of Nitrogen Oxide (NO, NO2) metry. Sciet,ce 222, 297-302.Exchange o_er Plant Surfaces. CSIRO AustralianDivision of Atmospheric Research Technical Paper no. Grosjean, D., and K. Fung, 1982: Collection efficicncies of8., 1-23. cartridges and microimpingers for sampling of aldehydes
in air as 2, 4-dinitrophcnylhydrazones. Anal Chem. 54,Galloway, J. N., 1985: The deposition of sulfur anti nitro- 1221-1224.
gen from the remote atmosphere. In The BiochemicalC)_cl#zgof Sulfur and Nitrogen in the Remote Atmosphere t._ahn, V., and P. J. Crutzen, 1982: Philos. Trans. R. Soc.(J. N. Galloway, R. J. Charlson, M. O. Andreae, and London, Scr. B296, 521-541.
H. Rodhe, Eds.), D. Rcidel Publishing Company, Dor- Hannawalt, R. B., 1969: Soil properties affecting the sorp-dreeht, the Nethcrlands, 143-175. tion of atmospheric ammonia. Soil Sci. Soc. Am..I. 33,
, D. M. Whelpdale, and G. T. Wolff, 1984: The 725-729.
flux of S and N eastward from North America. Atmos. Hans, n, M. H., K. Ingvorscn, and B. B. Joergensen, 1978:Environ. 18, 2595-2607. Mechanisms of hydrogen sulfid,; release from coastal
Garland, J. A., and S. A. Penkctt, 1976: Absorption of per. marine sediments to the atmosphere. Limnol. Occqnogr.oxy acetyl nitrate and ozone by natural surfaces. Atmos. 23, 68-76.Environ. 10, 1127-1131.
1990002793-102
REFE _.ENCES 97
Harper, L. A., V. R. Catchpoole, R. Davis, and K. L. Weir, , , S. E. Lindbcrg, and S. )C. Brombcrg,1983: Ammonia volatilization: Soil, plant and microcli- 1986b: Proceedings of tire NAI'AI" Workshop on Dry De-mate effects on diurnal and seasonal fluctuations. Agron. position. Available from NOAAIATDD, P.O. Box 2456,J. 75, 212-218. Oak Ridge, Tenn. 37831, 77 pp.
Harriss, R. C., E. Gorham, D. I. Scbacher, D. B. Bartlett, Hogg, D. C., M. T. Decker, F. O. Guiraud, K. B. Earnshaw,and P. A. Flcbbe, 1985: Methane flux from northern D.A. Merritt, K. P. Moran, W. B. Swcczy, R. G. Strauch,peatlands. Nature 315, 652-654. E.R. Westwatcr, and C. G. Little, 1983: An automatic
__, and D. 1. Scbacher, 1981: Methane flux in profiler of the temperature, wind, and humidity in theforested freshwater swamps of the southeastcrr. United troposphere. J. Appl. Meteor. 22, 897-831.States. Geophys. Res. Left. 8, 1002-1004. HolzapfcI-Pschorn, A., and W. Seller, 1986: Methane cmis-
, and F. P. Day, Jr., 1982: Methane sion during a cultivation period from an Italian riceflux in the Great Dismal Swamp. Nature 297, 673-674. paddy. J. Geophys. Res. 91, 11803-11814.
Hartkamp, H., and P. Bachhauscn, 1987: A method fortile determination of hydrogen peroxide in air. Aonos. Hudgcns, J. W., 1987: Progress in resonance enhancedEnviron. 21, 2207-2213. multi.photon ionization spectroscopy of transient free
radicals. In Advances in Multi-photon Processes and Spcc-Hatficld, J. L., 1989: Methods for estimating evapotranspi- troscopy (S. H. Lin, Ed.), World Scientific, Singapore.
ration. In The Irrigation of Arable Lands, Am. Soc. ofAgronomy, Madison, Wis., in press. Hucbert, B. J., and A. L. Lazrvs, 1980: Tropospheric gas
pha_ and particulate nitrate measurements. J. Geophys.Heikes, B. G., A. L. Lazrus, G. L. Kok, S. M. Kunen, B. W. Res. 35, 7322-7328.
Gandrud, S. N. '3itlin, and P. D. Sperry, 1982: Evidencefor aqueous phase hydrogen peroxide synthesis in the , W. T. Luke, A. C. Dclany, and R. A. Brost, 1988:troposphere. J. Geophys. Res. 87, 3045-3051. Measurements of concentrations and dry surface fluxes
of atmospheric nitrates in the presence of ammonia. J. m, G. L. Kok, J. G. Walcga, and A. L. Lazrus, Geophys. Res. 93, 7127-7136.
1987: H202, O3, and SO2 measurements in the lowertroposphere over the eastern United States during fall. ., and C. H. Robdrt, 1985: The dry deposition ofJ. Geoph),s. Res. 92, 915-931. nitric acid to grass. J. Geophys. Res. 90, 2085-2090.
Hellman, G., 1915: Untcr dcr bcwcgung dcr luft in der Hutchinson, G. L., R. J. Millington, and D. B. Peters, 1972:untcrstcn scitichtcn der atmosphere. Meteorol. Z. 32, Atmospheric ammonia: Absorption by plant leaves. Sei-1-16. ence 175, 771-772.
Herriott, D. R., and H. J. Schulte, 1965: Folded optical ., A. R. Mosier, and C. E. Andre, 1982: Ammoniadelay lines. Appl. Optics 4, 883-889. and amine emi_ions from a large cattle fcedlot. J.
Era'iron. QuaL 11, 288-293.Hicks, B. B., 1986: Measuring d_ deposition: A rcasscss-
mcnt of the state of the art. Water,Air attd Soil Pollution Hwang, H., and P. K. Dasgupta, 1986: Fluormctrlc flow in-30, 75-90. jection determination of aqueous peroxides at nanomo-
lar level using membrane reactors. A_raL Chem. 58,, R. P. Hosker, and J. D. Womack, 1987: Com- 1521-1524.
parisons of wet and dry deposition derived from the tirstyear of trial dry deposition monitoring. In 7)'reChemistry In,worsen, K., and B. B. Jocrgcnscn, 1982: Seasonal v_t__-of Acid Rabt, Sources attd Atmospheric l'rocesses (R. W. lion in H2S emission to the atmosphere from intertidalJohnson and G. E. Gordon, Eds.), Amer. Chem. Soc., sediments in Denmark. Atmos Environ. 10, 855-865.Symposium Series 349, 196-203. Ivcrson, R. L., F. L. Ncarhoof, and M. O. Andrc_e,
__......__..._D. R. Matt, R. T. McMillcn, J. D. Womack, M. 1989: Production of dimethylsulfonium propionate andL. Wetly, R. L. Hart, D. R. Cook, S. E. Lindbcrg, dimcthysulfide by pbytop)ankton in cstuarine and coastalR. G. de Pe?Ia, and D. W. Thomson, 1989: A fit,ld waters. L#nnol. Oceanogr. 34, in press.investigation of sulfate fluxes to a deciduous forest. J. Jacob, D. J., and S. C. Wofsy, 1988: Photochemistry ofGeophys. Res., in press, biogenic emissions over the Amazon forest. J. Geophys.
, and R. T. McMillcn, 1984: A simulation of Res. 93, 1477-1486.the eddy accumulation method for measuring pollutant Jacob, P., T. M. Tavarcs, and D. Klockow, 1986: Mcthodol-fluxes../, of Clim. and AppL Meteor. 23, 637-643. ogy h)r the determination of gaseous l)ydrogcn peroxide
, M. L. Wescly, R. L. Coulter, R. L. Hart, J.L. in ambient air. FreseniousZ. Anal. Chem. 325, 359-364.Durham, R. Spccr, and D. H. Stcdman, 1986a: An Jacschke, W., H. Claude, and J. Hcrrmann, 1980: Sourcesexperimental study of sulfur and NO, fluxes over grass- and sinks of atmospheric H2S. J. Geophys. Res. 85,land. Boundary Layer Meteorol. 3g, 103-121. 5639-5644.
I
-- ' ,,t ml
1990002793-103
98 CHZMICAL FLUXES
_____.._, and J. Herrmann, 1981: Measurc:ncnt of H2S posphere: An ovcrvicw of current understanding. Tellusin the atmosphere, htt. J. F+nviron. Anal. Chem. 10, 4OH, 322-324.
107-120. ____, R. W. Talbot, M. O. Andrcae, K. Bccchcr, 11.Johansson, C., 1984: Field measurements of emissions of Berrcshcim, M. Castro, J. C. Farmcr, J. N. Galloway, M.
nitric oxide from fertilized and unfertilizcd forest soils R. Hotrman, S. Li, J. R. Maben, J. W. Mungcr, R. B.in Sweden. J. Atmos. Chem. 1, 429-442. Norton, A. Pszcnny, H. Puxbaum, H. Westbcrg, and W.
______.., and I. E. Galbally, 1984: Production of nitric Winiwarter, 1989: An intcrcomparison of measurementoxide in loam under aerobic and anaerobic conditions, systems h_r vapor and particulate phasc concentrationsAppl. and Environ. Microbiol. 47, 1284--1289. of formic and acetic acids. J. Geophys. Res., 94, 6457-
6471..__.____, and I... Granat, 1984: Emission of nitric oxide
from arable land. Tellus 36b, 25-37. Keller, M., T. J. Goreau, S. C. Wofsy, W. A. Kaplan, andM. B. McElroy, 1983: Production of nitrous oxide and
Johnson, J. E., and J. E. l_x)velock, 1988: Electron capture consumption of mc hanc by forest soils. Geophys. Res.sulfur detector: Reduced sulfur species detection of the Lett. 10, 1156-1159.femtomole level. Anal. Chem., in press.
__, W. A. Kaplan, and S. C. Wofsy, 1986: EmissionsJohnson, N. K., 1929: A Stud), of the Vertical Gradient of of N20 , CH4, and CO 2 from tropical forest soils. J.
Temperature bz the Atmosphere near the Ground. Gco- Geophys. Res. 91, 11791-118(12.physical Memoirs, British Meteorological Officc, no. 46.
Johnson, P. M., and C. E. Otis, 1981: Molecular multiphoton Kelly, T. J., P. H. Daum, and S. E. Schwartz, 1985: Mcasurc-mcnts of peroxide in cloud water and rain. J. Geophys.
spectroscopy with ionizatkm dctcction. Ann. Rev. Phys. Res. 90, 7861-7871.Chem. 32, 132-157.
__, J. S. Gaffncy, M. F. Phillips, and R. L. Tan- _'Judeikis, H. S., and A. G. Wren, 1978: Laboratory measure- nor, 1983: Chcmilumincsccnt detection of reduced sul- i
ments of NO and NO 2 deposition onto soil and cement fur compounds with ozone. Anal. Chem. 55, 135-138.surfaces. Atmos. Environ. 12, 2315-2319.
Khalil, M. A. K., and R. A. Rasmussen, 1983: Sources,Jury, W. A., J. Letcy, and T. Collins, 1982: Analysis of chain- sinks, and seasonal cycles of atmospheric mcthanc. J.
bcr methods for measuring nitrous oxide production in Geophys. Res. 88, 5131-5144.the field. Soil Sci. Soc. Am. J. 46, 250-256.
Kim, K. H., and M. O. Andrcac, 1987: Carbon disullideKagcl, R. A., and S. O. Farwcll, 1986: Evaluation of metal- in seawater and the marine atmosphere over tl_e North
lic foils for prcconccntration of sulfur-containing gases Atlantic. J. Geophys. Res. 92, 14733-14738.with subsequent flash desorption/llame photomctric de-tection. Anal Chem. 58, 1197-12(12. Kimball, B. A., 1978: Critique of "Application of gaseous
diffusion theory to measurement of .Jcnitrilication." In
Kamens, R. M., M. W. Gcry, H. E. Jelrrics, M. Jackson, and Nitrogen in _he I')ivironment, Vol. 1: Nitrogen BehaviorE. I. Cole, 1982: Ozone-isoprene reactions: Product hi FieM Soil (D.R. Nielsen and J.G. MacDonald, Eds.),formation and aerosol potential, btt. J. Chem. Kinetics Academic Press, New York, 351--.t61.14, 955-975.
__., and E. R. Lemon, 1971: Air turbulence effectsKancmasu, E. T., M. L. Wcscly, B. B. Hicks, and J. L. upon soil gas exchange. Soil Sci. Soc. Am. J. 35, 16-21.
Hcilman, 1979: Techniques for calculating energy andmas,s fluxes. In Modification of the Aerial Environment of Kley, D., and M. McFarland, 1980: Chemiluminescel_ce de-
+ l'lants (B. J. Barfi¢ld and J.F. Gerber, Eds.), American tector for NO and NO 2. Attacks. I'echnol. 12, 63-69.
Society of Agricultural ,ginccrs, St. Joseph, Mich., Kluczcwski, S. M., J. N. B. Bell, K. A. Brown, al_d M.
156-182. J. Minski, 1983: The uptake of [35S]-carbonyl sulphideKaplan, W. A., S. C. Wofsy, M. Keller, and J. M. Da Costa, by plants and soils in ecological aspects of radionuclide
1988: Emission of NO and deposition of O 3 in a tropical reload. Spec. l'ubl. Br. Ecol. Soc. HI, 91-104.
forest system../. Geophys. Res. 93, 1389-1395. __, K. A. Brown, and J. N. B. Bell, 1985: Deposition
Kawa, S. R., 1988: The chemistry and dynamics of me- of [35S]-carbonyl sulphide to vegetable crops. Radiat.rine stratocumulus. PhD. dis.scrtation, Colorado State Prot. l)oshn. H, 173-177.
University, Fort Collins, 151)pp. Knoerr, K. R., and F. L. Mowry, 1981: Encrgy bal-Keeler, R. J., R. J. Scralin, R. L. Schwicsow, and D.H. ancc/Bowcn ratio tccl, niquc h_r estimating hydrocarbon
Lcnschow, 1986: An airborne laser air motion sensing lluxes. In Atmo.7#wric Biogenic llydtvcarbons, Vol. 1:system. Part I: Concept and preliminary cxperimcnt. J. Emissions (J. J. Bufalini and R. R. Arnts, Eds.), AnnAtmos. Oceanic Technol. 4, 113-127. Arbor Science, Ann Arbor, Mich., 35-52.
Keenc, W. C., and J. N. Galloway, 1988: The biogcochcm-ical cycling of formic and acetic acids through the fro-
1990002793-104
REFERENCES 99
Kolb, C. E., J. Wormhoudt, A. Freedman, M. S. Zahniscr, Lenhard, U., and G. Gravcnhorst, 1980: Evaluation of am-D. R. Worsnop, P. Kcbabian, and S. Anderson, 1986: monia fluxes into the free atmosphere over western Ger-Laser monitors for trace species in environmental and many. Tellus 32, 48.-55.
industrial procexses. SI'IE Proceedings 709, 60-72. Lenschow, D. H., 1984: Instrumentation development needsKristensen, L., and N. O. Jensen, 1979: Lateral coherence in for use of mass-balance technique. In Global Tropo-
i_tropic turbulence and in the natural wind. Boundary- spheric Chemistry: A Plan fur Action. National AcademyLa)er MeteoroL 17, 353-373. Press, Washington, D.C., 141-143.
, and D. H. Lcnschow, 1988: The effect of non- ______., 1986: Aircraft measurements in the boundarylinear dynamic response on measured means. J. Atmos. layer. In l'robing the Atmospheric Boundary La)_r (D.Oceanic Teclmol. 5, 34--43. H. Lenschow, Ed.), Amcrican Mctcort31ogical Society,
Kunde, V. G., J. C. Brasunas, B. J. Conrath, R. A. Hancl, Boston, 39-55.J. R. Herman, D. E. Jennings, W. C. Maguire, D.W. _ and A. C. Dclany, 1987: An analytic formulationWai._r, J. N. Annen, M. J. Silvcrstcin, M. M. Abbas, L. h)r NO and NO 2 flux proliles in the atmospheric surfaceW. Hcrath, H. L. Buijs, J. N. Bcrube, and J. McKinnin, layer. J. Atmos. Chemistly 5, 301-309.1987: Infrared spectroscopy of the lower stratosphere
with a balloon-borne cryogenic Fouricr spectrometer. , and L. Kristcn_n, 1985: Uncorrelatcd noise inAppl. Optics 32, 545-553. turbulence measurements. J. Atmos. Oceanic Technol.
Kuntz, R., W. Lonncman, G. Namic, and L. A. Hull, 1980: 2, 68-81.Rapid determinination of aldehydes in air analysis. An-
, and , 1988: Applications of dual air-
alyt. Len. 13, 14(19-1415. craft formation flights. J. Atmos. Oceanic Technot. 5,Lamb, B., A. Gucnthcr, D. Gay, and H. Wcstbcrg, 19874: 715-726.
A national inventory of biogcnic hydrocarbon cmi_k)ns. • R. Pearson, Jr., and B. B. Stankov, 1981: Esti-
Atmos. Environ. 21, 1695-1705. mating the ozone budget in the boundary laycr by use, H. Wcstberg, and G. Allwine, 1986: Isoprene of aircraft measurements of ozone eddy flux and mean
emission fluxes determined by an atmospheric tracer concentration. J. Geophys. Res. 86, 7291-7297.
technique. Atmos. Era'iron. 20, 1--8. , , and ,1982: Mcasurcments, L. Bamesbcrgct, and A. of ozone vertical flux to ocean and forest. J. Geophys.
Guenther, 1987b: Measurement of biogcnic sulfur trois- Res. 87, 8833--8837.
sions from .soils and vegetation. J. Atmos. Ozem. 5, , and B. B. Stankov, 1986: Length scales in the469-491. convective boundary layer. J. Atmos. Sci. 43, !198-1209.
(
...... , , and T. Ouarlcs, 1985: Bio- Lcrncr, J., E. Matthcws, and I. Fung, 1988: Methane emis-genie hydrocarbon emissions from deciduous and conif- sion from animals: A global high-rcsolutkm data ba.m.crous trccs in the United States. J. Geoph),s. Res. 90, GIob. Biogeochem. Cycles 2, 139-156.238(t-23_1.
Lcuning, R., O. T. Dcnmead, J. R. Simpson, and J. R.Langford, A. O., P. D. Goldan, and F. C. Fehsenfcld, 1989: Frency, 1984: Proccsses of ammonia loss from shaqow
A metal oxide annular denuder system for gas phase am- floodwater. Atmos. l_.'nvhvn. 18, 1583-1592.blent ammonia measurements. Unpublished manuscript.
___ J. R. Frcncy, O. T. Dcnmcad, and J. R. Simpst)n,Lazrus, A. L., G. L. Kok, J. A. Lind, S. N. Gitlin, B. G.
1985: A s_tmpler for measuring atmospheric ammoniallcikcs, and R. E. Shctter, 1986: Automated Iluoromet- flux. Atmos. Fnviron. 19. 1117-1124.ric method for hydrogen peroxide in air. Anal. Chem.58, 594-597. _ , E. Ohtaki, O. T. Dcnmead, at_d A. R. G. Lang,
1982: Effects of heat and water vapor transport on eddyl.,cc, Y.-N., and S. E. Schwartz, 1981: Evaluation of the
ctwariance measurements of CO 2 fluxes. Boumlar),-rate of uptake of nitrogen dioxidc by atmospheric and l.mvr Meteorol. 23, 209-222.surface liquid water. J. Geophys. lies. 86, 11971-11983.
Lemon, E., 1978: Critique of "Soil and other s3urces of Lilly, D. K., 19fhq: Models of cloud-topped mixed layersunder a strong inversion. Quart. J. Roy. Meteorol. Soc.
nitrous oxide: Nitrous oxide (N20) exchange at the 94, 292-309.land surface." In Nitrogen in the Em,irom,cnt, Vol. 1:Nitrogen Behavior in Field Soil (D. R. Nielsen and J.G. Liss, P. S., 1983: Gas transfer: Experiments and geochem-MacDonald, Eds.), Academic Press, New York, 493-521. ical implications. In Air--Sea Exchange of (;ascs and
l'atIicles (P. S. Lis,s and W. G. N. Slinn, Eds.), D. Rci-LcMone, M. A., and W. T. Penncll, 198(): A comparison ,,ff
del Publishing Company, Dordrccht, the Netherlands,turbulence measurements from aircraft. J. AppL Mete- 241-298.oroL 19, 142(I--1437.
iJ
1990002793-105
I00 CHEMICAL FLUXES
Liu, S. C., 1988: Model studies of background ozone for- Mopper, K., and R. G. Zika, 1987: Free amino acids inmation. In l_pospheric Ozone (1. S. A. Isakmn, Ed.), marine rains: Evidence h_r oxidation and potential roleNATO ASl Series C, No. 227, D. Rcidel Publishing in nitrogen cycling. Nature 323, 246-249.
Company, Dordrecht, the Netherlands, 303-318. Mosicr, A. R., and G. L. Hutchinson, 19_5: Nitrous oxide
Lloyd, A. C., R. Atkinson, F. W. Lurmann, and B. Nitta, emissions from cropped ll¢.lds. J ",,,irol_. Qttal. 10,1983: Modeling potential ozone impacts from natu- 169-173.
ral hydrocarbons, Part I: Development and testing of Natuscb, F. D., H. B. Konis, H.D. .i: , '_. J ;':k, and J.a chemical mechanism for the NO,-air photooxidations P. Lodge, Jr., 1972: Sensitive _ . ,_,_ m-: ,;,arcmcntof isoprene and a-pincne under ambient conditions. At- of atmospheric hydrogen sul, '.: -¢,",._ . zero. 44,mos. Environ. 17, 1931-195(I. 2067-2117(I.
l_x)gan, J. A., 1983: Nitrogen oxides in the Iroposphcre: Nelson, J. K., R. H. Getty, and J. W. Birk._, 1983: FluorineGlobal and regional budgets. J. Geopttys. Res. 88, induced chemiluminescence dctcct¢)r h)r reduced sulfur
10785-10807. compounds. An.;,. Chem. 55, 1767-1770.
, M. J. Prather, S. C. Wofsy, and M B. McEIroy, Nguycn, B. C., C. l_crgcrct, and G. Lambcrt, 1984: Ex-1981: Tropospheric chemistry: A global perspective. J. change rates of dimcthylsullide between ocean alJd at-Geopl!ys. Res. 86, 7210-7254. mospherc. In Gas Transfer at Water St#faces (W. Brut-
Lovclock, J. E., 1974: CS,_ and the natural sulphur cycle, sacrt and G. H. Jirka, Eds.), D. Rcidel Publishing Corn-Nature 248, 625-626. pany, Dordrccht, the Netherlands, 539-545.
, R. J. Maggs, and R. A. Rasmussen, 1972: Atmo- Nicholls, S., and C. J. Readings, 1979: Aircraft obscrvations
spheric dimcthyl sulphide and the natural sulphur cycle, of the structure of the lower boundary layer over theNature 237, 452-453. sea. Quart. J. Roy Meteorol. Soc. 107, 591-614.
Lowe, D. C., C. A. M. Brenninkmcijcr, M. R. ManniLg, R. W. Shaw, and T. Hauf, 1983: An intercompar- '_Sparks, and G. Wallace, 1988: Radiocarbo_i dctcrmi- ison of aircraft turbulence mcasurcmcnts made duringnation of atmospheric mcthanc at Baring Head, New JASIN. J. Clim. Appl. Meteorol. 22, 1637-1648.
Zealand. Nature 332, 522-525. Norton, R. B., 1986: The measurement of tropospheric
MacKay, G. 1., and H. 1. Schilt', 1984: I.'ield Measure- gas phase acids with sodium carbonate dcnuder tubes.ments with the TAMS-2B and l)evelolmzent of Methods (Abstract only.) EOS 67, 888.
fi)r Measuring l:onnaldehyde, Ammonia, attd Nitrotts Acid Nriagu, J. O., D. A. Holdway, and R. D. Cokcr, 1987: Bio-b_ RealAir. Report No. CRC-APRAC-CAPA-19-80-04, genie sulfur :rod the acidity of rainfall in remote areasUni._arch Axsoc. Inc., Concord, Ont., Canada. of Canada. Science 237, 1189-1192.
Malo, B. A., and E. R. Purvis, 1964: Soil absorption of Ockchnann, G., and It. W. Gcorgii, 1984: The distribu-atmospheric ammcmia. Soil Sci. 9,', 242-247. tion of sulfur di¢)xidc over the Nolwegian At_'_ic Ocean
Martens, C. S., N. E. Blair, C. D. Green, and D. J. Des during summer, l"ellus 36B, 179-185.
Marais, 1986: Seasonal variations in the slable carbon Parrish, D. D., E..1. Williams, D. W. F_dlcy, S. C. Liu,i isotopic signature of biogcnic methane in a coastal scd-t and F. C. Fchscnfcld, 1987: Measurement _f nitrogen
iment. Science 233, 13(}0-13(13. oxide lluxcs from soils: lntcrcomparison of enclosure
Matthews, E., and I. Fung, 1_8,._" Methane emission from and gradient measurement techniques. J. (;eopl_v._.. l_es.natural wetlands: Global distribution, area, and cnvi- 92, 2165-2171.
ronmcntal characteristics of sources. Glob. Biogeochem. Pcarmai_, G. I., D. Ethcridgc, F. dc Silva, and P. J. Frztser,C)'cles 1, 61-86. 1986: Evidence of changing concentrations of CO 2,
Matthias, A. D., A. M. Blackmer, and J. M. Brcmncr, 198(1: N20 , and CIIj, from air bubbles in Antarctic ice. NatureA simple chamber technique h)r field mcasurcmcnt of .t20, 248-25{I.
emis.@ ns of nitrous oxide from _)ils. J. ['Jtwiron. Qttal. Pca_on, R., Jr., and D. H. Stcdman, 1980: Instrumentation9, 251-256. h_r fast response ozone measurements from aircraft. At-
MeManus, J. B., P. L. Kebabian, and C. E. Kolb, 1989: mos. Tech. 12, 55-65.
Atmospheric methane measurement instrument us- Penkctt, S. A., and K. A. Brice, 1986: The spring maximum
ing a magnetically tuned HoNe laser. Unpublished in photo-oxidants in the Northern Hemisphere tropo-manuscript, sphere. Nature 319, 655.
Mcixner, F., and W. Ja_schke, 1984: Chcmilumincsccn- Platt, U., and D. Pcrncr, 198(1: Direct measurement of
zvcrfahrcn zum Nacl_eis wm Schwefeldioxid im ppt- atmospllcric CH20, HNO 2, O 3, NO 2, and SO 2 by dif-Bcreich. Fresenius Z. Anal. Chem. 317, 343-344. fcrential optical al_rplion in the near UV. J. Geophys.
Mr:_llcr, D., 1984: Estimation of the global man-made sul- Res. 85, 7453-7458.phur emission. Atmos. Envirotl. 18, 19 27.
k m ...... -_
]990002793-]06
_EFERENCES JO|
________, A. M. Wincr, H. W. Bicsmoun, R. Atkinson, and Ridlcy, B. A., M. A. Carroll, and G. L. Gregory, 1987:| J.N. Pitts, Jr.. 1984: Measurcmcnt (_f nitrate radical Measurements of nitric oxide in the boul_da_y layel and
concentrations in continental air. l'twiron. Sci. and free troposphere over the Pacific Ocean. J. Geophys.Technol. 18, 365-360. Res. 92, 2025-2047.
Pricstley, C. H. B., 1959: litrbttlettt "l'ran_port bz the Lo_,er Rinsland, C. P., J. S. Levine, and T. Miles, 1985: Conccntra-
I Atmosphere. University of Chicago Press, 13(I pp. tion of methane in the troposphere deduced from 1951
Prinn, R., D. Cunnold, R. Rasmus,,;cn, P. Simm()nds, F. infrared solar spectra. Nalttre 318, 245-249.Alyea, A. Crawfc_rd, P. Fraser, anu R. Roan, 1987: Ritter, J., 19__4:The determination (ff cl(_ud-base ma_s fluxAtmospheric trend:; in mcthylchloroform and the global and the vertical redistribution of a conservative tracer,a_rage for the hydroxyl radical. Science 238, 945-950. meteorology of acid depositions. In 7fie MeteorologT of
Prolfitt, M. H., 1985: Ozone measurement from a b:il- Acid Deposition (P. Samson, Ed.), Air Pollution Control
l loon payload using a new fast response UV absorption Association, Pittsburgh, Penn., 177-188.photumeter. AOnospheHc Ozone, Proceedings of Ouad. Roberts, J. M., F. C. Fehscnfeld, D. L. Albritton, and R.
Ozone Symposium, Halkibiki, Greece, 3-7 September E. Sicvcrs, 1983: Sampling and analysis of monoter-1984, 470-474. pone hydrocarbons in the atmosphere with Tcnax GC,
_ , and R. J. McLaughlin, 1983: Fast rcsponsc dual In Identification and Analysis of Organic Pollants in Airbcam UV absorption ozone pholon_eter suitable for u_ (L. H. Keith, Ed.), Ann Arbor Science, Ann Arbor,in stratospheric balloons. Sciemi]ic b_strumel_ts 54, 1719- Mich. 371-387.1728. Rodgcrs, M. O., J. D. Bradshaw, S. T. Sand-
Rasmussen, R. A., 1981. A review of the natural hydrocar- holm, R. E. Stickel, and D. D. Davis, 1986:bon issue. In AOno.spheric Biogenic llydrocarbons, Vol. Photofragmcntation/lascr-induced fluorescence dctcc-1: Emissions (J. J. Bufalini and R. R. Arnts, Eds.), Anl, tion of other species of atmosphcric interest. In NA,_,IArbor Science. Ann Arbor, Mich., 3-14. Tl_posphenc Chemistry Program Review, Willi,msburg,
Va., and M. A. K. Khalil, 1984: Atmospheric methane
in the recent and ancient attar)spheres: Concentrations, __, and D. D. Davis, 1988: A UV photofragmcn-: trends, and interhemispheric gradient. J. Geophys. Res. ration la._r induced fluorescence sensor for the _tmo-
89, 11599-116(15. spheric delccti{m (_f HONO. l'hwiron. Sci. and Tech,ol.,in prc_s.
__, and , 198c_: Atmospheric trace gases:Trends and ¢Jistributions over the last decade. Science Rudolph, J., D. 11. Ehhalt, A. Khcdim, and C. Jcl3scn,
232, 1623-1624. lq81: Dctcrmioation of C2--C5 hydrocarbons in the at-mt_sphcrc at low parts per 1()9 to high parts per 1012
____., and , 1988: Isoprene over the Amazon levels. J. C7,'omat. 217, 301-310.Basin. J. Geophys. Res. 0.t, 1417-1421.
Sacll._, G. W., R. C. ttarris.s, J. Fishman, G. F. llill, and D., , and S. D. Hoyt, 1982: The _)ccanic R. Caho(m, 1988: Carbon monoxide over the Amazon
_)urce of carbonyl sulfide (OCS). Atmos. l'im'inm. 16, Basin during the 1985 dry season. 1. (;eophy_. Res 93,1591-1594. 1422-143(I.
Ray, J. D., D. H. Stedman, and G. J. Wcndel, 1986: Fast., G. F. Hill, S. M. Beck, and J. A R.',tct, 1()._''_-
chemilumine_ent method fi)r measurement ()f ambient Development of a fast respon_ sensor for carbonozone. Anal Chem. 58, 598-6(10. monoxide llttx measurement. In Prcprint v(:!ume, Sirth
Raynaud, D., J. Chappellaz, J. M. Barnt)la, Y. S. Korotke- ._)'ml)O._htmon Meteomk_gical Obsen'athm attd btstntmcn-rich, and C. Lorius, 1988: Climatic and Ctt a cycle impli- ration, 12-16 Jan. 1987, New Orleans, La. Americancations of glacial-intcrglacial Ci-I.I change in the Vostok l_leteorological Society, Boston, 132-135.
ice core. Nature 3.L_', 655-657. _____ L. O. Wade, and M. G. Perry, 1987a:
Reid, W. S., R. L. Desjardins, W. Fagan, and A. Ginsburg, Fast-response, high-precision carbon monoxide _nsor1984: An open-loop fast response gas sampling valve using a tunable diode laser absorption technique. J.with current control. J. of I'hysh:s i'. Sc&nti[ic bt._tnt- (;eol_h),s. Res. 92, 2071-2081.
ment._ 17, 323-327. Salop, J., N. T. Wakclyn, G. F. Lccy, E. M. Middlcton, and J.Revsbech, N. P., B. B. Joerget_scn, |-!. T. Blackburn, and Y. C. Gervin, 1983: The application of forest cla_ilicatitm
Cohen, 1983: Mieroeleetrode studies of the photosyn- from Landsat data as a basis h)r e_atural hydrocarb(mthesis and 02, 1t2S, and pH prt)liles of a microbial mat. emission estima;ion and photochemical oxidant modelLinmol. Oceanogr. 28, 1062-1074. sirnulations in southeastern Virginia. J. Air l'olhtl. C(m-
tml As,_oc. 33, 17.
1990002793-107
102 CIIEMICAL FLUXES
Schillr, H. I., D. R. H_tie, O. 1. Mackay, T. iguchi, and B.A. Shannon, J. D., 1981: A model of regional long-term avcr-Ridley, 1983: Tunable diode laser systems for measuring age sulfur atmt_spheric pollution, surface removal, at_dtrace gases in tropospheric air. l-nvir. Sci. and Technol. net horizontal flux. Atmos. l'nviron. 15, 689-701.
17, 352a-364a. Shcppard, J. C., H. Westbcrg, J. F. Hopper, and K. Gancsan,Schlag, E. W., and H. J. Neusscr, 1983: Multiphoton maxs 1982: Inventory ¢,f global methane _)urces and their
spectroscopy. Acc. Chem. Res. 16, 355-360. production rates, k Geophy_. Re_. 87, 1305-1312.
Schmitt, K. F., C. A. Friche, and C. H. Gibson, 1979: Strut- Singh, H. B., L. J. Salas, B. K. Cantrcll, and R. M. Red-ture of marine surface laycr turbulence. J. Atmos. Sci. mond, 1')85 Distribution of aromatic hydrocarbons in36, 602-618. the ambient air. Atom_. Envion. II, 1911-1919.
Sclr,varz, F. P., H. Okabe, and J. K. Whittaker, 1974: Flu- Sh:mr, F., G. W. Harris, D. R. llastie, G. I. Mackay, andorcscence detection of sulfur dioxide in air at the parts H.I. Schill', 1986: Mcasurcm:_nt of gas phase hydro-per billion level. Anal. Chem. 46, 1024-1028. gen peroxide in air by tunable diode laser absorption
Scrase, F. J., 1930: Some characteristics of eddy mt;tion in specm_scopy. J. Geophys. Res. 91, 5371-5378.the atmospilcre. Geophysical Memoirs No. 52, British , and W. Seller, 1984: Field mcasurcmcnLs of NOMeteorological Office. and NO 2 emissions from fertilized and unfertilized soils.
Sebacher, D. i., 1978: Airborne nondisp:rsive infrared mon- J. Aonos. Chem. 2, 1-24.itor for atmospheric trace gases. Rev. ScL htstnan. 49, Smith, S. D., and E. P. Jones, 1985: Evidcnce f_,- wind-1520-1525. pumping of air-sea gas exchange based on dircct mca-
surcmcnts of CO2 lluxcs. J. Geophys. Res. 90, 869-875., and R. C. HarrKs, 1982: A system h)r mea-
suring methane fluxes from inland and coastal wetland ..... and . 1986: Isotopic and micrometco-environments. J. Environ. Qual. 11, 34--37. rological ocean co 2 fluxes: Different iimc and space _u.,
...... and K. B. Barllett, 1983. Methane scales. J. Geophys. Rcs. 91, 10529-10532.
flux across the air-water interface: Air velocity elrccts. Snidcr, J. R., and G. A. Daw::_m, 1985: Tropospheric lightTellus 35B, 103-109. alcohols, carbonyls, and acctonitrile: Concentrations in
. , , , S. M. Sebachcr, and S. the _mthwestern United States and Henry's law data. J.S. Grice, 1986: Atmospheric mcthane sources: Alaskan Geophys. Re._. _), 3797-3E05.
tundra bogs, an alpine fen, and a subarctic boreal marsh. SSderlund, R., and B. B. Svcnsson, 1976: The gk)bal ni-Tdlus 3811, 1-10. trogcn cycle. In Ni/rogetl, Phowhorous, and S_ffphur --
Seller, W., 1984: Contribution of biological proccs,ses to the Gh)bal C)'ch's (B. 1 i. Svcn.s:_on and R. 30dcrlund, Eds.),global budget of CH 4 in the atmosphere. In Cutrt'nt SCOPE Report 7, Stockholm, 22, 23-73.Perspectives in Microbal Ecololo_ (M. J. Klug and C.A. Specr, R. E. K. A. Pcterson, T. G. Ellestad, and J. L.Reddy, Eds.), American Society for Microbiok)gy, Wash- Durham, 10S5: Test tff a prott)type eddy accumulatorington, D.C., 468-477. h_r measuring atmospheric vertical fluxes of water vapor
, and R. Conrad, 1987: Contribution of tn_pical and particulate sulfate. ,1..Gcophys. Rcs 90, 2119-2122.ecosystems to the global budgcLs of trace gases, espe- Spurlin, S. R., and E. S. Yeung, 1982: On-line chemilumi-tinily CH4, H2, CO, and N20. In The G,,ophysioh_hy of ncscence detector for hydrogen sullide and mcth),lnwr-
i Anuzzonia (R. E. Dicken_m, Ed.), John Wiley and Sons, captan. Anal. Chem. 54, 318-32(I.i New York, 133-162. Staulfcr, B., G. Fischer, A. Ncftcl, :,,"2 '.'_.Oeschgc-. 1985:, , and D. Scharll'e, 1984: Field studies Increase of atmospheric n.:'t_',tlle recorded in Antarctic
of methane emisskm from termite nests into the atmo- ice core. Science 2_), 138t_1388.
sphere and measurementl of methane uptake by tropical __., E. Lochbronner, 1I. Ocschgcr, and J. Schwander.soils, /. Aanos. Cltem. 1, 171-186. 1988: Methane concentration in the glacial atnlospherc
, and P. J. Crutzen, 1980: Estimates of gro_s and was only half that of the prei_:.iustrial Holoeene. Naturenet fluxes of carbon between the biosphere add the 332, 812.--814.
atmosphere from biomass burning. Climatic Change 2, Stedman, D. H., and J. D. SheLter, 1983: The gk)bal budget207-247. of atmt)sl)herie ,li:rogcn species. In 7"race Atmospheric
, A. HolzapfeI-Pschorn, R. Conrad, and D. Constituems (S.E. Scl_vartz, Ed.), John Wiley & Sons,SchaHfe, 1984: ,/. Atmos. LTtem. 1, 241-268. New York, 411-454.
Sexton, K., and H. Wcstbcrg, 1979: Ambient air measure- Steele, L P., P. J. Fra._r, R. A. Rasmussen, M. A. K. Klmlil,ments of lx:troleum refinery emissions. ,l. Air Ibllut. T.J. Conway, A. J. Crawford, R. H. Gammon, K. A.C_ltrol Assoc. 29, 1149-I 152. Masarie, and K. W. Thor:ing, 19'37: Tile global distribu-
tion of methane in the, troposphere. J. Atmos. Chem.5, 125-171.
....................... 1990002793-108
/
REFSRENCES 103
) 4
Steudler, P. A., and W. Kijowski, I(.)84: Dctcrn.ination of __, R. Evans, and M. Gumpcrtz, 1981: ElfecLs ofreduced sulfur gases in air by _lid at! _rhant wee(w- environmental conditi(:r,s on isoprene emission from livecentration and gas chromatography. Anal. Chem. 50, oak. I'lanta 152, 565-570.
1432-1436. Tortes, A. L., and H. Buchan, 1988: Tropospheric nitric ox-, and B. J. Pclerson, 1984: Contribution of the su!- i,Je mcasun.'ments over the Amazon Basin. J. Geophys.
fur from salt marshes to the global sulfur cycle. Nature Res. 9.t, 1396-14(16.
311, 455--457. Trabalka, J. R., and D. E. Rcichie, Eds., 1986: The ChangingStcwcns, C. M., and A. Engelkcmcir, 1988: Stable carbon Carbon Cyc,'e --A Global .4nal.vsis. Springcr-Verlag,
isotopic composition of methane from some natural and New York. 592 pp.
anthropogenic sources. J. Geoph)_. Res. 93, 7_-733. Tr_,ler, M., E. J. Williams, D. D Parrish, M. P. Buhr, E.Stev,,art, R. W., A. M. Thompson, and M. A. Owens, 1989: J. Aliwine, H. H. Wcstbcrg, F. C. Fch.._nfcld, and S.
Comparison ot parameterized nitric acid raino,_t rates C. Liu, 1'987: Models and observations (_f the impactusing a coupled stochastic-photochemical tropospheric of natur_q hydrocarbons on rural ozone. Nature 329,model. Unpublished manuscript. 705-707.
Stickel, R., M. O. Rodgers, R. P. Thorn, J. D. Bradshaw, Trt.witt, A. C F., J. R. Frency, O. T. Dcnmcad, Z. Zhao-and D. D. Davis, 1989: A vacuum UV photofragmcn- Liang, C. Gui-Xiu, and J. R. Simw, on , 1988: Water-airtation/lascr induced fluorescence sensor for the in situ transfer resista_ce for ammonia fi'om flooded rice. J.detection of atmospheric ammonia in the _'_tv to ppbv Atmos. Chem. b, 133-147.
range. Unplished manuscrit,,t. Turner, S. M.: and P. S. Liss, 1985: Measurement of various
Svenss3n, B. H., and T. Ross'wall, 1984: In situ methane sulphur gases in a coastal marine cnv, ronment. J..4tmos.
production from acid peat in plant communities with Chem. 2, 223-232. _/different moisture regimes irl a subarctic mire. Oikos43, 341_350. UCAR, 1986: Global 7_t..:_._;)l,cHc Chcmist_ --Plans for
the U. S. Research 1".fro)',',OIES Report 3, UniversityTalbot, R. W., K. M. Bcecher, R. C. Harriss, and W.R. Corporation for Atmospheric Research, Boulder, Colo.
Cofer, Ill, 1988: Atmospheric get)chemistry of formic Varhclyi, G., 1980: Dr), deposition of atmospheric sulfurand acedc acids at a mid-latitude temperate site. ./. and nitrogen compounds, ldcjaras 84, 15-20.Geopln_. Res. 93, 1638-1652.
Vcrma, S. B., D. D. Baldocchi, D. E. ,t,ndcrson, D. R.
Tanner, R. L., G. Y. Markovits, E. M. Ferrcri, and T.J. Mort, and R. J. Clement, 1986: Edd 2) fluxes of CO2_Kelly, 1986: Sampling and determination of gas-phase water vapor and sensible heat over a deciduous forest.hydrogen peroxide h)llowing removal of ozone by gas- Boundary-Layer Mcteorol. 30, 71-91.phase reaction with nitric oxide. As)al. Chem. 58,1857-1865 ..... and N. J. Roscnberg, 1976: Carl)on dioxide con-
centration and flux in a large agricultural region of theTans, P. P., T. J. Conway, and T. Nakazawa, 1989: Latitudi-
Great Plains of North America. J. Geophys. Res. 81,hal distribution of the sources and sinks of atmospheric 3cX)__405.carbon dio×ide derived from surface o_crvations and
an atmospheric transport model. J. (;eoph)_. Rcs., 94, __ ..... and , 1981: Further mca,:.urcmcnts of5151-5172. carbon dioxide concentration and flux in ,', large agri-
cultural region t;f the Great Plains of North AmcJTayk)r, G. E., Jr., S. B. McLaughlin, Jr., D. S. Shriner, and
J. Geoph)_. Res. 80, 3258-3261.W. J. Selvidge, 1983: The llux of sulfur-containing ga_sto vegetation. Atmos. lhtviron. 17, 789-796. Vermettcn, A. W. M., W. A. H. Asman, E. Buijsm,m, and
Thcophanidcs, T., Ed., 1984: l'burier Transform htfrared W. Mulder, 1985: Concentrations of NH 3 and NH_-over the Netherlands. VDI Colloquim on Forest Decline,
i Spectroscopy. D. Reidcl Publishing Co., Dor,Jrccht, the June 18-20, 1985, Goslar, Federal Republic of Germany.Netherlands.
Thompson, A. M., and R. J. Cicerone, 1986: Atmospheric Vines, R. G., L. Gibson, A. B. Hatch, N. K. King, D. A., MacArthur, D. R. Packham, and R. J. Taylor, 1971: On; CH¢, CO, and OH from 1860 to 1985. Nature 321, the Nature, Properties, and Behavior of Bushfire Smoke.
148-150. CSIRO Div. Appl. Chem. Tcch. Pap. No. 1., CS1RO,i Tingcy, D. T., 1981: The ell'oct of environmental factors Mordialloc, Australia, 32 pp.t in the emission of biogenic hydrocarbons from live oak
Warncck, P., 1988: Chemist_. o] the Natural Atmosl)here.and slash pine. In Atmospheric Biogenic Ii),drocarbons, Academic Press, San Diego, Calif., 753 t)p.Vol. 1: l":mL_sions (J. J. Bufalini and R. R. Arnts, Eds.),
} Ann Arbor Science, Ann Arbor, Mich., 53-79. Wcbb, E. K, G. !. Pcarman, and R. Lcuning, 1980: Cor-rection of flux measurements for density effects d'te toheat and water vapour transfer. Quart. J. Roy Meteor.Soc. 106, 85-100.
L
1990002793-109
]04 CHEMICAL FLUXES
Webster, C. R., 1985: Brcn_'ster-plate spoiler: A novel son, M. A. Myers, K. Neisess, M. P. Poe, and E. R.method for reducing the amplitude of interference Stepllens, 1983: bzvestigationof the Role of Natural ll),-fringe_ that limit tunable-la.cer absorption sensitivities, drocarbons in Photochemical Smog Formation bl Califor-1. Opt. Soc. Am. B 2, 1464-1470. nia. Final Report AO-056-32, California Air Resources
Wendel, G. J., D. H. Stedman, and C. A. Cantrell, 1983: Board, Statcwide Air Pollution Research Center, Uni-Luminol-based nitrogen dioxide detector. Anal. Chem. versify of California, Riverside, Calif., 289 pp.55, 937-940.
Wesely, M. L., 1983: Turbulent transport of ozone to sur- Winner, W. E., C. L. Smith, G. W. Koch, H. A. Mooney, J.faces common in the eastern half of the United States. D. 13cwley,and H. R. Krouse, 1981: Rates of emission of
In Trace Atmospheric Constituents, Properties, Transfor- H2S from plants and patterns of stable sulphur isotope,ration and Fates (S.E. Schwartz, Ed.), J. Wiley & Sons, Iiactionation. Nature 289, 672-673.New York, 346-370. WMO, 1986: Aonospheric Ozone 1985, World Meteorological
_ ____.., 1986: Response to "Isotopic versus micromete- Organization, Global Ozone Research and Monitoringorologic ocean CO2 fluxes: A serious conflict," by Project- Repor: No. 16, 1095 pp.t
Broecker et al., Z Geophys. Res. 91, 16533--10535. Wormhoudt, J., J. A. Conant, and W. F. Hcraget, 1985:
, 1988: Use of waHance techniques to measure High resolution infrared emission from gaseous sources.dry air-surface exchange rates. Boundary-Layer Meteorol. In Infrared Methods for Gaseous Measurements (J.44, 13-31. Wormhoudt, Ed.), Marcel Dekker, New York, 1--45.
, D. R. Cook, R. L. Hart, and R. M. Williams, Wyngaard, J. C., 1988a: The effects of probe-induced flowdistortion on atmospheric turbulence measurements: ex.198_a: Air-sea exchange of CO2 and evidence for en-
hanced upward fluxes. J. Geophys. Res. 87, 8827-8832. tension to scalars. J. Atmos. _ci., in press._ , and R. M. Williams, 1981: Field mea- ,1988b: Flow-distortion effects on scalar flux mea-
surement of small ozone lluxes to snow, wet bare soil, surements in the surface layer: Implications for sensorand lake water. Boundary-Layer Meteorol. 20, 459--471. design. Boundary-Layer Meteorol. 42, 19-26.
__, J. A. Eastman, D. H. Stedman, and E. D. Yalvac, , and R. Biost, 1984: Top-down and bottom-up1982b: An eddy-correlation measurement of NO2 flux to dilfusion of a scalar in the convective boundary layer. J.vegetation and comparison to 03 flux. Atmos. Environ. Atmos. Sci. 41, 102-112.16, 815--820. __, and S.-F. Zhang, 1985: Transducer-shadow
, and R. L. Hart, 1985: Variability of short term effects on turbulence spectra measured by soniceddy-correlation estimates of mass exchange. In The anemometers. J. Atmos. Oceanic Teclmol. 2, 548-558.Forest-Atmospherehsteraction (B. A. Hutchison and B.B. Zimmerman, P. R., 1979a: Testing for ll),drocarbon Emis-Hicks, Eds.), D. Reidel Publishing Company, Dordrecht, sions from Vegetation Leaf Litter and Aquatic Surfaces,
the Netherlands, 591-612. and Development of a Methodology for Compiling Bid-
, B. B. Hicks, W. P. Dannevik, S. Frisella, and genic E,_sion blventories. EPA-450/4-4-79-004, Envi-R. B. Husar, 1977: An eddy correlation measurement ronmental Protection Agency, Research Triangle Park,of particulate deposition from the atmosphere. AOnos. N.C., 71 pp.Environ. 11,561-563. , 1979b: Determination of Emission Rates of lly-
Williams, E. J., D. D. Parrish, and F. C. Fehsenfeld, 1987: drocarbons from bMigenous Species of Vegetation bz theDetermination of nitrogen oxide emission from soils: Tampa/St. Petersbu_ Florida Area. EPA-904/9-77-028,Results from a grass land site in Colorado, United States. Environmental Protection Agency, Research TriangleJ. Geophys. Res. 92, 2173-2179. Park, N. C., 174 pp.
Williams, R. M., 1982: Uncertainties in the use of box mod- , R. B. Chatfield, J. Fishman, P. J. Crutzen, and P.els for estimating dry deposition velocity. Atmos. Envi- L. Hanst, 1978: Estimates on the production of CO andton. 16, 2707-2708. H2 from the oxidation of hydrocarbon emissions from
vegetation. Geoph),s. Res. Lett. 5, 679-682.Wilson, L. G., R. A. Bressan, and P. Filner, 1978: Light-
dependent emission of hydrogen sulfide from plants. , J. P' Greenbcrg, S. O. Wandiga, and P. J.Plant Physiology 61, 184--189. Crutzen, 1982: Termites: A potentially large source
of atmospheric methane, carbon dioxide, and molecularWirier, A. M., R. Atkinson, and J. N. Pitts, Jr., 1984: hydrogen. Science 218, 563-565.
Gaseous nitrate radical: Possible nighttime atmosphericsink for biogenie organic compounds. Science 224, 156-- .... and C. E. Westberg, 1988: Measure-159. ment of atmospheric hydrocarbons and biogenic emis-
sion fluxes in the Amazon boundary layer..I. Geophys., D. R. Fitz, P. R. Miller, R. Atkinson, D.E. Res. 93, 1407-1416.
Brown, W. P. L. Caner, M. C. Dodd, C. W. John-
1990002793-'110
! LIST OF PARTICIPANTS
Dr. Stuart Anderson Dr. Chris W. Fairall
Aerodyne Research Meteorology Department45 Manning Road 506 Walker BuildingBillerica, MA 01821 Pennsylvania State University(508) 663-9500 x231 University Park, PA 16802
Dr. M. O. Andreae (814) 863-3934
Max Planck Institute for Chemistry Dr. Carl FarmerBiochemistry Dept. Laboratory lor Atmospheric ResearchPostfach 3000 Washington S_ate UniversityD-6500 Mainz 1 Pullman, WA 99164-2730Federal Republic of Germany (509) 335-1526
49-6131-305420 Dr. Fred FehsensfcldDr. Dennis Baldocchi R/E/AL6NOAA NOAA
Atmospheric Turbulence and 325 BroadwayDiffusion Division Boulder, CO 80303P.O. Box 2456 (303) 497-5819
Oak Ridge, TN 37831 Dr. David Fitzjarrald(615) 576-1232 Atmospheric Sciences Research Center
State University of New York at AlbanyDr. Joost A. Businger 100 Fuller Road
National Center for Atmospheric Research Albany, NY 12205P.O. Box 3000 (518) 442-3838Boulder, CO 80307-3000(303) 497-8838 Dr. Incz Fung
Goddard Institute for Space Studies
Dr. Anthony C. Delany 2880 BroadwayNational Center for Atmospheric Research New York, NY 10025P. O. Box 3000 (212) 678-5590
Boulder, CO 80307-3000 Dr. Paul D. Goldan(303) 497-8776 R/E/AL7
NOAA
Dr. O. T. Denmead 325 BroadwayDivision of Environmental Mechanics Boulder, re 80303CSIRO (303) 497-3814P.O. Box 821Canberra, A.C.T. 2601 Dr. Gary GreenhutAUSTRALIA R/E2
325 Broadway
Dr. Ray Dcsjardins Boulder, CO 80303Agrometeorology Section (303) 497-6165Land Resource Research Institute Dr. Gerald L. GregoryCentral Experimental Farm, Bldg. 74 Mail Stop 483Ottawa, Ontario N_SAFLangley Research CenterCANADA K1A 0C6 Hampton, VA 23665(613) 995-5011, ext. 255 (804) 864-4341
105
1990002793-111
/
106
Dr. Robert Harriss Dr. Jarvis MoyersInstitute for the Study of Earth, Oceans and Space National Science FoundationScience and Engineering Research Bldg. Atmospheric Sciences DivisionUniversity of New Hampshire Washington, D.C. 20550Durham, NH 03824 (202) 357-9657(603) 862-3875
Dr. Richard Pearson, Jr.Mr. Bruce Hicks NASA/AMES Research CenterNOAA/ATDD Mail Stop 245-5P.O. Box 2456 Moffet Field, CA 94035Oak Ridge, TN 37831 (415) 694-4388(615) 576-1232
Dr. Michael Prather
Prof. Barry J. Huebert Goddard Institute for Space StudiesCenter for Atmospheric Studies 2880 BroadwayGraduate School of Oceanography New York, NY 10025University of Rhode Island (212) 678-5625Narragansett, RI 02882-1197(401) 792-6616 Dr. Brian Ridley
National Center for Atmospheric ResearchDr. Charles E. Kolb P.O. Box 3000President Boulder, CO 80307-3000
Aerodyne Research, Inc. (303) 497-1420 _,45 Manning Road Dr. John Ritter J
Billerica, MA 01821 Mail Stop 401B(508) 663-9500 x290 NASA/Langley Research Center
Hampton, VA 23665-5225Dr. Donald Lenschow (804) 864-5693National Center for Atmospheric Research
P.O. Box 3000 Dr. Michael O. RodgersBoulder, CO 80307 School of Geophysical Sciences(303) 497-8903 Room 107, Baker Building
Georgia Institute of TechnologyDr. Shaw C. Liu Atlanta, GA 30332R/E/AL4 (404) 894-3895
NOAA/ERL/Aeronomy Laboratory Dr. Glen Sachse
325 Broadway Mail Stop 468Boulder, CO 80303 NASA/Langley Research Center(303) 497-3356 Hampton, VA 23665
Dr. Jennifer Logan (804) 864-1566Center for Earth & Planetary Physics Dr. William ShawPierce Hall, Harvard University Department of Meteorology29 Oxford Street Naval Postgraduate School
Cambridge, MA 02138 Monterey, CA 93940(617) 495-4582 (408) 646-2411
Dr. Donald H. Stedman
Dr. Chris Martens Chemistry DepartmentCB 3300, Marine Sciences Program University of DenverT_niversity of North Carolina Denver, CO 80208-0179Lhapel Hill, NC 27514 (303) 871-3530
(919) 962-1252 Dr. L. Paul SteeleDr. Robert J. McNeal CIRES/NOAA
Code EEU Campus Box 216National Aeronaulics and Space Admin. University of ColoradoWashington, D.C. 20546 Boulder, CO 80309-0216(202) 453-1681 (303) 497-6228
O
1990002793-112
/
107
Dr. George E. Taylor Dr. Hal WcstbcrgEnvironmental Sciences Division Laboratory h)r Atmospheric ResearchOak Ridge National Laboratory Washington State UniversityP.O. Box X Pullman, WA 99164Oak Ridge, TN 37831-036 (509) 335-1526(615) 574-7353
Dr. Anne Thompson Dr. Stevcn C. WofsyCode 616 Har,,ard University
NASA/Goddard Space Flight Center Pierce Hall, 29 Oxford StreetGreenbelt, MD 20771 Cambridge, MA 02138 i(301) 286-2629 (617) 495-4566 i
Dr. Rod Zika
Dr. Marvin Wesely University of MiamiEnvironmental Research Division Roscnsteil Scht, ol of Marine al_d
Argonne National Laboratory Atmospheric ScienceBldg. 203 464)0 Rickenbacker CausewayArgonne, IL 80439 Miami, FL 33149-1098(312) 972-5827 (305) 361-4715
1990002793-113