Embed Size (px)
Citation preview
MURDOCH RESEARCH REPOSITORY
This is the author’s final version of the work, as accepted for publication following peer review but without the publisher’s layout or pagination.
The definitive version is available at http://dx.doi.org/10.1039/c5cp07141k
Minakshi, M., Biswal, A., Mitchell, D., Jones, R. and Fernandez, C.
(2016) Correlation among physical and electrochemical behaviour of nanostructured electrolytic manganese dioxide
from leach liquor and synthetic for aqueous asymmetric capacitor. Physical Chemistry Chemical Physics,
18 (6). pp. 4711-4720.
http://researchrepository.murdoch.edu.au/30084/
Copyright: © 2016 the Owner Societies.
It is posted here for your personal use. No further distribution is permitted.
Correlation Q1 Q2among physical and electrochemicalbehaviour of nanostructured electrolyticmanganese dioxide from leach liquor andsynthetic for aqueous asymmetric capacitor
Manickam Minakshi Sundaram,*a Avijit Biswal,ab David Mitchell,c Rob Jonesd andCarlos Fernandeze
An attempt has been made to correlate the differences in structural parameters, surface areas,
morphology etc. with the electrochemical capacitive behaviour of the EMDs. The nanostructured
electrolytic manganese dioxides (EMD) have been synthesized through electrodepositing MnO2 from
two different leach liquors and a synthetic analogue thereof. The structural and chemical state was
determined using X-ray diffraction (XRD) and X-ray photoelectron spectroscopy (XPS) respectively.
Multiplet structure determination led to estimates of the manganese valence states present in the EMD.
The EMDs have been tested in an asymmetric capacitor which we have developed. This used activated
carbon as the negative electrode and the various EMDs as the positive electrode. Aqueous 2 M NaOH
solution was used as the electrolyte. The capacitor achieved 1.6 V corresponding to a capacitance of
B50 F g�1 of the EMDs from leach liquors. The EMD derived from the synthetic solution showed an
inferior capacitance of 25 F g�1. Extended cycling (2000 cycles), showed 100% capacity retention was
achieved for one EMD produced from the leach liquor derived from low-grade manganese ore/residue.
This outstanding capacitor performance was correlated with the presence of a nanofibrous morphology.
These findings open up the possibility of extracting a high performance EMD product from a low cost,
low-grade source of manganese.
1. Introduction
The intense interest in manganese dioxide for energy applica-tions is driven by the low cost and non-toxicity of this materialwhen compared with nickel and cobalt oxides.1,2 The richchemistry and diverse crystalline structures of manganesedioxides (MnO2) offer a versatility which allows its use in arange of applications. Manganese dioxides used in batteriesand electrochemical capacitors are broadly classified into threegroups according to their origin – i.e. natural manganesedioxide (NMD), chemical manganese dioxide (CMD), and
electrolytic manganese dioxide (EMD). Despite crystal simila-rities, NMD, CMD and EMD exhibit different physical andelectrochemical properties. The natural ore (NMD) is not asingle stoichiometric MnO2 but, rather, a mixture of up to10–20 different manganese oxide minerals3,4 that have widelydiffering battery activities and inferior battery performancecompared to the other two forms (CMD and EMD). The synth-esis of CMD involves the chemical oxidation of precipitatedMn(II) from an aqueous solution of MnSO4.5 The g-MnO2
prepared chemically (CMD) has marginal performance com-pared to that derived from electrochemical methods (EMD).The latter being widely used in the battery industry. To over-come this, the electrochemically active form of MnO2 (g-MnO2)is prepared by electrodeposition from a very acidic MnSO4 bathat B95 1C.5 This phase is commonly thought of as an inter-growth of pyrolusite in a ramsdellite phase with varying degreesof micro twinning. This EMD phase exhibits the greatest batteryand capacitor activity for most applications.6,7 EMD can beformed from the direct electrolysis of an aqueous bath ofmanganese sulphate and sulphuric acid.
Numerous reports8–11 are available regarding the synthesisof EMD from various manganese ores and its use in energy
1
5
10
15
20
25
30
35
40
45
50
55
1
5
10
15
20
25
30
35
40
45
50
55
Cite this: DOI: 10.1039/c5cp07141k
a School of Engineering and Information Technology, Murdoch UniversityQ3 , Murdoch,
WA 6150, Australiab CSIR-Institute of Minerals and Materials Technology, Bhubaneswar 751013,
Odisha, Indiac Electron Microscope Centre, Australian Institute for Innovative Materials,
Innovation Campus, University of Wollongong, North Wollongong, NSW 2500,
Australiad Centre for Materials and Surface Science, La Trobe University, Bundoora,
VIC 3086, Australiae School of Pharmacy and Life Sciences, Robert Gordon University,
Aberdeen AB10 7GJ, UK
Received 20th November 2015,Accepted 19th January 2016
DOI: 10.1039/c5cp07141k
www.rsc.org/pccp
This journal is �c the Owner Societies 2016 Phys. Chem. Chem. Phys., 2016, 00, 1�10 | 1
PCCP
PAPER
storage applications. The possibility of producing EMD fromlow-grade and secondary manganese resources has not beenfully explored. Production of EMD from a range of sources willbe necessary to meet future escalating demand. Owing to thehigh demand for EMD used in energy storage applications,there is a need to develop EMD from in-expensive alternatesources of manganese. In our current work, we have identified adifferent approach to electro-synthesize EMD from differentprecursors i.e. low-grade manganese residue, manganese cakeand a synthetic solution. Manganese cake and leach residue(low-grade) are the side products obtained as waste materialfrom Mn nodule processing.12,13 Manganese nodules are metal-lic clusters which form on the sea floor. These comprise layersof iron and manganese hydroxides. One of the author’s homeinstitutions (Institute of Minerals and Materials Technology)has built a hydrometallurgical plant to recover Cu, Ni and Cofrom manganese nodules.14,15 The residue obtained from thisprocess was used as a precursor and more details on thepurification of leach liquor can be obtained from Biswalet al.16 To the best of our knowledge, use of EMD synthesizedfrom low-grade and secondary manganese sources as a candi-date material for use in an asymmetric capacitor (activatedcarbon vs. EMD) has not been reported. If successful, thesecost-effective EMD materials might find inexpensive applica-tion in large scale energy storage. The work described hereinvestigates the ability of EMD synthesized from differentprecursors to serve as an electrode material for asymmetriccapacitor applications. The characteristics such as improvedstorage capability, cycling stability, safety and economic life-cycle cost could make the device an attractive alternative toconventional charge storage devices using more expensivehigh-grade materials. The objective of this work is to studythe materials and electrochemistry that influence the electro-deposition of manganese dioxide from the residue Mn(II)liquors or synthetic solution while optimizing the conditionsproducing high-performance storage ability.
2. Experimental2.1. Material & methods
Leach liquors were prepared by leaching manganese cake andlow-grade manganese residue in a 1 L scale glass reactor at 75 �2 1C. Initially, 1 L of H2SO4 solution at the required concen-tration (2 M for low grade manganese residue, 1.5 M formanganese cake) was prepared and transferred to the leachingreactor. This was followed by the addition of 100 g of manga-nese cake and 15 g activated carbon as reductant to produce10% (w/v) slurry of manganese cake. Similarly about 200 g oflow grade residue and 25 g of activated carbon were taken toprepare a 20% (w/v) slurry of low grade residue. The leachingwas continued for 4 h for manganese residue, and 2 h formanganese cake with constant stirring using a Remi stirrer. Atthe conclusion of leaching, the slurry was cooled, filtered andpurified via two stages prior to electrowinning. The purificationprocess for removal of Fe and other trace elements was carried
out as detailed in one of our earlier reports.16 Manganese wasestimated volumetrically by EDTA method. The leach liquorswere purified and diluted to bring the concentration of man-ganese to the desired level.
A synthetic (high purity) solution was prepared as an analo-gue to the leach liquors, by dissolving manganese sulphate inan appropriate concentration of sulphuric acid. All three solu-tions contained 48 g dm�3 manganese as manganese sulfateand 24 g dm�3 sulphuric acid.
Electrolytic manganese dioxides (EMDs) was extracted fromthe three solutions at an anodic current density of 200 A m�2 ina glass cell.
Electrodeposition of EMD. Electrodeposition can be definedas the deposition of conductive particles on the substrate froman electrolytic bath by the imposition of current. EMD wasdeposited at 90 1C in an electrolytic cell from the preparedmanganese sulfate/sulphuric acid electrolytes. The anode andthe cathode were lead and stainless steel respectively, andcurrent was supplied from a constant current DC source. Thedeposited EMD was removed mechanically, washed thoroughlyand oven dried at 100 1C. The dried mass was ground andsieved through a 50 mm mesh screen to obtain EMD powder.This powder was washed repeatedly with deionized water untilfree from sulfate. The washed powder was dried and cooledin a desiccator and then subjected to various physicalcharacterizations.
2.2. Physical characterization
X-ray diffractograms were obtained from a Phillips PowderDiffractometer (PAN ANALYTICAL PW 1830) using Cu Karadiation. Scans were recorded in 2y range 10–701 at 21 perminute. X-ray photoelectron spectra were acquired using aKratos AXIS Nova spectrometer (Kratos Analytical Ltd, U.K.)equipped with a monochromated Al Ka radiation source(1486.6 eV) operating at 150 W. Survey spectra were recordedat 1 eV per step and a pass energy of 160 eV. Higher-resolutionspectra acquired for selected photoemissions were recorded at0.1 eV per step and a pass energy of 20 eV. The binding energyof the component of the C 1s spectrum attributed to hydro-carbon was measured to be (285.0 � 0.1) eV for all samples,indicating that there was no accumulation of surface chargeduring the acquisitions. The morphology and lattice imaging ofthe EMD materials were characterized by transmission electronmicroscopy (TEM), high-resolution TEM (HRTEM), electronenergy loss spectroscopy (EELS) and high angle angular darkfield (HAADF) using a JEOL ARM200F TEM operated at 200 kV.TEM specimens were prepared by grinding a small amount ofpowder under methanol and dispersing on a holey carbon film.Specimens were examined at liquid nitrogen temperature in acooling stage, to reduce beam damage and contaminationeffects.
2.3. Electrochemical characterization
The working electrode consists of active material electrolyticmanganese oxide (EMD) or activated carbon (AC) (75 wt%)mixed with carbon black (15 wt%) to improve the conductivity
1
5
10
15
20
25
30
35
40
45
50
55
1
5
10
15
20
25
30
35
40
45
50
55
2 | Phys. Chem. Chem. Phys., 2016, 00, 1�10 This journal is �c the Owner Societies 2016
Paper PCCP

and polyvinylidene fluoride (PVDF) (10 wt%) as a binder.Activated carbon was used as received from Sigma Aldrich witha surface area 1800 m2 g�1. The composites were suspended inan agate mortar containing 0.3 mL of N-methyl-2-pyrrolidinone(NMP) to form a slurry. A total of 100 mL of slurry was coated ona graphite sheet (geometric surface area of 1 cm2) and thendried at 60 1C for one hour. An aqueous solution of 2 M NaOHwas employed as the electrolyte for all electrochemical mea-surements. For the three-electrode tests, a platinum wire of10 cm in length and 1 mm in diameter and a mercury–mercuricoxide (Hg/HgO) cell served as the counter and reference elec-trode, respectively. The asymmetric capacitor was constructedwith EMD as the positive electrode and activated carbon as thenegative electrode. The electrochemical measurements werecarried out using BioLogic VSP-300 instrument. Prior to analy-sis, initially the electrode was left to equilibrate for 10 min inthe electrolyte, and the potential of the working electrode wasmonitored. This was followed by either cyclic voltammetry orgalvanostatic charge–discharge experiments. In the case ofpotentiostatic electrochemical impedance spectroscopy (EIS)analysis, measurements were made in the frequency rangefrom 1 Hz to 100 kHz with an AC excitation amplitude of 10 mV.
3. Results and discussion3.1. Physical characterization of the EMD materials
X-ray diffraction studies. The electrolytic manganese dioxide(EMD) materials obtained from different precursors were char-acterized by X-ray diffraction (XRD) to reveal the changes incrystal structure. Fig. 1 shows the XRD patterns of the electro-deposited MnO2 materials. All the peaks of EMD are indexed tog-MnO2 on the basis of an orthorhombic unit cell are broad andof low intensity, indicating the formation of poorly crystallinephase and not highly ordered. This is ascribed to non-periodic
intergrowth of pyrolusite and ramsdellite structural units.17
The obtained pattern is in good agreement with the standardvalues reported in JCPDS card no. 65-1298. The XRD patternacquired from all the synthesized EMD samples appear to besimilar in Fig. 1 and did not reveal any discernible changesbetween them. This indicates that if the electrolytic depositionparameters are constant then the phases of electrodepositedMnO2 will be quite similar in crystal structure irrespective ofthe precursors. To reveal the surface chemical state of manga-nese and to obtain further information on the composition ofthe electrodeposited MnO2, X-ray photoelectron spectroscopy(XPS) was performed.
X-ray photoelectron spectroscopy (XPS) studies. A surveyspectrum (0–1200 eV) of the surface of EMD obtained fromlow grade residue is shown in Fig. 2a. Identified in thespectrum are peaks associated with the elements Mn, O, C,and N. The atomic fractions of these elements for each EMDmaterial obtained are listed in Table 1.
Spectra recorded at higher energy resolution for the Mn 2pand 3s regions for the low-grade residue are show in Fig. 2b andd, respectively. The Mn 2p3/2 fitting curves are shown in Fig. 2c.Those acquired from the other samples are similar, and so notpresented here. On initial inspection, these spectra are char-acteristic of MnO2. The apex of the Mn 2p3/2 peak has thedistinctive shape observed for MnO2, but not for the oxides ofMn in other oxidation states,18–22 and is centred at 642.3 eV,which is within the range reported for MnO2. The energyseparation between the two components of the Mn 3s peak,arising from coupling in the photo-excited ion between theunpaired 3s and 3d electrons, is 4.5 eV, which is also char-acteristic of Mn(IV).23
The Mn 2p spectra of Mn(II), Mn(III), and Mn(IV) compoundsare generally broad and asymmetric, as each is a composite ofseveral peaks (multiplets) arising from coupling, in the excitedstate, between the unpaired 2p and 3d electrons. The theore-tical splitting for each state has been calculated by Gupta andSen,24,25 and their results applied to the spectra of Mn oxides by Q5
Nesbitt and Banerjee23 and Biesinger et al.22 Both observed, inthe Mn 2p spectra acquired from MnO2, a low binding energycomponent to the Mn 2p3/2 peak that they could not assign to amultiplet peak of Mn(IV). Instead, this component was attrib-uted to contributions from Mn(III)22,23 and, by Nesbitt andBanerjee only, Mn(II).21 A similar shoulder is present in theMn 2p spectra acquired from the EMD samples. The relativecontribution of the shoulder to the overall peak area wasaround 15% for all samples. The general trend is the samefor all fitting methods. The ratio of Mn(III) to Mn(IV) is approxi-mately the same for all the samples regardless of the precur-sors. Furthermore, from the fits obtained for the Mn 2p spectra,it seems likely that the O 1s spectra would be matched bycontributions from O atoms in Mn(III), as well as Mn(IV),coordination. Each C 1s spectrum (in Fig. 2e) was fitted tothree components. The most intense of these is the componentat the lowest binding energy, which is attributed to carbonatoms in hydrocarbon groups. The binding energies of allspectra were shifted so that this component was centred at
1
5
10
15
20
25
30
35
40
45
50
55
1
5
10
15
20
25
30
35
40
45
50
55Fig. 1 X-ray diffraction (XRD) patterns of the EMD materials derived fromprecursors (a) low-grade residue, (b) manganese cake and (c) syntheticsolution.
This journal is �c the Owner Societies 2016 Phys. Chem. Chem. Phys., 2016, 00, 1�10 | 3
PCCP Paper

285.0 eV, to correct for energy shifts resulting from samplecharging during irradiation. The binding energy of the secondcomponent in each C 1s spectrum is 1.6–1.7 eV higher than thatof the hydrocarbon peak, and so is attributed to carbon atomssingly bonded to oxygen, in either alcohol or ether functionalgroups. The binding energy of the third component is betweenthose generally observed for CQO and O–CQO functionalgroups, and is possibly a composite of contributions from both.The binding energies and relative contributions of each com-ponent are listed in Table 1. The XPS spectra acquired from all
the electrodeposited EMD samples were similar and did notappear to have any distinct differences between them, theconfirmation of Mn(IV) oxidation state. Nevertheless, the pro-portion of Mn(IV) could be slightly higher relative to that ofMn(III) or Mn(II) for low-grade residue as compared to that ofderived from the cake and synthetic solutions. This can beinferred from the lengthening of the average Mn–O bonds (seeTable 1) with an increased surface area. A possible correlationis suggested between the electrochemical reactivity and thesurface area of the active ‘‘OH’’ groups. The BET surface areas
1
5
10
15
20
25
30
35
40
45
50
55
1
5
10
15
20
25
30
35
40
45
50
55
Fig. 2 X-ray photoelectron spectroscopy (XPS) spectra (a) wide scan region, (b) Mn 2p, (c) Mn 2p3/2 fitting, (d) Mn 3s, and (e) C 1s deconvolution peaks forEMD (g-MnO2) samples derived from low-grade residue.
Table 1 XPS Elemental fractions and chemical states of the three EMD materials derived from different precursors
EMD from different precursors
Chemical state/atom fraction (%)
Wide (survey) spectrum C (1s) O (1s)
Mn O C N Cl Pb C–C C–O–C O–CQO Mn–O Mn–OH Organic O
Low-grade Mn residue 29.8 50.1 16.7 2.7 0.6 — 57.9 28.7 13.5 76.0 22.1 1.9Mn cake 29.2 49.6 18.0 2.4 0.7 0.1 58.1 27.4 14.5 74.3 23.5 2.2Synthetic (MnSO4) solution 28.5 49.8 18.4 2.8 0.4 0.1 59.7 26.2 14.2 71.8 25.5 2.7
4 | Phys. Chem. Chem. Phys., 2016, 00, 1�10 This journal is �c the Owner Societies 2016
Paper PCCP
of the EMD samples were calculated to be 104, 100 and 55 m2
g�1 for low-grade, cake and synthetic solution-derived materi-als, respectively.
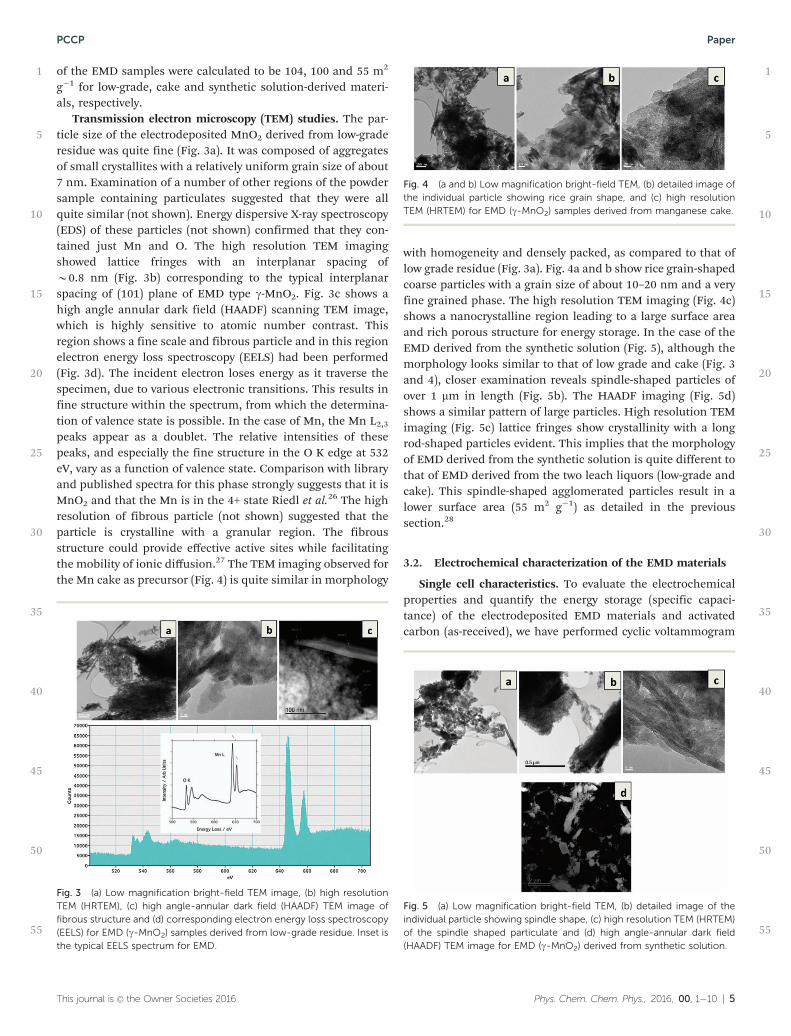
Transmission electron microscopy (TEM) studies. The par-ticle size of the electrodeposited MnO2 derived from low-graderesidue was quite fine (Fig. 3a). It was composed of aggregatesof small crystallites with a relatively uniform grain size of about7 nm. Examination of a number of other regions of the powdersample containing particulates suggested that they were allquite similar (not shown). Energy dispersive X-ray spectroscopy(EDS) of these particles (not shown) confirmed that they con-tained just Mn and O. The high resolution TEM imagingshowed lattice fringes with an interplanar spacing ofB0.8 nm (Fig. 3b) corresponding to the typical interplanarspacing of (101) plane of EMD type g-MnO2. Fig. 3c shows ahigh angle annular dark field (HAADF) scanning TEM image,which is highly sensitive to atomic number contrast. Thisregion shows a fine scale and fibrous particle and in this regionelectron energy loss spectroscopy (EELS) had been performed(Fig. 3d). The incident electron loses energy as it traverse thespecimen, due to various electronic transitions. This results infine structure within the spectrum, from which the determina-tion of valence state is possible. In the case of Mn, the Mn L2,3
peaks appear as a doublet. The relative intensities of thesepeaks, and especially the fine structure in the O K edge at 532eV, vary as a function of valence state. Comparison with libraryand published spectra for this phase strongly suggests that it isMnO2 and that the Mn is in the 4+ state Riedl et al.26 The highresolution of fibrous particle (not shown) suggested that theparticle is crystalline with a granular region. The fibrousstructure could provide effective active sites while facilitatingthe mobility of ionic diffusion.27 The TEM imaging observed forthe Mn cake as precursor (Fig. 4) is quite similar in morphology
with homogeneity and densely packed, as compared to that oflow grade residue (Fig. 3a). Fig. 4a and b show rice grain-shapedcoarse particles with a grain size of about 10–20 nm and a veryfine grained phase. The high resolution TEM imaging (Fig. 4c)shows a nanocrystalline region leading to a large surface areaand rich porous structure for energy storage. In the case of theEMD derived from the synthetic solution (Fig. 5), although themorphology looks similar to that of low grade and cake (Fig. 3and 4), closer examination reveals spindle-shaped particles ofover 1 mm in length (Fig. 5b). The HAADF imaging (Fig. 5d)shows a similar pattern of large particles. High resolution TEMimaging (Fig. 5c) lattice fringes show crystallinity with a longrod-shaped particles evident. This implies that the morphologyof EMD derived from the synthetic solution is quite different tothat of EMD derived from the two leach liquors (low-grade andcake). This spindle-shaped agglomerated particles result in alower surface area (55 m2 g�1) as detailed in the previoussection.28
3.2. Electrochemical characterization of the EMD materials
Single cell characteristics. To evaluate the electrochemicalproperties and quantify the energy storage (specific capaci-tance) of the electrodeposited EMD materials and activatedcarbon (as-received), we have performed cyclic voltammogram
1
5
10
15
20
25
30
35
40
45
50
55
1
5
10
15
20
25
30
35
40
45
50
55
Fig. 3 (a) Low magnification bright-field TEM image, (b) high resolutionTEM (HRTEM), (c) high angle-annular dark field (HAADF) TEM image offibrous structure and (d) corresponding electron energy loss spectroscopy(EELS) for EMD (g-MnO2) samples derived from low-grade residue. Inset isthe typical EELS spectrum for EMD.
Fig. 4 (a and b) Low magnification bright-field TEM, (b) detailed image ofthe individual particle showing rice grain shape, and (c) high resolutionTEM (HRTEM) for EMD (g-MnO2) samples derived from manganese cake.
Fig. 5 (a) Low magnification bright-field TEM, (b) detailed image of theindividual particle showing spindle shape, (c) high resolution TEM (HRTEM)of the spindle shaped particulate and (d) high angle-annular dark field(HAADF) TEM image for EMD (g-MnO2) derived from synthetic solution.
This journal is �c the Owner Societies 2016 Phys. Chem. Chem. Phys., 2016, 00, 1�10 | 5
PCCP Paper
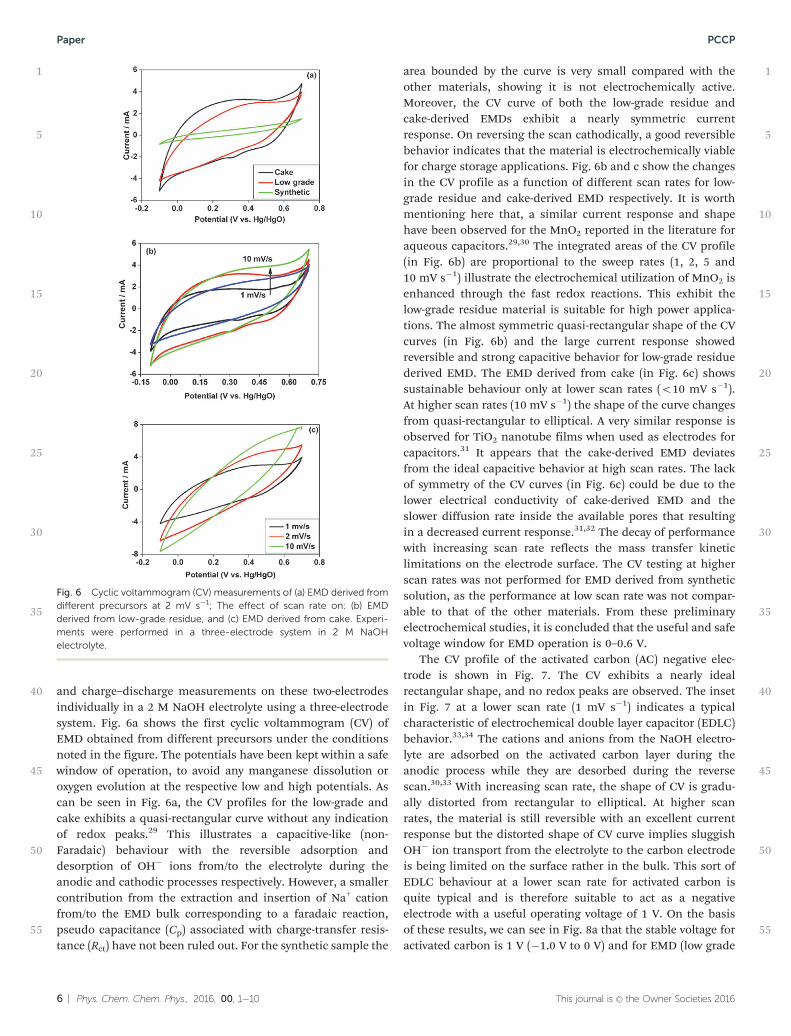
and charge–discharge measurements on these two-electrodesindividually in a 2 M NaOH electrolyte using a three-electrodesystem. Fig. 6a shows the first cyclic voltammogram (CV) ofEMD obtained from different precursors under the conditionsnoted in the figure. The potentials have been kept within a safewindow of operation, to avoid any manganese dissolution oroxygen evolution at the respective low and high potentials. Ascan be seen in Fig. 6a, the CV profiles for the low-grade andcake exhibits a quasi-rectangular curve without any indicationof redox peaks.29 This illustrates a capacitive-like (non-Faradaic) behaviour with the reversible adsorption anddesorption of OH� ions from/to the electrolyte during theanodic and cathodic processes respectively. However, a smallercontribution from the extraction and insertion of Na+ cationfrom/to the EMD bulk corresponding to a faradaic reaction,pseudo capacitance (Cp) associated with charge-transfer resis-tance (Rct) have not been ruled out. For the synthetic sample the
area bounded by the curve is very small compared with theother materials, showing it is not electrochemically active.Moreover, the CV curve of both the low-grade residue andcake-derived EMDs exhibit a nearly symmetric currentresponse. On reversing the scan cathodically, a good reversiblebehavior indicates that the material is electrochemically viablefor charge storage applications. Fig. 6b and c show the changesin the CV profile as a function of different scan rates for low-grade residue and cake-derived EMD respectively. It is worthmentioning here that, a similar current response and shapehave been observed for the MnO2 reported in the literature foraqueous capacitors.29,30 The integrated areas of the CV profile(in Fig. 6b) are proportional to the sweep rates (1, 2, 5 and10 mV s�1) illustrate the electrochemical utilization of MnO2 isenhanced through the fast redox reactions. This exhibit thelow-grade residue material is suitable for high power applica-tions. The almost symmetric quasi-rectangular shape of the CVcurves (in Fig. 6b) and the large current response showedreversible and strong capacitive behavior for low-grade residuederived EMD. The EMD derived from cake (in Fig. 6c) showssustainable behaviour only at lower scan rates (o10 mV s�1).At higher scan rates (10 mV s�1) the shape of the curve changesfrom quasi-rectangular to elliptical. A very similar response isobserved for TiO2 nanotube films when used as electrodes forcapacitors.31 It appears that the cake-derived EMD deviatesfrom the ideal capacitive behavior at high scan rates. The lackof symmetry of the CV curves (in Fig. 6c) could be due to thelower electrical conductivity of cake-derived EMD and theslower diffusion rate inside the available pores that resultingin a decreased current response.31,32 The decay of performancewith increasing scan rate reflects the mass transfer kineticlimitations on the electrode surface. The CV testing at higherscan rates was not performed for EMD derived from syntheticsolution, as the performance at low scan rate was not compar-able to that of the other materials. From these preliminaryelectrochemical studies, it is concluded that the useful and safevoltage window for EMD operation is 0–0.6 V.
The CV profile of the activated carbon (AC) negative elec-trode is shown in Fig. 7. The CV exhibits a nearly idealrectangular shape, and no redox peaks are observed. The insetin Fig. 7 at a lower scan rate (1 mV s�1) indicates a typicalcharacteristic of electrochemical double layer capacitor (EDLC)behavior.33,34 The cations and anions from the NaOH electro-lyte are adsorbed on the activated carbon layer during theanodic process while they are desorbed during the reversescan.30,33 With increasing scan rate, the shape of CV is gradu-ally distorted from rectangular to elliptical. At higher scanrates, the material is still reversible with an excellent currentresponse but the distorted shape of CV curve implies sluggishOH� ion transport from the electrolyte to the carbon electrodeis being limited on the surface rather in the bulk. This sort ofEDLC behaviour at a lower scan rate for activated carbon isquite typical and is therefore suitable to act as a negativeelectrode with a useful operating voltage of 1 V. On the basisof these results, we can see in Fig. 8a that the stable voltage foractivated carbon is 1 V (�1.0 V to 0 V) and for EMD (low grade
1
5
10
15
20
25
30
35
40
45
50
55
1
5
10
15
20
25
30
35
40
45
50
55
Fig. 6 Cyclic voltammogram (CV) measurements of (a) EMD derived fromdifferent precursors at 2 mV s�1; The effect of scan rate on: (b) EMDderived from low-grade residue, and (c) EMD derived from cake. Experi-ments were performed in a three-electrode system in 2 M NaOHelectrolyte.
6 | Phys. Chem. Chem. Phys., 2016, 00, 1�10 This journal is �c the Owner Societies 2016
Paper PCCP

residue) is 0.6 V (0 V to 0.6 V) with a scan rates between 2 and 5mV s�1. Therefore, for a cell containing activated carbon vs.EMD, the safe operating cell voltage could be 1.6 V in 2 MNaOH electrolyte. The specific capacitances of each electrodewere calculated by galvanostatic discharge–charge measure-ments as shown in Fig. 8b. The EMD electrode potentialincreases from 0 to 0.6 V upon charging while that of theactivated carbon electrode varied from 0 to �1.0 V. The specificcapacitance of the active material EMD and AC after subtract-ing from contributions of carbon black (acetylene black) and
binder were calculated to be 75 F g�1 and 110 F g�1 respectively.It is quite common to use carbon black as an additive35,36 in theEMD cathode, to reduce interparticle contact resistance andenhance the electrical percolation network with improvedelectronic conductivity. To avoid any discrepancy (like irrever-sible cell capacitance) arises from the carbon black, only theactive material has been taken into an account for calculatingspecific capacitance. Based on the single cell characteristics, tomaintain the charge balance of the hybrid cell, the weight ratiobetween the negative and positive electrodes (k = m+/m�) wasestimated to be 2.44.
Asymmetric device (activated carbon vs. EMD). Galvano-static charge/discharge experiments were carried out for theasymmetric capacitor (Fig. 9 and 10). Fig. 9a–c show typical
1
5
10
15
20
25
30
35
40
45
50
55
1
5
10
15
20
25
30
35
40
45
50
55
Fig. 7 Cyclic voltammogram (CV) measurements of activated carbon atdifferent scan rates. Inset is the typical electrochemical double layercapacitor (EDLC) behaviour at a low scan rate of 1 mV s�1. Experimentswere performed in a three-electrode system in 2 M NaOH electrolyte.
Fig. 8 (a) Cyclic voltammogram (CV) curves for activated carbon (AC)negative electrode and EMD positive electrode at 2 mV s�1 and (b)corresponding galvanostatic (charge–discharge) curves for each electrodeat 2 mA. The plots are shown for the 1st and 50th cycles. Experiments areperformed in a three-electrode system in 2 M NaOH electrolyte. (Terms Cand D refers to charge and discharge, respectively).
Fig. 9 Charge–discharge voltage profile of the activated carbon vs. EMDasymmetric capacitor. EMD derived from (a) low-grade residue, (b) man-ganese cake, and (c) synthetic solution measured at a constant current of2 mA in 2 M NaOH electrolyte. Plots are shown for the 1, 300 and 500cycles. The EMD derived from the low grade residue (a) shows the bestperformance.
This journal is �c the Owner Societies 2016 Phys. Chem. Chem. Phys., 2016, 00, 1�10 | 7
PCCP Paper
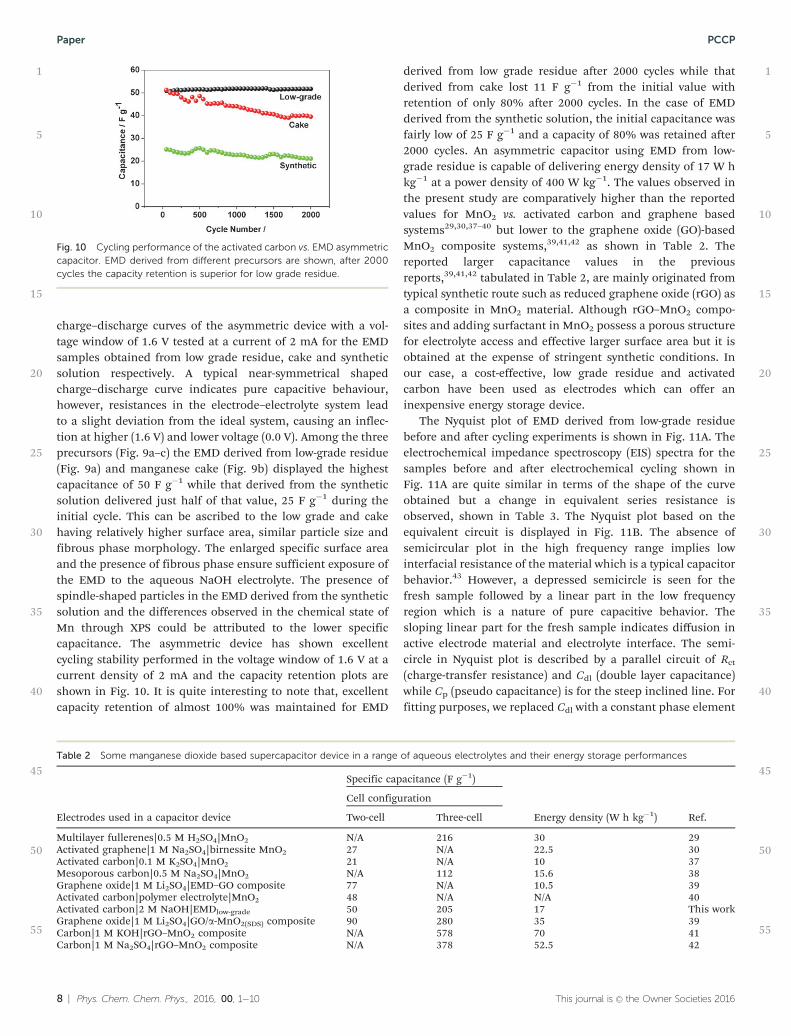
charge–discharge curves of the asymmetric device with a vol-tage window of 1.6 V tested at a current of 2 mA for the EMDsamples obtained from low grade residue, cake and syntheticsolution respectively. A typical near-symmetrical shapedcharge–discharge curve indicates pure capacitive behaviour,however, resistances in the electrode–electrolyte system leadto a slight deviation from the ideal system, causing an inflec-tion at higher (1.6 V) and lower voltage (0.0 V). Among the threeprecursors (Fig. 9a–c) the EMD derived from low-grade residue(Fig. 9a) and manganese cake (Fig. 9b) displayed the highestcapacitance of 50 F g�1 while that derived from the syntheticsolution delivered just half of that value, 25 F g�1 during theinitial cycle. This can be ascribed to the low grade and cakehaving relatively higher surface area, similar particle size andfibrous phase morphology. The enlarged specific surface areaand the presence of fibrous phase ensure sufficient exposure ofthe EMD to the aqueous NaOH electrolyte. The presence ofspindle-shaped particles in the EMD derived from the syntheticsolution and the differences observed in the chemical state ofMn through XPS could be attributed to the lower specificcapacitance. The asymmetric device has shown excellentcycling stability performed in the voltage window of 1.6 V at acurrent density of 2 mA and the capacity retention plots areshown in Fig. 10. It is quite interesting to note that, excellentcapacity retention of almost 100% was maintained for EMD
derived from low grade residue after 2000 cycles while thatderived from cake lost 11 F g�1 from the initial value withretention of only 80% after 2000 cycles. In the case of EMDderived from the synthetic solution, the initial capacitance wasfairly low of 25 F g�1 and a capacity of 80% was retained after2000 cycles. An asymmetric capacitor using EMD from low-grade residue is capable of delivering energy density of 17 W hkg�1 at a power density of 400 W kg�1. The values observed inthe present study are comparatively higher than the reportedvalues for MnO2 vs. activated carbon and graphene basedsystems29,30,37–40 but lower to the graphene oxide (GO)-basedMnO2 composite systems,39,41,42 as shown in Table 2. Thereported larger capacitance values in the previousreports,39,41,42 tabulated in Table 2, are mainly originated fromtypical synthetic route such as reduced graphene oxide (rGO) asa composite in MnO2 material. Although rGO–MnO2 compo-sites and adding surfactant in MnO2 possess a porous structurefor electrolyte access and effective larger surface area but it isobtained at the expense of stringent synthetic conditions. Inour case, a cost-effective, low grade residue and activatedcarbon have been used as electrodes which can offer aninexpensive energy storage device.
The Nyquist plot of EMD derived from low-grade residuebefore and after cycling experiments is shown in Fig. 11A. Theelectrochemical impedance spectroscopy (EIS) spectra for thesamples before and after electrochemical cycling shown inFig. 11A are quite similar in terms of the shape of the curveobtained but a change in equivalent series resistance isobserved, shown in Table 3. The Nyquist plot based on theequivalent circuit is displayed in Fig. 11B. The absence ofsemicircular plot in the high frequency range implies lowinterfacial resistance of the material which is a typical capacitorbehavior.43 However, a depressed semicircle is seen for thefresh sample followed by a linear part in the low frequencyregion which is a nature of pure capacitive behavior. Thesloping linear part for the fresh sample indicates diffusion inactive electrode material and electrolyte interface. The semi-circle in Nyquist plot is described by a parallel circuit of Rct
(charge-transfer resistance) and Cdl (double layer capacitance)while Cp (pseudo capacitance) is for the steep inclined line. Forfitting purposes, we replaced Cdl with a constant phase element
1
5
10
15
20
25
30
35
40
45
50
55
1
5
10
15
20
25
30
35
40
45
50
55
Fig. 10 Cycling performance of the activated carbon vs. EMD asymmetriccapacitor. EMD derived from different precursors are shown, after 2000cycles the capacity retention is superior for low grade residue.
Table 2 Some manganese dioxide based supercapacitor device in a range of aqueous electrolytes and their energy storage performances
Electrodes used in a capacitor device
Specific capacitance (F g�1)
Energy density (W h kg�1) Ref.
Cell configuration
Two-cell Three-cell
Multilayer fullerenes|0.5 M H2SO4|MnO2 N/A 216 30 29Activated graphene|1 M Na2SO4|birnessite MnO2 27 N/A 22.5 30Activated carbon|0.1 M K2SO4|MnO2 21 N/A 10 37Mesoporous carbon|0.5 M Na2SO4|MnO2 N/A 112 15.6 38Graphene oxide|1 M Li2SO4|EMD–GO composite 77 N/A 10.5 39Activated carbon|polymer electrolyte|MnO2 48 N/A N/A 40Activated carbon|2 M NaOH|EMDlow-grade 50 205 17 This workGraphene oxide|1 M Li2SO4|GO/a-MnO2(SDS) composite 90 280 35 39Carbon|1 M KOH|rGO–MnO2 composite N/A 578 70 41Carbon|1 M Na2SO4|rGO–MnO2 composite N/A 378 52.5 42
8 | Phys. Chem. Chem. Phys., 2016, 00, 1�10 This journal is �c the Owner Societies 2016
Paper PCCP
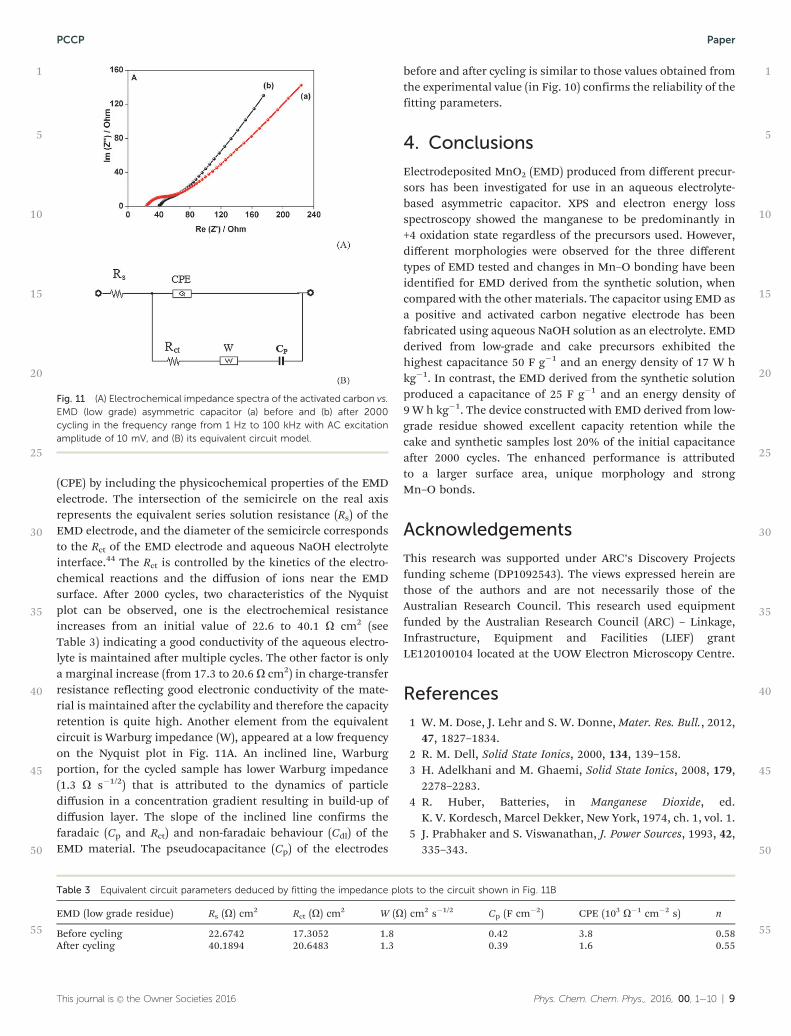
(CPE) by including the physicochemical properties of the EMDelectrode. The intersection of the semicircle on the real axisrepresents the equivalent series solution resistance (Rs) of theEMD electrode, and the diameter of the semicircle correspondsto the Rct of the EMD electrode and aqueous NaOH electrolyteinterface.44 The Rct is controlled by the kinetics of the electro-chemical reactions and the diffusion of ions near the EMDsurface. After 2000 cycles, two characteristics of the Nyquistplot can be observed, one is the electrochemical resistanceincreases from an initial value of 22.6 to 40.1 O cm2 (seeTable 3) indicating a good conductivity of the aqueous electro-lyte is maintained after multiple cycles. The other factor is onlya marginal increase (from 17.3 to 20.6 O cm2) in charge-transferresistance reflecting good electronic conductivity of the mate-rial is maintained after the cyclability and therefore the capacityretention is quite high. Another element from the equivalentcircuit is Warburg impedance (W), appeared at a low frequencyon the Nyquist plot in Fig. 11A. An inclined line, Warburgportion, for the cycled sample has lower Warburg impedance(1.3 O s�1/2) that is attributed to the dynamics of particlediffusion in a concentration gradient resulting in build-up ofdiffusion layer. The slope of the inclined line confirms thefaradaic (Cp and Rct) and non-faradaic behaviour (Cdl) of theEMD material. The pseudocapacitance (Cp) of the electrodes
before and after cycling is similar to those values obtained fromthe experimental value (in Fig. 10) confirms the reliability of thefitting parameters.
4. Conclusions
Electrodeposited MnO2 (EMD) produced from different precur-sors has been investigated for use in an aqueous electrolyte-based asymmetric capacitor. XPS and electron energy lossspectroscopy showed the manganese to be predominantly in+4 oxidation state regardless of the precursors used. However,different morphologies were observed for the three differenttypes of EMD tested and changes in Mn–O bonding have beenidentified for EMD derived from the synthetic solution, whencompared with the other materials. The capacitor using EMD asa positive and activated carbon negative electrode has beenfabricated using aqueous NaOH solution as an electrolyte. EMDderived from low-grade and cake precursors exhibited thehighest capacitance 50 F g�1 and an energy density of 17 W hkg�1. In contrast, the EMD derived from the synthetic solutionproduced a capacitance of 25 F g�1 and an energy density of9 W h kg�1. The device constructed with EMD derived from low-grade residue showed excellent capacity retention while thecake and synthetic samples lost 20% of the initial capacitanceafter 2000 cycles. The enhanced performance is attributedto a larger surface area, unique morphology and strongMn–O bonds.
Acknowledgements
This research was supported under ARC’s Discovery Projectsfunding scheme (DP1092543). The views expressed herein arethose of the authors and are not necessarily those of theAustralian Research Council. This research used equipmentfunded by the Australian Research Council (ARC) – Linkage,Infrastructure, Equipment and Facilities (LIEF) grantLE120100104 located at the UOW Electron Microscopy Centre.
References
1 W. M. Dose, J. Lehr and S. W. Donne, Mater. Res. Bull., 2012,47, 1827–1834.
2 R. M. Dell, Solid State Ionics, 2000, 134, 139–158.3 H. Adelkhani and M. Ghaemi, Solid State Ionics, 2008, 179,
2278–2283.4 R. Huber, Batteries, in Manganese Dioxide, ed.
K. V. Kordesch, Marcel Dekker, New York, 1974, ch. 1, vol. 1.5 J. Prabhaker and S. Viswanathan, J. Power Sources, 1993, 42,
335–343.
1
5
10
15
20
25
30
35
40
45
50
55
1
5
10
15
20
25
30
35
40
45
50
55
Fig. 11 (A) Electrochemical impedance spectra of the activated carbon vs.EMD (low grade) asymmetric capacitor (a) before and (b) after 2000cycling in the frequency range from 1 Hz to 100 kHz with AC excitationamplitude of 10 mV, and (B) its equivalent circuit model.
Table 3 Equivalent circuit parameters deduced by fitting the impedance plots to the circuit shown in Fig. 11B
EMD (low grade residue) Rs (O) cm2 Rct (O) cm2 W (O) cm2 s�1/2 Cp (F cm�2) CPE (103 O�1 cm�2 s) n
Before cycling 22.6742 17.3052 1.8 0.42 3.8 0.58After cycling 40.1894 20.6483 1.3 0.39 1.6 0.55
This journal is �c the Owner Societies 2016 Phys. Chem. Chem. Phys., 2016, 00, 1�10 | 9
PCCP Paper
6 A. Kozawa, Batteries, in Manganese Dioxide, ed.K. V. Kordesch, Marcel Dekker, Springer, New York, 1974,vol. 1, pp. 385–519.
7 M. Minakshi, P. Singh, T. B. Issa, S. Thurgate andR. DeMarco, J. Power Sources, 2004, 130, 254–259.
8 O. Schilling and J. R. Dahn, J. Appl. Crystallogr., 1998, 31,396–406.
9 A. G. Kholmogorov, A. M. Zhyzhaev, U. S. Kononov,G. A. Moiseeva and G. L. Pashkov, Hydrometallurgy, 2000,56, 1–11.
10 H. Malankar, S. S. Sharma, K. Singh and M. Sharma, J. SolidState Electrochem., 2010, 14, 71–82.
11 R. N. Sahoo, P. K. Naik and S. C. Das, Hydrometallurgy, 2001,62, 157–163.
12 A. Biswal, K. Sanjay, M. K. Ghosh, T. Subbaiah andB. K. Mishra, Hydrometallurgy, 2011, 110, 44–49.
13 A. Biswal, B. C. Tripathy, K. Sanjay, T. Subbaiah andM. Minakshi, RSC Adv., 2015, 5, 58255–58283.
14 R. P. Das, S. Anand, Proc. ISOPE Ocean Mining Symp., Seoul,1997, pp. 165–171.
15 N. K. Mittal and P. K. Sen, Miner. Eng., 2003, 16,865–868.
16 A. Biswal, B. C. Tripathy, K. Sanjay, D. Meyrick, T. Subbaiahand M. Minakshi, J. Solid State Electrochem., 2013, 17,3191–3198.
17 J. E. Post, Proc. Natl. Acad. Sci. U. S. A., 1999, 96(30),3447–3454.
18 M. A. Stranick, Surf. Sci. Spectra, 1999, 6, 31–38.19 M. A. Stranick, Surf. Sci. Spectra, 1999, 6, 39–46.20 M. C. Militello and S. W. Gaarenstroom, Surf. Sci. Spectra,
2001, 8, 200–206.21 H. W. Nesbitt and D. Banerjee, Am. Mineral., 1998, 83,
305–315.22 M. C. Biesinger, B. D. Payne, A. P. Grosvenor, L. W. M. Lau,
A. R. Gerson and R. C. Smart, Appl. Surf. Sci., 2011, 257,2717–2730.
23 Thermo Scientific XPS Knowledge Base, Manganese. http://xpssimplified.com/elements/manganese.php.
24 R. P. Gupta and S. K. Sen, Phys. Rev. B: Solid State, 1974, 10,71–77.
25 R. P. Gupta and S. K. Sen, Phys. Rev. B: Solid State, 1975, 12,15–19.
26 T. Riedl, T. Gemming and K. Wetzig, Ultramicroscopy, 2006,106, 284–291.
27 E. S. Pampal, E. Stojanovska, B. Simon and A. Kilic, J. PowerSources, 2015, 300, 199–215.
28 S.-L. Yang, R.-G. Ma, M.-J. Hu, L.-J. Xi, Z.-G. Lu andC. Y. Chung, J. Mater. Chem., 2012, 22, 25402–25408.
29 M. Vedi Kuyil Azhagan, M. V. Vaishampayan andM. V. Shelke, J. Mater. Chem., 2014, 2, 2152–2159.
30 M. Huang, Y. Zhang, F. Li, L. Zhang, R. S. Ruoff, Z. Wen andQ. Liu, Sci. Rep., 2014, 4, 3878–3884.
31 M. Zhou, A. M. Glushenkov, O. Kartachova, Y. Li andY. Chen, J. Electrochem. Soc., 2015, 162, A5065–A5069.
32 K. Zaghib, J. B. Goodenough, A. Mauger and C. Julien,J. Power Sources, 2009, 194, 1021–1023.
33 J. Xu, Q. Gao, Y. Zhang, Y. Tan, W. Tian, L. Zhu and L. Jiang,Sci. Rep., 2014, 4, 5545–5550.
34 S. Majumder, S. Dey, K. Bagani, S. K. Dey, S. Banerjee andS. Kumar, Dalton Trans., 2015, 44, 7190–7202.
35 X. Qi, B. Blizanac, A. DuPasquier, P. Meister, T. Placke,M. Oljaca, J. Li and M. Winter, Phys. Chem. Chem. Phys.,2014, 16, 25306–25313.
36 M. Manickam and M. Takata, J. Power Sources, 2002, 112,116–120.
37 T. Brousse, P.-L. Taberna, O. Crosnier, R. Dugas,P. Guillemet, Y. Scudeller, Y. Zhou, F. Favier, D. Belangerand P. Simon, J. Power Sources, 2007, 173, 633–641.
38 I.-T. Kim, N. Kouda, N. Yoshimoto and M. Morita, J. PowerSources, 2015, 298, 123–129.
39 C. J. Jafta, F. Nkosi, L. le Roux, M. K. Mathe, M. Kebede,K. Makgopa, Y. Song, D. Tong, M. Oyama, N. Manyala,S. Chen and K. I. Ozoemena, Electrochim. Acta, 2013, 110,228–233.
40 P. Staiti and F. Lufrano, Electrochim. Acta, 2010, 55,7436–7442.
41 H. Chen, S. Zhou, M. Chen and L. Wu, J. Mater. Chem., 2012,22, 25207–25216.
42 P. Y. Chan and S. R. Majid, Solid State Ionics, 2014, 262,226–229.
43 H. Pang, Y. Ma, G. Li, J. Chen. J. Zhang, H. Zheng andW. Du, Dalton Trans., 2012, 41, 13284–13291.
44 Q. Cheng, J. Tang, J. Ma, H. Zhang, N. Shinya and L. C. Qin,Carbon, 2011, 49, 2917–2925.
1
5
10
15
20
25
30
35
40
45
50
55
1
5
10
15
20
25
30
35
40
45
50
55
10 | Phys. Chem. Chem. Phys., 2016, 00, 1�10 This journal is �c the Owner Societies 2016
Paper PCCP