Embed Size (px)
Citation preview

Munjal Mehta
One assumption◦ HISTORY REPEATS ITSELF
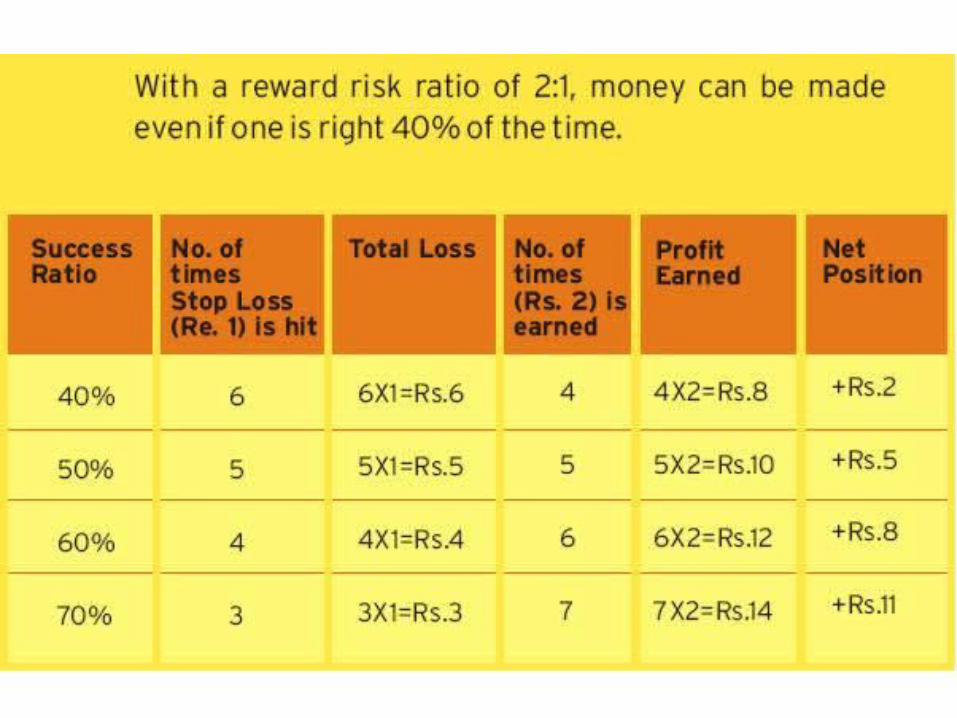
One rule◦ REWARD:RISK should always be 2:1
Two learnings◦ Technical analysis is SUBJECTIVE◦ It should be used alongwith FUNDAMENTAL
ANALYSIS to give the best results
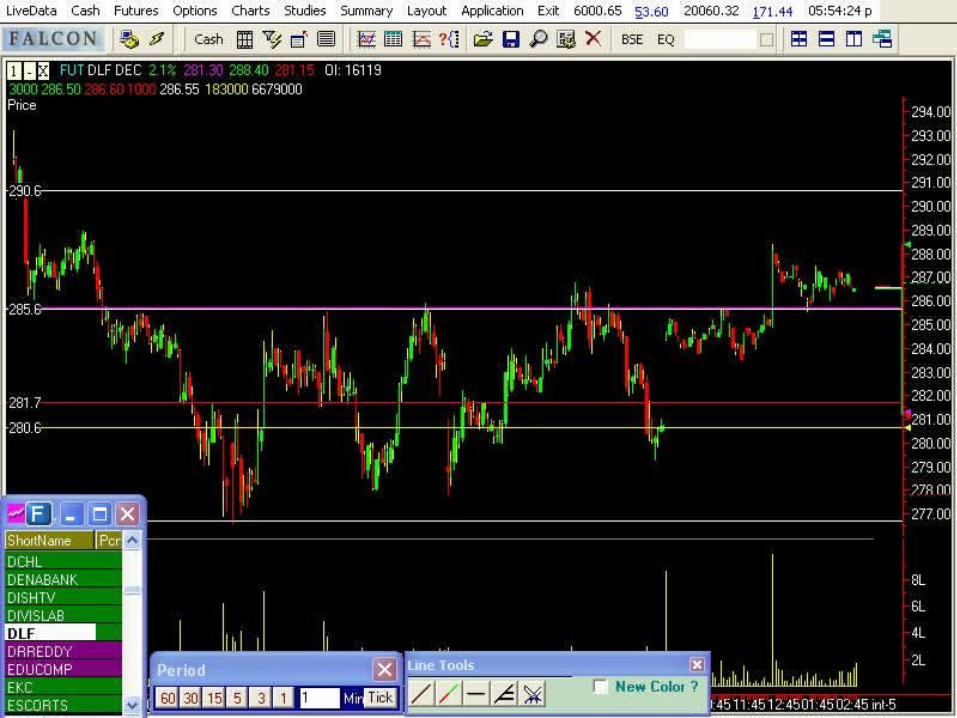
It assumes that the previous price levels shown will act as support and resistances
Supports will become resistances if broken Resistances will become supports if broken
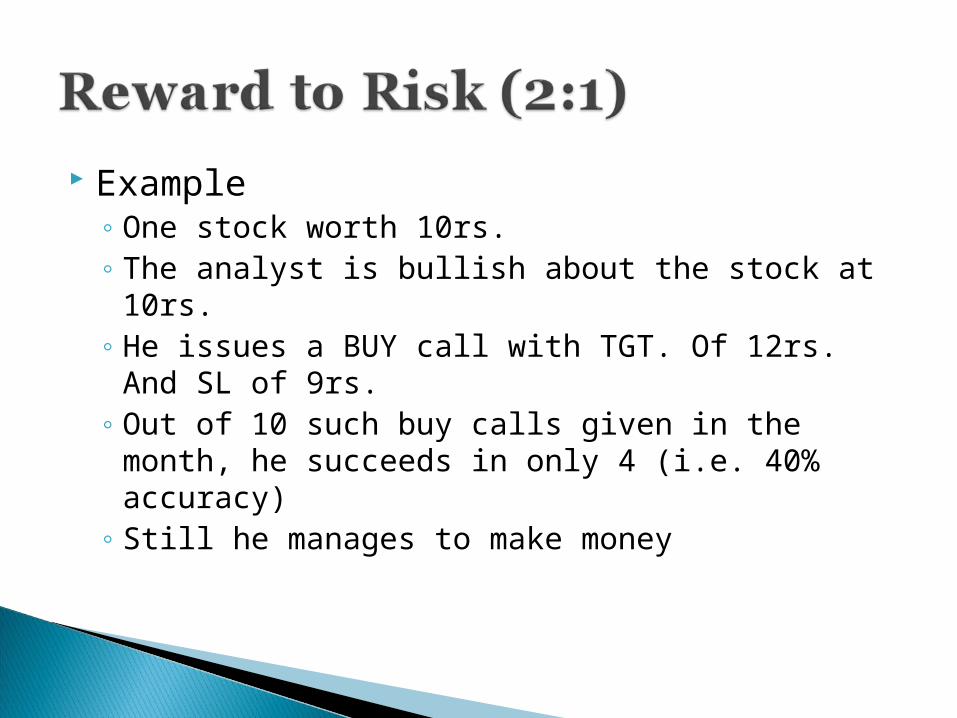
Example◦ One stock worth 10rs.◦ The analyst is bullish about the stock at 10rs.◦ He issues a BUY call with TGT. Of 12rs. And SL
of 9rs.◦ Out of 10 such buy calls given in the month, he
succeeds in only 4 (i.e. 40% accuracy)◦ Still he manages to make money
Technical analysis cannot be a self fulfilling phenomenon
The entire world watches the same charts and the same levels
But still half of them make money and half of them loose
This is because Technical analysis is subjective
The same chart could look bearish to one analyst and bullish to the other
Technical analysis should only be used as a guiding tool
The main use of technical analysis is affirm when to enter the stock
Whether to enter the stock or not is a call to be taken on the basis of fundamental analysis
Take the example of Tata Motors At levels of 140rs stock was highly
undervalued according to fundamentals Then at these levels, even if the technical
indicators might show weakness in the stock, it might not be advisable to issue a sell call
Trends Moving Averages Candlestick Patterns Oscillators (RSI, MACD, Stochastic, etc.) Bollinger bands Pivot points Elliot wave patterns And many more….
Most commonly used tool Uses the previous day’s levels to generate
support and resistance levels for today Ignores the open price of the stock,
because it is subject to bias Mainly used for intraday trading
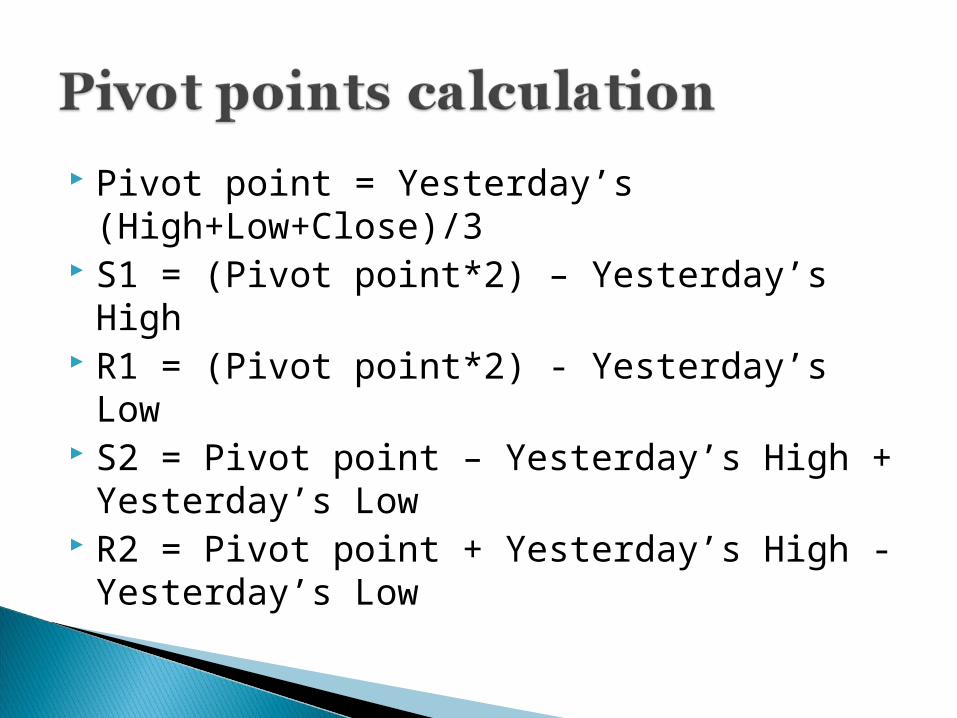
Pivot point = Yesterday’s (High+Low+Close)/3
S1 = (Pivot point*2) – Yesterday’s High R1 = (Pivot point*2) - Yesterday’s Low S2 = Pivot point – Yesterday’s High +
Yesterday’s Low R2 = Pivot point + Yesterday’s High -
Yesterday’s Low
Trends are a consistent pattern of highs and lows
Can be bullish as well as bearish A series of higher tops and higher bottoms
signifies a bullish trend A series of lower tops and lower bottoms
signifies a bearish trend


A very simple tool in analyzing a particular stock
An ‘n’ day simple moving average, simply calculates the average of the closing prices of the last ‘n’ days
Used to define support and resistance levels
Moving average crossovers are very important in gauging the trend
The larger the value of ‘n’ the more important is the level
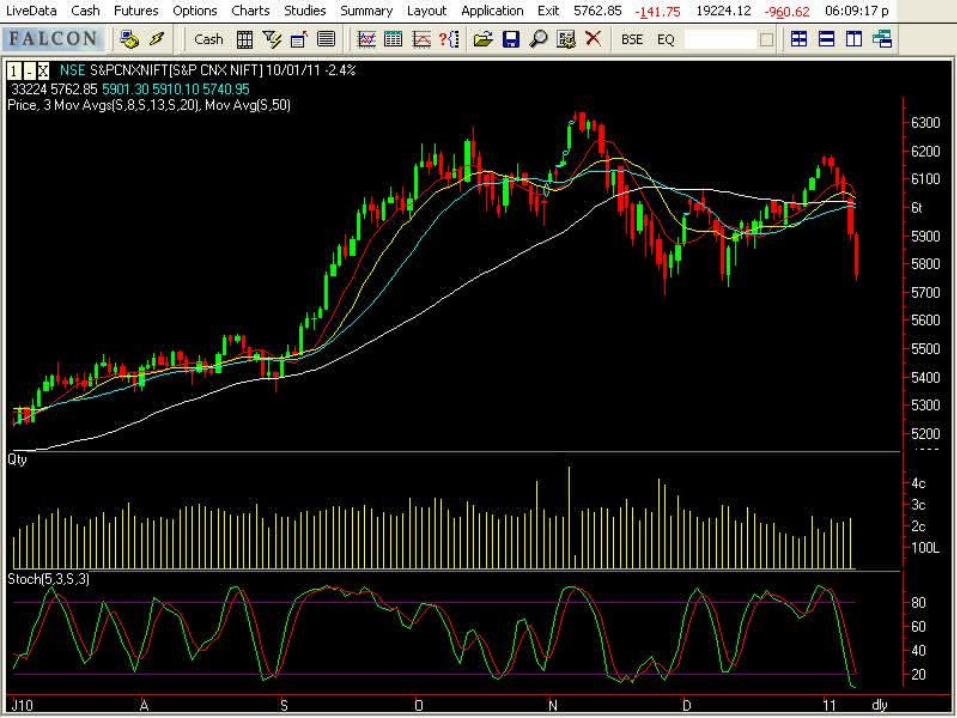
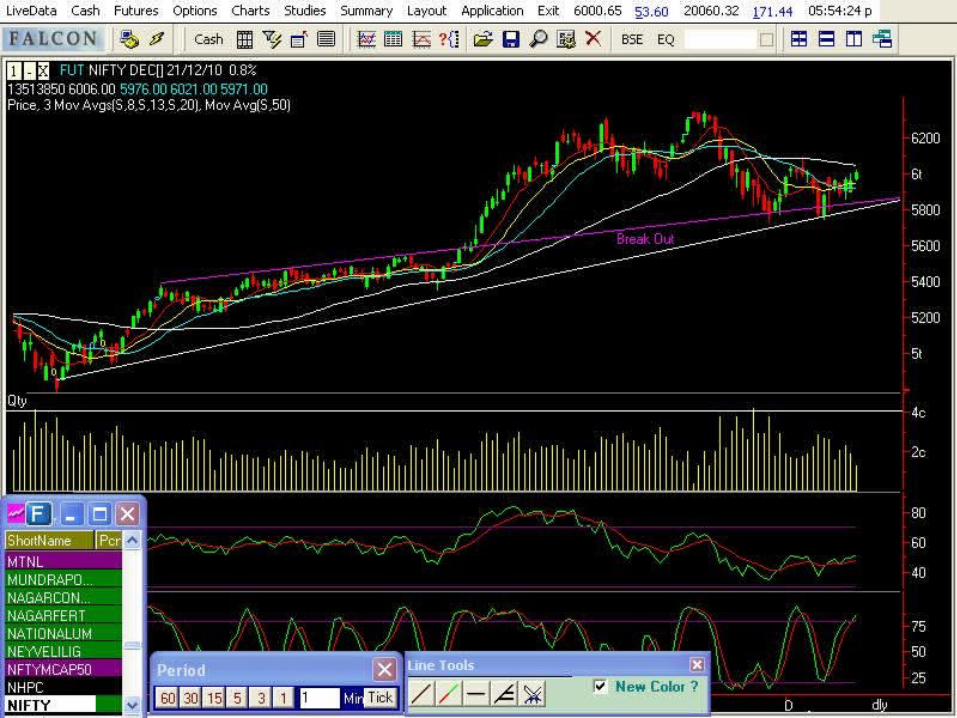
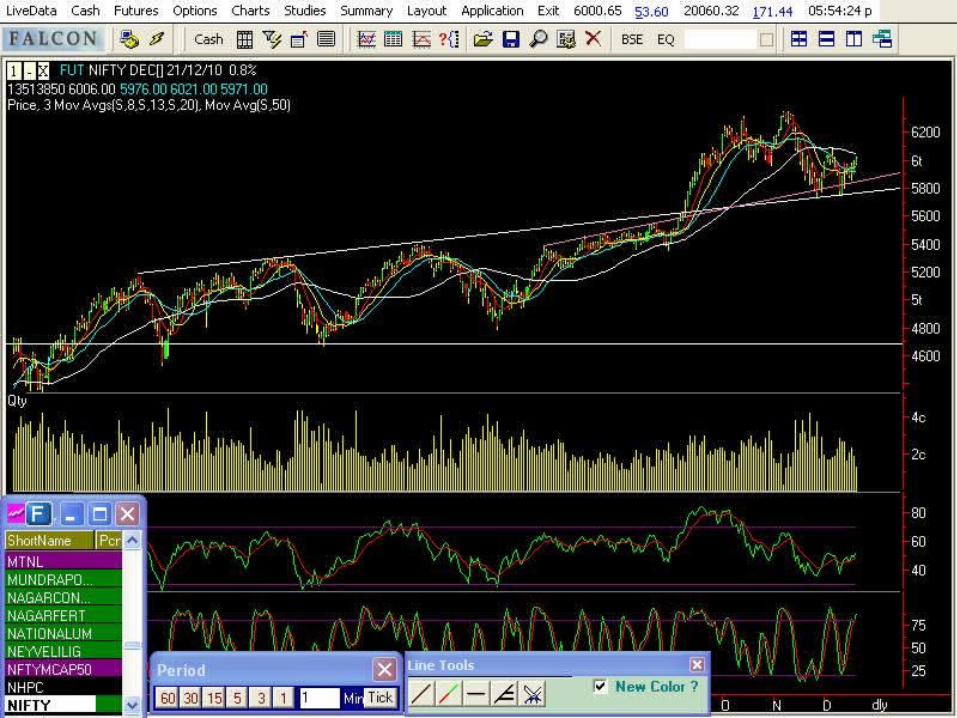
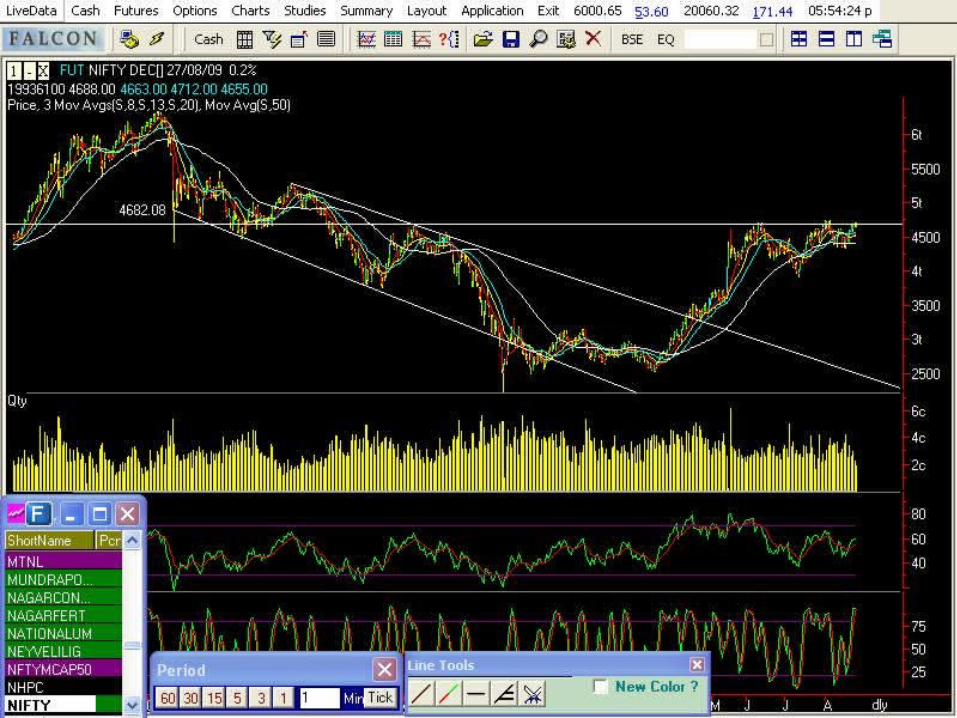
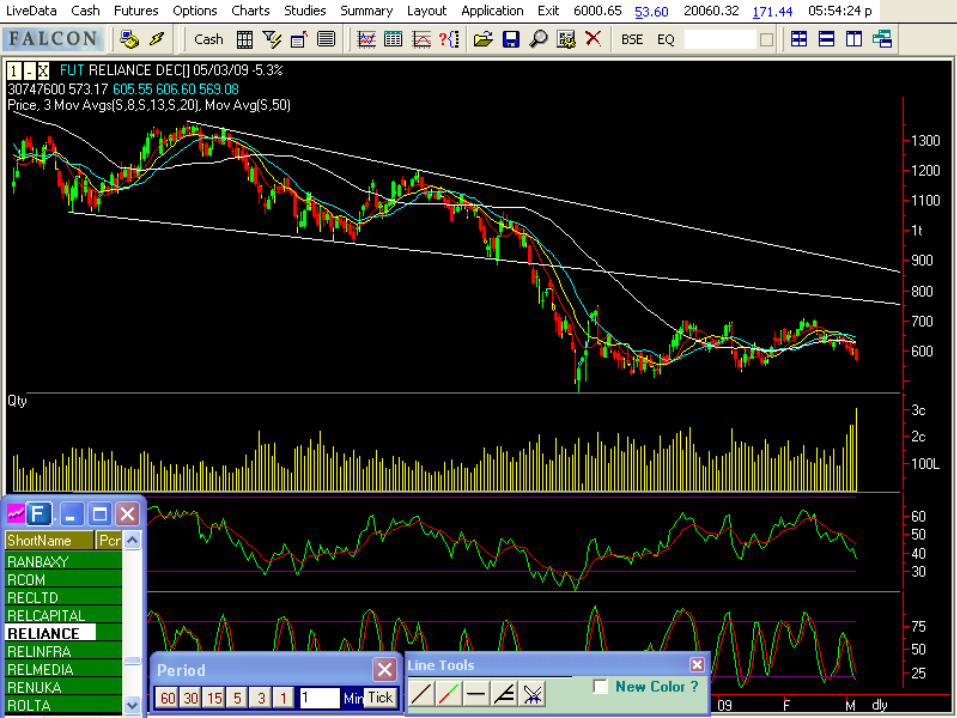
I have used the 8, 13 and 21 days moving average alongwith the 50 day moving average
On careful analysis of the chart, you will see that the 50 day moving average has acted as a major support and resistance level in the past
Commonly known as momentum indicators Used to gauge three things:-
◦ Overbought or Oversold conditions◦ Possibility of a Trend Reversal◦ Increase or Decrease in Momentum
Should never be used in Isolation, should always be used alongwith the price chart
An overbought condition is such that the probability of a downmove is quite high
An oversold condition is such that the probability of a upmove or a rally is high
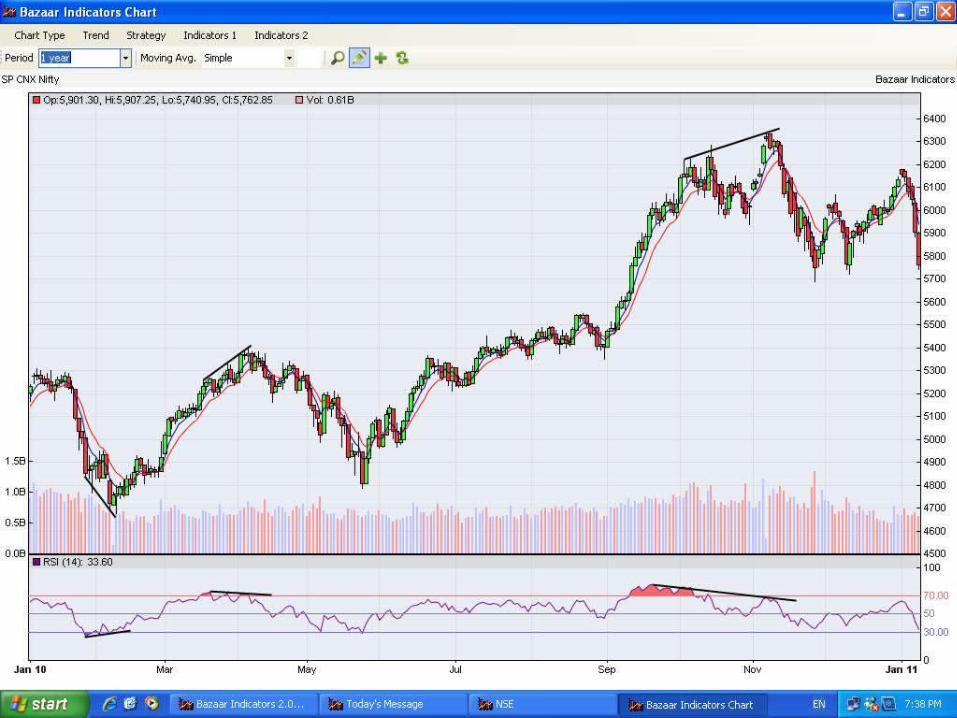
Can be found out by spotting a divergence between price action and the oscillator readings
Divergence means when the scrip and the oscillator moves in the opposite direction
Divergences occurring at the bottom are termed as positive divergences, and vice versa
They are useful only if they occur in overbought or oversold conditions
Rate Of Change (ROC) Relative Strength Index (RSI) Moving Average Convergence Divergence
(MACD) Stochastic
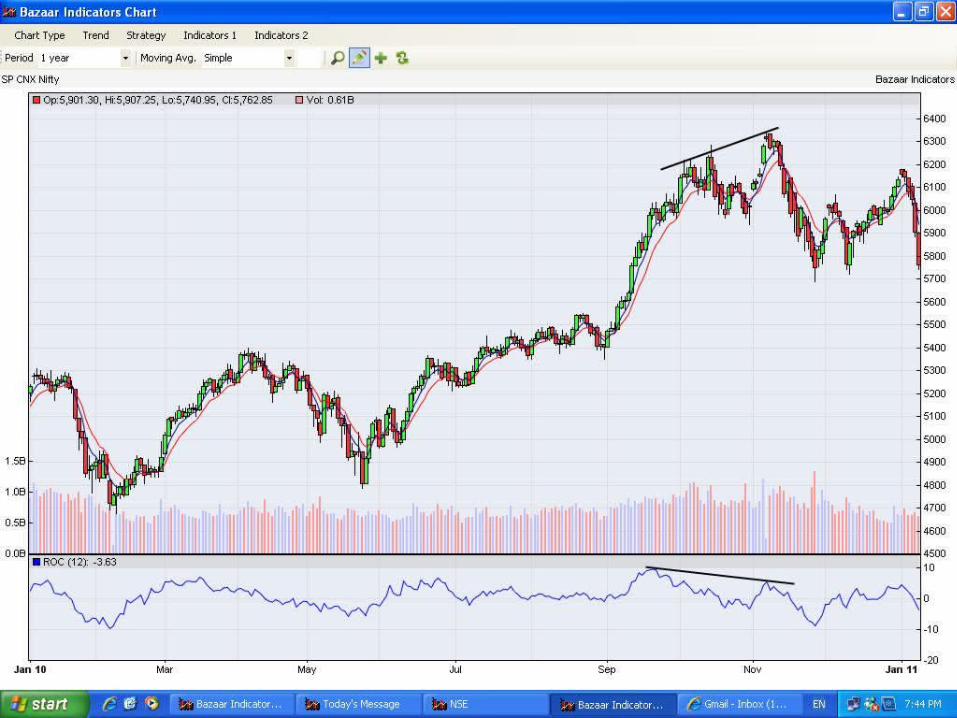
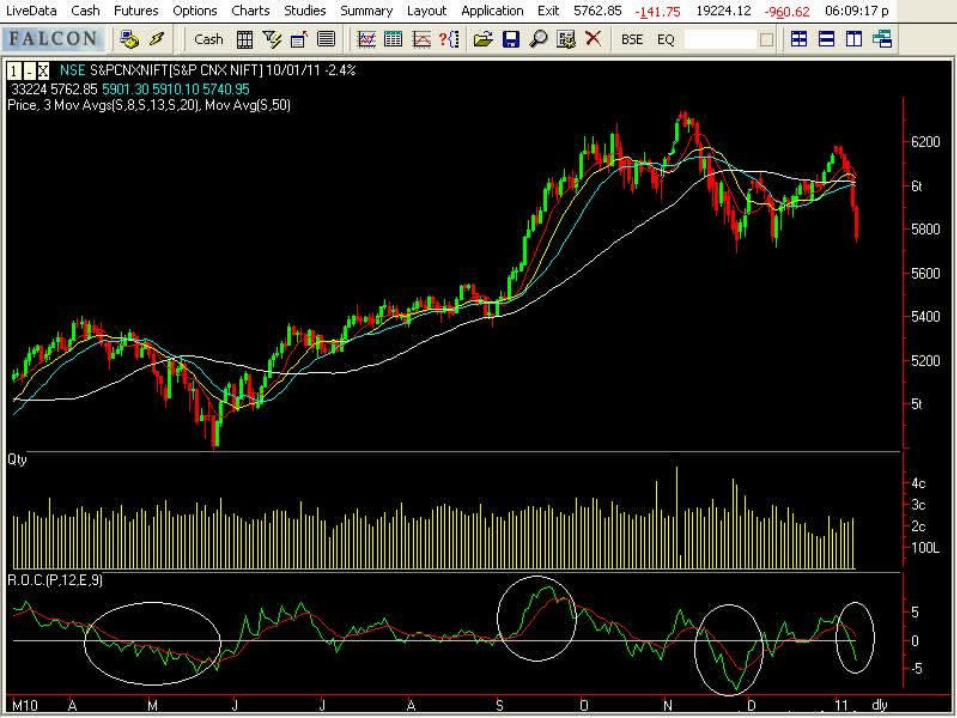
Measures the rate of change between the current price and the price ‘n’ days in the past
The RSI indicates the strength of the scrip relative to itself
RSI = 100 – 100/(1+Rs) Where Rs = Avg. daily gain / Avg. daily loss The time period normally selected is 14
days
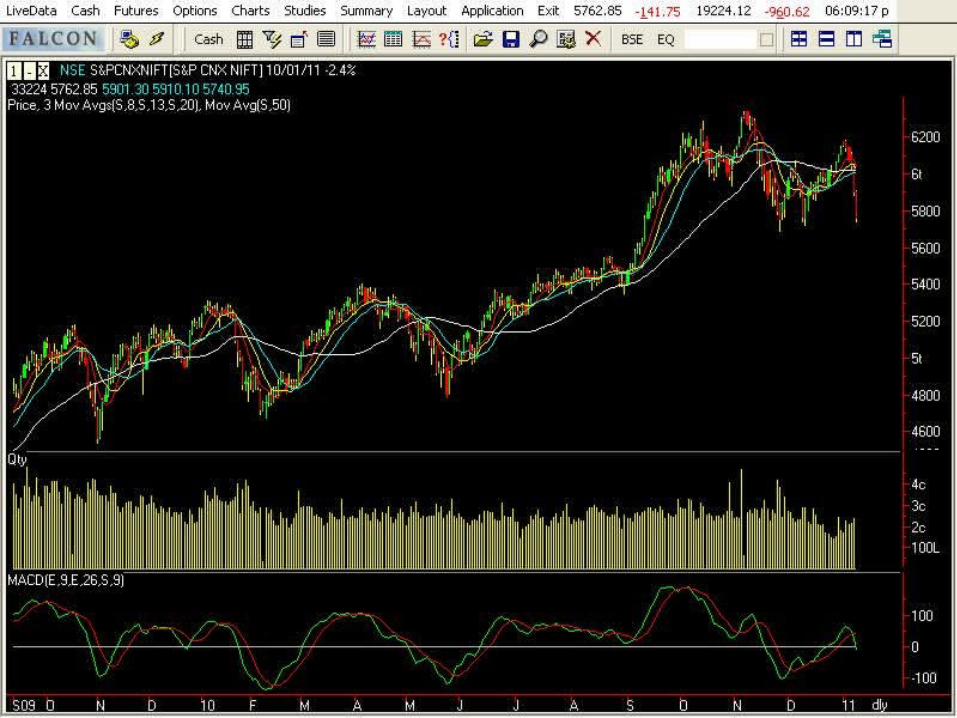
This indicator measures plots the difference between a short term moving avg. and a long term moving avg.
If the short term avg. is higher than the long term avg., the indicator is positive
If the indicator is positive and moves below the zero level, It indicates a possible change in trend
The stochastic oscillator works on the principle that the stock prices close near the high price of the day when the trend is bullish and vice versa
It consists of 2 components:-◦ %K = 100 (C-L5)/(H5-L5)◦ %D = moving average of the %K line