Embed Size (px)
Citation preview
Proposal for municipal solid waste
management for the city of
Kostomuksha
Prepared by Sari Piippo
Revised by Eva Pongrácz
For the Green Cities and Settlements European project and its partners
Report for WP2: Urban and rural resource management
2
EVOLUTION OF MUNICIPAL WASTE MANAGEMENT IN FINLAND
CONTENTS
Introduction ............................................................................................................................................................. 3
Background part ...................................................................................................................................................... 3
Status phase ............................................................................................................................................................ 3
Existing situation ................................................................................................................................................. 3
Estimating MSW amounts in the future .............................................................................................................. 4
Planning part ........................................................................................................................................................... 7
Establishment of an MSW management system ................................................................................................ 7
Scenarios for the establishment of MSWM system in Kostomuksha ................................................................. 9
The current situation ..................................................................................................................................... 10
Scenario 1 (maximum recovery) .................................................................................................................... 10
Scenario 2 (partial recovery) ......................................................................................................................... 11
Scenario 3 (experiences in Finland) ............................................................................................................... 13
Scenario 4 (experiences in Arkhangelsk) ....................................................................................................... 14
Scenario 5 (no recovery at all) ....................................................................................................................... 16
Summary of the Scenarios ............................................................................................................................. 16
Conclusions from the Scenarios ........................................................................................................................ 18
Conclusions ............................................................................................................................................................ 19
Reference list ......................................................................................................................................................... 20
3
EVOLUTION OF MUNICIPAL WASTE MANAGEMENT IN FINLAND
INTRODUCTION To achieve a reasonable and well-functioning MSW management system, the principles of sustainable
development, integrated solid waste management and the waste management hierarchy must be
included and practice at all the possible levels (e.g. national, regional and municipal levels). Strategic
planning is necessary so that MSWM services meet the demand, are suitable to needs, and are cost-
effective. (Worldbank 2001; European commission 2003)
The MSWM planning process itself consists of six phases: general considerations, status part, planning
part, consultation process, implementation and plan revision (Worldbank 2001; European commission
2003). When starting to plan the MSWM system it is essential to consider the waste management
principles, e.g. waste hierarchy. In the next stage, the present situation is studied very carefully before the
actual planning and implementation is started. An important part of the planning process is the
consultation of the experts. In implementation phase its orientations are put into practice by legislation,
regulation, negotiations with the industry, and/or information to the public. Plan revision is needed
before the expiry of the planning period. (European commission 2003)
This work was done as a part of the “Green cities and settlements” (GREENSETTLE) ENPI CBC project
financed by the European Union, the Russian Federation and the Republic of Finland. This report
proposes how to develop a municipal solid waste management strategy for the city of Kostomuksha in the
Republic of Karelia, Russian Federation.
BACKGROUND PART At the moment, landfilling is the only option for treating the MSW in Kostomuksha, so the planning needs
to start from the very basic level, by establishing the collection point system for recoverables. (For the
description of the city of Kostomuksha, see Chamilos 2011)
STATUS PHASE
EXISTING SITUATION The population of the city of Kostomuksha is estimated to be 30 000 persons. The number of inhabitants
has been quite stable during the 30 years the city has existed. The amount of MSW produced in
Kostomuksha is 10 960 tonnes annually, which makes 365 kg per person. (Potapova 2012) The amount of
municipal solid waste produced in the Russian Federation is estimated to be 440 kg per person annually
so the amount of waste produced in Kostomuksha is less than the average in Russia (OECD 2011).
There is no recycling or recovery of MSW in Kostomuksha at the moment and the composition of waste
has not been studied. According to Chamilos (2011), private entrepreneurs take care of waste collection
and separating some of the paper and other valuables. Chamilos proposed the separation of bio-waste
from MSW in Kostomuksha, since it would help the recovery of ‘dry’ recyclables. After successful bio-
waste separation and data collection about waste composition, it is easier to find the recipient facility and
to establish collection system for other recoverables as well. Since there is no data about the composition
yet, only estimations can be used.
4
EVOLUTION OF MUNICIPAL WASTE MANAGEMENT IN FINLAND
ESTIMATING MSW AMOUNTS IN THE FUTURE The composition of the Russian MSW is a bit different than in Europe and it was estimated according to
the statistics found in the literature. The most reliable estimate was found from the presentation of
Loseva (2007) since it is based on the studied MSW in the waste center of St. Petersburg. Composition
and daily amount of different waste fractions were calculated using the estimated 365 kg per person
waste amount and the waste percentages of Loseva (2007) (table 1).
TABLE 1 ESTIMATES OF THE AMOUNTS OF DIFFERENT FRACTIONS OF MSW IN KOSTOMUKSHA. (PERCENTAGES ARE FROM LOSEVA 2007, MSW AMOUNT
FROM POTAPOVA 2012)
Amount of MSW per inhabitant Percentage kg/year
Paper and cardboard 20 % 73
Bio-waste (food) 18 % 65,7
Plastic 12 % 43,8
Ferrous metals 4 % 14,6
Non-ferrous metals 1 % 3,65
Glass 10 % 36,5
Stones, bones, ceramics 9 % 32,85
Leather, rubber 1 % 3,65
Wood 4 % 14,6
Textile 5 % 18,25
Garden waste 1 % 3,65
Waste from treatment 10 % 36,5
Other 5 % 18,25
Total 100 % 365
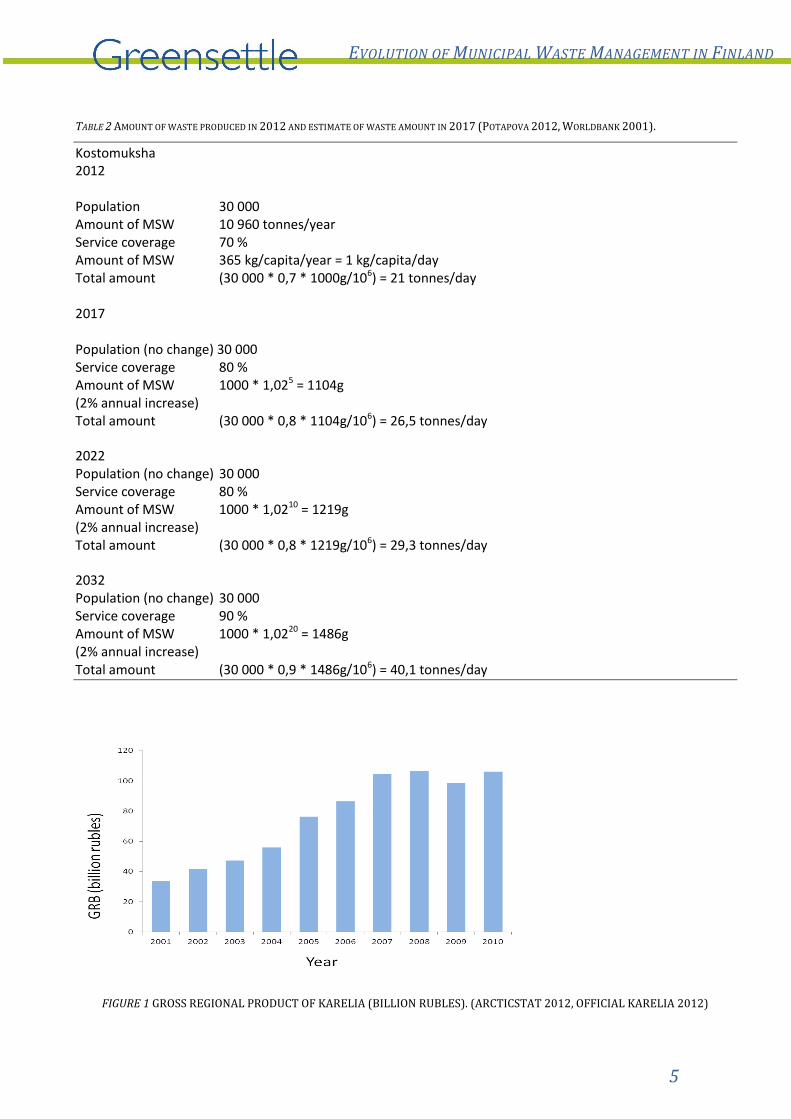
Future amounts of wastes after five, ten and twenty years were calculated (table 2) based on the
information about Kostomuksha from Potapova (2012) and by using the equation from the MSWM guide
from Worldbank (2001). The population was estimated to be 30 000 both from 2012 to 2032, since the
number of inhabitants is not fluctuating strongly. The current amount of MSW is 10 960 tonnes/year. It is
estimated to be increasing since the economy, which is one factor affecting the amount of goods and
waste produced, of the Karelian area is not regressing as the GRB is not declining but rather rising or at
least staying quite stable (figure 1). It is estimated that the amount of waste is increasing 2 % per year for
the whole twenty year period. The present service coverage in Kostomuksha is not known but it is
estimated to be 70 % in 2012 and increasing to 90 % in 2032.
5
EVOLUTION OF MUNICIPAL WASTE MANAGEMENT IN FINLAND
TABLE 2 AMOUNT OF WASTE PRODUCED IN 2012 AND ESTIMATE OF WASTE AMOUNT IN 2017 (POTAPOVA 2012, WORLDBANK 2001).
Kostomuksha 2012 Population 30 000 Amount of MSW 10 960 tonnes/year Service coverage 70 % Amount of MSW 365 kg/capita/year = 1 kg/capita/day Total amount (30 000 * 0,7 * 1000g/106) = 21 tonnes/day 2017 Population (no change) 30 000 Service coverage 80 % Amount of MSW 1000 * 1,025 = 1104g (2% annual increase) Total amount (30 000 * 0,8 * 1104g/106) = 26,5 tonnes/day 2022 Population (no change) 30 000 Service coverage 80 % Amount of MSW 1000 * 1,0210 = 1219g (2% annual increase) Total amount (30 000 * 0,8 * 1219g/106) = 29,3 tonnes/day 2032 Population (no change) 30 000 Service coverage 90 % Amount of MSW 1000 * 1,0220 = 1486g (2% annual increase) Total amount (30 000 * 0,9 * 1486g/106) = 40,1 tonnes/day
FIGURE 1 GROSS REGIONAL PRODUCT OF KARELIA (BILLION RUBLES). (ARCTICSTAT 2012, OFFICIAL KARELIA 2012)
6
EVOLUTION OF MUNICIPAL WASTE MANAGEMENT IN FINLAND
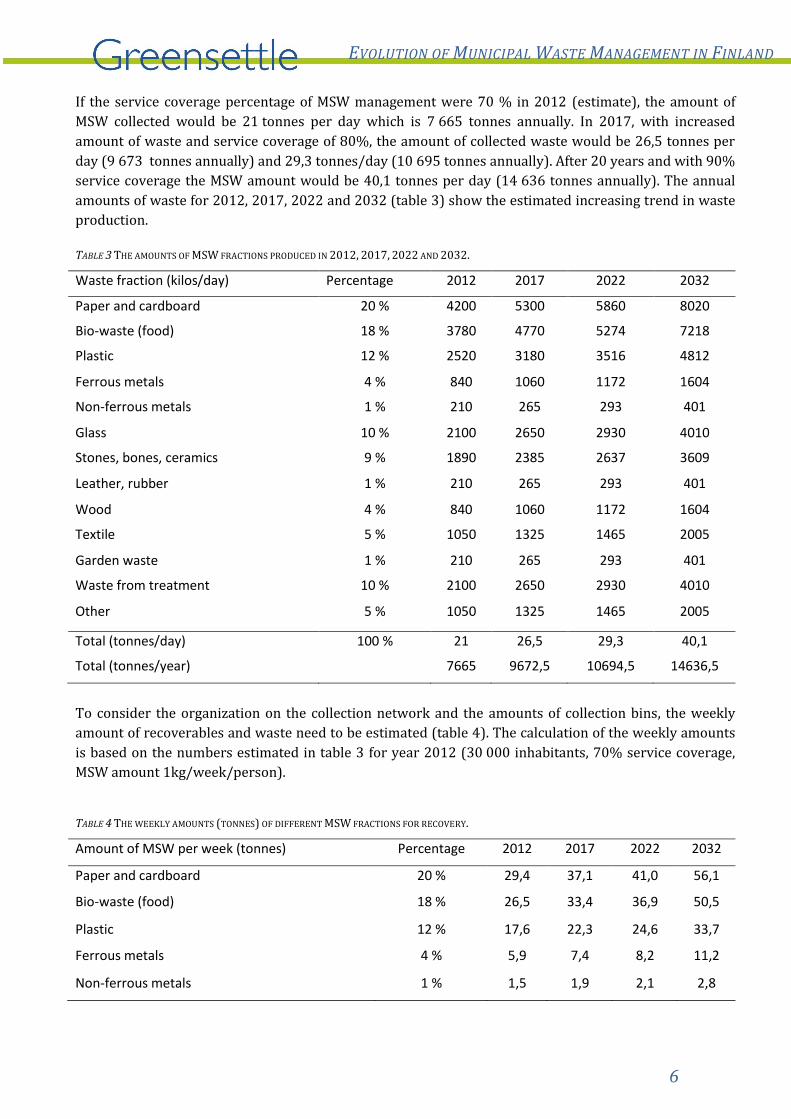
If the service coverage percentage of MSW management were 70 % in 2012 (estimate), the amount of
MSW collected would be 21 tonnes per day which is 7 665 tonnes annually. In 2017, with increased
amount of waste and service coverage of 80%, the amount of collected waste would be 26,5 tonnes per
day (9 673 tonnes annually) and 29,3 tonnes/day (10 695 tonnes annually). After 20 years and with 90%
service coverage the MSW amount would be 40,1 tonnes per day (14 636 tonnes annually). The annual
amounts of waste for 2012, 2017, 2022 and 2032 (table 3) show the estimated increasing trend in waste
production.
TABLE 3 THE AMOUNTS OF MSW FRACTIONS PRODUCED IN 2012, 2017, 2022 AND 2032.
Waste fraction (kilos/day) Percentage 2012 2017 2022 2032
Paper and cardboard 20 % 4200 5300 5860 8020
Bio-waste (food) 18 % 3780 4770 5274 7218
Plastic 12 % 2520 3180 3516 4812
Ferrous metals 4 % 840 1060 1172 1604
Non-ferrous metals 1 % 210 265 293 401
Glass 10 % 2100 2650 2930 4010
Stones, bones, ceramics 9 % 1890 2385 2637 3609
Leather, rubber 1 % 210 265 293 401
Wood 4 % 840 1060 1172 1604
Textile 5 % 1050 1325 1465 2005
Garden waste 1 % 210 265 293 401
Waste from treatment 10 % 2100 2650 2930 4010
Other 5 % 1050 1325 1465 2005
Total (tonnes/day) 100 % 21 26,5 29,3 40,1
Total (tonnes/year) 7665 9672,5 10694,5 14636,5
To consider the organization on the collection network and the amounts of collection bins, the weekly
amount of recoverables and waste need to be estimated (table 4). The calculation of the weekly amounts
is based on the numbers estimated in table 3 for year 2012 (30 000 inhabitants, 70% service coverage,
MSW amount 1kg/week/person).
TABLE 4 THE WEEKLY AMOUNTS (TONNES) OF DIFFERENT MSW FRACTIONS FOR RECOVERY.
Amount of MSW per week (tonnes) Percentage 2012 2017 2022 2032
Paper and cardboard 20 % 29,4 37,1 41,0 56,1
Bio-waste (food) 18 % 26,5 33,4 36,9 50,5
Plastic 12 % 17,6 22,3 24,6 33,7
Ferrous metals 4 % 5,9 7,4 8,2 11,2
Non-ferrous metals 1 % 1,5 1,9 2,1 2,8
7
EVOLUTION OF MUNICIPAL WASTE MANAGEMENT IN FINLAND
Glass 10 % 14,7 18,6 20,5 28,1
Stones, bones, ceramics 9 % 13,2 16,7 18,5 25,3
Leather, rubber 1 % 1,5 1,9 2,1 2,8
Wood 4 % 5,9 7,4 8,2 11,2
Textile 5 % 7,4 9,3 10,3 14,0
Garden waste 1 % 1,5 1,9 2,1 2,8
Waste from treatment 10 % 14,7 18,6 20,5 28,1
Other 5 % 7,4 9,3 10,3 14,0
Total (tonnes) 100 % 147 185,5 205,1 280,7
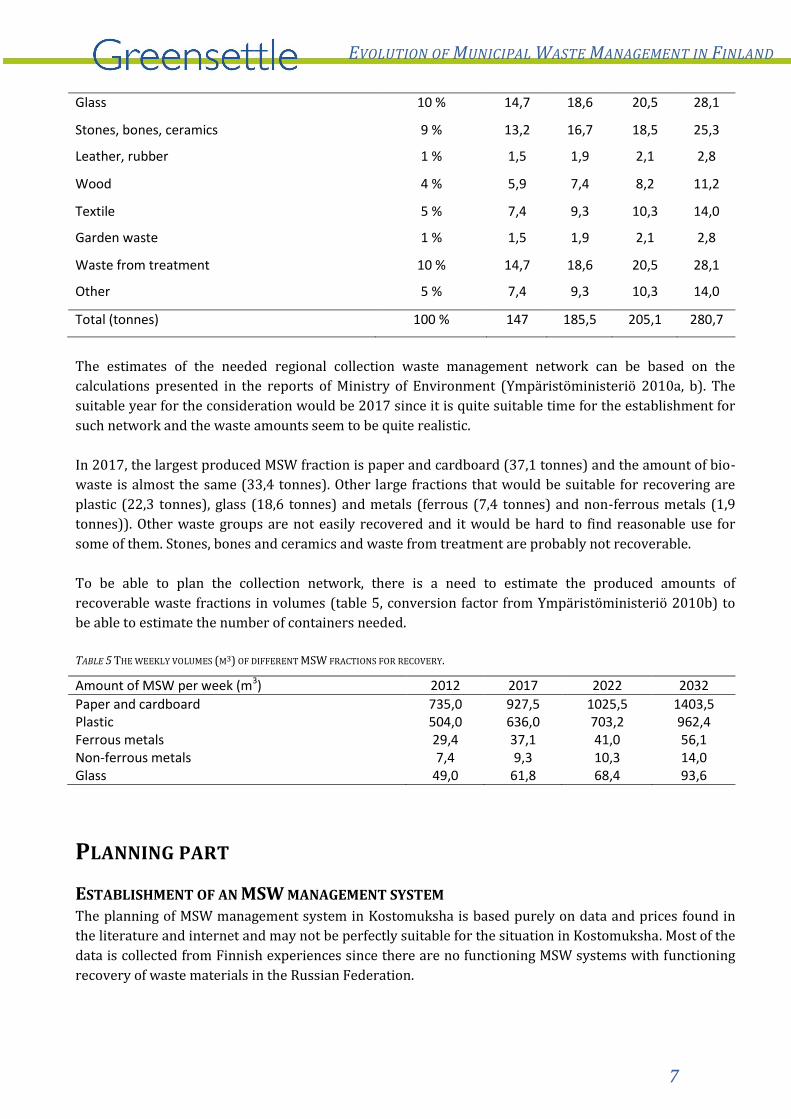
The estimates of the needed regional collection waste management network can be based on the
calculations presented in the reports of Ministry of Environment (Ympäristöministeriö 2010a, b). The
suitable year for the consideration would be 2017 since it is quite suitable time for the establishment for
such network and the waste amounts seem to be quite realistic.
In 2017, the largest produced MSW fraction is paper and cardboard (37,1 tonnes) and the amount of bio-
waste is almost the same (33,4 tonnes). Other large fractions that would be suitable for recovering are
plastic (22,3 tonnes), glass (18,6 tonnes) and metals (ferrous (7,4 tonnes) and non-ferrous metals (1,9
tonnes)). Other waste groups are not easily recovered and it would be hard to find reasonable use for
some of them. Stones, bones and ceramics and waste from treatment are probably not recoverable.
To be able to plan the collection network, there is a need to estimate the produced amounts of
recoverable waste fractions in volumes (table 5, conversion factor from Ympäristöministeriö 2010b) to
be able to estimate the number of containers needed.
TABLE 5 THE WEEKLY VOLUMES (M3) OF DIFFERENT MSW FRACTIONS FOR RECOVERY.
Amount of MSW per week (m3) 2012 2017 2022 2032
Paper and cardboard 735,0 927,5 1025,5 1403,5 Plastic 504,0 636,0 703,2 962,4 Ferrous metals 29,4 37,1 41,0 56,1 Non-ferrous metals 7,4 9,3 10,3 14,0 Glass 49,0 61,8 68,4 93,6
PLANNING PART
ESTABLISHMENT OF AN MSW MANAGEMENT SYSTEM The planning of MSW management system in Kostomuksha is based purely on data and prices found in
the literature and internet and may not be perfectly suitable for the situation in Kostomuksha. Most of the
data is collected from Finnish experiences since there are no functioning MSW systems with functioning
recovery of waste materials in the Russian Federation.
8
EVOLUTION OF MUNICIPAL WASTE MANAGEMENT IN FINLAND
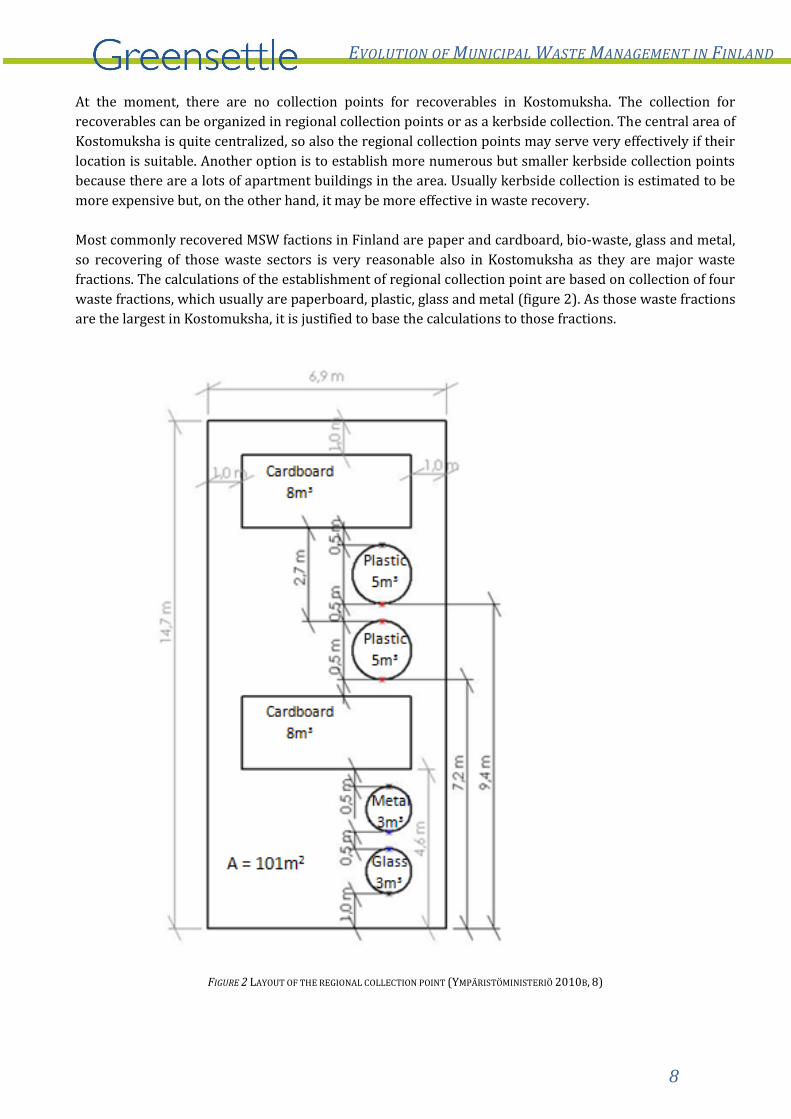
At the moment, there are no collection points for recoverables in Kostomuksha. The collection for
recoverables can be organized in regional collection points or as a kerbside collection. The central area of
Kostomuksha is quite centralized, so also the regional collection points may serve very effectively if their
location is suitable. Another option is to establish more numerous but smaller kerbside collection points
because there are a lots of apartment buildings in the area. Usually kerbside collection is estimated to be
more expensive but, on the other hand, it may be more effective in waste recovery.
Most commonly recovered MSW factions in Finland are paper and cardboard, bio-waste, glass and metal,
so recovering of those waste sectors is very reasonable also in Kostomuksha as they are major waste
fractions. The calculations of the establishment of regional collection point are based on collection of four
waste fractions, which usually are paperboard, plastic, glass and metal (figure 2). As those waste fractions
are the largest in Kostomuksha, it is justified to base the calculations to those fractions.
FIGURE 2 LAYOUT OF THE REGIONAL COLLECTION POINT (YMPÄRISTÖMINISTERIÖ 2010B, 8)

9
EVOLUTION OF MUNICIPAL WASTE MANAGEMENT IN FINLAND
It is not very realistic to assume that people would take the bio-waste to centralized collection points
because of its moist texture and odor problems, therefore, bio-waste collection is best establish as a
kerbside collection. The number of the needed containers depends on the number of emptying times and
also the number of collection points that is possible to establish in Kostomuksha. If the containers are
surface containers, the collection points are quite easy to establish and move, if necessary. In addition,
purchasing surface containers is more economical than the buying deep collection containers not to
mentioned the special collection vehicle needed for their emptying. The volume of the surface containers
usually is smaller than in deep collection containers so they need to be emptied more often.
After the recoverables have been collected from regional collection points or from kerbside collection,
they need to be taken to the transfer stations if there are no utilization possibilities near the city of
Kostomuksha. It would be reasonable to establish some kind of aerobic composter or anaerobic digester
near Kostomuksha, since the weekly amounts of collected bio-waste is 33,4 tonnes in 2017. Paper,
cardboard and plastic are valuable materials for recycling but if that is not possible in the area, it would
be reasonable to use it for energy recovery. If that is not possible either, the recycling should be
centralized to a more densely populated area. In this plan, it is suggested that the utilization of
recoverables is considers in the industries of the city of Petrozavodsk. Also building of a transfer station
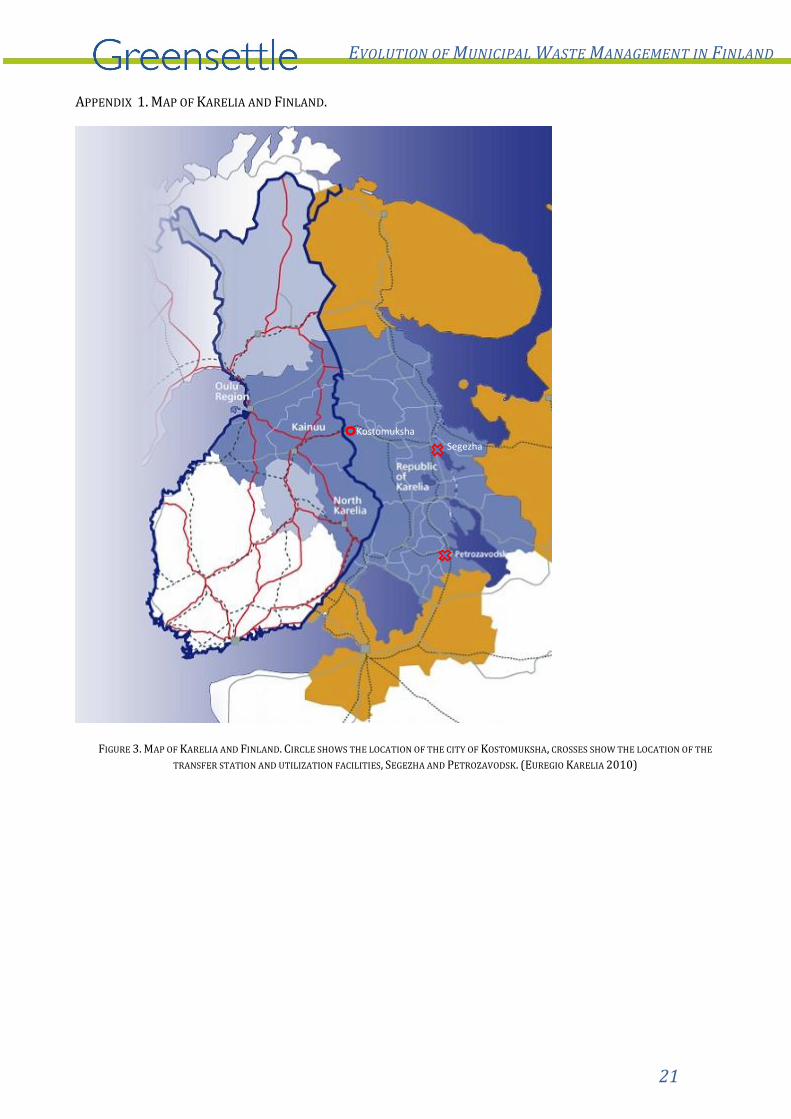
near Segezha, would be sensible considering transport logistics (see map in figure 3, appendix 1).
SCENARIOS FOR THE ESTABLISHMENT OF MSWM SYSTEM IN KOSTOMUKSHA There are five different Scenarios considered with different presumptions (table 6). Scenario 1 is based
on the idea that all the possible recoverables presented in table 3 (Loseva 2007) will be collected and
utilized as material or as energy. The amount of landfilled MSW is then quite small. Scenario 2 is based on
the assumption that the collection is not very effective right from the beginning and the amount of
collected recoverables is only half of the possible amount presented in Scenario 1. Hence, the number of
collection points are smaller and the amount of landfilled MSW bigger. Scenario 3 is based on figures
presented in the report of Ympäristöministeriö (2010b) which was used in Finland when calculating the
amount of recoverables when establishing collection points. As the amounts of collected recoverables are
quite small, the amount of landfilled MSW is high. Scenario 4 is based on the experiences in Arkhangelsk
where there was the separate waste collection experiment in 2005 (Koivisto 2006). These values may be
comparable to the situation in Kostomuksha when the differences in population are taken into account.
Scenario 5 considers that all waste is landfilled in 2017, which is the situation of the baseline. The
calculations in the Scenarios based on the data from Kostomuksha, found in literature and gathered from
other sources are presented in appendix 2 (tables 7 and 8).
TABLE 6 SCENARIOS FOR KOSTOMUKSHA.
Scenario 1 Scenario 2 Scenario 3 Scenario 4 Scenario 5
Based on Maximum recover (table 3, Loseva 2007)
Half of maximum recover (table 3, Loseva 2007)
Finnish experiences (Ympäristö-ministeriö 2010b)
Russian experiences (Koivisto 2006)
No recovering, (existing system in 2012)
Amount of collected recoverables
High Moderate Low Low None
Amount of landfilled waste
Low Moderate High High All
10
EVOLUTION OF MUNICIPAL WASTE MANAGEMENT IN FINLAND
THE CURRENT SITUATION The current situation of MSW management system in Kostomuksha is that nothing is recovered. The
prices of the mixed waste containers are not estimated since there already are containers for mixed
waste. The amount of generated MSW is 10 960 tonnes (132kg/m3, Lahdelma 2002, 20) which is 83 030
cubic meters. The treating of landfilled waste in the existing system is estimated to cost about 317 840
euros annually and, similarly, transportation costs make up to 657 600 euros annually. The estimation of
existing amounts of containers is 2 661. The costs of maintaining the containers would be 26 610 euros
altogether/year. The estimates of annual costs are then 1 002 050 euros for the existing system.
SCENARIO 1 (MAXIMUM RECOVERY) Scenario 1 is based on the maximum waste amounts that were calculated in table 3 for the year 2017. In
that case there will be 30 000 inhabitants, 80% service coverage and generated MSW amount
1104g/week/person and all the inhabitants would recover all the possible waste fractions. The weekly
volumes of recoverables are then paper and cardboard 927,5 m3, plastic 636 m3, metals (both ferrous and
non-ferrous) 46,4 m3 and glass 61,8 m3 (based on data from Loseva 2007 and Potapova 2012).
Regional collection points of the recoverables
Establishment costs would be about 254 000 euros for 20 collection points. The annual costs for the
emptying and transportation are 327 600 euros and maintaining costs would then be 7 200 euros per
year. The annual costs would then be 334 800 euros altogether.
Kerbside collection of the recoverables
As the paper and cardboard are the largest fraction and it would be emptied once per day, the number of
containers needed would be 133. Other containers would be emptied more rarely. The final sum of the
establishing of the system would be 150 450 euros. The pure emptying costs would be 606 879 euros and
annual maintaining cost is 5 320 euros which makes annual costs to be 612 199 euros.
Transfer costs of the recoverables
If all the recoverables were used as material, the total annual costs of transfer of recoverables would be
222 021 euros. If all the combustible recoverables were used for the energy production and only metal
and glass for material use, the price would be different. Transportation costs of combustible materials
would be 185 280 euros annually. The metal and glass would be used as material with transfer price for
metal 28 384 euros and for glass 56 768 euros.
Bio-waste collection
The number of the bio-waste containers would be reasonable to be the same than of containers for other
recoverables (133) and they could be emptied four times per week. The total costs of purchasing bio-
waste containers could be 9 031 euros. The total cost of collection and transportation of the bio-waste
would be 104 220 euros and the treatment of one tonne of bio-waste in the small-scale composting plant
makes 173 700 euros annually. Annual costs of the maintaining the system and collecting, transporting
and treating the bio-waste are 279 250 euros. The profit from the selling of compost is 5 790 euros.
If the produced biomass will be treated anaerobically for the production of biogas, the cost for the
treatment of one tonne of bio-waste in small-scale anaerobic digester would be 26 055 euros annually.
The amount of biogas would be 451 620 KWh and the value of produced electricity is 15 355 euros and
the selling price of the produced compost makes 5 790 euros.
11
EVOLUTION OF MUNICIPAL WASTE MANAGEMENT IN FINLAND
The selling price of the recoverables
The total selling price for all the collected recoverables for material use would be 731 962 euros. The
selling price of metal would be 158 752 euro and of glass 46 416 euros in energy use option.
The price of the landfilling
If all the recoverables were collected separately, the amount of landfilled waste would decrease
drastically. The only landfilled waste sectors would be wood, textile, garden waste, waste from treatment,
leather, rubber, stones, bones and ceramics. The amount of landfilled waste would be 4 450 tonnes
(33 712 m3) annually instead of prevailing 10 960 tonnes. Annual costs of the landfilling of the mixed
waste would be 406 850 euros altogether.
As the service coverage in this Scenario is 80 %, 20% of MSW is not collected by this system. It should be
collected as other mixed waste costing 145 080 and treat as landfilled waste which would cost 70 122
euros. Annual maintaining costs would be 5 870, which makes the total annual costs 221 072 (table 9).
TABLE 9 CONCLUSIONS OF THE SCENARIO 9.
Establishment costs of the 20 regional collection points for recoverables 254 000 euros
or
Establishment costs of the 133 kerbside collection points for recoverables 150 450 euros
Establishment costs of bio-waste collection system 9 031 euros
Establishment costs of mixed waste collection system Already existing
Annual costs of the 20 regional collection points 334 800 euros
or
Annual costs of the 133 kerbside collection points for recoverables 612 199 euros
Annual costs of the bio-waste management system (aerobic) 279 250 euros
or
Annual costs of the bio-waste management system (anaerobic) 131 605 euros
Annual costs of the mixed waste collection system 627 922 euros
Transfer costs of the recoverables in the material use option 222 021 euros
or
Transfer costs of the combustible recoverables to the energy use locally 185 280 euros
and
Transfer costs of the metal and glass to be used as material 85 152 euros
The selling price of the recoverables in the material use option 731 962 euros
The selling price of the compost (in biomass composting) 5 790 euros
or
The selling price of the electricity and compost from anaerobic digestion 21 145 euros
SCENARIO 2 (PARTIAL RECOVERY) Scenario 2 is based on the partial collection of all the recoverables. The justification for this Scenario is,
that it can be easily seen from the history of Finland that the recovering system cannot be established
12
EVOLUTION OF MUNICIPAL WASTE MANAGEMENT IN FINLAND
overnight. It would be good achievement to be able to collect half of the recoverables based on the same
assumptions than in Scenario 1 (year 2017, 30 000 inhabitants, 80% service coverage and generated
MSW amount 1104g/week/person) but all the inhabitants would recover half of the possible waste
fractions. The weekly amount of recovered paper and cardboard would be 18,6 tonnes (464 m3), the
amount of bio-waste 16,7 tonnes (56 m3), plastic 11,2 tonnes (318 m3), glass 9,3 tonnes (30,9 m3) and
metals 4,7 tonnes (23,2 m3). The regional collection point for this Scenario would be the same than in
figure 2. Almost all the costs and benefits would be half of those in Scenario 1.
The biggest difference between the Scenario 1 and 2 would be that if only the half of all the recoverables
were collected separately, the amount of landfilled waste would decrease, but not so much than in
Scenario 1. The landfilled waste sectors would be half of all the recoverable and also wood, textile, garden
waste, waste from treatment, leather, rubber, stones, bones and ceramics. The amount of landfilled waste
would be 7 705 tonnes (58 371 m3) annually compared to the 4 450 tonnes in Scenario 1 and 10 960
tonnes in the prevailing situation.
In the Scenario 2, the costs of landfilling would be higher than half of the costs in the Scenario one. In that
case there is need for 1 870 mixed waste containers emptied once a week. The maintaining costs 18 700
euros and collection and transportation costs 462 300 are euros annually. The price for the landfilled
MSW tonne makes 223 445 euros altogether. Hence the annual price for landfilled MSW would be 704
445 euros.
In addition, as the service coverage in this Scenario is also 80 %, 20% of MSW is not collected by this
system. It should be collected as other mixed waste costing 145 080 and treat as landfilled waste which
would cost 70 122 euros. Annual maintaining costs would be 5 870 which makes 221 072 altogether
(table 10).
TABLE 10 CONCLUSIONS OF THE SCENARIO 2.
Establishment costs of the 10 regional collection points for recoverables 127 000 euros
or
Establishment costs of the 67 kerbside collection points for recoverables 75 225 euros
Establishment costs of bio-waste collection system 4 515 euros
Establishment costs of mixed waste collection system Already existing
Annual costs of the 10 regional collection points 167 400 euros
or
Annual costs of the 67 kerbside collection points for recoverables 306 100 euros
Annual costs of the bio-waste management system (aerobic) 139 625 euros
or
Annual costs of the bio-waste management system (anaerobic) 65 803 euros
Annual costs of the mixed waste collection system 925 517 euros
Transfer costs of the recoverables in the material use option 111 011 euros
or
Transfer costs of the combustible recoverables to the energy use locally 92 640 euros
and
Transfer costs of the metal and glass to be used as material 42 576 euros
13
EVOLUTION OF MUNICIPAL WASTE MANAGEMENT IN FINLAND
The selling price of the recoverables in the material use option 365 981 euros
The selling price of the compost (in biomass composting) 2 895 euros
or
The selling price of the electricity and compost from anaerobic digestion 10 573 euros
SCENARIO 3 (EXPERIENCES IN FINLAND) The Scenario 3 is based on figures in the report of the Ministry of Environment (2010b) and the
population of Kostomuksha (30 000 inhabitants). In that report the data from various waste management
companies are used when the new collection point system is planned so that data may be useful for
Kostomuksha as well. The annual amounts of collected recoverables in that report were 5,6
kg/person/year for cardboard, 0,35 kg/person/year for plastic, 0,23 kg/person/year for metal and 1,8
kg/person/year for glass. The annual amounts of these waste sectors for 30 000 inhabitants would then
be 168 tonnes of cardboard and paper, 10,5 tonnes of plastic, 6,9 tonnes of metal and 54 tonnes of glass.
The weekly amounts would be about 3,2 tonnes of cardboard, 0,2 tonnes of plastic, 0,13 tonnes of metal
and one tonne of glass. In volumes they would be 80 m3 of cardboard, 5,7 m3 of plastic, 0,65 m3 of metal
and 3,3 m3 of glass.
Regional collection points of the recoverables
As the volumes are remarkably lower than in Scenarios 1 and 2, the number of regional collection points
and emptying times needed are much lower than in the earlier Scenarios. The establishment and annual
costs of the two regional collection points would be one tenth of the costs in Scenario 1 but the emptying
costs would be different, 14 600 euros. The annual costs of maintaining would be 720 euros. The annual
costs of two collection points would be 15 320 euros.
Kerbside collection points of the recoverables
The establishment of the kerbside collection system could be based on 10 kerbside collection points and
establishment costs would be 11 312 euros. The emptying of the containers would cost 27 430 euros and
maintaining costs would be 400 euros. Total annual costs of the kerbside collection would then be 27 830
euros.
Transfer costs of recoverables
As the amounts of the recoverable are low, there won’t be many annual transfer trips. The annual
transportation costs to Segezha and back would then be about and from there to Petrozavodsk and back
14 032 euros. These costs most probably would be lower since it is not reasonable to drive without full
loads but combine the recoverables from other cities to the same vehicle. If all the combustible material
will be incinerated, the transfer costs of glass and metal to material use is 6 239 euros and the
transportation costs of combustible material to be incinerated locally 10 710 euros annually.
The selling price of the recoverables
The annual selling price of the recoverables would be 25 655,7 euros altogether in material use option.
The annual selling price of the recoverables would in energy use option would be 2263,2 for metal and
2 592 euros for glass.
14
EVOLUTION OF MUNICIPAL WASTE MANAGEMENT IN FINLAND
Bio-waste collection
The amount of collected bio-waste in Scenario 3 is not based on any Finnish experiments but is set in
scale with the amount of other collected recoverables this Scenario being about one tenth of the bio-
waste in Scenario 1 and the number of collection points about 13. All the costs and benefits of collecting,
managing and treating of the bio-waste would be about one tenth of the Scenario 1.
The price of the landfilling
The amount of mixed waste is high in this Scenario being 11 678 tonnes (88 469m3). The transportation
costs would be 700 674 euros and the treating of the mixed waste 338 659 euros. The maintaining costs
would be 28 360 euros. The total annual costs of the mixed waste is then 1 067 693 euros (table 11).
TABLE 11 CONCLUSIONS OF THE SCENARIO 3.
Establishment costs of the 2 regional collection points for recoverables 25 400 euros
or
Establishment costs of the 10 kerbside collection points for recoverables 11 312 euros
Establishment costs of bio-waste collection system 903 euros
Establishment costs of mixed waste collection system Already existing
Annual costs of the 2 regional collection points 15 320 euros
or
Annual costs of the 10 kerbside collection points for recoverables 27 830 euros
Annual costs of the bio-waste management system (aerobic) 27 925 euros
or
Annual costs of the bio-waste management system (anaerobic) 13 161 euros
Annual costs of the mixed waste collection system 1 067 693 euros
Transfer costs of the recoverables in the material use option 14 032 euros
or
Transfer costs of the combustible recoverables to the energy use locally 10 710 euros
and
Transfer costs of the metal and glass to be used as material 6 239 euros
The selling price of the recoverables in the material use option 25 656 euros
The selling price of the compost (in biomass composting) 579 euros
or
The selling price of the electricity and compost from anaerobic digestion 2 115 euros
SCENARIO 4 (EXPERIENCES IN ARKHANGELSK) Scenario 4 is based on the experiences of the pilot source separation and collection experiments carried
out in Arkhangelsk in 2005 (Koivisto 2006). In the experiment, the collection points for paper and
cardboard and for plastic and glass bottles and metal cans were established for the trial time of two
months. The collection area was the area of Varavino with about 11 000 inhabitants. There were 18
containers for paper and cardboard and 13 containers for bottles and cans near the existing waste
collection points. The containers for paper and cardboard were emptied every other day and the
containers for bottles and cans every tenth day. (Koivisto 2006)
15
EVOLUTION OF MUNICIPAL WASTE MANAGEMENT IN FINLAND
The collected amount of paper and cardboard in this experiment was 0,0197 m3 per inhabitant in two
months which makes 0,1182 m3 annually. If the whole Kostomuksha (30 000 inhabitants) would collect
the same amount of paper and cardboard, it would make 3 546 m3 (142 tonnes) annually and 68 m3 (2,72
tonnes) weekly. The amount of paper in that fraction was only 40 %, which is 27,3 m3 weekly. The
collected amount of bottles and cans were 0,53 kg/inhabitant in two month. The volume of collected
plastic bottles were 28 m3, of glass bottles 11,9 m3 and of aluminum cans 7,6 m3 in two months which
makes 168 m3 of plastic, 71, 4 m3 of glass and 45, 6 m3 metal in one year for 11 000 inhabitants. When
calculated for 30 000 inhabitants in Kostomuksha, the annual amounts would be 458 m3 (16 tonnes)
plastic, 195 m3 (58,5 tonnes) glass and 124 m3 (24,8 tonnes) metal which are 8,81 m3 (0,31 tonnes)
plastic, 3,75 m3 (1,13 tonnes) glass and 2,38 m3 (0,476 tonnes) metal per week. The amounts of
recoverables are then quite similar than in Scenario 3 but much lower than in two first Scenarios.
Regional collection points of the recoverables
When thinking of regional collection points, the volumes of recoverables are not big in the Scenario 4.
Two regional collection points would be enough but the emptying times would be different than in the
Scenario 3. The emptying and transporting costs would be 16 380 euros and the annual costs of
maintaining would be 720 euros. The annual costs of two regional collection points would be 17 100
euros.
Kerbside collection points of the recoverables
The establishment of the kerbside collection system could be based on 10 kerbside collection points. The
establishment costs of the containers would be 11 312 euros. The emptying of the containers would be 32
110 euros. The maintaining costs would be 400 euros. Total annual costs of the kerbside collection would
then be 32 510 euros.
Transfer costs of recoverables
The amounts of the recoverables and transfers are low and almost similar than in Scenario 3. The annual
transportation costs to Segezha and back would then be about 13 175 euros. By combining the
transportations, these costs most probably would be lower. If all the combustible material will be
incinerated, the transfer costs of glass and metal to material use is 6 239 euros and the transportation
costs of combustible material to be incinerated locally 9 480 euros annually.
The selling price of the recoverables
The annual selling price of the recoverables for material use would be 23 440 euros altogether. The
annual selling price of the recoverables in energy use option would be 8 134 euros for metal and 2 808
euros for glass.
Bio-waste collection
As there was no collection of bio-waste in Arkhangelsk there are no estimates for bio-waste collection.
The collectable amount on bio-waste is set in scale with the amount of other collected recoverable in this
Scenario as well, being same than in Scenario 3.
The price of the landfilling
The amount of mixed waste is high in this Scenario being 11 676 tonnes (88 455 m3). The transportation
costs would be 700 560 euros and the treating of the mixed waste 338 604 euros. The maintaining costs
are 28 350 euros. The total annual costs of the mixed waste in Scenario 4 is then 1 067 514 euros (table
12).
16
EVOLUTION OF MUNICIPAL WASTE MANAGEMENT IN FINLAND
TABLE 12 CONCLUSIONS OF THE SCENARIO 4.
Establishment costs of the 2 regional collection points for recoverables 25 400 euros
or
Establishment costs of the 10 kerbside collection points for recoverables 11 312 euros
Establishment costs of bio-waste collection system 903 euros
Establishment costs of mixed waste collection system Already existing
Annual costs of the 2 regional collection points 17 100 euros
or
Annual costs of the kerbside collection points for recoverables 32 510 euros
Annual costs of the bio-waste management system (aerobic) 27 925 euros
or
Annual costs of the bio-waste management system (anaerobic) 13 161 euros
Annual costs of the mixed waste collection system 1 067 514 euros
Transfer costs of the recoverables in the material use option 13 175 euros
or
Transfer costs of the combustible recoverables to the energy use locally 9 480 euros
and
Transfer costs of the metal and glass to be used as material 6 224 euros
The selling price of the recoverables in the material use option 23 440 euros
The selling price of the compost (in biomass composting) 579 euros
or
The selling price of the electricity and compost from anaerobic digestion 2 115 euros
SCENARIO 5 (NO RECOVERY AT ALL) In Scenario 5, the situation would be the same than in 2012 without any recovery. As there would be no
establishment costs, all the waste management costs would be from the emptying of the containers,
transportation and treating of waste. In addition there would be the maintenance costs of containers. The
annual costs of landfilling 12 091 tonnes of wastes would then be 1 105 459 euros (table 13).
TABLE 13 CONCLUSIONS OF THE SCENARIO 5.
Establishment costs of mixed waste collection system Already existing
Annual costs of the mixed waste collection system 1 105 459 euros
SUMMARY OF THE SCENARIOS Establishment and annual costs of the collection systems
The establishment costs of collection system for recoverables naturally differ depending on the amount of
recoverable waste, number of collection points and containers needed for the system varying from zero
to 20 in different Scenarios. The establishment of the regional collection point seems to be more
expensive option (on average double the price) compared to the kerbside collection point. The reason for
that may be the fact that it needs bigger and more expensive containers with good foundation and better
17
EVOLUTION OF MUNICIPAL WASTE MANAGEMENT IN FINLAND
planning of the location of the space-demanding point. The kerbside collection point can be easily
established by using smaller containers next to existing mixed waste containers. The price for mixed
waste containers was not estimated since they already exist.
The annual costs of regional collection points are lower than in kerbside collection points, since the
emptying times are lower. In Scenarios 3 and 4, the number of regional points was only two which is not
ideal when thinking of the rational use (location, distance from households) of the collection points.
Therefore the location of collection points needs to be considered carefully. There is possibility to
establish several regional collection points and empty them more rarely, only when needed. This
situation is not analyzed in any Scenarios. The bio-waste collection is always kerbside collection due to
the moist content of the bio-waste. Bio-waste containers are usually emptied four times per week.
The annual costs of different waste fractions vary markedly depending on the type and the amount of
waste. When considering the treatment of the bio-waste, the price of the anaerobic digestion is
remarkably lower that the composting of the same amount of the bio-waste, even without the selling of
the produced biogas. Annual costs of transfer to the transfer station or utilization facilities does not seem
to cause huge costs, since it is done with larger vehicles, it lowers the landfilling costs and also the local
transportation to the landfill. In annual costs in can be clearly seen, that the local transportation costs are
strongly affecting the price of waste management. It is really hard to estimate the real transportation
costs of recoverables from collection points to e.g. local storage, since there are no any estimates but the
price of the collection of mixed waste for that use. The transfer costs are more easily calculated but they
are based on Finnish experiences, not on Russian ones.
Total annual costs of MSW system
The estimated total annual costs of waste management systems with cheapest management options
(regional collection system for dry recoverables, kerbside bio-waste collection and treatment by using
anaerobic digestion and material use of other recoverables) are seen in table 14. Incomes consist of
selling the recoverables and compost and biogas from the digester.
TABLE 14 ANNUAL COSTS OF EXISTING SYSTEM AND IN DIFFERENT SCENARIOS (KERBSIDE BIO-WASTE COLLECTION AND ANAEROBIC TREATMENT; REGIONAL
COLLECTION AND MATERIAL USE FOR OTHER RECOVERABLES)
Establishment costs of collection systems for all
recoverables (euros)
Annual costs without incomes from all
recoverables (euros)
Annual costs with incomes from all
recoverables (euros)
Existing system 1 002 050
Scenario 1 263 031 1 316 348 563 241
Scenario 2 131 515 1 269 731 893 177
Scenario 3 26 303 1 110 206 1 083 971
Scenario 4 26 303 1 110 950 1 086 931
Scenario 5 1 105 459
When comparing the existing system with the Scenario 5 (no recovering at all in both systems) it can be
seen that the waste management will be more expensive after five years due to the increased amount of
MSW generated.
18
EVOLUTION OF MUNICIPAL WASTE MANAGEMENT IN FINLAND
Selling price of the recoverables
The selling price of the recoverables is essential when considering the benefit of the establishment of the
collection system for the recoverables. The weaknesses in the assumption of the utilization of the
recoverables collected from Kostomuksha are, that there is no information if the factories in
Kostomuksha, Segezha or Petrozavodsk are able or willing to receive the recovered material. It may then
be that there won’t be any incomes from the recovered material. If the waste materials in Kostomuksha
had the same price than the waste material in Europe, the selling of it would give incomes and lower the
waste management price in Kostomuksha. The amount of incomes clearly depends on the amount of sold
material. The treating of biomass can also produce compost and biogas but the incomes are much lower
than from the sales of other recoverables.
Establishment costs of small-scale treatment facilities.
In case of the collection of the biomass, there is need to establish a small-scale biomass composting plant
or anaerobic digester to Kostomuksha so that the collected biomass can be utilized. If the size of the plant
were of 6 000 tonnes, the establishment costs of composting plant would be about two million euros and
the establishment of anaerobic digester 670 000 euros (table 15). In addition, the annual treating costs of
the bio-waste are much lower in anaerobic digester than in composting plant, and the selling of the biogas
would produce incomes. It needs to be noticed that amounts of collected bio-waste must be large enough
to establish bio-waste treatment plant. If there is need to establish a new landfill to Kostomuksha, the
estimate of the establishing of the landfill of suitable size would be about 1,3 million euros.
TABLE 15 ESTABLISHMENT COSTS OF SMALL-SCALE TREATMENT FACILITIES (LUOSTARINEN 2008, ILLIKAINEN 2007 AND VÄNSKÄ 2007 IN MYLLYMAA
ET AL. 2008)
Establishment costs of the composting plant for 6 000 tonnes/a 2 000 000 euros + total annual costs of treating the bio-waste (100 e/tonne) or Estab. costs of anaerobic digester for 6 000 tonnes/a+microturbine (90 kW) 670 000 euros + total annual costs of treating the bio-waste (15 e/tonne)
Estab.costs of new landfill for 11 000 tonnes/year (5,2 Milj.e/45 000 t/year) 1 300 000 euros
+ total annual costs of treating the mixed waste (30 euro/tonne)
CONCLUSIONS FROM THE SCENARIOS These calculations are based on reliable data about waste amounts, population dynamics and existing
waste management situation in Kostomuksha. The formulas and statistics are based on literature and
recent research results and they are provided from many well-known institutions and organizations. The
exact texture of the MSW is not known, and neither is the service coverage. The estimation of amount of
MSW after 30 years may not be so accurate, since the amount of waste is almost double compared to the
present situation. It is justified that the amount of MSW will increase (changes in consumption, better
living standards, new packaging materials) but it would be realistic to assume, that the amount of
produced waste would stabilize after two or three decades as in many industrial countries.
All the Scenarios are based on the guidelines found from the literatures and/or the experiments in
Finland or Russian Federation. Hence, there was a justification of using them. Scenario 1 was based on the
maximum yield where all the citizens would separate and take all their recoverables to the collection
points right away when the points would have been established. This may not be very reasonable
Scenario to start with because not even in Finland all the citizens are separating their wastes. Scenario 2

19
EVOLUTION OF MUNICIPAL WASTE MANAGEMENT IN FINLAND
is based on the fact that half of the recoverables are recovered. This may well be the situation after few
years or decades after the establishment of the collection system. Scenarios 3 and 4 are quite similar and
are based on the experiences in Finland and Russian Federation. As they support each other, they would
be very well argued with good possibilities to succeed and something to start with.
When considering the establishment and annual costs, the most reasonable combination for the
establishment of the MSW collection system is to use regional collection points for all the dry
recoverables and kerbside collection for bio-waste and mixed waste, to establish and use anaerobic bio-
waste treatment plant and to transfer other recoverables than bio-waste to be recovered as material,
especially if there will be any incomes from the selling of waste material to the industry. However, the
price of the local energy use of combustible material seems to be unreasonable high since there was no
proper examples how to calculate it. Therefore it needs to be noticed, that this planning of MSWM system
for Kostomuksha is not ideally suited for local circumstances and official planning would demand more
accurate information about the area. Also the participation of the local stakeholders and public would be
essential.
CONCLUSIONS The MSWM plan for the city of Kostomuksha is mainly theoretical. As a background information, it is
known that there is interest towards the more sustainable waste management system in the city which is
essential when starting to plan the establishment of such system. As a status phase, it is important to
estimate the waste amounts now and in the future, before considering the collection network of
recoverables. In the planning phase, it is good to make some scenarios about the collection networks for
the planning area. It is not always environmentally wise to collect and transport small amounts of
recoverables over long distances, as it may be in the case of Kostomuksha. Therefore, it is important in
the implementation phase to consider larger regions as a whole, establish transfer stations and utilize the
waste in a centralized manner.
Using the information on prevalent MSW amounts in Kostomuksha, present and future amounts of waste
fractions were estimated and scenarios on the recovery and utilization of these waste fractions were
presented. It was concluded that the best option would be to separately collect bio-waste at kerbside and
treat in an anaerobic digester. Other major recoverable fractions (paper and cardboard, plastic, metal and
glass) would be reasonable to collect in centralized collection points and transfer to utilization facilities
through transfer stations. In order to implement this plan, it is essential to have recipient facilities in a
reasonable distance and an infrastructure of transfer stations built in the Republic of Karelia. This will
require regional level legislative control and political agreement in the Republic of Karelia. On the
municipal level, also information and education campaigns will need to be planned in order for the public
to get involved and participate in separate waste collection
20
EVOLUTION OF MUNICIPAL WASTE MANAGEMENT IN FINLAND
REFERENCE LIST ArcticStat (2012)10.1.Gross regional product 1995,2000-2005. Russian Federation. Table 2008-08-25-13. http://www.arcticstat.org/Table.aspx/Region/Russian_Federation/Indicator/%5BRegional_Acco unts%5DGross_Product/2008-08-25-13/10911 Chamilos, I. (2011) Resource efficiency in an urban context: Defining the framework of eco-municipalities University of Oulu. Faculty of technology. Dept. of Process and Environmental Engineering. 80 p. 2 app. Euregio Karelia (2010) Karjalan kartta. http://www.euregiokarelia.com/wp-content/uploads/2010/06/kartta.jpg European Commission (2003) Preparing a Waste Management Plan. A methodological quidance note. European Commission Environment DG. European Topic Centre on Waste and Material Flows. http://ec.europa.eu/environment/waste/plans/pdf/wasteguide_final.pdf Eurostat (2012) Recycling.European commission. Eurostat. http://epp.eurostat.ec.europa.eu/portal/page/portal/waste/data/wastemanagement/recycling Illikainen, M. (2007) Suullinen tiedoksianto 29.5.2007. Johtaja. Oulun Jätehuolto. In Myllymaa et al. 2008. Koivisto, J. (2006) Syntypaikkalajittelukokeilu Arkangelin kaupungissa. Loppuraportti. HFT Network Oy. Lahdelma, J. (2002). Biojätteen erilliskeräyksen ja sekajätteenkeräyksen kustannusvertailu. Lappeenrannan teknillinen korkeakoulu Energiatekniikan osasto Lämpö- ja ympäristötekniikan laitos. Lassila-Tikanoja (2012) Jäteastia ja astiasuojat. http://www.lassila-tikanoja.fi/fi/PalvelutJaTuotteet/ palvelujatuotevalikoima/ymparistotuotteet/jateastiat/Sivut/jateastiat.aspx Loseva, E. (2007) Pietarin jätehuolto ja jätteiden käsittelyteknologian kehitys. Kosmos. Presentation in Material Exchange seminar. http://www.lut.fi/fi/technology/lutenergy/environment/research/ projects/matex/events/Documents/Kosmos_Loseva.pdf Luostarinen, J (2008) Metener Oy. Kirjallinen tiedoksianto 3.3.2008. In Myllymaa et al. 2008. Myllymaa, T, Moliis, K., Tohka, A., Rantanen, P., Ollikainen, M., & Dahlbo, H. (2008) Jätteiden kierrätyksen ja polton ympäristövaikutukset ja kustannukset – Inventaarioraportti. Suomen ympäristö 28 / 2008. http://www.ymparisto.fi/download.asp?contentid=92262 Nord Pool Spot (2012) Elspot prices. http://www.nordpoolspot.com/ OECD (2011) Municipal Waste. OECD Regions at a Glance 2011. Environmental Sustainability in Regions and Metropolitan Areas. OECD iLibrary. http://www.oecd-ilibrary.org/sites/reg_glance-2011-en/05/ 04/index.html;jsessionid=1s2dvipa67ub0.delta?contentType=&itemId=/content/chapter/reg_glance- 2011-35-en&containerItemId=/content/serial/19990057&accessItemIds=/content/book/reg_glance- 2011-en&mimeTy Official Karelia (2012) The Republic of Karelia State Government Bodies´Official Web Portal. http://www.gov.karelia.ru/gov/index_e.html Potapova, G. (2012) E-mail. Chief specialist. City of Kostomuksha. Raimovaara (2004) Biokaasun tuotanto- ja käyttömahdollisuudet Kanta-Hämeessä. Hämeen ammattikorkeakoulu. http://midgard1.nebula.fi/attachment/ee246cbb04c1da363116122aebb56633/ 19264351e78bffbf4327fe0f8f522694/Biokaasun+tuotanto+ja+hy%C3%83%C2%B6tyk%C3%83%C2 %A4ytt %C3%83%C2%B6mahdollisuudet Teknologiateollisuus ry (2012) Standardi-terästuotteiden sekä värimetallien hintoja. Talouden arviointi. http://www.google.fi/url?sa=t&rct=j&q=&esrc=s&source=web&cd=4&ved=0CD4QFjAD&url= http%3A%2F%2Fwww.teknologiateollisuus.fi%2Ffile%2F2764%2FMetallien_hintoja.pdf.html& ei=eCWVT4rwBuqQ4gSUrOjQDw&usg=AFQjCNFder2MiTPEFrYp619Yknnma-UB3A&sig2=_COCxsow Z_q-nNmEDqCfkg Vänskä, V. (2007) Kirjalliset tiedoksiannot 10.1. ja 18.9.2007. Joensuun Seudun Jätehuolto Oy. In Myllymaa et al. 2008 Worldbank (2001) Strategic Planning Guide for Municipal Solid Waste Management. http://www.worldbank.org/urban/solid_wm/erm/start_up.pdf Ympäristöministeriö (2010a) Jätehuollon taloudellinen merkitys ja kustannukset. Ympäristöministeriön raportteja 12 | 2010. http://www.ymparisto.fi/download.asp?contentid=117613&lan=fi Ympäristöministeriö (2010b). Uuden jätelainsäädännön mukaisten keräysverkostovaatimusten kustannusvaikutukset pakkausten jätehuollossa. Raportti 1907-P11168. FCG Finnish Consulting Group Oy. http://www.ymparisto.fi/download.asp?contentid=121811&lan=fi
21
EVOLUTION OF MUNICIPAL WASTE MANAGEMENT IN FINLAND
APPENDIX 1. MAP OF KARELIA AND FINLAND.
FIGURE 3. MAP OF KARELIA AND FINLAND. CIRCLE SHOWS THE LOCATION OF THE CITY OF KOSTOMUKSHA, CROSSES SHOW THE LOCATION OF THE
TRANSFER STATION AND UTILIZATION FACILITIES, SEGEZHA AND PETROZAVODSK. (EUREGIO KARELIA 2010)
Kostomuksha Segezha
22
EVOLUTION OF MUNICIPAL WASTE MANAGEMENT IN FINLAND
APPENDIX 2.
The calculations in the Scenarios for Kostomuksha
The number of collection points in all the Scenarios was usually based on the amount of the largest waste
fraction i.e. paper and cardboard. The container of paper and cardboard was emptied daily or several
times per week and the other containers less frequently. The volumes of the containers in one regional
collection point are as in the figure 2 (2*8 m3 for paper and cardboard; 2 * 5 m3 for plastic; 3 m3 for metal
and 3 m3 for glass) and the volumes in kerbside collection points are 1m3 for paper and cardboard and
plastic and 0,6 m3 for metal and glass. The number of containers needed in every Scenario was calculated
by using volumes of containers and the estimation of the future waste volumes (table 8) The
establishment costs of collection points were calculated by using the information about purchasing price
of containers (table 7). However, according to the report of the Ministry of Environment (2010b), by
buying large amounts of containers and by using competitional bidding, the savings may be even 30% of
the costs, which was used in calculation. The annual maintenance costs of collection points are caused by
wearing, cleaning, repairing and administration of the collection points and were calculated by using the
information about average maintaining costs (table 7).
As the emptying times varies in different Scenarios, annual emptying costs need to be calculated
separately for every Scenario by using the emptying price for the container of recoverables in table 7 and
emptying times in table 8. In the report of Myllymaa et al. (2008), it was assumed that the recoverables
are emptied straight to the vehicles that transfer them to the transfer stations so there should not be local
transportation costs in regional collection points. The annual emptying costs (including transportation) of
mixed waste and bio-waste were calculated by using the weight based emptying costs (table 7). The
annual costs of treating the waste material was calculated by using the average treating prices for bio-
waste tonne and mixed waste tonne (table 7). The price for treating of bio-waste differs if the bio-waste is
treated in composting plant or in the anaerobic digester (table 7).
The annual transfer costs of the recoverables from Kostomuksha to Segezha and Petrozavodsk were
calculated by using the information of waste loads, transfer capacities and consumption of vehicles,
driving distances, loading and unloading times, hourly costs of vehicles and coefficient for breaks and
refilling (tables 7 and 8). The average speed of the vehicle for the whole trip would be 70 km/h, the
loading and unloading of the vehicle would take one hour and because of the breaks and refilling the
transportation time should be multiplied by 1,15.
The annual selling price of recoverables in material use option (paper and cardboard in Segezha and other
dry recoverables in Petrozavodsk) was calculated by using the selling price of material/tonne and the
amount of collected material (tables 7 and 8). The exact share of paper in the fraction of paper and
cardboard is not known but it was estimated to be 75 %. As the prices of the waste materials fluctuate
very rapidly according to the market situation, the latest EU prices are used (Eurostat 2012;
Teknologiateollisuus ry 2012). In energy use option produced waste plastic and waste paper and
cardboard could be used as a fuel in the industry producing district heat for the city of Kostomuksha. As
the price for the REF is assumed to be negligible, there would not be any monetary benefit of providing
the waste for the incineration but the using of recovered material as energy save the costs of landfilling.
The selling price of the produced compost (about 1/3 of the original volume) and the production of
electricity from the treating of the biomass was calculated by using the information of the original amount
of bio-waste and production and price of the electricity (tables 7 and 8)
23
EVOLUTION OF MUNICIPAL WASTE MANAGEMENT IN FINLAND
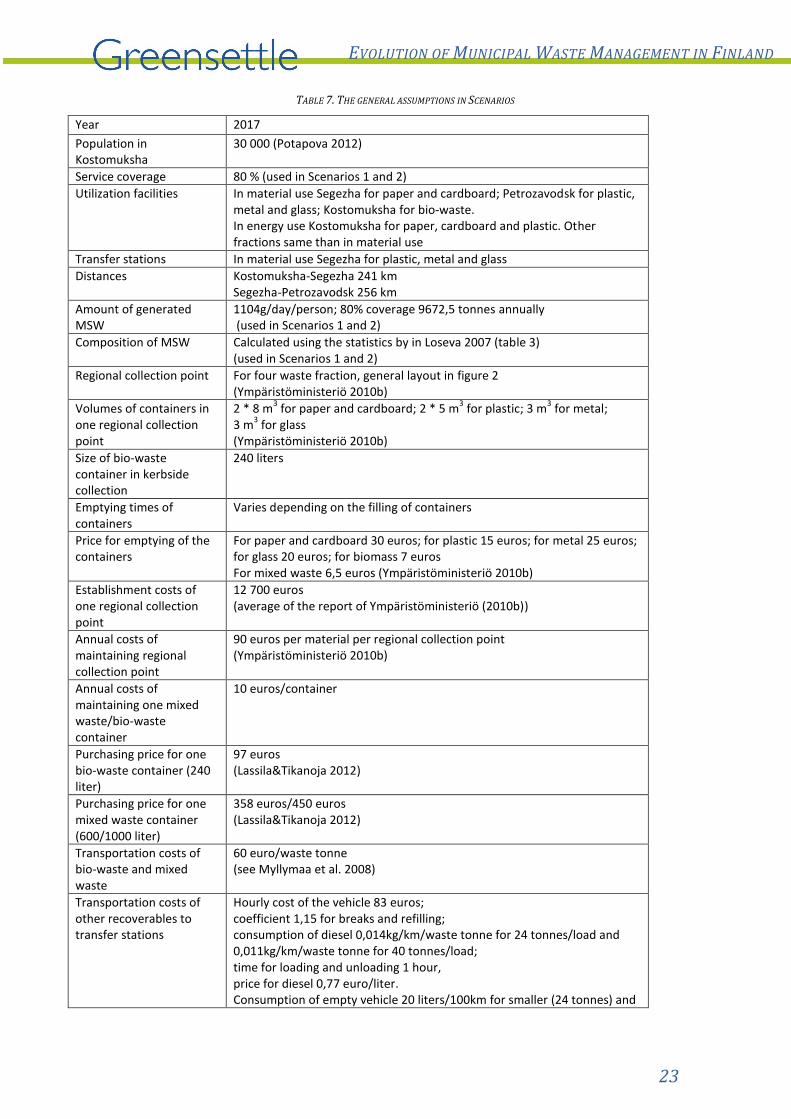
TABLE 7. THE GENERAL ASSUMPTIONS IN SCENARIOS
Year 2017
Population in Kostomuksha
30 000 (Potapova 2012)
Service coverage 80 % (used in Scenarios 1 and 2)
Utilization facilities In material use Segezha for paper and cardboard; Petrozavodsk for plastic, metal and glass; Kostomuksha for bio-waste. In energy use Kostomuksha for paper, cardboard and plastic. Other fractions same than in material use
Transfer stations In material use Segezha for plastic, metal and glass
Distances Kostomuksha-Segezha 241 km Segezha-Petrozavodsk 256 km
Amount of generated MSW
1104g/day/person; 80% coverage 9672,5 tonnes annually (used in Scenarios 1 and 2)
Composition of MSW Calculated using the statistics by in Loseva 2007 (table 3) (used in Scenarios 1 and 2)
Regional collection point For four waste fraction, general layout in figure 2 (Ympäristöministeriö 2010b)
Volumes of containers in one regional collection point
2 * 8 m3 for paper and cardboard; 2 * 5 m
3 for plastic; 3 m
3 for metal;
3 m3 for glass
(Ympäristöministeriö 2010b)
Size of bio-waste container in kerbside collection
240 liters
Emptying times of containers
Varies depending on the filling of containers
Price for emptying of the containers
For paper and cardboard 30 euros; for plastic 15 euros; for metal 25 euros; for glass 20 euros; for biomass 7 euros For mixed waste 6,5 euros (Ympäristöministeriö 2010b)
Establishment costs of one regional collection point
12 700 euros (average of the report of Ympäristöministeriö (2010b))
Annual costs of maintaining regional collection point
90 euros per material per regional collection point (Ympäristöministeriö 2010b)
Annual costs of maintaining one mixed waste/bio-waste container
10 euros/container
Purchasing price for one bio-waste container (240 liter)
97 euros (Lassila&Tikanoja 2012)
Purchasing price for one mixed waste container (600/1000 liter)
358 euros/450 euros (Lassila&Tikanoja 2012)
Transportation costs of bio-waste and mixed waste
60 euro/waste tonne (see Myllymaa et al. 2008)
Transportation costs of other recoverables to transfer stations
Hourly cost of the vehicle 83 euros; coefficient 1,15 for breaks and refilling; consumption of diesel 0,014kg/km/waste tonne for 24 tonnes/load and 0,011kg/km/waste tonne for 40 tonnes/load; time for loading and unloading 1 hour, price for diesel 0,77 euro/liter. Consumption of empty vehicle 20 liters/100km for smaller (24 tonnes) and
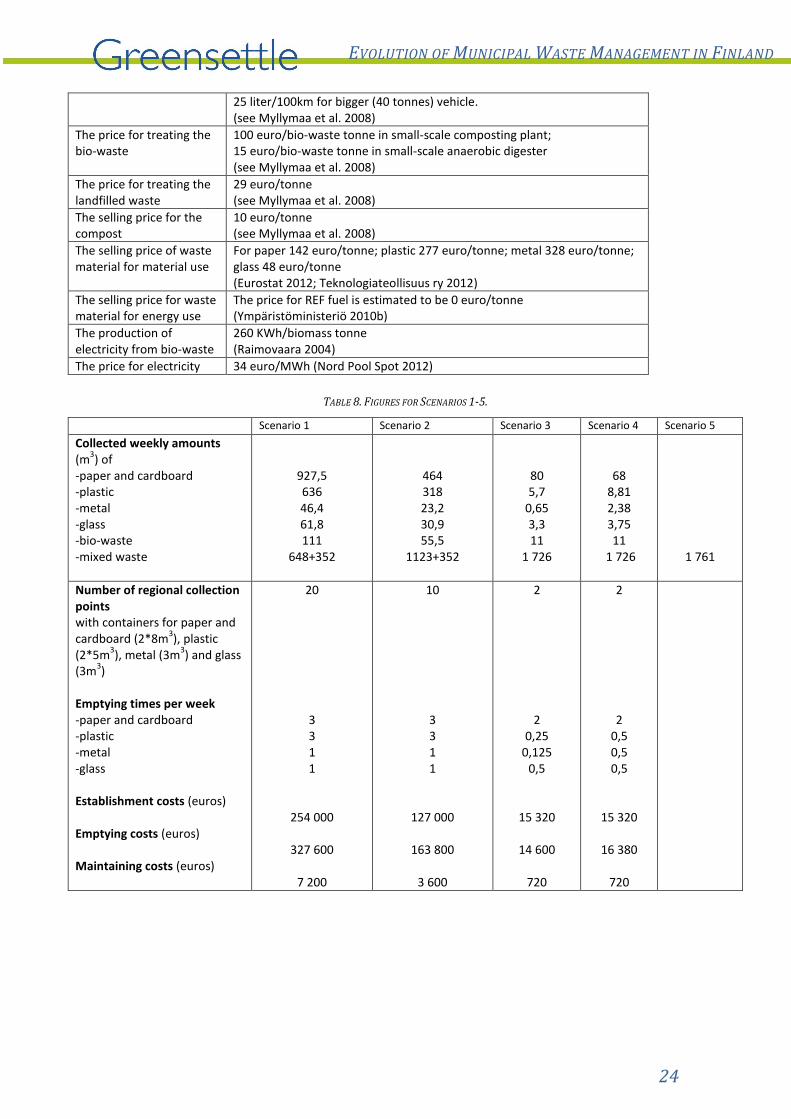
24
EVOLUTION OF MUNICIPAL WASTE MANAGEMENT IN FINLAND
25 liter/100km for bigger (40 tonnes) vehicle. (see Myllymaa et al. 2008)
The price for treating the bio-waste
100 euro/bio-waste tonne in small-scale composting plant; 15 euro/bio-waste tonne in small-scale anaerobic digester (see Myllymaa et al. 2008)
The price for treating the landfilled waste
29 euro/tonne (see Myllymaa et al. 2008)
The selling price for the compost
10 euro/tonne (see Myllymaa et al. 2008)
The selling price of waste material for material use
For paper 142 euro/tonne; plastic 277 euro/tonne; metal 328 euro/tonne; glass 48 euro/tonne (Eurostat 2012; Teknologiateollisuus ry 2012)
The selling price for waste material for energy use
The price for REF fuel is estimated to be 0 euro/tonne (Ympäristöministeriö 2010b)
The production of electricity from bio-waste
260 KWh/biomass tonne (Raimovaara 2004)
The price for electricity 34 euro/MWh (Nord Pool Spot 2012)
TABLE 8. FIGURES FOR SCENARIOS 1-5.
Scenario 1 Scenario 2 Scenario 3 Scenario 4 Scenario 5
Collected weekly amounts (m
3) of
-paper and cardboard -plastic -metal -glass -bio-waste -mixed waste
927,5 636 46,4
61,8
111 648+352
464 318 23,2 30,9
55,5
1123+352
80 5,7
0,65 3,3
11
1 726
68 8,81 2,38 3,75
11
1 726
1 761
Number of regional collection points with containers for paper and cardboard (2*8m
3), plastic
(2*5m3), metal (3m
3) and glass
(3m3)
Emptying times per week -paper and cardboard -plastic -metal -glass Establishment costs (euros) Emptying costs (euros) Maintaining costs (euros)
20
3 3 1 1
254 000
327 600
7 200
10
3 3 1 1
127 000
163 800
3 600
2
2 0,25
0,125 0,5
15 320
14 600
720
2
2 0,5 0,5 0,5
15 320
16 380
720
25
EVOLUTION OF MUNICIPAL WASTE MANAGEMENT IN FINLAND
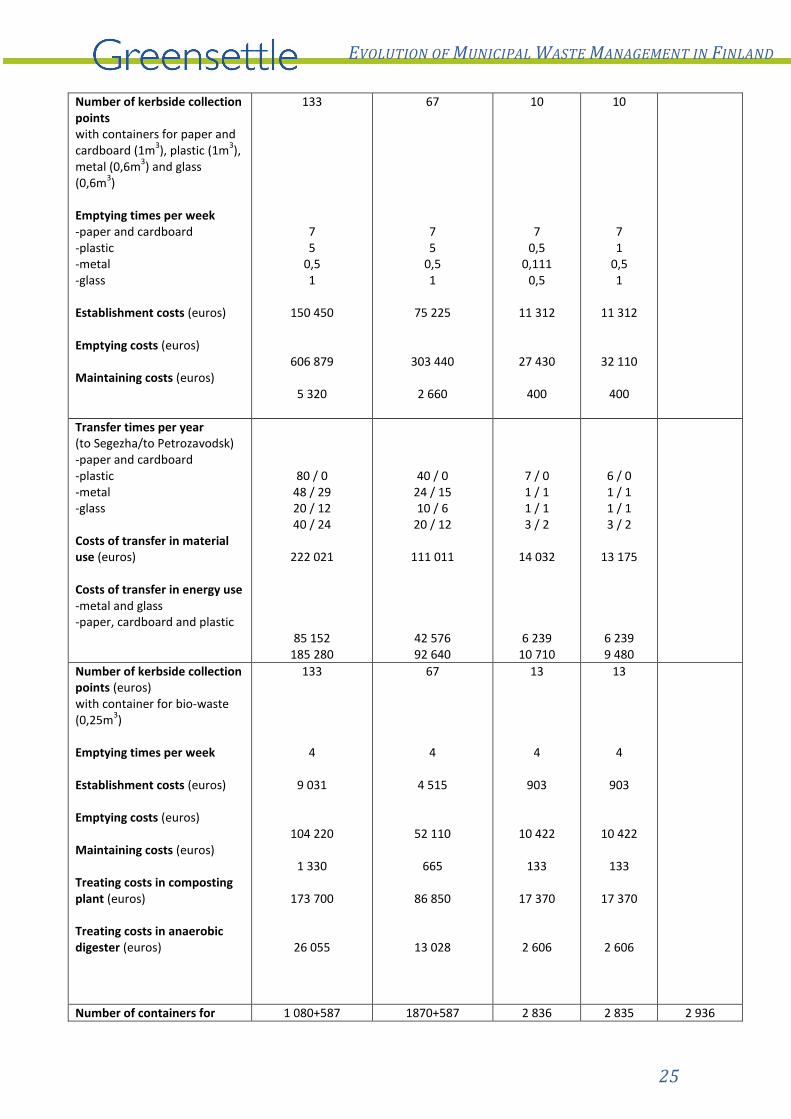
Number of kerbside collection points with containers for paper and cardboard (1m
3), plastic (1m
3),
metal (0,6m3) and glass
(0,6m3)
Emptying times per week -paper and cardboard -plastic -metal -glass Establishment costs (euros) Emptying costs (euros) Maintaining costs (euros)
133
7 5
0,5 1
150 450
606 879
5 320
67
7 5
0,5 1
75 225
303 440
2 660
10
7 0,5
0,111 0,5
11 312
27 430
400
10
7 1
0,5 1
11 312
32 110
400
Transfer times per year (to Segezha/to Petrozavodsk) -paper and cardboard -plastic -metal -glass Costs of transfer in material use (euros) Costs of transfer in energy use -metal and glass -paper, cardboard and plastic
80 / 0 48 / 29 20 / 12 40 / 24
222 021
85 152 185 280
40 / 0 24 / 15 10 / 6
20 / 12
111 011
42 576 92 640
7 / 0 1 / 1 1 / 1 3 / 2
14 032
6 239 10 710
6 / 0 1 / 1 1 / 1 3 / 2
13 175
6 239 9 480
Number of kerbside collection points (euros) with container for bio-waste (0,25m
3)
Emptying times per week Establishment costs (euros) Emptying costs (euros) Maintaining costs (euros) Treating costs in composting plant (euros) Treating costs in anaerobic digester (euros)
133
4
9 031
104 220
1 330
173 700
26 055
67
4
4 515
52 110
665
86 850
13 028
13
4
903
10 422
133
17 370
2 606
13
4
903
10 422
133
17 370
2 606
Number of containers for 1 080+587 1870+587 2 836 2 835 2 936
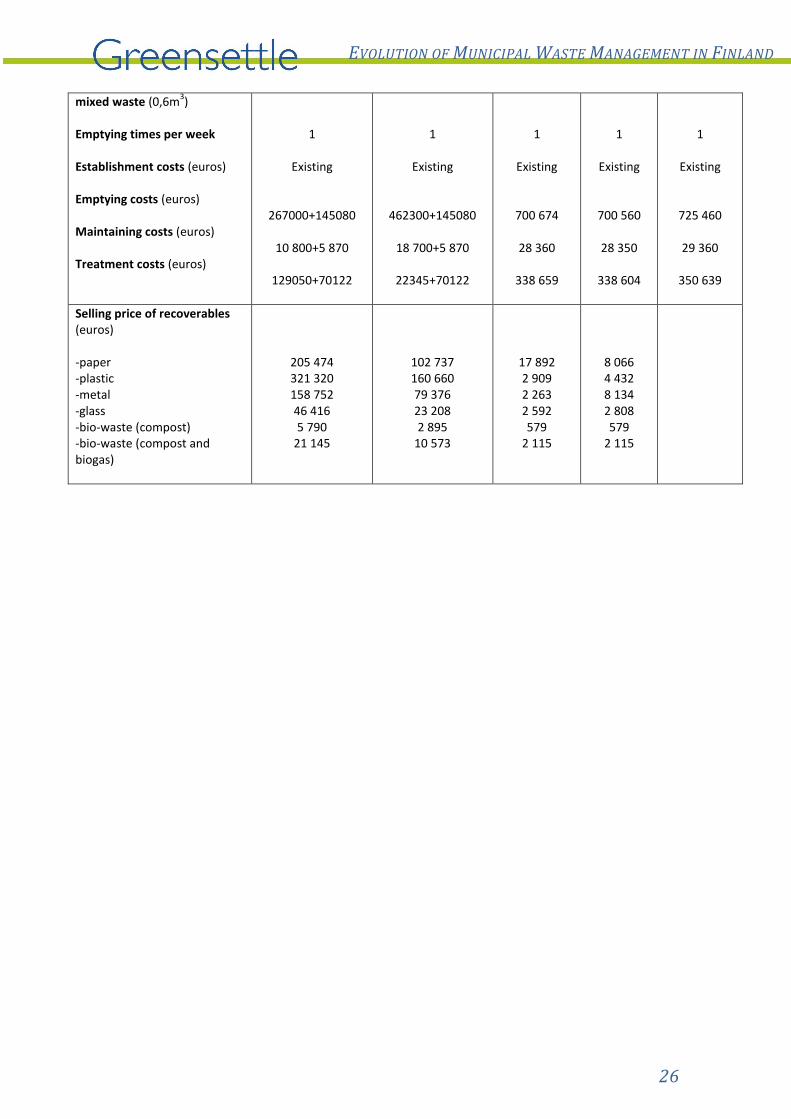
26
EVOLUTION OF MUNICIPAL WASTE MANAGEMENT IN FINLAND
mixed waste (0,6m3)
Emptying times per week Establishment costs (euros) Emptying costs (euros) Maintaining costs (euros) Treatment costs (euros)
1
Existing
267000+145080
10 800+5 870
129050+70122
1
Existing
462300+145080
18 700+5 870
22345+70122
1
Existing
700 674
28 360
338 659
1
Existing
700 560
28 350
338 604
1
Existing
725 460
29 360
350 639
Selling price of recoverables (euros) -paper -plastic -metal -glass -bio-waste (compost) -bio-waste (compost and biogas)
205 474 321 320 158 752 46 416 5 790
21 145
102 737 160 660 79 376 23 208 2 895
10 573
17 892 2 909 2 263 2 592 579
2 115
8 066 4 432 8 134 2 808 579
2 115


![INDEX [nortech.oulu.fi]nortech.oulu.fi/GREENSETTLE_files/Perala Oulu... · – extensive network separated from car traffic covering the whole city – separate funding for bicycle](https://img.pdfslide.us/doc/110x75/5fb9596d9d57543a404c0997/index-oulu-a-extensive-network-separated-from-car-traffic-covering-the.jpg)