Embed Size (px)
Citation preview

MPRAMunich Personal RePEc Archive
The trends of labor market inBangladesh and its determinants
Murad S. M. Woahid
Jahangirnagar University, Savar, Dhaka, Bangladesh
29. March 2009
Online at https://mpra.ub.uni-muenchen.de/32381/MPRA Paper No. 32381, posted 23. July 2011 14:10 UTC
0
The Trends of Labor Market in Bangladesh and Its Determinants
S. M. Woahid Murad
E-mail address: [email protected]
M.Sc. Class Roll: 787
Session: 2005-2006
Submitted to:
Mohammad Safiqul Islam Assistant Professor
Department of Economics Jahangirnagar University
Savar, Dhaka
March 2009

1
ABSTRACT
In this paper, we have tried to find out specially the features of unemployment-
underemployment scenario. As we know, like auction market labor market is not perfectly
competitive. For various heterogeneities, it has some distinct features. In Bangladesh,
unemployment and underemployment problems arrive due to the lack of effective demand for
labor. Hence, in this paper we desire to focus the demand determinants of labor in
Bangladesh. In this case, we have emphasized on manufacturing sector, which is the
emerging sector of Bangladesh economy both from the employment generation and from
economic growth perspectives. To estimate the demand determinants we have used ARDL
model where the estimation period is from 1980 to 2002.

2
I. Introduction:
As a labor abundant country, the prospect of the entire economy of Bangladesh depends on
the features of the labor market. In fact, the demand for labor is not sufficient enough to
generate the job opportunity for the existing unemployed as well as underemployed workers.
Consequently, the economy faces excess supply of labor. For various socio-economic
reasons, market does not clear.
In the labor market, employment is determined by the supply of labor in situations of full
employment. However, in situations of unemployment and underemployment, employment is
determined by the demand factors. Hence, the components of the supply function and the
determinations of employment need to be analyzed separately (Rahman, 1993).
Keynes believed that a certain level of frictional unemployment was characteristic of all labor
markets (which are known as natural rate of unemployment); however, involuntary
unemployment may arise when a condition of disequilibrium exists in labor markets, with
supply exceeding demand (Hall, 1972). According to Keynesian economics, any level of
unemployment beyond the natural rate of unemployment most likely due to insufficient
demand in the overall economy.
The major objective of this paper is to analyze the changing features of labor market in
Bangladesh. To explore the composition of labor market, in the first part of this paper, is to
focus on the changing features of labor market, its trends and examine the previous study on
the labor market. In the second part of this paper is to analyze the major industrial groups1,
demand determinants for employee and worker separately. Then it is to suggest some policy
implications.
1 See appendix-2
3
II. The Changing and Challenging Features of Labor Market in Bangladesh
The changing features of the composition of labor force, employment, unemployment,
underemployment scenario depends on various factors such as demography, structural
change, change of social attitude, trends of economic activities, the macroeconomic policies
initiated by private and public sectors as well as multilateral organizations specially the
World Bank, IMF, United Nation. In various cases, the factors are interrelated with various
aspects. In this section of this paper, we will elaborately explore the anatomy of the labor
market in Bangladesh and the literature survey associated with various economies along with
Bangladesh.
Chletsos, Kollias and Manolas (2000) found that the growth rate has a positive impact on the
employment level; however, there is a negative relationship between employment and labor
productively. Chletsos and Markellos (2005) also GDP, exports to imports and employment
level (Chletsos, 2005).
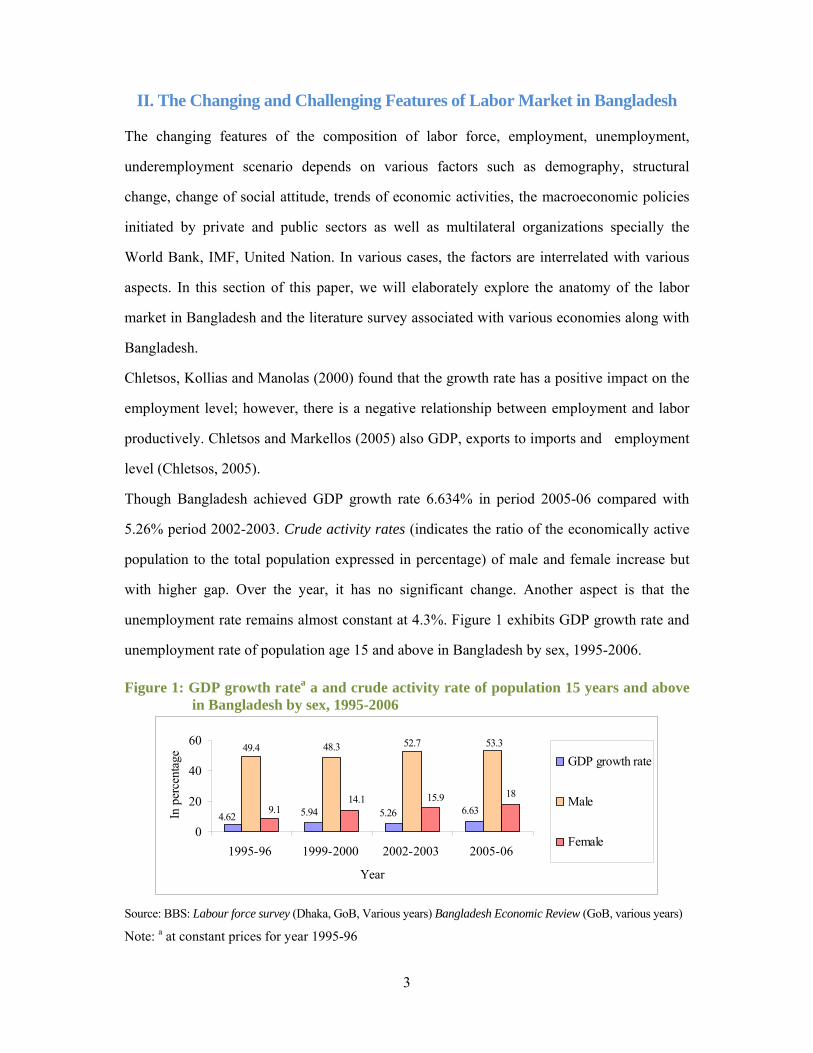
Though Bangladesh achieved GDP growth rate 6.634% in period 2005-06 compared with
5.26% period 2002-2003. Crude activity rates (indicates the ratio of the economically active
population to the total population expressed in percentage) of male and female increase but
with higher gap. Over the year, it has no significant change. Another aspect is that the
unemployment rate remains almost constant at 4.3%. Figure 1 exhibits GDP growth rate and
unemployment rate of population age 15 and above in Bangladesh by sex, 1995-2006.
Figure 1: GDP growth ratea a and crude activity rate of population 15 years and above in Bangladesh by sex, 1995-2006
6.635.265.944.62
52.7 53.349.4 48.3
15.914.19.1
18
0
20
40
60
1995-96 1999-2000 2002-2003 2005-06
Year
In p
erce
ntag
e
GDP growth rate
Male
Female
Source: BBS: Labour force survey (Dhaka, GoB, Various years) Bangladesh Economic Review (GoB, various years)
Note: a at constant prices for year 1995-96

4
Figure 2: GDP growth ratea and unemployment rate of population aged 15 and above in Bangladesh by sex, 1995-2006
5.94
4.3 4.33.4 3.4
7
5.266.63
4.624.33.5 4.2
2.8
4.9
7.8 7.8
02468
10
1995-96 1999-2000 2002-03 2005-06Year
In p
erce
ntag
e GDP growth rate
Both sex
Male
Female
Source: BBS: Labour force survey (Dhaka, GoB, Various years) Bangladesh Economic Review (GoB, various years)
Note: a at constant prices force year 1995-96
In figure 2 unemployment rate was 3.5 percent in the year 1995-96 which was lower compare
to 1999-2006. However, female unemployment rate was 7.8 percent and over the year it has
been declined to 7 percent. In the year 2002-2003 female unemployment rate was low (9.9
percent) compare to other fiscal year among 1995 to 2006. In contrast to the female
unemployment rate, in the 2002-2003, male unemployment rate was high (9.2 percent)
compare to other fiscal years among 1995 to 2006.
The labor force is growing faster than the employment opportunities, hence the unemployed
persons increase over time. Instead of these, change of sectoral growth rate is also responsible
for the rising unemployment rate. Table 1 shows that over time (2001 to 2007) the growth
rate of agriculture and forestry sector is very instable, while the lion’s share of labor force in
Bangladesh is engaged in agricultural sector. Based on table 1, the growth rate of
manufacturing sector for FY 2005-07 is 9-72 percent against 10.77 percent in the previous
year. However, in 2004-2005 the growth rate was 8.19. Mainly the knitwear, ready-made
garments and cotton textile fuel the growth of manufacturing. The growth of service sector
also increases. Nevertheless, the rate of increment of manufacturing and service sectors is not
sufficient to recruit all involuntary unemployed in these sectors.

5
Table 1: Sectoral share of GDP at constant Prices (Base Year: 1995-1996) (In percentage)
Sector 2001-02 2002-03 2003-04 2004-05 2005-06 2006-07
1. Agriculture, Forestry -0.62 3.29 4.38 1.80 5.23 4.69
2. Fishery 2.22 2.33 3.09 3.65 3.91 4.07
3. Mining & Quarrying 4.53 7.17 7.66 8.38 9.26 8.33
4. Industry (Manufacturing) 5.48 6.75 7.10 8.19 10.77 9.72
5. Electricity, Gas & Water 7.63 8.02 9.09 8.90 7.67 2.10
6. Construction 8.61 8.09 8.25 8.31 8.31 7.01
7. Wholesale & Retail Trade 6.59. 6.09 6.57 7.06 6.75 8.04
8. Hotel & Restaurant 6.92 7.00 7.05 7.12 7.45 7.52
9. Transport, Storage &
Communication 6.56 6.85 6.21 7.92 7.98 8.03
10. Financial Intermediations 6.70 6.67 7.02 8.92 8.50 9.18
11. Real Estate, Renting &
Other Business activities 3.42 3.52 3.58 3.65 3.69 3.76
12. Public Administration
and Defense 5.92 5.24 7.06 8.02 8.15 8.41
13. Education 7.58 7.60 7.69 7.90 9.05 8.96
14. Health and Social Work 5.30 5.63 6.17 7.40 7.79 7.64
15. Community, Social and
Personal Services 8.24 3.32 3.97 4.05 4.09 4.58
Growth Rate 4.42 5.26 6.27 5.96 6.63 6.43
Source: Bangladesh Economic Review 2008, Ministry of Finance, GoB.
6
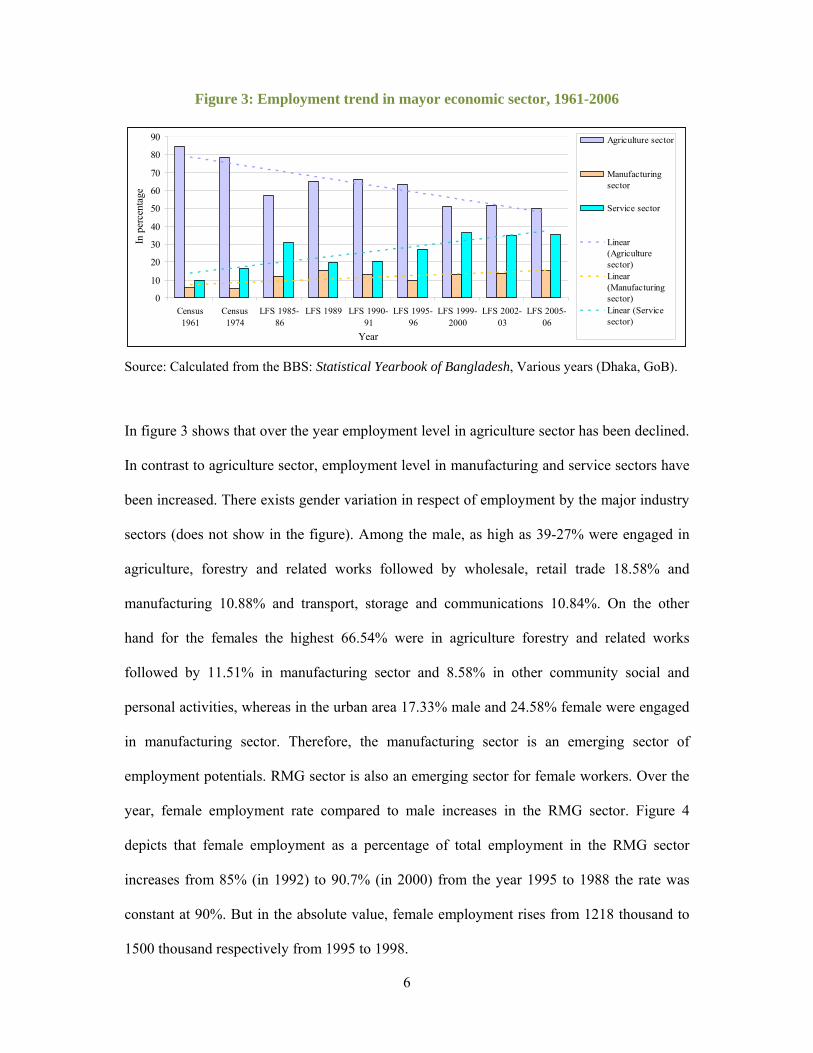
Figure 3: Employment trend in mayor economic sector, 1961-2006
0
10
20
30
40
50
60
70
80
90
Census1961
Census1974
LFS 1985-86
LFS 1989 LFS 1990-91
LFS 1995-96
LFS 1999-2000
LFS 2002-03
LFS 2005-06
Year
In p
erce
ntag
eAgriculture sector
Manufacturingsector
Service sector
Linear(Agriculturesector)Linear(Manufacturingsector)Linear (Servicesector)
Source: Calculated from the BBS: Statistical Yearbook of Bangladesh, Various years (Dhaka, GoB).
In figure 3 shows that over the year employment level in agriculture sector has been declined.
In contrast to agriculture sector, employment level in manufacturing and service sectors have
been increased. There exists gender variation in respect of employment by the major industry
sectors (does not show in the figure). Among the male, as high as 39-27% were engaged in
agriculture, forestry and related works followed by wholesale, retail trade 18.58% and
manufacturing 10.88% and transport, storage and communications 10.84%. On the other
hand for the females the highest 66.54% were in agriculture forestry and related works
followed by 11.51% in manufacturing sector and 8.58% in other community social and
personal activities, whereas in the urban area 17.33% male and 24.58% female were engaged
in manufacturing sector. Therefore, the manufacturing sector is an emerging sector of
employment potentials. RMG sector is also an emerging sector for female workers. Over the
year, female employment rate compared to male increases in the RMG sector. Figure 4
depicts that female employment as a percentage of total employment in the RMG sector
increases from 85% (in 1992) to 90.7% (in 2000) from the year 1995 to 1988 the rate was
constant at 90%. But in the absolute value, female employment rises from 1218 thousand to
1500 thousand respectively from 1995 to 1998.

7
Figure 4: Female employment as a percentage of total employment in the RMG sector, 1992-2000
80
82
84
86
88
90
92
94
1992 1993 1994 1995 1996 1997 1998 1999 2000
Year
In p
erce
ntag
e
Source: Rahman, 2005
After phasing out of the Multi-Fiber Arrangement (MFA) of trade on textile and clothing, no
negative impact has been felt in the sector and no worker has lost his or her job. Export data
for FY 2006-07 reveals that export of knitwear and woven garments registered a growth
19.30 percent and 14.05 percent respectively compared to the previous fiscal year. In FY
2006-07, exports registered a growth of 37.39 percent in knitwear and 38.25 percent in
woven garments. Government has taken several initiatives for the sustainable development of
RMG sector considering its contribution to the national income and employment generation.
Beside these, government allocated Tk. 20 core in the budget of 2006-07 for the purpose of
creating employment through alternative training in different areas if workers lose their jobs
due to negative impact in the quota-free regime.
Now it is to analyze the employment and unemployment situation by residence. Here we will
specially focus on the rural areas its changing features and the empirical studies conducted on
the rural labor market.

8
Figure 5: Unemployment rates of population aged 15 years and over by sex and
Residence, 1999-2006
4.3 4.24.3
5.8
3.9 4.35
4.1 4.3 3.44 3.6 3.33.45
2.94.2
4.6
6.77.2
4.9
7.68.37.8
6.2
4.4
7
0123456789
National(1999-2000)
Urban(1999-2000
Rural(1999-2000)
National(2002-03)
Urban(2002-03)
Rural(2002-03)
National(2005-06)
Urban(2005-06)
Rural(2005-06)
Year
In p
erce
ntag
e Both sex
Male
Female
Source: BBS: Labour force survey (Dhaka, GoB, 2002-2003, 2005-2006)
Unemployment rates are relatively higher in urban areas compared to rural areas from 1995
to 2003. In 1999-2000, urban unemployment rates for male and female is respectively 5
percent and 8.3 percent whereas rural unemployment rate for male and female are
respectively 2.9 percent and 7.6 percent. In 2002-03 figure 4 reveals the same trend in
different magnitude. Instead of those trends, in 2005-2006 female unemployment rate is
higher in rural area compare to urban area. In the same period in case of female
unemployment in rural area however, the highest rate is observed for age group 15-19
(30.27%) followed by age group 20-24 (10.84%) and 25.29 (6.21%). In urban area, female
unemployment rate is highest for age group 25-29 (10.14%) followed by age group 20-24
(10.02%) and 15-19 (9.03%). For male unemployment in both urban and rural areas,
unemployment rate is highest in the age group 20-24 where the unemployment rates are 9.33
percent, 9.13 percent and 9.38 percent respectively in national, urban and rural areas.
Using OLS regression estimation Rahman (1993) examines the determinants of the hours of
employment obtained by the female workers in rural areas. She finds the human capital
variables (age, square of age, years of experience) are not statistically significant while their
coefficient values are also very low. Here the relationships among dependent and explanatory
9
variables of human capital are negative. As their values are not significant, the author
interprets that these forces are not operating in the female labor market. The location with
low productivity has a significant negative coefficient. The variables reflecting recruitment
cost have negative coefficients. There is a negative relationship between dependent variable
and wage rate per hour. The value is statistically significant. The author concluded that
expansion of employment opportunities is an urgent need since involuntary underemployment
exists.
Ahmed (1981) has studied on the aggregate level of rural labor market. The author finds that
rural unemployment is not involuntary largely prevalent among family workers of middle and
rich farm households. Landless and land-poor wage workers do not remain unemployed even
for a few days, except during natural calamities when crops and employment potentials are
lost (Hossain, 1996). Hossain (1996) argues that since the rural people in Bangladesh live in
village generation after generation, they know how to adopt and cope with the vulnerable
situation. The author says that the rural people ‘have developed various income and
employment smoothing mechanisms through which they can manage to remain employed.’
Over the year landlessness and near-landlessness is gradually increasing while it is neither a
necessary nor a sufficient condition for rural poverty.
By using OLS estimation Hossain (1996) finds that the impact of the new technology on the
rate of aggregate unemployment and under employment is negative. The relationship
between agricultural real wage rate and agricultural employment is positive. Hence the over
all results suggest that the new technology does not raise the real wage rate.
Hossain (1988) finds that launching the new technology affects the labor market through
income effect. As income increases, rich households substitute their leisure for labor, hence,
employment being redistributed from higher to lower income groups (Hossain, 1996).

10
Nevertheless, Rahman (2004) finds that as the new technology (modern irrigation, seed and
fertilizer) being introduced in the agriculture sector, hired labor demand is rising, while the
use of machinery for land preparation leads to reduce the demand of hired labor. Hence, the
net effect is difficult to predict without empirical estimation.
Due to the sectoral productivity differentials and wage differentials, in the rural labor market,
labors migrate from farm to non-farm sector. The RNF sector provides a large number of
employment opportunities for the growing labor force. There are intersectoral linkages that
introduce the RNF sector as an emerging sector of the future growth of economy (Mahmud
1996). The RNF sector generates full-time, sustainable employment in small-scale industry
especially for the low productive workers, which may promote the income of unskilled
workers and vulnerable groups. Thus, large-scale migration to cities would be stopped and
female labor force would be more benefited (Varma & Kumar, 1996).
Consequent result is that the unemployment problem is not serious in the rural labor market,
through the underemployment rate is very high in the rural area. Therefore, the government
of Bangladesh should take initiatives to promote the prospect of RNF sector for sustainable,
secure as well as social standing employment opportunities.
New we would like to focus on the educated unemployed persons. Figure 6 shows the
disparity of composition educated unemployment with respect to sex and residence. It shows
grim picture in the sense that unemployment rate is higher along with the increase of
education level. It is especially confessable for female labor force. In 2005-2006 the female
unemployment rate at the education level HSC/equivalent is 22.18% followed by the
unemployment rate who have technical/vocational education (20.94%) in the rural area, while
in the urban area the highest unemployment rate is at the level Engineering/medical (19.02)
and the second highest is at the level class IX-X (15.94%). The feature is also available in
previous years. This scenario may depress the women and hence the enrollment of women for
higher education will be declined.

11
Figure 6: Unemployment rate of persons aged 15 years and over by level of
education and residence, 2005-2006
05
10152025303540455055
1 2 3 4 5 6 7 8 9 10 11Level of education
In p
erce
ntag
eBoth sex (National)
Male (National)
Female (National)
Both sex (Urban)
Male (Urban)
Female (Urban)
Both sex (Rural)
Male (Rural)
Female (Rural) Source: BBS: Labour force Survey 2005-2006 Note:
1. No education 4. Class IX-X 7. Degree/equivalent 10. Technical/vocational
2. Class-I-V 5. SSC/equivalent 8. Master’s/equivalent 11. Other
3. Class VI-VIII 6. HSC/equivalent 9. Engineering/medical
The feature is not quite different for male unemployment at higher level of education. Male
unemployment rate is highest in case of having HSC/equivalent education level (8.58%)
followed by technical/vocational education level (7.11%). Now it may suppose to relate the
figure with figure 7.
Figure 7: Employed persons aged 15 years and over by major industry and level of
education, 2005-2006
05
1015202530354045505560
1 2 3 4 5 6 7 8 9 10 11 12 13 14 15
Category of major industries
In p
erce
ntag
e
No educ
Class l-V
Class VI-Vlll
Class lX-X
SSC/HSC/equiv
Bachelorsdegree/above
Technical/vocation/ others

12
Note:
1. Agriculture, hunting and forestry
2. Fishing
3. Mining and quarrying
4. Manufacturing
5. Electricity, Gas and Water Supply
6. Construction
7. Whole Sale and Retail Trade; Repair of Motor
Vehicles, Motors
8. Hotels and Restaurants
9. Transport, Storages and Communications
10. Financial Intermediation
11. Real State Renting, and Business Activities
12. Public Administration and Defense
13. Education
14. Heath and Social Work
15. Other Community, Social and Personal Service
Activities
Source: Calculated from the BBS: Labour force Survey 2005-2006
Figure 7 shows that in agricultural, hunting and forestry 51.15 percent employed persons
have no education; in the fishing 53.29 percent employed persons have no education.
Similarly in mining and quarrying, manufacturing, construction, wholesale and retail trade,
hotels and restaurants, transport, storage and communications and other community, social
and personal service activities sector most of the peoples who are employed, have no
education. In the service sector, educated employment rate is very high. The same trend
found in 2002-2003 but in different magnitude. All of the sectors where employed persons of
no education level are highest in 2005-2006; the same features are found in 2002-2003, but in
higher magnitude. It exhibits the potentials of educated employment prospects. Figure 2 also
shows the potentials as the service sector is a growing sector.
Unemployment rate is not very high in Bangladesh labor market. Therefore, it is not a very
serious problem. Instead of unemployment problem, underemployment is a serious problem
especially for female labor.

13
Figure 8: Underemployment rate of population aged 15 and above in Bangladesh by sex and residence, 1995-2006.
05
10152025303540455055606570758085
National (1995-
96)
Urban (1995-
96)
Rural (1995-
96)
National(1999-2000)
Urban(1999-2000
Rural(1999-2000)
National(2002-
03)
Urban(2002-
03)
Rural(2002-
03)
National(2005-
06)
Urban(2005-
06)
Rural(2005-
06)
Year
In p
erce
ntag
e
Bothsex
Male
Female
Source: BBS: Labour force survey (Dhaka, GoB, Various years) Bangladesh Economic Review
(GoB, various years)
Figure 8 shows that over the year the under employment rate of female labor increases
specially in the rural area. Underemployment rate of male labor declines from the year 2002-
2003. In 2005-2006 10.86% males and 68.25%, females are underemployed, while 77.02%
females are underemployed in the rural areas. Rahman (2005) argues that over the year
unemployment and underemployment levels of male workers decline, which implies that
male labors are mainly benefited from new job opportunities. This indicates that the
unemployment and under employment levels of female workers will not decline until all
unemployment and underemployed male workers are absorbed into the labor market.
However, there may strengthen other concept named ‘prisoner’s dilemma’. Eastman (1998)
shows a prisoner’s dilemma in which employees have incentives to work more than the
optional level of hours. Because they think, it may induce his (or her) position in the work
place. According to data available in 2005-2006, 41.50 percent male workers work more than
60 hours in a week in the urban area. 15.86 percent female workers work more than 60 hours,
12.71 percent female workers work 50-59 hours. Since both employers and employees know
about the existing surplus labor (high unemployment and underemployment level) in the
14
labor market of Bangladesh, insiders try to convince their employers providing more effort.
Hence, the outsiders are deprived. Otherwise, more job opportunities may be created. In this
case, work-sharing program may be introduced (Freeman and Gottschalk, 1998).
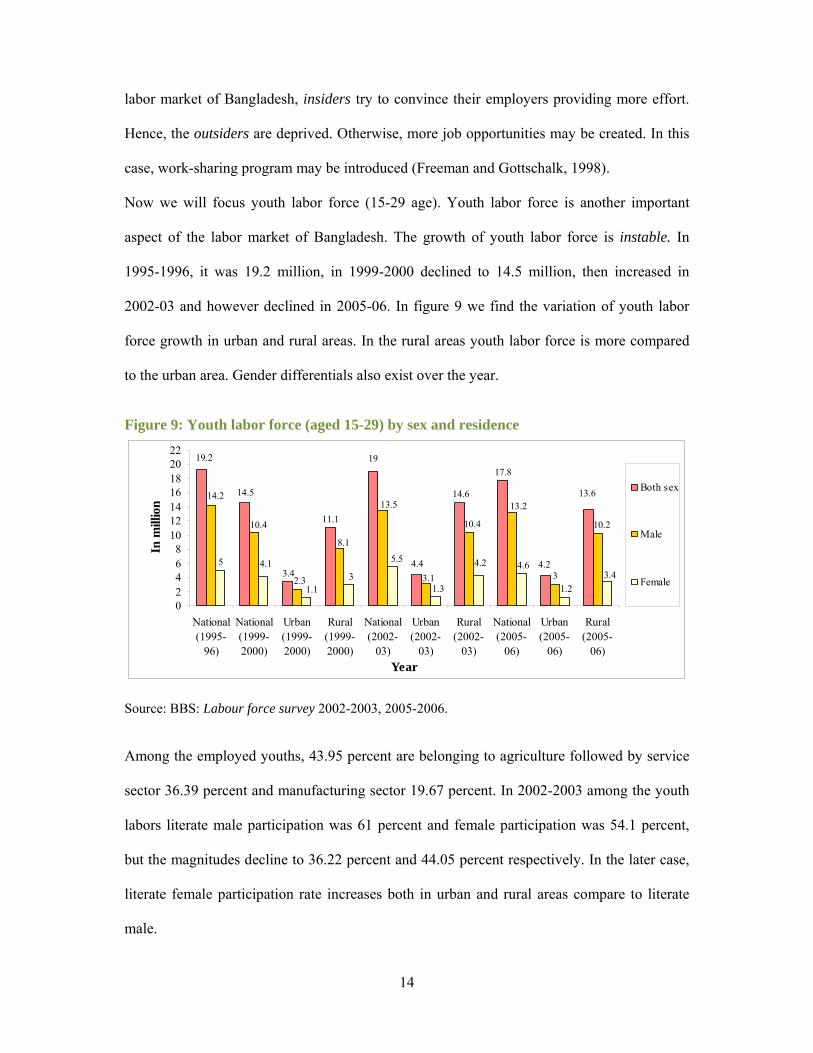
Now we will focus youth labor force (15-29 age). Youth labor force is another important
aspect of the labor market of Bangladesh. The growth of youth labor force is instable. In
1995-1996, it was 19.2 million, in 1999-2000 declined to 14.5 million, then increased in
2002-03 and however declined in 2005-06. In figure 9 we find the variation of youth labor
force growth in urban and rural areas. In the rural areas youth labor force is more compared
to the urban area. Gender differentials also exist over the year.
Figure 9: Youth labor force (aged 15-29) by sex and residence
4.4
19.2
14.5
11.1
19
4.2
13.6
17.8
14.6
3.4
14.2
8.1
13.5
3.12.3
10.4 10.4
13.2
3
10.2
5 5.5
1.33
1.1
4.1 4.2 4.6
1.23.4
02468
10121416182022
National(1995-
96)
National(1999-2000)
Urban(1999-2000)
Rural(1999-2000)
National(2002-
03)
Urban(2002-
03)
Rural(2002-
03)
National(2005-
06)
Urban(2005-
06)
Rural(2005-
06)Year
In m
illio
n
Both sex
Male
Female
Source: BBS: Labour force survey 2002-2003, 2005-2006.
Among the employed youths, 43.95 percent are belonging to agriculture followed by service
sector 36.39 percent and manufacturing sector 19.67 percent. In 2002-2003 among the youth
labors literate male participation was 61 percent and female participation was 54.1 percent,
but the magnitudes decline to 36.22 percent and 44.05 percent respectively. In the later case,
literate female participation rate increases both in urban and rural areas compare to literate
male.

15
Major Key findings of this section are that the labor market of Bangladesh is consistent with
Lewis two-sector model from various aspects. There is surplus labor in the rural economy, (as
the figure 5 and 8 show), the productivity differentials increase between rural and urban areas
and the sectoral wage differentials (see appendix 1) also exist in agriculture, manufacturing
and service sectors. The growth of output and employment increases in the manufacturing
and service sectors. In contrast, the unemployment rate is high in the urban areas. Because the
growth of manufacturing sector is not sufficient to absorb the surplus labor prevailed in the
urban economy.
In fact, manufacturing sector is an emerging sector for Bangladesh economy. The special
characteristics of manufacturing sector are:
• Manufacturing growth “pulls along” economic growth in such a way that other sectors
cannot operate like that sector. This argument is reflected in Table 1.
• “Learning by doing” concept is more relevant as well as more important in industry
than in agriculture or services. Learning by doing, innovation and intersectoral
linkages hence render overall productivity growth endogenous to growth in dynamic
manufacturing sectors.
• The technological change is generally initiated in the manufacturing sector then it is
diffused out of the sector.
• The manufacturing sector and service sector are interlinked which is the critical point
for Bangladesh labor market since the trend of employment rate in service sector is
upward over the year (see figure 3). The growth and increasing sophistication and
specialization of manufacturing may induce the demand for service inputs into
manufacturing sector (Tregenna, 2008).
For these district features of manufacturing sector in the next section, we will try to estimate
the demand determinants of labor in major industry groups. The econometric technique used
in this paper is ARDL (Autoregressive Distributed Lag Model).
16
III. The Demand Determinants of Labor in Major Industry Groups
In this section, we will estimate the demand determinants of employee and production worker
separately who works in the selected major industry groups. To avoid severe multicollinearity
problem, complexity and from the principles of parsimony, some variables are omitted from
the model and their proxy variables are incorporated in the model in some cases. Beside these
the unavailability of time series data of relevant factors restricts the number of explanatory
variables.
To estimate the demand determinants of employee, the following log linear model is
constructed:
lnemt = β0 + β1lnemt-1 + β2lnreicostt + β3lnrwicostt + β4lnfassett + β5lnrfact + β6lnvprodnt
+ β7lnvprodnt-1 + β8lnrimext + β9lnpwt + β10lnpwt-1 +ut
Where:
emt = average annual employee in t period
emt-1 = average annual employee in t-1 period
pwt = average annual production worker in t period
pwt-1= average annual production worker in t-1 period
reicostt = ratio of employment cost of employee and total industrial cost in t period
rwicostt = ratio of employment cost of production worker and total industrial cost in t period
fassett = Fixed assets in t period
rfact = number of reporting factories in t period
vprodnt = gross value of industrial production in t period
vprodnt-1 = gross value of industrial production in t-1period
rimext = ratio of import and export in t period
Given the availability of data, the log linear model is estimated for the period 1980-2002.
Table 2 reports the regression results.

17
Table 2: Regression results for employee
Dependent variable: Natural Log of number of employee Regressors Coefficients Standard Error T-ratio
lnemt-1 -0.15674 0.41 -0.38
lnreicostt 0.152261 0.42 0.36
lnrwicostt -0.37129 0.40 -0.93*
lnfassectt -0.09427 0.19 -0.48
lnrfact 0.114965 0.12 0.96*
lnvprodnt 0.099156 0.34 0.29
lnvprodnt-1 0.39702 0.38 1.04*
lnrimext 0.51904 0.24 2.18****
lnpwt 0.44237 0.44 1.00*
lnpwt-1 0.05132 0.26 0.19
Constant -3.1266 2.07 -1.55**
R2=0.99; R 2=0.98; observations =18
Note: *, **, *** **** denote one tailed significance at 0.25, 0.10, 0.05, 0.025 probability levels respectively.
To estimate the demand determinants of production worker, the following log linear model is
formed:
lnpwt= α0 + α1lnemt + α2lnreicostt + α3lnrwicostt + α4lnfassett + α5lnrfact + α6lnvprodnt +
α7lnvprodnt-1 + α8lnrimext+α9lnpwt-1 + α10lnemt-1 + vt
Where:
pwt = average annual production worker in t period
emt = average annual employee in t period
emt-1 = average annual employee in t-1 period
pwt-1 = average annual production worker in t-1 period
reicostt = ratio of employment cost of employee and total industrial cost in t period
rwicostt = ratio of employment cost of production worker and total industrial cost in t period
fassett = Fixed assets in t period
rfact = number of reporting factories in t period
vprodnt = gross value of industrial production in t period
vprodnt-1 = gross value of industrial production in t-1period
rimext = ratio of import and export in t period
By using the available data for the period 1980-2002, the log linear model is estimated. Table
3 reports the regression results.

18
Table 3: Regression results for production worker
Dependent variable: Natural Log of number of production worker
Regressors Coefficients Standard Error T-ratio
lnemt-1 0.28 0.28 1.00*
lnreicostt -0.50 0.28 -1.74***
lnrwicostt -0.009 0.34 -0.03
lnfassectt -0.15 0.15 -1.02*
lrrfact 0.16 0.08 1.91***
lnvprodnt 0.42 0.22 1.94***
lnvprodnt-1 -0.19 0.32 -0.61
lnrimext -0.24 0.23 -1.04*
lnpwt-1 0.04 0.21 0.21
lnemwt-1 0.28 0.31 0.89*
Constant 0.85 1.89 0.45
R2=0.99; R 2=0.99; observations =18
Note: *, **, *** **** denote one tailed significance at 0.25, 0.10, 0.05, 0.025 probability levels respectively.
According to the estimated value given in table 2 there is a negative relationship between the
recruitment in current year and previous year. It may economically significant in various
aspects, Table 2 shows that employee and production worker are not substitute, rather they
are complementary. For the improvement of productivity, technology, the coefficient of the
ratio of employment cost of employee and total industrial cost hold positive sign with lower
magnitude. It should be mentioned that in fixed assets land and improvement to land,
buildings, plant and machinery, transport and equipments are included. Hence, the coefficient
value of fixed assets partially shows the substitution effect that is negatively affect
recruitment of employee. But it is not statistically significant. From previous studies, it is
known that capital and blue-collar or unskilled workers are generally substitutes for each
19
other in production, however capital and skilled or white collar workers tend to be
complements. (Kaufman and Hotchkiss, 2003) But here we cannot explicitly provide any
evidence that support this hypothesis. The reason is that in this case blue-color and white-
color employees are jointly represented. As the number of factory rises, employment prospect
of employee also rises. The coefficients of production and its lagged value show that as the
production increases, enrollment also increases. The coefficient of import - export ratio
shows that if the trade balance is deteriorated, eventually it has no negative impact on
employee.
Table 3 specially represents the demand determinants of blue-color or unskilled workers. It is
sensible that recruitment of operative increases with employee. The coefficient sign of the
ratio of employment cost of production worker and total industrial cost is negative which
reflects that if government of Bangladesh implements minimum wage law, some operatives
may loss their jobs. As the fixed asset increases, the demand for unskilled or semi-skilled
worker declines accordingly. The coefficient of lagged value of production holds negative
sign, which implies that if the industry makes any inventory, it will lead to hire fewer
workers. In contrast to employee, if the trade balance is deteriorated, eventually it may lead to
fire a number of workers. Finally, the recruitment of employees and operatives in the lagged
year does not generate any negative impact on the demand for operative in the current year
contrary to the fact, if the enrollment of employees rises 1 percent in the lag year; the demand
for worker also rises by 0.28 percent.
The major findings of this section is that the employees who are engaged in the major
industry groups enjoy sustainable and secured jobs; while the operatives’ employment
position is very insecure. In the globalize economy the unskilled workers suffer more if the
trade balance become deteriorated.

20
IV. Conclusion and Policy Implications
As we have seen, the labor force participation over the year increases but job opportunity
does not increase in such a way that the country can absorb all the additional labor force. So
the focal point is to create the job opportunities. Keeping this in mind the policy should
include the following strategies:
• Since the underemployment rate in very high, especially in the rural area and (as we
have seen) RNF sector has the prospect to absorb the unskilled and semi-skilled labor
force, so the government should undertake specific policy measure to induce the RNF
sector. For this, rural infrastructure should be developed. As the SMEs’ (small and
medium enterprises) production technique is especially labor intensive, so providing
loan, training and other facility government can strengthen SMEs.
• Government may introduce work-sharing program and fix maximum working hours
that will reduce unemployment, underemployment rate in some extent.
• As the demand for labor is derived demand, if the government can accelerate the
economic growth rate using the macroeconomic components, labor demand will
increase as well.
• Government may take proper step to encourage the labor force to migrate overseas.
This procedure may induce the GNP growth rate that will lead to further job
opportunity in the country.
• As we have found that import-export ratio and unskilled labor demand is negatively
related, hence, if the government takes initiatives to improve the trade balance, it will
generate more job opportunities.
• Investment in the service sector and manufacturing sector should be encouraged.
Government should take proper step to prevent the capital flight to overseas. We have
found that as the number of factory rises, labor demand also rises.

21
• ILO studies suggest that governments ought consistently to incorporate the use of
“labor-based” rather than “equipment-based” production procedure in the public
investment policy (Islam, 2005)
• As the reservation wage of the labor in Bangladesh is very low, Bangladesh
government may urge foreign investors to invest in Bangladesh.
• Since the influence of demand determinants on the demand of skilled and unskilled
labor force is different, so policymaker must consider these features.
After all not only the government of Bangladesh, but also NGOs as well as other
organizations such as political, social, national and international should jointly or separately
take proper steps to eradicate poverty, unemployment and underemployment as well.

22
Reference
Ahmad, I., 1981. Wage Determination in Bangladesh Agriculture. Oxford Economic papers,
33, 1981, pp 298-322.
Chletsos, Michael., 2005. The Socio-Economic Determinants of Labour Demand in Greece:
1980-2001. http://ius.unicas.it/mc2005/papers/chietsos.pdf
Eastman, Wayne., 1998. Working for Position: Women, Men, and Managerial Work Hours.
Industrial Relations, Vol. 37, No. 1 (January 1998), UK.
Freeman, Richard B. and Gottschalk, peter., 1998. Generating Jobs: How to Increase Demand
for Less-Skilled Workers. Russell Sage Foundation, New York.
Hall, Robert E., 1970. Why Is the Unemployment Rate So High at Full Employment?
Brooking Papers on Economic Activity (3:1970).
Hossain, M., 1988. Nature and Impact of the Green Revolution in Bangladesh. Research
Paper 67, Washington, DC: International Food Policy Research Institute.
Hossain, Akhtar., 1996. Macroeconomic Issues and Policies: The case of Bangladesh.
University Press Limited, Dhaka, Bangladesh.
Islam, Iyanatul., 2005. Circumventing Macroeconomic conservatism: A policy framework for
growths, employment and poverty reduction. International labour review, Vol. 144
(2005), No. 1.
Kaufman, Bruce E. and Hotchkiss, Julie L., 2003. The Economics of Labor Markets. Sixth
edition, Thomson, South-Western.
Lewis, W. Arthur., 1954. Economic Development with Unlimited Supplies of Labor.
Manchester School of Economics and Social Studies, Vol. 22, No. 2 (May), pp.
139-91.
Mahmud, Woahiduddin., 1996. Employment Patterns and Income formation in Rural
Bangladesh: The Role of Rural Non-farm sector. The Bangladesh Development

23
Studies, Vol. XXIV, Nos. 3 & 4, Sept.-Dec. 1996, Dhaka, Bangladesh.
Osmani, S. R., 2005. The Role of Employment in Promoting the Millennium Development
Goals. Discussion Paper, Issues in Employment and Poverty. No. 18, October,
2005, Employment Strategy Department, International Labour Office, Geneva.
Rahman, Rushidan Islam, 1993: Determinants of Wage Employment and Labour Supply in
the Labour Surplus Situation of Rural Bangladesh. The Bangladesh Development
Studies, Vol. XXI, No. 2, June 1993, pp 45-66, Dhaka, Bangladesh.
_____, 2004, Employment Route to Poverty Reduction in Bangladesh: Role of Self-
Employment and Wage Employment. Discussion Paper, Issues in Employment
and Poverty. No. 17, November, 2004, Recovery and Reconstruction Department,
International Labour office, Geneva.
____, 2005, The Dynamics of the Labour Market and Employment in Bangladesh: A Focus
on Gender Dimensions. Employment Strategy Papers July 2005/13, Employment
Policy Unit, Employment Strategy Department, International Labour Office,
Geneva.
Tregenna, Fiona., 2008. The Contributions of Manufacturing and Services to Employment
Creation and Growth in South Africa. South African Journal of Economics, Vol.
76: 52 August 2008.
Varma, Sona and Kumar, Praveen., 1996. Rural Non-farm Employment in Bangladesh. The
Bangladesh Development Studies, Vol. XXIV, No. 3 & 4, Sept.-Dec. 1996.
Dhaka, Bangladesh.

24
Appendix
Appendix 1: Marginal productivity differentials in various sectors
In the short run, it is assumed that labor is only variable input. If the firm uses two factors
such as labor and capital, the firm’s profit is given as follows.
Π= P. Q – W. L (A. 1)
Where Π represents profit, P is the product price (assumed fixed for perfect competition in
the product market), Q is the level of output, W is the wage rate (assumed fixed for perfect
competition in the labor market), and L is the level of employment.
If the production function is:
Q = F (K, L) (A.2)
Replacing Q with the production function:
Π = P.F (K, L) – W.L (A.3)
The firm maximizes profit (A.1) by choosing how much of each factor to use. To obtain the
level of employment that maximizes profit, partially differentiating (A.3), then the first-order
condition is:
PLF∂∂ – W = 0 (A.4)
The term (∂ F/∂ L) represents the marginal product of labor (MPL). In case of perfect
competition, P is equal to marginal revenue (MR) and for imperfect competition, P is greater
than MR. However,
25
W = P.LF∂∂ = P. MPL (A. 5)
or, W = MR. MPL = MRPL (A. 6)
where MRPL represents marginal revenue product of labor. For long run demand function, it
is also found that
W = P. MPL
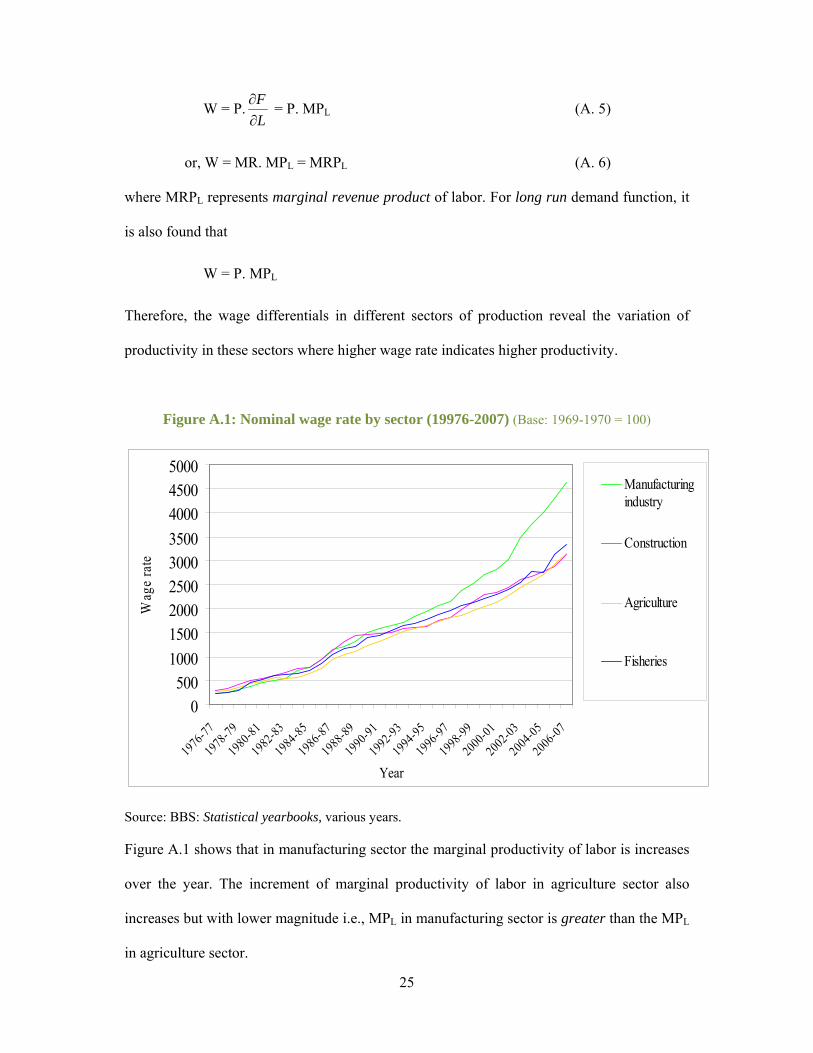
Therefore, the wage differentials in different sectors of production reveal the variation of
productivity in these sectors where higher wage rate indicates higher productivity.
Figure A.1: Nominal wage rate by sector (19976-2007) (Base: 1969-1970 = 100)
0500
100015002000250030003500400045005000
1976-7
7
1978
-79
1980
-81
1982
-83
1984
-85
1986
-87
1988
-89
1990
-91
1992
-93
1994
-95
1996
-97
1998
-99
2000
-01
2002
-03
2004-0
5
2006
-07
Year
Wag
e ra
te
Manufacturingindustry
Construction
Agriculture
Fisheries
Source: BBS: Statistical yearbooks, various years.
Figure A.1 shows that in manufacturing sector the marginal productivity of labor is increases
over the year. The increment of marginal productivity of labor in agriculture sector also
increases but with lower magnitude i.e., MPL in manufacturing sector is greater than the MPL
in agriculture sector.

26
Appendix 2: List of major industry groups
The major industry groups that have been considered to estimate the demand determinants of
labor in manufacturing sector, shows in table A 1. The data has been obtained from Statistical
Yearbooks of Bangladesh Bureau of Statistics in various years.
Table A. 1: Major industry groups
BSIC 1986
code Title of Category
BSIC 1986
code Title of Category
311-312 Food manufacturing 354 Petroleum refining
313 Beverage industries 355 Misc. prod. of petroleum & coal
314 Tobacco manufacturing 356 Rubber products
315 Animal feed 357 Plastic products
321-322 Mfg. of textiles 361 Pottery & China-ware
323 Wearing apparel except footwear 362 Glass & glass products
324 Leather & leather products 369 Non-metalic mineral products
325 Leather footwear 371-372 Iron & steel basic industries
326 Ginning & processing of fibers 381-382 Fabricated metal products
327 Embroidery of textile goods 383 Non-electrical Machinery
331 Wood & cork products 384 Electrical machinery
332 Furniture & fixtures (wooden) 385 Transport equipment
341 Paper & paper products 386 Measuring Instruments
342 Printing & publishing 387 Photographic & optical goods
351 Drugs & pharmaceuticals 391 Decorative
352 Industrial chemicals 392 Sports & athletic
353 Other chemical products 393-394 Other Mfg. Industries
Source: BBS: Statistical yearbooks, various years