Embed Size (px)
Citation preview
MPRAMunich Personal RePEc Archive
Factors Explaining the Interest Marginin the Banking Sectors of the EuropeanUnion
Joaquin Maudos and Juan Fernandez de Guevara
Instituto Valenciano de Investigaciones Economicas, Universitat deValencia
September 2003
Online at http://mpra.ub.uni-muenchen.de/15252/MPRA Paper No. 15252, posted 16. May 2009 13:52 UTC
1
FACTORS EXPLAINING THE INTEREST MARGIN IN THE BANKING
SECTORS OF THE EUROPEAN UNION
Joaquín Maudos (Ivie and Universitat de València)
Juan Fernández de Guevara (Ivie)
Abstract
This study analyses the interest margin in the principal European banking sectors (Germany, France, the United Kingdom, Italy and Spain) in the period 1993-2000 using a panel of 15,888 observations, identifying the fundamental elements affecting this margin. Our starting point is the methodology developed in the original study by Ho and Saunders (1981) and later extensions, but widened to take banks’ operating costs explicitly into account. Also, unlike the usual practice in the literature, a direct measure of the degree of competition (Lerner index) in the different markets is used. The results show that the fall of margins in the European banking system is compatible with a relaxation of the competitive conditions (increase in market power and concentration), as this effect has been counteracted by a reduction of interest rate risk, credit risk, and operating costs.
Key words: margins, competition
JEL Classification: G21, L11
Corresponding author: Joaquín Maudos, Universitat de València. Dpto. de Análisis Económico. Edificio departamental oriental; Avda. de los Naranjos, s/n; 46022 Valencia, SPAIN. Fax: 34-96 393 08 56; Email: [email protected]
Instituto Valenciano de Investigaciones Económicas (Ivie). C/ Guardia Civil 22, Esc. 2, 1º; 46020 Valencia, Spain. Email: [email protected]
2
1. Introduction*
The banking sector plays a fundamental role in economic growth, as it is the
basic element in the channelling of funds from lenders to borrowers. In this sense, it is
important that this work of intermediation by the banks is carried out with the lowest
possible cost in order to achieve greater social welfare. Obviously, the lower the banks’
interest margin, the lower the social costs of financial intermediation will be.
In this context, one part of the literature on banking has concentrated on
analysing the elements determining the interest margin. The pioneering study by Ho and
Saunders (1981), starting from the conception of banking firms as mere intermediaries
between lenders and borrowers, finds that the interest margin has two basic
components: the degree of competition of the markets and the interest rate risk to which
the bank is exposed. This model has been extended in several studies: Allen (1988)
widens it to permit the existence of different types of credits and deposits; McShane and
Sharpe (1985) change the source of interest rate risk, situating it in the uncertainty of the
money markets instead of the interest rates on credits and deposits, as in the original
study by Ho and Saunders (1981); Angbanzo (1997) extends the model to take into
account credit risk as well as interest rate risk.
This study analyses the interest margin in the principal European banking
sectors, identifying the fundamental elements affecting this margin. The starting point
for analysing the determinants of the interest margin is the original model of Ho and
Saunders (1981) and later extensions by other authors, but widened to take
banks´operating costs explicitly into account. Also, unlike the usual practice in the
literature described above, we will use direct measurements of the degree of
competition in the different markets, calculated by means of concentration indices or
Lerner indices of market power.
The reduction of the interest margin that has occurred in recent years in the
banking sectors of the European Union is usually interpreted as a result of the growth of
competition. However, in the light of the theoretical model, banking margins do not
depend only on the intensity of competition, but also on other factors such as interest
risk, credit risk, the evolution of operating costs, etc. A decrease in banking margins is
therefore compatible with a decrease in the degree of competition if the effect of the
* The authors acknowledge the comments of two anonymous referees and the funding received from the Spanish Savings Banks Foundation (FUNCAS) and from the Ministerio de Ciencia y Tecnología (through projects SEC2001-2950 and SEC2002-03375). They also wish to thank the Ivie for the information placed at their disposal for the purposes of the study and the Bank of Spain for the daily interest rate series provided.
3
latter is counteracted by the effect of the evolution of the other determinants of the
interest margin.
In recent years many studies have been published1 which analyse the evolution
of competition in the banking sectors of Europe in the context of phenomena like
deregulation, globalisation, increased concentration due to mergers, etc. These studies
concentrate, in general, on analysing the effect of market concentration on competition,
considering neither the impact on margins nor the effect of variables other than
competition which also affect banking margins, and therefore intermediation costs.
Of special interest because of the methodology and sample used is the study by
Saunders and Schumacher (2000), who apply the original model of Ho and Saunders
(1981) to analyse the determinants of the interest margin in six countries of the
European Union and in the United States during the period 1988-95. Our study differs
from Saunders and Schumacher (2000) in several aspects: a) we introduce the influence
of operating costs into the modelling of the interest margin; b) we use direct
measurements of market power; c) the determinants of the interest margin are analysed
in a single stage; d) it extends the period of study until the year 2000, though it is
centred on the principal European countries (Germany, France, United Kingdom, Italy
and Spain); and e) the sample consists of a panel data of 1,826 banks (in 2000), as
opposed to the 614 of Saunders and Schumacher’s study.
The results of analysing the contribution of the different factors explaining the
interest margin may be useful in the design of specific measures of economic policy.
Thus, if a significant part of the evolution of the interest margin is explained by the
volatility of interest rates and the credit risk instead of the market power of firms, public
policies should be aimed at achieving a climate of financial stability. If, on the contrary,
market power is the factor that most helps to explain the variability of the interest
margin, public initiatives must be aimed at encouraging competition among banks.
Obviously, depending on the contribution of the other variables explaining the interest
margin (quality of management, operating costs, etc.), the specific measures of
economic policy must be oriented towards specific aspects of banking business.
In this context, the study is structured as follows. Section 2 briefly describes the
methodology used to identify the determinants of the interest margin. Section 3
develops the empirical specification of the model to be estimated and of the variables,
and the sample used is described in section 4. Section 5 presents the empirical results of
the estimation. Finally, section 6 contains the main conclusions of the study.
1 Corvoisier and Gropp (2002), De Bandt and David (2000), Bikker, and Haaf (2002), among others.
4
2. The determinants of the interest margin
The starting point for analysing the determinants of the interest margin is the
model of Ho and Saunders (1981). Different versions of the model have been estimated
for the specific case of the United States in Ho and Saunders (1981), Allen (1988) and
Angbazo (1997); and for a sample of seven OCDE countries (six European ones plus
the United States) in Saunders and Schumacher (2000).
In this models, a bank is viewed as a risk-averse dealer in the credit market2,
acting as an intermediary between demanders and suppliers of funds. The planning
horizon is a single period during which the bank sets interest rates at the beginning of
the period, before any deposits or loans are made, remain constant for the whole period.
The banks, who are risk averse and have to deal with demands for loans, and offers of
deposits, that reach them asymmetrically in time, must set interest rates on loans (rL)
and deposits (rD) optimally so as to minimise the risk deriving from the uncertainty of
interest rates in the money markets to which they have to resort in the event of excessive
demand for loans or insufficient supply of deposits. For this, they set their interest rates
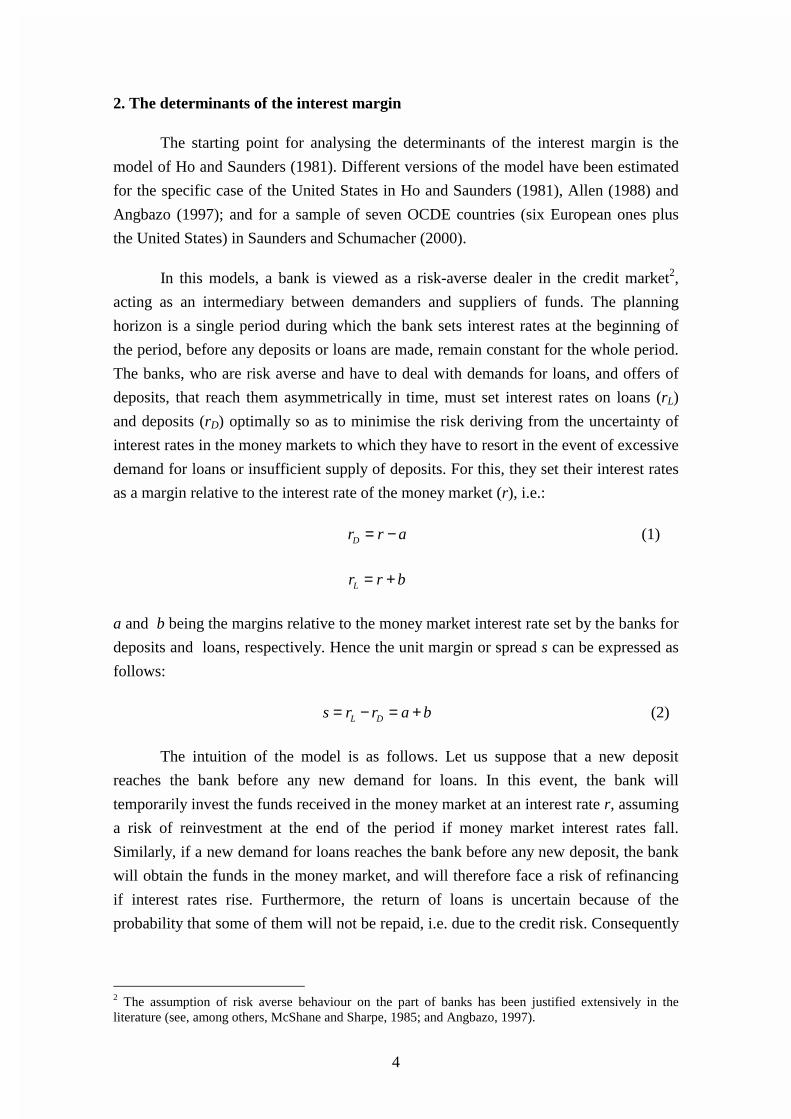
as a margin relative to the interest rate of the money market (r), i.e.:
Dr r a= − (1)
Lr r b= +
a and b being the margins relative to the money market interest rate set by the banks for
deposits and loans, respectively. Hence the unit margin or spread s can be expressed as
follows:
L Ds r r a b= − = + (2)
The intuition of the model is as follows. Let us suppose that a new deposit
reaches the bank before any new demand for loans. In this event, the bank will
temporarily invest the funds received in the money market at an interest rate r, assuming
a risk of reinvestment at the end of the period if money market interest rates fall.
Similarly, if a new demand for loans reaches the bank before any new deposit, the bank
will obtain the funds in the money market, and will therefore face a risk of refinancing
if interest rates rise. Furthermore, the return of loans is uncertain because of the
probability that some of them will not be repaid, i.e. due to the credit risk. Consequently
2 The assumption of risk averse behaviour on the part of banks has been justified extensively in the literature (see, among others, McShane and Sharpe, 1985; and Angbazo, 1997).
5
the bank will apply a margin to loans (b) and deposits (a) that will compensate for both
the interest rate and credit risk.
The initial wealth of the bank is determined by the difference between its assets
– loans (L) and net money market assets (M)- and its liabilities – deposits (D):
W0= L0 -D0+M0=I0+M0 (3)
Lo-Do being the net credit inventory (I0).
The criticism by Lerner (1981) of the original model of Ho and Saunders (1981)
is taken up incorporating into the model the productive nature of the banking firm by
including the production costs associated with the process of intermediation between
deposits and loans. Thus, the operating costs of a banking firm are assumed to be a
function of the deposits captured (C(D)) and the loans made (C(L)), so that the costs of
the net credit inventory can be expressed as C(I)=C(L)-C(D).
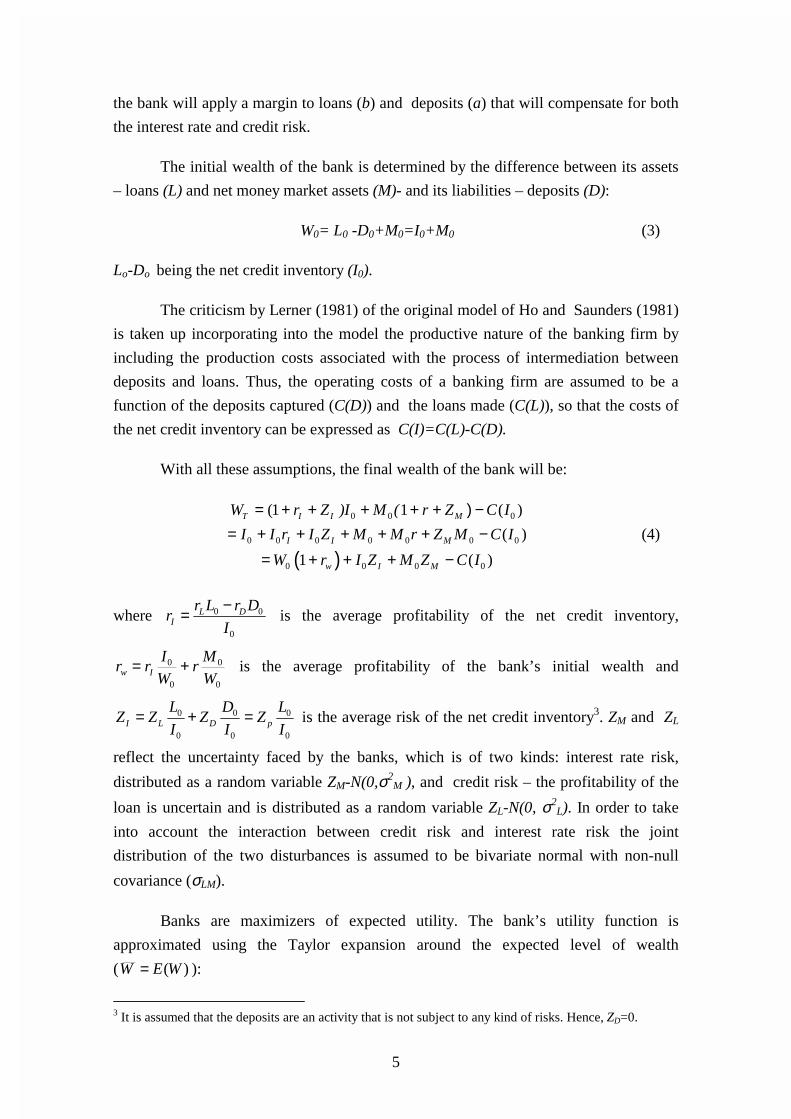
With all these assumptions, the final wealth of the bank will be:
( )
0 0 0
0 0 0 0 0 0 0
0 0 0 0
(1 1 ( )
( )
1 ( )
T I I M
I I M
w I M
W r Z )I M ( r Z C I
I I r I Z M M r Z M C I
W r I Z M Z C I
= + + + + + ) −= + + + + + −
= + + + − (4)
where 0 0
0
L DI
r L r Dr
I
−= is the average profitability of the net credit inventory,
0
0
0
0
W
Mr
W
Irr Iw += is the average profitability of the bank’s initial wealth and
0 0 0
0 0 0I L D p
L D LZ Z Z Z
I I I= + = is the average risk of the net credit inventory3. ZM and ZL
reflect the uncertainty faced by the banks, which is of two kinds: interest rate risk,
distributed as a random variable ZM-N(0,σ2M
), and credit risk – the profitability of the
loan is uncertain and is distributed as a random variable ZL-N(0, σ2L). In order to take
into account the interaction between credit risk and interest rate risk the joint
distribution of the two disturbances is assumed to be bivariate normal with non-null
covariance (σLM).
Banks are maximizers of expected utility. The bank’s utility function is
approximated using the Taylor expansion around the expected level of wealth
( )(WEW = ):
3 It is assumed that the deposits are an activity that is not subject to any kind of risks. Hence, ZD=0.
6
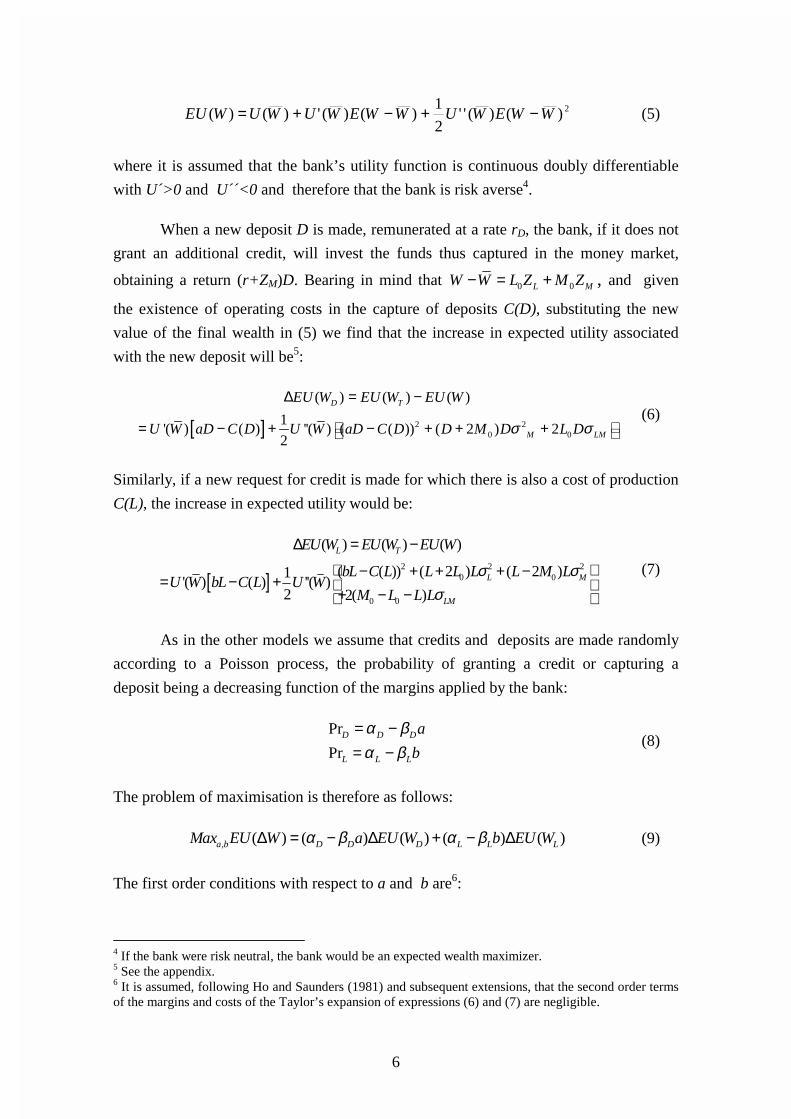
2)()(''2
1)()(')()( WWEWUWWEWUWUWEU −+−+= (5)
where it is assumed that the bank’s utility function is continuous doubly differentiable
with U´>0 and U´´<0 and therefore that the bank is risk averse4.
When a new deposit D is made, remunerated at a rate rD, the bank, if it does not
grant an additional credit, will invest the funds thus captured in the money market,
obtaining a return (r+ZM)D. Bearing in mind that 0 0L MW W L Z M Z− = + , and given
the existence of operating costs in the capture of deposits C(D), substituting the new
value of the final wealth in (5) we find that the increase in expected utility associated
with the new deposit will be5:
[ ] 2 2
0 0
( ) ( ) ( )
1'( ) ( ) ''( ) ( ( )) ( 2 ) 2
2
D T
M LM
EU W EU W EU W
U W aD C D U W aD C D D M D L Dσ σ
∆ = −
= − + − + + + (6)
Similarly, if a new request for credit is made for which there is also a cost of production
C(L), the increase in expected utility would be:
[ ]
2 2 20 0
0 0
( ) ( ) ( )
( ( )) ( 2 ) ( 2 )1'( ) ( ) ''( )
2 2( )
L T
L M
LM
EU W EU W EU W
bL C L L L L L M LU W bL C L U W
M L L L
σ σσ
∆ = −
− + + + −= − + + − −
(7)
As in the other models we assume that credits and deposits are made randomly
according to a Poisson process, the probability of granting a credit or capturing a
deposit being a decreasing function of the margins applied by the bank:
Pr
PrD D D
L L L
a
b
α βα β
= −= −
(8)
The problem of maximisation is therefore as follows:
, ( ) ( ) ( ) ( ) ( )a b D D D L L LMax EU W a EU W b EU Wα β α β∆ = − ∆ + − ∆ (9)
The first order conditions with respect to a and b are6:
4 If the bank were risk neutral, the bank would be an expected wealth maximizer. 5 See the appendix. 6 It is assumed, following Ho and Saunders (1981) and subsequent extensions, that the second order terms of the margins and costs of the Taylor’s expansion of expressions (6) and (7) are negligible.
7
20 0
2 20 0
0 0
1 ( ) 1 ''( )[( 2 ) 2 ]
2 4 '( )
1 1 ( ) 1 ''( )[( 2 ) ( 2 )
2 2 4 '( )
2 ( ) ]
M
DM L M
D
LL
L
L M
C D U Wa D M L
D U W
C L U Wb L L L M
L U W
M L L
α σ σβ
α σ σβ
σ
= + − + +
= + − + + −
+ − −
(10)
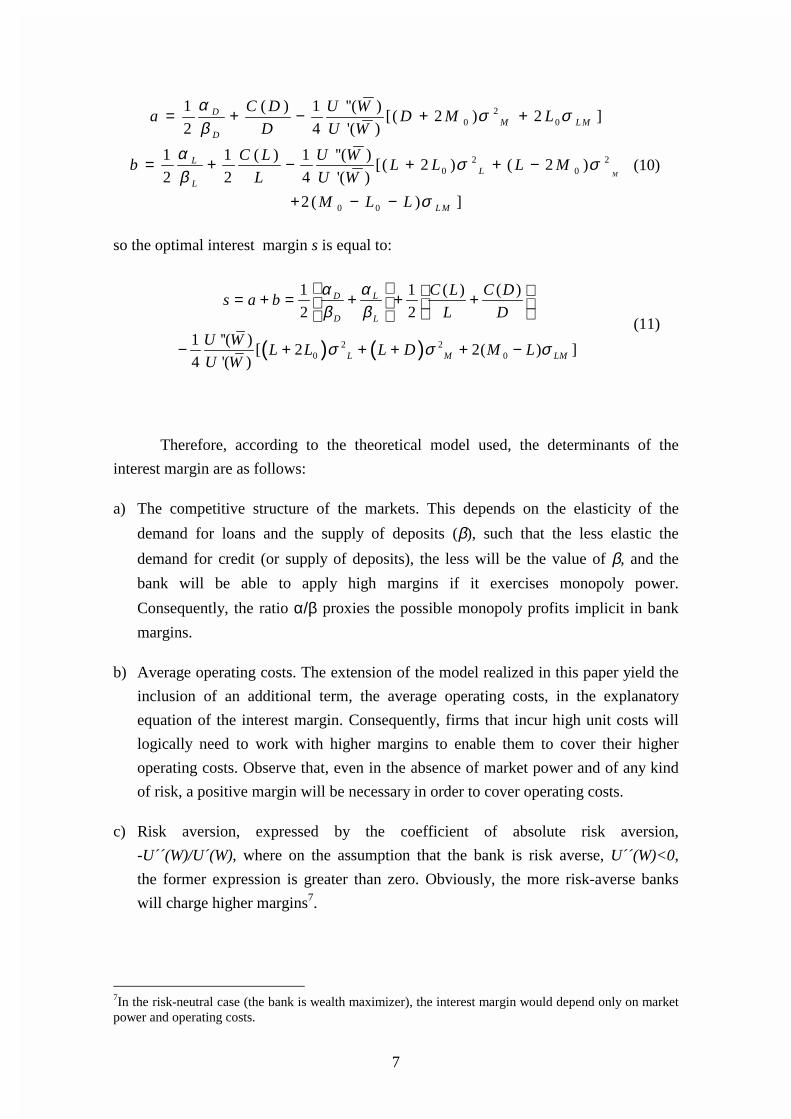
so the optimal interest margin s is equal to:
( ) ( )2 2
0 0
1 1 ( ) ( )
2 2
1 ''( )[ 2 2( ) ]
4 '( )
D L
D L
L M LM
C L C Ds a b
L D
U WL L L D M L
U W
α αβ β
σ σ σ
= + = + + +
− + + + + − (11)
Therefore, according to the theoretical model used, the determinants of the
interest margin are as follows:
a) The competitive structure of the markets. This depends on the elasticity of the
demand for loans and the supply of deposits (β), such that the less elastic the
demand for credit (or supply of deposits), the less will be the value of β, and the
bank will be able to apply high margins if it exercises monopoly power.
Consequently, the ratio α/β proxies the possible monopoly profits implicit in bank
margins.
b) Average operating costs. The extension of the model realized in this paper yield the
inclusion of an additional term, the average operating costs, in the explanatory
equation of the interest margin. Consequently, firms that incur high unit costs will
logically need to work with higher margins to enable them to cover their higher
operating costs. Observe that, even in the absence of market power and of any kind
of risk, a positive margin will be necessary in order to cover operating costs.
c) Risk aversion, expressed by the coefficient of absolute risk aversion,
-U´´(W)/U´(W), where on the assumption that the bank is risk averse, U´´(W)<0,
the former expression is greater than zero. Obviously, the more risk-averse banks
will charge higher margins7.
7In the risk-neutral case (the bank is wealth maximizer), the interest margin would depend only on market power and operating costs.
8
d) The volatility of money market interest rates (σ2M). The more volatile they are, the
greater will be the market risk, and it will therefore be necessary to operate with
higher margins, as the banks will require a higher premium at the margin.
e) The credit risk, captured by the variable σ2L. The greater the uncertainty or the
volatility of the return expected on the loans granted (risk of default), the greater
will be the margin with which the bank works.
f) The covariance or interaction between interest rate risk and credit risk σLM.
g) The average size of the credit and deposit operations undertaken by the bank
(captured by the term L+D) and the total volume of credits (L+2L0). The model
predicts that the unit margins are an increasing function of the average size of
operations. The justification is that, for a given value of credit risk and of market
risk, an operation of greater size would mean a greater potential loss, so the bank
will require a greater margin. Likewise, the potential loss will be greater for those
banks in which the volume of credits granted is greater.
The assumptions made in deriving the interest margin from the theoretical model
set out provide a margin that could be called “pure”. Obviously, in practice there exist
other variables that explain the interest margin, capturing the influence of aspects -
institutional, regulatory, etc. – which potentially distort the pure margin and are difficult
to incorporate into the theoretical model. Specifically, the additional variables
considered in the literature are:
h) The payment of implicit interest: the bank, instead of remunerating deposits
explicitly by paying an interest rate, offers various “free” banking services.
i) The opportunity cost of keeping reserves. The maintenance of bank reserves
remunerated at an interest rate below that of the market involves costs whose
magnitude will depend on the volume of reserves and on their opportunity cost. The
sign is expected to be positive, as the greater the volume of liquid reserves, the
greater the opportunity costs, so a greater interest margin is needed.
j) The quality of management. As shown by Angbanzo (1997), good management
implies selecting highly profitable assets and low-cost liabilities, so a positive
relationship is to be expected between the quality of management and the interest
margin.
9
3. Empirical approach
Empirical approach
There are two empirical approaches to the model of Ho and Saunders (1981) and
its subsequent extensions. On the one hand, in Ho and Saunders (1981) and Saunders
and Schumacher (2000) the empirical estimation of the determinants of the interest
margin follows a two-stage process. In the first stage, the effect of the explanatory
variables of the interest margin not explicitly introduced into the theoretical model is
controlled in order to obtain an estimate of the “pure” margin. The second stage
analyses the relationship between this “pure” margin and the variables posited by the
theoretical model. The application of this approach has the advantage that it allows a
“pure” interest margin to be estimated, though it requires a time series long enough to
be able to estimate the pure margin.
On the other hand, McShane and Sharpe (1985) and Angbazo (1997) use a
single-stage approach, including in the explanation of the interest margin both the
variables of the theoretical model and the additional variables or imperfections that
reflect other aspects not incorporated into the modelling of the pure margin.
Since the period studied in this paper covers the years 1993 to 2000, the
availability of annual observations for 8 years makes it impossible to apply the two-
stage methodology, so we use the single-stage methodology.
Variables
The estimation of the theoretical model developed in the previous section for the
specific case of the banking sectors of the European countries considered requires the
variables of the model to be proxied empirically as a function of the statistical
information available in the data base.
According to the theoretical model presented, there are seven variables that
determine the interest margin: the structure of the market, unit operating costs, the
banks’ degree of risk aversion, the volatility of market interest rates, credit risk, the
covariance between the latter and market risk, the average size of operations and the
volume of credits granted. The three imperfections mentioned above are also included.
Each of these variables is proxied empirically as follows:
10
a) Market structure
To proxy the competitive structure of the market two alternative variables will be
used. First, the degree of concentration of the market in which the banks compete,
proxied by the Herfindahl index (HERF), is used. This index, defined as the sum of the
squares of the market shares, is proxied on the assumption that competition takes place
on a national scale, as only in the case of big banks and in wholesale markets could a
greater than national market be assumed8. Total assets are used as a proxy of banking
activity.
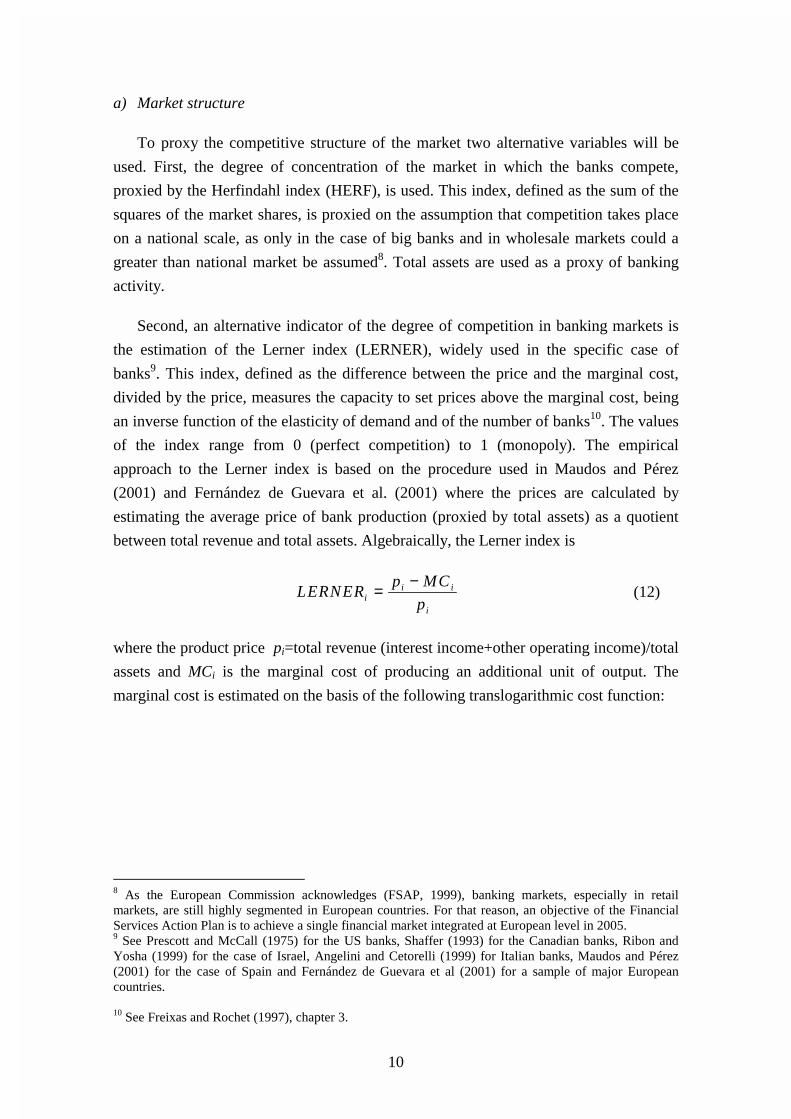
Second, an alternative indicator of the degree of competition in banking markets is
the estimation of the Lerner index (LERNER), widely used in the specific case of
banks9. This index, defined as the difference between the price and the marginal cost,
divided by the price, measures the capacity to set prices above the marginal cost, being
an inverse function of the elasticity of demand and of the number of banks10. The values
of the index range from 0 (perfect competition) to 1 (monopoly). The empirical
approach to the Lerner index is based on the procedure used in Maudos and Pérez
(2001) and Fernández de Guevara et al. (2001) where the prices are calculated by
estimating the average price of bank production (proxied by total assets) as a quotient
between total revenue and total assets. Algebraically, the Lerner index is
i ii
i
p MCLERNER
p
−= (12)
where the product price pi=total revenue (interest income+other operating income)/total
assets and MCi is the marginal cost of producing an additional unit of output. The
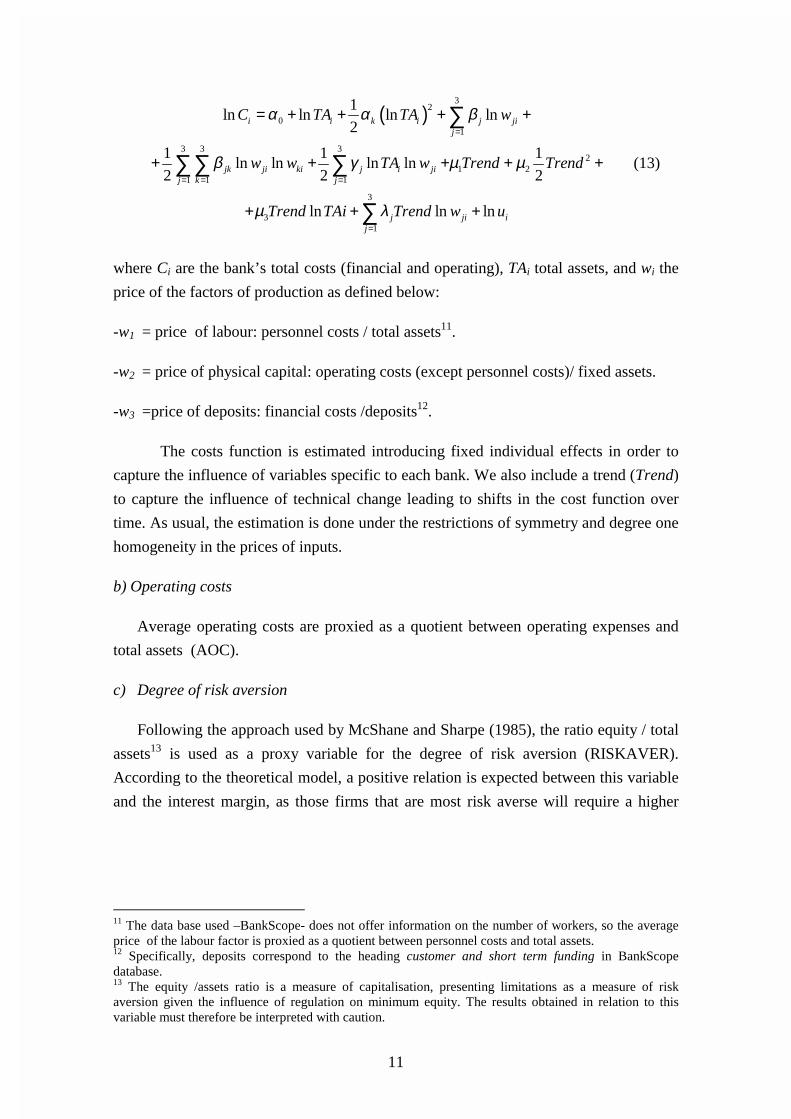
marginal cost is estimated on the basis of the following translogarithmic cost function:
8 As the European Commission acknowledges (FSAP, 1999), banking markets, especially in retail markets, are still highly segmented in European countries. For that reason, an objective of the Financial Services Action Plan is to achieve a single financial market integrated at European level in 2005. 9 See Prescott and McCall (1975) for the US banks, Shaffer (1993) for the Canadian banks, Ribon and Yosha (1999) for the case of Israel, Angelini and Cetorelli (1999) for Italian banks, Maudos and Pérez (2001) for the case of Spain and Fernández de Guevara et al (2001) for a sample of major European countries. 10 See Freixas and Rochet (1997), chapter 3.
11
( )3
2
01
3 3 32
1 21 1 1
3
31
1ln ln ln ln
2
1 1 1ln ln ln ln
2 2 2
ln ln ln
i i k i j jij
jk ji ki j i jij k j
j ji ij
C TA TA w
w w TA w Trend Trend
Trend TAi Trend w u
α α β
β γ µ µ
µ λ
=
= = =
=
= + + + +
+ + + + +
+ + +
∑
∑∑ ∑
∑
(13)
where Ci are the bank’s total costs (financial and operating), TAi total assets, and wi the
price of the factors of production as defined below:
-w1 = price of labour: personnel costs / total assets11.
-w2 = price of physical capital: operating costs (except personnel costs)/ fixed assets.
-w3 =price of deposits: financial costs /deposits12.
The costs function is estimated introducing fixed individual effects in order to
capture the influence of variables specific to each bank. We also include a trend (Trend)
to capture the influence of technical change leading to shifts in the cost function over
time. As usual, the estimation is done under the restrictions of symmetry and degree one
homogeneity in the prices of inputs.
b) Operating costs
Average operating costs are proxied as a quotient between operating expenses and
total assets (AOC).
c) Degree of risk aversion
Following the approach used by McShane and Sharpe (1985), the ratio equity / total
assets13 is used as a proxy variable for the degree of risk aversion (RISKAVER).
According to the theoretical model, a positive relation is expected between this variable
and the interest margin, as those firms that are most risk averse will require a higher
11 The data base used –BankScope- does not offer information on the number of workers, so the average price of the labour factor is proxied as a quotient between personnel costs and total assets. 12 Specifically, deposits correspond to the heading customer and short term funding in BankScope database. 13 The equity /assets ratio is a measure of capitalisation, presenting limitations as a measure of risk aversion given the influence of regulation on minimum equity. The results obtained in relation to this variable must therefore be interpreted with caution.
12
margin in order to cover the higher costs of equity financing compared to external
financing14.
d) Volatility of market interest rates
Uncertainty in the money markets is reflected in the theoretical model by the
variance of market interest rates (σ2M). The empirical proxying of this variable is
consequently based on a measurement of the volatility of market interest rates such as
the standard deviation (SD). Specifically, we will use the annual standard deviation of
daily interest rates of three alternative types, attempting to approximate the average
period of maturity of the assets and liabilities in the banks’ balance sheets15:
- The three-month interest rate in the inter-bank market (SD3M).
- Return on medium term public debt in national markets: treasury bonds with
three-year maturity period (SD3Y).
- Return on long term public debt in national markets: treasury bonds with ten
year maturity period (SD10Y).
On the basis of daily interest rate data we have calculated the corresponding annual
deviations in each of the countries analysed16.
e) Credit risk
The risk of non-repayment or default on a credit (credit risk) requires the bank to
apply a risk premium implicitly in the interest rates charged for the operation. Ideally,
the credit risk could be proxied by variables such as problem loans and the provisions
for insolvencies. Unfortunately, Bankscope database only offers these variables for a
very small number of banks17, so credit risk will be proxied initially by the loans/total
assets ratio (CRERISK). It is to be expected that firms specialising in the granting of
14A more adequate measure of risk aversion would be the capital held in excess of regulatory capital (capital buffer), but unfortunately the variable capital adequacy ratio is available only for a small number of banks (12% of the sample) because this ratio can not be calculated by looking at the balance sheet of a bank but has to be calculated internally by the bank (at their option they may publish this ratio in their annual report). 15 It has not been possible to obtain information on daily interest rates with other maturities. 16 The information was facilitated by the Bank of Spain. 17 For example, the variable non-performing loans is only available for 10% of the banks of the sample (for Germany, this variable is not available for any year of the sample). In the case of loan loss provisions, the variable is also available for a small group of banks (for Germany there are only 11 observations), albeit more numerous than the one for the variable problem loans (28% of the sample). We will therefore check the robustness of the results using the variable loan loss provisions/loans as a proxy for credit risk.
13
loans are more exposed to credit risk, so this variable is expected to have a positive
influence on the interest margin.
f) Interaction between credit risk and market risk
Interaction between credit risk and market risk (SD*CRERISK). As a proxy for this
variable we use the product of the measurement of credit risk and the rate of interest, i.e.
CRERISK and each of the variables of credit risk (SD3M, SD3Y, SD10Y).
g) Average size of operations/ volume of loans
Although the theoretical model shows the importance of the average size of
operations as a determinant of the interest margin, the information contained in
Bankscope does not permit this variable to be proxied empirically. In accordance with
the theoretical model, however, the volume of loans granted (in logarithms) is included
as an explanatory variable (SIZE).
The additional variables other than those determining the “pure” interest margin, are
proxied as follows:
h) Implicit interest payments
Following Ho and Saunders (1981), Angbanzo (1997) and Saunders and
Schumacher (2000) we will use the variable operating expenses net of non-interest
revenues, expressed as a percentage of total assets (IIP). A positive sign is expected.
i) Opportunity costs of bank reserves
This variable is proxied by the ratio of liquid reserves / total assets (RESER), using
the cash variable (cash and due from banks) as a proxy for bank reserves.
j) Quality of management
As mentioned earlier, high quality management translates into a profitable
composition of assets and a low-cost composition of liabilities. The quality or efficiency
of management is proxied by the cost to income ratio (EF) which is defined as the
operating cost necessary to generate one unit of gross income. An increase in this ratio
implies a decrease in the efficiency or quality of management, which will translate into
a lower interest margin. So a negative sign is expected.
14
Finally, the net interest margin, defined as the difference between revenue and
financial costs in relation to total assets (NIM) is used as the dependent variable.
4. Description of the sample
The information used to estimate the model is taken from the Bureau Van Dijk’s
BankScope data base, using unconsolidated financial statements, or consolidated ones if
the former were not available. The analysis is conducted on individual banks. The
sample contains a total of 15,888 observations corresponding to a number of banking
firms that varies from 1,436 in 1993 to 1,796 in 2000. By countries, in 2000 Germany
represents 64.5% of the total number of observations, Italy 19.4%, France 10.3%, Spain
3.6% and the United Kingdom 2.4%.
The sample used is less than the total number of observations in the data base, as
the information has been filtered using two criteria: a) we eliminate those banks for
which any of the variables necessary for estimating the explanatory model of the
interest margin is not available; b) we have also eliminated the banks whose input prices
(necessary for estimating the cost function) vary from the average for each country and
year by more than two and a half times the standard deviation.
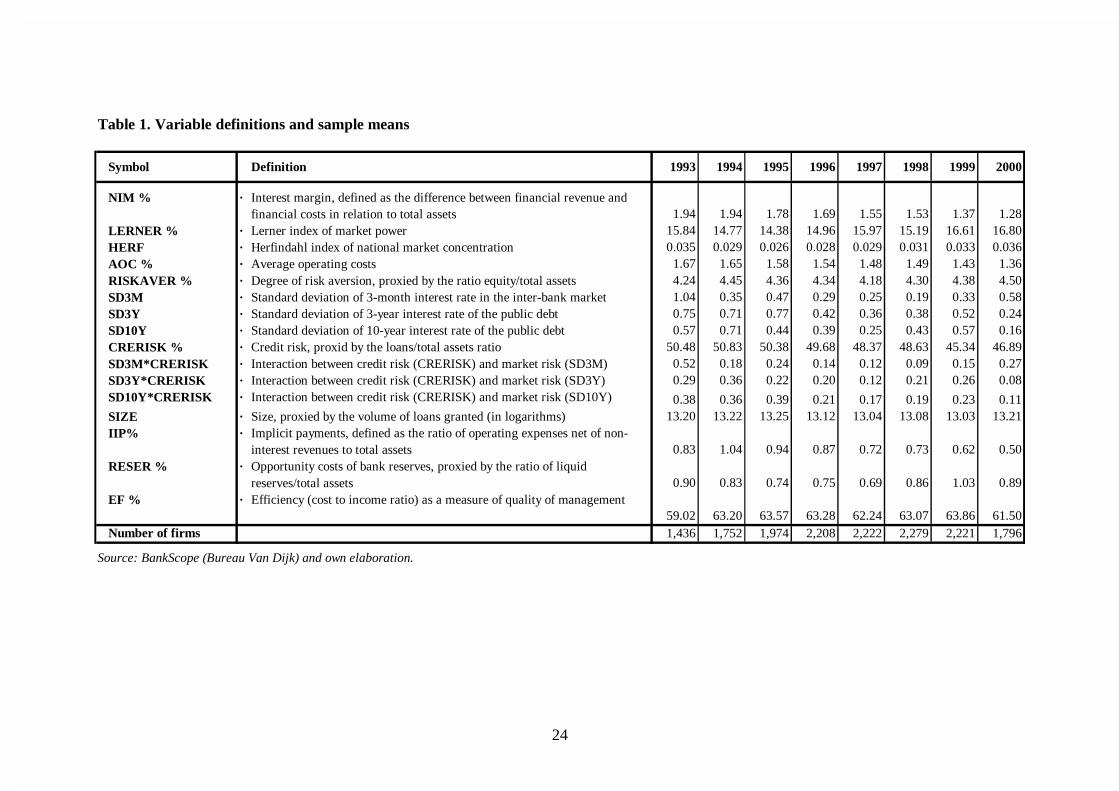
Table 1 shows the descriptive statistics both of the interest margin and of its
explanatory variables for the whole sample of the European countries considered. In the
case of the variable being studied– the net interest margin – there has been a reduction
of 34% in the period analysed, to 1.28% in 2000. The competitive structure of the
markets, proxied by the Lerner index, has not followed a uniform pattern. A reduction
of market power occurred from 1993 to 1995, and an increase thereafter, such that the
value of the index in 2000 (16.80) was higher than that of 1993 (15.84), so an increase
in competitive conditions was not verified. This result is similar to the evidence
contributed by Fernández de Guevara et al. (2001) for the same European countries. In
the case of market concentration, proxied by the Herfindahl index, the time evolution of
the variable is similar to the Lerner index, falling until 1995 and increasing thereafter to
such an extent that the concentration in 2000 (0.036) was practically similar to that of
1993 (0.035). The increase in concentration in the second half of the 1990s may be due
to the process of mergers and acquisitions among European banks, which may also be
behind the explanation of the increase in market power 18.
18 Bikker and Haaf (2002), using a broad sample of countries (European and non- European), analyse the relationship between competition and concentration, their results showing that competition decreases as
15
The volatility of interest rates decreased greatly regardless of the interest rate
used, the degree of inequality among countries in long term public debt rates being
lower. Risk aversion increased in the years analysed, though it must be borne in mind
that it is being proxied by the equity/assets ratio, so an increase was occurring in the
levels of bank capitalisation in Europe. Credit risk, proxied by the loans/assets ratio,
decreased from the mid-1990s onwards. Average costs decreased over the period
studied, showing the effort made by European banks. The opportunity cost of reserves
(liquidity) in 2000 was at a similar value to 1993, while the payment of implicit interest
decreased during the period considered19. Finally, the cost to income ratio was fairly
stable around an average level of 63%.
5. Results
The explanatory equation of the interest margin is estimated introducing fixed
effects with the aim of capturing the influence of specific characteristics of each
individual, using the within-group estimator20. Time effects are also introduced to
capture the influence of variables specific to each year, as well as dummy variables
specific to each country and to each institutional type of banking firm (banks, savings
banks, cooperatives and others).
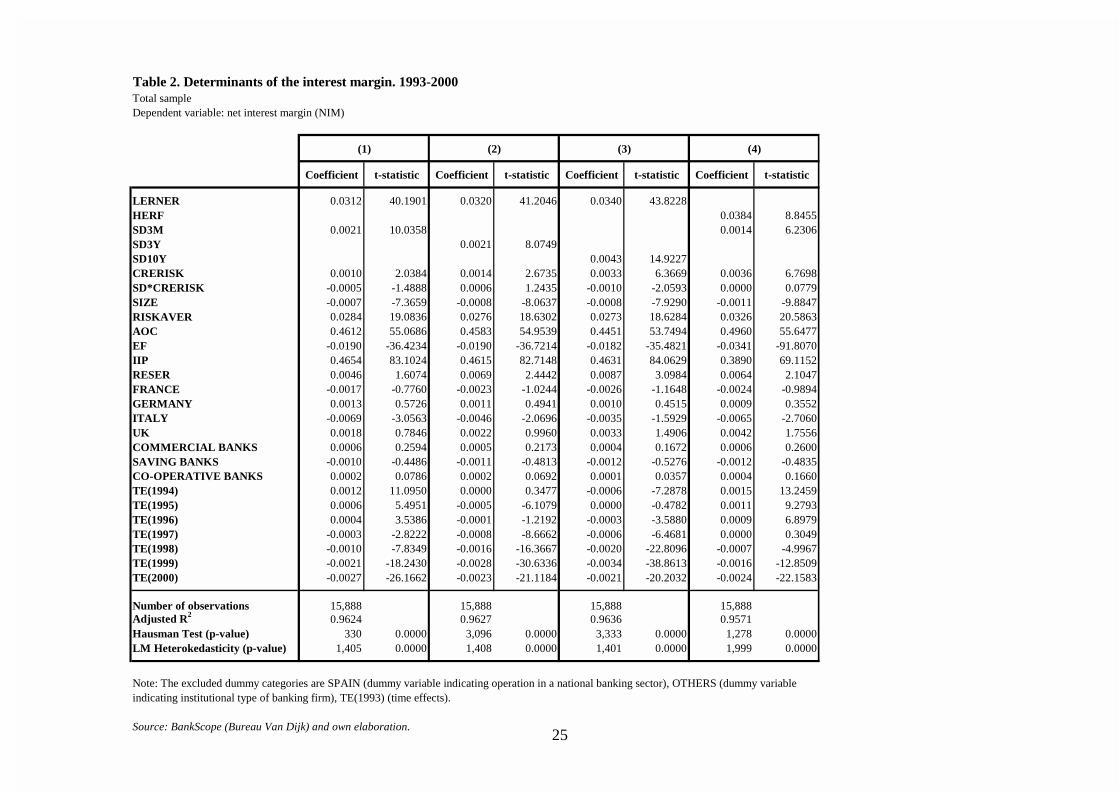
Table 2 shows the results of the estimation of the explanatory equation of the
interest margin for the pool of the five European countries considered. The different
columns correspond to different empirical approaches to market structure (Lerner index
versus Herfindahl index), and the volatility of interest rates (inter-bank, medium or long
term debt). The results obtained show that in general all the variables are statistically
significant and present the signs predicted by the theoretical model. Thus, market
power, proxied by the Lerner index, affects the interest margin positively, and is highly
significant. Interest rate risk also presents the expected positive sign, showing that firms
that assume greater market risk work with higher interest margins. Likewise, the banks
that assume greater credit risk present higher interest margins, though the explanatory
capacity of this variable is less than that of interest rate risk. Risk aversion also presents
the expected positive sign.
market concentration increases. Consequently, the increased concentration following the wave of banking mergers in Europe, may negatively affect competition. 19 As verified by the European Central Bank (2000), in recent years the importance of non-interest income is increasing to the detriment of interest income. Consequently, the explicit collection of payments for banking services in the form of commissions means a smaller volume of implicit payments.
16
The explanatory capacity of operating costs deserves special mention. The high
statistical significance of this variable shows the importance of introducing it into the
theoretical explanation of the interest margin as done in the paper. Therefore, there
could be a possible omitted variable bias of studies that ignore its importance21 As the
theoretical model predicts, the banks that bear higher average operating expenses need
to operate with higher margins to enable them to offset their higher transformation
costs.
With regard to the other variables introduced ad hoc into the regression –
variables that do not appear in the explanation of the pure interest margin -, quality of
management presents the expected negative sign (a higher value of the variable implies
lower efficiency), and is highly significant. Implicit payments also present the predicted
positive sign, so that the banks that charge for their services more implicitly through
lower remuneration of liabilities, present higher interest margins. In the case of the
opportunity cost of reserves, the results show the expected positive sign, though the
variable is not statistically significant.
Finally, dummy variables were introduced into the regression for each country22,
to capture the possible importance of institutional differences (commercial banks,
savings banks, credit cooperatives, and others23) and time effects. The results show the
importance of the time effects that capture the influence of other variables specific to
each time period; the value of the effects decreases as a consequence of the fall
observed in interest margins. In no case is the institutional characteristic significant, and
the country effect is significant only in the case of Italy (and negative in relation to
Spain, the country of reference).
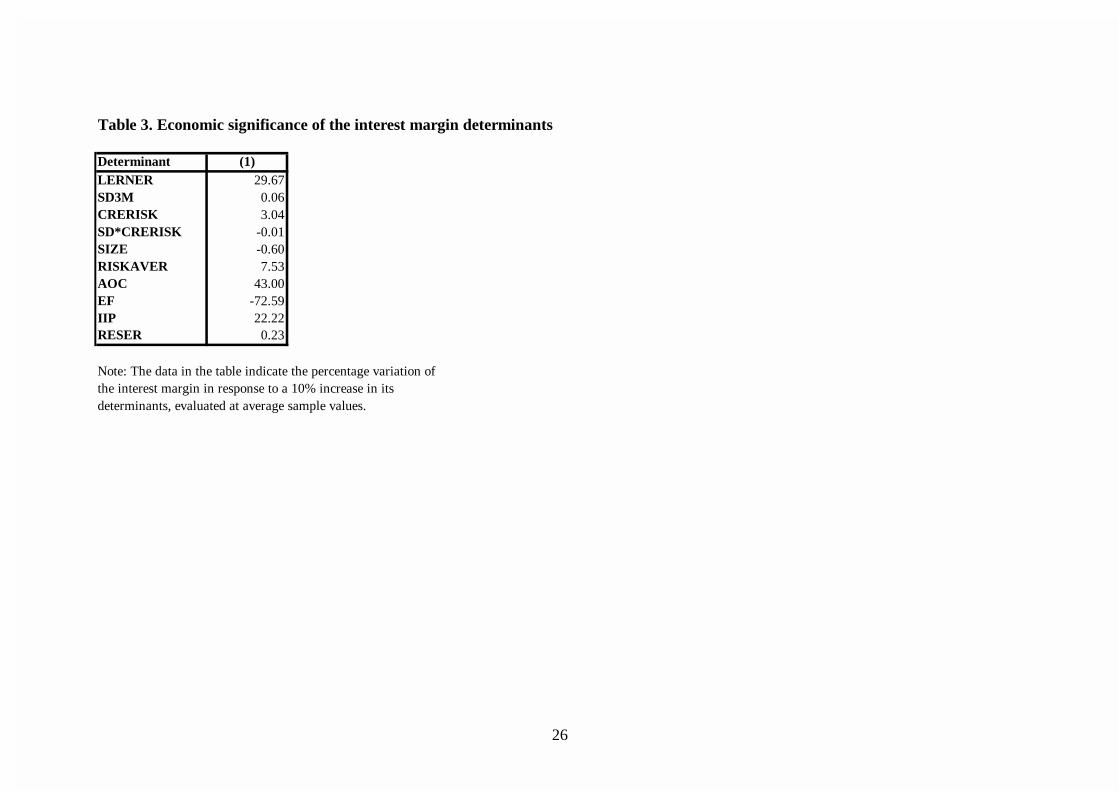
Table 3 shows the economic significance of the interest margin determinants
measured by the implicit elasticities evaluated at sample means. More specifically, the
20 The Hausman test allows the null hypothesis of absence of correlation between individual effects and the explanatory variables to be rejected in all cases, the GLS estimator of the random effects model being inconsistent. 21 Following the suggestion of one of the referees, we have re-estimated all the regressions omitting the operating costs variable. In this case, all the variables show the signs expected and the adjusted R2 shows a slight reduction. Given the importance of operating costs as a determinant of the interest margin, the results clearly show the bias produced in the estimation of the effect of the remaining determinants of the interest margin. Thus, the elasticities associated with the parameters estimated are reduced once the effect of average operating costs is introduced into the estimation, of special note being the reduction of around 70% in the elasticity associated with quality of management (EF), credit risk (CRERISK) and opportunity costs of bank reserves (RESER). 22 The country of reference is Spain. 23 The “others” category includes the following types of firms: investment bank/securities house, medium & long term credit bank, non-banking credit institution, real estate/mortgage bank, and specialised government credit institution. The reference group is “others”.
17
table captures the effect on the interest margin of a 10% increase in its determining
factors. With these results, the evolution of the interest margin in the banking sectors of
the European Union responds more to variations in the quality of management,
variations in the costs of production, and variations in the market power of the banking
firms than to the uncertainty faced by banks (interest rate risk and credit risk ). In the
particular case of operating costs, a 10% reduction in average operating costs would
enable the interest margin to be reduced by 43%, its reduction in the period analysed
being one of the most important factors in explaining the fall of the interest margin in
the banking sector of the European Union.
To test the robustness of the results, columns (2) to (4) of table 4 present the
results of the regression of the explanatory equation of the interest margin using: a)
alternative variables to interest rates risk (columns (2) and (3); and b) the Herfindahl
index as a measure of the competitive conditions in banking markets (column 4). The
results are robust to the indicator of competitive structure of the markets, and to the
interest rate used to measure the rate risk24.
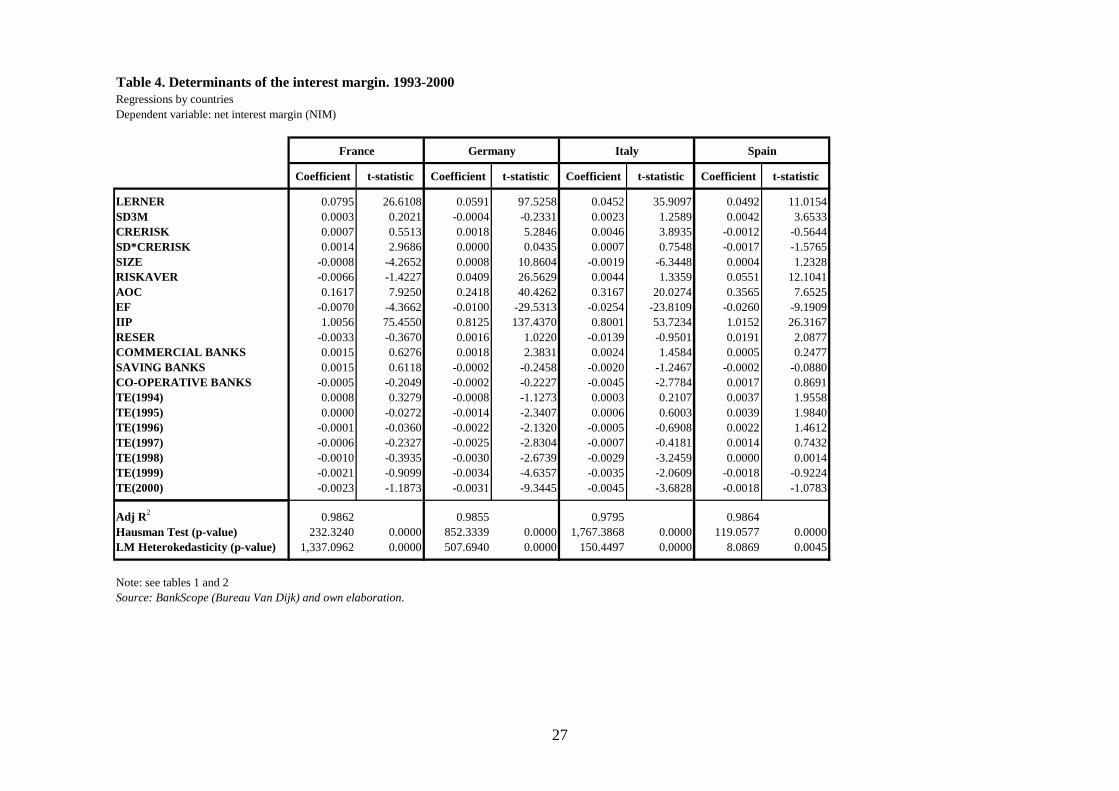
With the aim of testing for differences among countries in the explanatory power
of the variables determining the interest margin, we estimated the explanatory equation
of the interest margin separately for each of the banking sectors considered. The results
of the estimation, which appear in table 425, allow us to observe that in the five
countries analysed, the competitive structure of the markets, proxied by the Lerner
index, is highly significant in explaining the interest margin26. Likewise, average costs
and management quality are also significant and of the expected sign in the five
countries. In the specific case of credit risk and of implicit interest payments, significant
results are obtained in most cases. On the other hand, the opportunity cost of the
reserves is significant only in Spain and the United Kingdom, while interest rate risk is
significant only in the Spanish banking sector.
24In the case of credit risk, the loan loss provisions/total loans ratio is not statistically significant in any of the specifications used (results not shown), though the sample is unrepresentative (only 4,458 observations) because this variable is available for only a small group of banks (for Germany, there are only 11 observations). 25 Table 4 reports the results corresponding to the base case (column 1 of table 2). The results with alternative specifications of the explanatory variables (HERF, SD3Y and SD10Y) are available upon request to the authors. 26However, the influence of concentration is not significant in any case. The non- significance of concentration may be due to the lack of variability of the Herfindahl index (this variable takes a common value every year for all banks of the same country).
18
6. Conclusions
The financial structure of European economies, unlike that of the USA, is
characterised more by bank financing than by direct financing in the markets. With this
in mind, various measures have been implemented in recent years to deregulate
financial markets (e.g. the second banking directive) and to integrate them (e.g. the
European Commission’s Financial Services Action Plan) which have contributed to the
reduction in the interest margins of Europe’s banking sectors.
Starting from the model of Ho and Saunders (1981) and later extensions by other
authors, this study analyses the determinants of the interest margin of the European
banking sector on the basis of a broad sample of banks in Germany, Spain, Italy, France
and the United Kingdom in the period 1993-2000. The model shows that the “pure”
interest margin depends on the competitive conditions of the market, the interest rate
risk, the credit risk, the average operating expenses and the risk aversion of banking
firms, as well as on other variables not explicitly introduced into the model (opportunity
cost of reserves, payment of implicit interest and quality of management).
The study contributes to the existing literature in various directions. Firstly, it
introduces into the modelling of the interest margin the influence of operating costs;
secondly, it uses direct measures of market power to capture competitive conditions;
thirdly, unlike the study by Saunders and Schumacher (2000), it analyses the
determinants of the interest margins of European banks in a single stage, both extending
the period of study to the year 2000 (instead of 1995) and using a much broader sample
of banks (1,826 banks in 2000, as against the 614 in Saunders and Schumacher).
The results obtained show that the variables posited by the theoretical model as
explanatory of the interest margin are in general significant and of the predicted signs.
The results obtained permit us to conclude that:
a) Despite the deregulatory measures taken by the European Union in the 1990s, no
increase in the competitive rivalry among banks can be appreciated. In this respect,
the increase in the degree of concentration of European banks as a consequence of
the wave of mergers that took place in the 1990s may have caused a reduction in the
pressure of competition, and therefore, an increase in the market power of firms,
which in turn causes upward pressure on interest margins.
b) Nevertheless, the adverse consequences of diminishing competitive rivalry have
been counteracted by the effect of the fall in operating costs and credit risk.
Although the lower volatility of market interest rates has contributed to the
reduction of interest margins, the effect has been very small.

19
c) The change in the income structure of European banks has meant an increase in the
importance of banking commissions and a reduction in the implicit payment of
interest, which in turn has led to a reduction of the interest margin.
d) One of the most significant variables in the explanation of the interest margin is the
level of average production costs. In this respect, the containment of average costs
experienced in European banking in recent years has been a decisive factor in
enabling interest margins to be reduced. This supports the extension of the model
done in this study, explicitly including operating costs as a variable endogenous to
it.
In the light of the evidence obtained, the continuity of the process of reduction of
margins will be conditioned by the implementation of measures to incentivise above all
the increase in the degree of competition (e.g. greater penetration by foreign banks or
the development of alternative distribution channels for banking services such as
internet banking, making markets more “contestable”), by banks’ efforts to reduce their
average costs and to improve their efficiency levels, and by achieving a climate of
financial stability that will reduce the risk faced by banking firms.
The implications for economic policy that can be drawn from the results of this
study start with the fact that the reduction of interest margins was originated by factors
which, in part, were driven by several years of a favourable economic situation, due (a)
to a phase of economic growth which made reductions of costs possible in a context of
growth of banking business and created an environment of low credit risk; and (b) to
convergence in the economies of the euro zone, propitiating an environment of
macroeconomic stability in which financial markets have shown low volatility. These
factors seem to have offset a process of reduction of the levels of competition in
Europe’s banking sectors, possibly influenced by the process of mergers and
acquisitions. To the extent that the cyclical situation of the European economies has
changed, the factors that in the past favoured the reduction of margins, may begin to
exert pressure in the opposite direction. This phenomenon should cause a review of the
effectiveness of the public policies implemented during recent years in the matter of
competition, as this may be a fundamental factor in avoiding possible increases in the
interest margins of Europe’s banking systems which would, in turn, make the process of
financial intermediation more costly for society as a whole.
20
Appendix
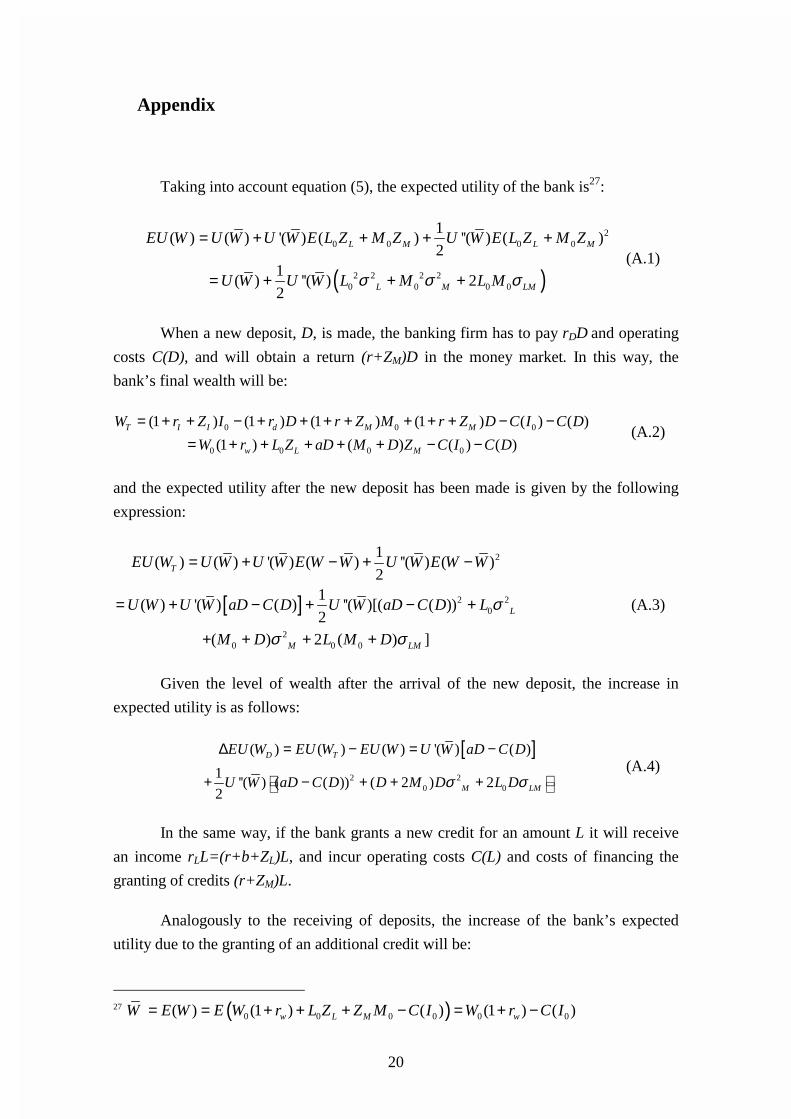
Taking into account equation (5), the expected utility of the bank is27:
( )
20 0 0 0
2 2 2 20 0 0 0
1( ) ( ) '( ) ( ) ''( ) ( )
21
( ) ''( ) 22
L M L M
L M LM
EU W U W U W E L Z M Z U W E L Z M Z
U W U W L M L Mσ σ σ
= + + + +
= + + + (A.1)
When a new deposit, D, is made, the banking firm has to pay rDD and operating
costs C(D), and will obtain a return (r+ZM)D in the money market. In this way, the
bank’s final wealth will be:
0 0 0
0 0 0 0
(1 ) (1 ) (1 ) (1 ) ( ) ( )
(1 ) ( ) ( ) ( )T I I d M M
w L M
W r Z I r D r Z M r Z D C I C D
W r L Z aD M D Z C I C D
= + + − + + + + + + + − −= + + + + + − −
(A.2)
and the expected utility after the new deposit has been made is given by the following
expression:
[ ]
2
2 20
20 0 0
1( ) ( ) '( ) ( ) ''( ) ( )
21
( ) '( ) ( ) ''( )[( ( ))2
( ) 2 ( ) ]
T
L
M LM
EU W U W U W E W W U W E W W
U W U W aD C D U W aD C D L
M D L M D
σ
σ σ
= + − + −
= + − + − +
+ + + +
(A.3)
Given the level of wealth after the arrival of the new deposit, the increase in
expected utility is as follows:
[ ]
2 20 0
( ) ( ) ( ) '( ) ( )
1''( ) ( ( )) ( 2 ) 2
2
D T
M LM
EU W EU W EU W U W aD C D
U W aD C D D M D L Dσ σ
∆ = − = −
+ − + + + (A.4)
In the same way, if the bank grants a new credit for an amount L it will receive
an income rLL=(r+b+ZL)L, and incur operating costs C(L) and costs of financing the
granting of credits (r+ZM)L.
Analogously to the receiving of deposits, the increase of the bank’s expected
utility due to the granting of an additional credit will be:
27 ( )0 0 0 0 0 0( ) (1 ) ( ) (1 ) ( )w L M wW E W E W r L Z Z M C I W r C I= = + + + − = + −
21
[ ]
2 2 20 0 0 0
( ) ( ) ( ) '( ) ( )
1''( ) ( ( )) ( 2 ) ( 2 ) 2( )
2
T T
L M LM
EU W EU W EU W U W bL C L
U W bL C L L L L L M L M L L Lσ σ σ
∆ = − = −
+ − + + + − + − − (A.5)
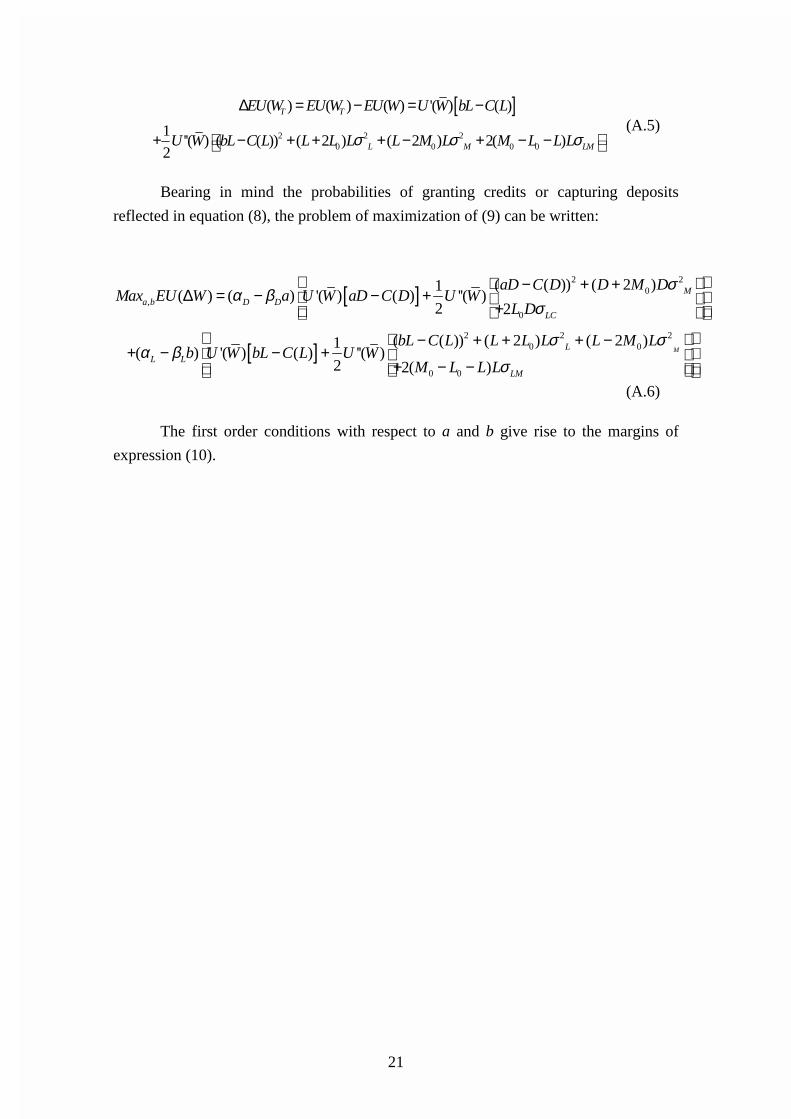
Bearing in mind the probabilities of granting credits or capturing deposits
reflected in equation (8), the problem of maximization of (9) can be written:
[ ]
[ ]
2 20
,
0
2 2 20 0
0 0
( ( )) ( 2 )1( ) ( ) '( ) ( ) ''( )
2 2
( ( )) ( 2 ) ( 2 )1( ) '( ) ( ) ''( )
2 2( )M
Ma b D D
LC
LL L
LM
aD C D D M DMax EU W a U W aD C D U W
L D
bL C L L L L L M Lb U W bL C L U W
M L L L
σα β
σ
σ σα β
σ
− + +∆ = − − + +
− + + + −+ − − +
+ − − (A.6)
The first order conditions with respect to a and b give rise to the margins of
expression (10).
22
References
Allen, L. (1988): “The determinants of bank interest margins: a note”, Journal of
Financial and Quantitative Analysis, Vol. 23, No. 2, 231-235.
Angbanzo, L. (1997): “Commercial bank net interest margins, default risk, interest-rate
risk and off-balance sheet banking”, Journal of Banking and Finance 21, 55-87.
Angelini, P. and Cetorelli, N. (1999): “Bank competition and regulatory reform, the
case of the Italian banking industry”, Working Paper, Research Department, Federal
Reserve Bank of Chicago, December (WP-99-32).
Bikker, J.A. and Haaf, K. (2002). “Competition, concentration and their relationship: an
empirical analysis of the banking industry”, Journal of Banking and Finance, vol. 26
(1), 2191-2214.
Corvoisier, S. and Gropp, R. (2002). “Bank concentration and retail interest rates”,
Journal of Banking and Finance, vol. 26 (1), 2155-2189.
De Bandt, O. and David, E. P. (2000): “Competition, contestability and market structure
in European banking sectors on the eve of EMU”, Journal of Banking and Finance 24,
1045-2066.
European Central Bank (2000): EU banks´ income structure, April 2000.
European Commission (1999): Implementing the Framework for Financial Markets:
Action Plan, COM(99) 232. Brussels, 11/05/1999.
Fernández de Guevara, J., Maudos, J. and Pérez, F. (2001): “Market power in European
banking sectors”. Working Paper WP-EC 2002-05, Instituto Valenciano de
Investigaciones Económicas.
Freixas, X. and Rochet, J.Ch. (1997): Microeconomics of Banking, Massachusetts
Institute of Technology.
Ho, T. and Saunders, A. (1981): “The determinants of banks interest margins: theory
and empirical evidence”. Journal of Financial and Quantitative Analysis, vol. XVI, No.
4, 581-600
23
Bank Scope (2001): Bureau Van Dijk, New York.
Lerner, E. M. (1981): “Discussion: the determinants of banks interest margins: theory
and empirical evidence”. Journal of Financial and Quantitative Analysis, vol. XVI, No.
4, 601-602.
Maudos, J. and Pérez, F. (2001): “Competencia vs. poder de monopolio en la banca
española”, Working Paper WP-EC 2001-09, Instituto Valenciano de Investigaciones
Económicas.
McShane, R.W. and Sharpe, I.G. (1985): “A time series/cross section analysis of he
determinants of Australian Trading bank loan/deposit interest margins: 1962-1981”.
Journal of Banking and Finance 9, 115-136.
Prescott, H. and A. S. McCall (1975): “Market power and structure and commercial
bank instalment lending”, Journal of Money, Credit and Banking 7(4), 449-467.
Ribon, S. and Yosha, O. (1999): ”Financial liberalization and competition in banking:
an empirical investigation”, Tel Aviv University, Working Paper No. 23-99.
Saunders, A. and Schumacher, L. (2000): “The determinants of bank interest rate
margins: an international study”, Journal of International Money and Finance 19, 813-
832.
24
Table 1. Variable definitions and sample means
Symbol Definition 1993 1994 1995 1996 1997 1998 1999 2000
NIM % · Interest margin, defined as the difference between financial revenue and financial costs in relation to total assets 1.94 1.94 1.78 1.69 1.55 1.53 1.37 1.28
LERNER % · Lerner index of market power 15.84 14.77 14.38 14.96 15.97 15.19 16.61 16.80HERF · Herfindahl index of national market concentration 0.035 0.029 0.026 0.028 0.029 0.031 0.033 0.036AOC % · Average operating costs 1.67 1.65 1.58 1.54 1.48 1.49 1.43 1.36RISKAVER % · Degree of risk aversion, proxied by the ratio equity/total assets 4.24 4.45 4.36 4.34 4.18 4.30 4.38 4.50SD3M · Standard deviation of 3-month interest rate in the inter-bank market 1.04 0.35 0.47 0.29 0.25 0.19 0.33 0.58SD3Y · Standard deviation of 3-year interest rate of the public debt 0.75 0.71 0.77 0.42 0.36 0.38 0.52 0.24SD10Y · Standard deviation of 10-year interest rate of the public debt 0.57 0.71 0.44 0.39 0.25 0.43 0.57 0.16CRERISK % · Credit risk, proxid by the loans/total assets ratio 50.48 50.83 50.38 49.68 48.37 48.63 45.34 46.89SD3M*CRERISK · Interaction between credit risk (CRERISK) and market risk (SD3M) 0.52 0.18 0.24 0.14 0.12 0.09 0.15 0.27SD3Y*CRERISK · Interaction between credit risk (CRERISK) and market risk (SD3Y) 0.29 0.36 0.22 0.20 0.12 0.21 0.26 0.08SD10Y*CRERISK · Interaction between credit risk (CRERISK) and market risk (SD10Y) 0.38 0.36 0.39 0.21 0.17 0.19 0.23 0.11SIZE · Size, proxied by the volume of loans granted (in logarithms) 13.20 13.22 13.25 13.12 13.04 13.08 13.03 13.21IIP% · Implicit payments, defined as the ratio of operating expenses net of non-
interest revenues to total assets 0.83 1.04 0.94 0.87 0.72 0.73 0.62 0.50RESER % · Opportunity costs of bank reserves, proxied by the ratio of liquid
reserves/total assets 0.90 0.83 0.74 0.75 0.69 0.86 1.03 0.89EF % · Efficiency (cost to income ratio) as a measure of quality of management
59.02 63.20 63.57 63.28 62.24 63.07 63.86 61.50Number of firms 1,436 1,752 1,974 2,208 2,222 2,279 2,221 1,796
Source: BankScope (Bureau Van Dijk) and own elaboration.
25
Table 2. Determinants of the interest margin. 1993-2000Total sampleDependent variable: net interest margin (NIM)
Coefficient t-statistic Coefficient t-statistic Coefficient t-statistic Coefficient t-statistic
LERNER 0.0312 40.1901 0.0320 41.2046 0.0340 43.8228HERF 0.0384 8.8455SD3M 0.0021 10.0358 0.0014 6.2306SD3Y 0.0021 8.0749SD10Y 0.0043 14.9227CRERISK 0.0010 2.0384 0.0014 2.6735 0.0033 6.3669 0.0036 6.7698SD*CRERISK -0.0005 -1.4888 0.0006 1.2435 -0.0010 -2.0593 0.0000 0.0779SIZE -0.0007 -7.3659 -0.0008 -8.0637 -0.0008 -7.9290 -0.0011 -9.8847RISKAVER 0.0284 19.0836 0.0276 18.6302 0.0273 18.6284 0.0326 20.5863AOC 0.4612 55.0686 0.4583 54.9539 0.4451 53.7494 0.4960 55.6477EF -0.0190 -36.4234 -0.0190 -36.7214 -0.0182 -35.4821 -0.0341 -91.8070IIP 0.4654 83.1024 0.4615 82.7148 0.4631 84.0629 0.3890 69.1152RESER 0.0046 1.6074 0.0069 2.4442 0.0087 3.0984 0.0064 2.1047FRANCE -0.0017 -0.7760 -0.0023 -1.0244 -0.0026 -1.1648 -0.0024 -0.9894GERMANY 0.0013 0.5726 0.0011 0.4941 0.0010 0.4515 0.0009 0.3552ITALY -0.0069 -3.0563 -0.0046 -2.0696 -0.0035 -1.5929 -0.0065 -2.7060UK 0.0018 0.7846 0.0022 0.9960 0.0033 1.4906 0.0042 1.7556COMMERCIAL BANKS 0.0006 0.2594 0.0005 0.2173 0.0004 0.1672 0.0006 0.2600SAVING BANKS -0.0010 -0.4486 -0.0011 -0.4813 -0.0012 -0.5276 -0.0012 -0.4835CO-OPERATIVE BANKS 0.0002 0.0786 0.0002 0.0692 0.0001 0.0357 0.0004 0.1660TE(1994) 0.0012 11.0950 0.0000 0.3477 -0.0006 -7.2878 0.0015 13.2459TE(1995) 0.0006 5.4951 -0.0005 -6.1079 0.0000 -0.4782 0.0011 9.2793TE(1996) 0.0004 3.5386 -0.0001 -1.2192 -0.0003 -3.5880 0.0009 6.8979TE(1997) -0.0003 -2.8222 -0.0008 -8.6662 -0.0006 -6.4681 0.0000 0.3049TE(1998) -0.0010 -7.8349 -0.0016 -16.3667 -0.0020 -22.8096 -0.0007 -4.9967TE(1999) -0.0021 -18.2430 -0.0028 -30.6336 -0.0034 -38.8613 -0.0016 -12.8509TE(2000) -0.0027 -26.1662 -0.0023 -21.1184 -0.0021 -20.2032 -0.0024 -22.1583
Number of observations 15,888 15,888 15,888 15,888Adjusted R2 0.9624 0.9627 0.9636 0.9571Hausman Test (p-value) 330 0.0000 3,096 0.0000 3,333 0.0000 1,278 0.0000LM Heterokedasticity (p-value) 1,405 0.0000 1,408 0.0000 1,401 0.0000 1,999 0.0000
Source: BankScope (Bureau Van Dijk) and own elaboration.
Note: The excluded dummy categories are SPAIN (dummy variable indicating operation in a national banking sector), OTHERS (dummy variable indicating institutional type of banking firm), TE(1993) (time effects).
(1) (2) (3) (4)
26
Table 3. Economic significance of the interest margin determinants
Determinant (1)LERNER 29.67SD3M 0.06CRERISK 3.04SD*CRERISK -0.01SIZE -0.60RISKAVER 7.53AOC 43.00EF -72.59IIP 22.22RESER 0.23
Note: The data in the table indicate the percentage variation of the interest margin in response to a 10% increase in its determinants, evaluated at average sample values.
27
Table 4. Determinants of the interest margin. 1993-2000Regressions by countriesDependent variable: net interest margin (NIM)
Coefficient t-statistic Coefficient t-statistic Coefficient t-statistic Coefficient t-statistic
LERNER 0.0795 26.6108 0.0591 97.5258 0.0452 35.9097 0.0492 11.0154SD3M 0.0003 0.2021 -0.0004 -0.2331 0.0023 1.2589 0.0042 3.6533CRERISK 0.0007 0.5513 0.0018 5.2846 0.0046 3.8935 -0.0012 -0.5644SD*CRERISK 0.0014 2.9686 0.0000 0.0435 0.0007 0.7548 -0.0017 -1.5765SIZE -0.0008 -4.2652 0.0008 10.8604 -0.0019 -6.3448 0.0004 1.2328RISKAVER -0.0066 -1.4227 0.0409 26.5629 0.0044 1.3359 0.0551 12.1041AOC 0.1617 7.9250 0.2418 40.4262 0.3167 20.0274 0.3565 7.6525EF -0.0070 -4.3662 -0.0100 -29.5313 -0.0254 -23.8109 -0.0260 -9.1909IIP 1.0056 75.4550 0.8125 137.4370 0.8001 53.7234 1.0152 26.3167RESER -0.0033 -0.3670 0.0016 1.0220 -0.0139 -0.9501 0.0191 2.0877COMMERCIAL BANKS 0.0015 0.6276 0.0018 2.3831 0.0024 1.4584 0.0005 0.2477SAVING BANKS 0.0015 0.6118 -0.0002 -0.2458 -0.0020 -1.2467 -0.0002 -0.0880CO-OPERATIVE BANKS -0.0005 -0.2049 -0.0002 -0.2227 -0.0045 -2.7784 0.0017 0.8691TE(1994) 0.0008 0.3279 -0.0008 -1.1273 0.0003 0.2107 0.0037 1.9558TE(1995) 0.0000 -0.0272 -0.0014 -2.3407 0.0006 0.6003 0.0039 1.9840TE(1996) -0.0001 -0.0360 -0.0022 -2.1320 -0.0005 -0.6908 0.0022 1.4612TE(1997) -0.0006 -0.2327 -0.0025 -2.8304 -0.0007 -0.4181 0.0014 0.7432TE(1998) -0.0010 -0.3935 -0.0030 -2.6739 -0.0029 -3.2459 0.0000 0.0014TE(1999) -0.0021 -0.9099 -0.0034 -4.6357 -0.0035 -2.0609 -0.0018 -0.9224TE(2000) -0.0023 -1.1873 -0.0031 -9.3445 -0.0045 -3.6828 -0.0018 -1.0783
Adj R2 0.9862 0.9855 0.9795 0.9864Hausman Test (p-value) 232.3240 0.0000 852.3339 0.0000 1,767.3868 0.0000 119.0577 0.0000LM Heterokedasticity (p-value) 1,337.0962 0.0000 507.6940 0.0000 150.4497 0.0000 8.0869 0.0045
Note: see tables 1 and 2Source: BankScope (Bureau Van Dijk) and own elaboration.
France Germany Italy Spain