Embed Size (px)
Citation preview

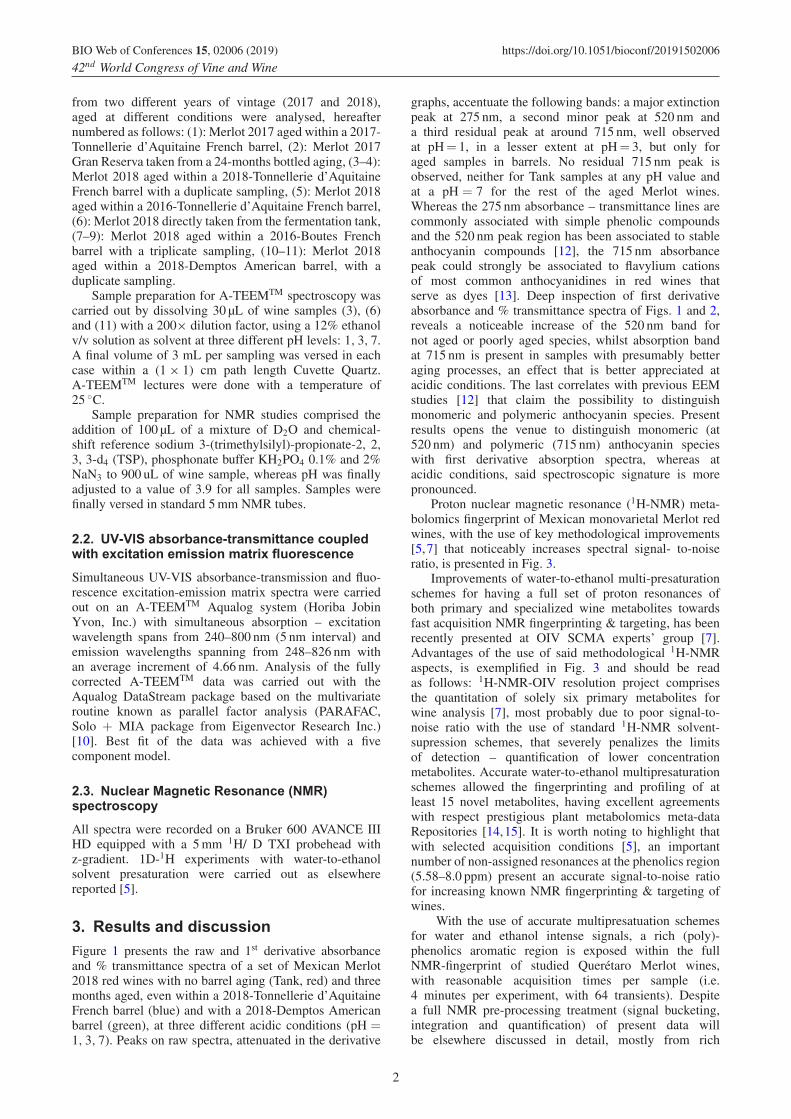
BIO Web of Conferences 15, 02006 (2019) https://doi.org/10.1051/bioconf/20191502006
42nd World Congress of Vine and Wine
Multivariate spectroscopy for targeting phenolicchoreography in wine with A-TEEMTM and NMR crosschecknon-targeted metabolomics
J.E. Herbert-Pucheta1, G. Padilla-Maya2, D. Milmo-Brittinham2, D. Lojero3, A.M. Gilmore4, L. Raventos-Llopart5,K.E. Hernandez-Pulido5, and L.G. Zepeda-Vallejo6
1 Consejo Nacional de Ciencia y Tecnologıa-Laboratorio Nacional de Investigacion y Servicio Agroalimentario y Forestal. UniversidadAutonoma Chapingo. Carretera Mexico-Texcoco Km 38.5, C.P. 56230, Chapingo, Estado de Mexico, Mexico
2 Consejo Mexicano Vitivinıcola A.C. Montecito No 38 Piso 15 Despacho 22 – WTC Mexico, C.P. 03810, Ciudad de Mexico, Mexico3 Intercovamex, Nueva China No. 400 Colonia Rincon del Valle, C.P. 62240, Cuernavaca, Morelos, Mexico4 Horiba Scientific, 3880 Park Avenue Edison, NJ 08820. United States of America5 Finca Sala-Vive – Freixenet, Carretera San Juan del Rıo Cadereyta, Km 40.5, Colonia los Perez Ezequiel Montes, Queretaro, Mexico6 Departamento de Quımica Organica, Escuela Nacional de Ciencias Biologicas, Instituto Politecnico Nacional. Prolongacion de Carpio
y Plan de Ayala s/n, Colonia Santo Tomas, 11340 Ciudad de Mexico, Mexico
Abstract. Present work comprises the use of different multivariate spectroscopic methods for trackingnovel metabolomics signatures related to red wine chemistry. It is presented for the first time the protonnuclear magnetic resonance metabolomics fingerprint of a monovarietal Mexican Merlot, obtained withacquisition improvements recently proposed to the OIV Methods of Analysis sub-commission. Effectivemulti-presaturation solvent schemes have revealed a rich (poly)-phenolics aromatic region, so far notexploited for wine-fingerprinting or – targeted profiling routines. It is presented as well for the first timethe use of simultaneous absorbance-transmission and fluorescence excitation-emission matrix “push-one-bottom” method (A-TEEMTM) at specific chemical conditions for a rapid, effective and high-sensitivitycharacterization of phenolic choreography in wines, as novel observables to quantify oenological practicesand aging.
1. Introduction
Economic and cultural importance of wine is chemicallysupported mostly by its phenolics content, as saidprimary and special metabolites’ family contribute towines’ organoleptic properties such as colour, taint,mouth-feel and aromas [1]. Standard quantification ofphenolics comprises colorimetric and/or chromatographicapproaches, whereas despite their robustness, they presentcertain complexity in terms of sample preparation,chemical manipulations, being in turn time consuming,laborious, costly and require some level of analyticalexpertise. OIV cross-commissions shall promptly evaluatethe ratio between wineries and oenological researchinstitutes in all member states that could provide themanoeuvre of analytical experts certified to carry out saidstandard methods.
This work presents a “push-one-bottom”, rapid, user-friendly and non-invasive spectroscopic solution to tracka robust phenolic profile in wines, with simultaneousabsorbance-transmittance (A-T) and fluorescence excita-tion – emission matrix spectroscopy (EEM), branded asA-TEEMTM [2], wherein the simultaneous AT & EEMacquisition is carried out at each excitation increment.Immediate applications of the A-TEEMTM device com-prise the characterization of human consumption waterquality, in terms of quantification of Total dissolved
Organic Carbon (TOC) metabolites like low-and high-molecular aromatics, as well as protein compounds fromhumic/fluvic sources [3]. More recently, A-TEEMTM
technology has been used to determine phenolic andanthocyanin profiles in fresh and oxidized Italianred wines, in the excitation-emission range between250–800 nm [3,4]. Construction of reliable meta-databases in terms of reproducible A-TEEMTM phenolic-anthocyanin libraries for quantitative analysis of mostlyspecial metabolites in wine with a fast/high sensitivity/push-one-bottom solution needs an orthogonal crosscheck withrobust OIV methods. For instance, high-resolution protonNuclear Magnetic Resonance Spectroscopy (1H-NMR)[5–7] is used to obtain the first reported metabolomicsfingerprint and profiling of a monovarietal Mexican Merlot(2018, Sala Vive, Freixenet, Queretaro MX), targeting themost abundant primary metabolites, in agreement to anOIV resolution project under course [7]. 1H-NMR meta-data analysis is presented, for fingerprinting some spectralregions associated to phenolics that orthogonally correlateswith A-TEEMTM observables.
2. Materials and methods2.1. Wine samples
A set of eleven Mexican monovarietal Merlot wines fromQueretaro, Mexico (Finca Sala Vive, Freixenet Mexico),
© The Authors, published by EDP Sciences. This is an Open Access article distributed under the terms of the Creative Commons Attribution License 4.0(http://creativecommons.org/licenses/by/4.0/).
BIO Web of Conferences 15, 02006 (2019) https://doi.org/10.1051/bioconf/20191502006
42nd World Congress of Vine and Wine
from two different years of vintage (2017 and 2018),aged at different conditions were analysed, hereafternumbered as follows: (1): Merlot 2017 aged within a 2017-Tonnellerie d’Aquitaine French barrel, (2): Merlot 2017Gran Reserva taken from a 24-months bottled aging, (3–4):Merlot 2018 aged within a 2018-Tonnellerie d’AquitaineFrench barrel with a duplicate sampling, (5): Merlot 2018aged within a 2016-Tonnellerie d’Aquitaine French barrel,(6): Merlot 2018 directly taken from the fermentation tank,(7–9): Merlot 2018 aged within a 2016-Boutes Frenchbarrel with a triplicate sampling, (10–11): Merlot 2018aged within a 2018-Demptos American barrel, with aduplicate sampling.
Sample preparation for A-TEEMTM spectroscopy wascarried out by dissolving 30 µL of wine samples (3), (6)and (11) with a 200× dilution factor, using a 12% ethanolv/v solution as solvent at three different pH levels: 1, 3, 7.A final volume of 3 mL per sampling was versed in eachcase within a (1 × 1) cm path length Cuvette Quartz.A-TEEMTM lectures were done with a temperature of25 ◦C.
Sample preparation for NMR studies comprised theaddition of 100 µL of a mixture of D2O and chemical-shift reference sodium 3-(trimethylsilyl)-propionate-2, 2,3, 3-d4 (TSP), phosphonate buffer KH2PO4 0.1% and 2%NaN3 to 900 uL of wine sample, whereas pH was finallyadjusted to a value of 3.9 for all samples. Samples werefinally versed in standard 5 mm NMR tubes.
2.2. UV-VIS absorbance-transmittance coupledwith excitation emission matrix fluorescence
Simultaneous UV-VIS absorbance-transmission and fluo-rescence excitation-emission matrix spectra were carriedout on an A-TEEMTM Aqualog system (Horiba JobinYvon, Inc.) with simultaneous absorption – excitationwavelength spans from 240–800 nm (5 nm interval) andemission wavelengths spanning from 248–826 nm withan average increment of 4.66 nm. Analysis of the fullycorrected A-TEEMTM data was carried out with theAqualog DataStream package based on the multivariateroutine known as parallel factor analysis (PARAFAC,Solo + MIA package from Eigenvector Research Inc.)[10]. Best fit of the data was achieved with a fivecomponent model.
2.3. Nuclear Magnetic Resonance (NMR)spectroscopy
All spectra were recorded on a Bruker 600 AVANCE IIIHD equipped with a 5 mm 1H/ D TXI probehead withz-gradient. 1D-1H experiments with water-to-ethanolsolvent presaturation were carried out as elsewherereported [5].
3. Results and discussionFigure 1 presents the raw and 1st derivative absorbanceand % transmittance spectra of a set of Mexican Merlot2018 red wines with no barrel aging (Tank, red) and threemonths aged, even within a 2018-Tonnellerie d’AquitaineFrench barrel (blue) and with a 2018-Demptos Americanbarrel (green), at three different acidic conditions (pH =1, 3, 7). Peaks on raw spectra, attenuated in the derivative
graphs, accentuate the following bands: a major extinctionpeak at 275 nm, a second minor peak at 520 nm anda third residual peak at around 715 nm, well observedat pH= 1, in a lesser extent at pH= 3, but only foraged samples in barrels. No residual 715 nm peak isobserved, neither for Tank samples at any pH value andat a pH = 7 for the rest of the aged Merlot wines.Whereas the 275 nm absorbance – transmittance lines arecommonly associated with simple phenolic compoundsand the 520 nm peak region has been associated to stableanthocyanin compounds [12], the 715 nm absorbancepeak could strongly be associated to flavylium cationsof most common anthocyanidines in red wines thatserve as dyes [13]. Deep inspection of first derivativeabsorbance and % transmittance spectra of Figs. 1 and 2,reveals a noticeable increase of the 520 nm band fornot aged or poorly aged species, whilst absorption bandat 715 nm is present in samples with presumably betteraging processes, an effect that is better appreciated atacidic conditions. The last correlates with previous EEMstudies [12] that claim the possibility to distinguishmonomeric and polymeric anthocyanin species. Presentresults opens the venue to distinguish monomeric (at520 nm) and polymeric (715 nm) anthocyanin specieswith first derivative absorption spectra, whereas atacidic conditions, said spectroscopic signature is morepronounced.
Proton nuclear magnetic resonance (1H-NMR) meta-bolomics fingerprint of Mexican monovarietal Merlot redwines, with the use of key methodological improvements[5,7] that noticeably increases spectral signal- to-noiseratio, is presented in Fig. 3.
Improvements of water-to-ethanol multi-presaturationschemes for having a full set of proton resonances ofboth primary and specialized wine metabolites towardsfast acquisition NMR fingerprinting & targeting, has beenrecently presented at OIV SCMA experts’ group [7].Advantages of the use of said methodological 1H-NMRaspects, is exemplified in Fig. 3 and should be readas follows: 1H-NMR-OIV resolution project comprisesthe quantitation of solely six primary metabolites forwine analysis [7], most probably due to poor signal-to-noise ratio with the use of standard 1H-NMR solvent-supression schemes, that severely penalizes the limitsof detection – quantification of lower concentrationmetabolites. Accurate water-to-ethanol multipresaturationschemes allowed the fingerprinting and profiling of atleast 15 novel metabolites, having excellent agreementswith respect prestigious plant metabolomics meta-dataRepositories [14,15]. It is worth noting to highlight thatwith selected acquisition conditions [5], an importantnumber of non-assigned resonances at the phenolics region(5.58–8.0 ppm) present an accurate signal-to-noise ratiofor increasing known NMR fingerprinting & targeting ofwines.
With the use of accurate multipresatuation schemesfor water and ethanol intense signals, a rich (poly)-phenolics aromatic region is exposed within the fullNMR-fingerprint of studied Queretaro Merlot wines,with reasonable acquisition times per sample (i.e.4 minutes per experiment, with 64 transients). Despitea full NMR pre-processing treatment (signal bucketing,integration and quantification) of present data willbe elsewhere discussed in detail, mostly from rich
2

BIO Web of Conferences 15, 02006 (2019) https://doi.org/10.1051/bioconf/20191502006
42nd World Congress of Vine and Wine
Figure 1. Raw and first derivative (�) UV-VIS absorbance – % transmittance spectra of Mexican monovarietal Merlot wines (samples3 (red spectra), 6 (blue spectra) and 10 green spectra); see Materials and Methods) at three different pH values (pH = 1, extreme Left;pH = 3.9, Middle; pH = 7, extreme Right). Relevant absorption-%Transmittance peaks at 715 nm is highlighted with a dotted-line circle.
Figure 2. First derivative (�) UV-VIS absorbance spectraof Mexican monovarietal Merlot wines with different agingschemes (samples 1 to 11, refer colour code to figure legendsand Materials and Methods) acquired at pH = 3.9. As in Fig. 1,absorbance region at 715 nm is expanded.
(poly)-phenolics aromatic region, some remarks can bedone. Figure 4 present expansions of Fig. 3 per dataset (see Materials and Methods), whereas QueretaroMerlot’s NMR-signatures are stacked in terms of aging
reservoirs and year of vintages: (1–2) Merlot 2017;(3–4): Merlot 2018/2018-Tonnellerie d’Aquitaine;(10–11): Merlot 2018/2018-Demptos; (7–8): Merlot2018/2016-Boutes; (5) Merlot 2018/2016-Tonnelleried’Aquitaine; (6): Merlot 2018/tank. This specific clas-sification in Fig. 4, was done by means of theUV-VIS �Absorbance 715 nm peak intensity that eachset of samples present (full UV-VIS �Absorbancedepicted in Fig. 2). As observed and expected, aged2017-Merlot in a 2017-Tonnellerie d’Aquitaine barrel,present a maximum 715 nm �Absorbance peak inten-sity. In counterpart, said sample present a minimumsignal intensity of �Absorbance at 520 nm wavelength(Fig. 2), strongly suggesting the presence of a majoramount of poly-anthocyanin with a minor amounts ofmono-anthocyanin moieties. In extreme contrast, Merlot2018/tank samples present no �Absorbance signal at715 nm and a maximum at 520 nm, confirming theUV-VIS � Absorbance antagonist mono/poly-anthocyaninprofile. Last observations could be cross-checked with theuse of the NMR-Merlot profiling. Despite the lack ofspectral resolution at the novel revealed (poly)-phenolicsregion around 5.58–8.0 ppm, signal integration could shedlight on phenolics content in agreement with UV-VISobservations.
3
BIO Web of Conferences 15, 02006 (2019) https://doi.org/10.1051/bioconf/20191502006
42nd World Congress of Vine and Wine
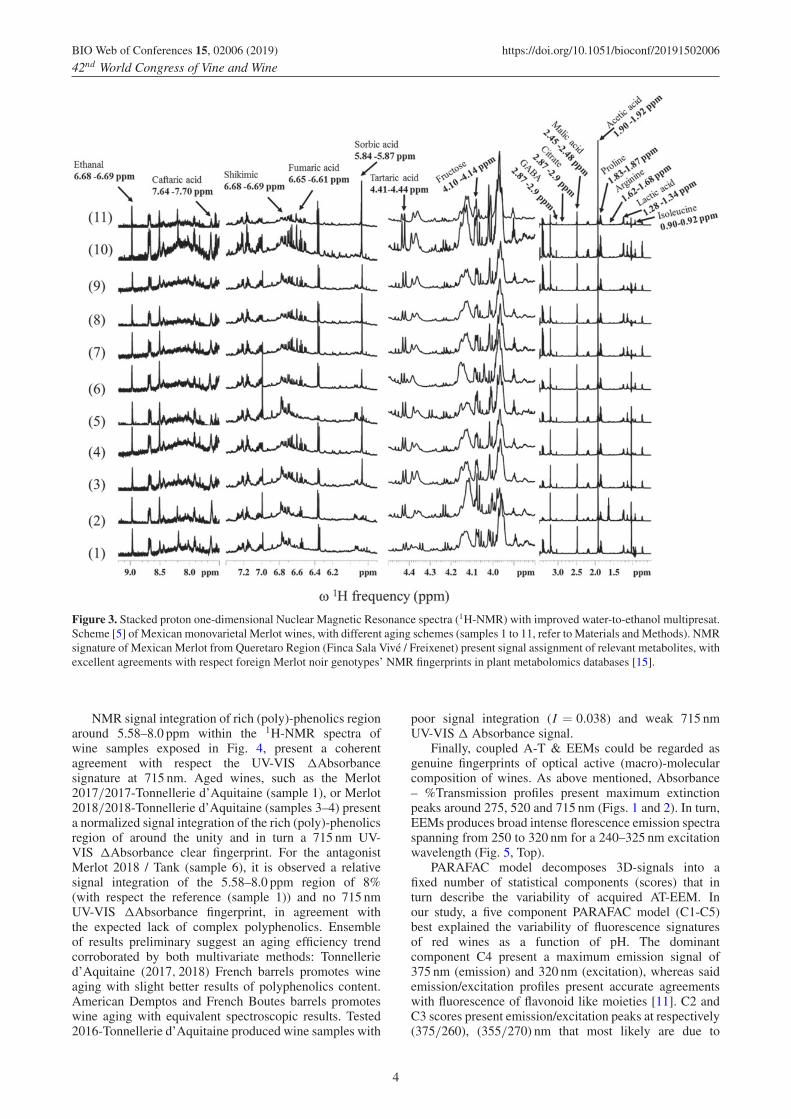
Figure 3. Stacked proton one-dimensional Nuclear Magnetic Resonance spectra (1H-NMR) with improved water-to-ethanol multipresat.Scheme [5] of Mexican monovarietal Merlot wines, with different aging schemes (samples 1 to 11, refer to Materials and Methods). NMRsignature of Mexican Merlot from Queretaro Region (Finca Sala Vive / Freixenet) present signal assignment of relevant metabolites, withexcellent agreements with respect foreign Merlot noir genotypes’ NMR fingerprints in plant metabolomics databases [15].
NMR signal integration of rich (poly)-phenolics regionaround 5.58–8.0 ppm within the 1H-NMR spectra ofwine samples exposed in Fig. 4, present a coherentagreement with respect the UV-VIS �Absorbancesignature at 715 nm. Aged wines, such as the Merlot2017/2017-Tonnellerie d’Aquitaine (sample 1), or Merlot2018/2018-Tonnellerie d’Aquitaine (samples 3–4) presenta normalized signal integration of the rich (poly)-phenolicsregion of around the unity and in turn a 715 nm UV-VIS �Absorbance clear fingerprint. For the antagonistMerlot 2018 / Tank (sample 6), it is observed a relativesignal integration of the 5.58–8.0 ppm region of 8%(with respect the reference (sample 1)) and no 715 nmUV-VIS �Absorbance fingerprint, in agreement withthe expected lack of complex polyphenolics. Ensembleof results preliminary suggest an aging efficiency trendcorroborated by both multivariate methods: Tonnelleried’Aquitaine (2017, 2018) French barrels promotes wineaging with slight better results of polyphenolics content.American Demptos and French Boutes barrels promoteswine aging with equivalent spectroscopic results. Tested2016-Tonnellerie d’Aquitaine produced wine samples with
poor signal integration (I = 0.038) and weak 715 nmUV-VIS � Absorbance signal.
Finally, coupled A-T & EEMs could be regarded asgenuine fingerprints of optical active (macro)-molecularcomposition of wines. As above mentioned, Absorbance– %Transmission profiles present maximum extinctionpeaks around 275, 520 and 715 nm (Figs. 1 and 2). In turn,EEMs produces broad intense florescence emission spectraspanning from 250 to 320 nm for a 240–325 nm excitationwavelength (Fig. 5, Top).
PARAFAC model decomposes 3D-signals into afixed number of statistical components (scores) that inturn describe the variability of acquired AT-EEM. Inour study, a five component PARAFAC model (C1-C5)best explained the variability of fluorescence signaturesof red wines as a function of pH. The dominantcomponent C4 present a maximum emission signal of375 nm (emission) and 320 nm (excitation), whereas saidemission/excitation profiles present accurate agreementswith fluorescence of flavonoid like moieties [11]. C2 andC3 scores present emission/excitation peaks at respectively(375/260), (355/270) nm that most likely are due to
4

BIO Web of Conferences 15, 02006 (2019) https://doi.org/10.1051/bioconf/20191502006
42nd World Congress of Vine and Wine
Figure 4. Proton one-dimensional Nuclear Magnetic Resonance spectra (1H-NMR) with improved water-to-ethanol multipresat. Scheme[5] of Mexican monovarietal Merlot wines, with different aging schemes (samples 1 to 11, refer to Materials and Methods). Novel richpolyphenolics exposed region (5.58–8.0 ppm) with multipresat scheme has been integrated in all cases, referenced with respect sample 1(I = 1.0). First derivative (�) UV-VIS absorbance spectra of each sample, at the 715 nm region is as well exposed, per case.
5

BIO Web of Conferences 15, 02006 (2019) https://doi.org/10.1051/bioconf/20191502006
42nd World Congress of Vine and Wine
Figure 4. Continued.
6

BIO Web of Conferences 15, 02006 (2019) https://doi.org/10.1051/bioconf/20191502006
42nd World Congress of Vine and Wine
Figure 4. Continued.
7

BIO Web of Conferences 15, 02006 (2019) https://doi.org/10.1051/bioconf/20191502006
42nd World Congress of Vine and Wine
Figure 5. Five component (C5) PARAFAC model constructedfrom the fluorescence EEMs comprising the evaluation of 3 × 3class groups as a function of storage vessel (tank, French barreland American barrel) and solution pH (1, 3.9, 7) and 6 repetitionsper class group (total of 54 files).
specific polyphenol content, whereas as appreciated bythe absorbance – transmittance profile, it possess a pHdependency that can be traced within the PARAFACcluster C4-C2-C3, depicted in Fig. 5.
4. ConclusionsThis work presents for the first time a NMR/A-TEEM traceable molecular (polyphenolics) fingerprints,linked to the chemistry involved in aging processes,using a set of mono-varietal Queretaro Merlot samplesas model system. First the use of raw and first derivative-pH dependent – UV-VIS (�)Absorbance spectroscopyis proposed to elucidate a simple-to-complex phenolics’profile within wine samples, in terms of (�) Absorbancelines at 275, 520 and 715 nm. In parallel, methodologicalimprovements allowed to obtain a proton NMR fingerprintof studied samples that in turn revealed a novel exploitablearomatics region, whereas signal integration of keyregions, present excellent correlation with UV-VIS data,for cross-checking the novel method of analysis. Two-dimensional Absorbance (Transmittance) – Excitation
Emission Fluorescence Matrix and processing with afive component PARAFAC cluster accurately describe thevariability of polyphenols in wines as a function of pH anddifferent aging processes.
Authors acknowledge the Mexican Ministry of Science andTechnology (CONACyT) for funding: CONACyT program No.682 “Catedras CONACyT”, CONACyT program No. LN295321“Laboratorios Nacionales” and CONACyT-Mexico infrastructuregrant: INFRA-2016 (269012) for funding Nuclear MagneticResonance experimental time.
J.E.H.P. specially acknowledge Eng. Isela Mejıa-Fonseca forfruitful assistance in sample management and processing.
In memoriam of Ernesto Ladron-de-Guevara.
References
[1] T.C. Somers, Phytochemistry 10, 2175 (1971)[2] A.M. Gilmore, Aqualog� Horiba, Instruments, Inc.
Methods in Molecular Biology 1076, edited by, Y.Engelborghs, A. Visser (Totowa, NJ: Humana Press)
[3] A. Quatela, et al., Methods Appl. Fluoresec. 6, 33(2018)
[4] D. Airada-Rodriguez, et al., J. Food Compos. Anal.24, 257 (2011)
[5] J.E. Herbert-Pucheta, et al., EDP Sciences, Bio WebConf., doi: 10.1051/bioconf/20191202029 (2019)
[6] C. Fauhl-Hassek, EDP Sciences, Bio Web Conf. doi:10.1051/bioconf/20191202030 (2019)
[7] OIV resolution project OENO-SCMA 17-618, Step 5(2019)
[8] D. Cozzolino, et al., Anal. Chim. Acta 513, 73(2004)
[9] M. Golic, et al., Appl. Spectrosc. 57, 139 (2003)[10] C.A. Stedmon, R. Bro. Limnol. Oceanogr.: Methods
6, 572 (2008)[11] C. Coelho, et al., Anal. Chem. 87, 8132 (2015)[12] G. Agati, et al., J. Agric. Food Chem. 61, 10156
(2013)[13] F. Pina, et al., Tetrahedron 71, 3107 (2015)[14] H. Ferry-Dumazet, et al., BMC Plant Biol. 11, 1
(2011)[15] services.cbib.u-bordeaux.fr/MERYB
8