Embed Size (px)
Citation preview
Multivariate Adaptive Regression Splines(MARS)
Puneet BansalJackson Salling
16-Feb-2013Data Mining, UT ECE
Introduction
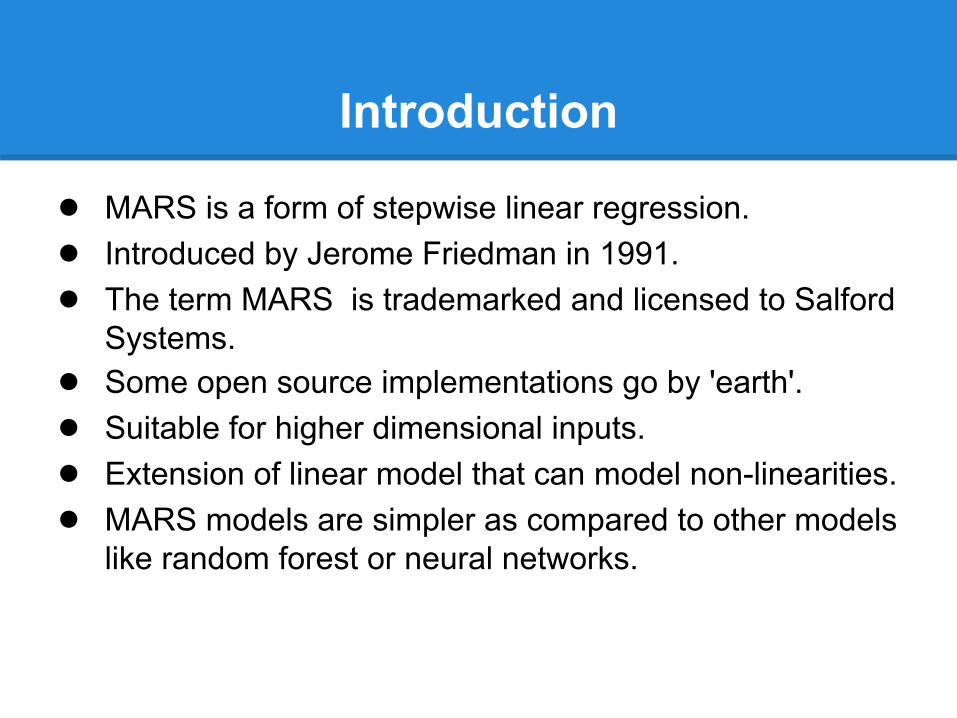
● MARS is a form of stepwise linear regression.● Introduced by Jerome Friedman in 1991.● The term MARS is trademarked and licensed to Salford
Systems.● Some open source implementations go by 'earth'.● Suitable for higher dimensional inputs.● Extension of linear model that can model non-linearities.● MARS models are simpler as compared to other models
like random forest or neural networks.
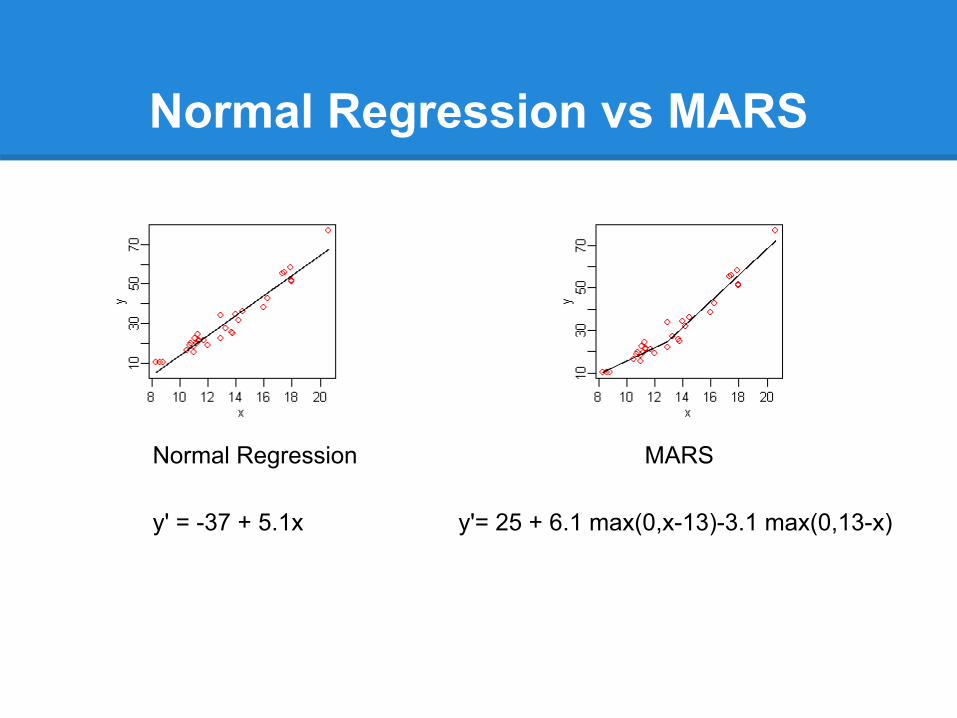
Normal Regression vs MARS
Normal Regression MARS
y' = -37 + 5.1x y'= 25 + 6.1 max(0,x-13)-3.1 max(0,13-x)
Terminology
● Multivariate - Able to generate model based on several input variables (high dimensionality).
● Adaptive - Generates flexible models in passes each time adjusting the model.
● Regression - Estimation of relationship among independent and dependent variables.
● Spline - A piecewise defined polynomial function that is smooth (possesses higher order derivatives) where polynomial pieces connect.
● Knot - The point at which two polynomial pieces connect.
Basis Functions
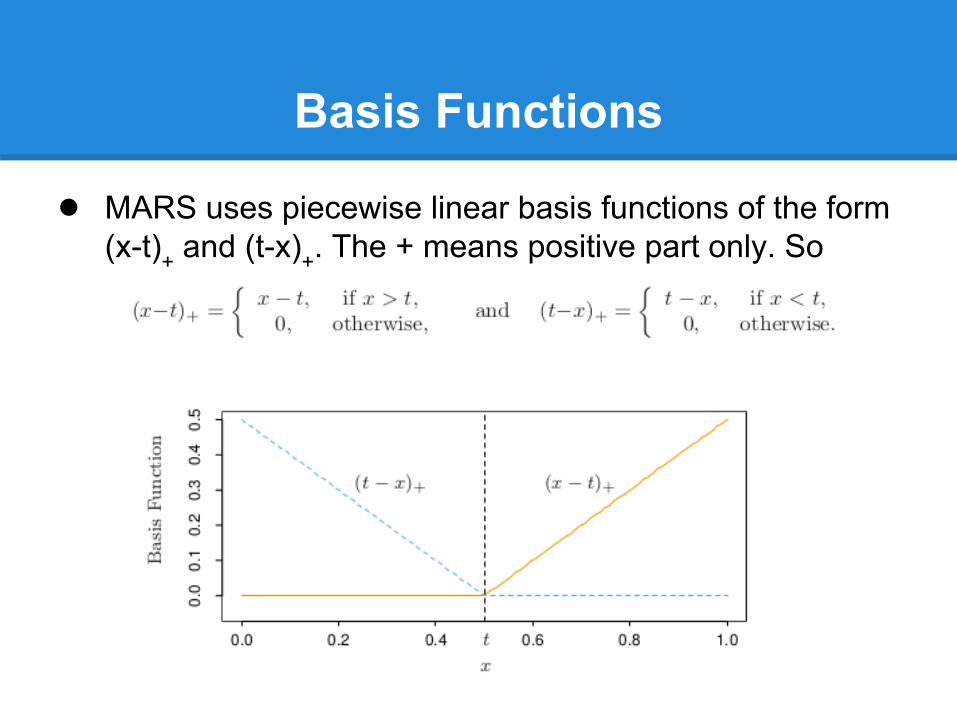
● MARS uses piecewise linear basis functions of the form (x-t)+ and (t-x)+. The + means positive part only. So
Basis Functions
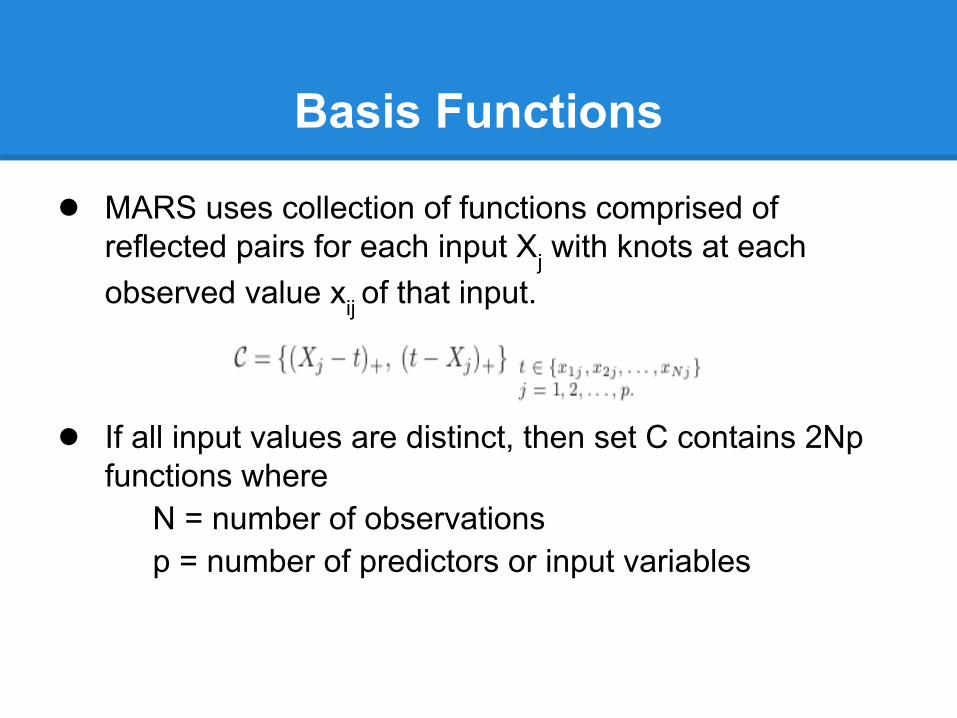
● MARS uses collection of functions comprised of reflected pairs for each input Xj with knots at each observed value xij of that input.
● If all input values are distinct, then set C contains 2Np functions where
N = number of observationsp = number of predictors or input variables
MARS Model Equation
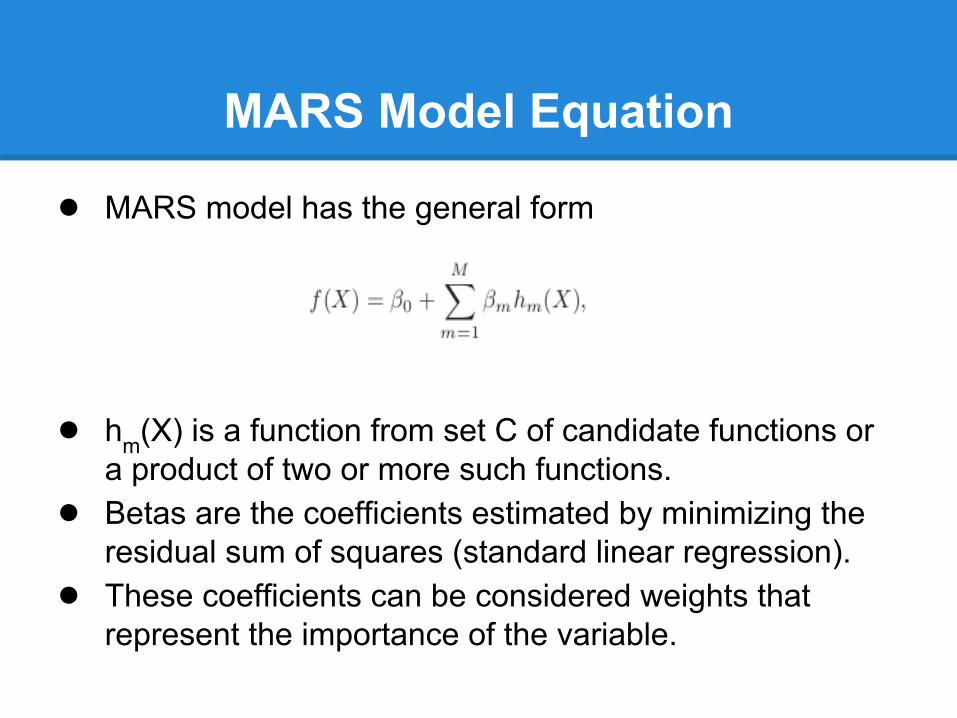
● MARS model has the general form
● hm(X) is a function from set C of candidate functions or a product of two or more such functions.
● Betas are the coefficients estimated by minimizing the residual sum of squares (standard linear regression).
● These coefficients can be considered weights that represent the importance of the variable.

MARS Model Building Procedure
1. Gather data - x input variables with y observations each, giving a total of xy data points.
2. Calculate set of candidate functions by generating reflected pairs of basis functions with knots set at observed values.
3. Specify constraints - the number of terms in the model and maximum allowable degree of interaction.
4. Do forward pass - Try out new function products and see which product decreases training error.
5. Do backward pass - Fix overfit.6. Do generalized cross validation to estimate the optimal
number of terms in the model.
MARS Forward Pass
● At each step, MARS adds the basis function which reduces the residual error the most
● Always adds the basis function in 'pairs', both sides of knot
● Calculate value for knot and function that fit the data, least squares
● This is a greedy algorithm
● The addition of model terms continues until the max number of terms in the model is reached

MARS Forward Pass(multiplying of two basis functions)
h(X1 , X2 ) = (X1 − x)+ · (x − X2 )+
Figure in Elements of Statistical Learning
MARS Backwards Pass
● Remove one term at a time from the model
● Remove the term which increases the residual error the least
● Continue removing terms until cross validation is satisfied
● Use the Generalized Cross Validation (GCV) function for this purpose
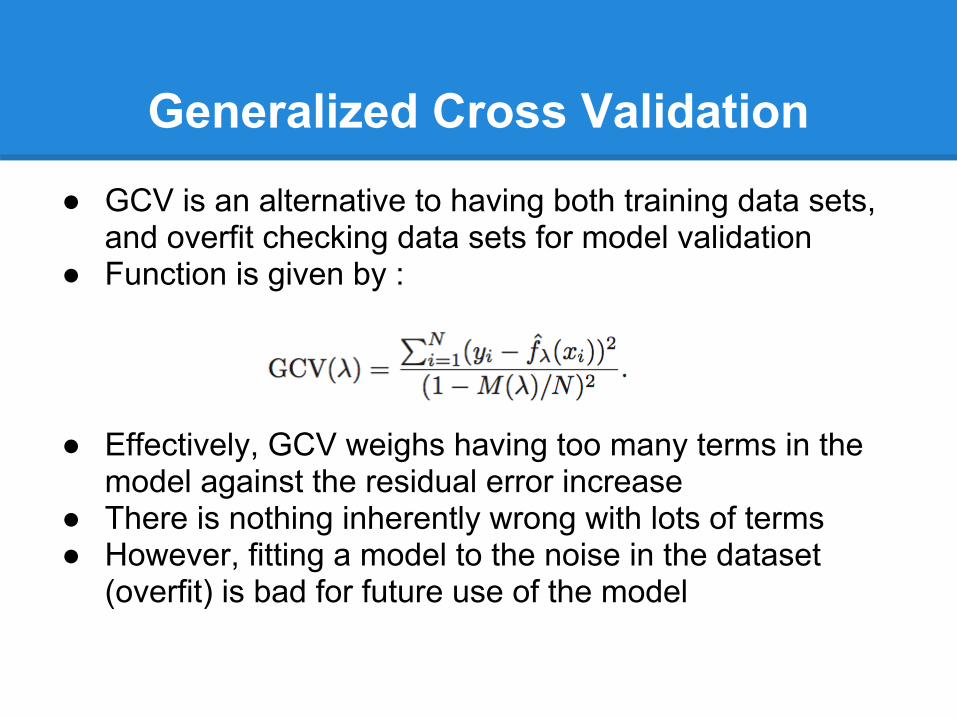
Generalized Cross Validation
● GCV is an alternative to having both training data sets, and overfit checking data sets for model validation
● Function is given by :
● Effectively, GCV weighs having too many terms in the model against the residual error increase
● There is nothing inherently wrong with lots of terms● However, fitting a model to the noise in the dataset
(overfit) is bad for future use of the model
MARS Computation
● Each forward pass step has N choices of functions, computed against N other data points
● Luckily each step only takes O(N) time since the regression difference between knots is only adding and subtracting one term
● For the example, a 10,000 data point set only took a few seconds to complete model building
Applications of MARS
● Spam filter is mentioned in the book as an example● High dimensions are handled well● Non-linear relationships modeled piecewise● Continuous dependent variable typically, but can be
categorical
Example Paper
Parametric and Nonparametric Logistic Regressions for Prediction of Presence/Absence of an Amphibian
● Toad likelihood estimation● Uses latitude, moisture, tree cover, etc.● Model generated and response to each variable plotted● Used only 7 of the available variables
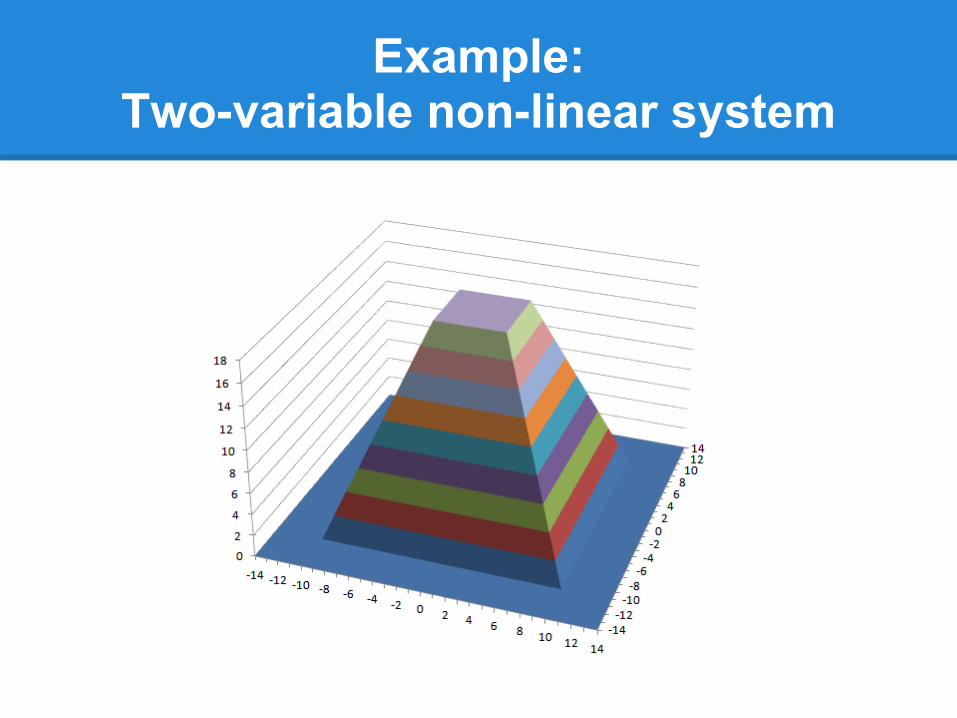
Example:Two-variable non-linear system
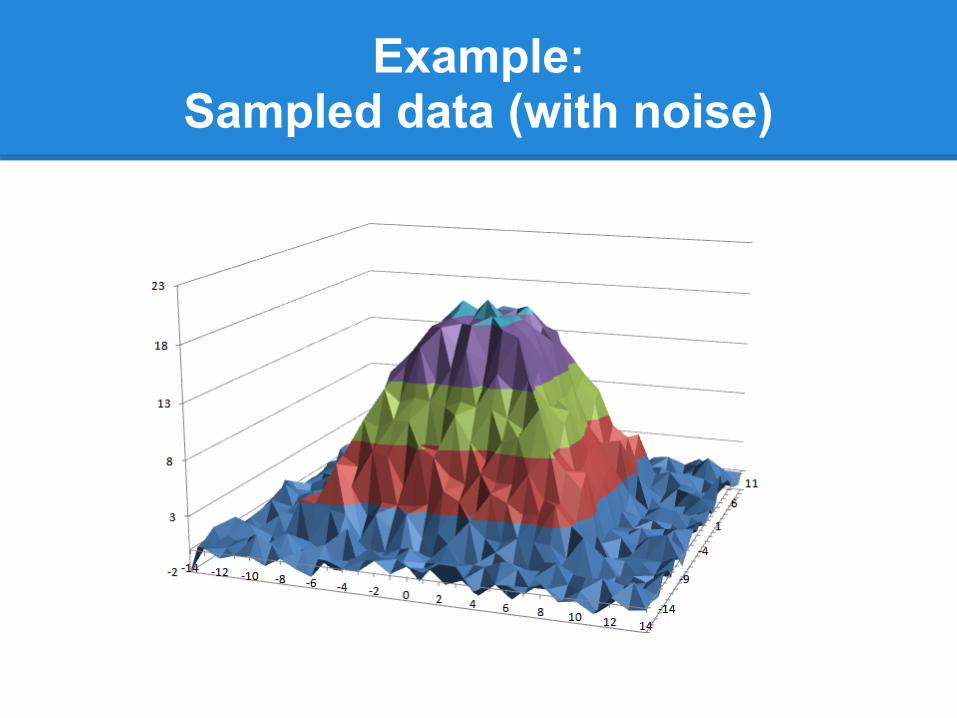
Example:Sampled data (with noise)
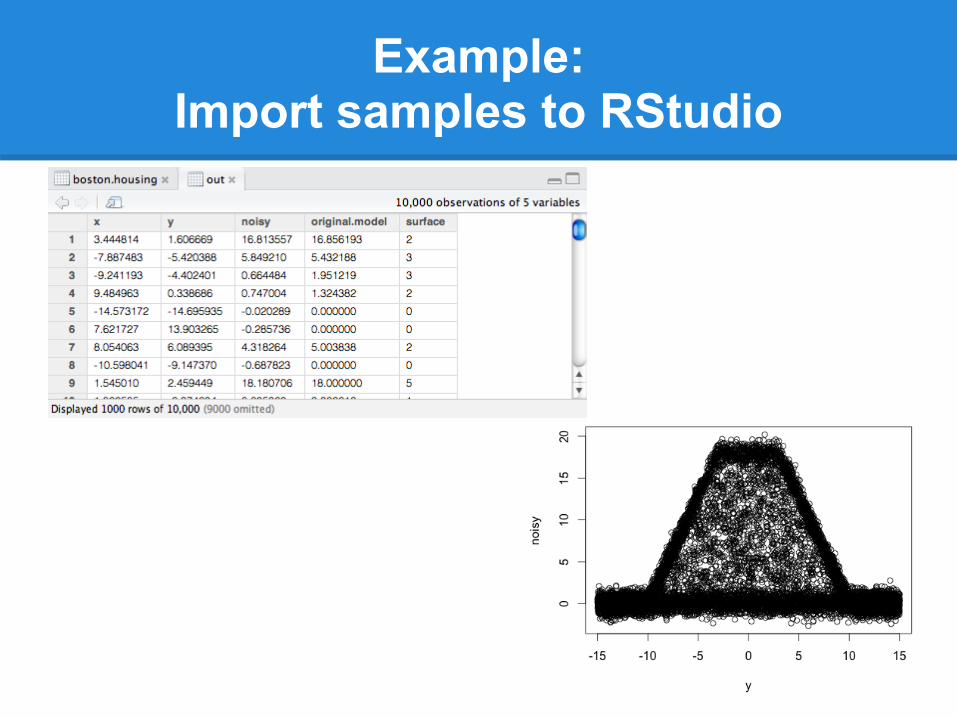
Example:Import samples to RStudio
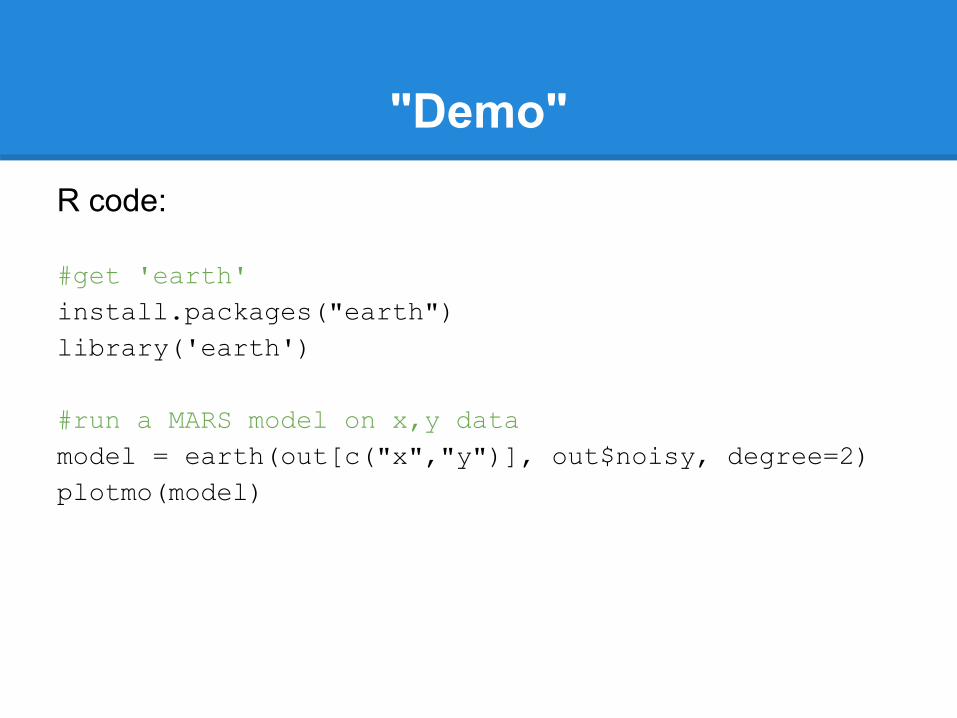
"Demo"
R code:
#get 'earth'install.packages("earth") library('earth')
#run a MARS model on x,y datamodel = earth(out[c("x","y")], out$noisy, degree=2)plotmo(model)
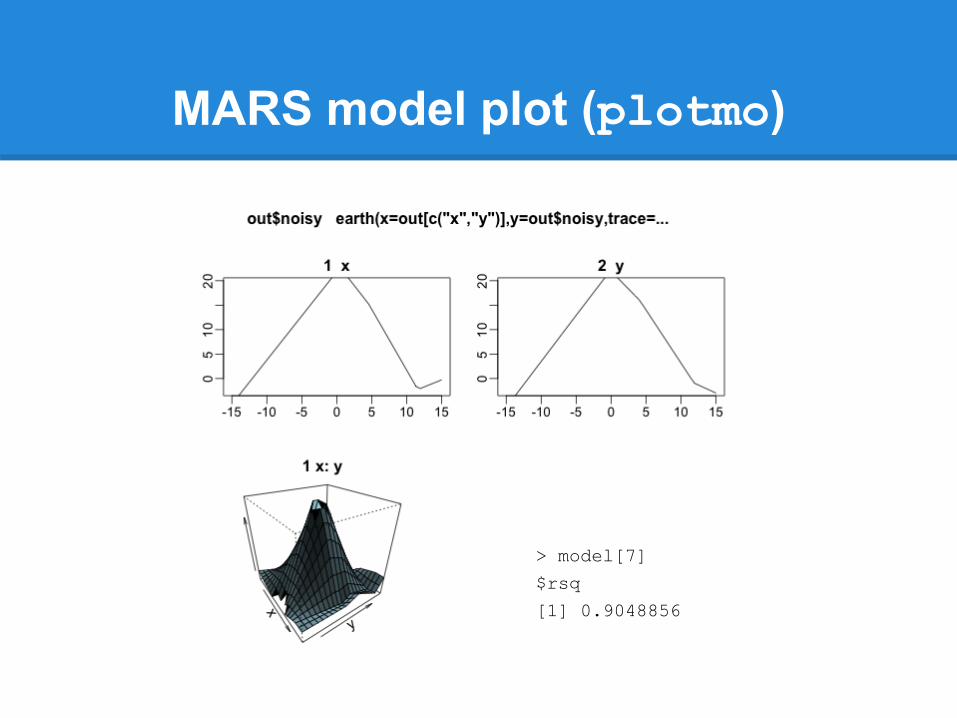
MARS model plot (plotmo)
> model[7]
$rsq
[1] 0.9048856
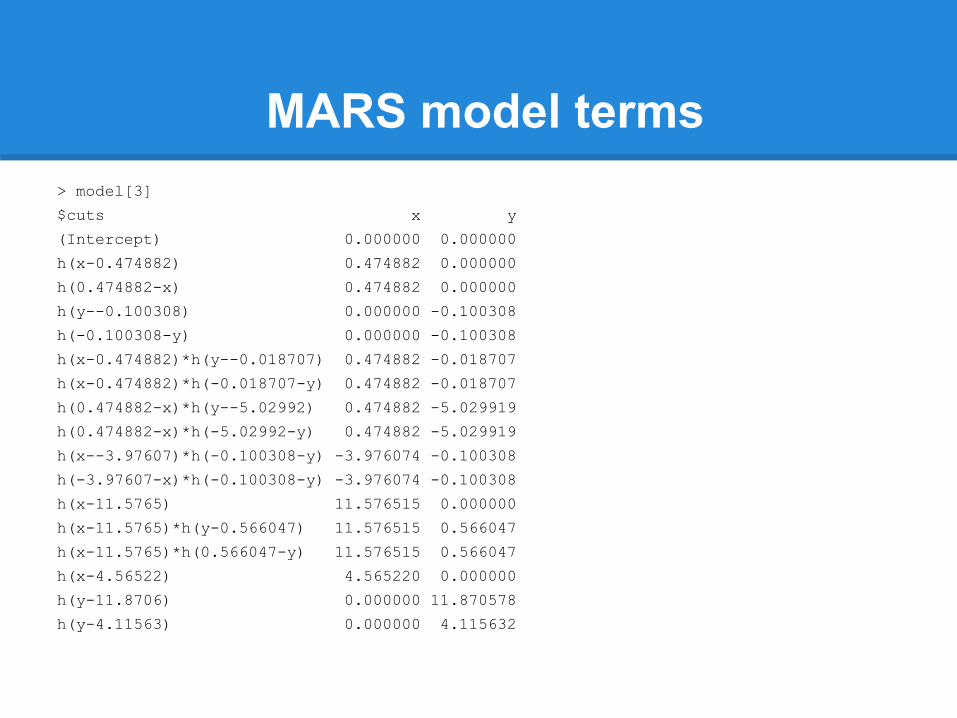
MARS model terms> model[3]
$cuts x y
(Intercept) 0.000000 0.000000
h(x-0.474882) 0.474882 0.000000
h(0.474882-x) 0.474882 0.000000
h(y--0.100308) 0.000000 -0.100308
h(-0.100308-y) 0.000000 -0.100308
h(x-0.474882)*h(y--0.018707) 0.474882 -0.018707
h(x-0.474882)*h(-0.018707-y) 0.474882 -0.018707
h(0.474882-x)*h(y--5.02992) 0.474882 -5.029919
h(0.474882-x)*h(-5.02992-y) 0.474882 -5.029919
h(x--3.97607)*h(-0.100308-y) -3.976074 -0.100308
h(-3.97607-x)*h(-0.100308-y) -3.976074 -0.100308
h(x-11.5765) 11.576515 0.000000
h(x-11.5765)*h(y-0.566047) 11.576515 0.566047
h(x-11.5765)*h(0.566047-y) 11.576515 0.566047
h(x-4.56522) 4.565220 0.000000
h(y-11.8706) 0.000000 11.870578
h(y-4.11563) 0.000000 4.115632

Q & A
Bibliography- Hastie, Tibshirani, and Friedman. The Elements of Statistical Learning (2nd ed.). Springer, 2009. http://www-stat.stanford.edu/~hastie/pub.htm.
- M. Nash and D. Bradford. Parametric and Nonparametric Logistic Regressions for Prediction of Presence/Absence of an Amphibian. EPA Oct. 2001. http:// www.epa.gov/esd/land-sci/pdf/008leb02.pdf.
- Multivariate Adaptive Regression Splines. Wikipedia.http://en.wikipedia.org/wiki/Multivariate_adaptive_regression_splines.
Reference Papers:- Jerome H. Friedman. Multivariate Adaptive Regression Splines (with discussion). Annals of Statistics, 1991. http://www.salfordsystems.com/doc/ MARS.pdf.
- Jerome H. Friedman. Fast MARS. Stanford University Department of Statistics, Technical Report 110, 1993. http://www.milbo.users.sonic.net/earth /Friedman-FastMars.pdf, http://www-stat.stanford.edu/research/ index.html.