Embed Size (px)
Citation preview
Multiuser Detection in CDMA
A. ChockalingamAssistant Professor
Indian Institute of Science, Bangalore-12
http://ece.iisc.ernet.in/~achockal
Dr. A. Chockalingam Dept of ECE, IISc, Bangalore 2
Outline
Near-Far Effect in CDMANear-Far Effect in CDMA CDMA System ModelCDMA System Model Conventional MF DetectorConventional MF Detector Optimum Multiuser DetectorOptimum Multiuser Detector Sub-optimum Multiuser DetectorsSub-optimum Multiuser Detectors
– Linear DetectorsLinear Detectors» MMSE, DecorrelatorMMSE, Decorrelator
– Nonlinear DetectorsNonlinear Detectors» Subtractive Interference cancellers (SIC, PIC)Subtractive Interference cancellers (SIC, PIC)» Decision Feedback DetectorsDecision Feedback Detectors
Dr. A. Chockalingam Dept of ECE, IISc, Bangalore 3
DS-CDMA
Efficient means of sharing a given RF spectrum by different users
User data is spread by a PN code before transmission
Base station Rx distinguishes different users based on different PN codes assigned to them
All CDMA users simultaneously can occupy the entire spectrum
» So system is Interference limited
Dr. A. Chockalingam Dept of ECE, IISc, Bangalore 4
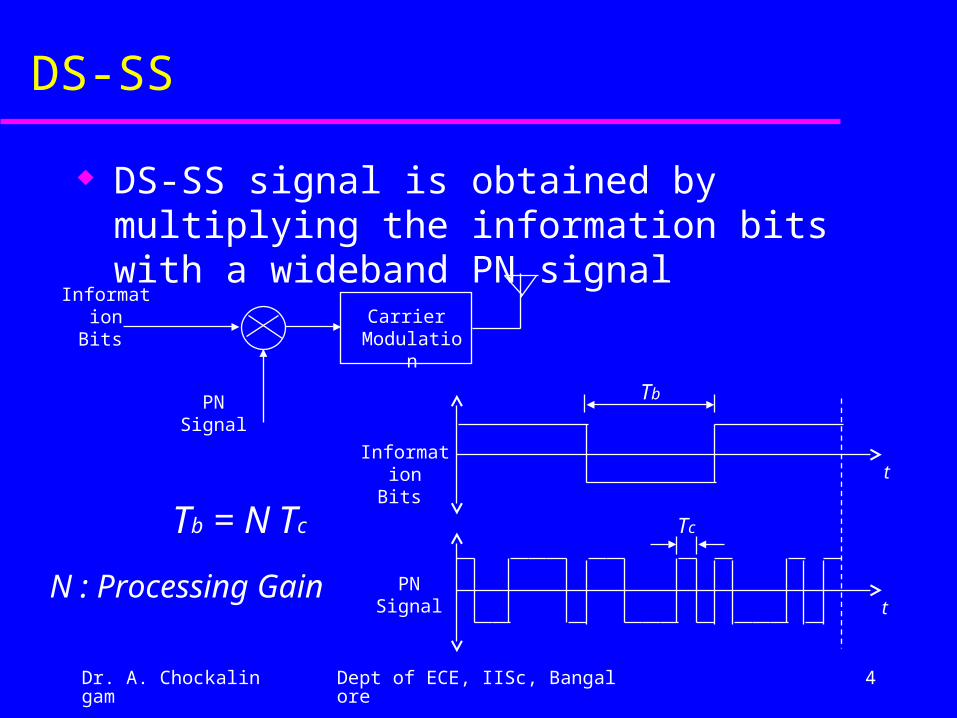
DS-SS
DS-SS signal is obtained by multiplying the information bits with a wideband PN signal
InformationBits
PN Signal
Carrier Modulation
InformationBits
PN Signalt
t
Tb
TcTb = N Tc
N : Processing Gain
Dr. A. Chockalingam Dept of ECE, IISc, Bangalore 5
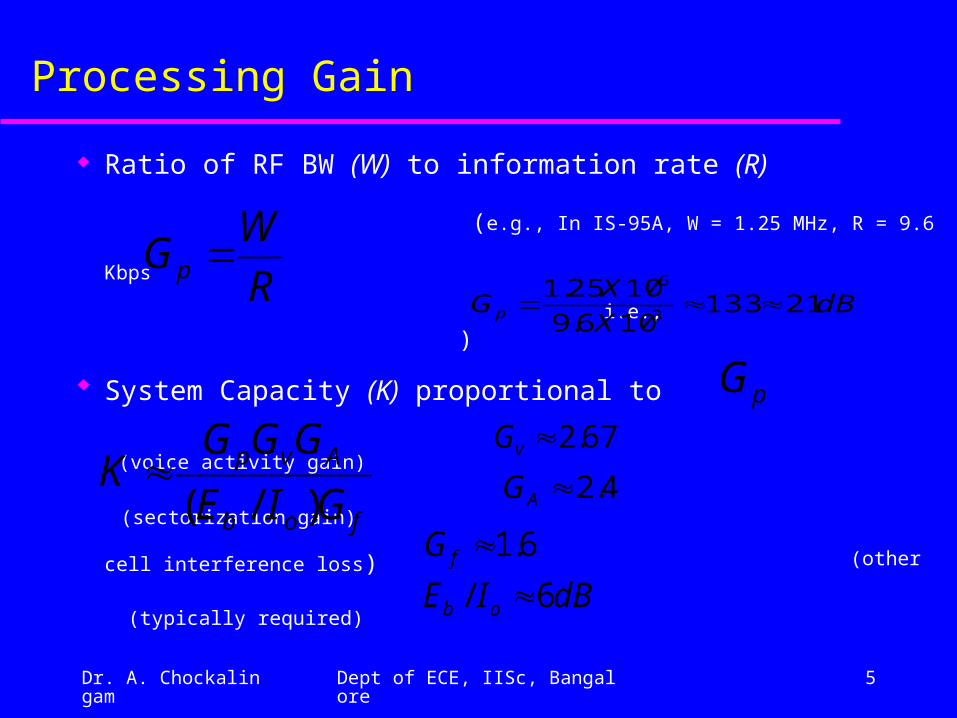
Processing Gain
Ratio of RF BW (W) to information rate (R)
(e.g., In IS-95A, W = 1.25 MHz, R = 9.6 Kbps
i.e., )
System Capacity (K) proportional to
(voice activity gain) (sectorization gain)
(other cell interference loss)
(typically required)
R
WGp
dBX
XGp 21133
106.9
1025.13
6
pG
fob
Avp
GIE
GGGK
)/(
67.2vG
4.2AG
6.1fG
dBIE ob 6/
Dr. A. Chockalingam Dept of ECE, IISc, Bangalore 6
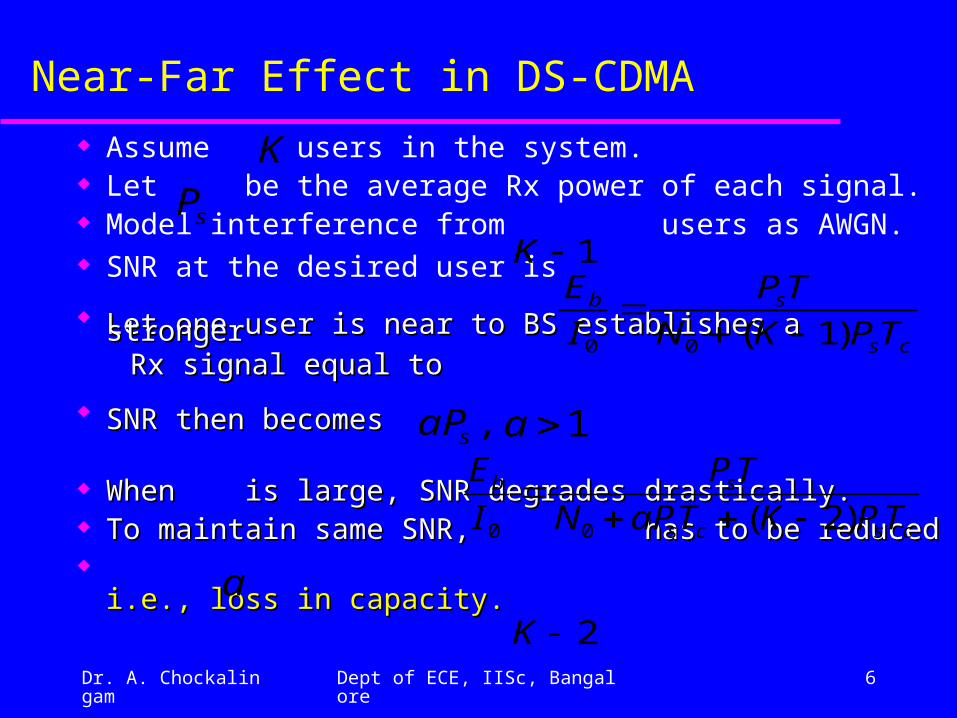
Near-Far Effect in DS-CDMA
Assume users in the system. Let be the average Rx power of each signal. Model interference from users as AWGN. SNR at the desired user is
Let one user is near to BS establishes a strongerLet one user is near to BS establishes a stronger Rx signal equal to Rx signal equal to
SNR then becomes SNR then becomes
When is large, SNR degrades drastically. When is large, SNR degrades drastically. To maintain same SNR, has to be reduced To maintain same SNR, has to be reduced i.e., loss in capacity.i.e., loss in capacity.
K
cs
sb
TPKN
TP
I
E
)1(00
sP1K
,saP 1a
cscs
sb
TPKTaPN
TP
I
E
)2(00
a2K
Dr. A. Chockalingam Dept of ECE, IISc, Bangalore 7
Near-Far Effect
Factors causing near-far effect (unequal Rx Signal powers from different users) in cellular CDMA– Distance loss
– Shadow loss
– Multipath fading (Most detrimental. Dynamic range of fade power variations: about 60 dB)
Two common approaches to combat near-far effect– Transmit Power Control– Near-far Resistant Multiuser DetectorsNear-far Resistant Multiuser Detectors
Dr. A. Chockalingam Dept of ECE, IISc, Bangalore 8
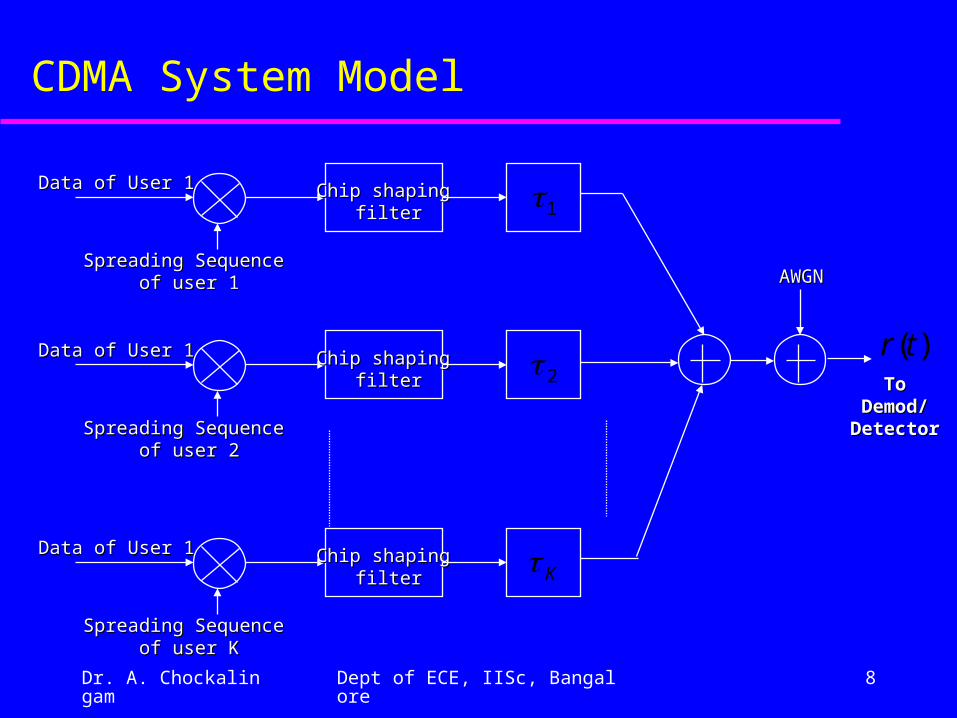
CDMA System Model
Data of User 1Data of User 1
Spreading Sequence Spreading Sequence of user 1of user 1
Chip shaping Chip shaping filterfilter 1
Data of User 1Data of User 1
Spreading Sequence Spreading Sequence of user 2of user 2
Chip shaping Chip shaping filterfilter 2
Data of User 1Data of User 1
Spreading Sequence Spreading Sequence of user Kof user K
Chip shaping Chip shaping filterfilter K
AWGNAWGN
ToToDemod/Demod/DetectorDetector
)(tr
Dr. A. Chockalingam Dept of ECE, IISc, Bangalore 9
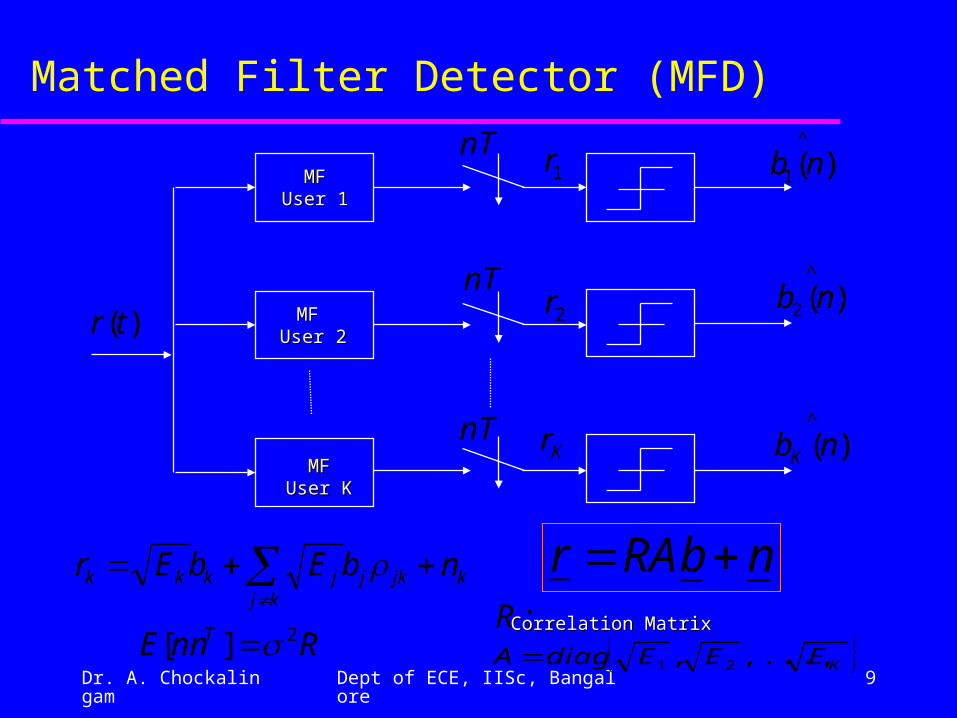
Matched Filter Detector (MFD)
MFMFUser 1User 1
MF MF User 2User 2
MFMFUser KUser K
)(tr
nT
nT
nT
^
1 )(nb
^
2 )(nb
^
)(nbK
1r
2r
Kr
kj
kjkjjkkk nbEbEr
RnnE T 2][
nbRAr :R Correlation MatrixCorrelation Matrix
KEEEdiagA ,...,, 21
Dr. A. Chockalingam Dept of ECE, IISc, Bangalore 10
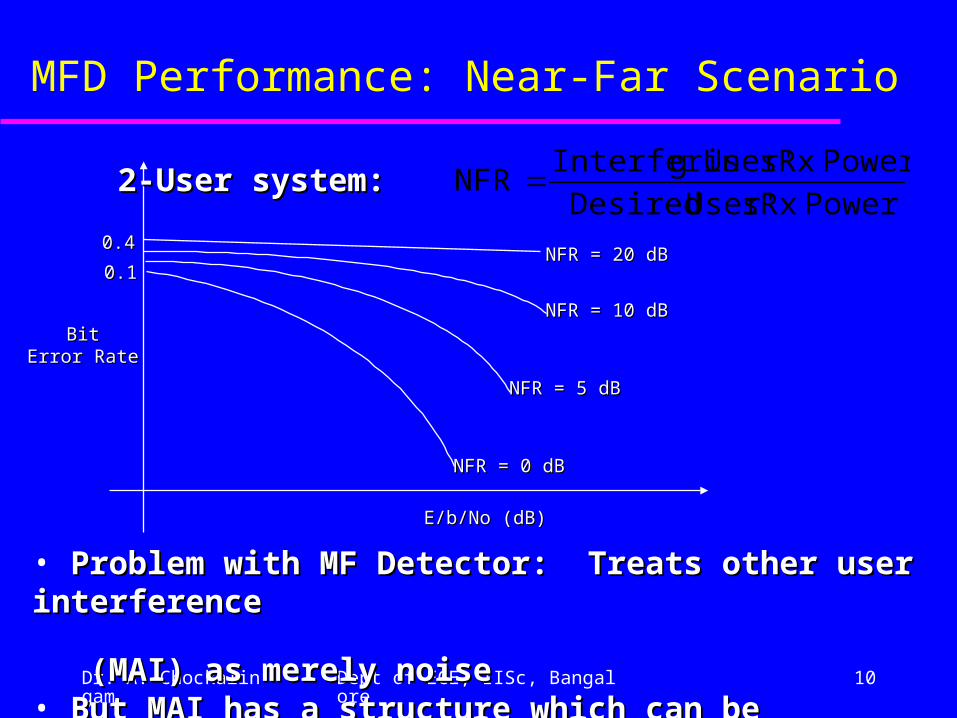
MFD Performance: Near-Far Scenario
E/b/No (dB)E/b/No (dB)
Bit Bit Error Rate Error Rate
0.4 0.4
0.1 0.1
NFR = 0 dBNFR = 0 dB
NFR = 5 dBNFR = 5 dB
NFR = 10 dBNFR = 10 dB
NFR = 20 dBNFR = 20 dB
2-User system: 2-User system: PowerRx s User'Desired
PowerRx s User'gInterferinNFR
• Problem with MF Detector: Treats other user interference Problem with MF Detector: Treats other user interference (MAI) as merely noise(MAI) as merely noise• But MAI has a structure which can be exploited in the But MAI has a structure which can be exploited in the detection process detection process
Dr. A. Chockalingam Dept of ECE, IISc, Bangalore 11
Optimum Multiuser Detector
Jointly detect all users data bits
Optimum Multiuser Detector– Maximum Likelihood Sequence Detector
Selects the mostly likely sequences of data bits
given the observations
Needs knowledge of side information such as– received powers of all users– relative delays of all users– spreading sequences of all users
Dr. A. Chockalingam Dept of ECE, IISc, Bangalore 12
Optimum Multiuser Detector
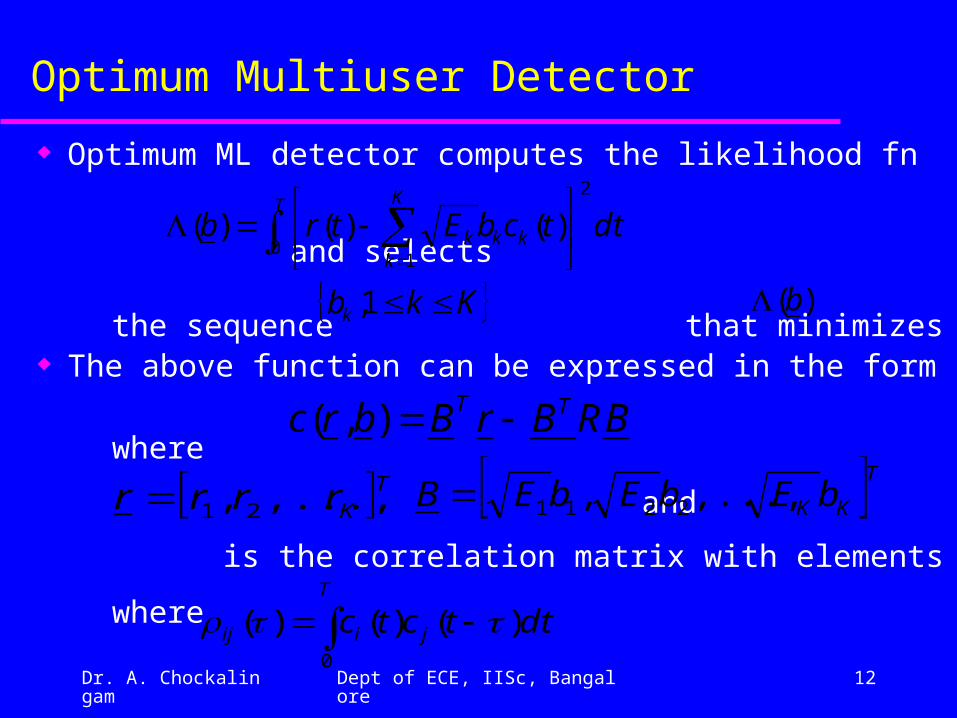
Optimum ML detector computes the likelihood fn
and selects
the sequence that minimizes The above function can be expressed in the form
where and
is the correlation matrix with elements
where
T K
kkkk dttcbEtrb
0
2
1
)()()(
Kkbk 1, )(b
BRBrBbrc TT ),(
TKrrrr ,...,, 21 TKK bEbEbEB ,...,, 2211
T
jiij dttctc0
)()()(
Dr. A. Chockalingam Dept of ECE, IISc, Bangalore 13
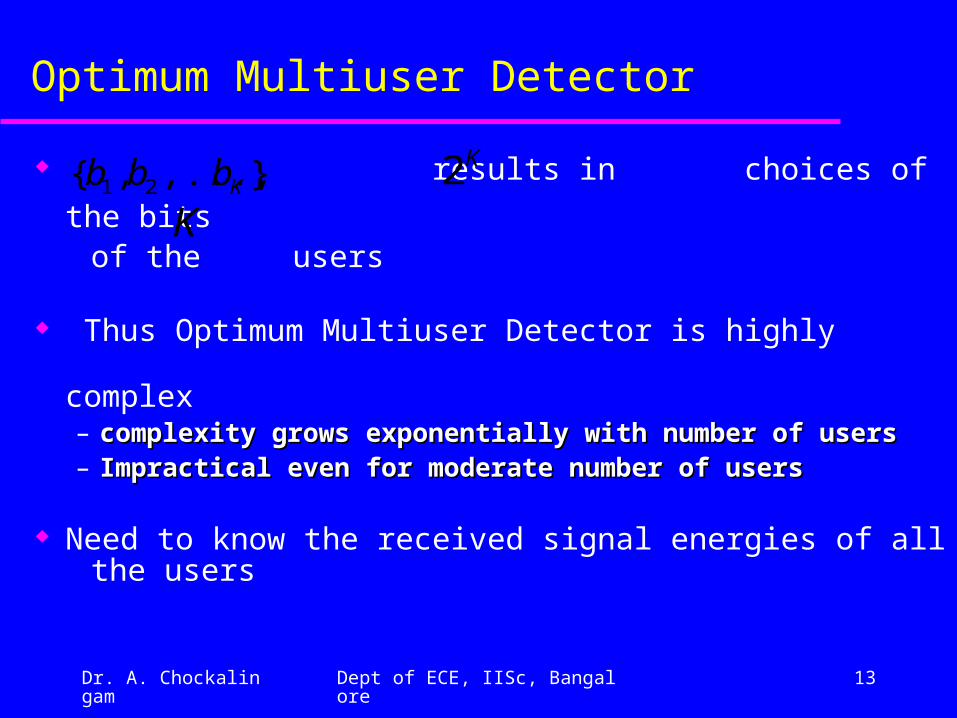
Optimum Multiuser Detector
results in choices of the bits of the users
Thus Optimum Multiuser Detector is highly complex– complexity grows exponentially with number of userscomplexity grows exponentially with number of users– Impractical even for moderate number of usersImpractical even for moderate number of users
Need to know the received signal energies of all the users
},...,,{ 21 Kbbb K2K
Dr. A. Chockalingam Dept of ECE, IISc, Bangalore 14
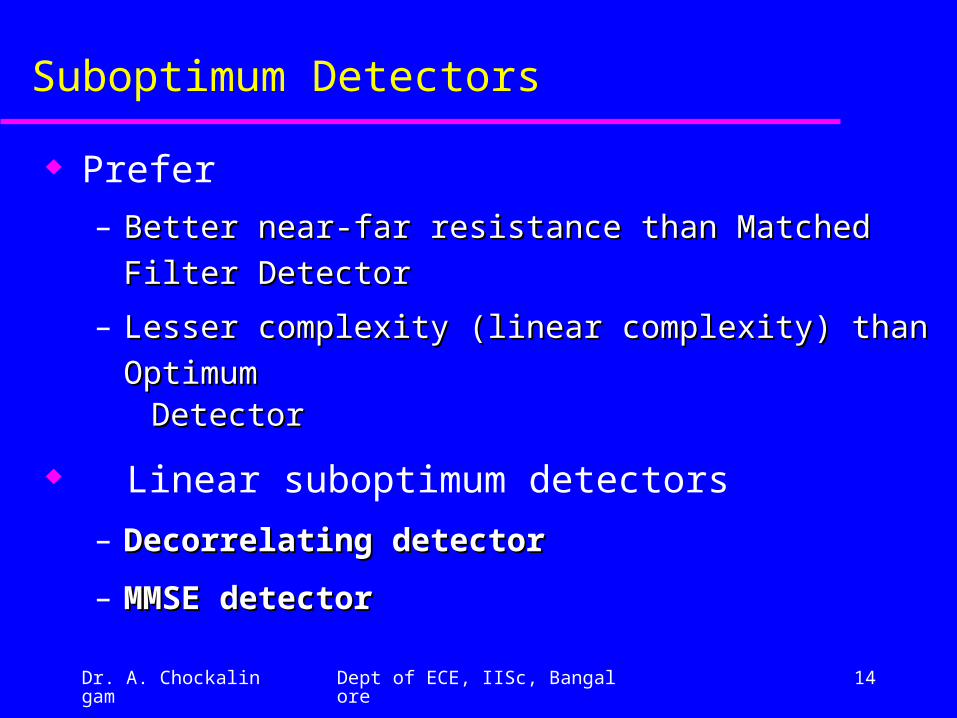
Suboptimum Detectors
Prefer
– Better near-far resistance than Matched Filter DetectorBetter near-far resistance than Matched Filter Detector
– Lesser complexity (linear complexity) than OptimumLesser complexity (linear complexity) than Optimum DetectorDetector
Linear suboptimum detectors
– Decorrelating detectorDecorrelating detector
– MMSE detectorMMSE detector
Dr. A. Chockalingam Dept of ECE, IISc, Bangalore 15
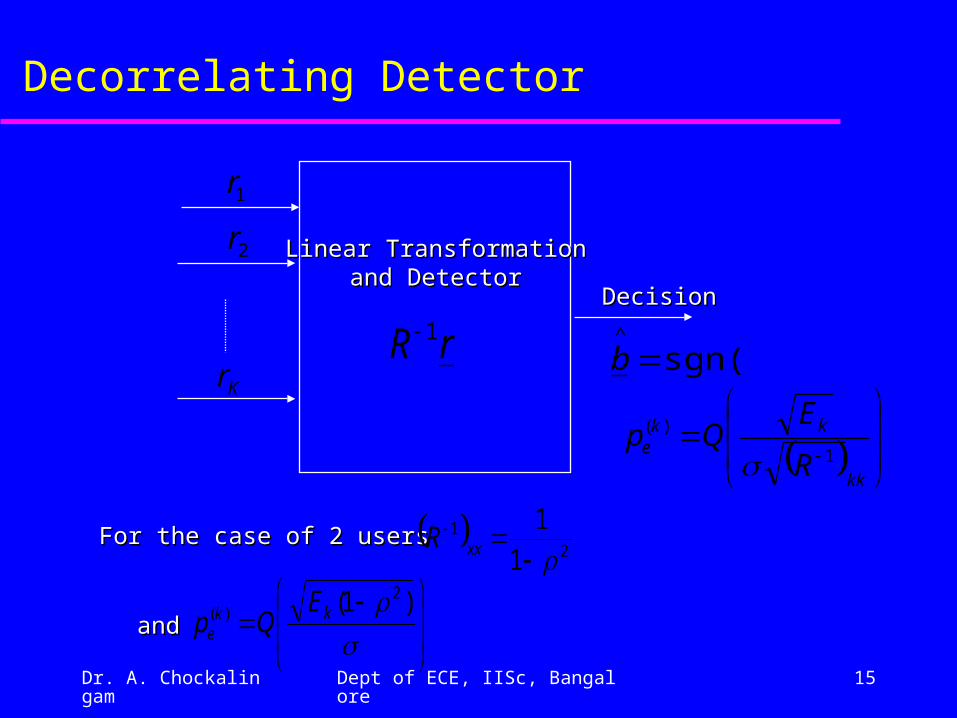
Decorrelating Detector
1r
2r
Kr
Linear TransformationLinear Transformationand Detectorand Detector
rR 1sgn()
^
b
DecisionDecision
kk
kke
R
EQp
1
)(
)1( 2
)( kke
EQp
For the case of 2 usersFor the case of 2 users 2
1
1
1
xxR
andand
Dr. A. Chockalingam Dept of ECE, IISc, Bangalore 16
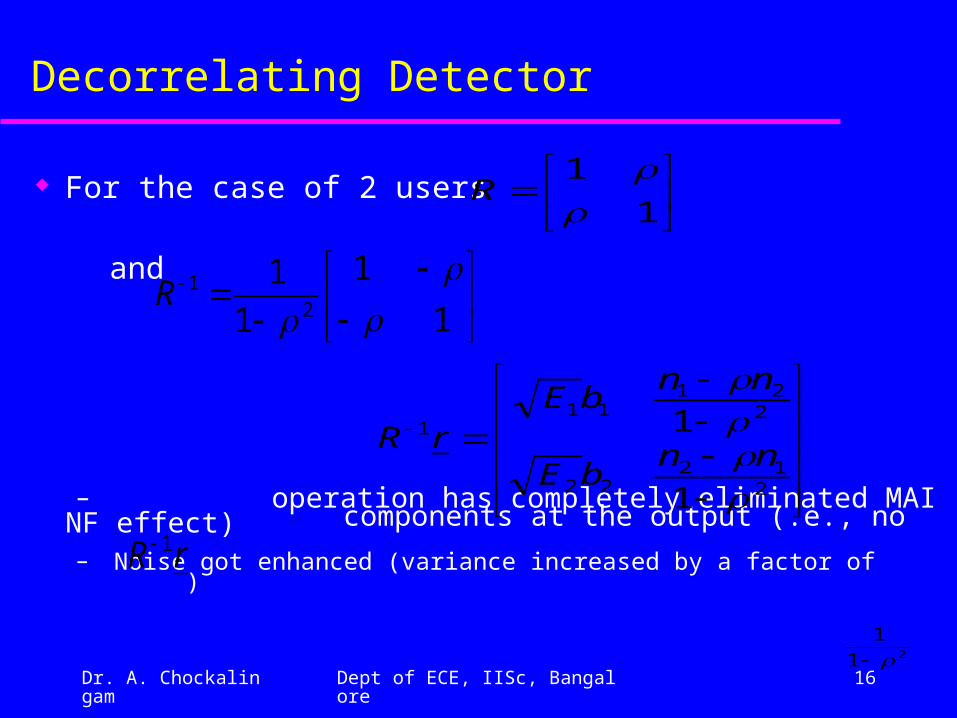
Decorrelating Detector
For the case of 2 users
and
– operation has completely eliminated MAI components at the output (.e., no NF effect)
– Noise got enhanced (variance increased by a factor of )
1
1
R
1
1
1
12
1
R
212
22
221
111
1
1
nnbE
nnbE
rR
rR 1
21
1
Dr. A. Chockalingam Dept of ECE, IISc, Bangalore 17
Decorrelating Detector
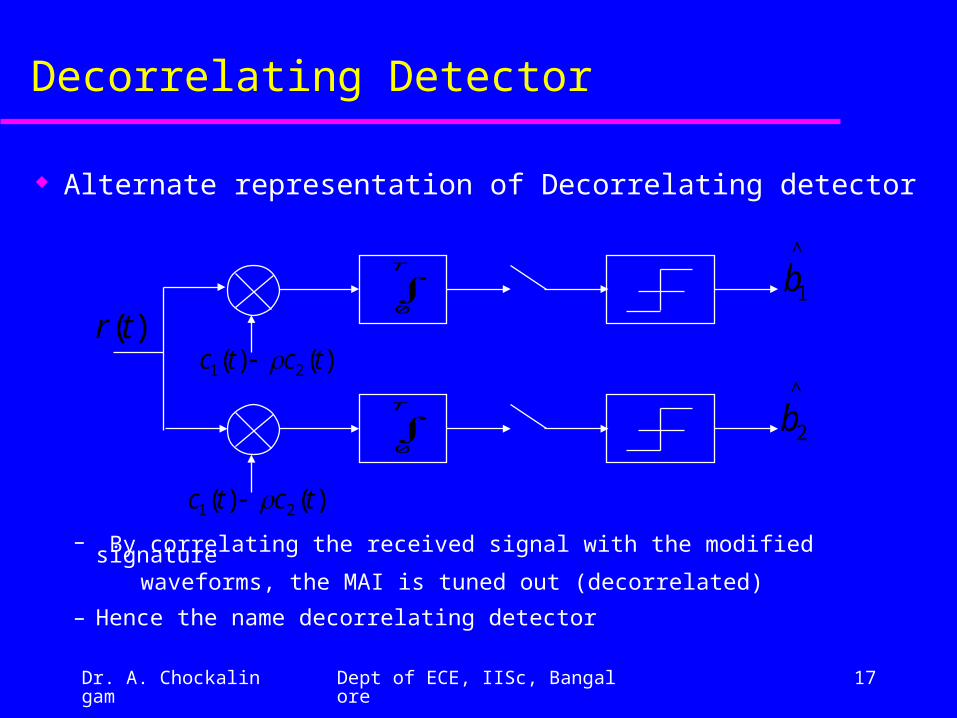
Alternate representation of Decorrelating detector
– By correlating the received signal with the modified signature waveforms, the MAI is tuned out (decorrelated)
– Hence the name decorrelating detector
)(tr)()( 21 tctc
T
0
^
1b
)()( 21 tctc
T
0
^
2b
Dr. A. Chockalingam Dept of ECE, IISc, Bangalore 18
MMSE Detector
1r
2r
Kr
Linear TransformationLinear Transformationand Detectorand Detector
rA 1sgn()
^
b
DecisionDecision
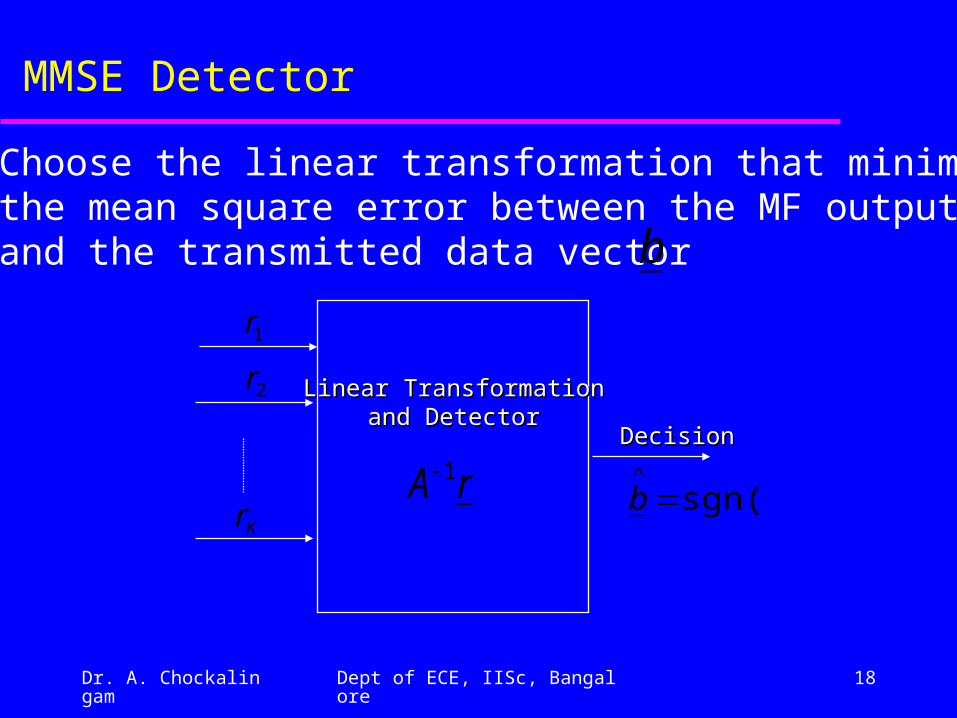
• Choose the linear transformation that minimizes the mean square error between the MF outputs and the transmitted data vector b
Dr. A. Chockalingam Dept of ECE, IISc, Bangalore 19
MMSE Detector
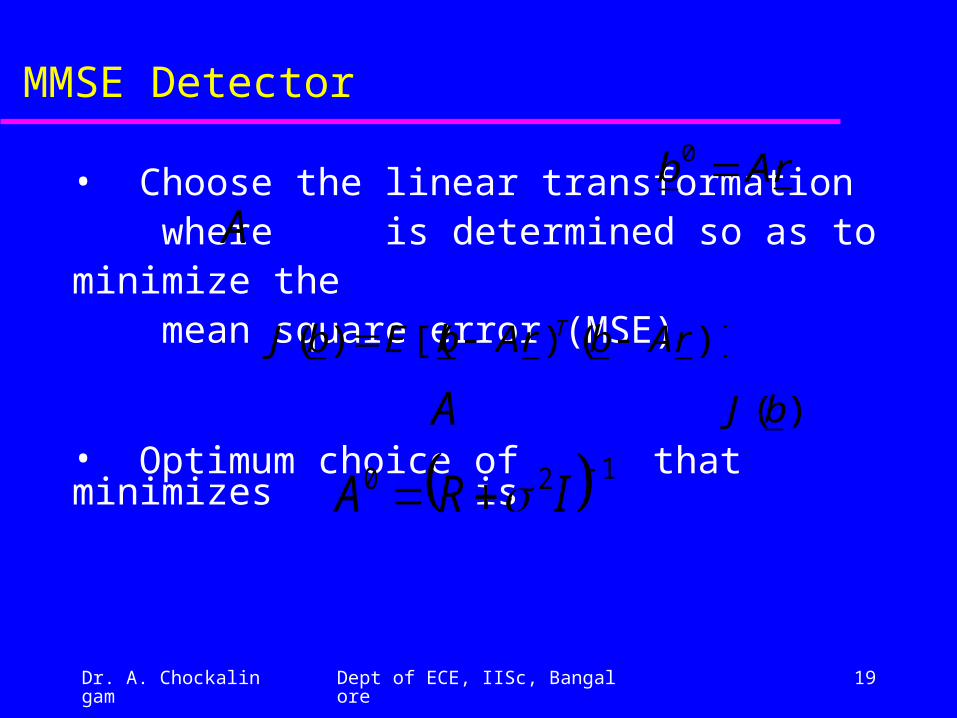
• Choose the linear transformation where is determined so as to minimize the mean square error (MSE)
• Optimum choice of that minimizes is
rAb 0
A
)]()[()( rAbrAbEbJ T
A )(bJ
120 IRA
Dr. A. Chockalingam Dept of ECE, IISc, Bangalore 20
MMSE Detector
1r
2r
Kr
Linear TransformationLinear Transformationand Detectorand Detector
sgn()^
b
DecisionDecision
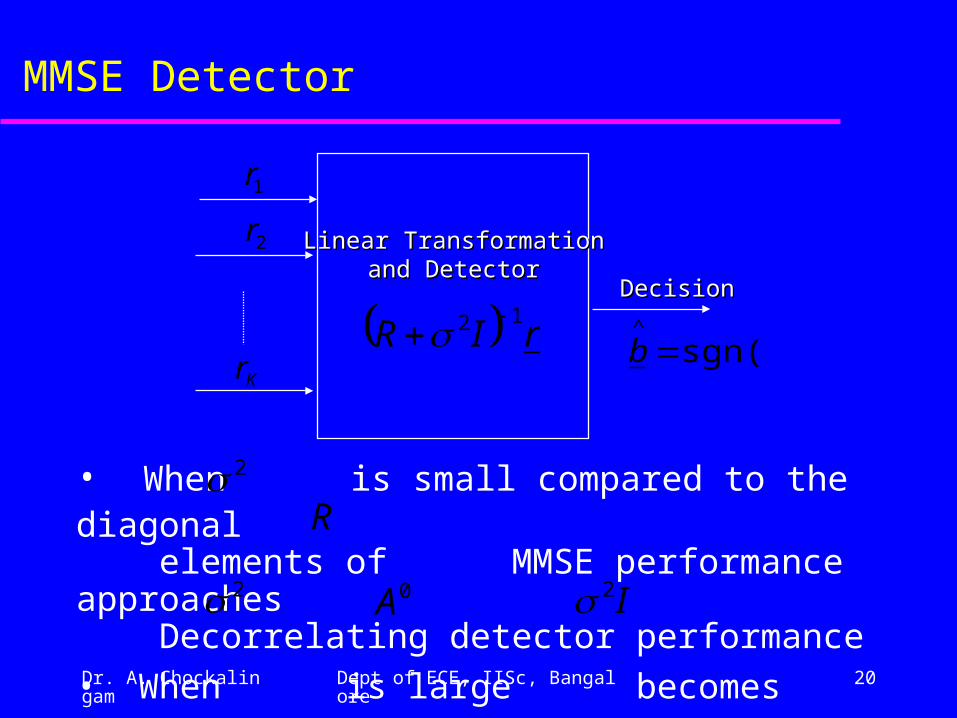
rIR12
• When is small compared to the diagonal elements of MMSE performance approaches Decorrelating detector performance
• When is large becomes (i.e., AWGN becomes dominant)
2
R
2
0A I2
Dr. A. Chockalingam Dept of ECE, IISc, Bangalore 21
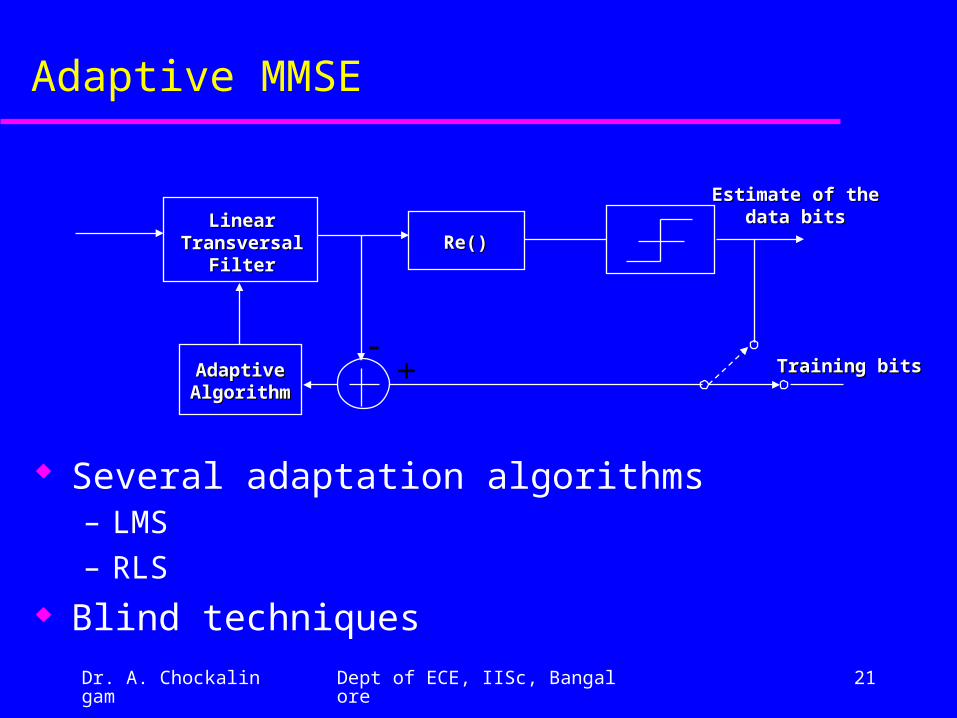
Adaptive MMSE
Several adaptation algorithms – LMS– RLS
Blind techniques
LinearLinearTransversalTransversal
FilterFilter
AdaptiveAdaptiveAlgorithmAlgorithm
Re()Re()
Estimate of theEstimate of thedata bitsdata bits
Training bitsTraining bits
Dr. A. Chockalingam Dept of ECE, IISc, Bangalore 22
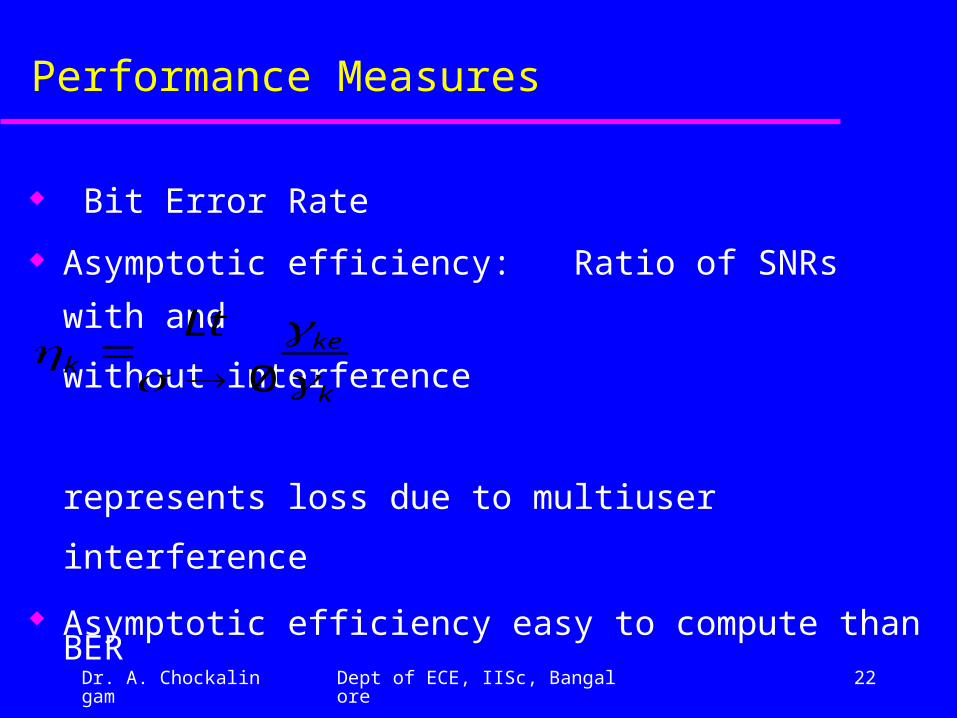
Performance Measures
Bit Error Rate
Asymptotic efficiency: Ratio of SNRs with and without interference
represents loss due to multiuser interference
Asymptotic efficiency easy to compute than BER
k
kek
Lt
0
Dr. A. Chockalingam Dept of ECE, IISc, Bangalore 23
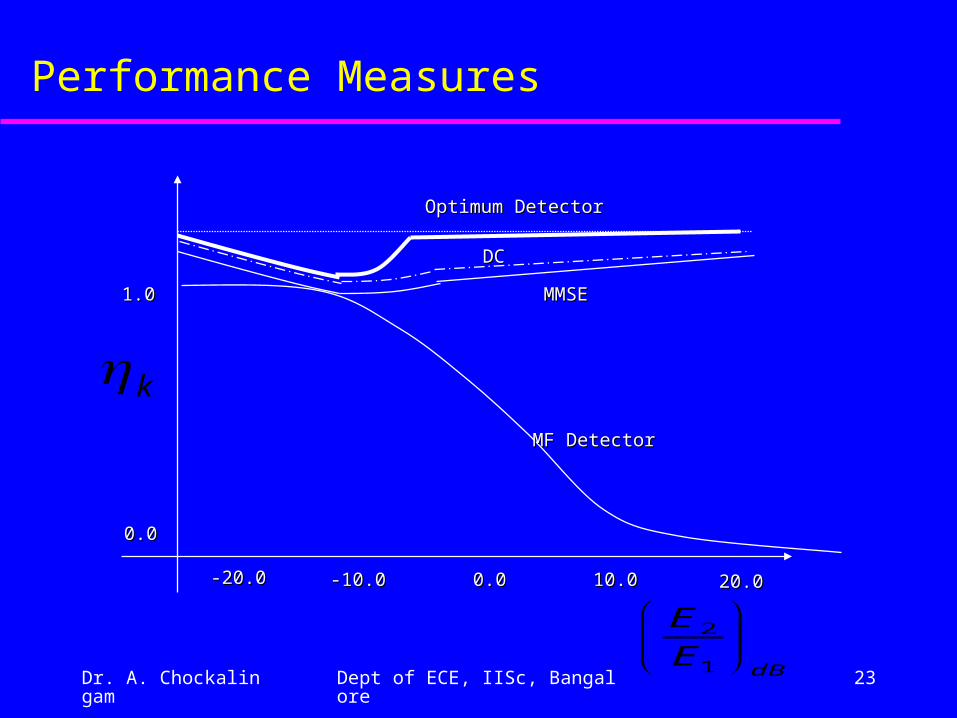
Performance Measures
dBE
E
1
2
k
0.0 0.0
1.0 1.0
-20.0 -20.0 -10.0 -10.0 10.0 10.0 0.0 0.0 20.0 20.0
MMSE MMSE
Optimum Detector Optimum Detector
DC DC
MF Detector MF Detector
Dr. A. Chockalingam Dept of ECE, IISc, Bangalore 24
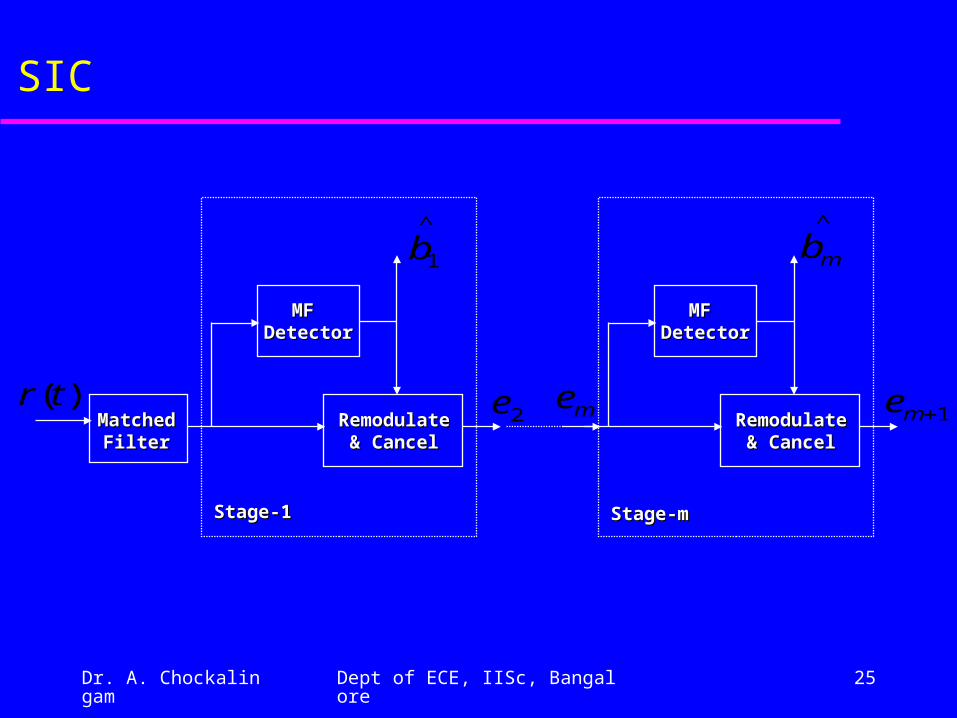
Subtractive Interference Cancellation
Multistage interference Cancellation approaches
– Serial (or successive) Interference Canceller (SIC)
» sequentially recovers users (recover one user per stage)
» data estimate in each stage is used to regenerate the
interfering signal which is then subtracted from the original
received signal
» Detects and removes the strongest user first
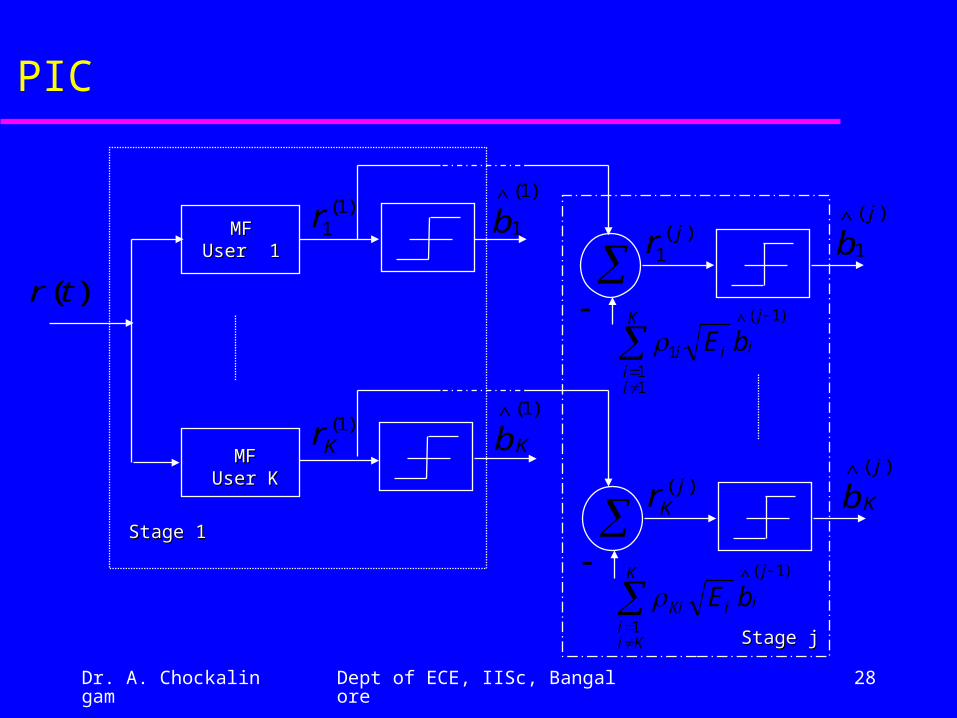
– Parallel Interference Canceller (PIC)» Similar to SIC except that cancellations are done in parallel
Dr. A. Chockalingam Dept of ECE, IISc, Bangalore 25
SIC
MatchedMatchedFilterFilter
RemodulateRemodulate& Cancel& Cancel
MF MF DetectorDetector
)(tr
^
1b
2e meRemodulateRemodulate
& Cancel& Cancel
Stage-1Stage-1
^
mb
1me
Stage-mStage-m
MF MF DetectorDetector
Dr. A. Chockalingam Dept of ECE, IISc, Bangalore 26
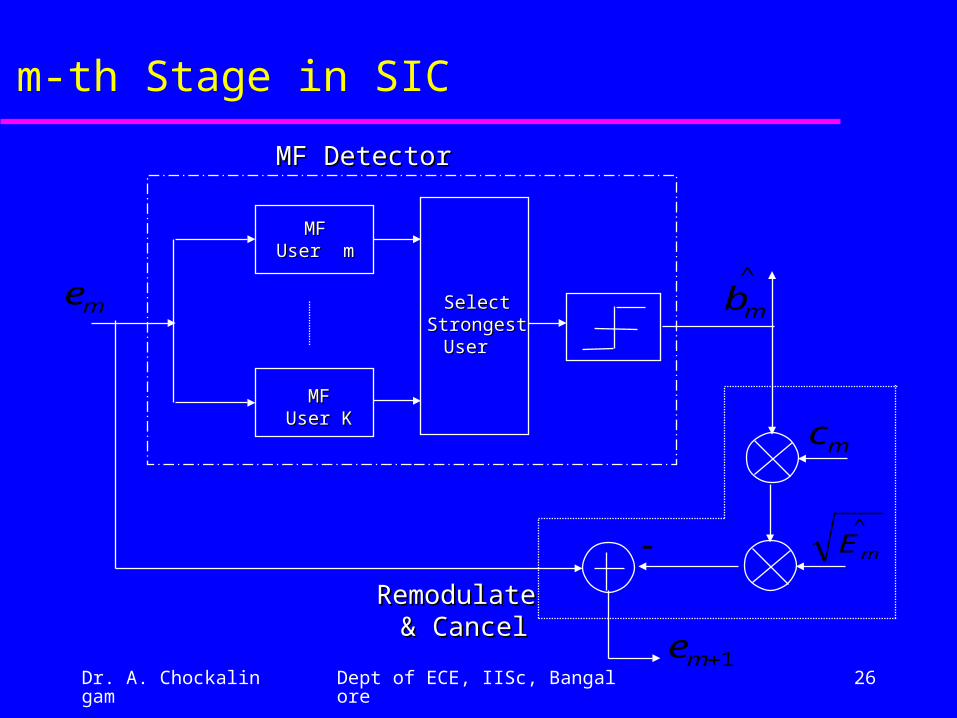
m-th Stage in SIC
^
mbme
MFMFUser mUser m
MFMFUser KUser K
SelectSelectStrongestStrongest
User User
mc
^
mE
1me
MF DetectorMF Detector
Remodulate Remodulate & Cancel& Cancel
Dr. A. Chockalingam Dept of ECE, IISc, Bangalore 27
Performance of SIC
Good near-far resistance Most performance gain in achieved using just
2 to 3 stages High NFR can result in good performance!
– Provided accurate estimates of amptitude and timing are available
Sensitive to amplitude and timing estimation errors– increased loss in performance for amplitude estimation
errors > 20 % Some amount of power control may be required to compensate for the near-far resistance loss due to imperfect estimates and low NFR
Dr. A. Chockalingam Dept of ECE, IISc, Bangalore 28
PIC
)(tr
MFMFUser 1User 1
MFMFUser KUser K
)1(1r
)1(Kr
)1(
1
^
b
)1(^
Kb
K
ii
j
iii bE
11
)1(^
1
)(1
jr)(
1
^ j
b
K
Kii
j
iiKi bE1
)1(^
)( jKr
)(^ j
KbStage 1Stage 1
Stage jStage j

Dr. A. Chockalingam Dept of ECE, IISc, Bangalore 29
Performance of PICPerformance of PIC
Good near-far resistance
Similar performance observations as in SIC
Performance of PIC depends more heavily on the relative amplitude levels than on the cross-correlations of the user spreading codes
Hybrid SIC/PIC architectures
Dr. A. Chockalingam Dept of ECE, IISc, Bangalore 30
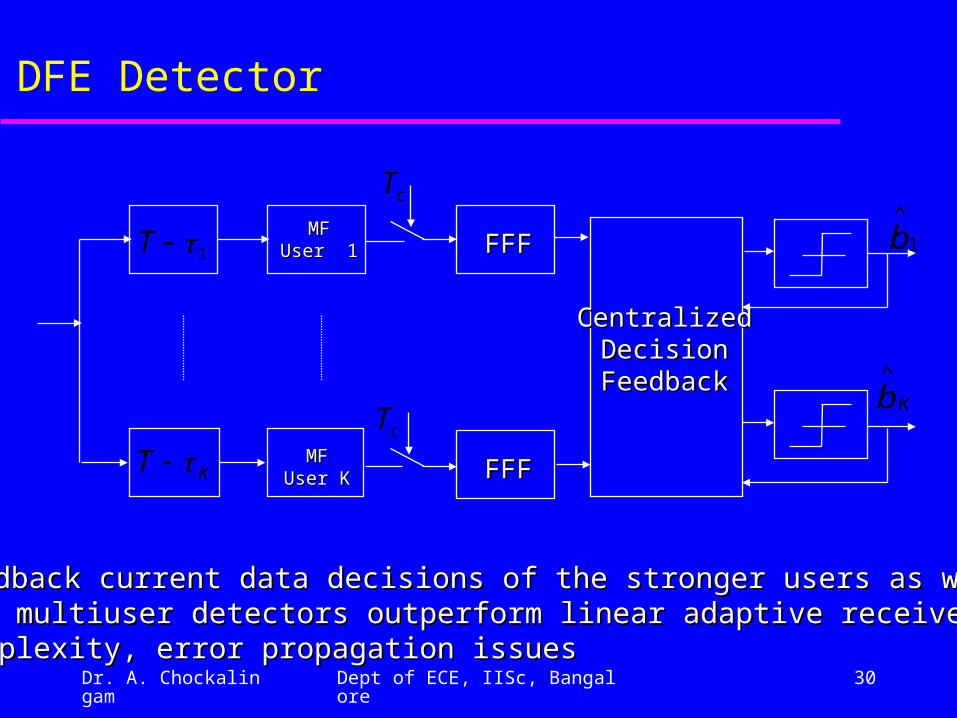
DFE Detector
MFMFUser 1User 1
MFMFUser KUser K
1T
KT
cT
cT
FFFFFF
FFFFFF
CentralizedCentralizedDecisionDecision
FeedbackFeedback
1
^
b
Kb^
• Feedback current data decisions of the stronger users as wellFeedback current data decisions of the stronger users as well• DFE multiuser detectors outperform linear adaptive receiversDFE multiuser detectors outperform linear adaptive receivers• Complexity, error propagation issuesComplexity, error propagation issues


![[XLS] · Web viewCHERIAN AIR FORCE KUNNIPARAMPIL HOUSE NIRANAM WEST P.O. TIRUVALLA KERALA STATE 689629 689629 00000000000000302535 KARUMUTTHU CHOCKALINGAM T SUNDARAM CHETTIAR "SIVAKAMI"](https://img.pdfslide.us/doc/110x75/5aa8f7477f8b9a95188c373d/xls-viewcherian-air-force-kunniparampil-house-niranam-west-po-tiruvalla-kerala.jpg)