Embed Size (px)
Citation preview
Lavanya Chockalingam
Software Technical Consulting Engineer
Intel Corporation

Copyright © 2016, Intel Corporation. All rights reserved. *Other names and brands may be claimed as the property of others.
Optimization Notice
Agenda:
Intel® System Studio Overview
Intel® VTune™ Amplifier for Systems
Intel® Energy Profiler
Additional Information
Q & A
Contents
2


Copyright © 2016, Intel Corporation. All rights reserved. *Other names and brands may be claimed as the property of others.
Optimization Notice4
Connected Devices are Increasing in Complexity & are EverywhereChallenges & Opportunities are Increasing for System & Embedded Developers
To address these challenges, software developers need tools that… Are comprehensive and easy to use Quickly help resolve defects in complex systems Offer insight into sources of excess power consumption Enable & accelerate performance - demanding & unique, competitive use cases
Networks &CommunicationTransportation MedicalIndustrial
Military, Aerospace,
GovernmentRetail
$$
ImagingDigital
SecuritySurveillance
Client & Mobile
Cloud /data centers /
storageIoT Devices
F
143 bpm
Gateways

Copyright © 2016, Intel Corporation. All rights reserved. *Other names and brands may be claimed as the property of others.
Optimization Notice5
Deep system-wide insight for SYSTEM & embedded developers
Accelerate Time to Market
Boost Power Efficiency & Performance
Strengthen System Reliability
Develop embedded solutions Faster
Intel® System Studio
Support for the latest Intel® platforms
Comprehensive, ready-to-use, domain-specific routines
Reduce optimization time with system-wide visual performance analysis
Powerful, easy to understand performance analysis tools
Highly optimized, platform tuned, libraries and compilers
Actionable wake-up, sleep state, frequency and temperature data
Correlated system event tracing and debugging
Closed chassis software debug and trace on production hardware
Start debugging faster with an enhanced debugger workflow

Copyright © 2016, Intel Corporation. All rights reserved. *Other names and brands may be claimed as the property of others.
Optimization Notice
Intel® System Studio - A Comprehensive Tool SuiteProvides Deep System-wide Insight for System & Embedded Developers
6
Enables & accelerates performance-demanding use cases Offers insight into sources of excess power consumption Quickly helps resolve defects in complex systems Is comprehensive & easy to use
Develop Embedded Solutions Faster - Learn more: intel.ly/system-studio
1 Linux*, Embedded Linux*, Wind River* Linux*, Yocto* Project2 UEFI: Unified Extensible Firmware Interface
COMPILER & LIBRARIES ANALYZERS DEBUGGERS
UEFI*2
Agent
JTAG,JTAGoverUSB
Simics*
PlatformSimulation
System and Application Code Running onLinux*1, Android*, Windows* or VxWorks*
Intel® Architecture-based Platforms
C/C++Compiler
Image, Signal, Math andData Processing
Power &Performance
Memory &Threading
Application &System
Debug &Trace
TARGET SYSTEM

Copyright © 2016, Intel Corporation. All rights reserved. *Other names and brands may be claimed as the property of others.
Optimization Notice7
Editions & ConfigurationsIntel® System Studio 2017
Composer Edition Professional Edition Ultimate Edition
Buil
d
Intel® C++ Compiler
Intel® Threading Building Blocks
Intel® Integrated Performance Primitives
Intel® Math Kernel Library
√√√√
√√√√
√√√√
Anal
yze Intel® VTune Amplifier for Systems – Performance Profiler
Intel® Energy Profiler
Intel® Graphics Performance Analyzers
Intel® Inspector – Memory & Thread Debugger
√√√√
√√√√
Debu
g GDB Application Debugger3
Intel® System Debugger
GDB over OpenOCD3
√ √ √√√
Host Operating Systems Linux*, Windows*
Target Operating Systems1 Linux*2, Android*, Windows*
Hardware Processors & Platforms4
Processors: Intel® Quark™ X1000 Processor, Intel® Atom™ x3/x5/x7 SoC Processor Series,Intel® Core™ M Processors, Intel® Core™ i3/i5/i7 Processor Series, Intel® Xeon® Processors
Development Platforms: Intel® Edison Development Platform, Intel® Joule IoT Module, Intel® Puma™6-Media Gateway, Intel® Galileo Gen 2 Board
1 Target OS licenses available: Linux*+Android* (combined), Windows*2 Linux*, Embedded Linux*, Wind River* Linux*, Yocto* Project3 Supported on Linux* target OSes4 See release notes for detailed information about supported processors and platforms
Additional configurations including, floating, academic and VxWorks* support, are available at: software.intel.com/en-us/intel-system-studio/try-buyAll editions include 1 year of renewable Intel® Premier Support.


Copyright © 2016, Intel Corporation. All rights reserved. *Other names and brands may be claimed as the property of others.
Optimization Notice
Where is my system…
Spending Time? Wasting Time? Waiting Too Long? Waking-up Too Often?
• Focus tuning on functions taking time
• See call stacks• See time on source
• See cache misses on your source
• See functions sorted by # of cache misses
• See locks by wait time
• Red/Green for CPU utilization during wait
• See wakeup causes on your source
• See CPU frequencies per core
Intel® VTune™ Amplifier 2017 for SystemsPower & Performance Analyzer
9
• Windows, Linux, FreeBSD• Low overhead• No special recompiles

Copyright © 2016, Intel Corporation. All rights reserved. *Other names and brands may be claimed as the property of others.
Optimization Notice
Get the Data You Need
Hotspot (Statistical call tree), Call counts (Statistical)
Thread Profiling – Concurrency and Lock & Waits Analysis
Cache miss, Bandwidth analysis…1
GPU Offload and OpenCL™ Kernel Tracing
Find Answers Fast
View Results on the Source / Assembly
OpenMP Scalability Analysis, Graphical Frame Analysis
Filter Out Extraneous Data – Organize Data with Viewpoints
Visualize Thread & Task Activity on the Timeline
Easy to Use
No Special Compiles – C, C++, C#, Fortran, Java, ASM
Visual Studio* Integration or Stand Alone
Local & Remote Data Collection, Command Line
Analyze Windows* & Linux* data on OS X*2
Intel® VTune™ Amplifier for SystemsFaster, Scalable Code Faster
1 Events vary by processor. 2 No data collection on OS X*
Quickly Find Tuning Opportunities
See Results On The Source Code
Visualize & Filter Data
Tune OpenMP Scalability
10

Copyright © 2016, Intel Corporation. All rights reserved. *Other names and brands may be claimed as the property of others.
Optimization Notice
Intel® VTune™ Amplifier for Systems
Agenda
Data Collection –
Rich set of performance data
Data Analysis -
Find answers fast
Flexible workflow –
– User i/f and command line
– Compare results
– Remote collection
New for 2017!
11
Copyright © 2016, Intel Corporation. All rights reserved. *Other names and brands may be claimed as the property of others.
Optimization Notice12
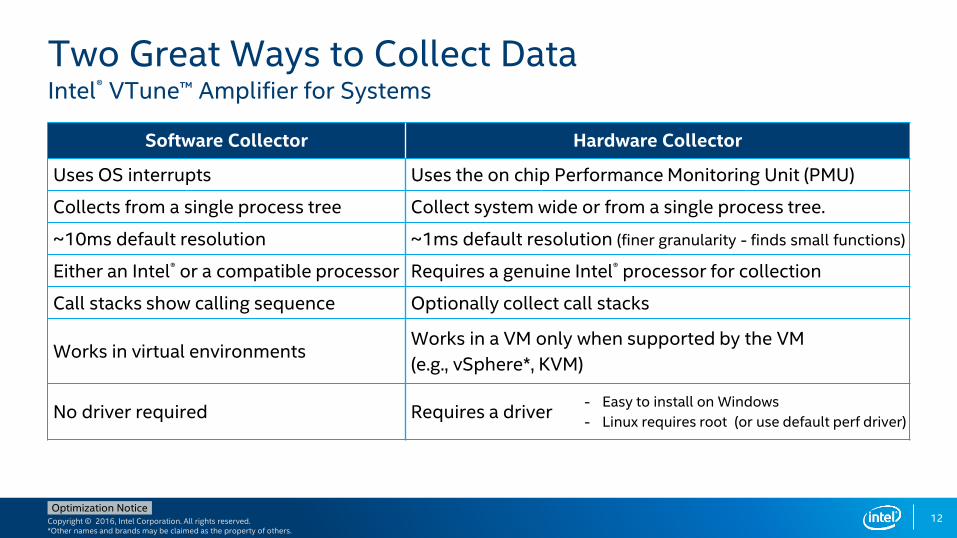
Two Great Ways to Collect DataIntel® VTune™ Amplifier for Systems
Software Collector Hardware Collector
Uses OS interrupts Uses the on chip Performance Monitoring Unit (PMU)
Collects from a single process tree Collect system wide or from a single process tree.
~10ms default resolution ~1ms default resolution (finer granularity - finds small functions)
Either an Intel® or a compatible processor Requires a genuine Intel® processor for collection
Call stacks show calling sequence Optionally collect call stacks
Works in virtual environmentsWorks in a VM only when supported by the VM
(e.g., vSphere*, KVM)
No driver required Requires a driver - Easy to install on Windows
- Linux requires root (or use default perf driver)

Copyright © 2016, Intel Corporation. All rights reserved. *Other names and brands may be claimed as the property of others.
Optimization Notice13
A Rich Set of Performance DataIntel® VTune™ Amplifier for Systems
Software Collector Hardware Collector
Basic HotspotsWhich functions use the most time?
Advanced HotspotsWhich functions use the most time?Where to inline? – Statistical call counts
ConcurrencyTune parallelism.Colors show number of cores used.
General ExplorationWhere is the biggest opportunity?Cache misses? Branch mispredictions?
Locks and WaitsTune the #1 cause of slow threaded performance: – waiting with idle cores.
Advanced AnalysisDig deep to tune bandwidth, cache misses, access contention, etc.
Any IA86 processor, any VM, no driver Higher res., lower overhead, system wide

Copyright © 2016, Intel Corporation. All rights reserved. *Other names and brands may be claimed as the property of others.
Optimization Notice
Intel® VTune™ Amplifier for Systems
Agenda
Data Collection –
Rich set of performance data
Data Analysis -
Find answers fast
Flexible workflow –
– User i/f and command line
– Compare results
– Remote collection
New for 2017!
14

Copyright © 2016, Intel Corporation. All rights reserved. *Other names and brands may be claimed as the property of others.
Optimization Notice15
Summary window
Flags that alert when metric value exceeds recommended value on the system
Top hotspots that can be considered for optimization

Copyright © 2016, Intel Corporation. All rights reserved. *Other names and brands may be claimed as the property of others.
Optimization Notice
Bottom up view
Double Click Functionto View Source
Adjust Data Grouping
… (Partial list shown)
Click [+] for Call Stack
Filter by Timeline Selection (or by Grid Selection)
Filter by Process & Other Controls
Tuning Opportunities Shown in Pink Hover for Tips
16

Copyright © 2016, Intel Corporation. All rights reserved. *Other names and brands may be claimed as the property of others.
Optimization Notice
See Profile Data On Source / AsmDouble Click from Grid or Timeline
Right click for instruction reference manual
View Source / Asm or both CPU TimeClick jump to scroll Asm
Scroll Bar “Heat Map” is an overview of hot spots
17

Copyright © 2016, Intel Corporation. All rights reserved. *Other names and brands may be claimed as the property of others.
Optimization Notice
Timeline Visualizes Thread BehaviorIntel® VTune™ Amplifier
CPU TimeTransitionsBasic Hotspots Advanced
Hotspots
Locks & Waits
18
Copyright © 2016, Intel Corporation. All rights reserved. *Other names and brands may be claimed as the property of others.
Optimization Notice
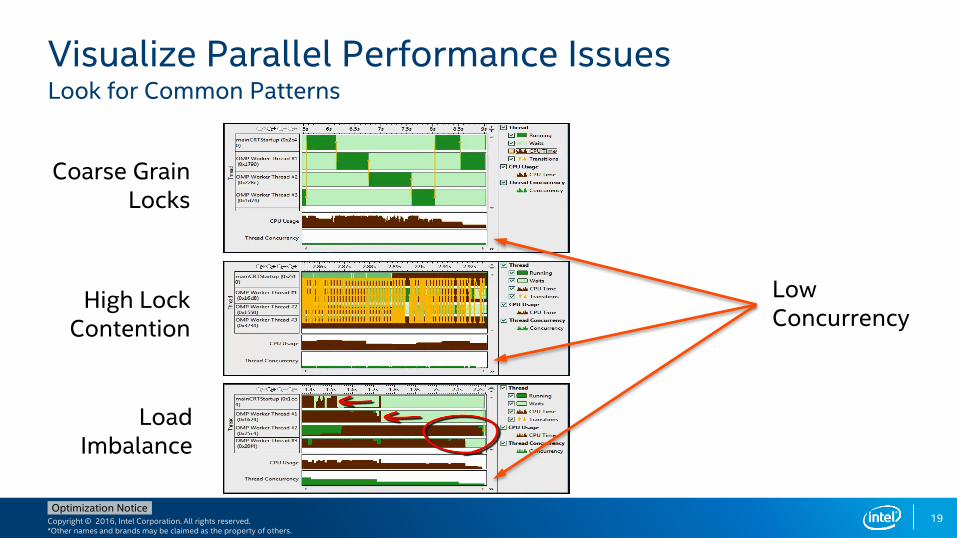
Visualize Parallel Performance IssuesLook for Common Patterns
Coarse GrainLocks
High LockContention
LoadImbalance
LowConcurrency
19

Copyright © 2016, Intel Corporation. All rights reserved. *Other names and brands may be claimed as the property of others.
Optimization Notice
Tune OpenMP for Efficiency and Scalability
The summary view shown above gives fast answers to four important OpenMP tuning questions:
1) Is the serial time of my application significant enough to prevent scaling?
2) How much performance can be gained by tuning OpenMP?
3) Which OpenMP regions / loops / barriers will benefit most from tuning?
4) What are the inefficiencies with each region? (click the link to see details)
Fast Answers: Is My OpenMP Scalable? How Much Faster Could It Be?
1)
2)
4)
3)
20
Copyright © 2016, Intel Corporation. All rights reserved. *Other names and brands may be claimed as the property of others.
Optimization Notice
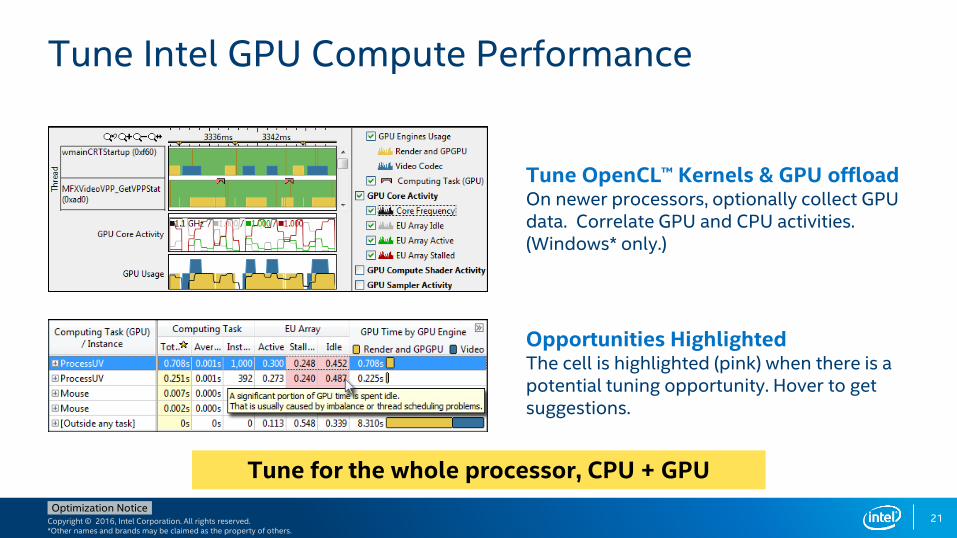
Tune Intel GPU Compute Performance
Tune for the whole processor, CPU + GPU
Tune OpenCL™ Kernels & GPU offload On newer processors, optionally collect GPU data. Correlate GPU and CPU activities. (Windows* only.)
Opportunities HighlightedThe cell is highlighted (pink) when there is a potential tuning opportunity. Hover to get suggestions.
21
Copyright © 2016, Intel Corporation. All rights reserved. *Other names and brands may be claimed as the property of others.
Optimization Notice
Intel® VTune™ Amplifier for Systems
Agenda
Data Collection –
Rich set of performance data
Data Analysis -
Find answers fast
Flexible workflow –
– User i/f and command line
– Compare results
– Remote collection
New for 2017!
22

Copyright © 2016, Intel Corporation. All rights reserved. *Other names and brands may be claimed as the property of others.
Optimization Notice
amplxe-cl is the command line:– Windows: C:\Program Files (x86)\Intel\VTune Amplifier for Systems \bin[32|64]\amplxe-cl.exe– Linux: /opt/intel/vtune_amplifier_for_systems/bin[32|64]/amplxe-cl
Help: amplxe-cl –help
Use UI to setup1) Configure analysis in UI2) Press “Command Line…” button3) Copy & paste command
Command Line InterfaceAutomate analysis
23

Copyright © 2016, Intel Corporation. All rights reserved. *Other names and brands may be claimed as the property of others.
Optimization Notice24
Interactive analysis
1) Configure SSH to a remote Linux* target
2) Choose and run analysis with the UI
Command line analysis
1) Run command line remotely on Windows* or Linux* target
2) Copy results back to host and open in UI
Interactive Remote Data Collection

Copyright © 2016, Intel Corporation. All rights reserved. *Other names and brands may be claimed as the property of others.
Optimization Notice25
Compare Results Quickly - Sort By Difference
Quickly identify cause of regressions.
Run a command line analysis daily
Identify the function responsible so you know who to alert
Compare 2 optimizations – What improved?
Compare 2 systems – What didn’t speed up as much?

Copyright © 2016, Intel Corporation. All rights reserved. *Other names and brands may be claimed as the property of others.
Optimization Notice
Intel® VTune™ Amplifier for Systems
Agenda
Data Collection –Rich set of performance data
Data Analysis -Find answers fast
Flexible workflow –– User i/f and command line
– Compare results
– Remote collection
New for 2017!
26

Copyright © 2016, Intel Corporation. All rights reserved. *Other names and brands may be claimed as the property of others.
Optimization Notice
• Profile Python and Mixed Python / C++ / Fortran
• HPC Performance Characterization
• Optimize Memory Access
• Storage Analysis – I/O bound or CPU bound?
• Enhanced OpenCL™ & GPU Profiling
• Application & Storage Performance Snapshots
New for 2017! Python, Storage & More…Intel® VTune™ Amplifier Performance Profiler
27

Copyright © 2016, Intel Corporation. All rights reserved. *Other names and brands may be claimed as the property of others.
Optimization Notice28
Optimize Memory AccessMemory Access Analysis - Intel® VTune™ Amplifier for Systems 2017
Tune data structures for performance
Attribute cache misses to data structures(not just the code causing the miss)
Support for custom memory allocators
Optimize NUMA latency & scalability
True & false sharing optimization
Auto detect max system bandwidth
Easier tuning of inter-socket bandwidth
Easier install, Latest processors
No special drivers required on Linux*

Copyright © 2016, Intel Corporation. All rights reserved. *Other names and brands may be claimed as the property of others.
Optimization Notice
Are You I/O Bound or CPU Bound?
Explore imbalance between I/O operations(async & sync) and compute
Storage accesses mapped tothe source code
See when CPU is waiting for I/O
Measure bus bandwidth to storage
Latency analysis
Tune storage accesses with latency histogram
Distribution of I/O over multiple devices
29
Storage Device Analysis (HDD, SATA or NVMe SSD)
Intel® VTune™ Amplifier for Systems
Slow task with I/O Wait
Sliders set thresholds for
I/O Queue Depth

Copyright © 2016, Intel Corporation. All rights reserved. *Other names and brands may be claimed as the property of others.
Optimization Notice
Intel® VTune™ Amplifier for Systems makes faster scalable code faster by:
• Get all the data you need
• Find answers fast
• Ease of use
Intel® System Studio and it’s Intel® VTune™ Amplifier provides accurate profiling data with very low overhead whether you are tuning for the first time or doing advanced performance optimization.
30
Intel® VTune™ Amplifier for Systems - Summary


Copyright © 2016, Intel Corporation. All rights reserved. *Other names and brands may be claimed as the property of others.
Optimization Notice
Intel® Energy ProfilerEnergy and Power Profiler for System Software Developers
32
• Optimize Software for Extended Battery Life
• Find the system behaviorsThat Waste Energy
– Interrupts mapped to the IRQ/device
– Timers mapped to the scheduling process
• Available now for Windows(>=8.1), Android, Linux

Copyright © 2016, Intel Corporation. All rights reserved. *Other names and brands may be claimed as the property of others.
Optimization Notice
Intel® Energy Profiler
There are two key pieces to the Intel ® Energy Profiler:
Collector
The main collector for the Intel ® Energy Profiler is called SoC Watch.
SoC Watch is a command line tool that collects platform power-relevant metrics
Visualizer
Intel ® Energy Profiler provides timeline views of these metrics
Feature of VTune® Amplifier for Systems included in Intel System Studio
33

Copyright © 2016, Intel Corporation. All rights reserved. *Other names and brands may be claimed as the property of others.
Optimization Notice
Key power metrics – Sleep and Frequency
C1
C2
C3
C4
C5
C6
Pn
P1
P0 CPU
Active
CPU
Sleep
P0 - CPU active at highest frequency (HFM)
Pn - CPU active at lowest frequency (LFM)
C0 - CPU active (In any P-state)
C0
C1 - Core clock is Off
C3/C4 - Reduced Voltage, Partial L2 cache flush
C6 - Core Off, L2 cache flush, state saved to SRAM
The deeper the sleep state
more power saving
but longer to wake up
Po
we
r
Hig
he
r
La
ten
cy
Gre
ate
r

Copyright © 2016, Intel Corporation. All rights reserved. *Other names and brands may be claimed as the property of others.
Optimization Notice
Intel® SoC Watch Overview• Software command line tool to collect platform-level, power-relevant metrics
C & P-state residencies for CPU and GPU
Device D-state residencies, System S0ix state residencies
Package energy, Core and SoC temperatures
Idle/busy analysis for the CPU, Wakeup analysis for CPU and GPU, Timer resolution change summary
Concurrency of cores, CPU & GPU concurrency
Bandwidth and DRAM self-refresh reports
• Platforms Supported (support depends on OS)
•Windows 8.1 and above, Linux, Android
• No external measurement hardware needed
• Overhead generally <1% for idle
Increases with highly active workload and types of metrics collected
• Generates CSV-formatted summary reports and timelines• Detail reports are in simple text• Export option for visualizing in Intel® VTune™ Amplifier for Systems

Copyright © 2016, Intel Corporation. All rights reserved. *Other names and brands may be claimed as the property of others.
Optimization Notice
Windows Quick Start – Install/CollectOn the Target platform:• Install
• Either install as part of Intel System Studio, or you can bring the socwatch.msi file to a target Windows system and install it there.
• Open a windows command window with Administrator privilege• Add install directory to your Path environment variable or preface the commands with it.
Example directory path, if running on a 64-bit Win OS c:\Program Files (x86)\Intel\SocWatch\bin
• Run collection command
• Collects broad range of system metrics for 30 seconds, storing results in files with base name myResults
• Add --max-detail -r detail options to get wakeup/idle analysis reports, timelines, and callstacks• For long runs (hour+), save disk space and analysis time by using advanced option --no-
callstack during collection
#socwatch –t 30 –f sys –o myResults

Copyright © 2016, Intel Corporation. All rights reserved. *Other names and brands may be claimed as the property of others.
Optimization Notice
Windows Quick Start - Results
View summary results in myResults.csv and details in myResults.txt, timelines also available
Sample reports from summary
result
User’s Guide contains detailed explanation of all reports.

Copyright © 2016, Intel Corporation. All rights reserved. *Other names and brands may be claimed as the property of others.
Optimization Notice
Windows Quick Start – Intel® Energy Profiler
38
Produce VTune Amplifier import file:
Reprocess on target
Use previous collection with -i
Add -r sww option
Import data into VTune Amplifier project:
Open imported result:
socwatch –i myResults –r sww
amplxe-cl –import myResults.sww1 –r myProject
amplxe-gui myProject

Copyright © 2016, Intel Corporation. All rights reserved. *Other names and brands may be claimed as the property of others.
Optimization Notice
Intel® Energy Profiler - Platform Power Analysis Viewpoint Summary
39Intel Confidential
Click the details tab and will point you to the corresponding CPU C/P state tab data

Copyright © 2016, Intel Corporation. All rights reserved. *Other names and brands may be claimed as the property of others.
Optimization Notice
Intel® Energy ProfilerPlatform Power Analysis Viewpoint’s CPU C/P States View
VTune™ Amplifier for Systems is the visualization mechanism of the
Intel® Energy Profiler

Copyright © 2016, Intel Corporation. All rights reserved. *Other names and brands may be claimed as the property of others.
Optimization Notice
Intel® Energy Profiler helps optimize software for extended battery life by providing actionable data that help reduce/consolidate wakeups and save energy by staying in a low power state for a longer period of time
41
Intel® Energy Profiler - Summary

Copyright © 2016, Intel Corporation. All rights reserved. *Other names and brands may be claimed as the property of others.
Optimization Notice
Intel® VTune™ Amplifier for Systems and Intel® Energy Profiler are powerful, easy to use visual analyzer tools that provide actionable data that help boost performance and power efficiency of systems.
42
Conclusion

useful links

Copyright © 2016, Intel Corporation. All rights reserved. *Other names and brands may be claimed as the property of others.
Optimization Notice44
Embedded Dev Webinars - Advanced Analysis
Embedded Dev Part 2: Advanced Analysis to Accelerate Innovative Use Cases - Dec. 8
Not only is developing faster for embedded apps and system software the goal, but what you build for your competitive advantage, and working smarter can make the difference between financial success and potential disaster. Get to the advanced level of using Intel System Studio's advanced analysis tools to improve performance, memory access and storage, data filtering, and productivity. Then, get insight on how our tools help developers innovate for use cases like imaging, machine learning, storage, communications and transportation usages.
An IMCORP R&D software engineer says, “IMCORP pioneers complex signal processing algorithms for power transmission cable diagnostics. Intel® VTune™ Amplifier, as part of Intel System Studio, allowed us to find critical performance hotspots within 5 minutes that otherwise would take us more than 8 hours.”
Dec. 8 - Noon Beijing (other time zones: 10:30 a.m. Mumbai, 8 a.m. Moscow/Jerusalem, Dec. 7, 10 p.m. Pacific)
Copyright © 2016, Intel Corporation. All rights reserved. *Other names and brands may be claimed as the property of others.
Optimization Notice45
Intel® System Studio
Useful Links
Main Page
Details
Technical Support

Copyright © 2016, Intel Corporation. All rights reserved. *Other names and brands may be claimed as the property of others.
Optimization Notice46
Intel® VTune™ Amplifier 2017 for Systems
Useful Links
Getting started guide
User and installation guide
Tutorials


Copyright © 2016, Intel Corporation. All rights reserved. *Other names and brands may be claimed as the property of others.
Optimization Notice
Legal Disclaimer & Optimization Notice
INFORMATION IN THIS DOCUMENT IS PROVIDED “AS IS”. NO LICENSE, EXPRESS OR IMPLIED, BY ESTOPPEL OR OTHERWISE, TO ANY INTELLECTUAL PROPERTY RIGHTS IS GRANTED BY THIS DOCUMENT. INTEL ASSUMES NO LIABILITY WHATSOEVER AND INTEL DISCLAIMS ANY EXPRESS OR IMPLIED WARRANTY, RELATING TO THIS INFORMATION INCLUDING LIABILITY OR WARRANTIES RELATING TO FITNESS FOR A PARTICULAR PURPOSE, MERCHANTABILITY, OR INFRINGEMENT OF ANY PATENT, COPYRIGHT OR OTHER INTELLECTUAL PROPERTY RIGHT.
Software and workloads used in performance tests may have been optimized for performance only on Intel microprocessors. Performance tests, such as SYSmark and MobileMark, are measured using specific computer systems, components, software, operations and functions. Any change to any of those factors may cause the results to vary. You should consult other information and performance tests to assist you in fully evaluating your contemplated purchases, including the performance of that product when combined with other products.
Copyright © 2016, Intel Corporation. All rights reserved. Intel, Pentium, Xeon, Xeon Phi, Core, VTune, Cilk, and the Intel logo are trademarks of Intel Corporation in the U.S. and other countries.
Optimization Notice
Intel’s compilers may or may not optimize to the same degree for non-Intel microprocessors for optimizations that are not unique to Intel microprocessors. These optimizations include SSE2, SSE3, and SSSE3 instruction sets and other optimizations. Intel does not guarantee the availability, functionality, or effectiveness of any optimization on microprocessors not manufactured by Intel. Microprocessor-dependent optimizations in this product are intended for use with Intel microprocessors. Certain optimizations not specific to Intel microarchitecture are reserved for Intel microprocessors. Please refer to the applicable product User and Reference Guides for more information regarding the specific instruction sets covered by this notice.
Notice revision #20110804
49