Embed Size (px)
Citation preview

1
MULTISTAGE RISK ANALYSIS AND SAFETY STUDY OF A
HYDROGEN ENERGY STATION
Bo Zhao
1, Pengcheng Zhao
1, Meng Niu
1, Zhanjie Xu
2, Thomas Jordan
2, Zhaolong Du
1,
Feng Liu1 and Yu Xiao
1
1 Power Electronics Department, Global Energy Interconnection Research Institute (GEIRI),
Riverside Road No. 18, Future Technology Park, Changping, Beijing, 102211, China,
[email protected] 2 Karlsruhe Institute of Technology, P. O. Box 3640, Karlsruhe, 76021, Germany,
ABSTRACT
China has plenty of renewable energy like wind power and solar energy especially in the northwest
part of the country. Due to the volatile and intermittent characters of the green powers, high
penetration level of renewable resources could arise grid stabilization problem. Therefore electricity
storage is considered as a solution and hydrogen energy storage is proposed. Instead of storing the
electricity directly, it converts electricity into hydrogen and the energy in hydrogen will be released as
needed from gas to electricity and heat. The transformed green power can be fed to the power grid and
heat supply network. State Grid Corporation of China carried out its first hydrogen demonstration
project. In the demonstration project, an alkaline electrolyzer and a PEM hydrogen fuel cell stack are
decided as the hydrogen producer and consumer, respectively. Hydrogen safety issue is always of
significant importance to secure the property. In order to develop a dedicated safety analysis method
for hydrogen energy storage system in power industry, the risk analysis for the power-to-gas-to-
power&heat facility was made. The hazard and operability (HAZOP) study and the failure mode and
effects analysis (FMEA) are performed sequentially to the installation, to identify the most
problematic parts of the system in view of hydrogen safety and possible failure modes and
consequences. At the third step, the typical hydrogen leak accident scenarios are simulated by using
computational fluid dynamics (CFD) computer code. The resulted pressure loads of the possibly
ignited hydrogen-air mixture in the facility container are estimated conservatively. Important
safeguards and mitigation measures are proposed based on the three-stage risk and safety studies.
1.0 INTRODUCTION
Due to the carbon-free nature of hydrogen gas, hydrogen has been considered as future energy in
replacement of hydrocarbon resources [1, 2]. As a type of energy, hydrogen contains more than three
times combustion energy than gasoline by weight [2]. Hydrogen could be produced by varies means
including water electrolysis, reforming, thermocatalytic cracking, thermolysis, biotechnology,
photonic and etc. [3]. To utilize the energy in hydrogen, one clean way is to generate electricity by
fuel cell technology which converts hydrogen and oxygen to water, electricity and heat.
By combining hydrogen production and utilization processes mentioned above, there is one attractive
cycle, hydrogen production with water electrolysis and hydrogen consumption by fuel cell, in which
there is no carbon included and hydrogen could act as electricity storage media. Based on this idea,
hydrogen energy storage system is developed and many demonstration projects have been employed
to prove the feasibility of the idea [4]. One of the successful projects is MYRTE project which was
commissioned at Corsica, France. According to [5], in MYRET project, hydrogen energy storage
system is integrated into the local PV station to generate hydrogen and oxygen through water
electrolysis by excess solar power. Both hydrogen and oxygen are stored in high pressure vessels.
Whenever the PV generation could not cover the load, a PEM fuel cell power generation system will
generate power by stored hydrogen and oxygen.
2
Despite the advantages of using hydrogen as energy storage media, a major concern of the technology
is safety issue which could also be an obstacle to expand its commercial implementation. To prevent
potential hazard from hydrogen system, lots of studies were carried out and different safety analysis
methods were developed [1, 2, 6].
Recently, the authors were involved in a pilot hydrogen energy storage demonstration platform in
China, which is the first hydrogen project in China power industry. Regarding the hydrogen hazard
management, a collaboration between global energy interconnection research institute (GEIRI) and
Karlsruhe Institute of Technology (KIT) was established to take care of the safety issue. A multistage
risk analysis methodology, which combines three different safety analysis methods (HAZOP, FMEA
and CFD), was applied in the project. In this paper, the platform configuration, the methodology, and
the results from safety study are presented.
2.0 POWER TO GAS TO POWER & HEAT FACILITY
The platform is container based and consists of PV simulator, alkaline electrolyzer, hydride hydrogen
storage, fuel cell and heat recycle system. As the first hydrogen project in China power grid. the scale
of this platform was decided to be 10kW level so the research team could gain basic experience from it
and build larger system by multiple 10kW modules in next phase. Eventually, considering the
equipment availability, the system was set to 11kW electrolyzer (hydrogen production rate: 2Nm3/h)
and 10kW fuel cell stack (FCS). The hydride storage tank was supposed to store the hydrogen
produced from the 11kW electrolyte system for 8 hours. Hence, the storage capability was originally
designed to be 16Nm3 and finally, it became 20Nm
3 for redundancy. A PEM electrolyzer with 1Nm
3/h
production rate is also equipped in the platform for future research. Fig. 1 presents the on-site
overview of the platform.
Figure 1. The configuration and equipment in the platform
To increase the overall efficiency, the platform is also designed to evaluate heat recycle concept. A
heat exchanger is installed in the fuel cell coolant loop to collect waste heat. The coolant of hydride
tank is coupled with the fuel cell heat recycle loop in order to re-use the waste heat to heat up hydride
storage.
All equipment of the platform is configured into two containers and one storage room. PV simulator
and alkaline water electrolyzer system are located in hydrogen production container. FCS, super
capacitor, PEM electrolyzer and switch cabin are installed together in operation container. The storage
room is adjacent to operation container and used to keep hydrogen, nitrogen and hydride hydrogen
storage tank.

3
3.0 METHODOLOGY
In power industry, the safety issue is always of great importance. As the first hydrogen based project
in China power sector, the safety level of platform had drawn great attention during the project.
However, there are few standards to follow regarding safety analysis for hydrogen energy storage
system in power industry. To comprehensively manage the safety of demonstration platform, the
authors applied the multistage safety analysis, which has been well proven in nuclear power plant
design, to this project in both design and construction phases.
The methodology applied in this project is the combination of three safety analysis methods, HAZOP,
FMEA and CFD analysis. HAZOP and FMEA were performed to identify the potential risks and
failure modes. Since the hydrogen is the hazardous gas and could lead to explosion if the proper
safeguards are not taken after leakage, a CFD was performed to simulate the hydrogen behaviour
under leakage scenario.
The three stages were performed sequentially in this project. First, HAZOP was applied to identify all
potential failure modes for each component. Based on the HAZOP results, the occurrence probability,
detectability and severity of each failure mode were scaled by applying FMEA and risk priority
number (RPN) is then defined to indicate the significance of each failure mode. A ranking of the RPNs
for all analyzed failure were obtained as the results of FMEA study. Important safeguards or
protection measures were proposed for those failures with high RPN to improve the safety of the
hydrogen energy station. In all potential failure modes, the hydrogen leakage cases were specially
treated by additional CFD analysis. The full steps of multistage risk analysis is shown in Fig. 2.
Step1: System Description
If the failure mode contain the
risk of hydrogen leakage?
Yes
No
Propose mitigation
measures
Step2:HAZOP Study
Step3a: FMEA Study
based on HAZOP results
Step3b: Rank Failure
Modes by RPN
Step 4: CFD Study
Figure 2. The stages of risk analysis
4.0 SYSTEM DESCRIPTION
The starting point of safety analysis is the pipe & instrumentation diagram (PID) as shown in Fig. 3.
To identify different elements in HAZOP and FMEA study, every element in the system is specified
by a unique combination of code and number. The abbreviations used in the coding are listed below.

4
CEV - Normal closed electrical valve
CV - Check valve
DCDC - DC/DC transformer
ELZ - Electrolyzer
EV - Normal open electrical valve
FCS - Fuel cell stack
FN - Fan
H - H2 purity gauge
HAS -H2 alloy storage
HEX - Heat exchanger
HMD - Humidifier
I - Current gauge
MV - Manual valve
P - Pressure gauge
PB - Pressure bottle
PMP - Pump
PRV - Pressure reducing valve
PVS - Photovoltaic simulator
Q - Flow rate gauge
SPT - Separator
T - Temperature gauge
TWV - Three-way valve
V - Voltage gauge
Valve – All types of valves including
Electrical Valve (EV), normal Closed
Electrical Valve (CEV), Manual Valve (MV),
Check Valve (CV), Pressure Reducing Valve
(PRV) and Three-Way Valve (TWV);
WB - Wash basin
WL - Water level
WS - Water supply
WT - Water tank
Ω - Electrical conductivity gauge
Figure 3. PID design with system and element coding and numbering
The platform was subdivided as 13 systems, including e.g. the PV simulator, the alkaline electrolyzer,
the hydrogen loop, the air loop, the water loops and so on. There are totally 51 elements in 13 sub-
systems, which are coded individually. The coding and numbering about the systems and the elements
are listed in Tab. 1.

5
Table 1 System and element coding and numbering
System code Element code Description
1.1.PVS Photovoltaic simulator
1.1.1.I Current gauge
1.1.2.V Voltage gauge
1.2.ELZ Alkaline electrolyzer
1.2.1.H H2 purity gauge
1.2.2.P Pressure gauge
1.2.3.Q Flow rate gauge
1.2.4.EV Electrical valve
1.3.WS Water supply to electrolyzer
1.3.1.WL Water level control
1.3.2.EV Electrical valve
2.1.N2 N2 loop
2.1.1.PB N2 pressure bottle
2.1.2.MV Manual valve
2.1.3.PRV Pressure reducing valve
2.1.4.P Pressure gauge
2.1.5.CEV Normal closed electrical valve
2.1.6.CV Check valve
2.1.7.CEV Normal closed electrical valve
2.1.8.CV Check valve
2.2.H2 H2 loop
2.2.1.HAS H2 alloy storage system
2.2.2.MV Manual valve
2.2.3.PRV Pressure reducing valve
2.2.4.MV Manual valve
2.2.5.P Pressure gauge
2.2.6.Q Flow rate gauge
2.2.7.CEV Normal closed electrical valve
2.2.8.CV Check valve
2.2.9.P Pressure gauge
2.2.10.SPT Water separator
2.2.11.EV Electrical valve
2.2.12.EV Electrical valve
2.3.Air Air loop
2.3.1.FN Venting fan
2.3.2.CEV Normal closed electrical valve
2.3.3.P Pressure gauge
2.3.4.Q Flow rate gauge
2.3.5.EV Electrical valve
2.3.6.EV Electrical valve
2.3.7 SPT Water separator (not
represented in Fig. 3)
2.4.Water1 Water loop for fuel cell stack
2.4.1.WT Water tank
2.4.2.T Temperature gauge
2.4.3.Ω Conductivity gauge
2.4.4.PMP Coolant pump
2.4.5.P Pressure gauge
2.4.6.T Temperature gauge

6
2.5.Water2 Water loop for H2 alloy storage
2.5.1.WT Water tank
2.5.2.PMP Water pump
2.5.3.WB Wash basin
2.5.4.T Temperature gauge
2.5.5.TWV Three-way valve
2.6.FCS Fuel cell stack
2.6.1.T Temperature gauge
2.7.DCDC DC/DC transformer
2.8.HEX Heat exchanger
2.9.HMD Humidifier
3.AHS Alternative H2 supply system
3.1.PB H2 pressure bottle
3.2.MV Manual valve
3.3.PRV Pressure reducing valve
3.4.PRV Pressure reducing valve
3.5.MV Manual valve
After HAZOP and FMEA studies, hydrogen flow was simulated through CFD based on 3D drawing of
the system. The geometry layouts of operation container and storage room are presented in Fig. 4. The
hydrogen production container is not included in CFD analysis since in this project, it is a commercial
product and its safety is already certified by the manufacture according to the national standard.
Figure 4. Layout of the operation container and storage room
5.0 HAZOP RESULTS,
By an overview of the HAZOP study results, the most typical accident scenarios that might happen to
the platform are listed in Tab. 2. Accordingly, proper safeguards are proposed against the accidental
scenarios which are also included in Tab. 2. The scenarios stated below are all directly or indirectly
related to hydrogen event evolutions, e.g. hydrogen release, hydrogen accumulation/ distribution or
hydrogen ignition and so on, which indicate further CFD study must be applied to assess the influence
of hydrogen leakage.

7
Table 2 Potential accident scenarios and proposed safeguards
Category Potential Accident Scenarios Safeguards
Environmental
issues
1 The ambient temperature is
freezing or too hot
2 The ambient air is too
humid or too dry
1 Filters at the fan inlet should be installed
against any possible contamination from
atmosphere
2 The gas flow into the FCS should be
controlled at the entrance in terms of both
temperature and humidity, i.e. air-
conditioned
3 Emergency heating system is proposed in the
water tanks against unexpected freezing
incident
4 Anti-freezing coolant might be adopted, by
accounting properly the compatibility to the
surrounding facilities or other type of
coolant
Overpressure
of closed
systems
1 Overpressure accident to
closed vessels/ tanks or
sealed piping systems, e.g.
the H2 loop, the air loop,
the N2 loop and so on
1 Fast responding safety valve as pressure
limiter has to be installed for every closed or
sealed vessel/ tank/ loop, including the H2
loop, the N2 loop, the air loop, the water
loop 1 (cooling FCS), the water loop 2
(heating HAS), the HAS vessel, the FCS, the
separator and the humidifier
2 The outlet pressures of both water pumps
should be controlled to avoid any overdriven
incident

8
Thermal-
hydraulic fluid
issues
1 Impurity of fluid, e.g. H2,
N2, coolant water
2 Leakage of fluid, e.g. H2,
N2, coolant water
3 Broken pipe or broken
separation, e.g. plates in the
heat exchanger, or
membranes
4 in the FCS
5 Loss of cooling/ heating,
e.g. the FCS and the HAS
vessel
6 Total or partial blockage or
congestion of pipe line
1 The purity of gas including H2 and N2 should
be ensured
2 The water purity in water loop 1 (cooling the
FCS) should be controlled
3 Definite separation of the H2 alloy from
cooling water must be kept in mind;
otherwise serious explosion could occur
4 The minimum H2 pressure in the HAS vessel
is suggested to be maintained always above
atmosphere, to avoid any air ingression into
the HAS vessel
5 The temperature of H2 alloy storage vessel
should be controlled; over-heating while
hydrogen charging could cause serious
accident
6 The free volume at the top of water tank
should be vented constantly or periodically,
to avoid any H2 accumulation in it
7 The water level and water temperature
should be controlled for both tanks
8 The flow rate and pressure of the pumps
should be measured and controlled
9 N2 purging procedure should be conducted if
the anode module of the FCS is
contaminated
10 The pressure of the water loop for cooling
the FCS is proposed to be always slightly
higher than the pressure of the water loop for
heating the HAS vessel, to avoid ingression
of the water with lower quality in the latter
loop into the former loop
11 The pressure of the N2 bottle is suggested to
be higher than that of the HAS vessel
Electrical
issues
1 Wrong polarity of electrical
equipment, e.g. the pumps,
the fan, the electrolyzer
2 and the DC/DC transformer
3 Unstable (excess or
inadequate) power supply
to the electrical equipment
4 Loss of power supply to the
electrical equipment
1 Fuse limiter, protection against wrong
polarity and grounding must be assured to all
electrical equipment, e.g. fan, pump,
electrolyzer, DC/DC transformer, etc

9
Human error,
installation
and control
issues
1 Human error (incorrect
operation), e.g. incomplete
operation to a valve
2 Wrong installation of
equipment, e.g. direction of
check valves, position of
twophase
3 separators
4 Faulty control, mechanical
defect, inaccurate
measurement
1 Always correct operation to a manual valve
2 The valve 2.2.7.CEV should be surely closed
during the N2 purging procedure
3 The technicians, who construct the station,
and who install the equipment, should be
asked to provide installation documentation
with checklist and signature
4 Measured parameters should be included in
control unit as possible, e.g. pressure,
temperature, flow rate, etc
Common
security issues
1 Fire events
2 Flooding events
1 Fire extinguisher should be installed in/ at
the containers
6.0 FMEA RESULTS
The hazards identified in the HAZOP stage are further quantified in FMEA stage, by means of scaling
the failure occurrence likelihood, detectability and severity, which are defined as follow:
⁻ Occurrence (O) — frequency or probability of the occurring failure;
⁻ Severity (S) — harm or seriousness of the effect of the failure mode;
⁻ Detectability (D) — probability of the failure being detected before it occurs in reality.
By using these quantities, a variable of risk priority number (RPN) is defined for every failure mode to
indicate the risk significance in a whole view of the system safety. A ranking of the RPNs for all
analyzed failure/effects is the result of the FMEA study.
In a typical FMEA, numerical rankings are assigned for each factor. The higher the ranking, the
greater the potential harm posed by the failure and its effect. Attentions should be paid that the factor
of “Detectability” is quantified in an inverse sense: a higher ranking or a higher value of
“Detectability” stands for a harder situation to detect the failure. The rankings of the factors can be
used on the scale of 1 to 10. The RPN can be determined by the product of the three factors, which
reflects the overall measure of relative risk of the considered failure/effect. RPNs will be used to rank
the significance of the risk posed by the failure/effect and the need for corrective actions to reduce or
eliminate the potential failure mode.
In this project, totally 178 potential failure modes and effects of the 29 elements were analyzed. The
178 modes are categorized into three levels depending on the RPN values:
⁻ 103 modes with RPN<40, which affect slightly the system without significant con-sequences;
⁻ 52 modes with 40≤RPN<100, which could influence adversely the system or the operation.
Safeguard measures should be considered;
⁻ 23 modes with RPN≥100, which are strongly proposed to follow the recommended or adequate
actions, to modify the design or install necessarily additional components or sensors.
The 178 potential failures/effects are also classified by the different sub-system, as shown in Fig. 5.
The system name “1.H2P” in Fig. 5 is hereby defined, which is the “H2 Production” (H2P) system
including the three parts of the photovoltaic simulator (1.1.PVS), the electrolyzer (1.2.ELZ) and the
water supply system (1.3.WS) to the electrolyzer. Fig. 5 manifests that the most potentially
problematic system is the hydrogen loop "2.2.H2", which has 7 potential failure modes with RPN≥

10
100. Second is the fuel cell stack "2.6.FCS", which has 5 modes with RPN≥100. The third is the
hydrogen production system "1.H2P" with 3.
Figure 5. Number of potential failure modes categorized by system
The 178 failure modes are also classified by the different type of elements. The statistical results about
the failure mode numbers distributed in different types of components is shown in Fig. 6.
Figure 6. Number of potential failure modes categorized by element type
Fig. 6 shows that the most problematic components can be the hydrogen alloy storage vessel (HAS)
and the fuel cell stack (FCS) in a sense of the highest number of failure modes with RPN≥100. Then
serious failure modes could also happen to the pumps, the valves, the phase separators and so on.
A full list of the 178 RPNs of potential failure modes of all the 29 elements or components is shown in
Fig. 7. The horizontal axis lists the codes of failure modes. For an example, “2.2.1.HAS.6” means the
sixth failure mode of the element 2.2.1.HAS.
Margins of RPN values in yellow and in red are drawn in Fig. 7, standing for the critical values of
RPN, 40 and 100, respectively. When the RPN is lower than 40, the corresponding failure modes can
be ignored. More attentions should be paid on those with greater RPN values than 40, especially those
than 100.

11
Figure 7. RPN list of 178 failure modes and effects of all 29 elements (The yellow line stands for
RPN=40 and the red for RPN=100. Focus should be concentrated on those modes with high RPN
values)
In another view, the analyzed failure modes are presented according the consequence severity (S) and
the corresponding occurrence (O) times detectability (D), as shown in Fig. 8. It is obvious that the
deeper color at the top-right corner in the plot stands for the higher risk than the lighter color at the
bottom-left corner does. The two curves, the yellow curve for RPN=40 and the red for RPN=100,
divides the whole region into three regimes. Fig. 8 shows that most failure modes locate in the regime
of RPN<40; certain number of modes in 40≤RPN<100; and more than a dozen of modes in RPN≥100, which are the most critical cases from the FMEA study. (Some modes share the same coordinates
of S and O x D, thus the data symbols overlap each other without reflection in the plot.)
Figure 8. Severity versus occurrence x detectability plot on failure modes
Regarding the failure modes with RPN>40, the recommended actions or proposed countermeasures
listed in Tab. 2 should be carefully considered. Further safeguards are also expected to improve the
safety level of the hydrogen station, especially for those relevant to the failures with RPN≥100.
7.0 CFD RESULTS
As shown in Fig. 4, two independent compartments, namely, the FCS operation room and the
hydrogen storage room, are modeled and calculated separately by KIT computer code GASFLOW.
12
Due to the important role of the fuel cell stack, hydrogen release scenarios in the FCS cabinet are
further studied independently with a refined computational grid. In extreme scenario, about 1 kg of
hydrogen will be emitted in few minutes into the atmosphere outside of the container. This may pose a
potential risk too, if burnable mixtures are released. Therefore the hydrogen distribution in the external
environment is also modeled for different wind conditions. In summary, 35 release scenarios have
been modeled for the FCS operation room, 13 cases for the storage room, 21 cases for the FCS cabinet
and 4 cases for the external environment. In total 73 simulation cases (scenarios) have been analyzed.
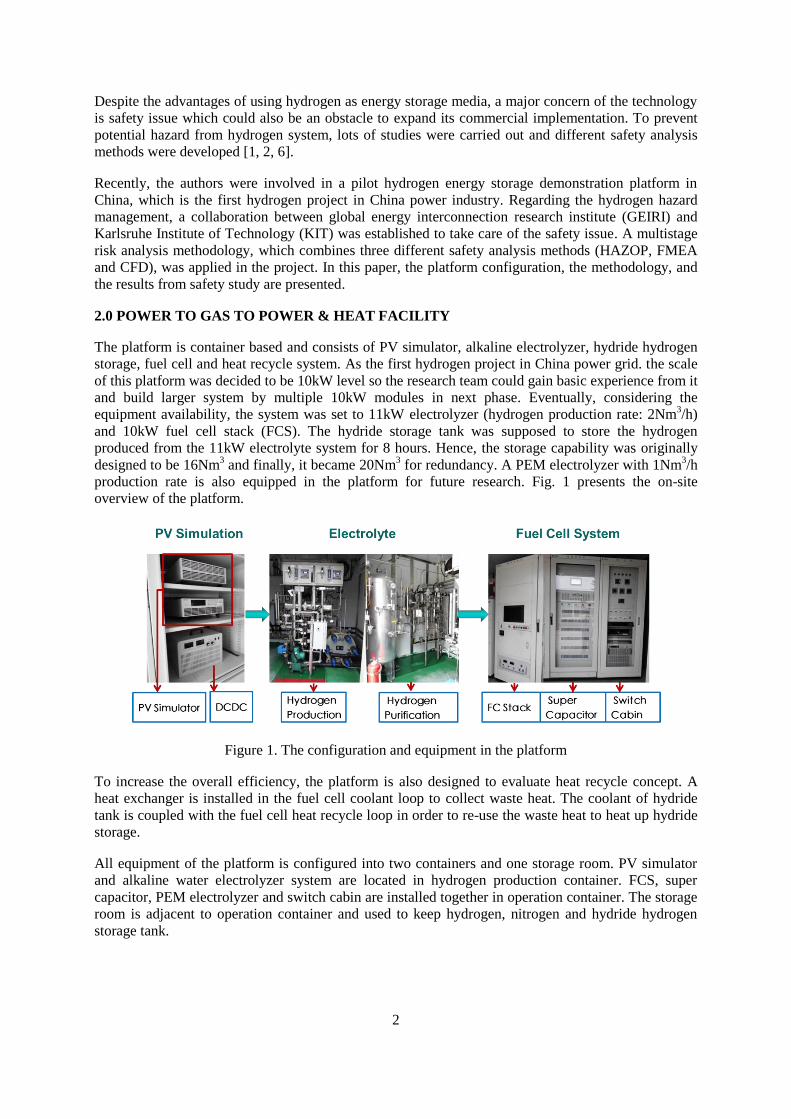
7.1 Source Definition
Accidental hydrogen release is modeled as a source in simulations. An extreme case of double-end
break of the hydrogen pipe is considered as a bounding accident scenario. According to the design, the
hydrogen loop is connected to the H2 pressure bottles, which has a high pressure of 100 bar. By
several levels of pressure-reducing-vales the high pressure is reduced to 3 bar before the hydrogen
arrives in the FCS operation room. Thus, the peak pressure of the hydrogen system in the FCS
operation room is 3 bar, which is much higher than the ambient pressure (1 atm) in the operation
room. Thus the hydrogen release flow is a critical flow at the break, which means sound speed is
reached at the break opening. If hydrogen release is treated as an adiabatic process and hydrogen an
ideal gas, the critical mass flow rate at the break can be computed as,
(1)
where,γ –specific heat ratio of hydrogen, γ=1.41; –source hydrogen pressure, =3 bar; –source
hydrogen density; =247.69 g/m3, if the source hydrogen temperature is 293.15 K; –break area, in
the FCS operation room, the inner diameter of the hydrogen pipe is 6 mm at maximum, so the
maximum value is =14π 2=2.8274×10
-5 m
2.
The computed critical mass flow rate (5.29 g/s) is the maximal hydrogen release rate for a given break
size. According to the product specification of the fuel cell stack, the nominal hydrogen supply is
about 0.16 g/s to the FCS to maintain the rated output power. Therefore the minor hydrogen leak rate
is defined as 100%, 50%, and 10% of the nominal rate, which are defined as, 0.16 g/s, 0.08 g/s and
0.016 g/s, respectively.
With the help of GASFLOW, hydrogen release scenarios with different leak rates ranging from an
extreme level (5.29 g/s) to medium values (2.5, 1, 0.5 g/s), and to minor levels (0.16, 0.08, 0.016 g/s)
are simulated for the confined volumes in the container, including FCS operation room, the FCS
cabinet, and the hydrogen storage room. The FCS cabinet simulations using a refined numerical mesh,
offer more detailed hydrogen distribution and transport information. A diffusion source with a leak
rate of 0.002 g H2/s is also simulated to investigate the consequences of a leak of the FCS at its end of
life. The external hydrogen distribution outside of the container is simulated for a bounding scenario
with a massive hydrogen emission (5.29g H2/s, 1kg in total) from the two roof openings of the
container.
7.2 Ventilation Schemes
As sensitivity analyses, parametric studies with different ventilation schemes, different hydrogen
injection directions and locations are performed. The venting fans installed at the top of the FCS
cabinet, the capacitor cabinet and the electronics cabinet are modeled as fans in the simulation, by
specifying a volumetric flow rate at each opening:
⁻ FCS cabinet: volumetric flow rate of 2.5E+05 cm3/s, equivalent to 15 m
3/min;
⁻ Capacitor cabinet: volumetric flow rate of 2.10333E+05 cm3/s, equivalent to 12.62 m
3/min;

13
⁻ Electronics cabinet: volumetric flow rate of 1.02083E+05 cm3/s, equivalent to 6.125 m
3/min.
The three cabinet venting fans, similar to the roof venting, can operate at different power levels, to
generate a volumetric flow rate at the opening as 100% (full), 75%, 50%, 25% or 0% (off), of each
nominal rate, respectively.
7.3 Simulation Results
The simulation results for the FCS operation room are summarized as follows. (a) In the extreme case
of 5.29g H2/s release in different injection directions and different ventilation schemes, the generated
hydrogen cloud with potential for flame acceleration, called the sigma cloud, ranges from 0.59-8.41m3
with average hydrogen concentrations of 16-34 vol% in the operation room. The combustion of such
layered hydrogen clouds can produce an overpressure of 0.13-1.8 bar, which very likely exceeds the
load capacity of a standard steel container. (b) In the cases with a leak rates > 1 g/s, the sigma cloud
reaches volumes of up to 1.5 m3 with 27 vol % H2 average concentration in the worst scenario. The
overpressure loads from the ignited clouds can be as high as 0.40 bar, which is still destructive for a
normal container facility. (c) In the cases with leak rates≤1g/s, only small overpressures below 0.02bar
are predicted due to the combustion of a small sigma cloud. However, a fire risk still exists in the
operation room. (d) For the cases with minor leakages, no overpressure risk is identified.
The simulation results for the FCS cabinet lead to the following conclusions. (a) For the extreme
scenario with 5.29g/s hydrogen release, the sigma cloud volume reaches 0.8m3 with an average
hydrogen concentration of 33 vol% in the cabinet. The ignition of such a large and sensitive cloud can
cause a serious local explosion in the cabinet, which could result in a maximum reflected overpressure
of 0.95bar at the glass window, located in the dividing wall between the operation room and the
control room. Such an overpressure certainly exceeds the stability limit of normal glass panes and of
the facility itself. (b) In the medium range of release rates from 0.1 to 1.0g H2/s, the volumes of the
fast burnable sigma clouds generated in the cabinet range from 0.15-0.78m3 with an average hydrogen
volume fraction in the cloud of 15-28vol%. The local explosion of such clouds can produce
overpressures of 0.08-0.90bar at the central position of the glass pane, which could be certainly
damaged by the pressure wave and cause injuries in the operator compartment. (c) In the case of minor
leakage rates, no over-pressure risk is identified, but a fire risk still exists. (d) In the case of a long-
term diffusion leak with about 0.002g H2/s, only up to 3 liters of slowly burnable hydrogen-air mixture
are predicted, but no fast burnable sigma cloud. The pressure load at the window from ignition of such
a mixture is negligible.
The simulation results for the hydrogen storage room can be summarized as follows. (a) In the
extreme case of release scenarios with different injection directions, the generated sigma cloud
volumes range from 0.33 – 0.83 m3, with hydrogen concentrations of 16-26Vol% H2 in the cloud. The
combustion overpressures from such sigma clouds range from 0.34-0.71bar, which could basically
destroy the storage chamber. (b) In the case with leak rates≥1g/s, the sigma clouds range from 0.15-
0.52m3, with hydrogen concentrations of 14-21vol%. The combustion of such clouds can still generate
destructive overpressures in the range of 0.10-0.48bar. (c) In the cases with leak rates<1g/s, only small
overpressures like 0.04bar are identified in the room after the cloud is ignited. Nevertheless, a fire risk
is still not excluded. (d) In the minor leakage cases (0.016 to 0.16g H2/s) there is no risk for
overpressure development.
The simulation results for the external environment with a massive hydrogen exhaust from the
container (about 1kg H2 within 4 minutes) indicate that a large flammable cloud can be formed in a
significant distance from the container, reaching up to 13m height and 4m in horizontal radius from
the exhaust/ventilator location. This zone should be kept free of ignition sources and lightning rods.
In summary, the safety margin for hydrogen leakages in the hydrogen energy storage platform is
conservatively recommended as 0.1g/s to guaranty safety of the personal and facility. Apart from those
mitigation measures recommended by national hydrogen safety regulations and mentioned Tab. 2, One

14
of the most important recommendations concerns the tolerable hydrogen leak rates. Hydrogen sensors
are recommended to be installed in the container. An additional mitigation measure proposed for the
FCS cabinet is a small ventilator, which could be installed beneath the FCS body to counteract
possible hydrogen accumulation there, when a downwards hydrogen leak should occur at the FCS. At
last, the passive ventilation condition of the storage room can be improved by a simple opening in the
floor, or by replacing the solid container walls with grid plates.
9.0 CONCLUSION
Through HAZOP, FMEA and CFD study, the potential risks were thoroughly identified. The
multistage risk analysis methodology delivered both overall safety evaluation and insight of hydrogen
leakage risk. In the study, the safeguards were also proposed. All the safeguards are already applied in
the design and the effect of safeguards need to be further evaluated in the future. Generally, the safety
of hydrogen energy station fulfils the requirement of normal operation in company campus. However,
in practical application, the hydrogen energy station will operate close to high power electric
equipment, which needs to be studied before it could be widely implemented in power system. The
methodology proposed in this paper could be a reference for future hydrogen safety analysis in power
industry.
9.0 ACKNOWLEDGEMENT
The project is supported by State Grid Research Project “Study on Key Technology of Hydrogen
Energy Storage and its Implementation in Renewable Energy Integration” (SGRI-DL-71-14-012).
REFERENCES
1. Daniel A. Crowl, Young-Do Jo, The hazards and risks of hydrogen, Journal of Loss Prevention in
the Process Industries, 20, 2007, pp.158–164.
2. Hans J. Pasman, William J. Rogers, Safety challenges in view of the upcoming hydrogen
economy: An overview, Journal of Loss Prevention in the Process Industries, 23, 2020, pp.697–
704.
3. Fan Zhang, Pengcheng Zhao, Meng Niu, Jon Maddy, The survey of key technologies in hydrogen
energy storage, International journal o f hydrogen energy, 41, 2016, pp.14535-14552.
4. C. Darras, S. Sailler, C. Thibault, M. Muselli, P. Poggi, J.C. Hoguet, S. Melscoet, E. Pinton, S.
Grehant, F. Gailly, C. Turpin, S. Astier, G. Fonte`s, Sizing of photovoltaic system coupled with
hydrogen/oxygen storage based on the ORIENTE model, International journal o f hydrogen
energy, 35, 2010, pp. 3322-3332.
5. C. Darras, M. Muselli, P. Poggi, C. Voyant, J.-C. Hoguet, F. Montignac, PV output power
fluctuations smoothing: The MYRTE platform experience, International journal o f hydrogen
energy, 37, 2012, pp.14015-14025
6. Ray E. Witter, Guidelines f or Hazard Evaluation Procedures: Second Edition, Process Safety
Progress, 11, No. 2, 2010, pp.50-52.