Embed Size (px)
Citation preview
PHYSICS OF FLUIDS 17, 116101 �2005�
Multistage interaction of a shock wave and a strong vortexShuhai Zhanga�
China Aerodynamics Research and Development Center, Mianyang, Sichuan 621000, China
Yong-Tao Zhangb�
Department of Mathematics, University of California at Irvine, Irvine, California 92697
Chi-Wang Shuc�
Division of Applied Mathematics, Brown University, Providence, Rhode Island 02912
�Received 22 June 2005; accepted 16 August 2005; published online 8 November 2005�
The interaction between a shock wave and a strong vortex is simulated systematically throughsolving the two-dimensional, unsteady compressible Navier–Stokes equations using a fifth-orderweighted essentially nonoscillatory finite difference scheme. Our main purpose in this study is tocharacterize the flow structure and the generation of sound waves of the shock–strong vortexinteraction. The simulations show that the interaction of a shock wave and a strong vortex has amultistage feature. It contains the interaction of the shock wave and the initial vortex, of thereflected shock wave and the deformed vortex and of the shocklets and the deformed vortex. Theshocklets are generated by the secondary interaction. Due to the complex reflected shock structure,there exist interactions between the reflected shock waves and the sound waves. Many pressurewaves are embedded in the second and third sound waves. © 2005 American Institute of Physics.�DOI: 10.1063/1.2084233�
I. INTRODUCTION
The interaction between shock waves and vortices is animportant phenomenon in aerodynamics and aeroacoustics.When a plane shock wave meets a vortex, disturbance isgenerated, which propagates along the shock wave and re-sults in its deformation. Behind the curved shock wave, theflow field is compressed and rarefied locally and formsacoustic waves. These interesting phenomena are closely re-lated to the shock–turbulence interaction, which is one of themajor sources of noise, and has attracted a lot of attention inthe literature.
An early experimental study of shock vortex interactionwas carried out by Hollingsworth and Richards.1 A planeshock wave was generated by a shock tube. As it passed anaerofoil with an attack angle to the flow, a spiral vortex wasshed. After the shock wave was reflected by the wall at theend of the shock tube, it traveled back toward the vortex andthe interaction between the shock and the vortex took place.Acoustic waves and bending of the shock were observed. Itwas found that the acoustic wave consisted of four alternat-ing compression and rarefaction regions centered at thetransmitted vortex. With a similar apparatus and a Mach–Zehnder interferometer, Dosanjh and Weeks2 measured thecircumferential pressure distribution of the acoustic wave,which later became the benchmark experimental data for anumerical comparison. The experimental results also foundthat the original vortex was compressed into an ellipticalshape. The major axis was approximately equal to the diam-
a�Electronic mail: [email protected]�Electronic mail: [email protected]�Author to whom correspondence should be addressed. Telephone: 1-401-
863-2549. Fax: 1-401-863-1355. Electronic mail: [email protected]
1070-6631/2005/17�11�/116101/13/$22.50 17, 11610
Downloaded 03 Jan 2006 to 128.148.160.224. Redistribution subject to
eter of the initial circular vortex and the ratio of the major tominor axes was approximately equal to the density ratioacross the shock wave. Naumann and Hermann3 used adouble-sided shock tube to produce the interaction of a shockwave and a vortex. The flow field for the time evolution ofthe shock vortex interaction was visualized by a Mach–Zehnder interferometer coupled with a high-speed camera.The experiment revealed that the deformation of the shockwave was either a regular or a Mach reflection, depending onthe strength of the shock wave and vortices.
The linear theory to explain the production of sound in ashock vortex interaction was developed by Ribner4,5 and byWeeks and Dosanjh.6 Ribner decomposed the vortex intoplane sinusoidal shear waves by a Fourier transform and thenrecombined the plane sound waves produced by the interac-tion of each shear wave with the shock wave. This analysisresulted in a cylindrical acoustic wave. The circumferentialsound pressure presented a quadrupolar character with per-fect antisymmetry with respect to the normal of the shock.The result of Ribner5 agreed well with the antisymmetrycomponent of the interferometric measurement.2 Weeks andDosanjh6 extended the theory of Lighthill7 and Curle8 andrepresented the circumferential pressure as a combination ofquadrupole, dipole, and monopole acoustic sources. Themonopole part allowed a distortion from the purely antisym-metric pattern. Their prediction for the acoustic wavesagreed well with their experimental data. Ting9 solved theacoustic waves from the linearized equations of the com-pressible flow and obtained a quadrupolar pressure distribu-tion similar to the result of Ribner.
Guichard et al.10 simulated the flow field in a mixingzone produced by shock interaction with a single vortex or a
pair of vortices by solving the Navier–Stokes equations us-© 2005 American Institute of Physics1-1
AIP license or copyright, see http://pof.aip.org/pof/copyright.jsp
116101-2 Zhang, Zhang, and Shu Phys. Fluids 17, 116101 �2005�
ing a sixth-order compact scheme.11 The deformation of theshock wave and the formation of the triple point were re-solved. The numerical result showed that the vorticity wasincreased and the vortex was bent according to the curvatureof the shock. Ellzey et al.12 and Ellzey and Henneke13,14
studied extensively the problem of shock–vortex interaction.The unsteady compressible Euler equations were solved us-ing a fourth-order flux-corrected transport algorithm of Borisand Book.15,16 In Ref. 12 the authors examined the effect ofdifferent strengths of vortices and shock waves. Their simu-lation confirmed the quadrupolar nature of the acousticwaves that were generated in the interaction and showed thata strong vortex could distort the incident shock wave andform regular or Mach reflections, depending on the strengthof the shock. The reflected shock wave merged with theacoustic wave and resulted in an acoustic wave consisting ofa strong compression region near the shock front. In Ref. 13the authors introduced their earlier results17 that the shockcompressed the originally circular vortex into an ellipticalvortex. They studied the effect of the compressed vortex onthe formation of sound waves. The result showed that anisolated elliptical vortex could produce similar sound wavesas that of shock–vortex interaction. Inoue and Hattori18 stud-ied the sound generation through simulating the shock inter-action with a single vortex or a pair of vortices by solvingthe two-dimensional Navier–Stokes equations using a sixth-order compact scheme of Lele.11 They obtained the first andsecond acoustic waves, both of which have a quadrupolarnature. In the interaction of a shock wave with a pair ofvortices, the third and fourth acoustic waves were observed.Although neither the third nor the fourth acoustic wave wasobserved in the interaction of a shock with a single vortex,the authors suspected that this was due to the limitation ofthe computational domain and the short simulation time.Later, Inoue19 performed a numerical simulation with alarger domain and for a longer time, and observed the thirdsound wave.
Using a fourth-order weighted essentially nonoscillatory�WENO� scheme20 to solve the two-dimensional Euler equa-tions, Grasso and Pirozzoli21 simulated the shock vortex in-teraction problem with an extensive range of strengths forboth the shock wave and the vortex. They classified the in-teraction into three types, depending on the deformation ofthe shock. The first type is a weak interaction in which theshock is not significantly distorted. The second type is astrong interaction with a regular reflection. The last type is astrong interaction with a Mach reflection. Corresponding re-gions were divided in terms of the strengths of shock wavesand vortices. The acoustic generation evolved in three stages,depending on the shock interacting with the forepart of thevortex, interacting with the rear part of the vortex, and leav-ing the vortex. The sound wave appeared in bipolar patternsin the first stage and changed to a quadrupolar behavior inthe second stage. Erlebacher et al.22 simulated shock interac-tion with a transverse vortex, emphasizing on a detailedstudy of disturbance propagating along the shock and indi-cating that the nonlinear effect became more important for astronger vortex interacting with a fixed shock.
All of the above studies were focused on the sound gen-
Downloaded 03 Jan 2006 to 128.148.160.224. Redistribution subject to
eration at relatively weak vortices. As the vortex becomesstronger, it produces a stronger disturbance to the shockwave, which results in stronger reflected shock waves. Thesereflected shock waves may interact with the deformed vortexto form a secondary interaction. Both Pirozzoli et al.23 andInoue et al.24,25 studied the interactions of shock waves andvortex pairs with strong intensity. In Ref. 23, Pirozzoli et al.studied the flow pattern and classified the shock structureinto five types. Their results indicated that the generation ofsound waves was influenced by the interaction of shockwaves with the vortex pair as well as the vorticity dynamicsrelated to the coupling of the pair. In Ref. 25 Inoue et al.focused on the study for the separation of the reflected shockwaves by the second vortex and found that there were moresound waves and a complex flow field. Barbosa and Skews26
studied the shock vortex interaction experimentally in a bi-furcated shock tube as well as numerically by solving thetwo-dimensional Euler equations. The vortex was shed byone of the shocks passing through a wedge and then inter-acting with another shock generated by the bifurcated shocktube. They observed the “tertiary shocklets” between the vor-tex core and the wall of the wedge. The pressure spiked atthe position of the focused cusp where the slope of the shockfront is discontinuous. The comparison between the experi-mental and numerical results was very good. Rault et al.27
also studied shock vortex interactions with a strong vortexnumerically, by solving the Euler equations using Marquina’sscheme28 and found that the interaction of strong shockwaves with vortices resulted in the breakdown of thevortices.
Our purpose in this paper is to study the details of theflow structure and sound generation for the interaction of ashock wave with a strong vortex, through simulating thetwo-dimensional Navier–Stokes equations using the fifth-order WENO scheme of Jiang and Shu.29 We find that theinteraction of a shock wave with a strong vortex has a mul-tistage feature. The strong reflected shock wave interactswith the deformed vortex, which results in the formation ofshocklets near the vortex center. The reflected shock waveand the shocklets interact with the deformed vortex. Eachstage of the interaction results in an increase of the vorticityand deformation of the vortex. The paper is organized asfollows: in Sec. II, the physical model, numerical scheme,and grid generation are introduced. In Sec. III, a numericalexample is provided to validate our code and to test its gridsensitivity. In the fourth section we present numerical resultsand a discussion for the interaction of a shock wave with astrong vortex. The details of the multistage feature of ashock–strong vortex interaction are discussed. The last sec-tion contains concluding remarks.
II. MATHEMATICAL FORMULATION AND NUMERICALPROCEDURE
A. The physical model
Following the simulation of Inoue and Hattori,18 the in-
teraction of a shock wave with an isolated vortex is simu-AIP license or copyright, see http://pof.aip.org/pof/copyright.jsp
116101-3 Interaction of shock and strong vortex Phys. Fluids 17, 116101 �2005�
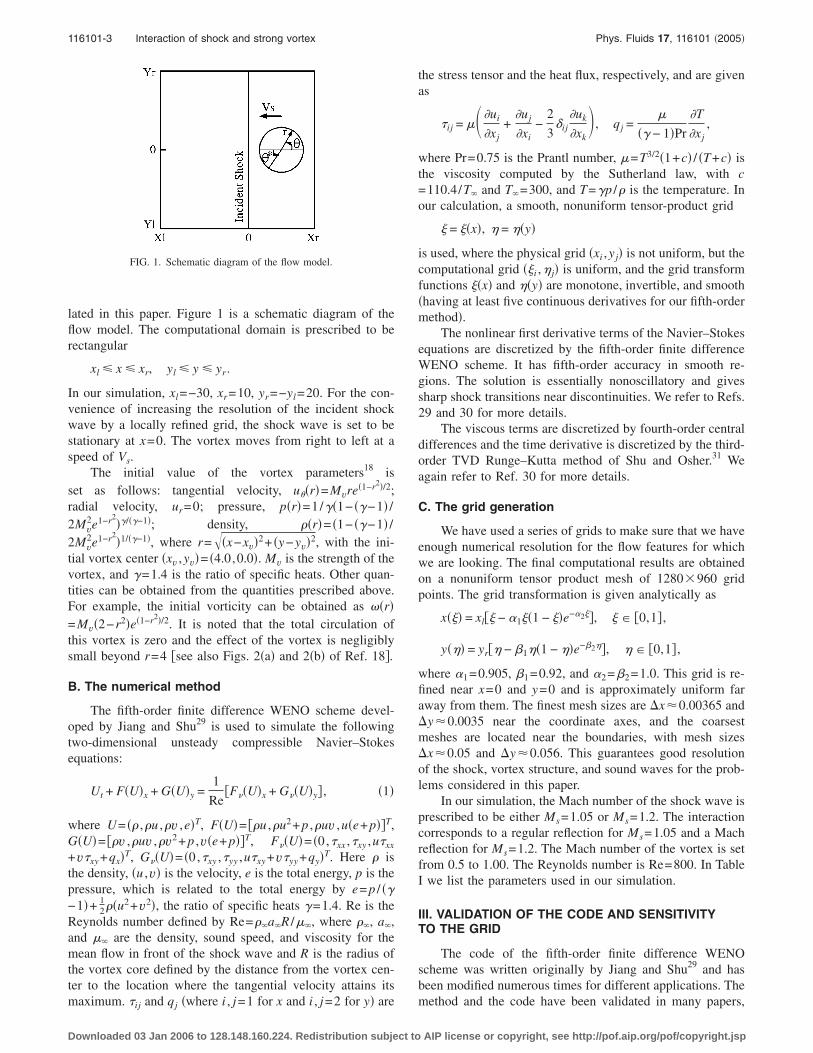
lated in this paper. Figure 1 is a schematic diagram of theflow model. The computational domain is prescribed to berectangular
xl � x � xr, yl � y � yr.
In our simulation, xl=−30, xr=10, yr=−yl=20. For the con-venience of increasing the resolution of the incident shockwave by a locally refined grid, the shock wave is set to bestationary at x=0. The vortex moves from right to left at aspeed of Vs.
The initial value of the vortex parameters18 isset as follows: tangential velocity, u��r�=Mvre�1−r2�/2;radial velocity, ur=0; pressure, p�r�=1/��1− ��−1� /2Mv
2e1−r2��/��−1�; density, ��r�= �1− ��−1� /
2Mv2e1−r2
�1/��−1�, where r=��x−xv�2+ �y−yv�2, with the ini-tial vortex center �xv ,yv�= �4.0,0.0�. Mv is the strength of thevortex, and �=1.4 is the ratio of specific heats. Other quan-tities can be obtained from the quantities prescribed above.For example, the initial vorticity can be obtained as ��r�=Mv�2−r2�e�1−r2�/2. It is noted that the total circulation ofthis vortex is zero and the effect of the vortex is negligiblysmall beyond r=4 �see also Figs. 2�a� and 2�b� of Ref. 18�.
B. The numerical method
The fifth-order finite difference WENO scheme devel-oped by Jiang and Shu29 is used to simulate the followingtwo-dimensional unsteady compressible Navier–Stokesequations:
Ut + F�U�x + G�U�y =1
Re�F��U�x + G��U�y� , �1�
where U= �� ,�u ,�v ,e�T, F�U�= ��u ,�u2+ p ,�uv ,u�e+ p��T,G�U�= ��v ,�uv ,�v2+ p ,v�e+ p��T, F��U�= �0,�xx ,�xy ,u�xx
+v�xy +qx�T, G��U�= �0,�xy ,�yy ,u�xy +v�yy +qy�T. Here � isthe density, �u ,v� is the velocity, e is the total energy, p is thepressure, which is related to the total energy by e= p / ��−1�+ 1
2��u2+v2�, the ratio of specific heats �=1.4. Re is theReynolds number defined by Re=��a�R /�, where ��, a�,and � are the density, sound speed, and viscosity for themean flow in front of the shock wave and R is the radius ofthe vortex core defined by the distance from the vortex cen-ter to the location where the tangential velocity attains its
FIG. 1. Schematic diagram of the flow model.
maximum. �ij and qj �where i , j=1 for x and i , j=2 for y� are
Downloaded 03 Jan 2006 to 128.148.160.224. Redistribution subject to
the stress tensor and the heat flux, respectively, and are givenas
�ij = � �ui
�xj+
�uj
�xi−
2
3ij
�uk
�xk�, qj =
�� − 1�Pr
�T
�xj,
where Pr=0.75 is the Prantl number, =T3/2�1+c� / �T+c� isthe viscosity computed by the Sutherland law, with c=110.4/T� and T�=300, and T=�p /� is the temperature. Inour calculation, a smooth, nonuniform tensor-product grid
� = ��x�, � = ��y�
is used, where the physical grid �xi ,yj� is not uniform, but thecomputational grid ��i ,� j� is uniform, and the grid transformfunctions ��x� and ��y� are monotone, invertible, and smooth�having at least five continuous derivatives for our fifth-ordermethod�.
The nonlinear first derivative terms of the Navier–Stokesequations are discretized by the fifth-order finite differenceWENO scheme. It has fifth-order accuracy in smooth re-gions. The solution is essentially nonoscillatory and givessharp shock transitions near discontinuities. We refer to Refs.29 and 30 for more details.
The viscous terms are discretized by fourth-order centraldifferences and the time derivative is discretized by the third-order TVD Runge–Kutta method of Shu and Osher.31 Weagain refer to Ref. 30 for more details.
C. The grid generation
We have used a series of grids to make sure that we haveenough numerical resolution for the flow features for whichwe are looking. The final computational results are obtainedon a nonuniform tensor product mesh of 1280 960 gridpoints. The grid transformation is given analytically as
x��� = xl�� − �1��1 − ��e−�2��, � � �0,1� ,
y��� = yr�� − �1��1 − ��e−�2��, � � �0,1� ,
where �1=0.905, �1=0.92, and �2=�2=1.0. This grid is re-fined near x=0 and y=0 and is approximately uniform faraway from them. The finest mesh sizes are �x�0.00365 and�y�0.0035 near the coordinate axes, and the coarsestmeshes are located near the boundaries, with mesh sizes�x�0.05 and �y�0.056. This guarantees good resolutionof the shock, vortex structure, and sound waves for the prob-lems considered in this paper.
In our simulation, the Mach number of the shock wave isprescribed to be either Ms=1.05 or Ms=1.2. The interactioncorresponds to a regular reflection for Ms=1.05 and a Machreflection for Ms=1.2. The Mach number of the vortex is setfrom 0.5 to 1.00. The Reynolds number is Re=800. In TableI we list the parameters used in our simulation.
III. VALIDATION OF THE CODE AND SENSITIVITYTO THE GRID
The code of the fifth-order finite difference WENOscheme was written originally by Jiang and Shu29 and hasbeen modified numerous times for different applications. The
method and the code have been validated in many papers,AIP license or copyright, see http://pof.aip.org/pof/copyright.jsp
116101-4 Zhang, Zhang, and Shu Phys. Fluids 17, 116101 �2005�
including the simulation of strong shocks and the Rayleigh–Taylor instability problem for Euler and Navier–Stokesequations;29,32,33 see also Ref. 34 for the simulation of theinteraction between shock waves and longitudinal vorticesusing ENO schemes.
For the shock vortex interaction problem considered inthis paper, since we are interested in the details of the soundgeneration, and the sound wave generated by the interactionis very weak comparing with the pressure jump across theshock, a good resolution of the detailed flow structures re-quires a high-order, nonoscillatory scheme with enough gridresolution.
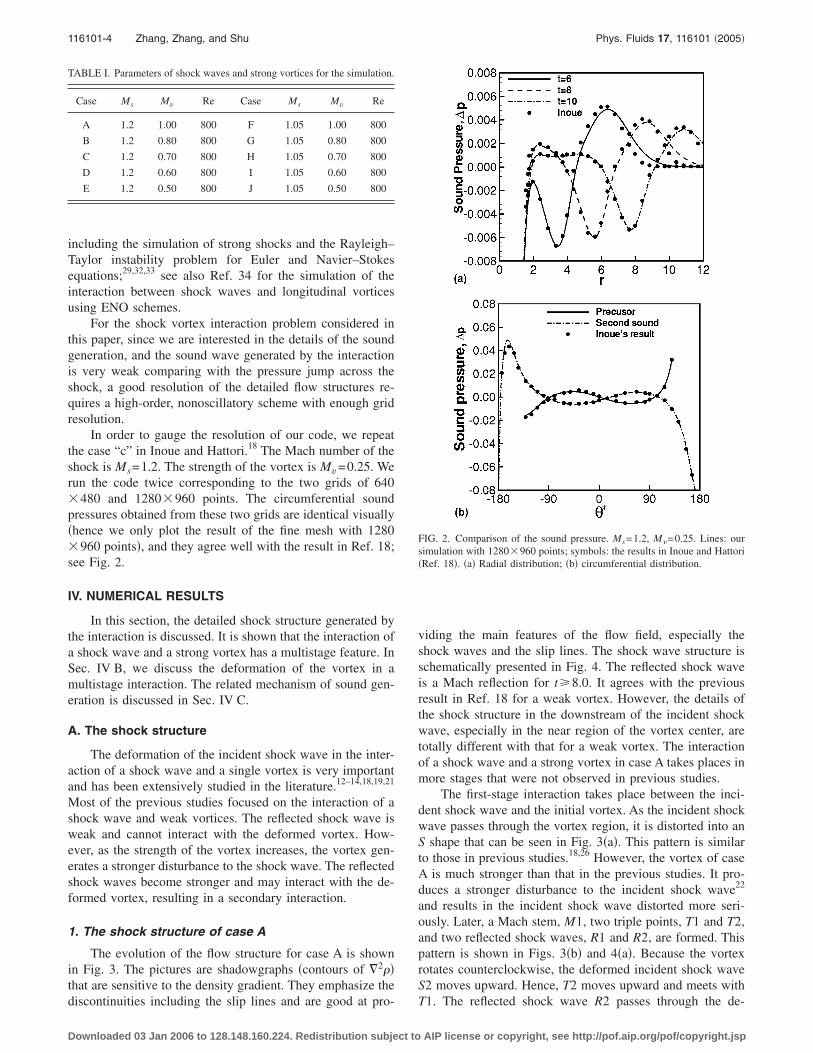
In order to gauge the resolution of our code, we repeatthe case “c” in Inoue and Hattori.18 The Mach number of theshock is Ms=1.2. The strength of the vortex is Mv=0.25. Werun the code twice corresponding to the two grids of 640 480 and 1280 960 points. The circumferential soundpressures obtained from these two grids are identical visually�hence we only plot the result of the fine mesh with 1280 960 points�, and they agree well with the result in Ref. 18;see Fig. 2.
IV. NUMERICAL RESULTS
In this section, the detailed shock structure generated bythe interaction is discussed. It is shown that the interaction ofa shock wave and a strong vortex has a multistage feature. InSec. IV B, we discuss the deformation of the vortex in amultistage interaction. The related mechanism of sound gen-eration is discussed in Sec. IV C.
A. The shock structure
The deformation of the incident shock wave in the inter-action of a shock wave and a single vortex is very importantand has been extensively studied in the literature.12–14,18,19,21
Most of the previous studies focused on the interaction of ashock wave and weak vortices. The reflected shock wave isweak and cannot interact with the deformed vortex. How-ever, as the strength of the vortex increases, the vortex gen-erates a stronger disturbance to the shock wave. The reflectedshock waves become stronger and may interact with the de-formed vortex, resulting in a secondary interaction.
1. The shock structure of case A
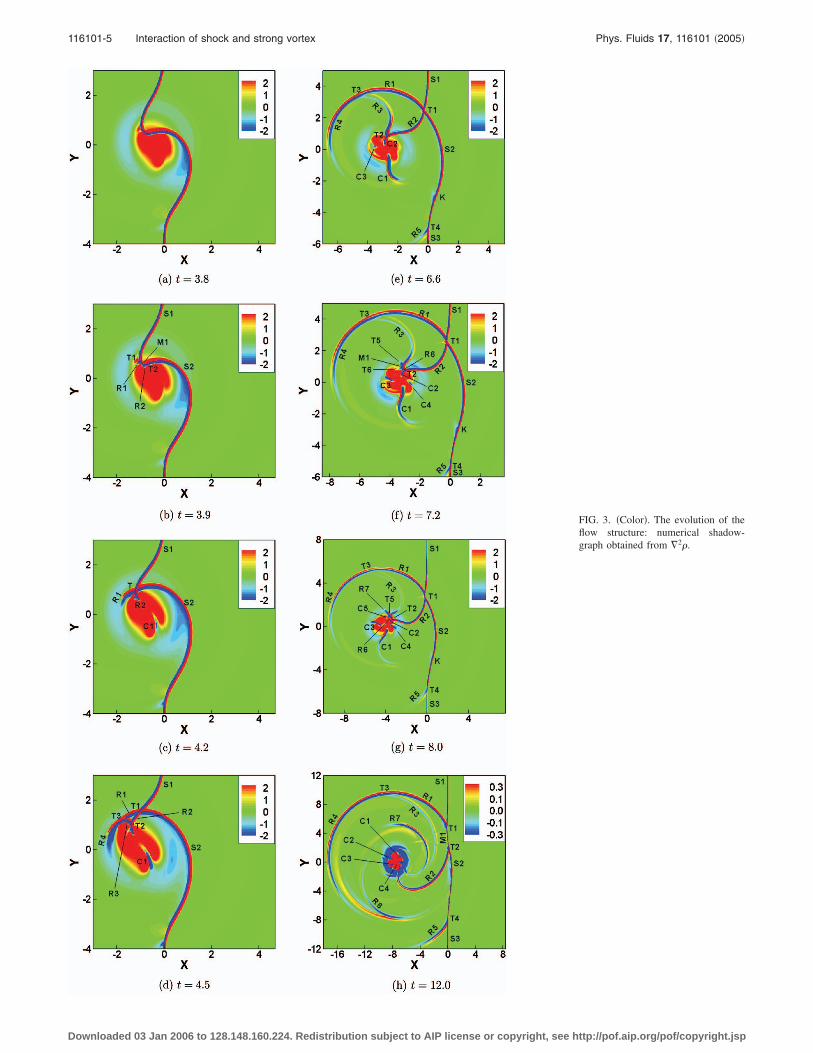
The evolution of the flow structure for case A is shownin Fig. 3. The pictures are shadowgraphs �contours of �2��that are sensitive to the density gradient. They emphasize the
TABLE I. Parameters of shock waves and strong vortices for the simulation.
Case Ms Mv Re Case Ms Mv Re
A 1.2 1.00 800 F 1.05 1.00 800
B 1.2 0.80 800 G 1.05 0.80 800
C 1.2 0.70 800 H 1.05 0.70 800
D 1.2 0.60 800 I 1.05 0.60 800
E 1.2 0.50 800 J 1.05 0.50 800
discontinuities including the slip lines and are good at pro-
Downloaded 03 Jan 2006 to 128.148.160.224. Redistribution subject to
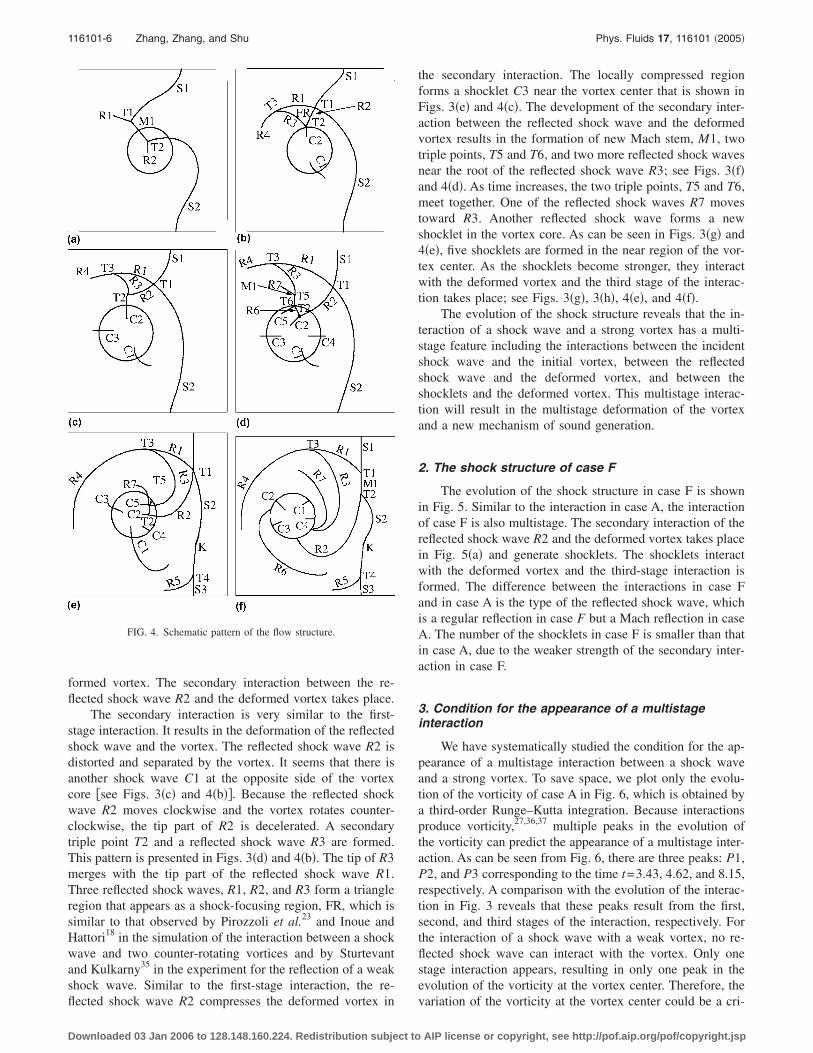
viding the main features of the flow field, especially theshock waves and the slip lines. The shock wave structure isschematically presented in Fig. 4. The reflected shock waveis a Mach reflection for t�8.0. It agrees with the previousresult in Ref. 18 for a weak vortex. However, the details ofthe shock structure in the downstream of the incident shockwave, especially in the near region of the vortex center, aretotally different with that for a weak vortex. The interactionof a shock wave and a strong vortex in case A takes places inmore stages that were not observed in previous studies.
The first-stage interaction takes place between the inci-dent shock wave and the initial vortex. As the incident shockwave passes through the vortex region, it is distorted into anS shape that can be seen in Fig. 3�a�. This pattern is similarto those in previous studies.18,26 However, the vortex of caseA is much stronger than that in the previous studies. It pro-duces a stronger disturbance to the incident shock wave22
and results in the incident shock wave distorted more seri-ously. Later, a Mach stem, M1, two triple points, T1 and T2,and two reflected shock waves, R1 and R2, are formed. Thispattern is shown in Figs. 3�b� and 4�a�. Because the vortexrotates counterclockwise, the deformed incident shock waveS2 moves upward. Hence, T2 moves upward and meets with
FIG. 2. Comparison of the sound pressure. Ms=1.2, M�=0.25. Lines: oursimulation with 1280 960 points; symbols: the results in Inoue and Hattori�Ref. 18�. �a� Radial distribution; �b� circumferential distribution.
T1. The reflected shock wave R2 passes through the de-
AIP license or copyright, see http://pof.aip.org/pof/copyright.jsp
116101-5 Interaction of shock and strong vortex Phys. Fluids 17, 116101 �2005�
FIG. 3. �Color�. The evolution of theflow structure: numerical shadow-graph obtained from �2�.
Downloaded 03 Jan 2006 to 128.148.160.224. Redistribution subject to AIP license or copyright, see http://pof.aip.org/pof/copyright.jsp
116101-6 Zhang, Zhang, and Shu Phys. Fluids 17, 116101 �2005�
formed vortex. The secondary interaction between the re-flected shock wave R2 and the deformed vortex takes place.
The secondary interaction is very similar to the first-stage interaction. It results in the deformation of the reflectedshock wave and the vortex. The reflected shock wave R2 isdistorted and separated by the vortex. It seems that there isanother shock wave C1 at the opposite side of the vortexcore �see Figs. 3�c� and 4�b��. Because the reflected shockwave R2 moves clockwise and the vortex rotates counter-clockwise, the tip part of R2 is decelerated. A secondarytriple point T2 and a reflected shock wave R3 are formed.This pattern is presented in Figs. 3�d� and 4�b�. The tip of R3merges with the tip part of the reflected shock wave R1.Three reflected shock waves, R1, R2, and R3 form a triangleregion that appears as a shock-focusing region, FR, which issimilar to that observed by Pirozzoli et al.23 and Inoue andHattori18 in the simulation of the interaction between a shockwave and two counter-rotating vortices and by Sturtevantand Kulkarny35 in the experiment for the reflection of a weakshock wave. Similar to the first-stage interaction, the re-
FIG. 4. Schematic pattern of the flow structure.
flected shock wave R2 compresses the deformed vortex in
Downloaded 03 Jan 2006 to 128.148.160.224. Redistribution subject to
the secondary interaction. The locally compressed regionforms a shocklet C3 near the vortex center that is shown inFigs. 3�e� and 4�c�. The development of the secondary inter-action between the reflected shock wave and the deformedvortex results in the formation of new Mach stem, M1, twotriple points, T5 and T6, and two more reflected shock wavesnear the root of the reflected shock wave R3; see Figs. 3�f�and 4�d�. As time increases, the two triple points, T5 and T6,meet together. One of the reflected shock waves R7 movestoward R3. Another reflected shock wave forms a newshocklet in the vortex core. As can be seen in Figs. 3�g� and4�e�, five shocklets are formed in the near region of the vor-tex center. As the shocklets become stronger, they interactwith the deformed vortex and the third stage of the interac-tion takes place; see Figs. 3�g�, 3�h�, 4�e�, and 4�f�.
The evolution of the shock structure reveals that the in-teraction of a shock wave and a strong vortex has a multi-stage feature including the interactions between the incidentshock wave and the initial vortex, between the reflectedshock wave and the deformed vortex, and between theshocklets and the deformed vortex. This multistage interac-tion will result in the multistage deformation of the vortexand a new mechanism of sound generation.
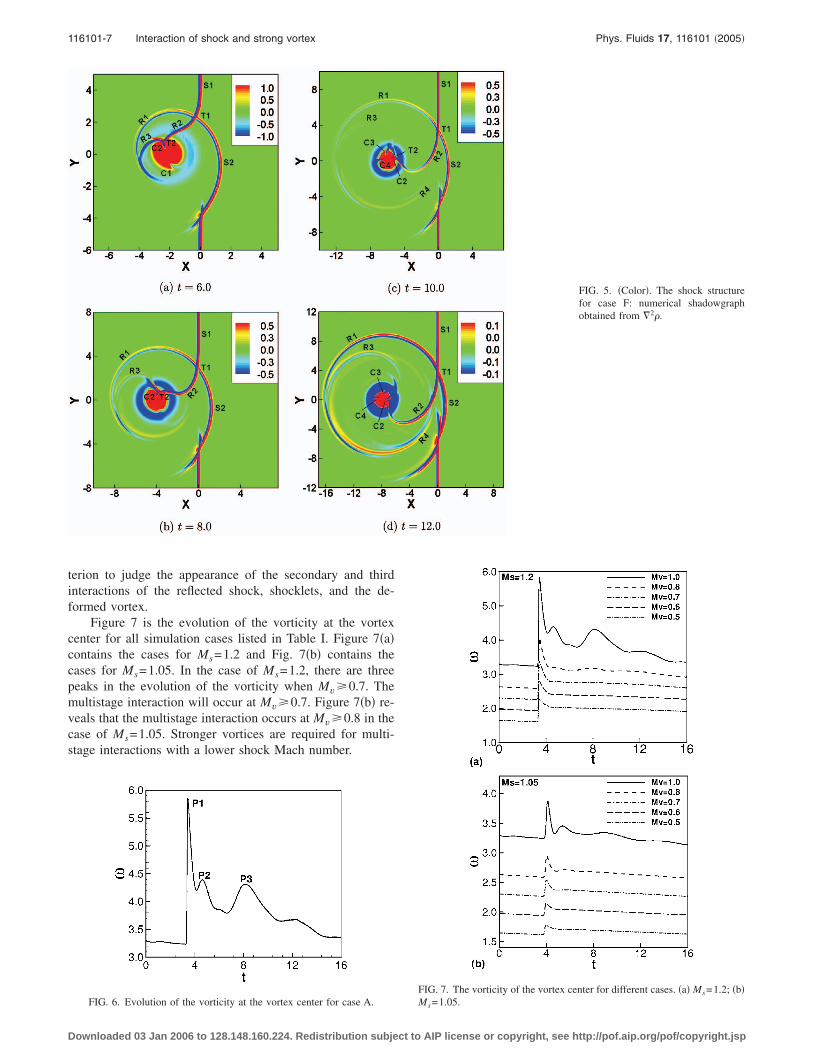
2. The shock structure of case F
The evolution of the shock structure in case F is shownin Fig. 5. Similar to the interaction in case A, the interactionof case F is also multistage. The secondary interaction of thereflected shock wave R2 and the deformed vortex takes placein Fig. 5�a� and generate shocklets. The shocklets interactwith the deformed vortex and the third-stage interaction isformed. The difference between the interactions in case Fand in case A is the type of the reflected shock wave, whichis a regular reflection in case F but a Mach reflection in caseA. The number of the shocklets in case F is smaller than thatin case A, due to the weaker strength of the secondary inter-action in case F.
3. Condition for the appearance of a multistageinteraction
We have systematically studied the condition for the ap-pearance of a multistage interaction between a shock waveand a strong vortex. To save space, we plot only the evolu-tion of the vorticity of case A in Fig. 6, which is obtained bya third-order Runge–Kutta integration. Because interactionsproduce vorticity,27,36,37 multiple peaks in the evolution ofthe vorticity can predict the appearance of a multistage inter-action. As can be seen from Fig. 6, there are three peaks: P1,P2, and P3 corresponding to the time t=3.43, 4.62, and 8.15,respectively. A comparison with the evolution of the interac-tion in Fig. 3 reveals that these peaks result from the first,second, and third stages of the interaction, respectively. Forthe interaction of a shock wave with a weak vortex, no re-flected shock wave can interact with the vortex. Only onestage interaction appears, resulting in only one peak in theevolution of the vorticity at the vortex center. Therefore, the
variation of the vorticity at the vortex center could be a cri-AIP license or copyright, see http://pof.aip.org/pof/copyright.jsp
116101-7 Interaction of shock and strong vortex Phys. Fluids 17, 116101 �2005�
terion to judge the appearance of the secondary and thirdinteractions of the reflected shock, shocklets, and the de-formed vortex.
Figure 7 is the evolution of the vorticity at the vortexcenter for all simulation cases listed in Table I. Figure 7�a�contains the cases for Ms=1.2 and Fig. 7�b� contains thecases for Ms=1.05. In the case of Ms=1.2, there are threepeaks in the evolution of the vorticity when Mv�0.7. Themultistage interaction will occur at Mv�0.7. Figure 7�b� re-veals that the multistage interaction occurs at Mv�0.8 in thecase of Ms=1.05. Stronger vortices are required for multi-stage interactions with a lower shock Mach number.
FIG. 5. �Color�. The shock structurefor case F: numerical shadowgraphobtained from �2�.
FIG. 6. Evolution of the vorticity at the vortex center for case A.
Downloaded 03 Jan 2006 to 128.148.160.224. Redistribution subject to
FIG. 7. The vorticity of the vortex center for different cases. �a� Ms=1.2; �b�
Ms=1.05.AIP license or copyright, see http://pof.aip.org/pof/copyright.jsp
116101-8 Zhang, Zhang, and Shu Phys. Fluids 17, 116101 �2005�
B. Vortex deformation and movement
1. Vortex deformation
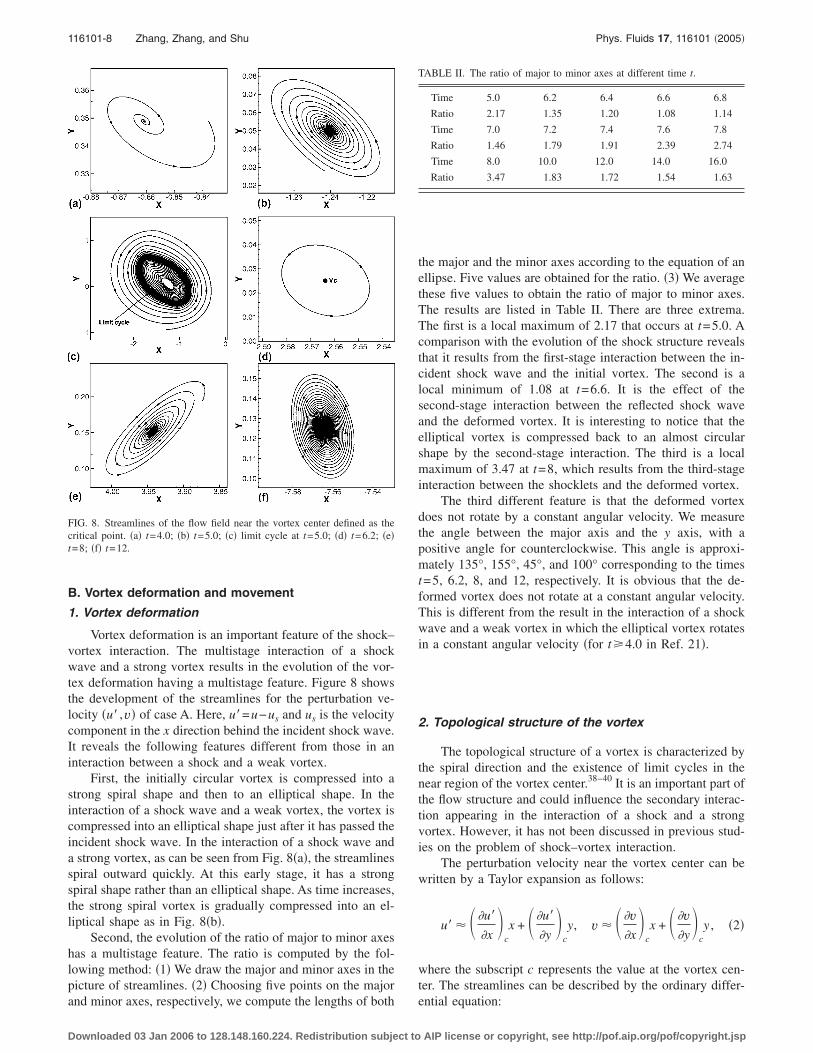
Vortex deformation is an important feature of the shock–vortex interaction. The multistage interaction of a shockwave and a strong vortex results in the evolution of the vor-tex deformation having a multistage feature. Figure 8 showsthe development of the streamlines for the perturbation ve-locity �u� ,v� of case A. Here, u�=u−us and us is the velocitycomponent in the x direction behind the incident shock wave.It reveals the following features different from those in aninteraction between a shock and a weak vortex.
First, the initially circular vortex is compressed into astrong spiral shape and then to an elliptical shape. In theinteraction of a shock wave and a weak vortex, the vortex iscompressed into an elliptical shape just after it has passed theincident shock wave. In the interaction of a shock wave anda strong vortex, as can be seen from Fig. 8�a�, the streamlinesspiral outward quickly. At this early stage, it has a strongspiral shape rather than an elliptical shape. As time increases,the strong spiral vortex is gradually compressed into an el-liptical shape as in Fig. 8�b�.
Second, the evolution of the ratio of major to minor axeshas a multistage feature. The ratio is computed by the fol-lowing method: �1� We draw the major and minor axes in thepicture of streamlines. �2� Choosing five points on the major
FIG. 8. Streamlines of the flow field near the vortex center defined as thecritical point. �a� t=4.0; �b� t=5.0; �c� limit cycle at t=5.0; �d� t=6.2; �e�t=8; �f� t=12.
and minor axes, respectively, we compute the lengths of both
Downloaded 03 Jan 2006 to 128.148.160.224. Redistribution subject to
the major and the minor axes according to the equation of anellipse. Five values are obtained for the ratio. �3� We averagethese five values to obtain the ratio of major to minor axes.The results are listed in Table II. There are three extrema.The first is a local maximum of 2.17 that occurs at t=5.0. Acomparison with the evolution of the shock structure revealsthat it results from the first-stage interaction between the in-cident shock wave and the initial vortex. The second is alocal minimum of 1.08 at t=6.6. It is the effect of thesecond-stage interaction between the reflected shock waveand the deformed vortex. It is interesting to notice that theelliptical vortex is compressed back to an almost circularshape by the second-stage interaction. The third is a localmaximum of 3.47 at t=8, which results from the third-stageinteraction between the shocklets and the deformed vortex.
The third different feature is that the deformed vortexdoes not rotate by a constant angular velocity. We measurethe angle between the major axis and the y axis, with apositive angle for counterclockwise. This angle is approxi-mately 135°, 155°, 45°, and 100° corresponding to the timest=5, 6.2, 8, and 12, respectively. It is obvious that the de-formed vortex does not rotate at a constant angular velocity.This is different from the result in the interaction of a shockwave and a weak vortex in which the elliptical vortex rotatesin a constant angular velocity �for t�4.0 in Ref. 21�.
2. Topological structure of the vortex
The topological structure of a vortex is characterized bythe spiral direction and the existence of limit cycles in thenear region of the vortex center.38–40 It is an important part ofthe flow structure and could influence the secondary interac-tion appearing in the interaction of a shock and a strongvortex. However, it has not been discussed in previous stud-ies on the problem of shock–vortex interaction.
The perturbation velocity near the vortex center can bewritten by a Taylor expansion as follows:
u� � � �u�
�x�
cx + � �u�
�y�
cy, v � � �v
�x�
cx + � �v
�y�
cy , �2�
where the subscript c represents the value at the vortex cen-ter. The streamlines can be described by the ordinary differ-
TABLE II. The ratio of major to minor axes at different time t.
Time 5.0 6.2 6.4 6.6 6.8
Ratio 2.17 1.35 1.20 1.08 1.14
Time 7.0 7.2 7.4 7.6 7.8
Ratio 1.46 1.79 1.91 2.39 2.74
Time 8.0 10.0 12.0 14.0 16.0
Ratio 3.47 1.83 1.72 1.54 1.63
ential equation:
AIP license or copyright, see http://pof.aip.org/pof/copyright.jsp
116101-9 Interaction of shock and strong vortex Phys. Fluids 17, 116101 �2005�
dy
dx=
vu
=� �v
�x�
cx + � �v
�y�
cy
� �u�
�x�
cx + � �u�
�y�
cy
. �3�
For this ordinary differential equation, the condition for thecritical point �u�=0, v=0� to be a vortex is �=4q̄− p̄2�0,where q̄= ��v /�x�c��u� /�y�c− ��u� /�x�c��v /�y�c and p̄=−���u� /�x�c+ ��v /�y�c�. p̄ is an important parameter to de-termine the topological structure of a vortex. If p̄�0, thestreamlines spiral outward. If p̄=0, the critical point is acenter. If p̄�0, the streamlines spiral inward.41
Based on the continuity equation, we obtain
p̄ = − � �u�
�x�
c+ � �v
�y�
c =
1
�� ��
�t+ us
��
�x�
c
=1
�� ��
�t+
us
RT
�p
�x−
�us
T
�T
�x�
c, �4�
where T is the temperature and R is a gas constant. The firstterm on the right-hand side of �4� represents the unsteadyeffect, and the last two terms represent the baroclinic effect.In our case, the interaction of a shock wave with a strongvortex results in an unsteady movement of the vortex �wewill discuss this later�. As a result, p̄ is a function of time andthe vortex takes a spiral shape. For vortical flow, the stream-lines in the outer region of the vortex core spiral inward. Ifthe streamlines in the inner region spiral outward, there ex-ists a stable limit cycle near the vortex center. In the evolu-tion of the vortex in case A, p̄ equals −0.826, −0.088, 0.000,0.093, and 0.040 corresponding to the time t=4.0, 5.0, 6.2,8.0, and 12.0, respectively. Figures 8�a� and 8�b� are outwardspiraling streamlines at t=4.0 and 5.0, respectively, while p̄is negative. At these instants, there exists a stable limit cycle.Figure 8�c� is an example for t=5.0. Figure 8�d� containsclosed streamlines at t=6.2 with p̄=0.000. The outward spi-ral types are shown in Figs. 8�e� and 8�f� for t=8 and t=12.
3. Vortex center
All the features discussed above about the vortex defor-mation, especially the topological structure, are strongly re-lated to the definition of the vortex center. There are threemethods used in the literature to define the vortex center. Thefirst is the point of local minimum density where both thespatial derivatives of the density vanish ��� /�x=0, �� /�y=0�. The vortex center determined from the density contour,the shadowgraph, or the schlieren and interferogram2 are re-lated to this method. The second is the point of local mini-mum pressure.42 The last is the critical point in the stream-lines where the two components of the perturbation velocityvanish.42 For a steady polytropic flow, the three definitionswill give the same vortex center. But after the vortex inter-acts with the incident shock wave, the expansion and baro-clinic effects will influence the flow significantly. The gradi-ents of density and pressure are not aligned. The vortex is notsteady anymore. Hence, the three methods will give differentresults for the vortex center. We compute the vortex center
based on these three methods. In addition, we integrate theDownloaded 03 Jan 2006 to 128.148.160.224. Redistribution subject to
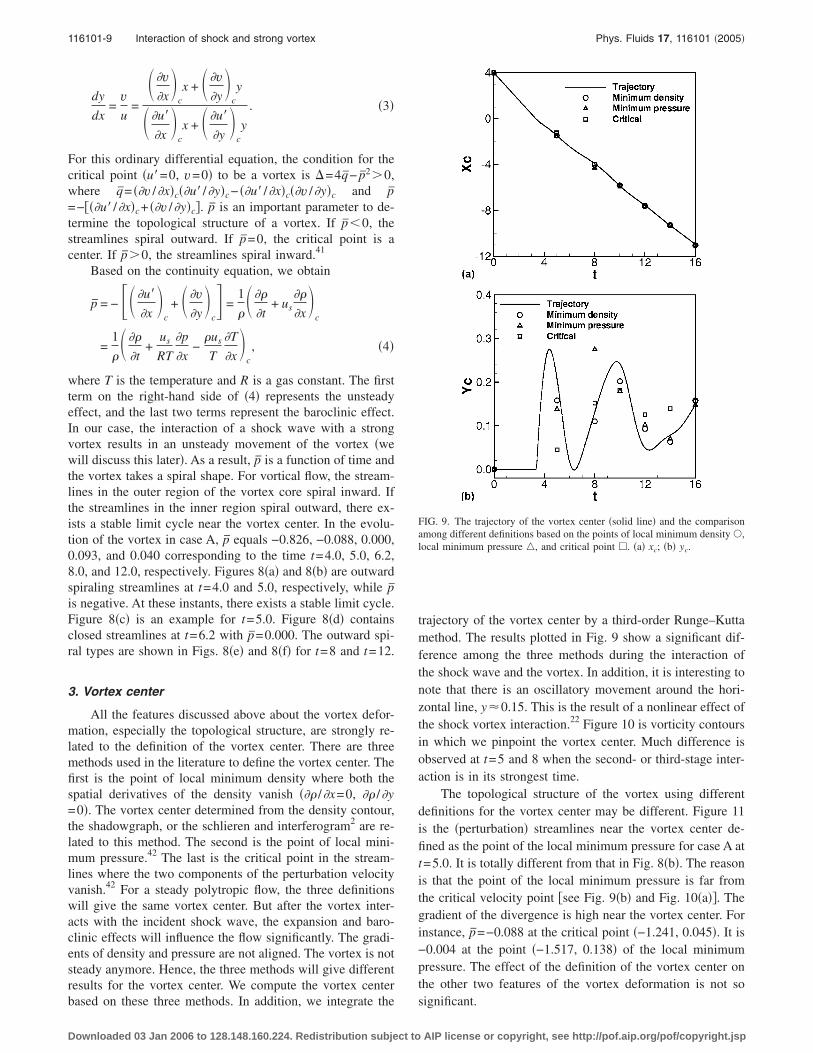
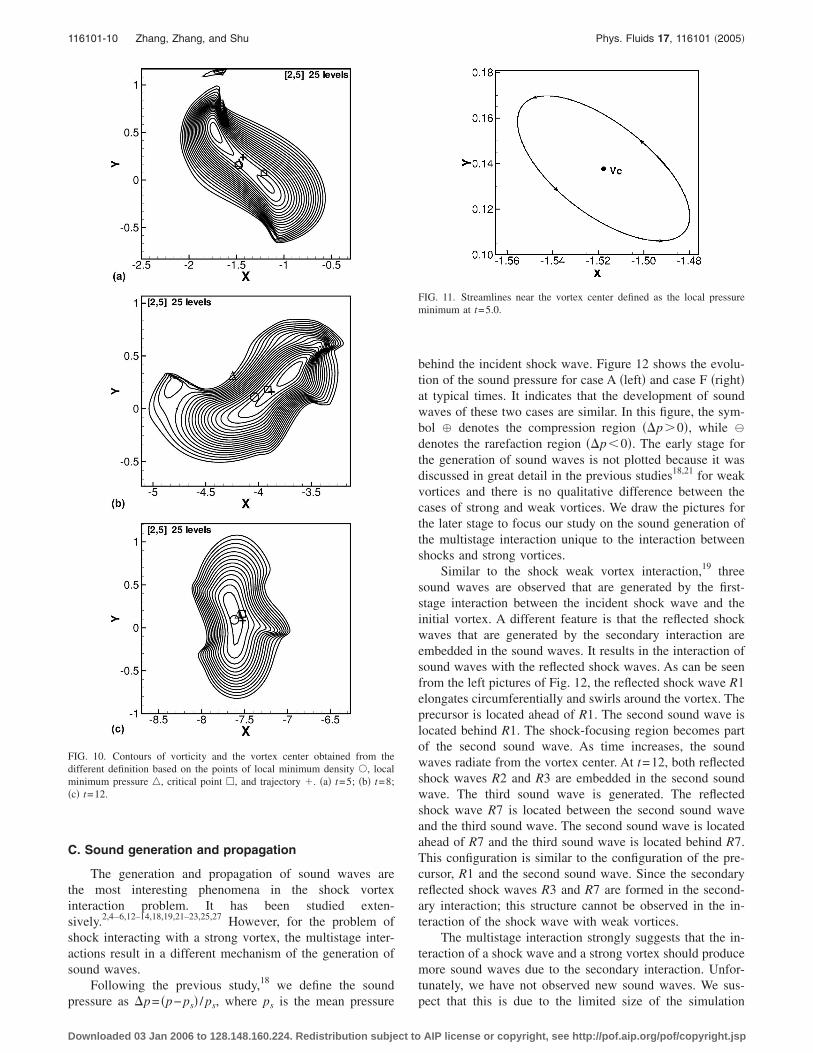
trajectory of the vortex center by a third-order Runge–Kuttamethod. The results plotted in Fig. 9 show a significant dif-ference among the three methods during the interaction ofthe shock wave and the vortex. In addition, it is interesting tonote that there is an oscillatory movement around the hori-zontal line, y�0.15. This is the result of a nonlinear effect ofthe shock vortex interaction.22 Figure 10 is vorticity contoursin which we pinpoint the vortex center. Much difference isobserved at t=5 and 8 when the second- or third-stage inter-action is in its strongest time.
The topological structure of the vortex using differentdefinitions for the vortex center may be different. Figure 11is the �perturbation� streamlines near the vortex center de-fined as the point of the local minimum pressure for case A att=5.0. It is totally different from that in Fig. 8�b�. The reasonis that the point of the local minimum pressure is far fromthe critical velocity point �see Fig. 9�b� and Fig. 10�a��. Thegradient of the divergence is high near the vortex center. Forinstance, p̄=−0.088 at the critical point �−1.241, 0.045�. It is−0.004 at the point �−1.517, 0.138� of the local minimumpressure. The effect of the definition of the vortex center onthe other two features of the vortex deformation is not so
FIG. 9. The trajectory of the vortex center �solid line� and the comparisonamong different definitions based on the points of local minimum density �,local minimum pressure �, and critical point �. �a� xc; �b� yc.
significant.
AIP license or copyright, see http://pof.aip.org/pof/copyright.jsp
116101-10 Zhang, Zhang, and Shu Phys. Fluids 17, 116101 �2005�
C. Sound generation and propagation
The generation and propagation of sound waves arethe most interesting phenomena in the shock vortexinteraction problem. It has been studied exten-sively.2,4–6,12–14,18,19,21–23,25,27 However, for the problem ofshock interacting with a strong vortex, the multistage inter-actions result in a different mechanism of the generation ofsound waves.
Following the previous study,18 we define the sound
FIG. 10. Contours of vorticity and the vortex center obtained from thedifferent definition based on the points of local minimum density �, localminimum pressure �, critical point �, and trajectory �. �a� t=5; �b� t=8;�c� t=12.
pressure as �p= �p− ps� / ps, where ps is the mean pressure
Downloaded 03 Jan 2006 to 128.148.160.224. Redistribution subject to
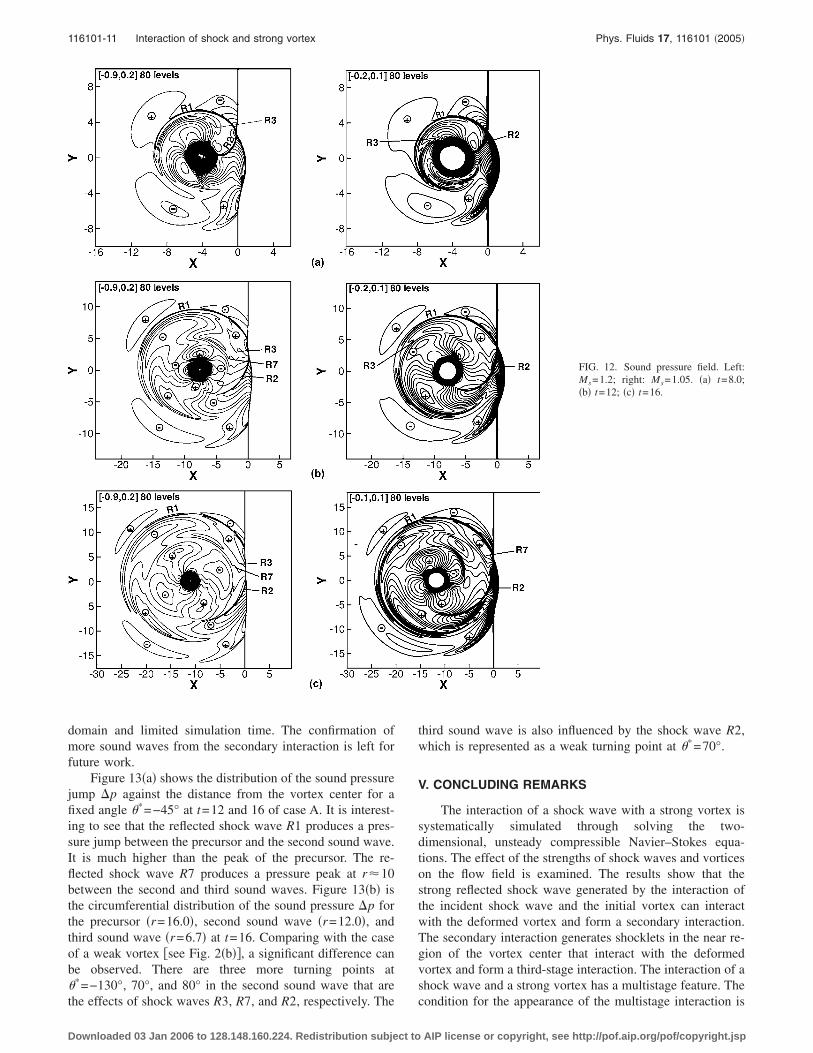
behind the incident shock wave. Figure 12 shows the evolu-tion of the sound pressure for case A �left� and case F �right�at typical times. It indicates that the development of soundwaves of these two cases are similar. In this figure, the sym-bol � denotes the compression region ��p�0�, while �
denotes the rarefaction region ��p�0�. The early stage forthe generation of sound waves is not plotted because it wasdiscussed in great detail in the previous studies18,21 for weakvortices and there is no qualitative difference between thecases of strong and weak vortices. We draw the pictures forthe later stage to focus our study on the sound generation ofthe multistage interaction unique to the interaction betweenshocks and strong vortices.
Similar to the shock weak vortex interaction,19 threesound waves are observed that are generated by the first-stage interaction between the incident shock wave and theinitial vortex. A different feature is that the reflected shockwaves that are generated by the secondary interaction areembedded in the sound waves. It results in the interaction ofsound waves with the reflected shock waves. As can be seenfrom the left pictures of Fig. 12, the reflected shock wave R1elongates circumferentially and swirls around the vortex. Theprecursor is located ahead of R1. The second sound wave islocated behind R1. The shock-focusing region becomes partof the second sound wave. As time increases, the soundwaves radiate from the vortex center. At t=12, both reflectedshock waves R2 and R3 are embedded in the second soundwave. The third sound wave is generated. The reflectedshock wave R7 is located between the second sound waveand the third sound wave. The second sound wave is locatedahead of R7 and the third sound wave is located behind R7.This configuration is similar to the configuration of the pre-cursor, R1 and the second sound wave. Since the secondaryreflected shock waves R3 and R7 are formed in the second-ary interaction; this structure cannot be observed in the in-teraction of the shock wave with weak vortices.
The multistage interaction strongly suggests that the in-teraction of a shock wave and a strong vortex should producemore sound waves due to the secondary interaction. Unfor-tunately, we have not observed new sound waves. We sus-
FIG. 11. Streamlines near the vortex center defined as the local pressureminimum at t=5.0.
pect that this is due to the limited size of the simulation
AIP license or copyright, see http://pof.aip.org/pof/copyright.jsp
116101-11 Interaction of shock and strong vortex Phys. Fluids 17, 116101 �2005�
domain and limited simulation time. The confirmation ofmore sound waves from the secondary interaction is left forfuture work.
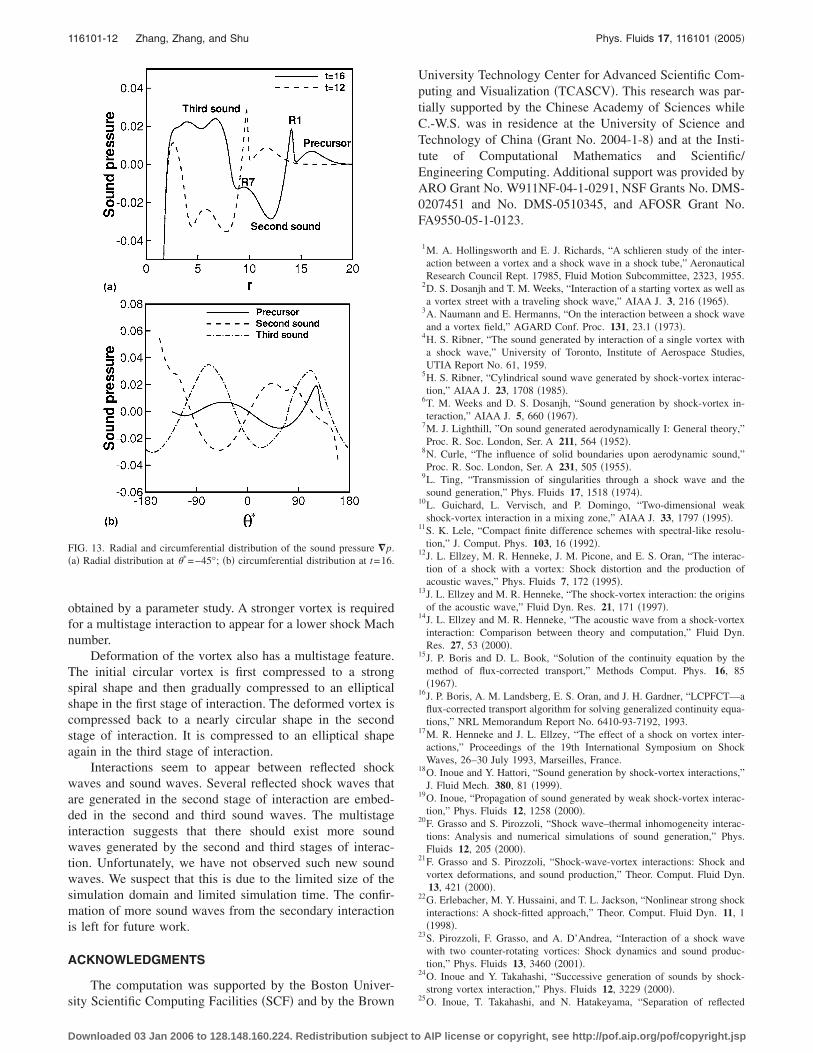
Figure 13�a� shows the distribution of the sound pressurejump �p against the distance from the vortex center for afixed angle �*=−45° at t=12 and 16 of case A. It is interest-ing to see that the reflected shock wave R1 produces a pres-sure jump between the precursor and the second sound wave.It is much higher than the peak of the precursor. The re-flected shock wave R7 produces a pressure peak at r�10between the second and third sound waves. Figure 13�b� isthe circumferential distribution of the sound pressure �p forthe precursor �r=16.0�, second sound wave �r=12.0�, andthird sound wave �r=6.7� at t=16. Comparing with the caseof a weak vortex �see Fig. 2�b��, a significant difference canbe observed. There are three more turning points at�*=−130°, 70°, and 80° in the second sound wave that are
the effects of shock waves R3, R7, and R2, respectively. TheDownloaded 03 Jan 2006 to 128.148.160.224. Redistribution subject to
third sound wave is also influenced by the shock wave R2,which is represented as a weak turning point at �*=70°.
V. CONCLUDING REMARKS
The interaction of a shock wave with a strong vortex issystematically simulated through solving the two-dimensional, unsteady compressible Navier–Stokes equa-tions. The effect of the strengths of shock waves and vorticeson the flow field is examined. The results show that thestrong reflected shock wave generated by the interaction ofthe incident shock wave and the initial vortex can interactwith the deformed vortex and form a secondary interaction.The secondary interaction generates shocklets in the near re-gion of the vortex center that interact with the deformedvortex and form a third-stage interaction. The interaction of ashock wave and a strong vortex has a multistage feature. The
FIG. 12. Sound pressure field. Left:Ms=1.2; right: Ms=1.05. �a� t=8.0;�b� t=12; �c� t=16.
condition for the appearance of the multistage interaction is
AIP license or copyright, see http://pof.aip.org/pof/copyright.jsp
116101-12 Zhang, Zhang, and Shu Phys. Fluids 17, 116101 �2005�
obtained by a parameter study. A stronger vortex is requiredfor a multistage interaction to appear for a lower shock Machnumber.
Deformation of the vortex also has a multistage feature.The initial circular vortex is first compressed to a strongspiral shape and then gradually compressed to an ellipticalshape in the first stage of interaction. The deformed vortex iscompressed back to a nearly circular shape in the secondstage of interaction. It is compressed to an elliptical shapeagain in the third stage of interaction.
Interactions seem to appear between reflected shockwaves and sound waves. Several reflected shock waves thatare generated in the second stage of interaction are embed-ded in the second and third sound waves. The multistageinteraction suggests that there should exist more soundwaves generated by the second and third stages of interac-tion. Unfortunately, we have not observed such new soundwaves. We suspect that this is due to the limited size of thesimulation domain and limited simulation time. The confir-mation of more sound waves from the secondary interactionis left for future work.
ACKNOWLEDGMENTS
The computation was supported by the Boston Univer-
FIG. 13. Radial and circumferential distribution of the sound pressure �p.�a� Radial distribution at �*=−45°; �b� circumferential distribution at t=16.
sity Scientific Computing Facilities �SCF� and by the Brown
Downloaded 03 Jan 2006 to 128.148.160.224. Redistribution subject to
University Technology Center for Advanced Scientific Com-puting and Visualization �TCASCV�. This research was par-tially supported by the Chinese Academy of Sciences whileC.-W.S. was in residence at the University of Science andTechnology of China �Grant No. 2004-1-8� and at the Insti-tute of Computational Mathematics and Scientific/Engineering Computing. Additional support was provided byARO Grant No. W911NF-04-1-0291, NSF Grants No. DMS-0207451 and No. DMS-0510345, and AFOSR Grant No.FA9550-05-1-0123.
1M. A. Hollingsworth and E. J. Richards, “A schlieren study of the inter-action between a vortex and a shock wave in a shock tube,” AeronauticalResearch Council Rept. 17985, Fluid Motion Subcommittee, 2323, 1955.
2D. S. Dosanjh and T. M. Weeks, “Interaction of a starting vortex as well asa vortex street with a traveling shock wave,” AIAA J. 3, 216 �1965�.
3A. Naumann and E. Hermanns, “On the interaction between a shock waveand a vortex field,” AGARD Conf. Proc. 131, 23.1 �1973�.
4H. S. Ribner, “The sound generated by interaction of a single vortex witha shock wave,” University of Toronto, Institute of Aerospace Studies,UTIA Report No. 61, 1959.
5H. S. Ribner, “Cylindrical sound wave generated by shock-vortex interac-tion,” AIAA J. 23, 1708 �1985�.
6T. M. Weeks and D. S. Dosanjh, “Sound generation by shock-vortex in-teraction,” AIAA J. 5, 660 �1967�.
7M. J. Lighthill, ”On sound generated aerodynamically I: General theory,”Proc. R. Soc. London, Ser. A 211, 564 �1952�.
8N. Curle, “The influence of solid boundaries upon aerodynamic sound,”Proc. R. Soc. London, Ser. A 231, 505 �1955�.
9L. Ting, “Transmission of singularities through a shock wave and thesound generation,” Phys. Fluids 17, 1518 �1974�.
10L. Guichard, L. Vervisch, and P. Domingo, “Two-dimensional weakshock-vortex interaction in a mixing zone,” AIAA J. 33, 1797 �1995�.
11S. K. Lele, “Compact finite difference schemes with spectral-like resolu-tion,” J. Comput. Phys. 103, 16 �1992�.
12J. L. Ellzey, M. R. Henneke, J. M. Picone, and E. S. Oran, “The interac-tion of a shock with a vortex: Shock distortion and the production ofacoustic waves,” Phys. Fluids 7, 172 �1995�.
13J. L. Ellzey and M. R. Henneke, “The shock-vortex interaction: the originsof the acoustic wave,” Fluid Dyn. Res. 21, 171 �1997�.
14J. L. Ellzey and M. R. Henneke, “The acoustic wave from a shock-vortexinteraction: Comparison between theory and computation,” Fluid Dyn.Res. 27, 53 �2000�.
15J. P. Boris and D. L. Book, “Solution of the continuity equation by themethod of flux-corrected transport,” Methods Comput. Phys. 16, 85�1967�.
16J. P. Boris, A. M. Landsberg, E. S. Oran, and J. H. Gardner, “LCPFCT—aflux-corrected transport algorithm for solving generalized continuity equa-tions,” NRL Memorandum Report No. 6410-93-7192, 1993.
17M. R. Henneke and J. L. Ellzey, “The effect of a shock on vortex inter-actions,” Proceedings of the 19th International Symposium on ShockWaves, 26–30 July 1993, Marseilles, France.
18O. Inoue and Y. Hattori, “Sound generation by shock-vortex interactions,”J. Fluid Mech. 380, 81 �1999�.
19O. Inoue, “Propagation of sound generated by weak shock-vortex interac-tion,” Phys. Fluids 12, 1258 �2000�.
20F. Grasso and S. Pirozzoli, “Shock wave–thermal inhomogeneity interac-tions: Analysis and numerical simulations of sound generation,” Phys.Fluids 12, 205 �2000�.
21F. Grasso and S. Pirozzoli, “Shock-wave-vortex interactions: Shock andvortex deformations, and sound production,” Theor. Comput. Fluid Dyn.13, 421 �2000�.
22G. Erlebacher, M. Y. Hussaini, and T. L. Jackson, “Nonlinear strong shockinteractions: A shock-fitted approach,” Theor. Comput. Fluid Dyn. 11, 1�1998�.
23S. Pirozzoli, F. Grasso, and A. D’Andrea, “Interaction of a shock wavewith two counter-rotating vortices: Shock dynamics and sound produc-tion,” Phys. Fluids 13, 3460 �2001�.
24O. Inoue and Y. Takahashi, “Successive generation of sounds by shock-strong vortex interaction,” Phys. Fluids 12, 3229 �2000�.
25
O. Inoue, T. Takahashi, and N. Hatakeyama, “Separation of reflectedAIP license or copyright, see http://pof.aip.org/pof/copyright.jsp
116101-13 Interaction of shock and strong vortex Phys. Fluids 17, 116101 �2005�
shock waves due to secondary interaction with vortices: Another mecha-nism of sound generation,” Phys. Fluids 14, 3733 �2002�.
26F. J. Barbosa and B. W. Skews, “Shock wave interaction with a spiralvortex,” Phys. Fluids 13, 3049 �2001�.
27A. Rault, G. Chiavassa, and R. Donat, “Shock-vortex interactions at highMach numbers,” J. Sci. Comput. 19, 347 �2003�.
28R. Donat and A. Marquina, “Capturing shock reflections: An improvedflux formula,” J. Comput. Phys. 125, 42 �1996�.
29G.-S. Jiang and C.-W. Shu, “Efficient implementation of weighted ENOschemes,” J. Comput. Phys. 126, 202 �1996�.
30C.-W. Shu, “Essentially non-oscillatory and weighted essentially non-oscillatory schemes for hyperbolic conservation laws,” in Advanced Nu-merical Approximation of Nonlinear Hyperbolic Equations, Lecture Notesin Mathematics, edited by B. Cockburn, C. Johnson, C.-W. Shu, E. Tad-mor, and A. Quarteroni �Springer, New York, 1998�, Vol. 1697, pp. 325–432.
31C.-W. Shu and S. Osher, “Efficient implementation of essentially non-oscillatory shock capturing schemes,” J. Comput. Phys. 77, 439 �1988�.
32J. Shi, Y.-T. Zhang, and C.-W. Shu, “Resolution of high order WENOschemes for complicated flow structures,” J. Comput. Phys. 186, 690�2003�.
33Y.-T. Zhang, J. Shi, C.-W. Shu, and Y. Zhou, “Numerical viscosity and
resolution of high-order weighted essentially nonoscillatory schemes forDownloaded 03 Jan 2006 to 128.148.160.224. Redistribution subject to
compressible flows with high Reynolds numbers,” Phys. Rev. E 68,046709 �2003�.
34G. Erlebacher, M. Y. Hussaini, and C.-W. Shu, “Interaction of a shockwith a longitudinal vortex,” J. Fluid Mech. 337, 129 �1997�.
35B. Sturtevant and V. A. Kulkarny, “The focusing of weak shock waves,” J.Fluid Mech. 73, 651 �1976�.
36N. K.-R. Kevlahan, “The vorticity jump across a shock in a non-uniformflow,” J. Fluid Mech. 341, 371 �1997�.
37J. M. Picone and J. P. Boris, “Vorticity generation by shock propagationthrough bubbles in a gas,” J. Fluid Mech. 189, 23 �1988�.
38A. E. Perry and M. S. Chong, “A series-expansion study of the Navier–Stokes equations with applications to three-dimensional separation pat-terns.” J. Fluid Mech. 173, 207 �1986�.
39A. E. Perry and T. R. Steiner, “Large-scale vortex structures in turbulentwakes behind bluff bodies. Part 1. Vortex formation process,” J. FluidMech. 174, 233 �1987�.
40M. Tobak and D. J. Peake, “Topology of three-dimensional separatedflows,” Annu. Rev. Fluid Mech. 14, 61 �1982�.
41J. Crank, H. G. Martin, and D. M. Melluish, Nonlinear Ordinary Differ-ential Equations �Oxford University Press, Oxford, 1977�.
42J. Jeong and F. Hussain, “On the identification of a vortex,” J. Fluid Mech.
285, 69 �1995�.AIP license or copyright, see http://pof.aip.org/pof/copyright.jsp


![SHOCK[1] - Hypovolemic Shock](https://img.pdfslide.us/doc/110x75/58edc1bc1a28abae538b4711/shock1-hypovolemic-shock.jpg)