Embed Size (px)
Citation preview
Inst
itut
e fo
r A
dvan
ced
Tech
nolo
gyT
he U
nive
rsit
y of
Tex
as a
t Aus
tin
Multistage Electromagneticand Laser Launchers for Affordable,
Rapid Access to SpaceAFOSR MURI Final Report 2010
I. R. McNab, M. J. Guillot, M. Giesselman,G. V. Candler, D. A. Wetz, F. Stefani, D. Motes,
J. V. Parker, J. J. Mankowski, and R. Karhi
Institute for Advanced TechnologyThe University of Texas at Austin
3925 W. Braker Ln., Ste. 400Austin, TX 78759
July 2011
IAT.R 0624
Approved for public release; distribution unlimited.
Award No. FA9550-05-1-0341 with the Air Force Office of Scientific Research
Institute for Advanced Technology, The University of Texas at Austin * 3925 West Braker Lane, Suite 400 * Austin, Texas 78759
REPORT DOCUMENTATION PAGE Form ApprovedOMB NO. 0704-0188
Public reporting burden for this collection of information is estimated to average 1 hour per response, including the time for reviewing instructions, searching existing data sources, gathering andmaintaining the data needed, and completing and reviewing the collection of information. Send comments regarding this burden estimate or any other aspect of this collection of information,including suggestions for reducing this burden, to Washington Headquarters Services, Directorate for Information Operations and Reports, 1215 Jefferson Davis Highway, Suite 1204, Arlington, VA22202-4302, and to the Office of Management and Budget, Paperwork Reduction Project (0704-0188), Washington, DC 20503.
1. AGENCY USE ONLY (Leave blank) 2. REPORT DATE 3. REPORT TYPE AND DATES COVERED
7/8/20114. TITLE AND SUBTITLE
Multistage Electromagnetic and Laser Launchers for Affordable, Rapid Access toSpace AFOSR MURI Final Report 2010
5. FUNDING NUMBERS
Contract # FA9550-05-1-0341
6. AUTHOR(S)
I. R. McNab, M. J. Guillot, M. Giesselman, G. V. Candler, D. A. Wetz, F. Stefani,D. Motes, J. V. Parker, J. J. Mankowski, and R. Karhi
7. PERFORMING ORGANIZATION NAME(S) AND ADDRESS(ES) 8. PERFORMING ORGANIZATIONREPORT NUMBER
IAT.R 0624
9. SPONSORING / MONITORING AGENCY NAME(S) AND ADDRESS(ES) 10. SPONSORING / MONITORING AGENCY REPORT NUMBER
11. SUPPLEMENTARYNOTES Any opinions, findings, and conclusions or recommendations expressed in this publication are those of the authors and
do not necessarily reflect the views of the AFOSR.
12a. DISTRIBUTION / AVAILABILITYSTATEMENT
12b. DISTRIBUTIONCODE
A
13. ABSTRACT (Maximum 200 words)
This is the final report for efforts made under AFOSR MURI Award No. FA9550-05-1-0341, including summaries of theresearch effort at UT-IAT, TTU, UMN, and UNO. Efforts at UT-IAT focused on developing methods to improve the integrityof the augmented launcher bore using high-pressure assembly techniques and improved ceramic tiles to provide longer borelife for research at velocities up to 7 km/s. Researchers at TTU have designed a 40-stage, high-efficiency, distributedsynchronous launcher to demonstrate operation at high velocities (the goal is ~10 km/s) with plasma arcs. Researchers atUMN and UNO have continued to make progress in defining the requirements for the thermal protection system forhypervelocity projectile launches from high altitude at Mach numbers of ~25.
14. SUBJECT TERMS
plasma armature electromagnetic launch, distributed synchronous launcher,thermal protection system
15. NUMBER OF PAGES
101
16. PRICE CODE
17. SECURITYCLASSIFICATION OF REPORT
18. SECURITYCLASSIFICATION OF THIS PAGE
19. SECURITYCLASSIFICATION OF ABSTRACT
20. LIMITATION OFABSTRACT
ULUnclassified Unclassified UnclassifiedNSN 7540-01-280-5500 Standard Form 298 (Rev.2-89)
Prescribed by ANSI Std. 239-18 298-102
Final Report, 2010
Institute for Advanced TechnologyThe University of Texas at Austin3925 W. Braker Lane, Ste. 400Austin, TX 78759
Dr. Mitat Birkan, AFOSR/NA, 875 N. Randolph St., Rm. 3112,Arlington, VA 22203-1954(703) 696-7234 [email protected]
Approved for public release; distribution is unlimited.
AFRL-OSR-VA-TR-2012-0117
IAT.R 0624 ii
Table of Contents
Executive Summary .............................................................................................................1 1 Introduction ...................................................................................................................2 2 The University of Texas at Austin, Institute for Advanced Technology ......................4
2.1 Overview ...........................................................................................................4 2.2 Experimental Results 2009–2010 ......................................................................7
2.2.1 UT-IAT Electromagnetic Launcher Core Design ........................................7 2.2.2 UT-IAT Plasma Preinjector .........................................................................8 2.2.3 UT-IAT EM Launcher Results—Breech-Fed Power Input .......................10 2.2.4 UT-IAT EM Launcher Results—Distributed-Feed Power Input...............14
2.3 Findings from UT-IAT Research ....................................................................17 2.4 UT-IAT Personnel Supported ..........................................................................18
3 Texas Tech University ................................................................................................19 3.1 Overview .........................................................................................................19 3.2 Distributed Energy Store Concept ...................................................................21 3.3 Plasma Armatures ............................................................................................23 3.4 Synchronous Electromagnetic Launcher Design .............................................26 3.5 TTU Electromagnetic Launcher Results .........................................................26
3.5.1 Preliminary Solid Armature Experiments with a Five-Stage Distributed Energy Launcher ................................................................................................................26 3.5.2 Preliminary Plasma Arc Launcher Experiments ........................................27 3.5.3 Plasma Arc Splitting ..................................................................................29 3.5.4 Plasma Arc Length .....................................................................................30 3.5.5 40-Stage Distributed Energy Source Launcher Simulation .......................32 3.5.6 Seven-Stage Distributed Energy Source Prototype ...................................37 3.5.7 Conclusions ................................................................................................43 3.5.8 40-Stage Free-Running Arc Synchronous DES Launcher .........................44 3.5.9 Control System...........................................................................................51 3.5.10 Experimental Results .................................................................................53
3.6 Findings from TTU Research ..........................................................................60 3.7 TTU Personnel Supported ...............................................................................61 3.8 TTU Publications .............................................................................................62
4 University of Minnesota .............................................................................................63 4.1 Introduction .....................................................................................................63 4.2 UMN Progress .................................................................................................63
5 University of New Orleans .........................................................................................63 5.1 Introduction .....................................................................................................63 5.2 UNO Progress ..................................................................................................66 5.3 ABRES Shape-Change Code (ASCC) ............................................................66
5.3.1 Surface Energy Balance .............................................................................66 5.3.2 Turbulence Transition ................................................................................67 5.3.3 Internal Heat Conduction Model ...............................................................67 5.3.4 Trajectory Calculations-Equations of Motion ...........................................68
5.4 Lift and Drag Calculations ..............................................................................70
IAT.R 0624 iii
5.5 Propellant Mass Estimation .............................................................................74 5.6 Results .............................................................................................................74
5.6.1 Ballistic Trajectories with Ablation ...........................................................75 5.6.2 Lifting Trajectories Without Ablation .......................................................86
5.7 Findings from UNO .........................................................................................88 5.7.1 Summary ....................................................................................................89
5.8 Conferences, Meetings, and Seminar Participation .........................................90 6 Overall MURI Conclusions ........................................................................................90 Acknowledgments..............................................................................................................91 References ..........................................................................................................................91

IAT.R 0624 iv
List of Figures Figure 1-1. EM launcher operation. ................................................................................................ 3
Figure 1-2. UT-IAT’s electromagnetic launch facility (ELF). ....................................................... 4
Figure 2-1. Plasma formation in the launcher bore [3]. .................................................................. 5
Figure 2-2. Ablation threshold as a function of time for simple and augmented launchers. .......... 6
Figure 2-3. UT-IAT’s current MCL core as a solid model (left) and assembly (right). ................. 8
Figure 2-4. Preinjector with tapered acceleration region. ............................................................... 9
Figure 2-5. Photographs of a projectile exiting the free-flight region before (top) and after (bottom) the addition of the tapered region. ......................................................................... 10
Figure 2-6. Carrier and projectile coupled together before a shot. ............................................... 10
Figure 2-7. Extruded carrier (below) and projectile (above) after an experiment. ....................... 10
Figure 2-8. Assembled system. a) Solid model. b) Overall perspective. c) Breech end. d) Muzzle end. ...................................................................................................................... 11
Figure 2-9. Current waveforms for experiment 09072002. .......................................................... 12
Figure 2-10. B-dot waveforms plotted in a waterfall plot for experiment 09072002. .................. 12
Figure 2-11. Plot of armature velocity and position vs. time as extrapolated from the B-dots for experiment 09072002............................................................................................................ 12
Figure 2-12. Integrated B-dot traces from experiment 09072002. ............................................... 12
Figure 2-13. B-dot and current data from experiment 09080601. ................................................ 13
Figure 2-14. Plot of armature velocity and position vs. time of the first arc as extrapolated from the B-dots for experiment 09080601. ................................................................................... 13
Figure 2-15. B-dot and current data from experiment 09102802. ................................................ 13
Figure 2-16. Plot of armature velocity and position vs. time of the first arc as extrapolated from the B-dots for experiment 09102802. ................................................................................... 13
Figure 2-17. Previously recorded restrike arc formation. ............................................................. 14
Figure 2-18. Solid model (left) and photograph (right) of the two-stage distributed-feed configuration. ........................................................................................................................ 14
Figure 2-19. Photograph of solid armature and payload............................................................... 14
Figure 2-20. Currents from experiment 10050401. ...................................................................... 15
Figure 2-21. B-dot and current data from experiment 10050401. ................................................ 15
Figure 2-22. Plot of armature velocity and position vs. time as extrapolated from the B-dots for experiment 10050401............................................................................................................ 15
Figure 2-23. Energy module driving a launcher. .......................................................................... 16
Figure 2-24. Photograph of a solid armature with robust trailing arms. ....................................... 17
Figure 2-25. B-dot and current data from experiment 10070203. ................................................ 17

IAT.R 0624 v
Figure 2-26. Plot of armature velocity and position vs. time as extrapolated from the B-dots for experiment 10070203............................................................................................................ 17
Figure 2-27. Simulated and measured data from experiment 10070203. ..................................... 17
Figure 3-1. Breech-fed energy concept. ........................................................................................ 21
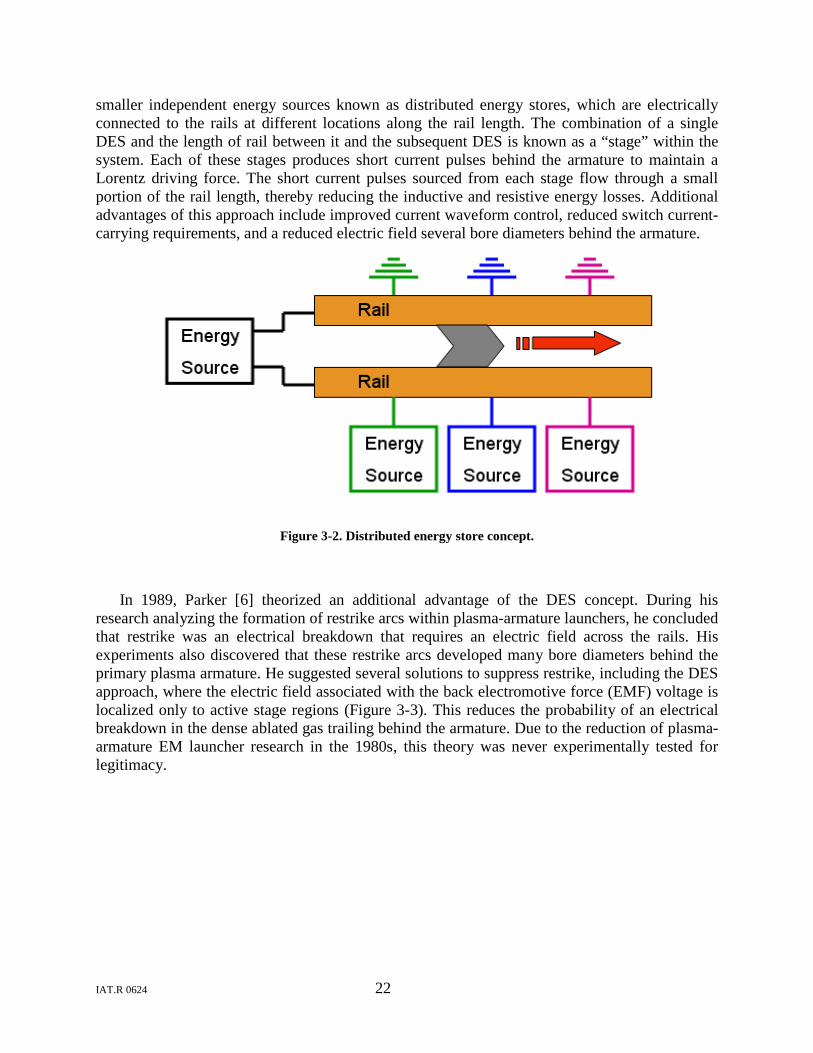
Figure 3-2. Distributed energy store concept. ............................................................................... 22
Figure 3-3. Illustration of the electric field profile for breech-fed and DES concepts. ................ 23
Figure 3-4. Schematic of a free arc traveling below Mach 10. ..................................................... 24
Figure 3-5. Schematic of a free arc traveling above Mach 10. ..................................................... 25
Figure 3-6. Five-stage DES launcher for solid armatures............................................................. 27
Figure 3-7. Assembled breech-fed launcher. ................................................................................ 28
Figure 3-8. Plasma-armature system............................................................................................. 28
Figure 3-9. Breech-fed system data using the alumina bore insulators. ....................................... 28
Figure 3-10. Plasma velocity comparison. .................................................................................... 28
Figure 3-11. Armature B-dot probe signals from experiment 3. .................................................. 30
Figure 3-12. A drawing of the DES launcher and optical diagnostics. ......................................... 31
Figure 3-13. Illustration of the fiber line mounting. ..................................................................... 31
Figure 3-14. Arc length calculations vs. pressure and location. ................................................... 32
Figure 3-15. Simulated current waveforms for a 40-stage system. Top: current waveforms for stages 1–20. Bottom: current waveforms for stages 21–40. ................................................. 36
Figure 3-16. Simulated armature current. ..................................................................................... 36
Figure 3-17. Simulated arc velocity. ............................................................................................. 36
Figure 3-18. Cross-sectional view of launcher bore. .................................................................... 37
Figure 3-19. Interior view of containment structure. .................................................................... 38
Figure 3-20. Disassembled CAD drawing launcher view. ........................................................... 38
Figure 3-21. CAD drawing of the distributed energy module. ..................................................... 39
Figure 3-22. Variable self-inductance concept. ............................................................................ 40
Figure 3-23. Prototype photographs. Top: view of switch and diode side. Bottom: view of capacitor bank side. ............................................................................................................... 41
Figure 3-24. Current waveforms for the prototype system. .......................................................... 42
Figure 3-25. Current distribution analysis data. ............................................................................ 43
Figure 3-26. CAD drawing of a 40-stage DES launcher. ............................................................. 44
Figure 3-27. Photograph of the containment structures. ............................................................... 45
Figure 3-28. Photograph of two rails. ........................................................................................... 45
IAT.R 0624 vi
Figure 3-29. Photograph of the PCB B-dot probe and plot of the integrated and calibrated data. 46
Figure 3-30. Photograph of PCB Rogowski coil and plot of the integrated and calibrated data. . 47
Figure 3-31. PCB armature B-dot probes. Left: two-turn design. Center: 14-turn design. Right: 28-turn design. ...................................................................................................................... 47
Figure 3-32. National Instruments DAQ system. ......................................................................... 49
Figure 3-33. Top/side view of the 40-stage DES launcher. .......................................................... 50
Figure 3-34. Photograph of the 40-stage DES launcher (isometric view). ................................... 50
Figure 3-35. Control system hardware.......................................................................................... 51
Figure 3-36. Flow chart of the control program. .......................................................................... 53
Figure 3-37. Current waveforms from a 40-stage asynchronous DES launcher experiment. ...... 54
Figure 3-38. Armature B-dot waveforms from a 40-stage asynchronous DES launcher experiment............................................................................................................................. 55
Figure 3-39. Current waveforms from a 40-stage synchronous DES launcher experiment. ........ 55
Figure 3-40. Armature B-dot waveforms from a 40-stage synchronous DES launcher experiment................................................................................................................................................ 56
Figure 3-41. Circuit diagram of the breech-fed railgun used in shot 1. ........................................ 57
Figure 3-42. Current Waveforms from a Breech-fed Railgun for Shot 1. .................................... 57
Figure 3-43. Current waveforms from a breech-fed railgun for shot 1. ....................................... 58
Figure 3-44. Circuit diagram of the breech-fed railgun used in shot 2. ........................................ 58
Figure 3-45. Current waveforms from a breech-fed railgun form shot 2. .................................... 59
Figure 3-46. Current waveforms from a breech-fed railgun from shot 2. .................................... 59
Figure 5-1. Surface energy balance. ............................................................................................. 67
Figure 5-2. Implicit/explicit overset grids used in ASCC............................................................. 68
Figure 5-3. Relationship between geodetic, geocentric, and Cartesian coordinates. The angle γ is between V and Dk . ................................................................................................................ 69
Figure 5-4. Surface discretization of aeroshell. ............................................................................ 71
Figure 5-5. Modified Newtonian lift and drag coefficients, nr = 2 cm. ........................................ 72
Figure 5-6. Typical pressure coefficient at 10 degrees AOA for elliptical and sphere-cone forebodies using the modified Newtonian method. .............................................................. 73
Figure 5-7. Aeroshell geometry for ablation study: (a) sphere-cone, (b) elliptical. ..................... 76
Figure 5-8. Mesh sensitivity study. ............................................................................................... 76
Figure 5-9. Final ablated profiles for stated launch conditions, 1R . ............................................. 77
Figure 5-10. Final ablated profiles for stated launch conditions, 2R . .......................................... 78
IAT.R 0624 vii
Figure 5-11. Final ablated profiles for stated launch conditions, 3R . ........................................... 78
Figure 5-12. Final ablated profiles for stated launch conditions, 1R . ........................................... 79
Figure 5-13. Final ablated profiles for stated launch conditions, 2R . .......................................... 79
Figure 5-14. Final ablated profiles for stated launch conditions, 3R . ........................................... 80
Figure 5-15. Velocity vs. altitude maps for projectiles studied. ................................................... 81
Figure 5-16. R2 temperature contours at 60 km. VL= 7.5 km/s: (a) 15-degree, (b) 45-degree launch angle, ballistic trajectory, TPS length = 7.75 cm. ..................................................... 83
Figure 5-17. E2 temperature contours at 60 km. VL= 7.5 km/s: (a) 15-degree, (b) 45-degree launch angle, ballistic trajectory, TPS length = 7.75 cm. ..................................................... 83
Figure 5-18. TPS centerline back wall temperature variation with TPS axial length................... 84
Figure 5-19. Ablated profiles assuming fully turbulent flow. ...................................................... 85
Figure 5-20. Propellant mass required for lifting trajectories without ablation. ........................... 86
IAT.R 0624 1
AFOSR MURI Final Report Multistage Electromagnetic and Laser Launchers for Affordable,
Rapid Access to Space
I. R. McNab1, D. A. Wetz1, F. Stefani1, D. Motes1, J. V. Parker1, M. Giesselman2, J. J. Mankowski2, R.W. Karhi2, G. V. Candler3, and M. J. Guillot4
1Institute for Advanced Technology, The University of Texas at Austin
2Texas Tech University 3The University of Minnesota
4The University of New Orleans
Executive Summary Over the past decade, there has been significantly increased interest in launching
miniaturized payloads (~1–1,000 kg) into low Earth orbit (LEO) at increased frequency. Defense and telecommunications industries would greatly benefit could the capability provide affordable access to space at increased launch frequency for miniaturized satellite payloads. In some cases, such as natural disasters or rapidly evolving military or emergency situations, a rapid response time could also be very beneficial. Despite some 50 years of development, conventional rocket launch from Earth is still very expensive for small mass payloads, with estimates ranging from $7,000–$30,000 to launch 1 kg of mass into LEO. Launch window opportunities are also often limited because small payloads are frequently added as relatively minor piggyback packages onto larger payloads that are placed on the few large boosters available from a limited number of countries (the United States, Russia, France, China, and the Ukraine). Several alternative methods have been proposed to economically launch small payloads from Earth, including light-gas guns, electromagnetic launchers, and beamed energy. The concept evaluated in this study was the use of an electromagnetic launcher to accelerate an aerodynamic projectile containing a payload to near orbital velocity (~7.8 km/s for LEO) in the launcher using a relatively high acceleration to keep the launcher length acceptable. After exiting the bore, the launch package would traverse the atmosphere on a ballistic or lifting trajectory and would be inserted into a circular orbit at the desired orbital altitude using small rocket motors. During its flight through the denser lower portion of the atmosphere, the projectile would experience very high aerodynamic heating loads, which would require the launch vehicle to incorporate a thermal protection system (TPS) to ensure that the payload survives atmospheric transit. Similarly, the launch package and payload will need to be designed to withstand launch acceleration forces.
In this research project, two major aspects of this system were evaluated: (a) methods to reach velocities close to those needed for direct launch to orbit using an electromagnetic launcher, and (b) aerothermal issues encountered by small (~10 kg) projectiles traversing the atmosphere at very high velocities (Mach numbers ~25). The first issue was studied by research groups at the Institute for Advanced Technology at The University of Texas at Austin (IAT-UT) and by Texas Tech University (TTU), while the second issue was addressed by researchers at the University of Minnesota (UMN) and the University of New Orleans (UNO).

IAT.R 0624 2
Overall, the results were encouraging but did not answer all the questions completely. The IAT-UT research showed that using plasma armatures in a magnetically augmented, ceramic-bore-lined electromagnetic launcher allowed launch velocities of ~5.2 km/s to be achieved with small projectiles (a few grams): this velocity is well above those currently being achieved with solid-armature technology in other programs. However, higher velocities could not be achieved in these experiments, most likely because of dynamic structural responses of the preexisting core containment system that was used in these experiments because of financial limitations. In contrast, a new 40-stage distributed-power-feed system built and operated at TTU showed that plasma armatures alone (with masses of only a few micrograms) could be accelerated to 14–18 km/s, thereby confirming the potential feasibility of the plasma-armature approach. The introduction of the distributed power feed into the UT launcher was started, but not completed, by the time this project ended. However, the equipment remains in place for future research should the opportunity arise.
The aerothermal studies at UMN and UNO showed that the launch of small (~10 kg) projectiles at Mach numbers >25 from sea level is very stressing. However, launch from a high-flying aircraft at ~15 km (50,000 feet) altitude appeared to be very feasible, with erosion of the projectile nosetip at very acceptable values of only a few millimeters. Optimization of the flight trajectory by aerodynamic modification of the trajectory with lifting bodies showed that the launch mass, and hence the launch energy requirements, could be minimized.
Important areas that were not addressed in this study included an evaluation of the acceleration forces on the launch package and payload. However, levels on the order of tens of thousands of standard accelerations of gravity (tens of kG) are currently being successfully demonstrated in other programs.
1 Introduction Over the last half century, thousands of satellites have been launched into orbit using well-
established rocket technology based on liquid fuels and solid propellant boosters. This approach has the advantage that the rocket starts slowly from the surface of the Earth with its full fuel load and builds up speed gradually as the fuel is burned off. It minimizes aerodynamic and aerothermal loads while providing relatively modest accelerations that can be tolerated by humans and delicate payloads. However, it comes at the cost of very large vehicles with small payload ratios and high launch costs, roughly $10,000 to $20,000 per kilogram. With advances in satellite technology over the last decade, the need to put many additional satellites into space has become a reality—but the high cost of launching limits the ability to achieve this.
One of several possible alternatives for putting small (1 to 10 kg) satellites into space could be to use electromagnetic (EM) launch technology in place of chemical propulsion. EM launch to space has been an appealing concept since the first demonstration of hypervelocity launch in the late 1970s [1], especially since the cost of “fuel”—that is, electricity—to do this job is remarkably low. For example, 1 kg launched to 8 km/s has a kinetic energy of 32 MJ. The cost of electrical energy to achieve this with an assumed electrical system efficiency of only 10%—that is, an input energy of 320 MJ—is only about ten dollars for a typical utility electricity cost of ten cents per kilowatt hour. Although this simple calculation ignores the capital cost of building the EM launcher system and the operational costs, both of which have yet to be well defined, early
IAT.R 0624 3
estimates are that moderate costs could be achieved when amortized over a reasonable number of launches [2
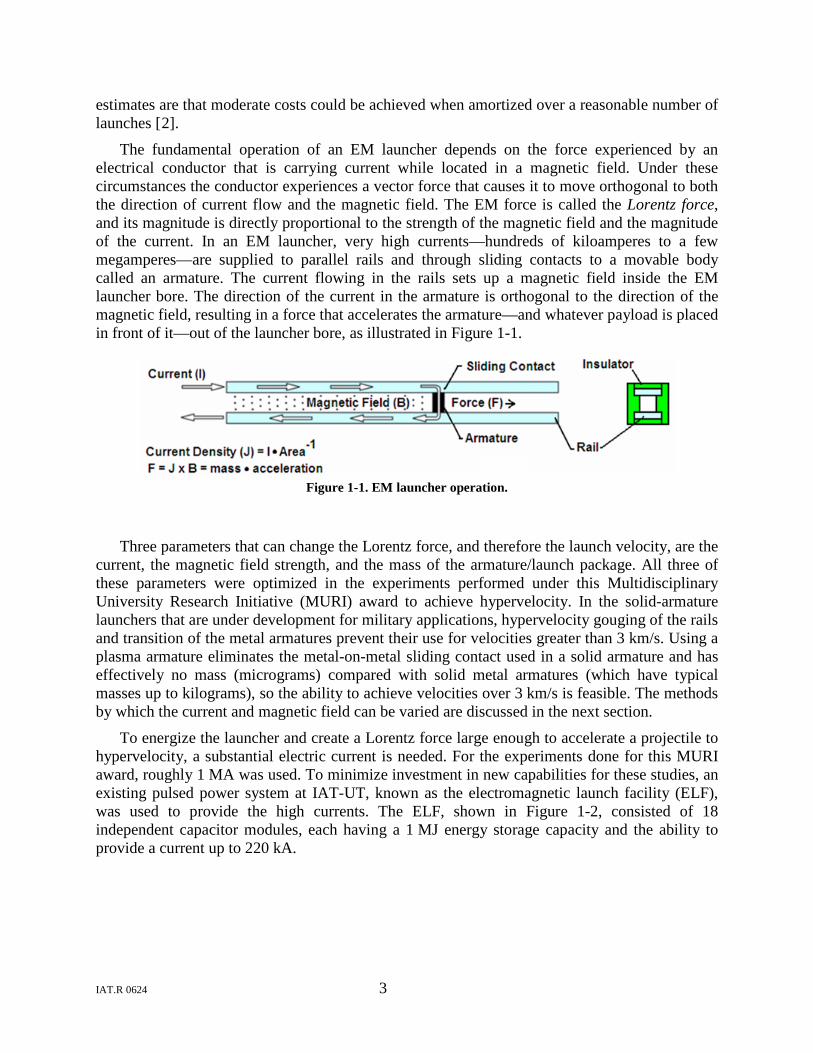
The fundamental operation of an EM launcher depends on the force experienced by an electrical conductor that is carrying current while located in a magnetic field. Under these circumstances the conductor experiences a vector force that causes it to move orthogonal to both the direction of current flow and the magnetic field. The EM force is called the Lorentz force, and its magnitude is directly proportional to the strength of the magnetic field and the magnitude of the current. In an EM launcher, very high currents—hundreds of kiloamperes to a few megamperes—are supplied to parallel rails and through sliding contacts to a movable body called an armature. The current flowing in the rails sets up a magnetic field inside the EM launcher bore. The direction of the current in the armature is orthogonal to the direction of the magnetic field, resulting in a force that accelerates the armature—and whatever payload is placed in front of it—out of the launcher bore, as illustrated in
].
Figure 1-1.
Figure 1-1. EM launcher operation.
Three parameters that can change the Lorentz force, and therefore the launch velocity, are the current, the magnetic field strength, and the mass of the armature/launch package. All three of these parameters were optimized in the experiments performed under this Multidisciplinary University Research Initiative (MURI) award to achieve hypervelocity. In the solid-armature launchers that are under development for military applications, hypervelocity gouging of the rails and transition of the metal armatures prevent their use for velocities greater than 3 km/s. Using a plasma armature eliminates the metal-on-metal sliding contact used in a solid armature and has effectively no mass (micrograms) compared with solid metal armatures (which have typical masses up to kilograms), so the ability to achieve velocities over 3 km/s is feasible. The methods by which the current and magnetic field can be varied are discussed in the next section.
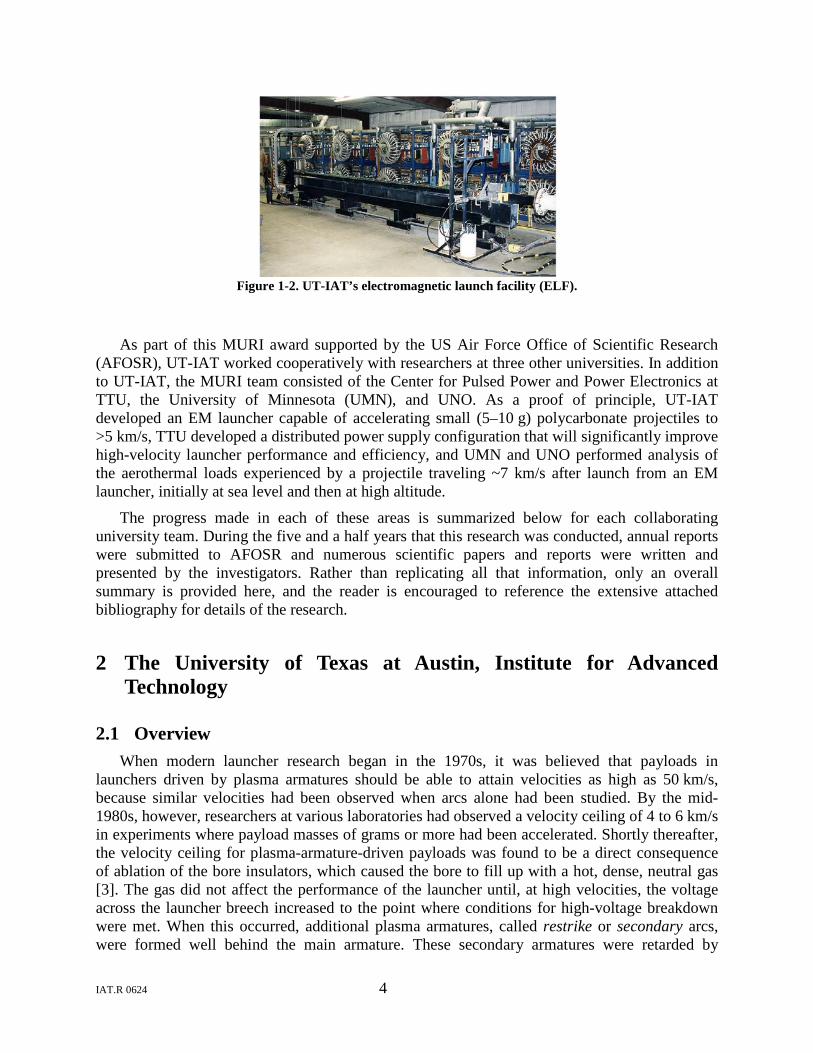
To energize the launcher and create a Lorentz force large enough to accelerate a projectile to hypervelocity, a substantial electric current is needed. For the experiments done for this MURI award, roughly 1 MA was used. To minimize investment in new capabilities for these studies, an existing pulsed power system at IAT-UT, known as the electromagnetic launch facility (ELF), was used to provide the high currents. The ELF, shown in Figure 1-2, consisted of 18 independent capacitor modules, each having a 1 MJ energy storage capacity and the ability to provide a current up to 220 kA.
IAT.R 0624 4
Figure 1-2. UT-IAT’s electromagnetic launch facility (ELF).
As part of this MURI award supported by the US Air Force Office of Scientific Research (AFOSR), UT-IAT worked cooperatively with researchers at three other universities. In addition to UT-IAT, the MURI team consisted of the Center for Pulsed Power and Power Electronics at TTU, the University of Minnesota (UMN), and UNO. As a proof of principle, UT-IAT developed an EM launcher capable of accelerating small (5–10 g) polycarbonate projectiles to >5 km/s, TTU developed a distributed power supply configuration that will significantly improve high-velocity launcher performance and efficiency, and UMN and UNO performed analysis of the aerothermal loads experienced by a projectile traveling ~7 km/s after launch from an EM launcher, initially at sea level and then at high altitude.
The progress made in each of these areas is summarized below for each collaborating university team. During the five and a half years that this research was conducted, annual reports were submitted to AFOSR and numerous scientific papers and reports were written and presented by the investigators. Rather than replicating all that information, only an overall summary is provided here, and the reader is encouraged to reference the extensive attached bibliography for details of the research.
2 The University of Texas at Austin, Institute for Advanced Technology
2.1 Overview When modern launcher research began in the 1970s, it was believed that payloads in
launchers driven by plasma armatures should be able to attain velocities as high as 50 km/s, because similar velocities had been observed when arcs alone had been studied. By the mid-1980s, however, researchers at various laboratories had observed a velocity ceiling of 4 to 6 km/s in experiments where payload masses of grams or more had been accelerated. Shortly thereafter, the velocity ceiling for plasma-armature-driven payloads was found to be a direct consequence of ablation of the bore insulators, which caused the bore to fill up with a hot, dense, neutral gas [3]. The gas did not affect the performance of the launcher until, at high velocities, the voltage across the launcher breech increased to the point where conditions for high-voltage breakdown were met. When this occurred, additional plasma armatures, called restrike or secondary arcs, were formed well behind the main armature. These secondary armatures were retarded by
IAT.R 0624 5
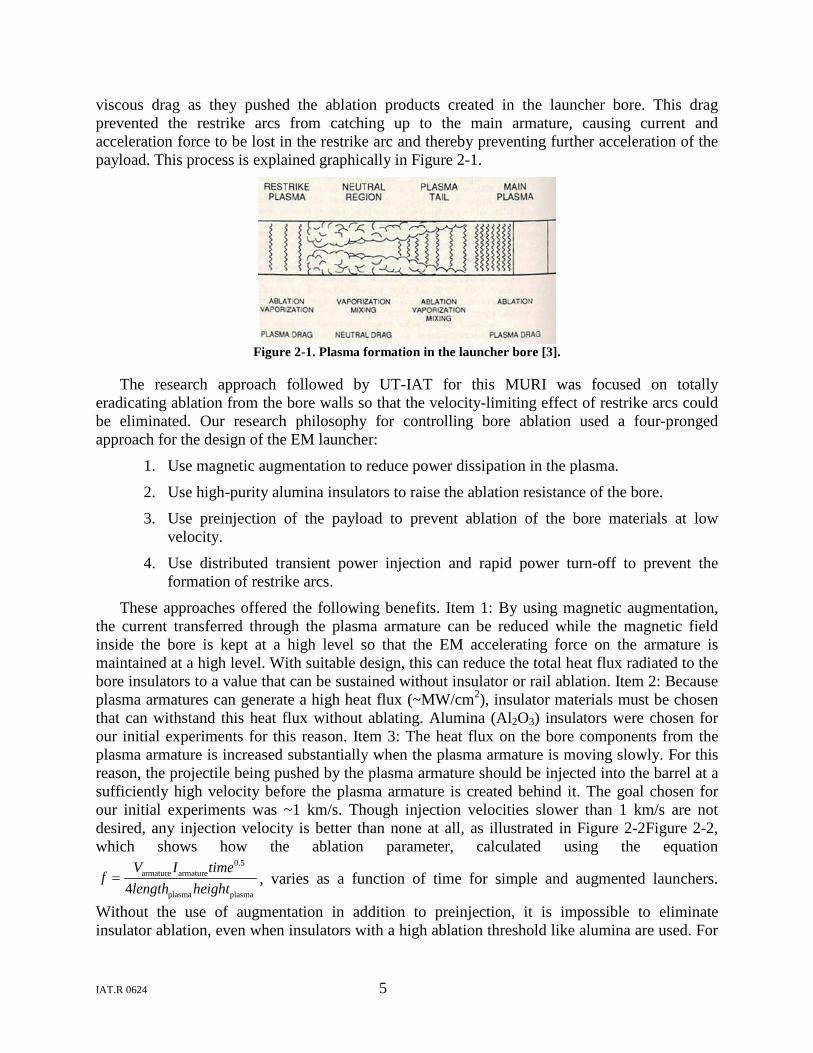
viscous drag as they pushed the ablation products created in the launcher bore. This drag prevented the restrike arcs from catching up to the main armature, causing current and acceleration force to be lost in the restrike arc and thereby preventing further acceleration of the payload. This process is explained graphically in Figure 2-1.
Figure 2-1. Plasma formation in the launcher bore [3].
The research approach followed by UT-IAT for this MURI was focused on totally eradicating ablation from the bore walls so that the velocity-limiting effect of restrike arcs could be eliminated. Our research philosophy for controlling bore ablation used a four-pronged approach for the design of the EM launcher:
1. Use magnetic augmentation to reduce power dissipation in the plasma.
2. Use high-purity alumina insulators to raise the ablation resistance of the bore.
3. Use preinjection of the payload to prevent ablation of the bore materials at low velocity.
4. Use distributed transient power injection and rapid power turn-off to prevent the formation of restrike arcs.
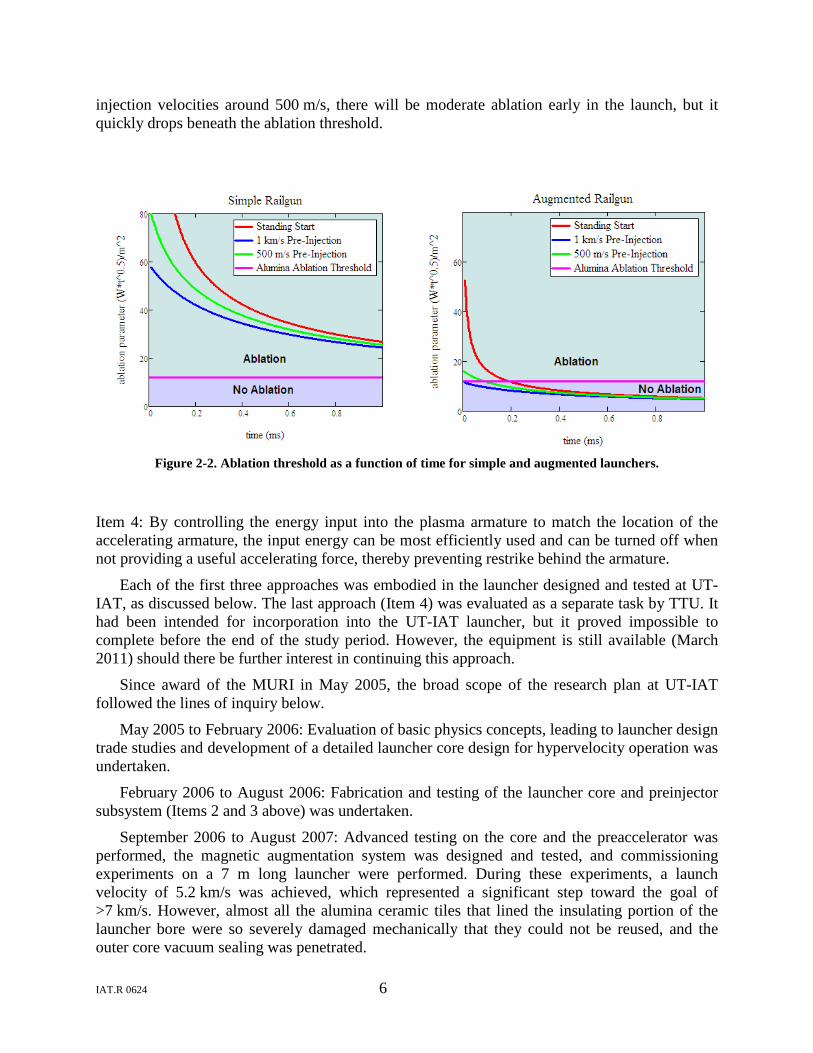
These approaches offered the following benefits. Item 1: By using magnetic augmentation, the current transferred through the plasma armature can be reduced while the magnetic field inside the bore is kept at a high level so that the EM accelerating force on the armature is maintained at a high level. With suitable design, this can reduce the total heat flux radiated to the bore insulators to a value that can be sustained without insulator or rail ablation. Item 2: Because plasma armatures can generate a high heat flux (~MW/cm2), insulator materials must be chosen that can withstand this heat flux without ablating. Alumina (Al2O3) insulators were chosen for our initial experiments for this reason. Item 3: The heat flux on the bore components from the plasma armature is increased substantially when the plasma armature is moving slowly. For this reason, the projectile being pushed by the plasma armature should be injected into the barrel at a sufficiently high velocity before the plasma armature is created behind it. The goal chosen for our initial experiments was ~1 km/s. Though injection velocities slower than 1 km/s are not desired, any injection velocity is better than none at all, as illustrated in Figure 2-2Figure 2-2, which shows how the ablation parameter, calculated using the equation
0.5armature armature
plasma plasma4=
V I timef
length height, varies as a function of time for simple and augmented launchers.
Without the use of augmentation in addition to preinjection, it is impossible to eliminate insulator ablation, even when insulators with a high ablation threshold like alumina are used. For
IAT.R 0624 6
injection velocities around 500 m/s, there will be moderate ablation early in the launch, but it quickly drops beneath the ablation threshold.
Figure 2-2. Ablation threshold as a function of time for simple and augmented launchers.
Item 4: By controlling the energy input into the plasma armature to match the location of the accelerating armature, the input energy can be most efficiently used and can be turned off when not providing a useful accelerating force, thereby preventing restrike behind the armature.
Each of the first three approaches was embodied in the launcher designed and tested at UT-IAT, as discussed below. The last approach (Item 4) was evaluated as a separate task by TTU. It had been intended for incorporation into the UT-IAT launcher, but it proved impossible to complete before the end of the study period. However, the equipment is still available (March 2011) should there be further interest in continuing this approach.
Since award of the MURI in May 2005, the broad scope of the research plan at UT-IAT followed the lines of inquiry below.
May 2005 to February 2006: Evaluation of basic physics concepts, leading to launcher design trade studies and development of a detailed launcher core design for hypervelocity operation was undertaken.
February 2006 to August 2006: Fabrication and testing of the launcher core and preinjector subsystem (Items 2 and 3 above) was undertaken.
September 2006 to August 2007: Advanced testing on the core and the preaccelerator was performed, the magnetic augmentation system was designed and tested, and commissioning experiments on a 7 m long launcher were performed. During these experiments, a launch velocity of 5.2 km/s was achieved, which represented a significant step toward the goal of >7 km/s. However, almost all the alumina ceramic tiles that lined the insulating portion of the launcher bore were so severely damaged mechanically that they could not be reused, and the outer core vacuum sealing was penetrated.

IAT.R 0624 7
September 2007 to August 2008: The launcher core was redesigned to use toughened ceramic tiles of an improved design having considerably greater stiffness for longer bore lifetime. A high-pressure assembly method for the launcher that used hydraulic cylinders to ensure full precompression of the ceramics was developed and used. Seven experiments were undertaken, and a peak velocity of 3.2 km/s was achieved. In several of those experiments, electrical breakdowns occurred across the breech and muzzle, which limited the acceleration achieved.
September 2008–August 2009: Additional modifications were made to ensure proper armature formation. Two approaches were investigated to overcome this problem—using field-enhanced electrodes at the launcher breech and introducing a fuse into the breech—but only limited success was achieved. It was also found that gas from the plasma preinjector leaked ahead of the projectile and created additional paths for the current. Changes were made to the preinjector to eliminate that problem and showed great improvements on launchers 3.2 m long.
September 2009 to December 2010: Two experiments were undertaken using the improved preinjector configuration on 7 m long launchers, but only limited success was achieved. Following the early successes with the TTU distributed-power-feed plasma launcher, modifications to the UT-IAT launcher were made to incorporate a two-stage distributed launcher configuration. However, only a few experiments were undertaken before it was discovered that the configuration of the power supply in the ELF was not appropriately designed to handle these conditions. Use of this configuration was shelved until the necessary changes to the ELF could be made. Prior to making those changes, it was apparent that more accurate modeling of this power supply was needed to ensure that no future damage could occur to the power supply (which is also used for experiments in other research programs). The last series tested in 2010 was performed using a standard build configuration and solid armatures to better calibrate the models. That series was completed successfully, and a good model was developed for use for future launch experiments.
The research from May 2005 through to August 2009 has been fully documented in annual reports to AFOSR and published papers that are referenced later in this report.
Details of key experiments undertaken in the September 2009 to December 2010 period are discussed below.
2.2 Experimental Results 2009–2010
2.2.1 UT-IAT Electromagnetic Launcher Core Design Two of UT-IAT’s three approaches to overcoming bore ablation were implemented within
the core of the launcher—namely, the use of magnetic augmentation and the use of alumina insulators. These approaches were implemented by creating a two-turn, independently augmented launcher. The outer core was a standard medium-caliber launcher (MCL) (designed and built under a prior Army program) with a bore area of 40 mm × 40 mm bounded by rails and insulators. These rails conducted a current of ~800 kA that created a large magnetic field inside what was effectively a second launcher, called the inner core. Because there was no armature to conduct the return current in the augmenting rails, a crossover (described in detail in a previous report [3]) was located at the muzzle end of the rails to carry current from the forward rail over to the return rail. The inner core structure, located inside the 40 mm × 40 mm bore, formed a
IAT.R 0624 8
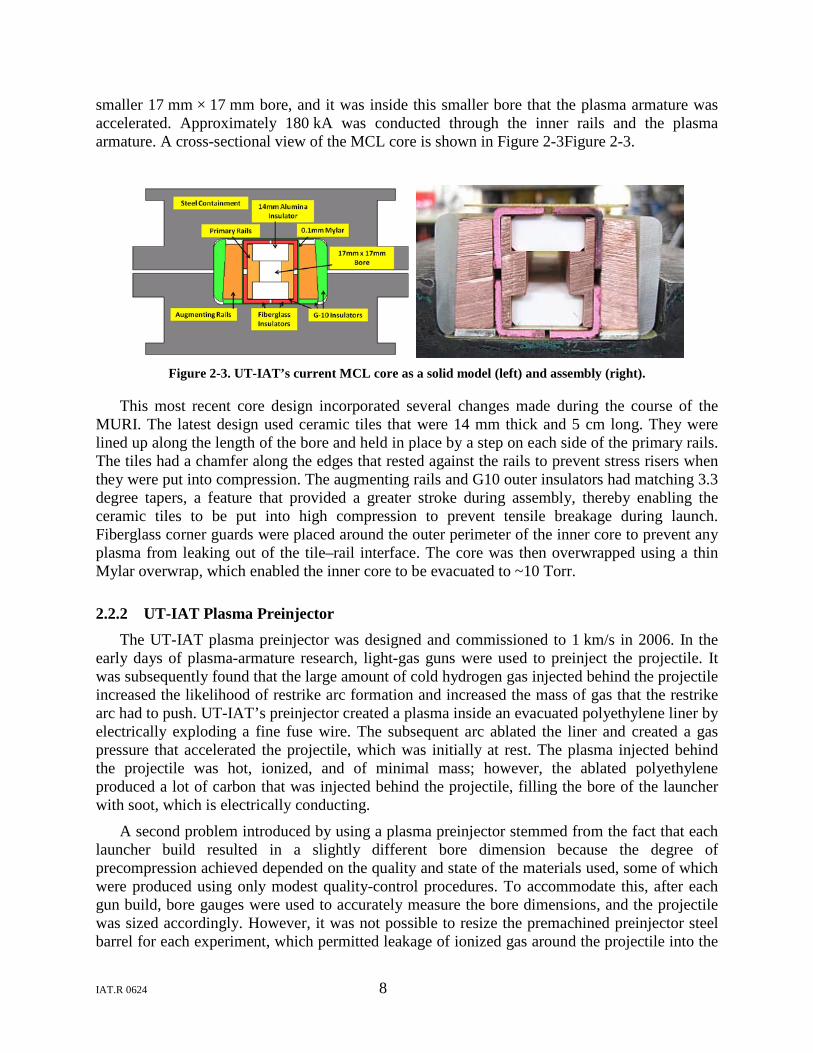
smaller 17 mm × 17 mm bore, and it was inside this smaller bore that the plasma armature was accelerated. Approximately 180 kA was conducted through the inner rails and the plasma armature. A cross-sectional view of the MCL core is shown in Figure 2-3Figure 2-3.
Figure 2-3. UT-IAT’s current MCL core as a solid model (left) and assembly (right).
This most recent core design incorporated several changes made during the course of the MURI. The latest design used ceramic tiles that were 14 mm thick and 5 cm long. They were lined up along the length of the bore and held in place by a step on each side of the primary rails. The tiles had a chamfer along the edges that rested against the rails to prevent stress risers when they were put into compression. The augmenting rails and G10 outer insulators had matching 3.3 degree tapers, a feature that provided a greater stroke during assembly, thereby enabling the ceramic tiles to be put into high compression to prevent tensile breakage during launch. Fiberglass corner guards were placed around the outer perimeter of the inner core to prevent any plasma from leaking out of the tile–rail interface. The core was then overwrapped using a thin Mylar overwrap, which enabled the inner core to be evacuated to ~10 Torr.
2.2.2 UT-IAT Plasma Preinjector The UT-IAT plasma preinjector was designed and commissioned to 1 km/s in 2006. In the
early days of plasma-armature research, light-gas guns were used to preinject the projectile. It was subsequently found that the large amount of cold hydrogen gas injected behind the projectile increased the likelihood of restrike arc formation and increased the mass of gas that the restrike arc had to push. UT-IAT’s preinjector created a plasma inside an evacuated polyethylene liner by electrically exploding a fine fuse wire. The subsequent arc ablated the liner and created a gas pressure that accelerated the projectile, which was initially at rest. The plasma injected behind the projectile was hot, ionized, and of minimal mass; however, the ablated polyethylene produced a lot of carbon that was injected behind the projectile, filling the bore of the launcher with soot, which is electrically conducting.
A second problem introduced by using a plasma preinjector stemmed from the fact that each launcher build resulted in a slightly different bore dimension because the degree of precompression achieved depended on the quality and state of the materials used, some of which were produced using only modest quality-control procedures. To accommodate this, after each gun build, bore gauges were used to accurately measure the bore dimensions, and the projectile was sized accordingly. However, it was not possible to resize the premachined preinjector steel barrel for each experiment, which permitted leakage of ionized gas around the projectile into the
IAT.R 0624 9
bore before the projectile entered it. Such ionized gas ahead of the projectile increased the likelihood of armature formation in front of the projectile.
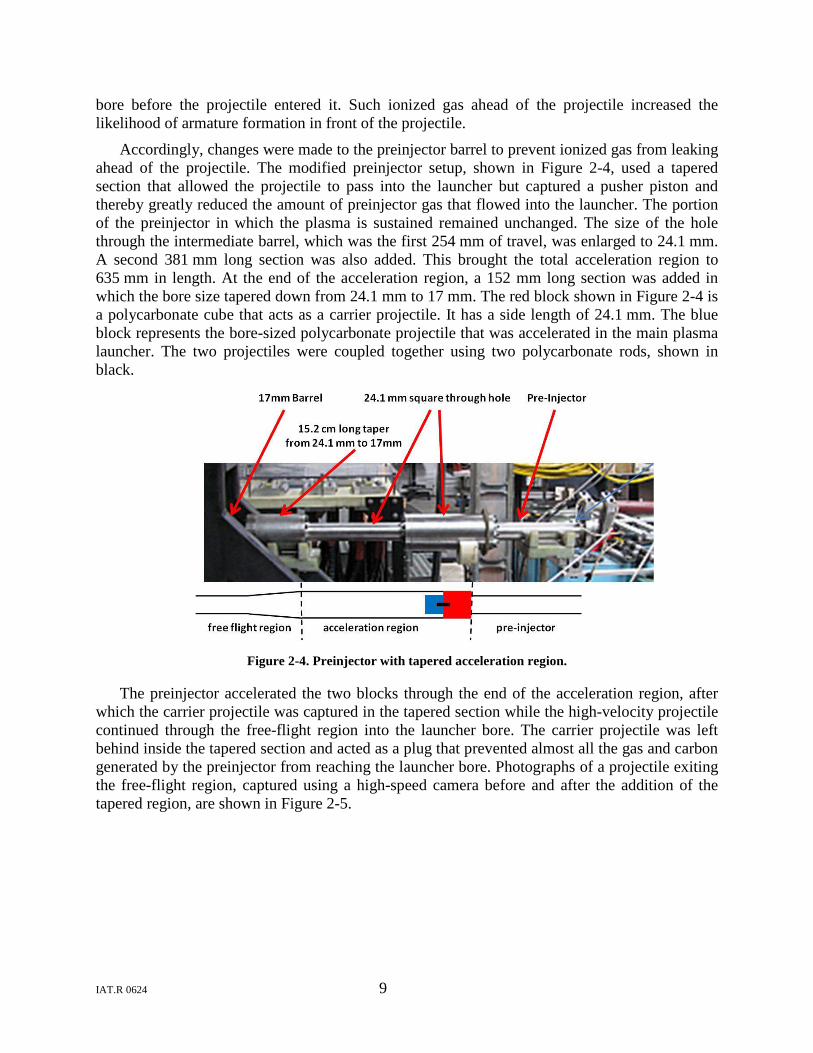
Accordingly, changes were made to the preinjector barrel to prevent ionized gas from leaking ahead of the projectile. The modified preinjector setup, shown in Figure 2-4, used a tapered section that allowed the projectile to pass into the launcher but captured a pusher piston and thereby greatly reduced the amount of preinjector gas that flowed into the launcher. The portion of the preinjector in which the plasma is sustained remained unchanged. The size of the hole through the intermediate barrel, which was the first 254 mm of travel, was enlarged to 24.1 mm. A second 381 mm long section was also added. This brought the total acceleration region to 635 mm in length. At the end of the acceleration region, a 152 mm long section was added in which the bore size tapered down from 24.1 mm to 17 mm. The red block shown in Figure 2-4 is a polycarbonate cube that acts as a carrier projectile. It has a side length of 24.1 mm. The blue block represents the bore-sized polycarbonate projectile that was accelerated in the main plasma launcher. The two projectiles were coupled together using two polycarbonate rods, shown in black.
Figure 2-4. Preinjector with tapered acceleration region.
The preinjector accelerated the two blocks through the end of the acceleration region, after which the carrier projectile was captured in the tapered section while the high-velocity projectile continued through the free-flight region into the launcher bore. The carrier projectile was left behind inside the tapered section and acted as a plug that prevented almost all the gas and carbon generated by the preinjector from reaching the launcher bore. Photographs of a projectile exiting the free-flight region, captured using a high-speed camera before and after the addition of the tapered region, are shown in Figure 2-5.
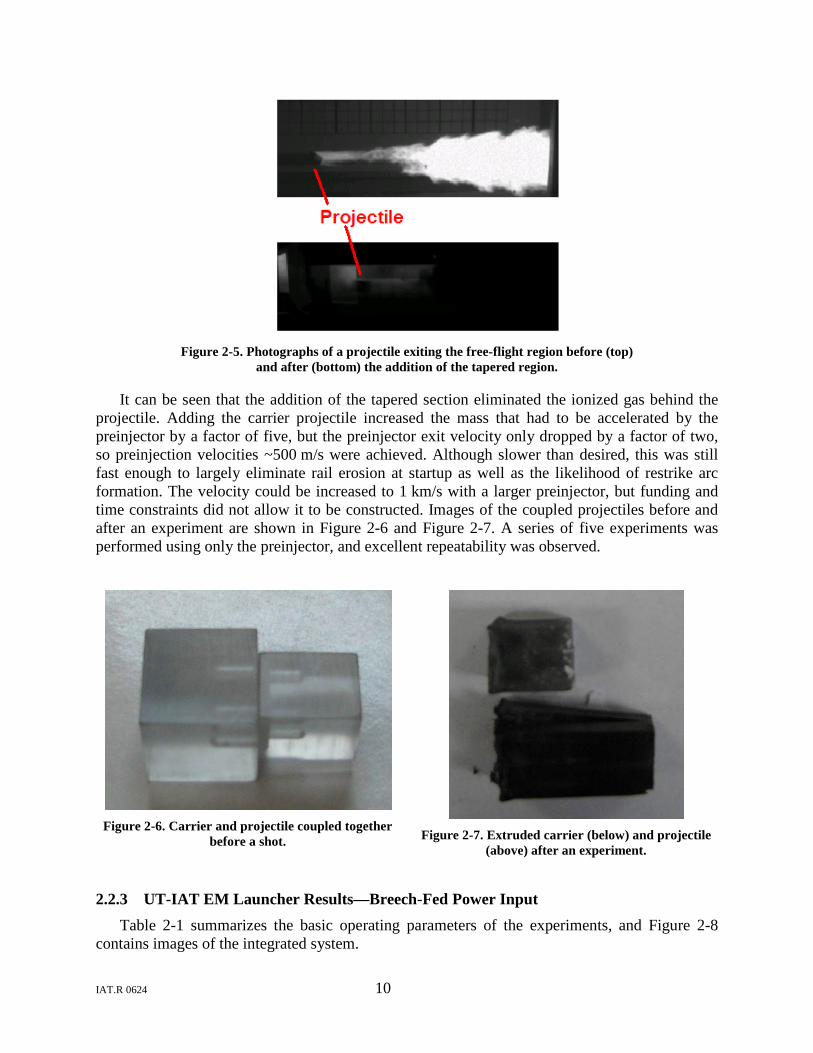
IAT.R 0624 10
Figure 2-5. Photographs of a projectile exiting the free-flight region before (top)
and after (bottom) the addition of the tapered region.
It can be seen that the addition of the tapered section eliminated the ionized gas behind the projectile. Adding the carrier projectile increased the mass that had to be accelerated by the preinjector by a factor of five, but the preinjector exit velocity only dropped by a factor of two, so preinjection velocities ~500 m/s were achieved. Although slower than desired, this was still fast enough to largely eliminate rail erosion at startup as well as the likelihood of restrike arc formation. The velocity could be increased to 1 km/s with a larger preinjector, but funding and time constraints did not allow it to be constructed. Images of the coupled projectiles before and after an experiment are shown in Figure 2-6 and Figure 2-7. A series of five experiments was performed using only the preinjector, and excellent repeatability was observed.
Figure 2-6. Carrier and projectile coupled together
before a shot.
Figure 2-7. Extruded carrier (below) and projectile
(above) after an experiment.
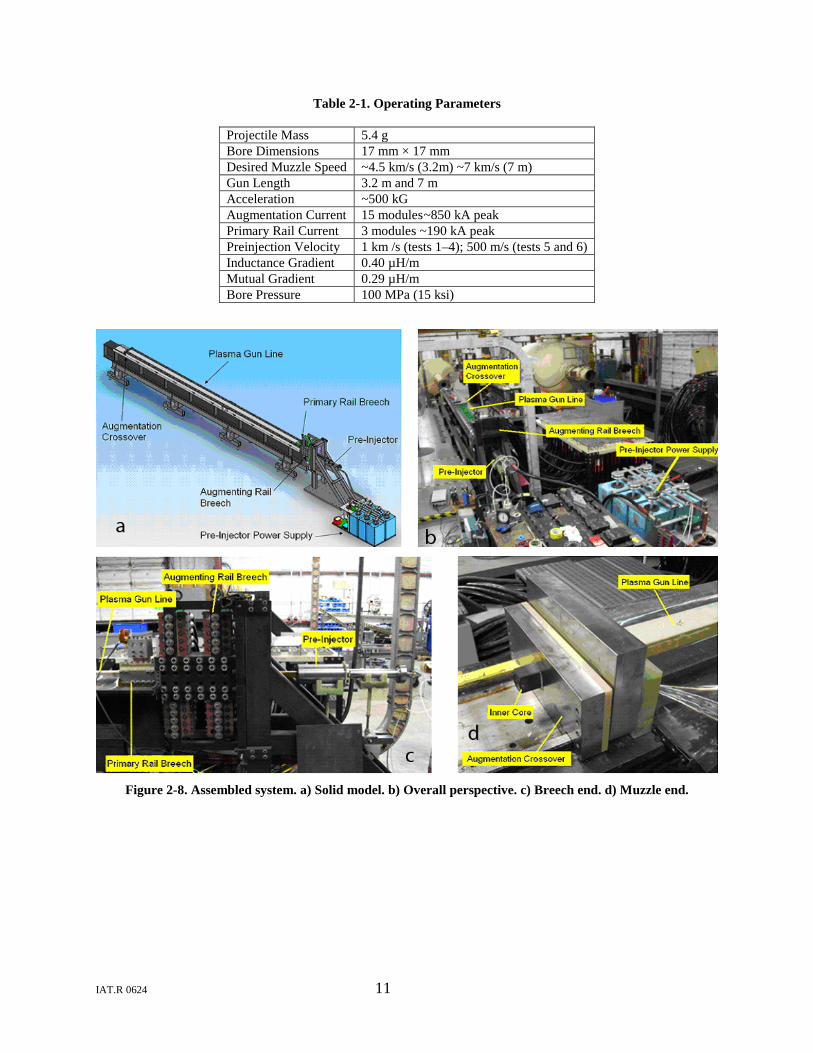
2.2.3 UT-IAT EM Launcher Results—Breech-Fed Power Input Table 2-1 summarizes the basic operating parameters of the experiments, and Figure 2-8
contains images of the integrated system.
IAT.R 0624 11
Table 2-1. Operating Parameters
Projectile Mass 5.4 g Bore Dimensions 17 mm × 17 mm Desired Muzzle Speed ~4.5 km/s (3.2m) ~7 km/s (7 m) Gun Length 3.2 m and 7 m Acceleration ~500 kG Augmentation Current 15 modules ~850 kA peak Primary Rail Current 3 modules ~190 kA peak Preinjection Velocity 1 km /s (tests 1–4); 500 m/s (tests 5 and 6) Inductance Gradient 0.40 µH/m Mutual Gradient 0.29 µH/m Bore Pressure 100 MPa (15 ksi)
Figure 2-8. Assembled system. a) Solid model. b) Overall perspective. c) Breech end. d) Muzzle end.
IAT.R 0624 12
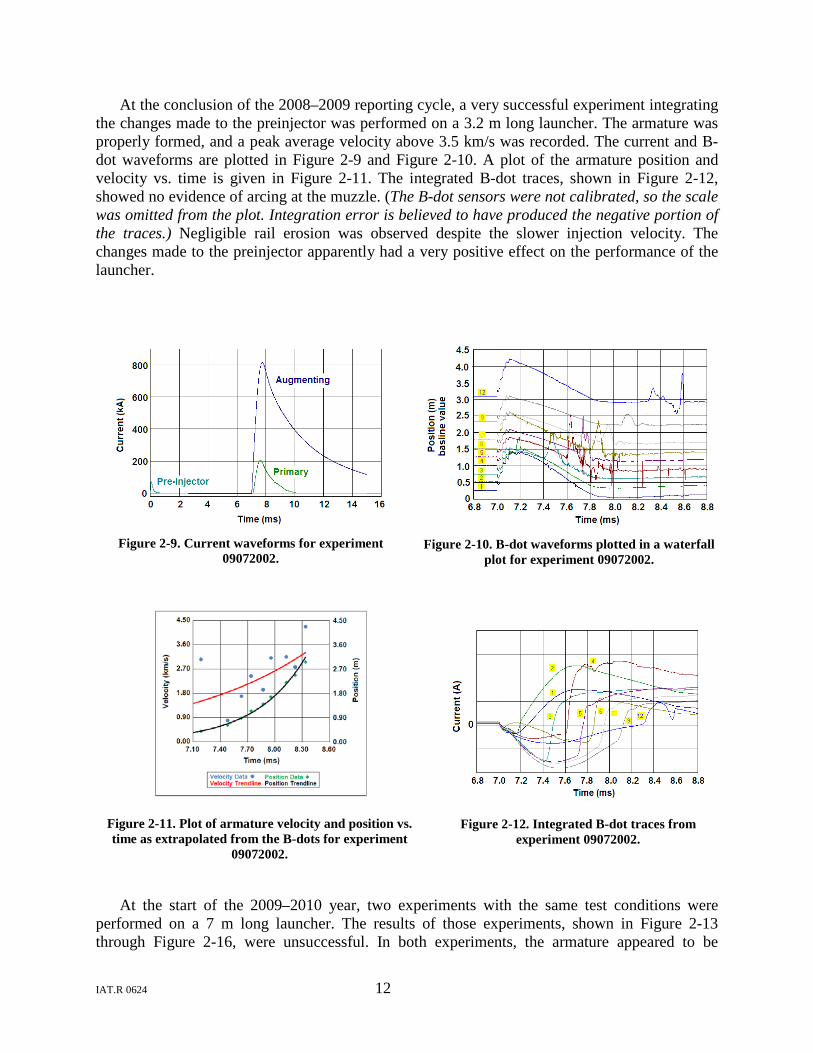
At the conclusion of the 2008–2009 reporting cycle, a very successful experiment integrating the changes made to the preinjector was performed on a 3.2 m long launcher. The armature was properly formed, and a peak average velocity above 3.5 km/s was recorded. The current and B-dot waveforms are plotted in Figure 2-9 and Figure 2-10. A plot of the armature position and velocity vs. time is given in Figure 2-11. The integrated B-dot traces, shown in Figure 2-12, showed no evidence of arcing at the muzzle. (The B-dot sensors were not calibrated, so the scale was omitted from the plot. Integration error is believed to have produced the negative portion of the traces.) Negligible rail erosion was observed despite the slower injection velocity. The changes made to the preinjector apparently had a very positive effect on the performance of the launcher.
Figure 2-9. Current waveforms for experiment
09072002.
Figure 2-10. B-dot waveforms plotted in a waterfall
plot for experiment 09072002.
Figure 2-11. Plot of armature velocity and position vs. time as extrapolated from the B-dots for experiment
09072002.
Figure 2-12. Integrated B-dot traces from experiment 09072002.
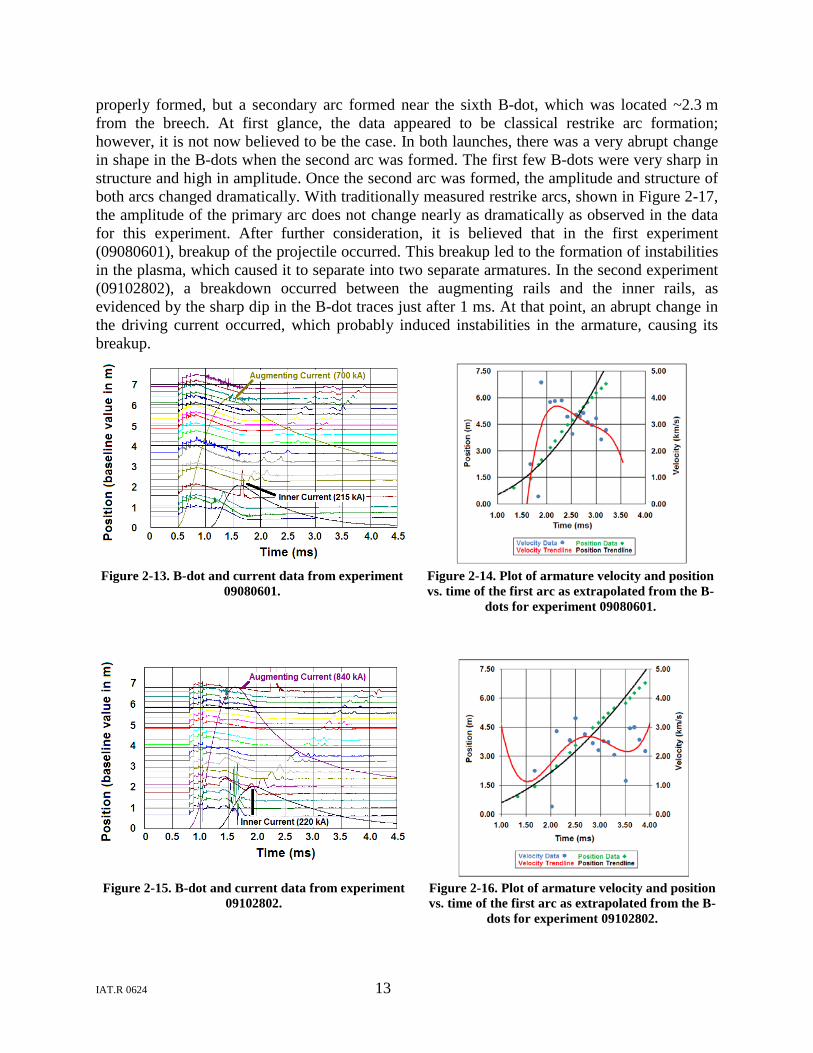
At the start of the 2009–2010 year, two experiments with the same test conditions were
performed on a 7 m long launcher. The results of those experiments, shown in Figure 2-13 through Figure 2-16, were unsuccessful. In both experiments, the armature appeared to be
IAT.R 0624 13
properly formed, but a secondary arc formed near the sixth B-dot, which was located ~2.3 m from the breech. At first glance, the data appeared to be classical restrike arc formation; however, it is not now believed to be the case. In both launches, there was a very abrupt change in shape in the B-dots when the second arc was formed. The first few B-dots were very sharp in structure and high in amplitude. Once the second arc was formed, the amplitude and structure of both arcs changed dramatically. With traditionally measured restrike arcs, shown in Figure 2-17, the amplitude of the primary arc does not change nearly as dramatically as observed in the data for this experiment. After further consideration, it is believed that in the first experiment (09080601), breakup of the projectile occurred. This breakup led to the formation of instabilities in the plasma, which caused it to separate into two separate armatures. In the second experiment (09102802), a breakdown occurred between the augmenting rails and the inner rails, as evidenced by the sharp dip in the B-dot traces just after 1 ms. At that point, an abrupt change in the driving current occurred, which probably induced instabilities in the armature, causing its breakup.
Figure 2-13. B-dot and current data from experiment
09080601. Figure 2-14. Plot of armature velocity and position vs. time of the first arc as extrapolated from the B-
dots for experiment 09080601.
Figure 2-15. B-dot and current data from experiment 09102802.
Figure 2-16. Plot of armature velocity and position vs. time of the first arc as extrapolated from the B-
dots for experiment 09102802.
IAT.R 0624 14
Figure 2-17. Previously recorded restrike arc formation.
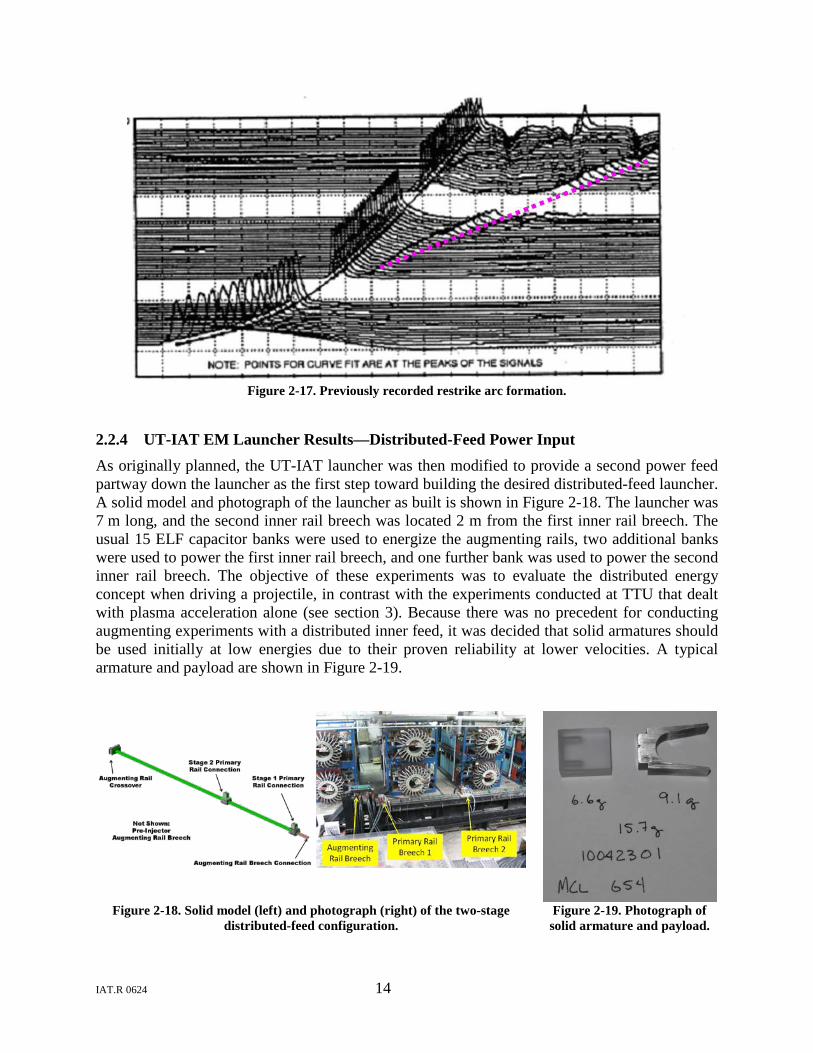
2.2.4 UT-IAT EM Launcher Results—Distributed-Feed Power Input As originally planned, the UT-IAT launcher was then modified to provide a second power feed partway down the launcher as the first step toward building the desired distributed-feed launcher. A solid model and photograph of the launcher as built is shown in Figure 2-18. The launcher was 7 m long, and the second inner rail breech was located 2 m from the first inner rail breech. The usual 15 ELF capacitor banks were used to energize the augmenting rails, two additional banks were used to power the first inner rail breech, and one further bank was used to power the second inner rail breech. The objective of these experiments was to evaluate the distributed energy concept when driving a projectile, in contrast with the experiments conducted at TTU that dealt with plasma acceleration alone (see section 3). Because there was no precedent for conducting augmenting experiments with a distributed inner feed, it was decided that solid armatures should be used initially at low energies due to their proven reliability at lower velocities. A typical armature and payload are shown in Figure 2-19.
Figure 2-18. Solid model (left) and photograph (right) of the two-stage
distributed-feed configuration. Figure 2-19. Photograph of solid armature and payload.
IAT.R 0624 15
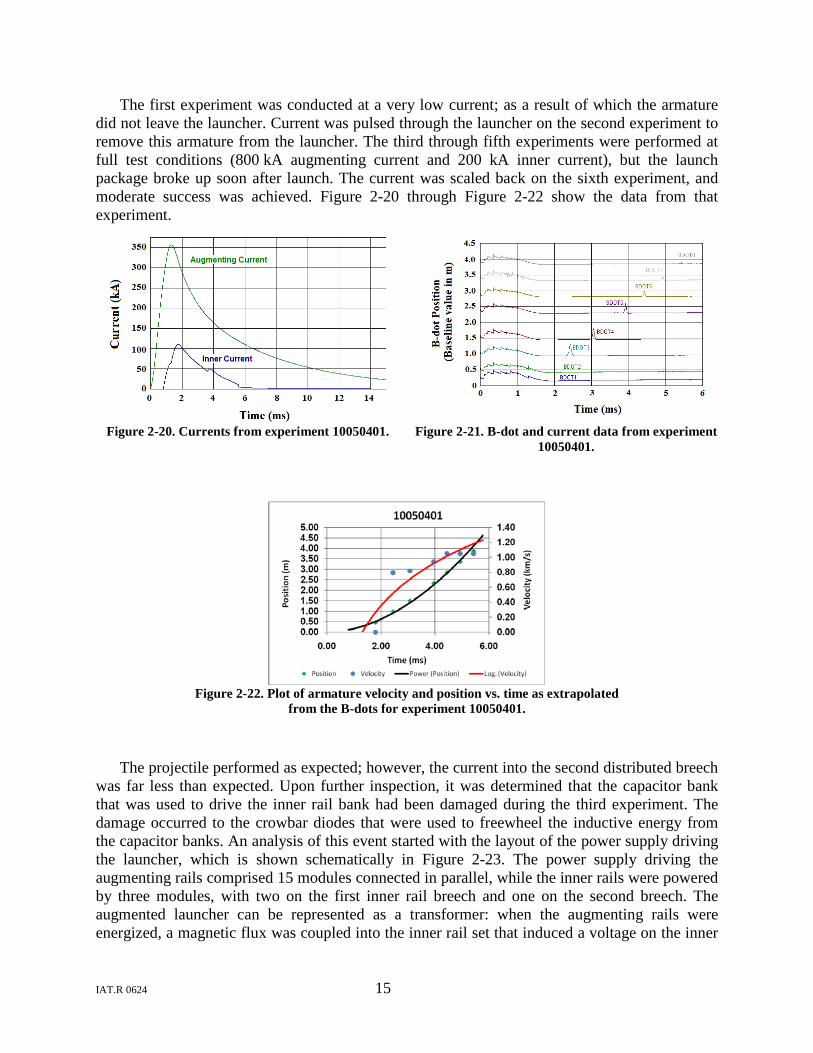
The first experiment was conducted at a very low current; as a result of which the armature did not leave the launcher. Current was pulsed through the launcher on the second experiment to remove this armature from the launcher. The third through fifth experiments were performed at full test conditions (800 kA augmenting current and 200 kA inner current), but the launch package broke up soon after launch. The current was scaled back on the sixth experiment, and moderate success was achieved. Figure 2-20 through Figure 2-22 show the data from that experiment.
Figure 2-20. Currents from experiment 10050401. Figure 2-21. B-dot and current data from experiment
10050401.
Figure 2-22. Plot of armature velocity and position vs. time as extrapolated
from the B-dots for experiment 10050401.
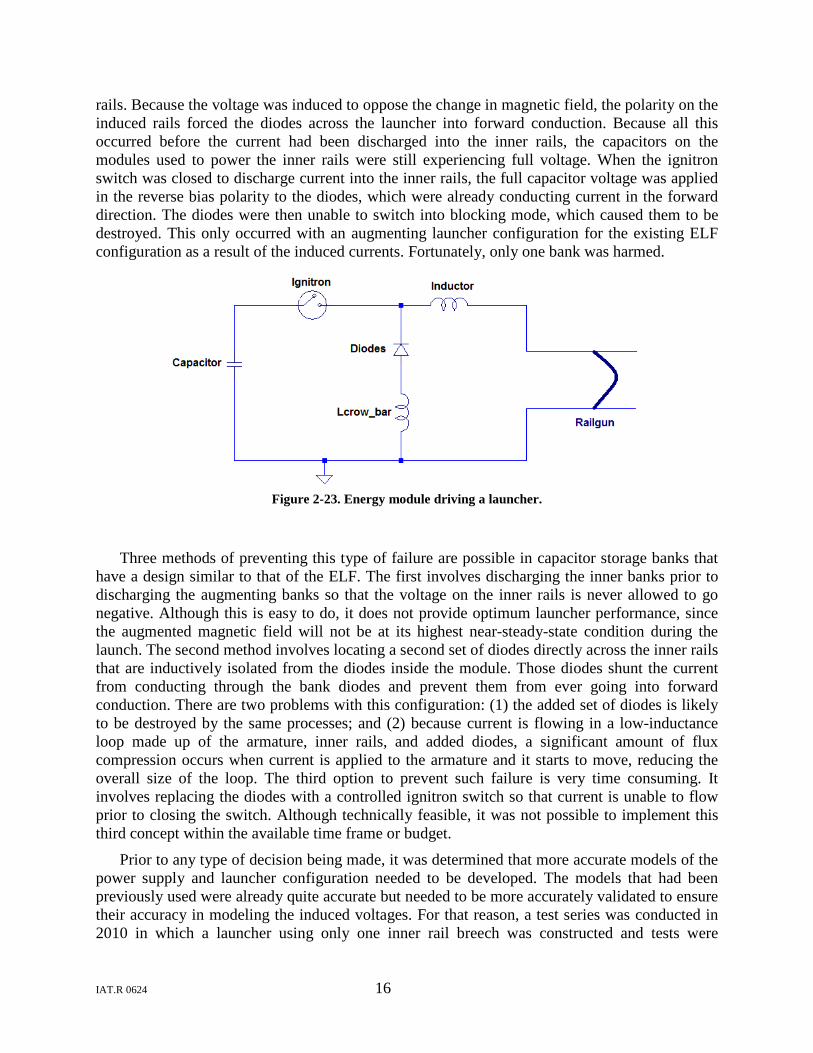
The projectile performed as expected; however, the current into the second distributed breech was far less than expected. Upon further inspection, it was determined that the capacitor bank that was used to drive the inner rail bank had been damaged during the third experiment. The damage occurred to the crowbar diodes that were used to freewheel the inductive energy from the capacitor banks. An analysis of this event started with the layout of the power supply driving the launcher, which is shown schematically in Figure 2-23. The power supply driving the augmenting rails comprised 15 modules connected in parallel, while the inner rails were powered by three modules, with two on the first inner rail breech and one on the second breech. The augmented launcher can be represented as a transformer: when the augmenting rails were energized, a magnetic flux was coupled into the inner rail set that induced a voltage on the inner
IAT.R 0624 16
rails. Because the voltage was induced to oppose the change in magnetic field, the polarity on the induced rails forced the diodes across the launcher into forward conduction. Because all this occurred before the current had been discharged into the inner rails, the capacitors on the modules used to power the inner rails were still experiencing full voltage. When the ignitron switch was closed to discharge current into the inner rails, the full capacitor voltage was applied in the reverse bias polarity to the diodes, which were already conducting current in the forward direction. The diodes were then unable to switch into blocking mode, which caused them to be destroyed. This only occurred with an augmenting launcher configuration for the existing ELF configuration as a result of the induced currents. Fortunately, only one bank was harmed.
Figure 2-23. Energy module driving a launcher.
Three methods of preventing this type of failure are possible in capacitor storage banks that have a design similar to that of the ELF. The first involves discharging the inner banks prior to discharging the augmenting banks so that the voltage on the inner rails is never allowed to go negative. Although this is easy to do, it does not provide optimum launcher performance, since the augmented magnetic field will not be at its highest near-steady-state condition during the launch. The second method involves locating a second set of diodes directly across the inner rails that are inductively isolated from the diodes inside the module. Those diodes shunt the current from conducting through the bank diodes and prevent them from ever going into forward conduction. There are two problems with this configuration: (1) the added set of diodes is likely to be destroyed by the same processes; and (2) because current is flowing in a low-inductance loop made up of the armature, inner rails, and added diodes, a significant amount of flux compression occurs when current is applied to the armature and it starts to move, reducing the overall size of the loop. The third option to prevent such failure is very time consuming. It involves replacing the diodes with a controlled ignitron switch so that current is unable to flow prior to closing the switch. Although technically feasible, it was not possible to implement this third concept within the available time frame or budget.
Prior to any type of decision being made, it was determined that more accurate models of the power supply and launcher configuration needed to be developed. The models that had been previously used were already quite accurate but needed to be more accurately validated to ensure their accuracy in modeling the induced voltages. For that reason, a test series was conducted in 2010 in which a launcher using only one inner rail breech was constructed and tests were
IAT.R 0624 17
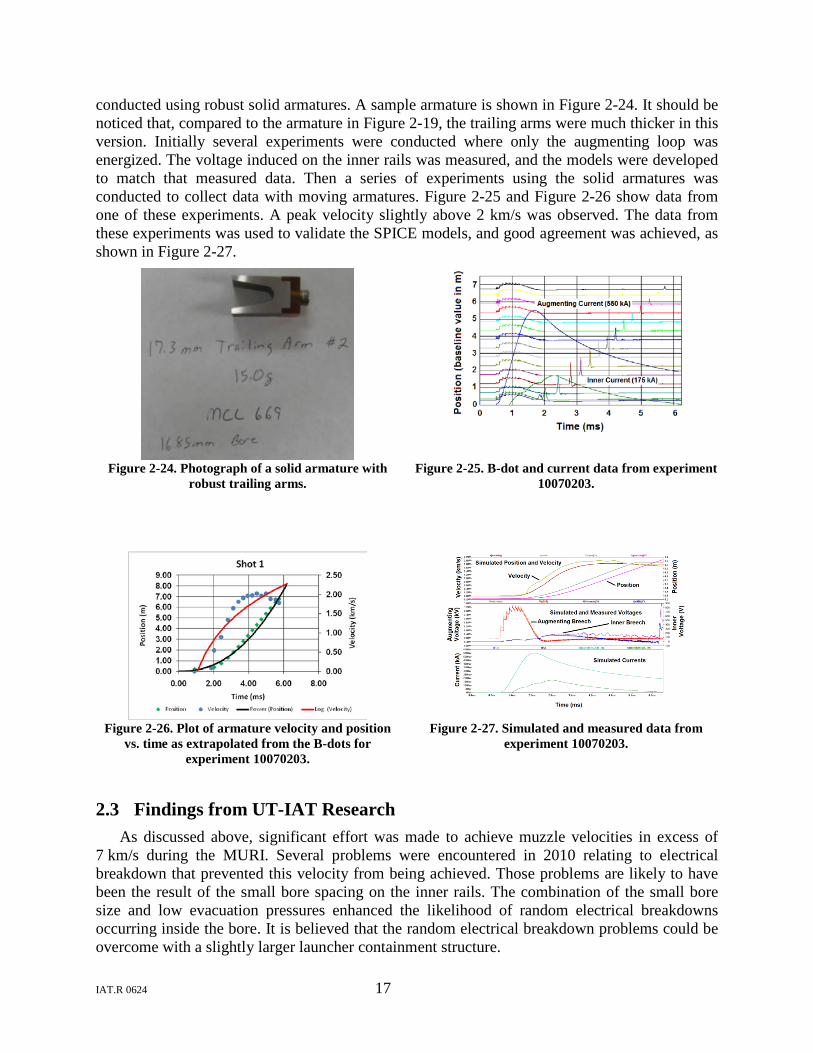
conducted using robust solid armatures. A sample armature is shown in Figure 2-24. It should be noticed that, compared to the armature in Figure 2-19, the trailing arms were much thicker in this version. Initially several experiments were conducted where only the augmenting loop was energized. The voltage induced on the inner rails was measured, and the models were developed to match that measured data. Then a series of experiments using the solid armatures was conducted to collect data with moving armatures. Figure 2-25 and Figure 2-26 show data from one of these experiments. A peak velocity slightly above 2 km/s was observed. The data from these experiments was used to validate the SPICE models, and good agreement was achieved, as shown in Figure 2-27.
Figure 2-24. Photograph of a solid armature with robust trailing arms.
Figure 2-25. B-dot and current data from experiment 10070203.
Figure 2-26. Plot of armature velocity and position vs. time as extrapolated from the B-dots for
experiment 10070203.
Figure 2-27. Simulated and measured data from experiment 10070203.
2.3 Findings from UT-IAT Research As discussed above, significant effort was made to achieve muzzle velocities in excess of
7 km/s during the MURI. Several problems were encountered in 2010 relating to electrical breakdown that prevented this velocity from being achieved. Those problems are likely to have been the result of the small bore spacing on the inner rails. The combination of the small bore size and low evacuation pressures enhanced the likelihood of random electrical breakdowns occurring inside the bore. It is believed that the random electrical breakdown problems could be overcome with a slightly larger launcher containment structure.
IAT.R 0624 18
The absence of evidence for restrike arc phenomena or bore ablation indicates that the techniques being employed by UT-IAT were successful in that regard.
In retrospect, we now believe that a critical decision that was made early in the program on financial grounds was largely responsible for the difficulties encountered. This was the decision to use the existing UT-IAT MCL. This launcher was originally designed in the mid-1990s largely on the basis of ease and rapidity of undertaking experiments. Thus, the structure was designed and fabricated so it could easily be disassembled in order that, in principle, several experiments per day could be undertaken and the gun taken apart and rebuilt between experiments. This proved to be acceptable for the experiments undertaken on solid armatures for the parameters of military research. However, a consequence of this decision that was not fully appreciated at the time was that the structure fundamentally lacked the mechanical stiffness required when the impregnated fiberglass insulation (G-10) used for the military research was replaced by the ultra-stiff ceramic tiles required to prevent ablation with plasma armatures. This is what led to the tile breakages observed and, despite the development of a very high-pressure tile loading and pressurization system, the inherent mechanical capabilities of the structure represented a fundamental limitation that could not be overcome. By the time this became apparent, there was insufficient time or funding to change the launcher structure.
2.4 UT-IAT Personnel Supported Dr. Ian R. McNab (Principal Investigator, currently UT-IAT Acting Director)
Dr. Mark Crawford (UT-IAT Associate Director)
Dr. Jerald V. Parker (Consultant to UT-IAT)
Dr. David A. Wetz (graduated with PhD from TTU in 2006 and has been working as a Research Associate at the UT-IAT since that time until his recent acceptance of an Assistant Professorship at the University of Texas in Arlington).
Dr. Francis Stefani (UT-IAT staff member since 1996; graduated with PhD from UT in 2008 and currently working as a research scientist at UT-IAT)
Dr. Scott Levinson (UT-IAT staff member)
Doyle Motes (MS from UT in 2008 and pursuing a PhD at UT)
Professor Janet Ellzey, UT
M. Alonzo (UT student)
T. Klatt (UT student)
Dr. J. Elwell, Draper Laboratories
Technical support staff
IAT.R 0624 19
3 Texas Tech University
3.1 Overview The Center for Pulsed Power and Power Electronics at TTU developed and investigated
distributed energy source (DES) concepts applicable to hypervelocity EM launch systems. The goal was to identify issues and verify theoretical concepts before implementation onto a full-scale system. A DES concept is attractive for a number of reasons:
(1) Theoretically predicted to suppress restrike arc formation. (2) Proven to increase energy conversion efficiency vs. a breech-fed configuration [4(3) Ability to tailor the projectile acceleration (soft launch and constant acceleration).
].
(4) Multiple stages reduce the switch current-carrying requirements.
Although Marshall [5] is credited with the DES launcher concept, the theoretical analysis and mathematical background of restrike arc prevention was developed at Los Alamos National Laboratory in the late 1980s by Parker [6
The second benefit of the DES system is increased energy conversion efficiency vs. a breech-fed configuration, which becomes increasingly important when launcher lengths exceed a few meters. Since the projected satellite payload will inherently contain electronics prone to failure by excessive acceleration forces, a launcher of considerable length becomes a critical requirement to minimize the acceleration forces. For applications where launcher lengths greater than 10 m are required (as is likely to be the case here), sustaining energy store simulations show energy conversion efficiency in excess of 60 percent [
]. The primary objective of the TTU research team within the MURI effort was to examine Parker’s theoretical concept through basic research. This involved the construction and experimental study of a synchronously driven DES EM launch system to obtain appropriate data in effort to prove/disprove the underlying theory.
7
The first task addressed during 2005–2006 was to develop a low-energy, solid-armature DES launcher to serve as a proof-of-principle experiment and determine the control system requirements. A 16 kJ, five-stage pseudo-asynchronous DES launcher was designed, built, and tested. Use of a solid armature was advantageous because of its fixed length and ~150 m/s velocity. Experimentation with the system led the TTU research group to the conclusion that a real-time feedback control system was required. After proving the DES principle with solid armatures, the research shifted to experiments testing free-running plasma armatures. This technique allowed for more realistic armature velocities, in excess of 6 km/s, without requiring a large stored energy facility. The higher velocity was achieved through the use of a low-mass (microgram) plasma armature in place of the heavier solid armature.
].
During 2006–2007, development of the free-running arc DES launcher called for the design and construction of a completely new system to operate in the hypervelocity regime. System modifications included:
a) A vacuum chamber containment structure (∼1–10 Torr). b) A plasma source to create the armature. c) Increased rail and stage lengths. d) Energy sources that produced a larger current magnitude with a shortened pulse
width. e) A real-time feedback control system.
IAT.R 0624 20
As a result, a 15 kJ, four-stage free-running arc DES launcher was developed that allowed three different switching or energy concepts to be examined: breech-fed, pseudo-asynchronous, and pseudo-synchronous. To intentionally create restrike arcs for analysis, highly ablating G-10 bore insulators were utilized. Although classical restrike was observed for the breech-fed configuration, both pseudo-asynchronous and pseudo-synchronous concepts suppressed the phenomenon. However, analysis of these data collected from the latter energy concepts revealed an unusual current diversion away from the primary arc, with observed characteristics that were not similar to restrike.
Upon further examination during 2007–2008, alternative diagnostics provided supporting evidence that the restrike phenomenon was not responsible for this current diversion. Instead of restrike, the current diversion was attributed to a secondary arc formed by plasma arc splitting at the distributed current injection locations. This problem was resolved by waiting until the full length of the armature was ahead of the distributed-feed location before the release of energy, maintaining magnetic pressure behind the plasma body. Knowledge of the plasma-armature length was determined to be an important parameter to correctly time the triggering of distributed stages. An initiative to accurately calculate the length was undertaken using optical diagnostics that were integrated into a two-stage DES system at five different locations along the launcher bore. These data revealed a luminosity gradient along the length of the plasma-armature body, suggesting a hot, dense, compact plasma-armature head followed by a cooler, less dense plasma body/tail region. As expected, the armature length grew when the background pressure was increased. When conditions for arc splitting were applied, the length was found to fluctuate near the DES feed location. This fluctuation is believed to be a perturbation of the plasma by gradient magnetic pressures near the distributed feeds. The final objective during 2007–2008 was to begin the design of a 40-stage synchronous free-running arc DES launcher. A computer simulation was developed to determine the necessary component values for each stage. The code neglected complex plasma physics and was developed in accordance with derived circuit equations for a distributed energy model.
During 2008–2009, development of the 40-stage DES system was started. The computer simulation provided the pulsed power requirements but lacked information to design the physical components such as the launcher, support structure, and diagnostics. These remaining system components were designed in collaboration with UT-IAT. After all the system components were designed, the TTU and UT-IAT teams concluded that it was necessary to build and test a prototype system resembling the first seven stages before progression to the complete 40-stage system. The objectives of the prototype were to design, built, and test:
a) A 7-stage DES launcher with successful arc propagation towards the muzzle. b) A containment structure capable of maintaining low pressures (mTorr). c) A bore compression technique to suppress plasma leakage. d) A flange to couple multiple containment structures together while maintaining vacuum
and bore compression. e) Distributed energy modules capable of sourcing 10kA with a 100 µs pulse width. f) Precision diagnostics including B-dot probes and Rogowski coils.
The overall design proved to be feasible and functioned correctly and all of the above objectives were accomplished. The last objective of 2009 was the expansion of the prototype to a 40-stage system. This required fabricating and purchasing thousands of system components which all required assembly and testing.

IAT.R 0624 21
During 2009–2010, construction of the 40-stage DES launcher was completed and tested. TTU did not attempt to erect all 40 stages initially because of possible catastrophic system failure in the event of a large number of the energy modules misfiring. Instead, the system was erected by adding five-stage increments in order to isolate problematic components. This preliminary testing highlighted necessary modifications to some system components to achieve 40 operational stages. Additionally, a breech-fed energy concept was tested to prove or disprove the effectiveness of a DES system to suppress the plasma restrike phenomenon.
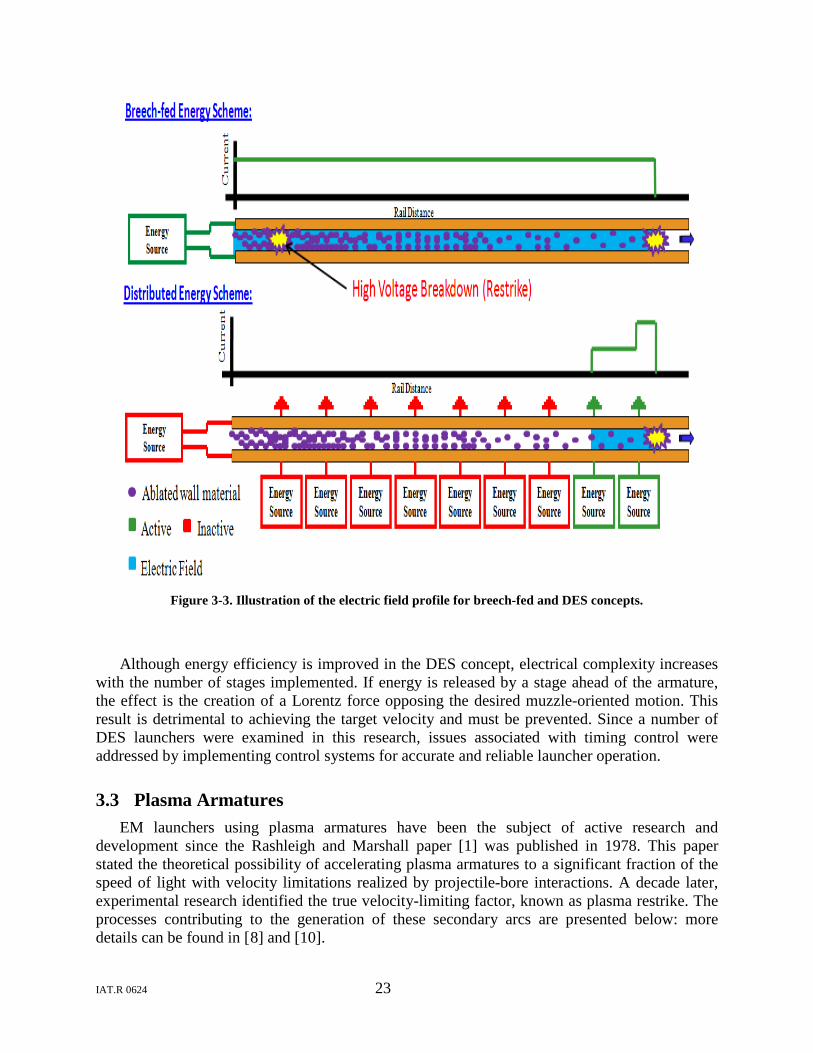
3.2 Distributed Energy Store Concept Two main energy concepts are discussed in this section of the report, so it is worthwhile to
explain their differences. One is the breech-fed energy concept, and the other is the DES concept. An explanation of the breech-fed energy concept is addressed first since it is the simpler of the two.
In a breech-fed energy concept (Figure 3-1) electrical energy is applied to the breech end of the rails using a single energy source. The input current flows in a loop through both rails and the armature. For maximum energy efficiency, all the electrical energy would be converted into kinetic energy to drive the armature. In reality, there are several loss mechanisms in this configuration, primarily associated with Joule heating and rail inductance. The Joule heating resistive losses occur in the rails and armature and are determined by the rail conductivity and geometry. As the armature travels farther away from the breech, the current must flow through an increasing length of rail. The result is a larger resistance and larger power losses. The second dominant loss mechanism is associated with rail inductance. About half of the input energy is converted into magnetic energy that is stored in the inductor formed by the rail geometry. As the current flows through an increasing rail length, more of the electrical input energy is converted and stored magnetically. The combination of these loss mechanisms results in poor energy efficiency for breech-fed systems with long rails.
Figure 3-1. Breech-fed energy concept.
To reduce energy losses, Marshall [5] proposed a new launcher configuration in 1981 known as the DES concept (Figure 3-2). For the breech-fed concept, a single current loop exists that grows in length with the armature motion, all the way down to the muzzle. The DES concept maintains continuous rails but creates multiple current loops that flow through reduced rail distances. This is accomplished by replacing the large breech-fed energy source with many
IAT.R 0624 22
smaller independent energy sources known as distributed energy stores, which are electrically connected to the rails at different locations along the rail length. The combination of a single DES and the length of rail between it and the subsequent DES is known as a “stage” within the system. Each of these stages produces short current pulses behind the armature to maintain a Lorentz driving force. The short current pulses sourced from each stage flow through a small portion of the rail length, thereby reducing the inductive and resistive energy losses. Additional advantages of this approach include improved current waveform control, reduced switch current-carrying requirements, and a reduced electric field several bore diameters behind the armature.
Figure 3-2. Distributed energy store concept.
In 1989, Parker [6] theorized an additional advantage of the DES concept. During his research analyzing the formation of restrike arcs within plasma-armature launchers, he concluded that restrike was an electrical breakdown that requires an electric field across the rails. His experiments also discovered that these restrike arcs developed many bore diameters behind the primary plasma armature. He suggested several solutions to suppress restrike, including the DES approach, where the electric field associated with the back electromotive force (EMF) voltage is localized only to active stage regions (Figure 3-3). This reduces the probability of an electrical breakdown in the dense ablated gas trailing behind the armature. Due to the reduction of plasma-armature EM launcher research in the 1980s, this theory was never experimentally tested for legitimacy.
IAT.R 0624 23
Figure 3-3. Illustration of the electric field profile for breech-fed and DES concepts.
Although energy efficiency is improved in the DES concept, electrical complexity increases with the number of stages implemented. If energy is released by a stage ahead of the armature, the effect is the creation of a Lorentz force opposing the desired muzzle-oriented motion. This result is detrimental to achieving the target velocity and must be prevented. Since a number of DES launchers were examined in this research, issues associated with timing control were addressed by implementing control systems for accurate and reliable launcher operation.
3.3 Plasma Armatures EM launchers using plasma armatures have been the subject of active research and
development since the Rashleigh and Marshall paper [1] was published in 1978. This paper stated the theoretical possibility of accelerating plasma armatures to a significant fraction of the speed of light with velocity limitations realized by projectile-bore interactions. A decade later, experimental research identified the true velocity-limiting factor, known as plasma restrike. The processes contributing to the generation of these secondary arcs are presented below: more details can be found in [8 10] and [ ].
IAT.R 0624 24
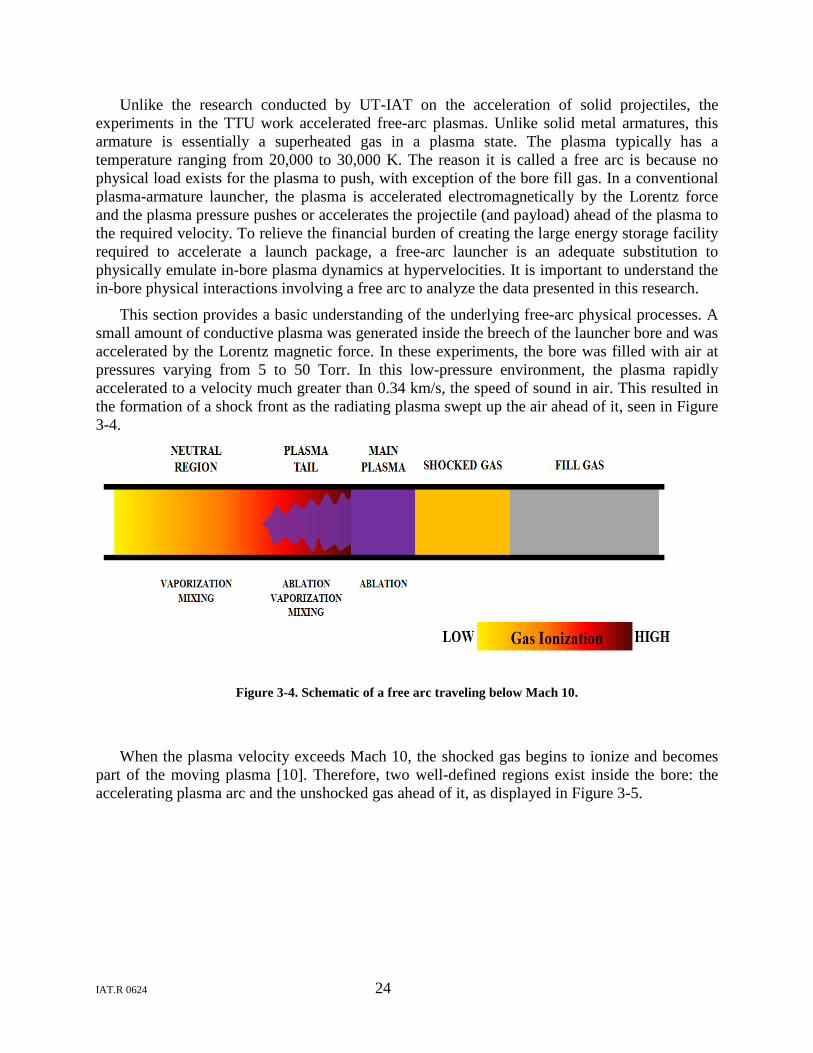
Unlike the research conducted by UT-IAT on the acceleration of solid projectiles, the experiments in the TTU work accelerated free-arc plasmas. Unlike solid metal armatures, this armature is essentially a superheated gas in a plasma state. The plasma typically has a temperature ranging from 20,000 to 30,000 K. The reason it is called a free arc is because no physical load exists for the plasma to push, with exception of the bore fill gas. In a conventional plasma-armature launcher, the plasma is accelerated electromagnetically by the Lorentz force and the plasma pressure pushes or accelerates the projectile (and payload) ahead of the plasma to the required velocity. To relieve the financial burden of creating the large energy storage facility required to accelerate a launch package, a free-arc launcher is an adequate substitution to physically emulate in-bore plasma dynamics at hypervelocities. It is important to understand the in-bore physical interactions involving a free arc to analyze the data presented in this research.
This section provides a basic understanding of the underlying free-arc physical processes. A small amount of conductive plasma was generated inside the breech of the launcher bore and was accelerated by the Lorentz magnetic force. In these experiments, the bore was filled with air at pressures varying from 5 to 50 Torr. In this low-pressure environment, the plasma rapidly accelerated to a velocity much greater than 0.34 km/s, the speed of sound in air. This resulted in the formation of a shock front as the radiating plasma swept up the air ahead of it, seen in Figure 3-4.
Figure 3-4. Schematic of a free arc traveling below Mach 10.
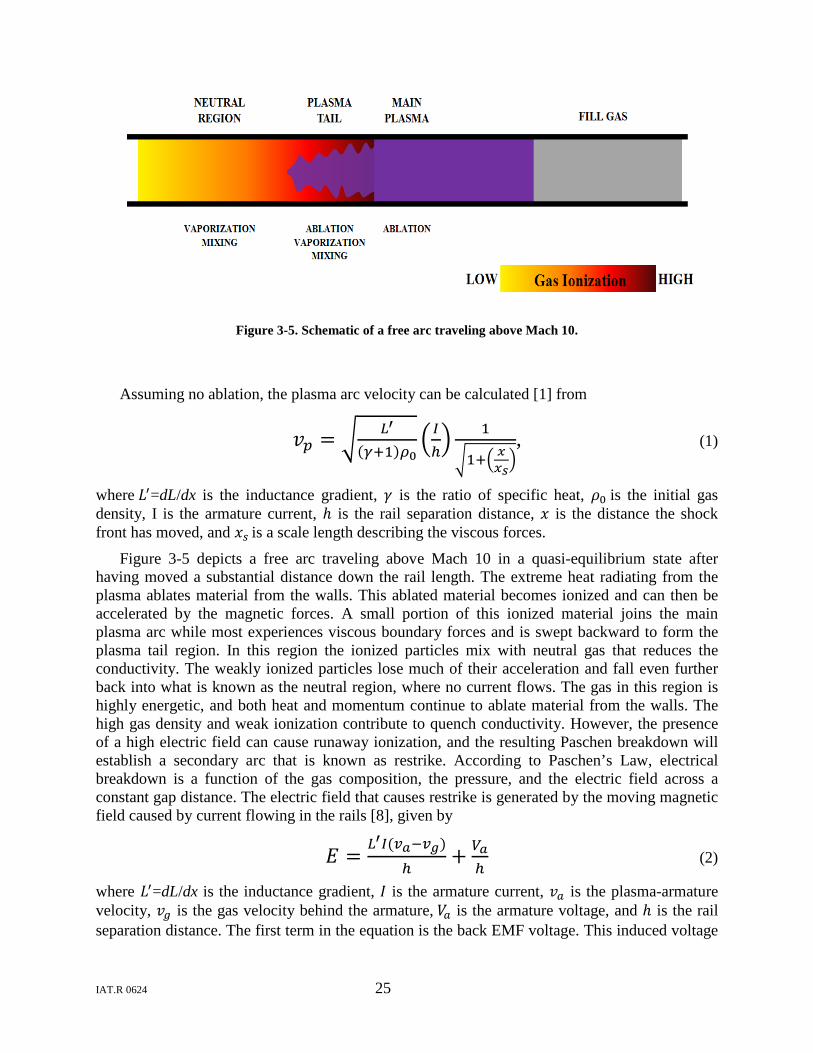
When the plasma velocity exceeds Mach 10, the shocked gas begins to ionize and becomes part of the moving plasma [10]. Therefore, two well-defined regions exist inside the bore: the accelerating plasma arc and the unshocked gas ahead of it, as displayed in Figure 3-5.
IAT.R 0624 25
Figure 3-5. Schematic of a free arc traveling above Mach 10.
Assuming no ablation, the plasma arc velocity can be calculated [1] from
𝑣𝑝 = 𝐿′
(𝛾+1)𝜌0𝐼ℎ 1
1+ 𝑥𝑥𝑠, (1)
where 𝐿′=dL/dx is the inductance gradient, 𝛾 is the ratio of specific heat, 𝜌0 is the initial gas density, I is the armature current, ℎ is the rail separation distance, 𝑥 is the distance the shock front has moved, and 𝑥𝑠 is a scale length describing the viscous forces.
Figure 3-5 depicts a free arc traveling above Mach 10 in a quasi-equilibrium state after having moved a substantial distance down the rail length. The extreme heat radiating from the plasma ablates material from the walls. This ablated material becomes ionized and can then be accelerated by the magnetic forces. A small portion of this ionized material joins the main plasma arc while most experiences viscous boundary forces and is swept backward to form the plasma tail region. In this region the ionized particles mix with neutral gas that reduces the conductivity. The weakly ionized particles lose much of their acceleration and fall even further back into what is known as the neutral region, where no current flows. The gas in this region is highly energetic, and both heat and momentum continue to ablate material from the walls. The high gas density and weak ionization contribute to quench conductivity. However, the presence of a high electric field can cause runaway ionization, and the resulting Paschen breakdown will establish a secondary arc that is known as restrike. According to Paschen’s Law, electrical breakdown is a function of the gas composition, the pressure, and the electric field across a constant gap distance. The electric field that causes restrike is generated by the moving magnetic field caused by current flowing in the rails [8], given by
𝐸 = 𝐿′𝐼(𝑣𝑎−𝑣𝑔)ℎ
+ 𝑉𝑎ℎ
(2)
where 𝐿′=dL/dx is the inductance gradient, 𝐼 is the armature current, 𝑣𝑎 is the plasma-armature velocity, 𝑣𝑔 is the gas velocity behind the armature, 𝑉𝑎 is the armature voltage, and ℎ is the rail separation distance. The first term in the equation is the back EMF voltage. This induced voltage
IAT.R 0624 26
is a consequence of changing magnetic flux and is a function of the armature velocity. Therefore, an armature traveling at a hypervelocity can generate a back EMF large enough to exceed the breakdown voltage across the rail gap.
3.4 Synchronous Electromagnetic Launcher Design During the research summarized below, two different current waveform profiles were
implemented on a DES concept. The first was termed synchronous and the second asynchronous. The term synchronous refers to the speed of an electromagnetic wave in the inductance-capacitance (LC) transmission line formed by the rails and capacitors being matched to the velocity of the armature. A synchronous distributed energy system is theorized to prevent restrike by reducing the breech voltage, which is a function of arc velocity, to a magnitude below the high-voltage breakdown threshold. The electric field associated with this breech voltage is generated by the moving magnetic field emanating from the rails, Eq. 1.4. Examining this equation, the armature current can be carefully chosen such that the rail current in critical sections of the launcher can be near zero. This is accomplished by underdamping the DESs to provide negative current. An asynchronous DES concept does not match the armature and phase velocities and in addition, does not allow current reversal to take place on any of the energy banks.
The two concepts are similar in that both implement the technique of distributed energy to increase efficiency and reduce the trailing electric field. However, according to the electric field equation (2), the synchronous concept will be more effective. Current reversal in a synchronous arrangement effectively cancels the residual positive current remaining in regions many bore diameters behind the main plasma arc. Elimination of this current does not fully quench the E-field, but it reduces the magnitude to prevent restrike.
3.5 TTU Electromagnetic Launcher Results
3.5.1 Preliminary Solid Armature Experiments with a Five-Stage Distributed Energy Launcher
The initial research task was to develop a low-energy, solid-armature DES launcher to serve as a proof-of-principle experiment and determine the control system requirements. A 16 kJ, five-stage DES launcher was designed, built, and tested. Use of a solid armature was advantageous because of its fixed length and ~150 m/s velocity. The control system functioned to accurately time the release of stored energy once the armature was completely within a specific stage. A photograph of the system is shown in Figure 3-6. For a complete experimental setup description, refer to Karhi [9].
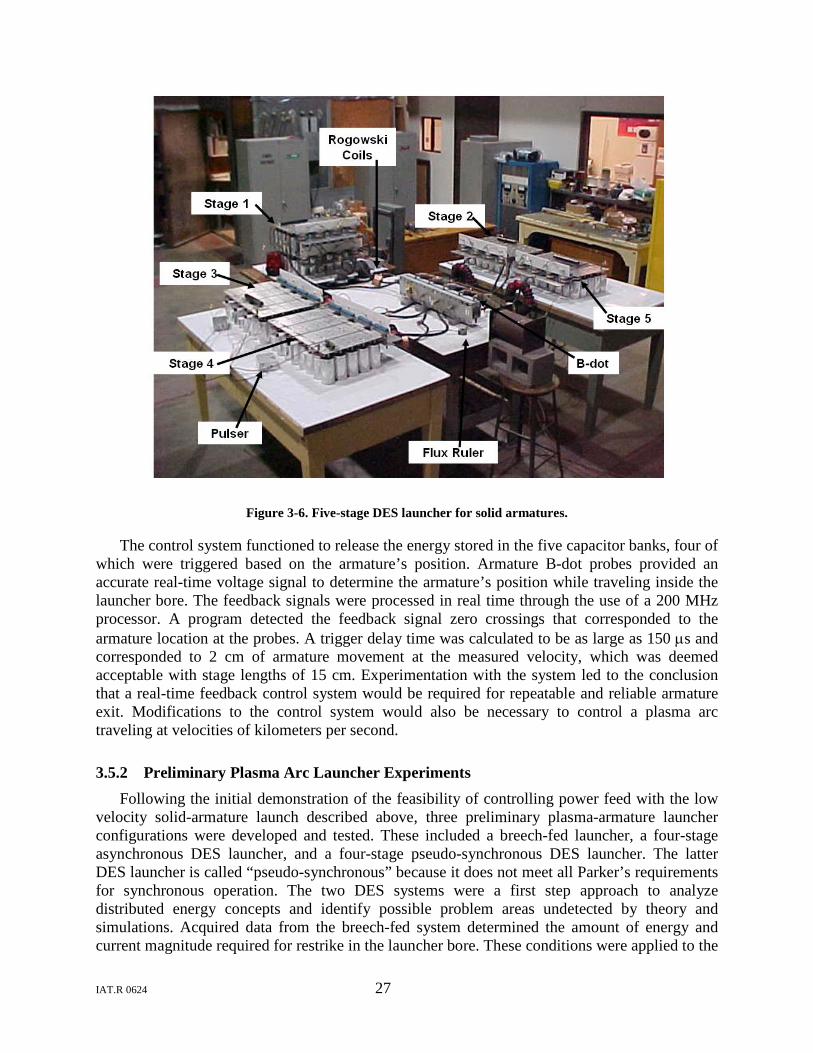
IAT.R 0624 27
Figure 3-6. Five-stage DES launcher for solid armatures.
The control system functioned to release the energy stored in the five capacitor banks, four of which were triggered based on the armature’s position. Armature B-dot probes provided an accurate real-time voltage signal to determine the armature’s position while traveling inside the launcher bore. The feedback signals were processed in real time through the use of a 200 MHz processor. A program detected the feedback signal zero crossings that corresponded to the armature location at the probes. A trigger delay time was calculated to be as large as 150 µs and corresponded to 2 cm of armature movement at the measured velocity, which was deemed acceptable with stage lengths of 15 cm. Experimentation with the system led to the conclusion that a real-time feedback control system would be required for repeatable and reliable armature exit. Modifications to the control system would also be necessary to control a plasma arc traveling at velocities of kilometers per second.
3.5.2 Preliminary Plasma Arc Launcher Experiments Following the initial demonstration of the feasibility of controlling power feed with the low
velocity solid-armature launch described above, three preliminary plasma-armature launcher configurations were developed and tested. These included a breech-fed launcher, a four-stage asynchronous DES launcher, and a four-stage pseudo-synchronous DES launcher. The latter DES launcher is called “pseudo-synchronous” because it does not meet all Parker’s requirements for synchronous operation. The two DES systems were a first step approach to analyze distributed energy concepts and identify possible problem areas undetected by theory and simulations. Acquired data from the breech-fed system determined the amount of energy and current magnitude required for restrike in the launcher bore. These conditions were applied to the
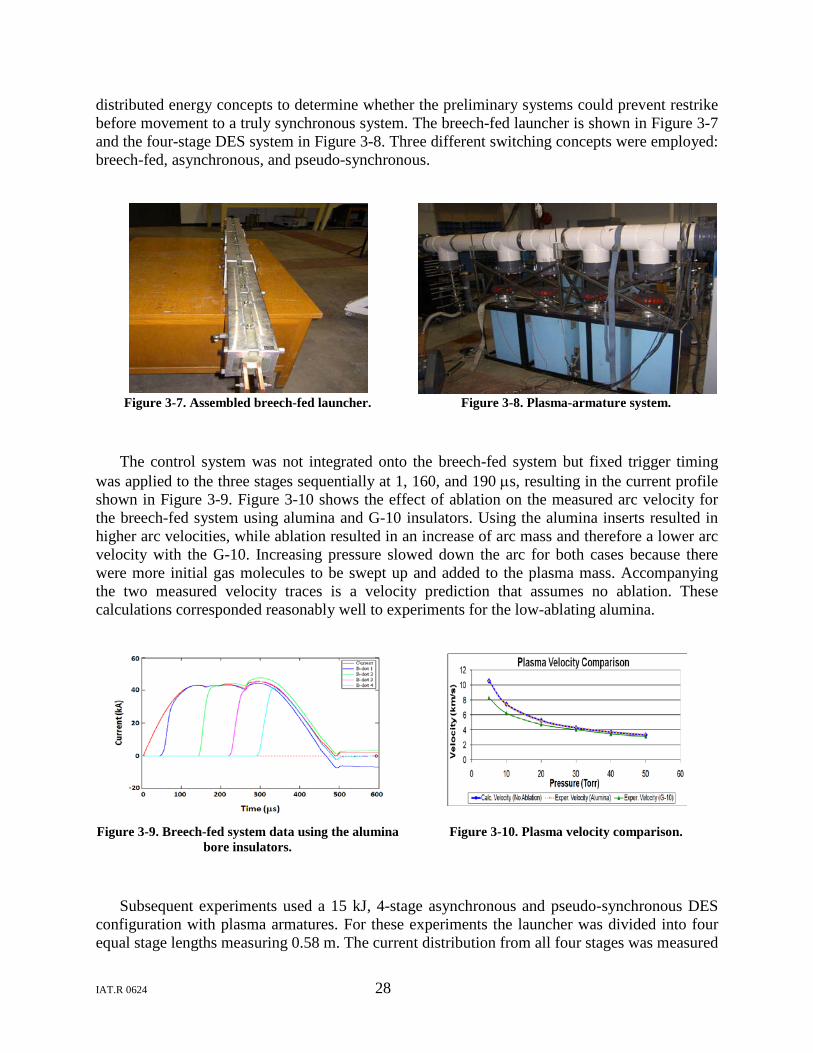
IAT.R 0624 28
distributed energy concepts to determine whether the preliminary systems could prevent restrike before movement to a truly synchronous system. The breech-fed launcher is shown in Figure 3-7 and the four-stage DES system in Figure 3-8. Three different switching concepts were employed: breech-fed, asynchronous, and pseudo-synchronous.
Figure 3-7. Assembled breech-fed launcher.
Figure 3-8. Plasma-armature system.
The control system was not integrated onto the breech-fed system but fixed trigger timing was applied to the three stages sequentially at 1, 160, and 190 µs, resulting in the current profile shown in Figure 3-9. Figure 3-10 shows the effect of ablation on the measured arc velocity for the breech-fed system using alumina and G-10 insulators. Using the alumina inserts resulted in higher arc velocities, while ablation resulted in an increase of arc mass and therefore a lower arc velocity with the G-10. Increasing pressure slowed down the arc for both cases because there were more initial gas molecules to be swept up and added to the plasma mass. Accompanying the two measured velocity traces is a velocity prediction that assumes no ablation. These calculations corresponded reasonably well to experiments for the low-ablating alumina.
Figure 3-9. Breech-fed system data using the alumina bore insulators.
Figure 3-10. Plasma velocity comparison.
Subsequent experiments used a 15 kJ, 4-stage asynchronous and pseudo-synchronous DES configuration with plasma armatures. For these experiments the launcher was divided into four equal stage lengths measuring 0.58 m. The current distribution from all four stages was measured
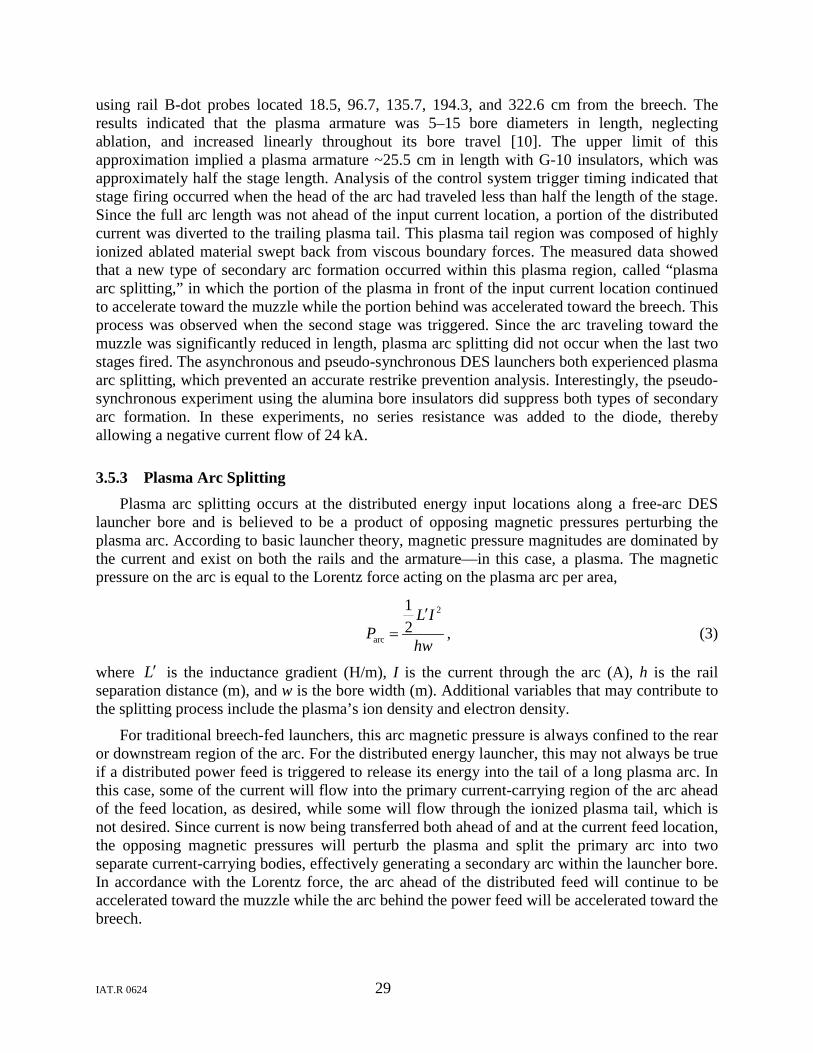
IAT.R 0624 29
using rail B-dot probes located 18.5, 96.7, 135.7, 194.3, and 322.6 cm from the breech. The results indicated that the plasma armature was 5–15 bore diameters in length, neglecting ablation, and increased linearly throughout its bore travel [10]. The upper limit of this approximation implied a plasma armature ~25.5 cm in length with G-10 insulators, which was approximately half the stage length. Analysis of the control system trigger timing indicated that stage firing occurred when the head of the arc had traveled less than half the length of the stage. Since the full arc length was not ahead of the input current location, a portion of the distributed current was diverted to the trailing plasma tail. This plasma tail region was composed of highly ionized ablated material swept back from viscous boundary forces. The measured data showed that a new type of secondary arc formation occurred within this plasma region, called “plasma arc splitting,” in which the portion of the plasma in front of the input current location continued to accelerate toward the muzzle while the portion behind was accelerated toward the breech. This process was observed when the second stage was triggered. Since the arc traveling toward the muzzle was significantly reduced in length, plasma arc splitting did not occur when the last two stages fired. The asynchronous and pseudo-synchronous DES launchers both experienced plasma arc splitting, which prevented an accurate restrike prevention analysis. Interestingly, the pseudo-synchronous experiment using the alumina bore insulators did suppress both types of secondary arc formation. In these experiments, no series resistance was added to the diode, thereby allowing a negative current flow of 24 kA.
3.5.3 Plasma Arc Splitting Plasma arc splitting occurs at the distributed energy input locations along a free-arc DES
launcher bore and is believed to be a product of opposing magnetic pressures perturbing the plasma arc. According to basic launcher theory, magnetic pressure magnitudes are dominated by the current and exist on both the rails and the armature—in this case, a plasma. The magnetic pressure on the arc is equal to the Lorentz force acting on the plasma arc per area,
2
arc
12
L IP
hw
′= , (3)
where L′ is the inductance gradient (H/m), I is the current through the arc (A), h is the rail separation distance (m), and w is the bore width (m). Additional variables that may contribute to the splitting process include the plasma’s ion density and electron density.
For traditional breech-fed launchers, this arc magnetic pressure is always confined to the rear or downstream region of the arc. For the distributed energy launcher, this may not always be true if a distributed power feed is triggered to release its energy into the tail of a long plasma arc. In this case, some of the current will flow into the primary current-carrying region of the arc ahead of the feed location, as desired, while some will flow through the ionized plasma tail, which is not desired. Since current is now being transferred both ahead of and at the current feed location, the opposing magnetic pressures will perturb the plasma and split the primary arc into two separate current-carrying bodies, effectively generating a secondary arc within the launcher bore. In accordance with the Lorentz force, the arc ahead of the distributed feed will continue to be accelerated toward the muzzle while the arc behind the power feed will be accelerated toward the breech.
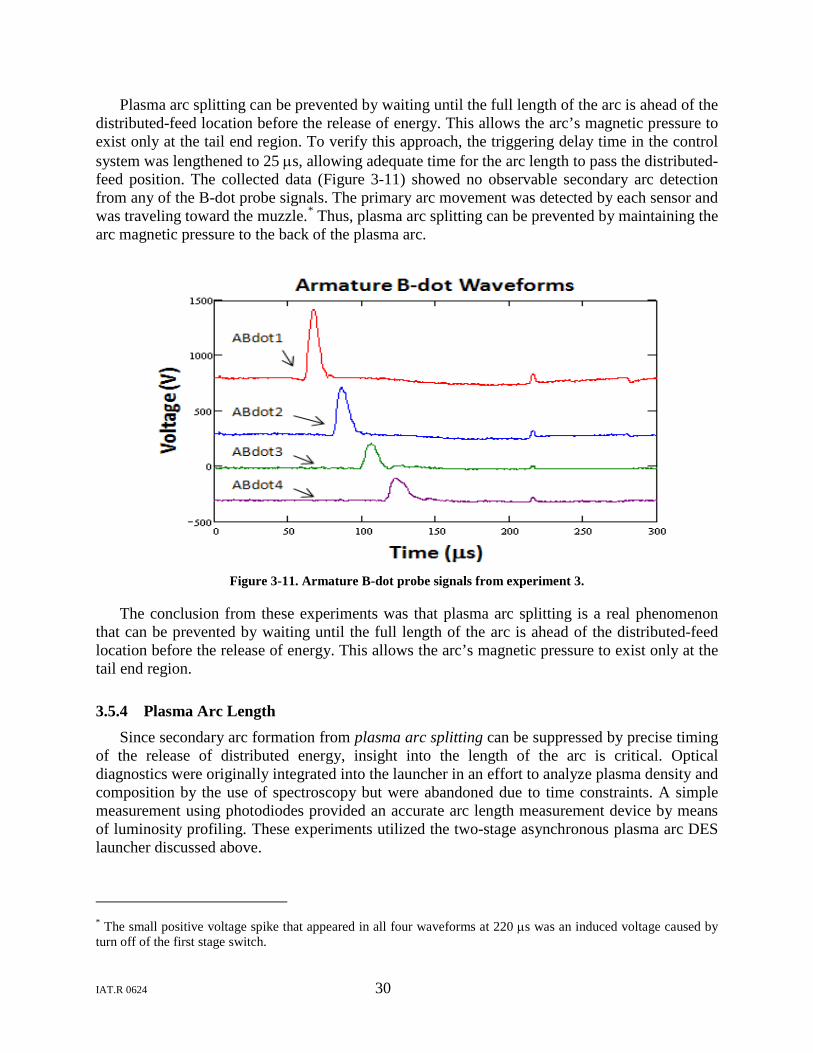
IAT.R 0624 30
Plasma arc splitting can be prevented by waiting until the full length of the arc is ahead of the distributed-feed location before the release of energy. This allows the arc’s magnetic pressure to exist only at the tail end region. To verify this approach, the triggering delay time in the control system was lengthened to 25 µs, allowing adequate time for the arc length to pass the distributed-feed position. The collected data (Figure 3-11) showed no observable secondary arc detection from any of the B-dot probe signals. The primary arc movement was detected by each sensor and was traveling toward the muzzle.*
Thus, plasma arc splitting can be prevented by maintaining the arc magnetic pressure to the back of the plasma arc.
Figure 3-11. Armature B-dot probe signals from experiment 3.
The conclusion from these experiments was that plasma arc splitting is a real phenomenon that can be prevented by waiting until the full length of the arc is ahead of the distributed-feed location before the release of energy. This allows the arc’s magnetic pressure to exist only at the tail end region.
3.5.4 Plasma Arc Length Since secondary arc formation from plasma arc splitting can be suppressed by precise timing
of the release of distributed energy, insight into the length of the arc is critical. Optical diagnostics were originally integrated into the launcher in an effort to analyze plasma density and composition by the use of spectroscopy but were abandoned due to time constraints. A simple measurement using photodiodes provided an accurate arc length measurement device by means of luminosity profiling. These experiments utilized the two-stage asynchronous plasma arc DES launcher discussed above.
* The small positive voltage spike that appeared in all four waveforms at 220 µs was an induced voltage caused by turn off of the first stage switch.
IAT.R 0624 31
The optical diagnostics selected were Hamamatsu S1336-18BK photodiodes with a spectral response range of 320 nm to 1100 nm and a rise time of 0.1 µs. Five of these photodiodes were utilized to provide light detection at five different in-bore locations (Figure 3-12). Since the photodiodes could not be directly exposed to the bore due to the intense heat radiated by the plasma arc, optical fibers coupled the light signals to the detectors at a safe distance.
Figure 3-12. A drawing of the DES launcher and optical diagnostics.
The optical fiber mounting location along the length of the gun is shown (not to scale) in Figure 3-13, with an exposed bore to illustrate how the fibers were oriented. The optical fibers are drawn in blue and the black boxes represent the coupling of two fiber lines.
Figure 3-13. Illustration of the fiber line mounting.
The plasma arc length was measured from the photodiode data and is shown in Figure 3-14. Unlike the monotonically increasing function of arc length expected from a breech-fed energy
IAT.R 0624 32
concept, the distributed energy power fed arc length traces were not monotonic in relation to position. For the 5 Torr trace, the arc length was 17.7 cm at the first fiber location and 8.9 cm at the second fiber position. Perturbations from the opposing magnetic pressures resulting from the distributed feed allowed the plasma to expand from 13.5–19.5 cm as it propagated past the third and fourth fiber locations. Interestingly, when the arc reached the fifth fiber location, the length was reduced to 9.4 cm. This can be explained by a return of the magnetic pressure to the tail end of the plasma arc.
Figure 3-14. Arc length calculations vs. pressure and location.
In summary, the light intensity profiles indicated a short, compact plasma arc head and long plasma body and tail region. The plasma length was calculated for each fiber location for varying air pressures between 5 and 30 Torr. As expected, the arc length increased with rising air pressure because the higher pressures provided more available fill gas molecules vulnerable to ionization by the plasma. These experiments showed the arc length to be from 37 cm (30 Torr air pressure) to 8 cm (5 Torr air pressure). Further, the investigation found the arc length to be dynamic near the distributed current feed. This is believed to be a product of gradient magnetic pressures perturbing the plasma arc. In addition, these perturbations affected the arc velocity, which could impart significant changes of acceleration on the payload. These arc length calculations were beneficial to the suppression of plasma arc splitting during future experiments.
3.5.5 40-Stage Distributed Energy Source Launcher Simulation The knowledge acquired from the above experiments was utilized to design and test a fully
synchronous DES launcher. Since a large number of stages is required to achieve synchronous operation, it was decided to build a 40-stage DES launcher, based on a theoretical synchronous system [6] described by Parker. Since the complexity of a DES launcher increases with number of stages, after completion of the full system design it was decided to first build a seven-stage prototype to evaluate the design and operation of the DES system. The objectives of the prototype were to design, built, and test:
IAT.R 0624 33
• A seven-stage DES launcher with successful arc propagation towards the muzzle. • A containment structure capable of maintaining low pressures (mTorr range). • A bore compression technique to suppress plasma leakage. • A flange to couple multiple containment structures together while maintaining vacuum
and bore compression. • Compact distributed energy modules capable of sourcing the necessary energy. • Precision diagnostics, including B-dot probes and Rogowski coils. A necessary phase of the design was a computer simulation to characterize component
values. The simulation was designed to achieve an arc velocity > 8 km/s with 40 stages contributing to provide 50 kA of nearly constant current. The circuit equations implemented were based on a lumped circuit element model [6] and coded using MATLAB. The energy stored within each stage and the stage length were kept constant, but variations of the constants were analyzed. Values obtained from the simulation allowed for the selection of realizable system components such as capacitors, switches, and power conditioning devices.
The code was developed in accordance with derived circuit equations for a distributed energy model [6]. The code implemented the derivation of two loop equations from a lumped circuit element model describing the capacitive energy store stages. The first loop equation characterized the electrical system for the case when the arc has passed through a respective stage. The simulation equation yields
i i
i i i i i i k i k1 1i i
i+1 i+1 i+1 i+1
1'1
0, 1 ( 1)
i i
k k
q qR q L q rS q L S qC C
R q L q i N= =
+− − − − +
++ + = ≤ ≤ −
∑ ∑
(4)
where i represents the stage number, iq in coulombs is the charge on capacitor iC (C), Ri is the stage resistance (Ω), iL is the stage inductance (H), ir is the stage rail resistance (Ω/m), Si is the stage length (m), and 'L = dL/dx is the inductance gradient (H/m). A thorough derivation is presented in [6], which includes dimensionless variables and equations.
The second loop equation characterizes the electrical system for the case when the arc is contained within a respective stage. Here, N refers to the stage number, and the second-order differential equation used in the simulation yields
N
N N N N kk=1N
kk=1
( * ' )C
' * 0
N
N
q R q L q rx L x q
L x q
− − − −
− =
∑
∑
, (5)
where x is the arc velocity (m/s) and *x is the arc distance from the beginning of stage N in meters.
If the arc is at a distance x from the launcher breech, the relationship between x and x* can be described as
1i1
* N
ix x S−
== − ∑ . (6)
IAT.R 0624 34
The second-order differential equations of (5) and (6) were solved using a MATLAB routine ode45 with syntax of [t,Y] = ode45(odefun, tspan, y0, options), where “odefun” is a function that evaluates the right side of the differential equations, “tspan” is a vector specifying the interval of integration, “y0” is a vector of initial conditions, and “options” is a function to adjust the integration parameters (which was useful for the q calculation or equivalently the dI/dt calculation). The algorithm used for the ode45 routine is based on an explicit Runge-Kutta formula known as the Dormand-Prince pair.
The terms presented in equations (4)–(6) are all straightforward, with the exception of the arc velocity term. The simulation used a derived plasma velocity equation [10
] that assumed no in-bore wall ablation and had the form
p0
S
' 1( * 1)
1
L Ih x
x
νγ ρ
= + +
(7)
where L' = dL/dx is the inductance gradient (H/m), *γ is the ratio of specific heat (unitless), 0ρ is the initial gas density (kg/m3), I is the armature current (A), h is the rail separation distance (m), x is the distance the shock front has moved (m), and Sx is a scale length as a consequence of viscous forces (m). The equation for the scale length is characterized by
Sf
1*4
hxC
γ = +
, (8)
where fC is the drag coefficient (unitless).
The location of the shock front, the ratio of specific heat, the scale length, and the drag coefficient are all difficult to determine by neglecting complex physics. The values used in the simulation were determined by an experiment with comparable parameters [10]. For strong ionizing shocks, the ratio of specific heat has a strong dependence on the degree of dissociation and ionization [10]. A common value of 1.2 was used in the simulation. The scale length was calculated by setting the drag coefficient to a constant value of 0.0049, which was calculated from the comparable experiment. By analyzing equation (7), it was observed that the arc velocity was a function of only two temporal variables, the current through the arc and the shock-front distance. Since the current was a user-defined variable, the remaining dependent variable to be determined was the location of the shock front. This is not an intuitive calculation and drastically affects the arc velocity in the simulation. An attempt was made to approximate the shock-front movement by setting it equal to the arc movement. Since the current was essentially constant, this produced a linear decrease of the velocity as the arc traveled down the rails. The velocity measurement of a past experiment [11
10] confirmed a velocity reduction with arc distance, but to a
lesser degree than equation (4) predicted. An advanced code mentioned in [ ] also had difficulty matching theory to experiment and concluded that there must be a linear dependence on the drag coefficient for the hypervelocity regime. Taking this into consideration, a compromise was made by making the shock-front distance constant while maintaining a constant drag coefficient. Therefore, the time-varying velocity is solely proportional to the arc current. When the shock-front distance was set to the rail length, reasonable values of velocity were obtained by comparison to experimental measurements found in [11].
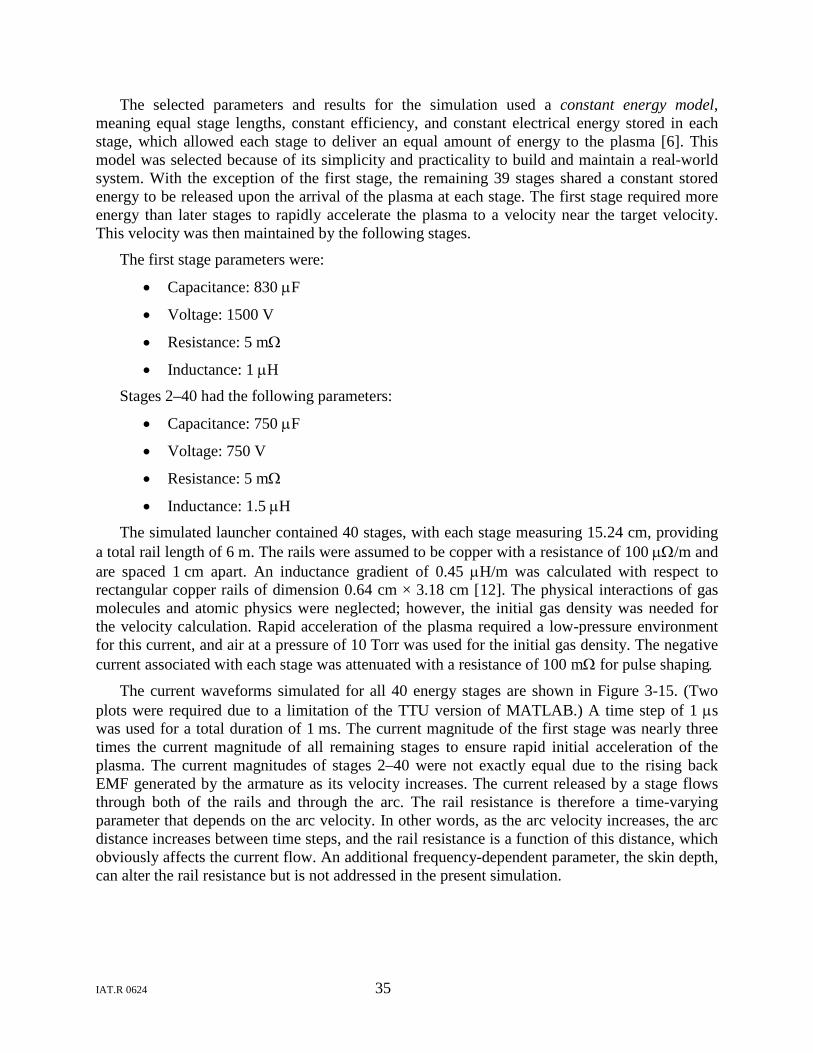
IAT.R 0624 35
The selected parameters and results for the simulation used a constant energy model, meaning equal stage lengths, constant efficiency, and constant electrical energy stored in each stage, which allowed each stage to deliver an equal amount of energy to the plasma [6]. This model was selected because of its simplicity and practicality to build and maintain a real-world system. With the exception of the first stage, the remaining 39 stages shared a constant stored energy to be released upon the arrival of the plasma at each stage. The first stage required more energy than later stages to rapidly accelerate the plasma to a velocity near the target velocity. This velocity was then maintained by the following stages.
The first stage parameters were:
• Capacitance: 830 µF
• Voltage: 1500 V
• Resistance: 5 mΩ
• Inductance: 1 µH
Stages 2–40 had the following parameters:
• Capacitance: 750 µF
• Voltage: 750 V
• Resistance: 5 mΩ
• Inductance: 1.5 µH The simulated launcher contained 40 stages, with each stage measuring 15.24 cm, providing
a total rail length of 6 m. The rails were assumed to be copper with a resistance of 100 µΩ/m and are spaced 1 cm apart. An inductance gradient of 0.45 µH/m was calculated with respect to rectangular copper rails of dimension 0.64 cm × 3.18 cm [12
The current waveforms simulated for all 40 energy stages are shown in
]. The physical interactions of gas molecules and atomic physics were neglected; however, the initial gas density was needed for the velocity calculation. Rapid acceleration of the plasma required a low-pressure environment for this current, and air at a pressure of 10 Torr was used for the initial gas density. The negative current associated with each stage was attenuated with a resistance of 100 mΩ for pulse shaping.
Figure 3-15. (Two plots were required due to a limitation of the TTU version of MATLAB.) A time step of 1 µs was used for a total duration of 1 ms. The current magnitude of the first stage was nearly three times the current magnitude of all remaining stages to ensure rapid initial acceleration of the plasma. The current magnitudes of stages 2–40 were not exactly equal due to the rising back EMF generated by the armature as its velocity increases. The current released by a stage flows through both of the rails and through the arc. The rail resistance is therefore a time-varying parameter that depends on the arc velocity. In other words, as the arc velocity increases, the arc distance increases between time steps, and the rail resistance is a function of this distance, which obviously affects the current flow. An additional frequency-dependent parameter, the skin depth, can alter the rail resistance but is not addressed in the present simulation.
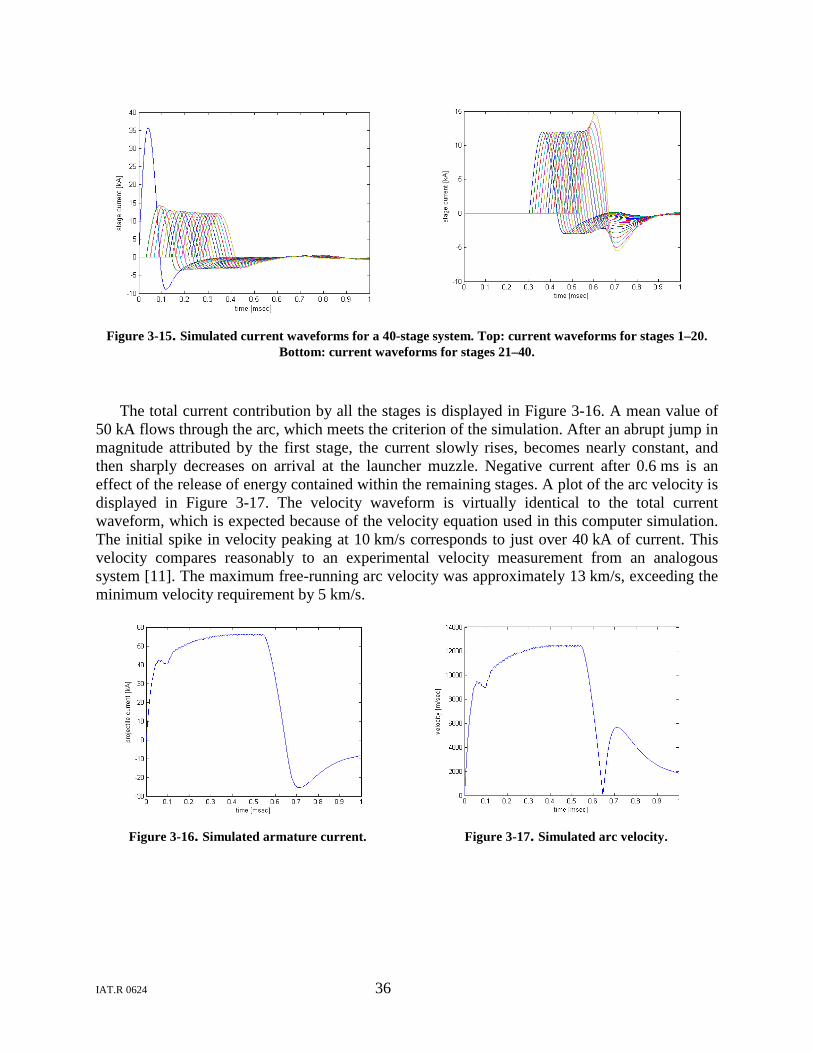
IAT.R 0624 36
Figure 3-15. Simulated current waveforms for a 40-stage system. Top: current waveforms for stages 1–20. Bottom: current waveforms for stages 21–40.
The total current contribution by all the stages is displayed in Figure 3-16. A mean value of 50 kA flows through the arc, which meets the criterion of the simulation. After an abrupt jump in magnitude attributed by the first stage, the current slowly rises, becomes nearly constant, and then sharply decreases on arrival at the launcher muzzle. Negative current after 0.6 ms is an effect of the release of energy contained within the remaining stages. A plot of the arc velocity is displayed in Figure 3-17. The velocity waveform is virtually identical to the total current waveform, which is expected because of the velocity equation used in this computer simulation. The initial spike in velocity peaking at 10 km/s corresponds to just over 40 kA of current. This velocity compares reasonably to an experimental velocity measurement from an analogous system [11]. The maximum free-running arc velocity was approximately 13 km/s, exceeding the minimum velocity requirement by 5 km/s.
Figure 3-16. Simulated armature current.
Figure 3-17. Simulated arc velocity.
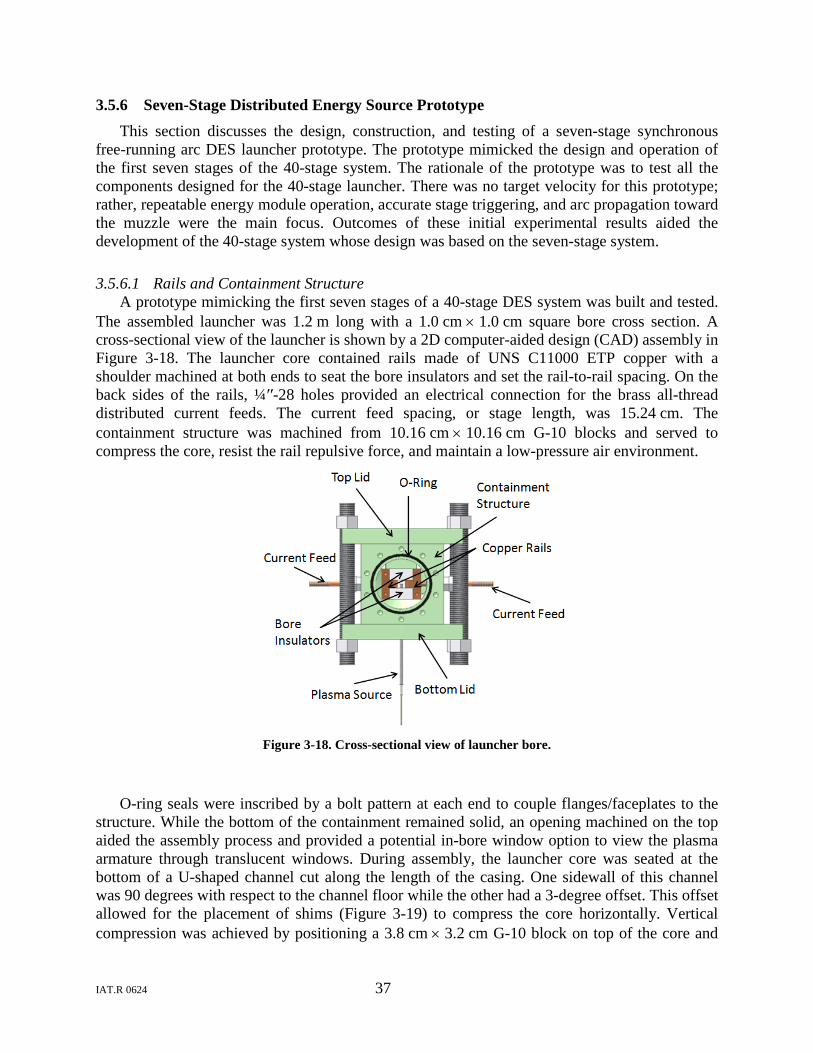
IAT.R 0624 37
3.5.6 Seven-Stage Distributed Energy Source Prototype This section discusses the design, construction, and testing of a seven-stage synchronous
free-running arc DES launcher prototype. The prototype mimicked the design and operation of the first seven stages of the 40-stage system. The rationale of the prototype was to test all the components designed for the 40-stage launcher. There was no target velocity for this prototype; rather, repeatable energy module operation, accurate stage triggering, and arc propagation toward the muzzle were the main focus. Outcomes of these initial experimental results aided the development of the 40-stage system whose design was based on the seven-stage system.
3.5.6.1 Rails and Containment Structure A prototype mimicking the first seven stages of a 40-stage DES system was built and tested.
The assembled launcher was 1.2 m long with a 1.0 cm × 1.0 cm square bore cross section. A cross-sectional view of the launcher is shown by a 2D computer-aided design (CAD) assembly in Figure 3-18. The launcher core contained rails made of UNS C11000 ETP copper with a shoulder machined at both ends to seat the bore insulators and set the rail-to-rail spacing. On the back sides of the rails, ¼′′-28 holes provided an electrical connection for the brass all-thread distributed current feeds. The current feed spacing, or stage length, was 15.24 cm. The containment structure was machined from 10.16 cm × 10.16 cm G-10 blocks and served to compress the core, resist the rail repulsive force, and maintain a low-pressure air environment.
Figure 3-18. Cross-sectional view of launcher bore.
O-ring seals were inscribed by a bolt pattern at each end to couple flanges/faceplates to the structure. While the bottom of the containment remained solid, an opening machined on the top aided the assembly process and provided a potential in-bore window option to view the plasma armature through translucent windows. During assembly, the launcher core was seated at the bottom of a U-shaped channel cut along the length of the casing. One sidewall of this channel was 90 degrees with respect to the channel floor while the other had a 3-degree offset. This offset allowed for the placement of shims (Figure 3-19) to compress the core horizontally. Vertical compression was achieved by positioning a 3.8 cm × 3.2 cm G-10 block on top of the core and
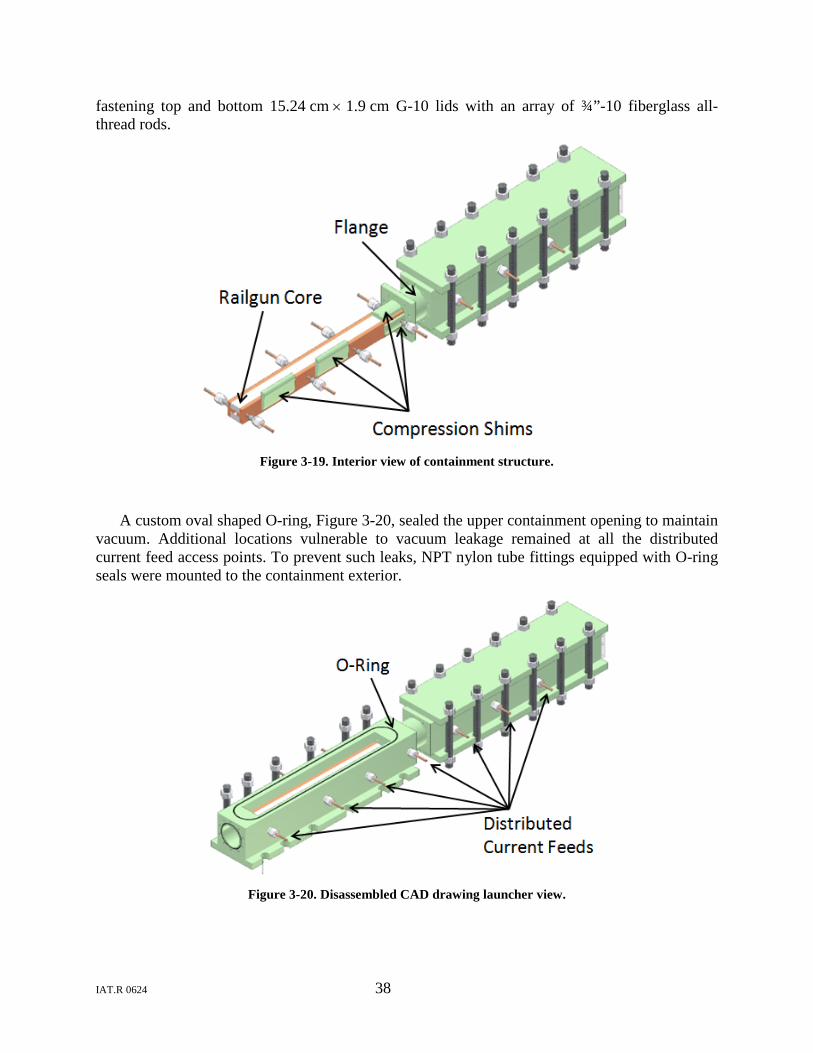
IAT.R 0624 38
fastening top and bottom 15.24 cm × 1.9 cm G-10 lids with an array of ¾”-10 fiberglass all-thread rods.
Figure 3-19. Interior view of containment structure.
A custom oval shaped O-ring, Figure 3-20, sealed the upper containment opening to maintain vacuum. Additional locations vulnerable to vacuum leakage remained at all the distributed current feed access points. To prevent such leaks, NPT nylon tube fittings equipped with O-ring seals were mounted to the containment exterior.
Figure 3-20. Disassembled CAD drawing launcher view.
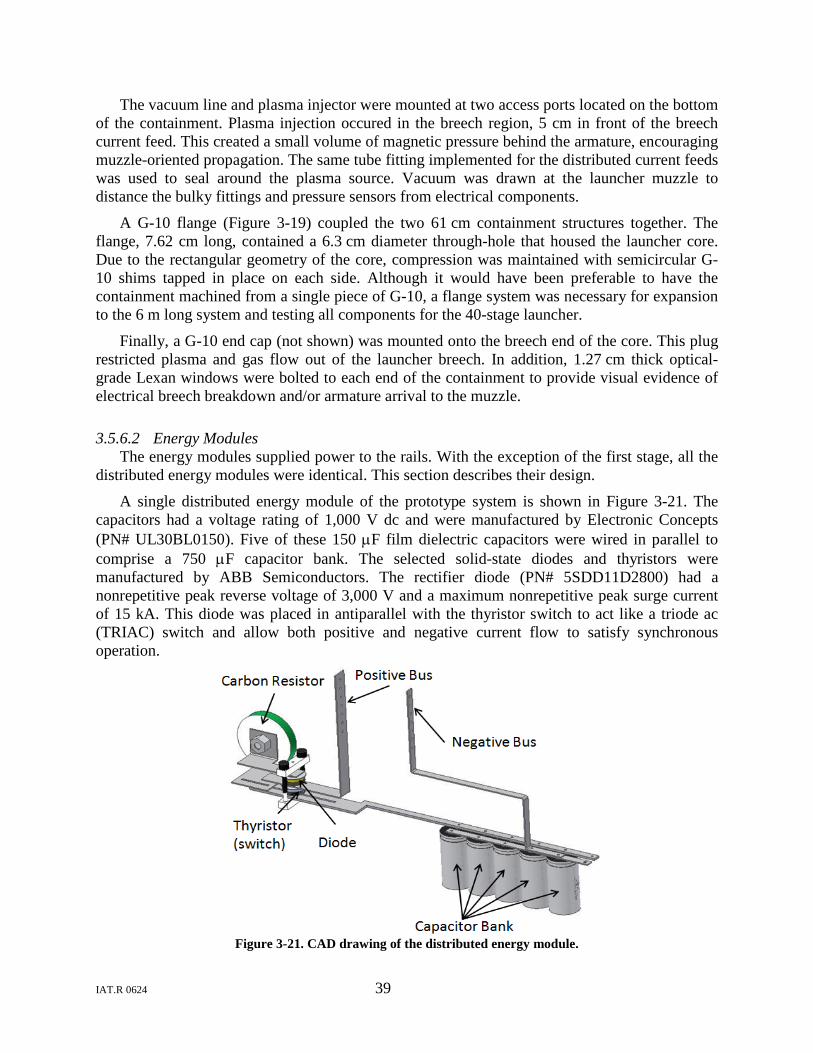
IAT.R 0624 39
The vacuum line and plasma injector were mounted at two access ports located on the bottom of the containment. Plasma injection occured in the breech region, 5 cm in front of the breech current feed. This created a small volume of magnetic pressure behind the armature, encouraging muzzle-oriented propagation. The same tube fitting implemented for the distributed current feeds was used to seal around the plasma source. Vacuum was drawn at the launcher muzzle to distance the bulky fittings and pressure sensors from electrical components.
A G-10 flange (Figure 3-19) coupled the two 61 cm containment structures together. The flange, 7.62 cm long, contained a 6.3 cm diameter through-hole that housed the launcher core. Due to the rectangular geometry of the core, compression was maintained with semicircular G-10 shims tapped in place on each side. Although it would have been preferable to have the containment machined from a single piece of G-10, a flange system was necessary for expansion to the 6 m long system and testing all components for the 40-stage launcher.
Finally, a G-10 end cap (not shown) was mounted onto the breech end of the core. This plug restricted plasma and gas flow out of the launcher breech. In addition, 1.27 cm thick optical-grade Lexan windows were bolted to each end of the containment to provide visual evidence of electrical breech breakdown and/or armature arrival to the muzzle.
3.5.6.2 Energy Modules The energy modules supplied power to the rails. With the exception of the first stage, all the
distributed energy modules were identical. This section describes their design.
A single distributed energy module of the prototype system is shown in Figure 3-21. The capacitors had a voltage rating of 1,000 V dc and were manufactured by Electronic Concepts (PN# UL30BL0150). Five of these 150 µF film dielectric capacitors were wired in parallel to comprise a 750 µF capacitor bank. The selected solid-state diodes and thyristors were manufactured by ABB Semiconductors. The rectifier diode (PN# 5SDD11D2800) had a nonrepetitive peak reverse voltage of 3,000 V and a maximum nonrepetitive peak surge current of 15 kA. This diode was placed in antiparallel with the thyristor switch to act like a triode ac (TRIAC) switch and allow both positive and negative current flow to satisfy synchronous operation.
Figure 3-21. CAD drawing of the distributed energy module.
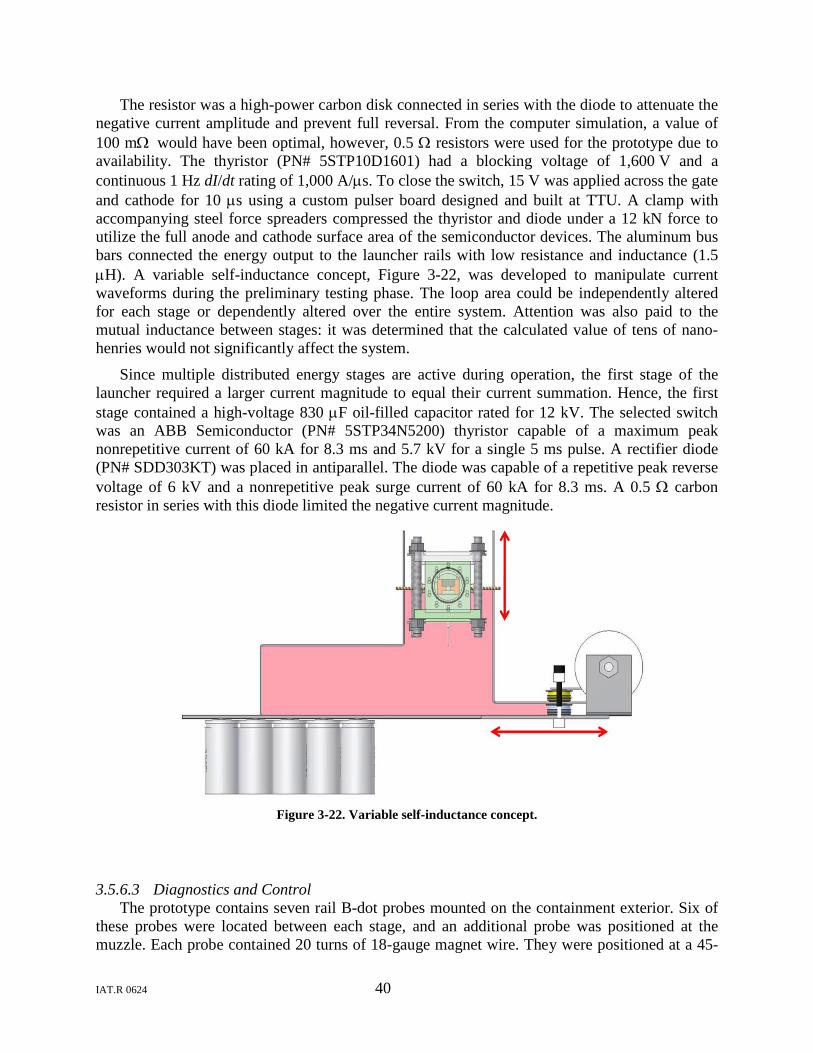
IAT.R 0624 40
The resistor was a high-power carbon disk connected in series with the diode to attenuate the negative current amplitude and prevent full reversal. From the computer simulation, a value of 100 mΩ would have been optimal, however, 0.5 Ω resistors were used for the prototype due to availability. The thyristor (PN# 5STP10D1601) had a blocking voltage of 1,600 V and a continuous 1 Hz dI/dt rating of 1,000 A/µs. To close the switch, 15 V was applied across the gate and cathode for 10 µs using a custom pulser board designed and built at TTU. A clamp with accompanying steel force spreaders compressed the thyristor and diode under a 12 kN force to utilize the full anode and cathode surface area of the semiconductor devices. The aluminum bus bars connected the energy output to the launcher rails with low resistance and inductance (1.5 µH). A variable self-inductance concept, Figure 3-22, was developed to manipulate current waveforms during the preliminary testing phase. The loop area could be independently altered for each stage or dependently altered over the entire system. Attention was also paid to the mutual inductance between stages: it was determined that the calculated value of tens of nano-henries would not significantly affect the system.
Since multiple distributed energy stages are active during operation, the first stage of the launcher required a larger current magnitude to equal their current summation. Hence, the first stage contained a high-voltage 830 µF oil-filled capacitor rated for 12 kV. The selected switch was an ABB Semiconductor (PN# 5STP34N5200) thyristor capable of a maximum peak nonrepetitive current of 60 kA for 8.3 ms and 5.7 kV for a single 5 ms pulse. A rectifier diode (PN# SDD303KT) was placed in antiparallel. The diode was capable of a repetitive peak reverse voltage of 6 kV and a nonrepetitive peak surge current of 60 kA for 8.3 ms. A 0.5 Ω carbon resistor in series with this diode limited the negative current magnitude.
Figure 3-22. Variable self-inductance concept.
3.5.6.3 Diagnostics and Control The prototype contains seven rail B-dot probes mounted on the containment exterior. Six of
these probes were located between each stage, and an additional probe was positioned at the muzzle. Each probe contained 20 turns of 18-gauge magnet wire. They were positioned at a 45-
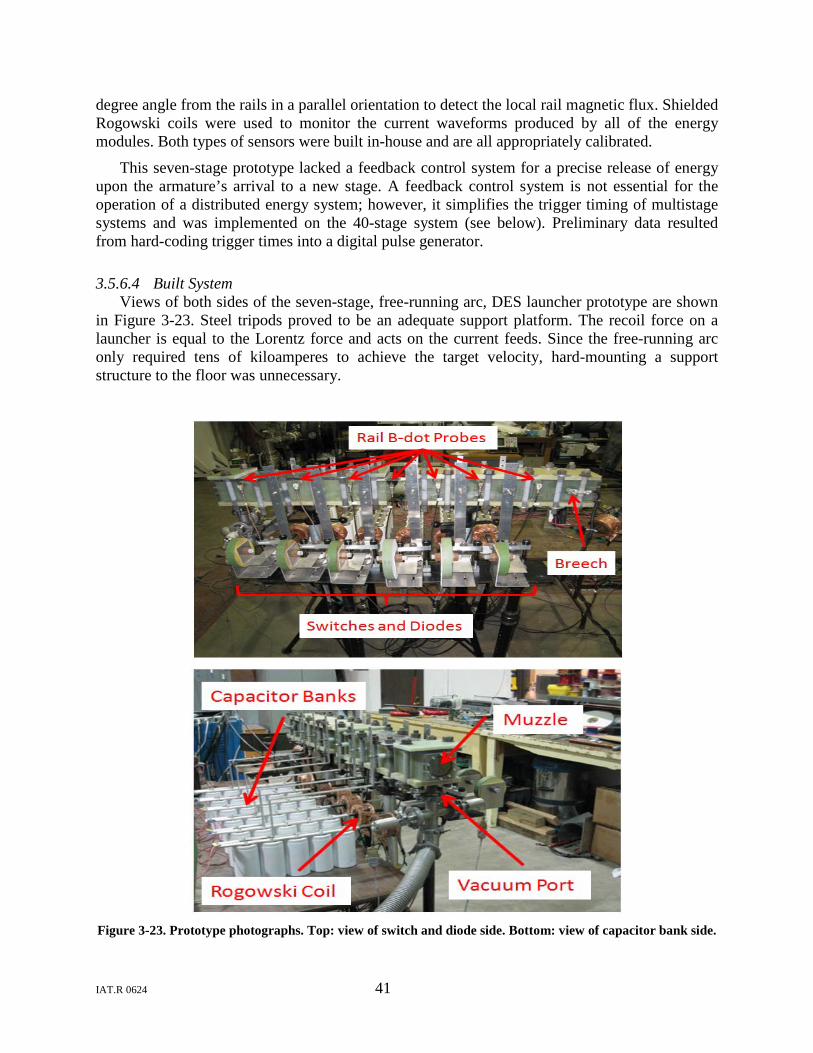
IAT.R 0624 41
degree angle from the rails in a parallel orientation to detect the local rail magnetic flux. Shielded Rogowski coils were used to monitor the current waveforms produced by all of the energy modules. Both types of sensors were built in-house and are all appropriately calibrated.
This seven-stage prototype lacked a feedback control system for a precise release of energy upon the armature’s arrival to a new stage. A feedback control system is not essential for the operation of a distributed energy system; however, it simplifies the trigger timing of multistage systems and was implemented on the 40-stage system (see below). Preliminary data resulted from hard-coding trigger times into a digital pulse generator.
3.5.6.4 Built System Views of both sides of the seven-stage, free-running arc, DES launcher prototype are shown
in Figure 3-23. Steel tripods proved to be an adequate support platform. The recoil force on a launcher is equal to the Lorentz force and acts on the current feeds. Since the free-running arc only required tens of kiloamperes to achieve the target velocity, hard-mounting a support structure to the floor was unnecessary.
Figure 3-23. Prototype photographs. Top: view of switch and diode side. Bottom: view of capacitor bank side.
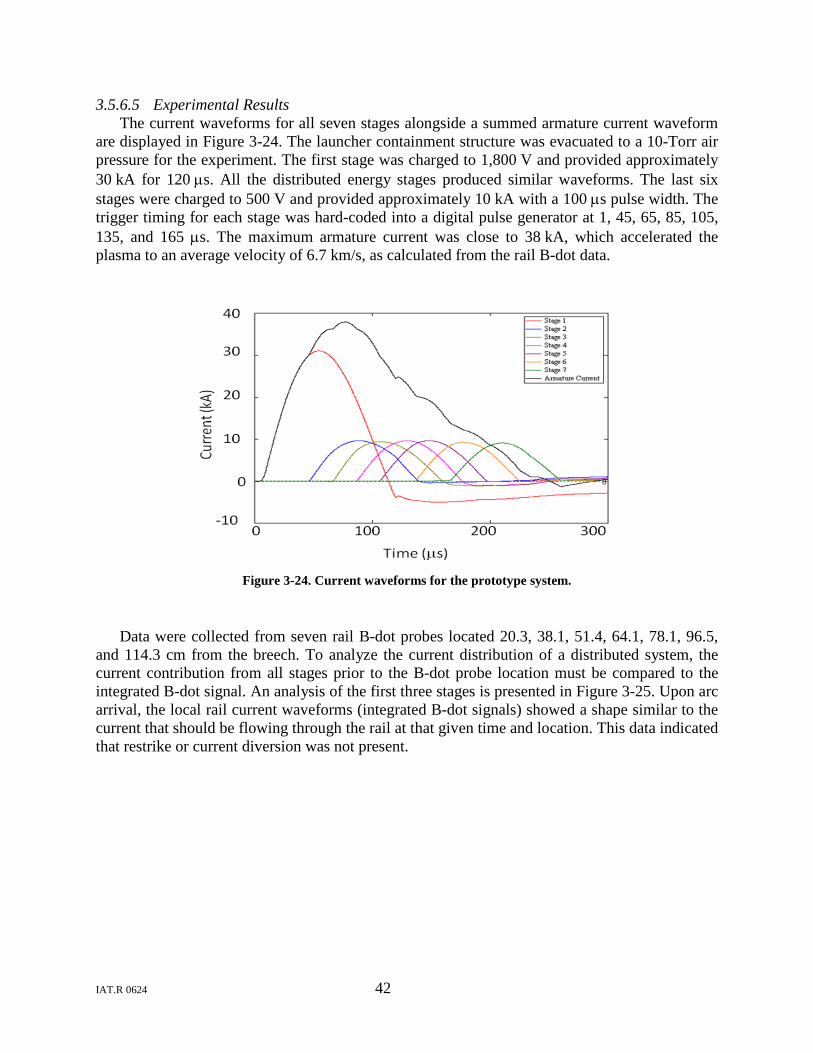
IAT.R 0624 42
3.5.6.5 Experimental Results The current waveforms for all seven stages alongside a summed armature current waveform
are displayed in Figure 3-24. The launcher containment structure was evacuated to a 10-Torr air pressure for the experiment. The first stage was charged to 1,800 V and provided approximately 30 kA for 120 µs. All the distributed energy stages produced similar waveforms. The last six stages were charged to 500 V and provided approximately 10 kA with a 100 µs pulse width. The trigger timing for each stage was hard-coded into a digital pulse generator at 1, 45, 65, 85, 105, 135, and 165 µs. The maximum armature current was close to 38 kA, which accelerated the plasma to an average velocity of 6.7 km/s, as calculated from the rail B-dot data.
Figure 3-24. Current waveforms for the prototype system.
Data were collected from seven rail B-dot probes located 20.3, 38.1, 51.4, 64.1, 78.1, 96.5, and 114.3 cm from the breech. To analyze the current distribution of a distributed system, the current contribution from all stages prior to the B-dot probe location must be compared to the integrated B-dot signal. An analysis of the first three stages is presented in Figure 3-25. Upon arc arrival, the local rail current waveforms (integrated B-dot signals) showed a shape similar to the current that should be flowing through the rail at that given time and location. This data indicated that restrike or current diversion was not present.
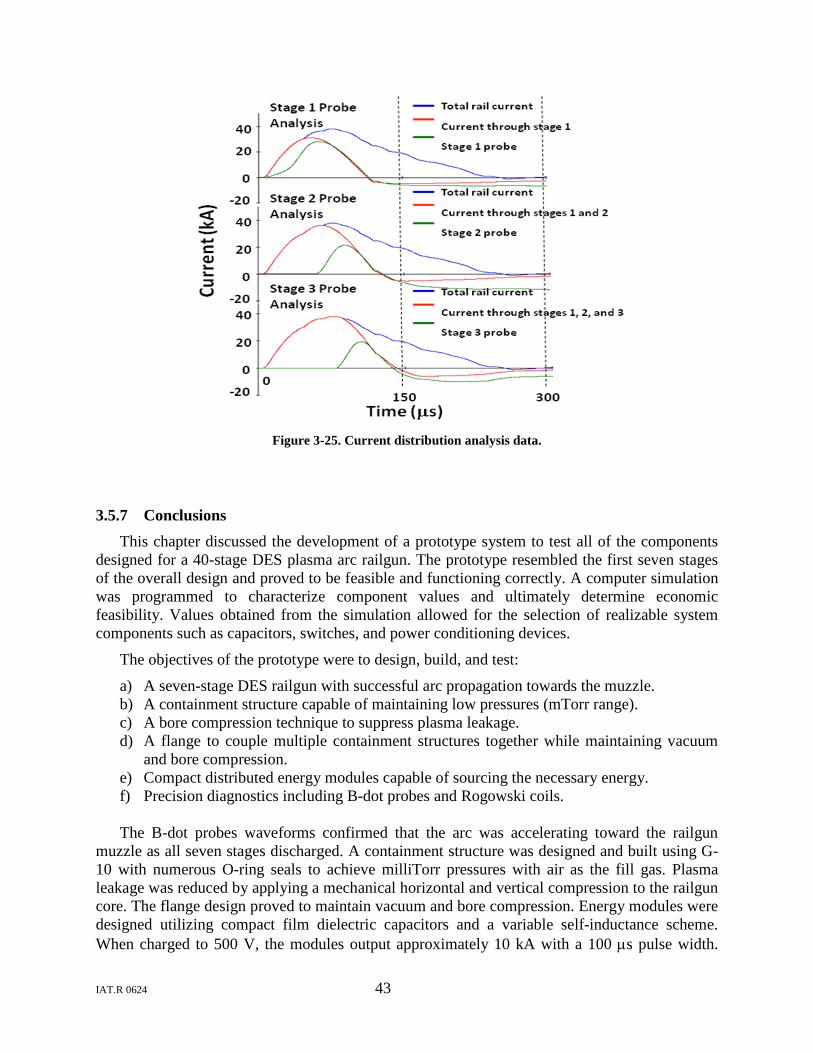
IAT.R 0624 43
Figure 3-25. Current distribution analysis data.
3.5.7 Conclusions This chapter discussed the development of a prototype system to test all of the components
designed for a 40-stage DES plasma arc railgun. The prototype resembled the first seven stages of the overall design and proved to be feasible and functioning correctly. A computer simulation was programmed to characterize component values and ultimately determine economic feasibility. Values obtained from the simulation allowed for the selection of realizable system components such as capacitors, switches, and power conditioning devices.
The objectives of the prototype were to design, build, and test:
a) A seven-stage DES railgun with successful arc propagation towards the muzzle. b) A containment structure capable of maintaining low pressures (mTorr range). c) A bore compression technique to suppress plasma leakage. d) A flange to couple multiple containment structures together while maintaining vacuum
and bore compression. e) Compact distributed energy modules capable of sourcing the necessary energy. f) Precision diagnostics including B-dot probes and Rogowski coils.
The B-dot probes waveforms confirmed that the arc was accelerating toward the railgun
muzzle as all seven stages discharged. A containment structure was designed and built using G-10 with numerous O-ring seals to achieve milliTorr pressures with air as the fill gas. Plasma leakage was reduced by applying a mechanical horizontal and vertical compression to the railgun core. The flange design proved to maintain vacuum and bore compression. Energy modules were designed utilizing compact film dielectric capacitors and a variable self-inductance scheme. When charged to 500 V, the modules output approximately 10 kA with a 100 µs pulse width.
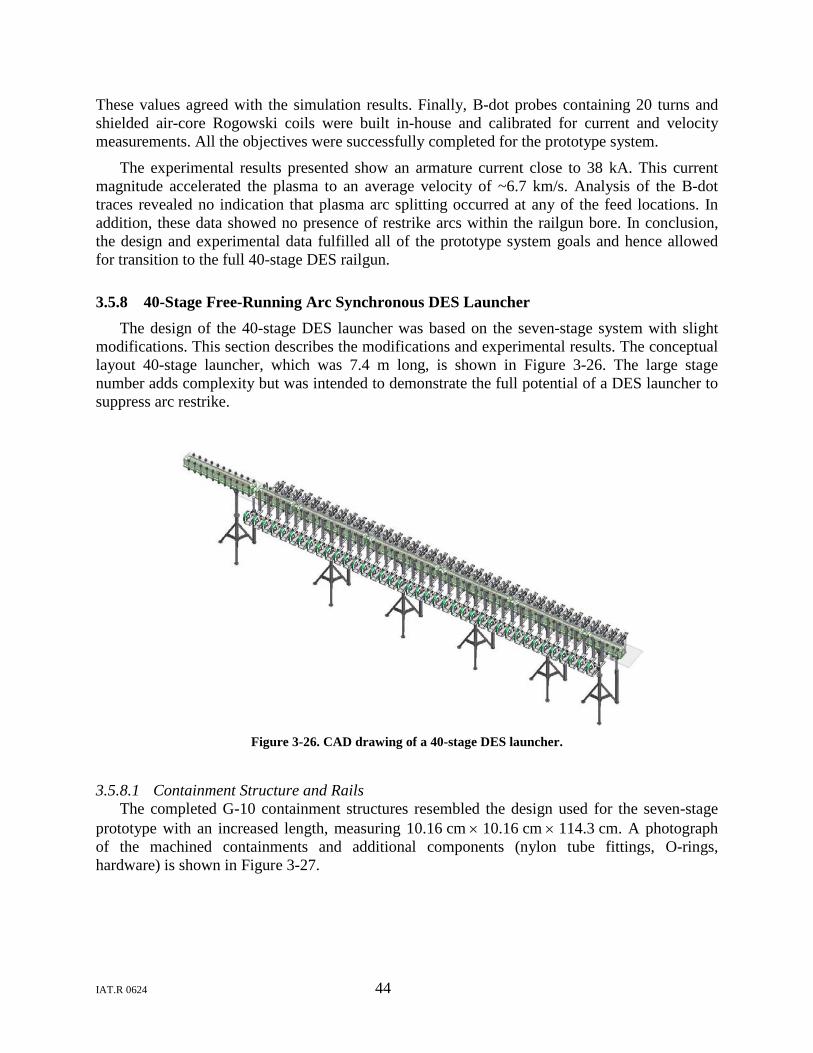
IAT.R 0624 44
These values agreed with the simulation results. Finally, B-dot probes containing 20 turns and shielded air-core Rogowski coils were built in-house and calibrated for current and velocity measurements. All the objectives were successfully completed for the prototype system.
The experimental results presented show an armature current close to 38 kA. This current magnitude accelerated the plasma to an average velocity of ~6.7 km/s. Analysis of the B-dot traces revealed no indication that plasma arc splitting occurred at any of the feed locations. In addition, these data showed no presence of restrike arcs within the railgun bore. In conclusion, the design and experimental data fulfilled all of the prototype system goals and hence allowed for transition to the full 40-stage DES railgun.
3.5.8 40-Stage Free-Running Arc Synchronous DES Launcher The design of the 40-stage DES launcher was based on the seven-stage system with slight
modifications. This section describes the modifications and experimental results. The conceptual layout 40-stage launcher, which was 7.4 m long, is shown in Figure 3-26. The large stage number adds complexity but was intended to demonstrate the full potential of a DES launcher to suppress arc restrike.
Figure 3-26. CAD drawing of a 40-stage DES launcher.
3.5.8.1 Containment Structure and Rails The completed G-10 containment structures resembled the design used for the seven-stage
prototype with an increased length, measuring 10.16 cm × 10.16 cm × 114.3 cm. A photograph of the machined containments and additional components (nylon tube fittings, O-rings, hardware) is shown in Figure 3-27.
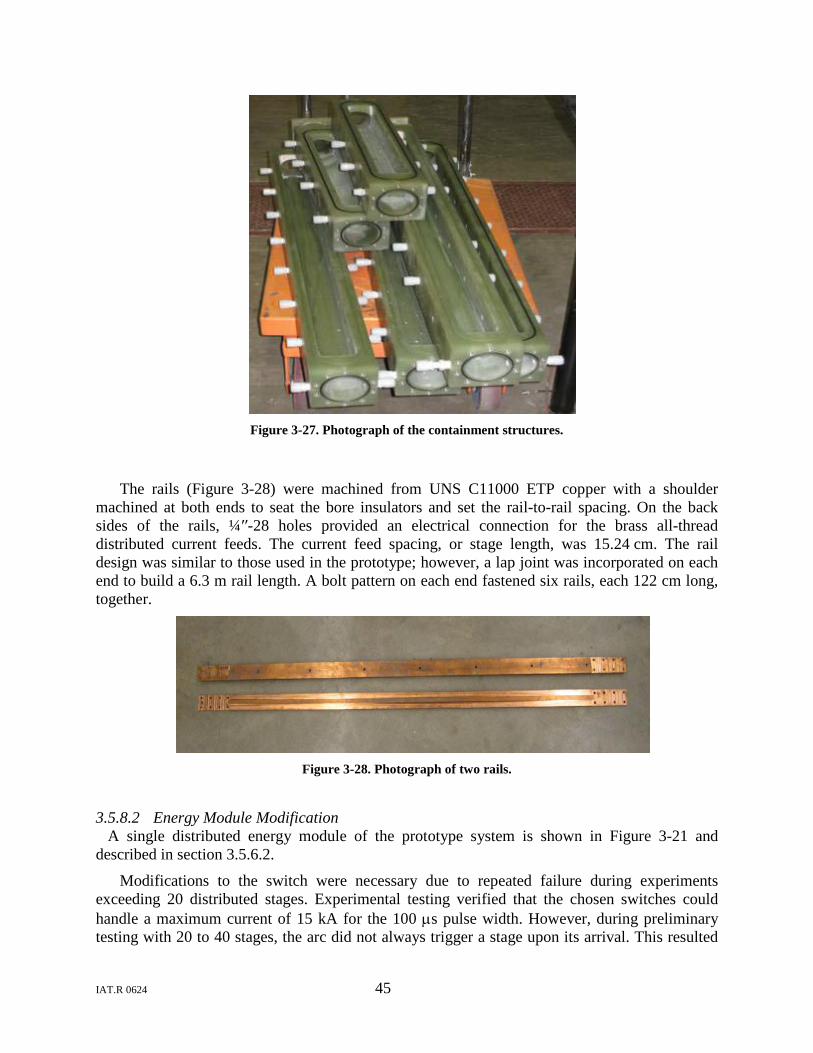
IAT.R 0624 45
Figure 3-27. Photograph of the containment structures.
The rails (Figure 3-28) were machined from UNS C11000 ETP copper with a shoulder machined at both ends to seat the bore insulators and set the rail-to-rail spacing. On the back sides of the rails, ¼′′-28 holes provided an electrical connection for the brass all-thread distributed current feeds. The current feed spacing, or stage length, was 15.24 cm. The rail design was similar to those used in the prototype; however, a lap joint was incorporated on each end to build a 6.3 m rail length. A bolt pattern on each end fastened six rails, each 122 cm long, together.
Figure 3-28. Photograph of two rails.
3.5.8.2 Energy Module Modification A single distributed energy module of the prototype system is shown in Figure 3-21 and
described in section 3.5.6.2.
Modifications to the switch were necessary due to repeated failure during experiments exceeding 20 distributed stages. Experimental testing verified that the chosen switches could handle a maximum current of 15 kA for the 100 µs pulse width. However, during preliminary testing with 20 to 40 stages, the arc did not always trigger a stage upon its arrival. This resulted
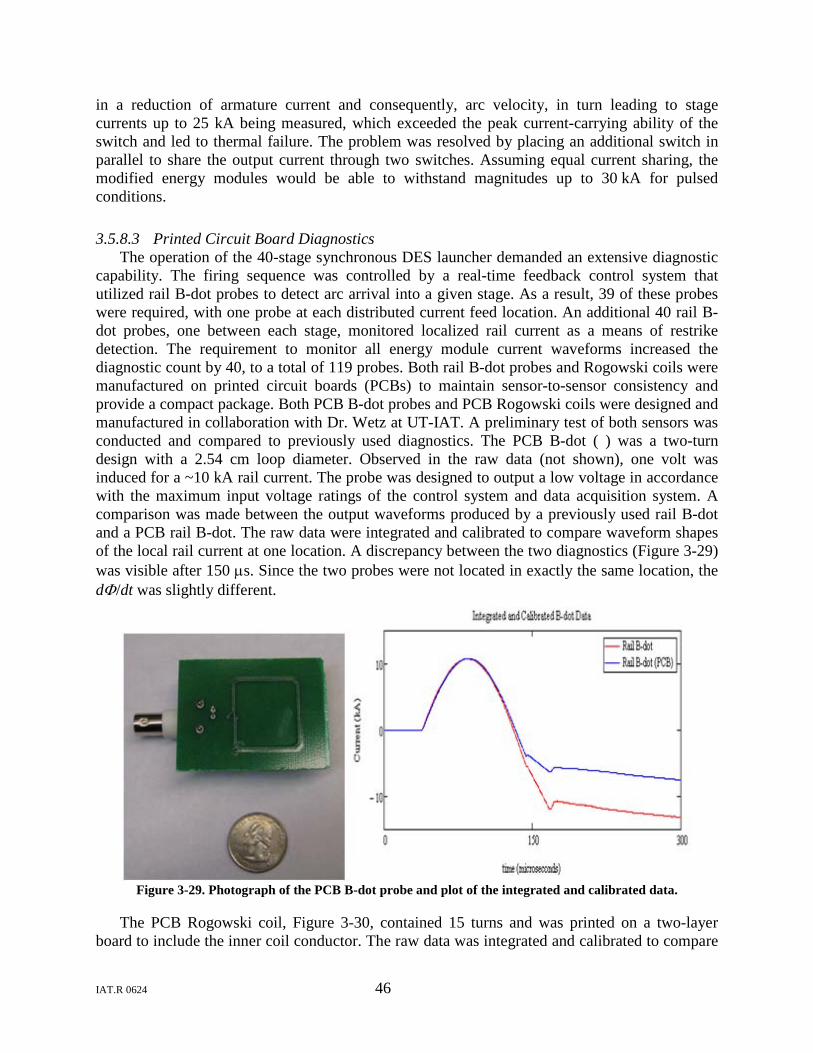
IAT.R 0624 46
in a reduction of armature current and consequently, arc velocity, in turn leading to stage currents up to 25 kA being measured, which exceeded the peak current-carrying ability of the switch and led to thermal failure. The problem was resolved by placing an additional switch in parallel to share the output current through two switches. Assuming equal current sharing, the modified energy modules would be able to withstand magnitudes up to 30 kA for pulsed conditions.
3.5.8.3 Printed Circuit Board Diagnostics The operation of the 40-stage synchronous DES launcher demanded an extensive diagnostic
capability. The firing sequence was controlled by a real-time feedback control system that utilized rail B-dot probes to detect arc arrival into a given stage. As a result, 39 of these probes were required, with one probe at each distributed current feed location. An additional 40 rail B-dot probes, one between each stage, monitored localized rail current as a means of restrike detection. The requirement to monitor all energy module current waveforms increased the diagnostic count by 40, to a total of 119 probes. Both rail B-dot probes and Rogowski coils were manufactured on printed circuit boards (PCBs) to maintain sensor-to-sensor consistency and provide a compact package. Both PCB B-dot probes and PCB Rogowski coils were designed and manufactured in collaboration with Dr. Wetz at UT-IAT. A preliminary test of both sensors was conducted and compared to previously used diagnostics. The PCB B-dot ( ) was a two-turn design with a 2.54 cm loop diameter. Observed in the raw data (not shown), one volt was induced for a ~10 kA rail current. The probe was designed to output a low voltage in accordance with the maximum input voltage ratings of the control system and data acquisition system. A comparison was made between the output waveforms produced by a previously used rail B-dot and a PCB rail B-dot. The raw data were integrated and calibrated to compare waveform shapes of the local rail current at one location. A discrepancy between the two diagnostics (Figure 3-29) was visible after 150 µs. Since the two probes were not located in exactly the same location, the dΦ/dt was slightly different.
Figure 3-29. Photograph of the PCB B-dot probe and plot of the integrated and calibrated data.
The PCB Rogowski coil, Figure 3-30, contained 15 turns and was printed on a two-layer board to include the inner coil conductor. The raw data was integrated and calibrated to compare
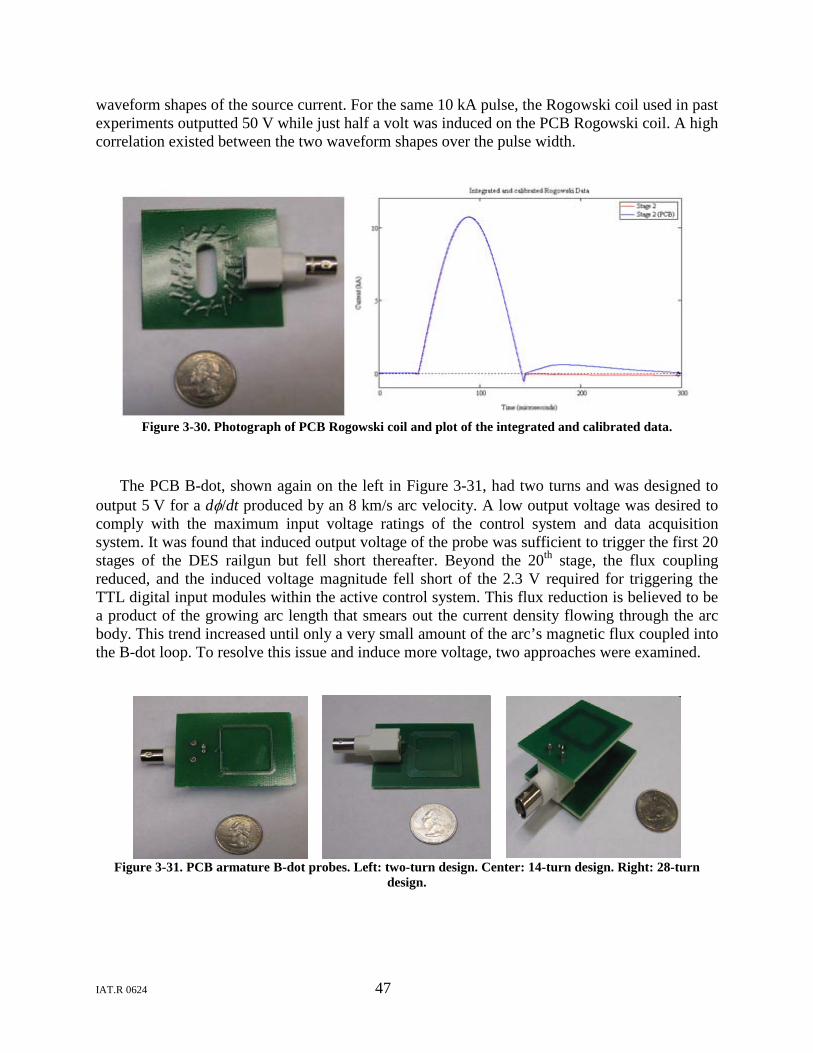
IAT.R 0624 47
waveform shapes of the source current. For the same 10 kA pulse, the Rogowski coil used in past experiments outputted 50 V while just half a volt was induced on the PCB Rogowski coil. A high correlation existed between the two waveform shapes over the pulse width.
Figure 3-30. Photograph of PCB Rogowski coil and plot of the integrated and calibrated data.
The PCB B-dot, shown again on the left in Figure 3-31, had two turns and was designed to output 5 V for a dφ/dt produced by an 8 km/s arc velocity. A low output voltage was desired to comply with the maximum input voltage ratings of the control system and data acquisition system. It was found that induced output voltage of the probe was sufficient to trigger the first 20 stages of the DES railgun but fell short thereafter. Beyond the 20th stage, the flux coupling reduced, and the induced voltage magnitude fell short of the 2.3 V required for triggering the TTL digital input modules within the active control system. This flux reduction is believed to be a product of the growing arc length that smears out the current density flowing through the arc body. This trend increased until only a very small amount of the arc’s magnetic flux coupled into the B-dot loop. To resolve this issue and induce more voltage, two approaches were examined.
Figure 3-31. PCB armature B-dot probes. Left: two-turn design. Center: 14-turn design. Right: 28-turn
design.

IAT.R 0624 48
The first option would be to move the probe closer to the plasma arc and the second approach would be to increase the number of turns on the probe. The latter was selected because the containment design would not allow the probes to be moved closer to the railgun bore. A new probe design, center in Figure 3-31, was implemented that consisted of 14 turns. These new probes provided enough signal amplification to trigger ten additional stages but lacked signal strength to trigger the last ten. To induce enough voltage to trigger stages 31–40, two of the 14-turn PCB probes were electrically connected in series, shown on the right in Figure 3-31, doubling the turn ratio to 28. This magnetic flux reduction problem would not be encountered with a solid armature embodying a fixed length.
3.5.8.4 Data Acquisition System The 40-stage system required 79 signals to be recorded for each experimental test. A large-
scale data acquisition (DAQ) system was therefore required. The hardware (Figure 3-32) and software selected for the task were designed and manufactured by National Instruments.
The selected DAQ system was a stand-alone device equipped with a controller (PN# PXI-8106) that contained:
• 2.16 Intel GHz Core 2 Duo T7400 dual-core processor • 250 GB SATA hard drive • 1 GB DDR2 RAM • Windows XP
Only analog input modules were required since both the B-dots and the Rogowski coils output analog signal waveforms. The purchased DAQ system contained ten eight-channel analog input modules (PN# PXI-6133) capable of simultaneous sampling at a maximum 2.5 MS/s using an onboard sample clock. The appropriate sampling rate was determined from past B-dot and Rogowski coil experimental data. Four input voltage ranges could be set from ±1.25 to ±10 V (±10 V was set for this system). The analog input modules had a 14 bit resolution which allowed them to detect voltage differences of 0.5 mV. Provided with 16 MS of onboard memory, the device can collect 0.8 s of data while sampling all eight channels at 2.5 MS/s. This fell well within the required data collection time interval because the 40-stage railgun current pulse width was approximately 1 ms. In addition, the modules contained two 24 bit counter/timers and eight hardware-timed digital I/O lines. Additional over voltage/current protection was added to protect the sensitive inputs. External circuitry consisting of fast-acting fuses and transient voltage suppressors (TVS) clamped the input voltage to ±10 V and limited the current to 62 mA.
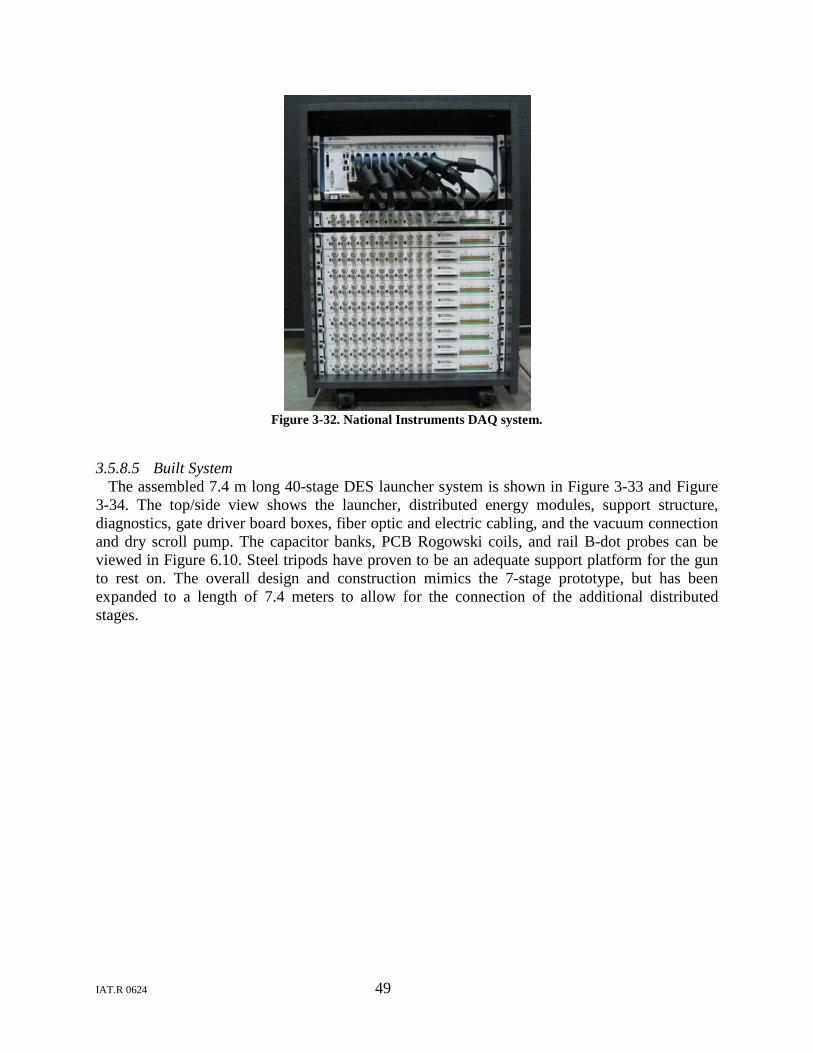
IAT.R 0624 49
Figure 3-32. National Instruments DAQ system.
3.5.8.5 Built System The assembled 7.4 m long 40-stage DES launcher system is shown in Figure 3-33 and Figure
3-34. The top/side view shows the launcher, distributed energy modules, support structure, diagnostics, gate driver board boxes, fiber optic and electric cabling, and the vacuum connection and dry scroll pump. The capacitor banks, PCB Rogowski coils, and rail B-dot probes can be viewed in Figure 6.10. Steel tripods have proven to be an adequate support platform for the gun to rest on. The overall design and construction mimics the 7-stage prototype, but has been expanded to a length of 7.4 meters to allow for the connection of the additional distributed stages.
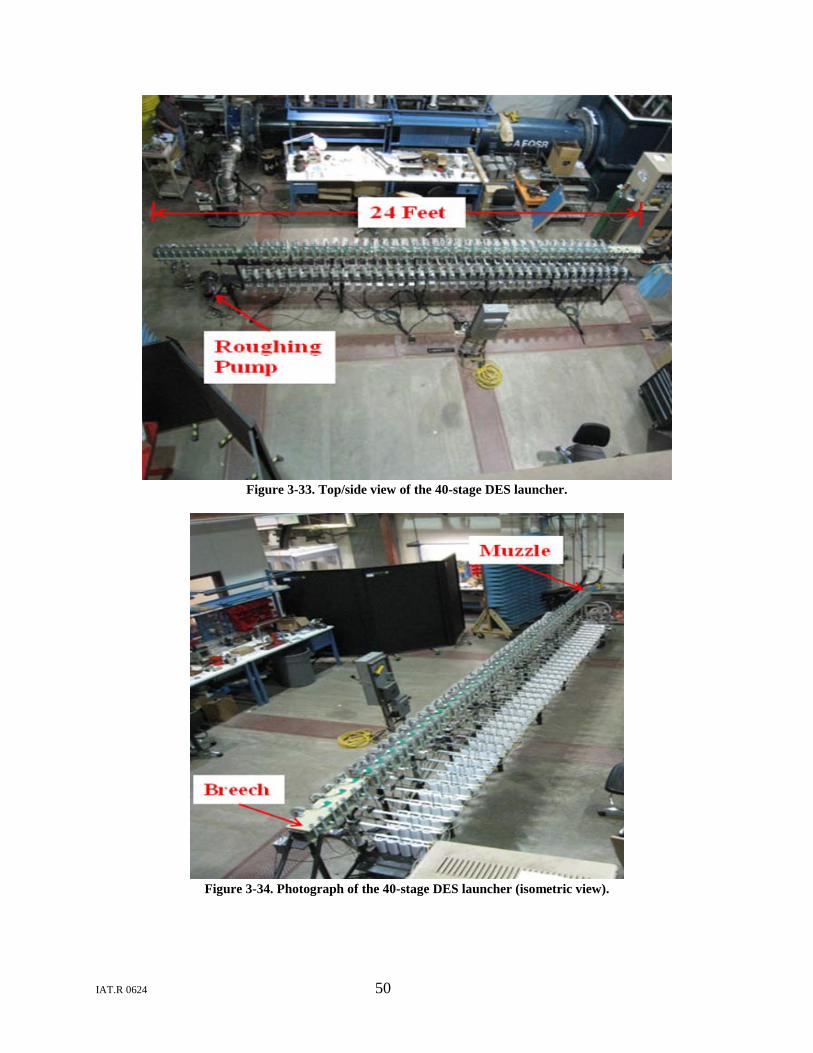
IAT.R 0624 50
Figure 3-33. Top/side view of the 40-stage DES launcher.
Figure 3-34. Photograph of the 40-stage DES launcher (isometric view).
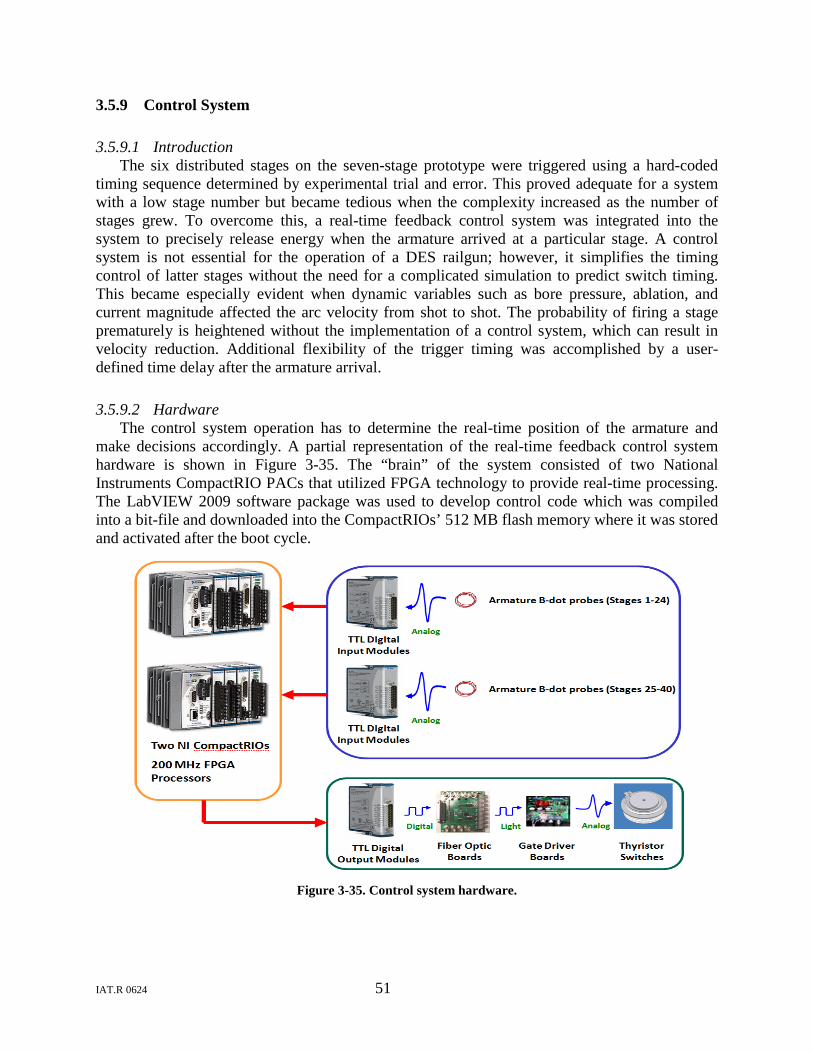
IAT.R 0624 51
3.5.9 Control System
3.5.9.1 Introduction The six distributed stages on the seven-stage prototype were triggered using a hard-coded
timing sequence determined by experimental trial and error. This proved adequate for a system with a low stage number but became tedious when the complexity increased as the number of stages grew. To overcome this, a real-time feedback control system was integrated into the system to precisely release energy when the armature arrived at a particular stage. A control system is not essential for the operation of a DES railgun; however, it simplifies the timing control of latter stages without the need for a complicated simulation to predict switch timing. This became especially evident when dynamic variables such as bore pressure, ablation, and current magnitude affected the arc velocity from shot to shot. The probability of firing a stage prematurely is heightened without the implementation of a control system, which can result in velocity reduction. Additional flexibility of the trigger timing was accomplished by a user-defined time delay after the armature arrival.
3.5.9.2 Hardware The control system operation has to determine the real-time position of the armature and
make decisions accordingly. A partial representation of the real-time feedback control system hardware is shown in Figure 3-35. The “brain” of the system consisted of two National Instruments CompactRIO PACs that utilized FPGA technology to provide real-time processing. The LabVIEW 2009 software package was used to develop control code which was compiled into a bit-file and downloaded into the CompactRIOs’ 512 MB flash memory where it was stored and activated after the boot cycle.
Figure 3-35. Control system hardware.
IAT.R 0624 52
Thirty nine armature B-dot probes supplied the real-time feedback signals. These probes were incrementally located at each distributed current feed. The induced armature B-dot voltage signals resembled a single cycle of a sine wave. A positive voltage was induced as the armature approached the probe and the polarity flipped as the armature moved away from the probe. The armature detection occurred on the rising edge of the feedback signal which indicated its arrival at the probe location. The B-dot voltage signals were sent to the CompactRIOs where five eight-channel NI 9401 TTL digital input modules measured the induced voltages. The AND gates within the digital input module provided a faster detection method than measurements using analog input modules. This device functioned as a switch because of its digital nature, which can interpret the signals in two ways. When the signal amplitudes were below 2.3 V, the TTL device remained in a “low” state (“open” when represented as a switch). Signal amplitude above 2.3 V corresponds to a “high” state (closed by representation of a switch). The induced voltage within the B-dot probes typically exceeded 5 V due to the dφ/dt and probe design. Input signals in excess of 5 V could have damaged the module’s channels; therefore, external ±10 V TVS were integrated to clamp the circuit voltage and provide protection.
A LabVIEW 2009 program determined the appropriate switch timing for each energy module. To initiate the release of current from an energy module, five eight-channel NI 9401 TTL digital output modules provided a 10 µs, 5 V pulse to a fiber optic board on the respected stage channel. Gate driver boards received the light signals and converted them to 10 µs, 15 V analog pulses to trigger the stage’s corresponding SCR gate and release the stored energy in the capacitor banks.
3.5.9.3 Software The control code was developed using the LabVIEW 2009 software package and then
compiled into a bit-file and finally downloaded into the CompactRIOs’ 512 MB flash memory where it was stored and activated after the boot cycle. A flow chart of the control program is shown in Figure 3-36. The program began with an event sequence (not shown) that waited for one second to allow the CompactRIO to complete its boot configurations. The next event set line directions and checked the status of the digital input/output modules. After these tasks were completed a Boolean TRUE was assigned to two local variables that controlled the DAQ system and plasma gun triggering. These local variables were read by a pulse generating program to output the two 10 µs, 5 V digital pulses required to initiate the DAQ and fire the plasma source. The following event waited 1 µs to allow for the plasma to disperse in the breech region. As the plasma expanded, a Boolean TRUE was assigned to a local variable that controlled the first stage firing. Once again this local variable was read by a pulse generating program which outputted a signal to fire the first energy module, causing a high-voltage breakdown across the rail gap and initiating the Lorentz driving force to accelerate the arc.
IAT.R 0624 53
Figure 3-36. Flow chart of the control program.
As the plasma traveled through the bore, the distributed stage firing sequence began with an event to read the armature B-dot sensor located at the second stage current feed. This event continued to loop until a 2.3 V threshold voltage was obtained or exceeded. A user-defined time delay was then executed to control the fire timing of the second stage. This distributed stage firing sequence procedure was continued to detect the armature position and trigger the remaining stages.
3.5.10 Experimental Results Three different energy schemes were experimentally tested and the results are discussed in
this section. The first energy scheme is referred to as “asynchronous” and allows only positive current to be discharged by the capacitor banks. This is accomplished by opening the current loop containing an antiparallel diode which is electrical connected in parallel with the thyristor. The second energy scheme is referred to as “synchronous” and allows negative current to flow through the system. An antiparallel diode connected in parallel with the thyristor allows the capacitor bank to ring and produces under-damped waveforms. This energy scheme provides negative current to cancel out residual positive current that is trailing behind the armature. The result is an enhanced isolation of the electric flux in the bore behind the armature. The final energy scheme experimentally tested is the breech-fed configuration. The breech-fed scheme is historically known to produce restrike under sufficient conditions. A similar current pulse that was implemented on the DES schemes is sourced at the railgun breech in attempt to create a restrike arc and validate Parker’s theory.
IAT.R 0624 54
3.5.10.1 Asynchronous Energy Concept The current waveforms for a 40-stage free-running arc asynchronous DES launcher
experiment, along with a summed armature current waveform, are displayed in Figure 3-37. During the experiment, the containment structure was evacuated to roughly 14 mTorr. The first stage was charged to 1,000 V and provided a maximum 31 kA for a pulse width of 150 µs. Stages 2 through 40 were charged to 650 V, and each stage output 10–15 kA with a 100 µs pulse width. The triggering of stages 2 through 40 was controlled by the active feedback control system.
Figure 3-37. Current waveforms from a 40-stage asynchronous DES launcher experiment.
An attempt was made to produce a square pulse armature current waveform. The waveform produced loosely resembles a square wave with a pulse width of 550 µs. The maximum armature current was ~ 83 kA at 500 µs. The plasma accelerated to a maximum velocity of ~19.1 km/s from 400 µs to 416 µs. The average measured velocity was ~13.8 km/s calculated using the armature B-dot data shown in Figure 3-38. Analysis of these B-dot traces reveals no indication that arc splitting occurred at any of the feed locations or that a restrike arc was formed.
IAT.R 0624 55
Figure 3-38. Armature B-dot waveforms from a 40-stage asynchronous DES launcher experiment.
3.5.10.2 Synchronous Energy Concept The current waveforms for a 40-stage free-running arc synchronous DES launcher experiment,
along with a summed armature current waveform, are displayed in Figure 3-39. During the experiment, the containment structure was evacuated to roughly 12 mTorr. The first stage was charged to 1,000 V and provided a maximum of 31 kA for a pulse width of 150 µs. Stages 2 through 40 were charged to 825 V, and each stage put out 12 to 21 kA with a 100 µs pulse width. As in the asynchronous test, triggering was done with the active feedback control system.
Figure 3-39. Current waveforms from a 40-stage synchronous DES launcher experiment.
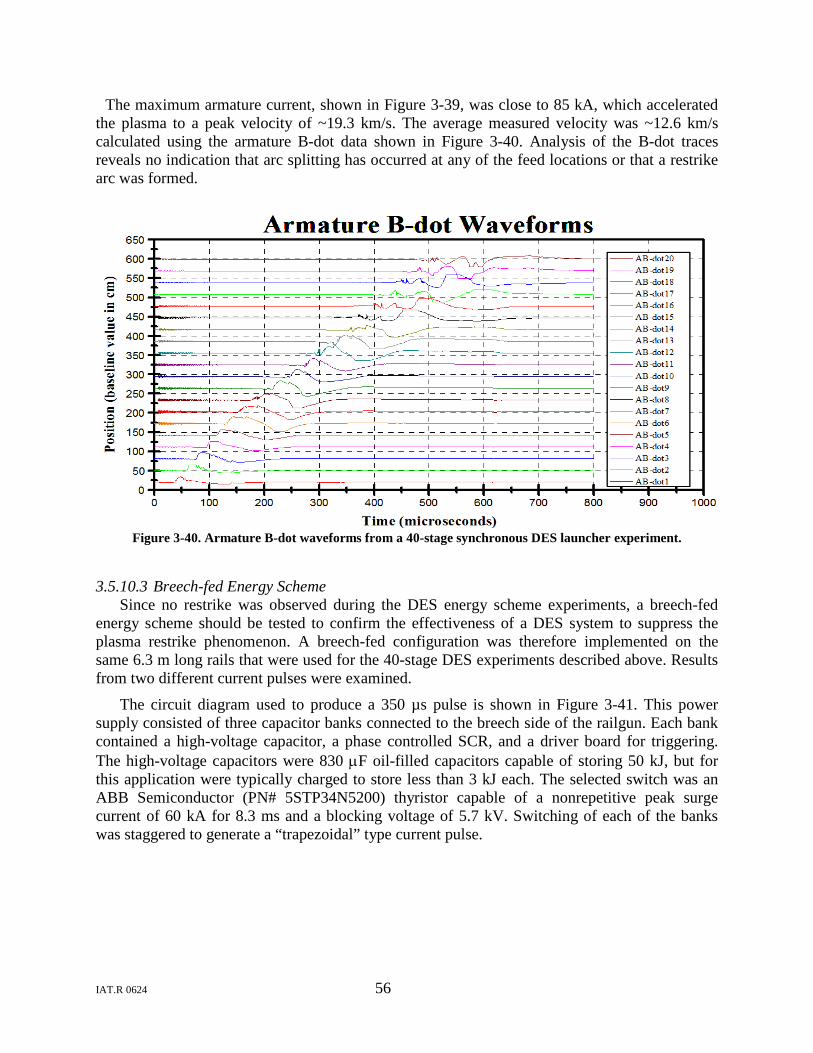
IAT.R 0624 56
The maximum armature current, shown in Figure 3-39, was close to 85 kA, which accelerated the plasma to a peak velocity of ~19.3 km/s. The average measured velocity was ~12.6 km/s calculated using the armature B-dot data shown in Figure 3-40. Analysis of the B-dot traces reveals no indication that arc splitting has occurred at any of the feed locations or that a restrike arc was formed.
Figure 3-40. Armature B-dot waveforms from a 40-stage synchronous DES launcher experiment.
3.5.10.3 Breech-fed Energy Scheme Since no restrike was observed during the DES energy scheme experiments, a breech-fed
energy scheme should be tested to confirm the effectiveness of a DES system to suppress the plasma restrike phenomenon. A breech-fed configuration was therefore implemented on the same 6.3 m long rails that were used for the 40-stage DES experiments described above. Results from two different current pulses were examined.
The circuit diagram used to produce a 350 µs pulse is shown in Figure 3-41. This power supply consisted of three capacitor banks connected to the breech side of the railgun. Each bank contained a high-voltage capacitor, a phase controlled SCR, and a driver board for triggering. The high-voltage capacitors were 830 µF oil-filled capacitors capable of storing 50 kJ, but for this application were typically charged to store less than 3 kJ each. The selected switch was an ABB Semiconductor (PN# 5STP34N5200) thyristor capable of a nonrepetitive peak surge current of 60 kA for 8.3 ms and a blocking voltage of 5.7 kV. Switching of each of the banks was staggered to generate a “trapezoidal” type current pulse.
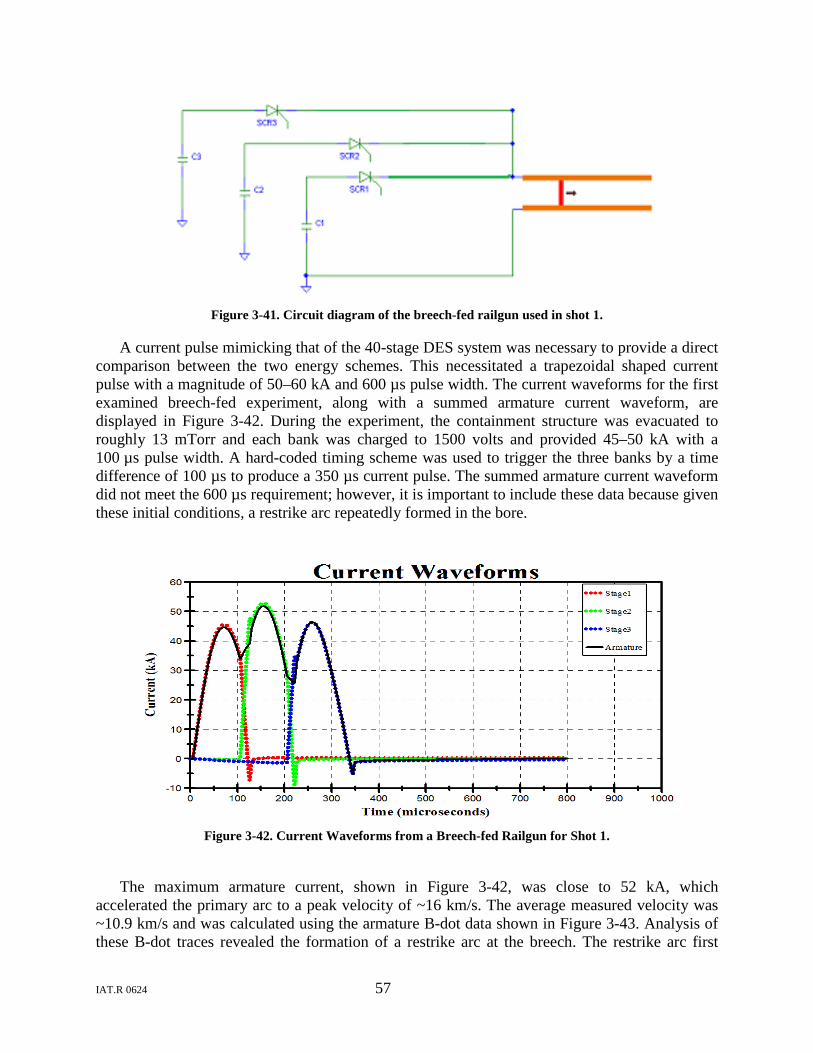
IAT.R 0624 57
Figure 3-41. Circuit diagram of the breech-fed railgun used in shot 1.
A current pulse mimicking that of the 40-stage DES system was necessary to provide a direct comparison between the two energy schemes. This necessitated a trapezoidal shaped current pulse with a magnitude of 50–60 kA and 600 µs pulse width. The current waveforms for the first examined breech-fed experiment, along with a summed armature current waveform, are displayed in Figure 3-42. During the experiment, the containment structure was evacuated to roughly 13 mTorr and each bank was charged to 1500 volts and provided 45–50 kA with a 100 µs pulse width. A hard-coded timing scheme was used to trigger the three banks by a time difference of 100 µs to produce a 350 µs current pulse. The summed armature current waveform did not meet the 600 µs requirement; however, it is important to include these data because given these initial conditions, a restrike arc repeatedly formed in the bore.
Figure 3-42. Current Waveforms from a Breech-fed Railgun for Shot 1.
The maximum armature current, shown in Figure 3-42, was close to 52 kA, which
accelerated the primary arc to a peak velocity of ~16 km/s. The average measured velocity was ~10.9 km/s and was calculated using the armature B-dot data shown in Figure 3-43. Analysis of these B-dot traces revealed the formation of a restrike arc at the breech. The restrike arc first
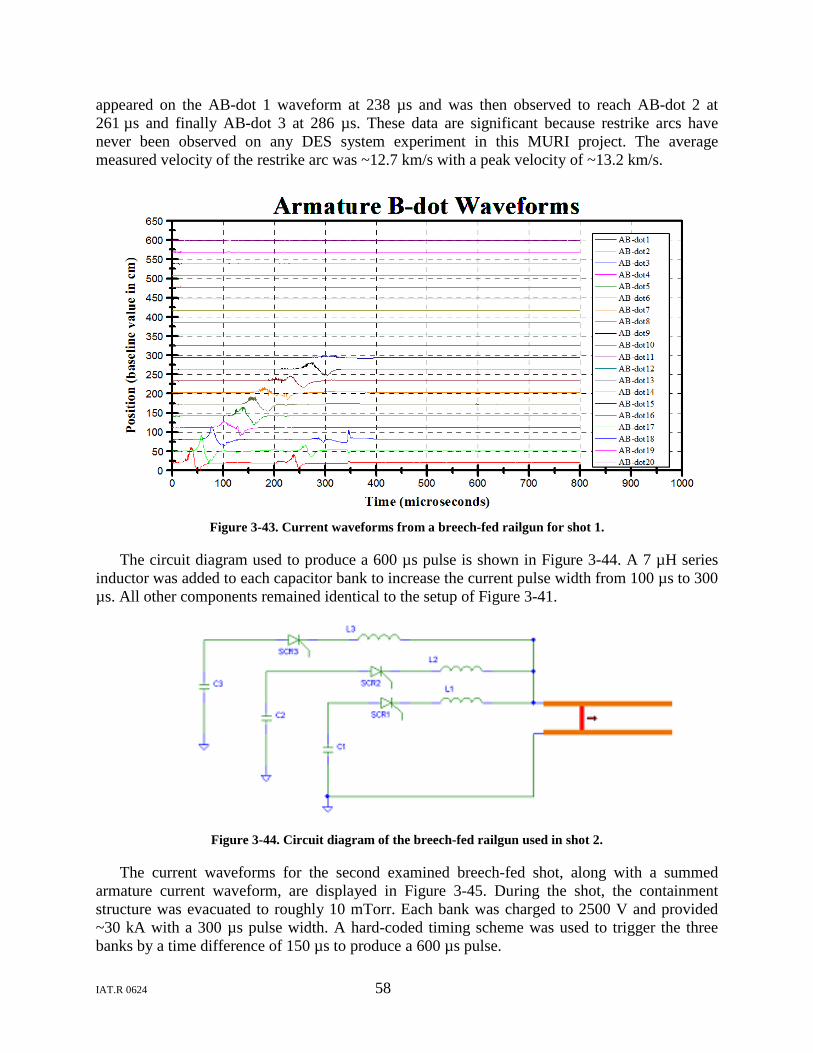
IAT.R 0624 58
appeared on the AB-dot 1 waveform at 238 µs and was then observed to reach AB-dot 2 at 261 µs and finally AB-dot 3 at 286 µs. These data are significant because restrike arcs have never been observed on any DES system experiment in this MURI project. The average measured velocity of the restrike arc was ~12.7 km/s with a peak velocity of ~13.2 km/s.
Figure 3-43. Current waveforms from a breech-fed railgun for shot 1.
The circuit diagram used to produce a 600 µs pulse is shown in Figure 3-44. A 7 µH series inductor was added to each capacitor bank to increase the current pulse width from 100 µs to 300 µs. All other components remained identical to the setup of Figure 3-41.
Figure 3-44. Circuit diagram of the breech-fed railgun used in shot 2.
The current waveforms for the second examined breech-fed shot, along with a summed armature current waveform, are displayed in Figure 3-45. During the shot, the containment structure was evacuated to roughly 10 mTorr. Each bank was charged to 2500 V and provided ~30 kA with a 300 µs pulse width. A hard-coded timing scheme was used to trigger the three banks by a time difference of 150 µs to produce a 600 µs pulse.
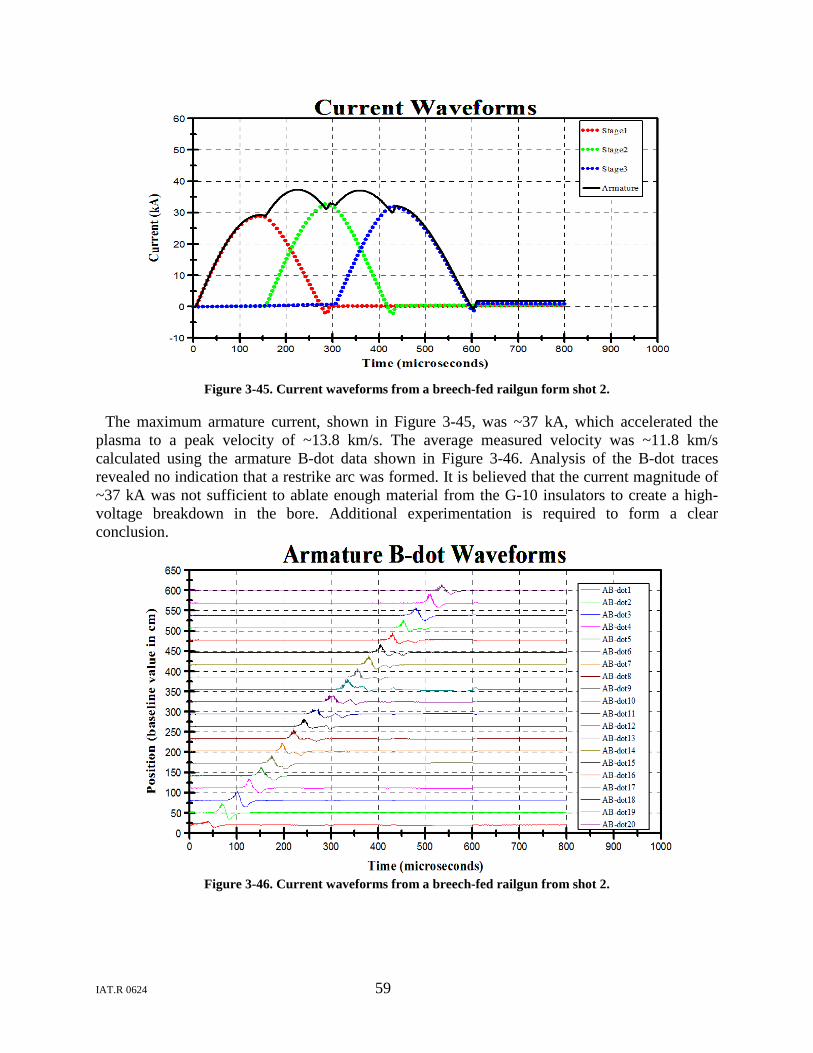
IAT.R 0624 59
Figure 3-45. Current waveforms from a breech-fed railgun form shot 2.
The maximum armature current, shown in Figure 3-45, was ~37 kA, which accelerated the plasma to a peak velocity of ~13.8 km/s. The average measured velocity was ~11.8 km/s calculated using the armature B-dot data shown in Figure 3-46. Analysis of the B-dot traces revealed no indication that a restrike arc was formed. It is believed that the current magnitude of ~37 kA was not sufficient to ablate enough material from the G-10 insulators to create a high-voltage breakdown in the bore. Additional experimentation is required to form a clear conclusion.
Figure 3-46. Current waveforms from a breech-fed railgun from shot 2.
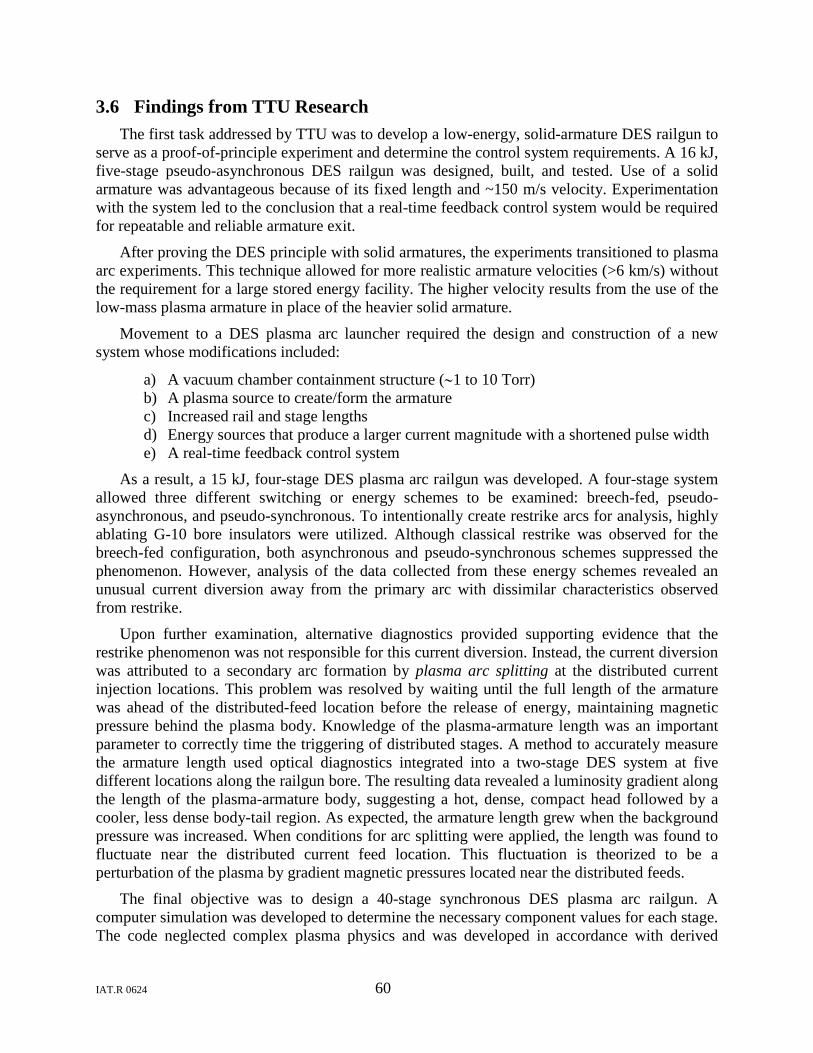
IAT.R 0624 60
3.6 Findings from TTU Research The first task addressed by TTU was to develop a low-energy, solid-armature DES railgun to
serve as a proof-of-principle experiment and determine the control system requirements. A 16 kJ, five-stage pseudo-asynchronous DES railgun was designed, built, and tested. Use of a solid armature was advantageous because of its fixed length and ~150 m/s velocity. Experimentation with the system led to the conclusion that a real-time feedback control system would be required for repeatable and reliable armature exit.
After proving the DES principle with solid armatures, the experiments transitioned to plasma arc experiments. This technique allowed for more realistic armature velocities (>6 km/s) without the requirement for a large stored energy facility. The higher velocity results from the use of the low-mass plasma armature in place of the heavier solid armature.
Movement to a DES plasma arc launcher required the design and construction of a new system whose modifications included:
a) A vacuum chamber containment structure (∼1 to 10 Torr) b) A plasma source to create/form the armature c) Increased rail and stage lengths d) Energy sources that produce a larger current magnitude with a shortened pulse width e) A real-time feedback control system
As a result, a 15 kJ, four-stage DES plasma arc railgun was developed. A four-stage system allowed three different switching or energy schemes to be examined: breech-fed, pseudo-asynchronous, and pseudo-synchronous. To intentionally create restrike arcs for analysis, highly ablating G-10 bore insulators were utilized. Although classical restrike was observed for the breech-fed configuration, both asynchronous and pseudo-synchronous schemes suppressed the phenomenon. However, analysis of the data collected from these energy schemes revealed an unusual current diversion away from the primary arc with dissimilar characteristics observed from restrike.
Upon further examination, alternative diagnostics provided supporting evidence that the restrike phenomenon was not responsible for this current diversion. Instead, the current diversion was attributed to a secondary arc formation by plasma arc splitting at the distributed current injection locations. This problem was resolved by waiting until the full length of the armature was ahead of the distributed-feed location before the release of energy, maintaining magnetic pressure behind the plasma body. Knowledge of the plasma-armature length was an important parameter to correctly time the triggering of distributed stages. A method to accurately measure the armature length used optical diagnostics integrated into a two-stage DES system at five different locations along the railgun bore. The resulting data revealed a luminosity gradient along the length of the plasma-armature body, suggesting a hot, dense, compact head followed by a cooler, less dense body-tail region. As expected, the armature length grew when the background pressure was increased. When conditions for arc splitting were applied, the length was found to fluctuate near the distributed current feed location. This fluctuation is theorized to be a perturbation of the plasma by gradient magnetic pressures located near the distributed feeds.
The final objective was to design a 40-stage synchronous DES plasma arc railgun. A computer simulation was developed to determine the necessary component values for each stage. The code neglected complex plasma physics and was developed in accordance with derived
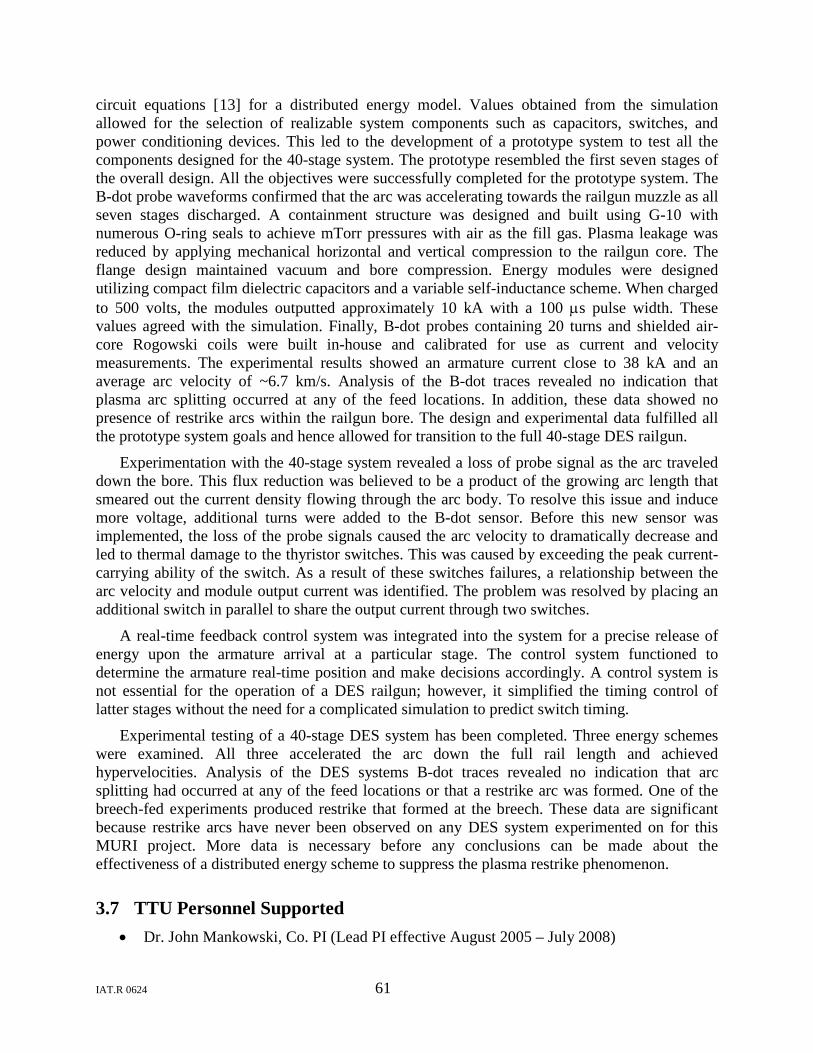
IAT.R 0624 61
circuit equations [13
Experimentation with the 40-stage system revealed a loss of probe signal as the arc traveled down the bore. This flux reduction was believed to be a product of the growing arc length that smeared out the current density flowing through the arc body. To resolve this issue and induce more voltage, additional turns were added to the B-dot sensor. Before this new sensor was implemented, the loss of the probe signals caused the arc velocity to dramatically decrease and led to thermal damage to the thyristor switches. This was caused by exceeding the peak current-carrying ability of the switch. As a result of these switches failures, a relationship between the arc velocity and module output current was identified. The problem was resolved by placing an additional switch in parallel to share the output current through two switches.
] for a distributed energy model. Values obtained from the simulation allowed for the selection of realizable system components such as capacitors, switches, and power conditioning devices. This led to the development of a prototype system to test all the components designed for the 40-stage system. The prototype resembled the first seven stages of the overall design. All the objectives were successfully completed for the prototype system. The B-dot probe waveforms confirmed that the arc was accelerating towards the railgun muzzle as all seven stages discharged. A containment structure was designed and built using G-10 with numerous O-ring seals to achieve mTorr pressures with air as the fill gas. Plasma leakage was reduced by applying mechanical horizontal and vertical compression to the railgun core. The flange design maintained vacuum and bore compression. Energy modules were designed utilizing compact film dielectric capacitors and a variable self-inductance scheme. When charged to 500 volts, the modules outputted approximately 10 kA with a 100 µs pulse width. These values agreed with the simulation. Finally, B-dot probes containing 20 turns and shielded air-core Rogowski coils were built in-house and calibrated for use as current and velocity measurements. The experimental results showed an armature current close to 38 kA and an average arc velocity of ~6.7 km/s. Analysis of the B-dot traces revealed no indication that plasma arc splitting occurred at any of the feed locations. In addition, these data showed no presence of restrike arcs within the railgun bore. The design and experimental data fulfilled all the prototype system goals and hence allowed for transition to the full 40-stage DES railgun.
A real-time feedback control system was integrated into the system for a precise release of energy upon the armature arrival at a particular stage. The control system functioned to determine the armature real-time position and make decisions accordingly. A control system is not essential for the operation of a DES railgun; however, it simplified the timing control of latter stages without the need for a complicated simulation to predict switch timing.
Experimental testing of a 40-stage DES system has been completed. Three energy schemes were examined. All three accelerated the arc down the full rail length and achieved hypervelocities. Analysis of the DES systems B-dot traces revealed no indication that arc splitting had occurred at any of the feed locations or that a restrike arc was formed. One of the breech-fed experiments produced restrike that formed at the breech. These data are significant because restrike arcs have never been observed on any DES system experimented on for this MURI project. More data is necessary before any conclusions can be made about the effectiveness of a distributed energy scheme to suppress the plasma restrike phenomenon.
3.7 TTU Personnel Supported • Dr. John Mankowski, Co. PI (Lead PI effective August 2005 – July 2008)
IAT.R 0624 62
• Dr. Mike Giesselmann, Co. PI (Lead PI effective July 2008 – August 2009)
• Ryan Karhi, Ph.D. student (Graduated with Ph.D. in electrical engineering on December 2010)
• David Wetz, Ph.D. student (Graduated with Ph.D. in electrical engineering on December 2006)
• Brent McHale, Ph.D. student (Graduated with Ph.D. in electrical engineering on May 2008)
• Bryan McDaniel, graduate student (Graduated with MS in electrical engineering on December 2006)
• Jeff Diehl, graduate student (Graduated with MS in mechanical engineering in July 2010)
• Patrick Kelly, undergraduate student (assisted during September 2009 – January 2010)
• Shannon Gray, machinist
3.8 TTU Publications Presented at the 2006 EML Symposium entitled “A Bench Top Railgun with Distributed Energy Sources” with authors J. Mankowski, B. McDaniel, J. Dickens, M. Giesselmann, and M. Kristiansen. Additionally, this paper was accepted for the IEEE Transactions on Magnetics Special Issue.
Submitted to the 2006 International Conference on Megagauss Magnetic Field Generation and Related Topics entitled “A Bench Top Railgun with Distributed Energy Sources and Diagnostics,” with authors B. McDaniel, J. Mankowski, D. Wetz, B. McHale, and M. Kristiansen.
Submitted to the 2006 International Conference on Megagauss Magnetic Field Generation and Related Topics entitled “Real Time Feedback Control System for an Electromagnetic Launcher,” with authors R. Karhi, J. Mankowski, M. Kristiansen, D. Hemmert, and S. Holt.
R. Karhi, J. Mankowski, J. Dickens, M. Kristiansen, and D. Wetz, “Secondary Arc Formation within a Distributed Energy Railgun,” IEEE Transactions on Plasma Science, Vol. 36, No. 5, October 2008.
R. Karhi, J. Mankowski, and M. Kristiansen, “A 40 Stage Synchronous Free-running Arc Distributed Energy Railgun Simulation”, 2008 IEEE International Power Modulator Conference, Las Vegas, Nevada, May 2008.
R. Karhi, J. Mankowski, and M. Kristiansen, “Analysis of Distributed Energy Railguns to Suppress Secondary Arc Formation,” 2008 International EML Symposium, Victoria, B.C., June 2008.
R. Karhi, D. Wetz, M. Giesselmann, J. Mankowski, J. Diehl, and P. Kelly, “A 40-Stage Synchronous Distributed Energy Railgun,” IEEE Transactions on Plasma Science, Special Issue—Selected Papers from EML Symposium 2010, accepted for publication.
R. Karhi, “A Multi-Stage Distributed Energy Plasma Arc Railgun,” Dissertation, Texas Tech University, December 2010.
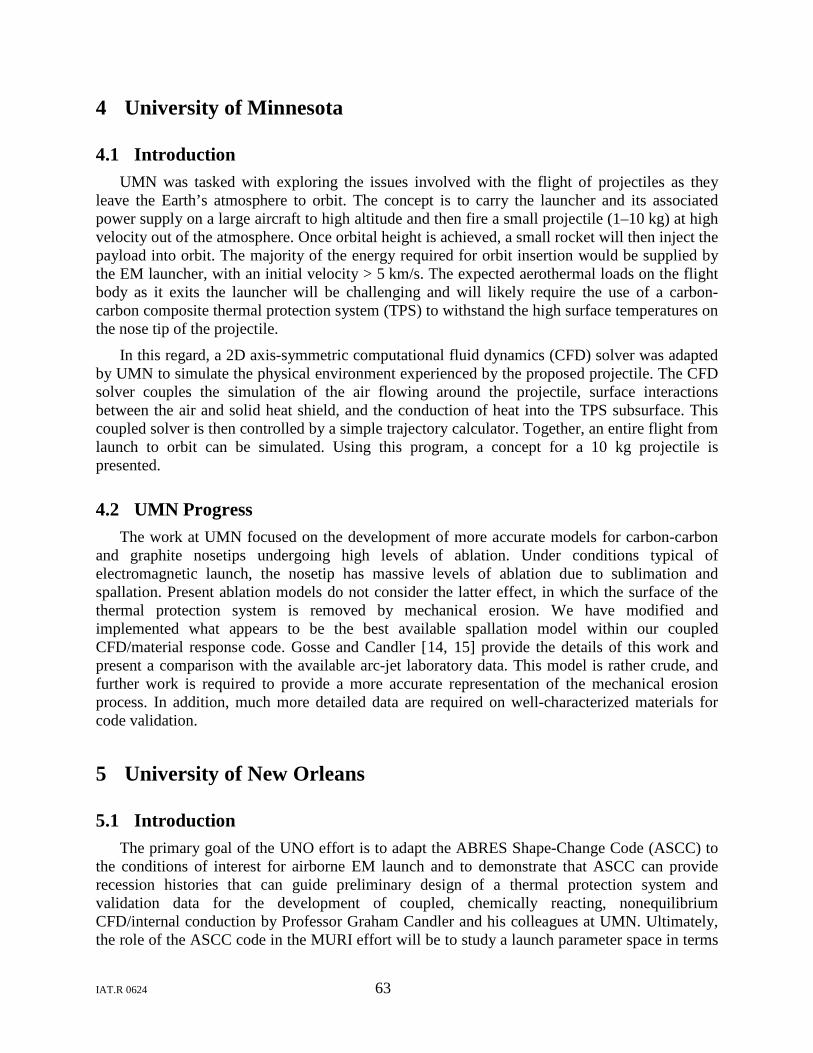
IAT.R 0624 63
4 University of Minnesota
4.1 Introduction UMN was tasked with exploring the issues involved with the flight of projectiles as they
leave the Earth’s atmosphere to orbit. The concept is to carry the launcher and its associated power supply on a large aircraft to high altitude and then fire a small projectile (1–10 kg) at high velocity out of the atmosphere. Once orbital height is achieved, a small rocket will then inject the payload into orbit. The majority of the energy required for orbit insertion would be supplied by the EM launcher, with an initial velocity > 5 km/s. The expected aerothermal loads on the flight body as it exits the launcher will be challenging and will likely require the use of a carbon-carbon composite thermal protection system (TPS) to withstand the high surface temperatures on the nose tip of the projectile.
In this regard, a 2D axis-symmetric computational fluid dynamics (CFD) solver was adapted by UMN to simulate the physical environment experienced by the proposed projectile. The CFD solver couples the simulation of the air flowing around the projectile, surface interactions between the air and solid heat shield, and the conduction of heat into the TPS subsurface. This coupled solver is then controlled by a simple trajectory calculator. Together, an entire flight from launch to orbit can be simulated. Using this program, a concept for a 10 kg projectile is presented.
4.2 UMN Progress The work at UMN focused on the development of more accurate models for carbon-carbon
and graphite nosetips undergoing high levels of ablation. Under conditions typical of electromagnetic launch, the nosetip has massive levels of ablation due to sublimation and spallation. Present ablation models do not consider the latter effect, in which the surface of the thermal protection system is removed by mechanical erosion. We have modified and implemented what appears to be the best available spallation model within our coupled CFD/material response code. Gosse and Candler [14, 15
5 University of New Orleans
] provide the details of this work and present a comparison with the available arc-jet laboratory data. This model is rather crude, and further work is required to provide a more accurate representation of the mechanical erosion process. In addition, much more detailed data are required on well-characterized materials for code validation.
5.1 Introduction The primary goal of the UNO effort is to adapt the ABRES Shape-Change Code (ASCC) to
the conditions of interest for airborne EM launch and to demonstrate that ASCC can provide recession histories that can guide preliminary design of a thermal protection system and validation data for the development of coupled, chemically reacting, nonequilibrium CFD/internal conduction by Professor Graham Candler and his colleagues at UMN. Ultimately, the role of the ASCC code in the MURI effort will be to study a launch parameter space in terms
IAT.R 0624 64
of launch velocity, launch angle, and final orbital altitude to determine optimum launch velocities and angles that will minimize the total parasitic mass (thermal protection system and propellant fuel to circularize the orbit) for desired orbital altitudes. The designs can then be validated and further refined with the codes developed by Professor Candler and his group at UMN.
In the UNO effort, ballistic and lifting trajectories of a nominal 10 kg launch package launched from a 16 km airborne platform were studied using two common aeroshell shapes: sphere-cone and elliptical. The mass was chosen to be representative of what is feasible to launch from an airborne platform.
The UNO study is divided into two parts. In the first part, ablation due to aerothermal heating for ballistic trajectories is quantified for both laminar and turbulent flow over a range of launch parameters relevant to gun launch. Total TPS mass and propellant mass needed for orbital insertion are computed to serve as a baseline for the lifting trajectories. The second part focuses on computing lifting trajectories without ablation to turn the velocity vector during atmospheric transit, so that it arrives at orbital altitude tangential to the Earth. Optimal trajectories are sought that minimize total parasitic mass (TPS + propellant) for 200 km orbital insertion.
A major effort of the space program over the past 30 years has focused on developing extended-duration human presence and infrastructure in low Earth orbit (LEO) for scientific, defense and commercial interests, and that trend is expected to continue into the foreseeable future. The defense and telecommunications industries have an ever-increasing need for a large number of miniature satellites as part of their communications needs. LEO structures (such as the international space station) that provide a laboratory environment for scientific research as well as a starting point for planned interplanetary missions (such as return to the moon and manned exploration of Mars) require continuous resupply of basic essentials such as food, water, and replacement parts. Given these trends, there is growing need to develop systems that provide affordable access to LEO at an increased rate for miniature payloads. Sweeting [16
Interest in low-cost access to space for miniature payloads has spurred interest in alternatives to chemical rockets that can reduce the cost per kilogram and increase launch frequency. Several alternative technologies have been proposed, including laser and gun launch and the so-called space elevator concept. Ketsdever, Young, and Mossman [
] classifies satellites by size according to the following: large (> 1,000 kg), small (500–1,000 kg), mini (100–500 kg), micro (10–100 kg), nano (1–10 kg), and pico (< 1 kg). These definitions vary somewhat in the literature, but will be used for this effort.
17
Gun launch appears to be one of the more promising methods to economically deliver miniature payloads at increased launch frequency. Palmer [
] provide an excellent overview of many advanced concepts for space access. The authors also present the cost per kilogram of payload vs. payload mass for commonly used launch systems. Notably, using conventional rocket launch systems, the cost per kilogram rises sharply as the payload mass decreases below 1,000 kg. The authors also note that if a launch system is thought of as a means of transferring the requisite kinetic and potential energy to insert a payload into a stable orbit, then the cost of existing launch systems is approximately 10,000 times higher than the market value of the energy added to the payload—leaving significant room for reducing launch costs.
18] presents the motivation and discusses the economic benefits of gun-launched projectiles. Candidate gun launchers are divided primarily into two groups: compressed gas and electromagnetic (EM). The idea was first
IAT.R 0624 65
explored the 1960s, beginning with the high-altitude research project (HARP) [19
In contrast to conventional chemical rockets that achieve orbital velocity from the thrust provided by the rocket engines during ascent, gun launch achieves orbital velocity using high in-bore accelerations to quickly accelerate the launch package to near orbital velocity as the vehicle exits the gun bore, after which the package follows a ballistic or lifting trajectory through the atmosphere. To achieve a stable circular orbit, the flight vehicle is turned at some point in the trajectory so that the final velocity vector is tangential to the Earth’s surface at the orbital velocity for the desired altitude (~7.8 km/s at 200 km altitude). This is typically achieved using small rocket motors or thrusters and requires some portion of the total launch mass to be devoted to propellant. Ballistic trajectories achieve orbital insertion by turning the velocity vector at or near the end of the trajectory using rocket motors. Lifting trajectories turn the velocity vector continuously during the atmospheric transit and use rocket assist for final orbital insertion. Although any lift-producing vehicle incurs additional drag, the advantage of turning the velocity vector so that it is more tangential to the Earth’s surface at orbital altitude overcomes the disadvantage of additional drag.
], in which projectiles were launched into suborbital trajectories using a conventional powder gun, with the ultimate goal of launching small payloads into LEO. Although HARP never achieved its goal of delivering a small satellite into LEO, it did achieve the notable accomplishment of demonstrating that G-hardened electronic packages could withstand the high acceleration forces experienced during in-bore travel.
The current effort is part of an investigation funded by the AFOSR under a MURI award to investigate the technical issues associated with launching miniature payloads from an airborne platform at 16 km using an EM launcher. The airborne launch concept reduces the aerothermal heating load by avoiding the densest portion of the atmosphere near the Earth’s surface.
The work presented in this section of the report does not consider the technical challenges of launch; rather, it focuses on the issues associated with traversing the atmosphere after exiting the bore and with orbital insertion. The current analysis is decoupled from the launcher, and the results are applicable to any launch system that can produce the necessary initial launch package velocity. McNab [20, 21
After exiting the bore of the gun, the launch package initially experiences a severe aerothermal heating load as it traverses the atmosphere. The high temperatures experienced near the nose tip require a TPS to prevent destructively high temperatures on the payload. Unlike the reentry problem, the projectile is in the densest portion of the atmosphere when it is at its maximum speed, although launching at 16 km significantly alleviates the aerothermal heating problem as compared to ground launch.
] discusses current research and progress made addressing the technical issues associated with EM launch.
Sphere-cone and elliptical aeroshells were considered in this study. The sphere-cone aeroshell is defined by the nose radius, cone angle, and total length. The elliptical aeroshell is defined by the total length and base radius. To provide a basis for comparison, the dimensions of the elliptical aeroshells were chosen to enclose equal volumes as the sphere-cone aeroshells.
The first part of this section applies the ASCC to compute ballistic trajectories with ablation to estimate the TPS requirements and the propellant mass needed to achieve a stable 200 km circular orbit for a range of launch conditions relevant to gun launch. The results of the ablation analysis show that the parasitic mass (TPS + propellant) is dominated by the propellant mass
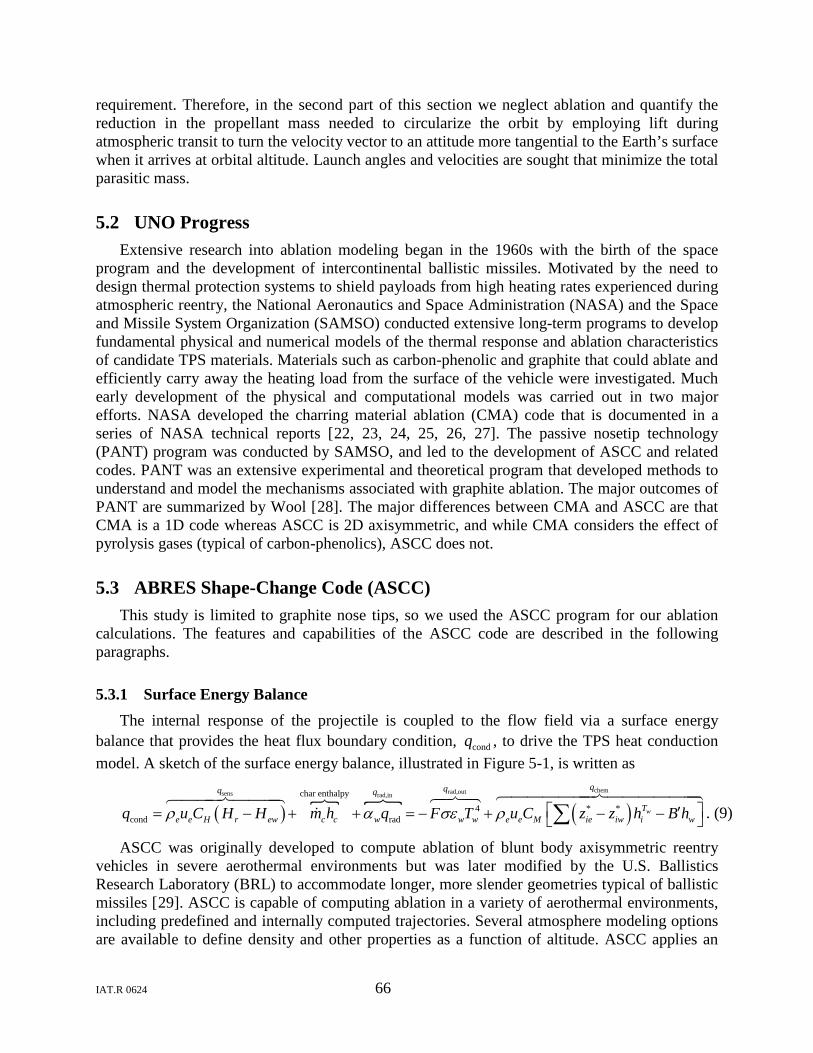
IAT.R 0624 66
requirement. Therefore, in the second part of this section we neglect ablation and quantify the reduction in the propellant mass needed to circularize the orbit by employing lift during atmospheric transit to turn the velocity vector to an attitude more tangential to the Earth’s surface when it arrives at orbital altitude. Launch angles and velocities are sought that minimize the total parasitic mass.
5.2 UNO Progress Extensive research into ablation modeling began in the 1960s with the birth of the space
program and the development of intercontinental ballistic missiles. Motivated by the need to design thermal protection systems to shield payloads from high heating rates experienced during atmospheric reentry, the National Aeronautics and Space Administration (NASA) and the Space and Missile System Organization (SAMSO) conducted extensive long-term programs to develop fundamental physical and numerical models of the thermal response and ablation characteristics of candidate TPS materials. Materials such as carbon-phenolic and graphite that could ablate and efficiently carry away the heating load from the surface of the vehicle were investigated. Much early development of the physical and computational models was carried out in two major efforts. NASA developed the charring material ablation (CMA) code that is documented in a series of NASA technical reports [22, 23, 24, 25, 26, 27]. The passive nosetip technology (PANT) program was conducted by SAMSO, and led to the development of ASCC and related codes. PANT was an extensive experimental and theoretical program that developed methods to understand and model the mechanisms associated with graphite ablation. The major outcomes of PANT are summarized by Wool [28
5.3 ABRES Shape-Change Code (ASCC)
]. The major differences between CMA and ASCC are that CMA is a 1D code whereas ASCC is 2D axisymmetric, and while CMA considers the effect of pyrolysis gases (typical of carbon-phenolics), ASCC does not.
This study is limited to graphite nose tips, so we used the ASCC program for our ablation calculations. The features and capabilities of the ASCC code are described in the following paragraphs.
5.3.1 Surface Energy Balance The internal response of the projectile is coupled to the flow field via a surface energy
balance that provides the heat flux boundary condition, condq , to drive the TPS heat conduction model. A sketch of the surface energy balance, illustrated in Figure 5-1, is written as
( )
( )chemrad,outsens rad,inchar enthalpy
4 * *cond rad
w
qqq q
Te e H r ew c c w w w e e M ie iw i wq u C H H m h q F T u C z z h B hρ α σε ρ ′= − + + = − + − − ∑
. (9)
ASCC was originally developed to compute ablation of blunt body axisymmetric reentry vehicles in severe aerothermal environments but was later modified by the U.S. Ballistics Research Laboratory (BRL) to accommodate longer, more slender geometries typical of ballistic missiles [29]. ASCC is capable of computing ablation in a variety of aerothermal environments, including predefined and internally computed trajectories. Several atmosphere modeling options are available to define density and other properties as a function of altitude. ASCC applies an
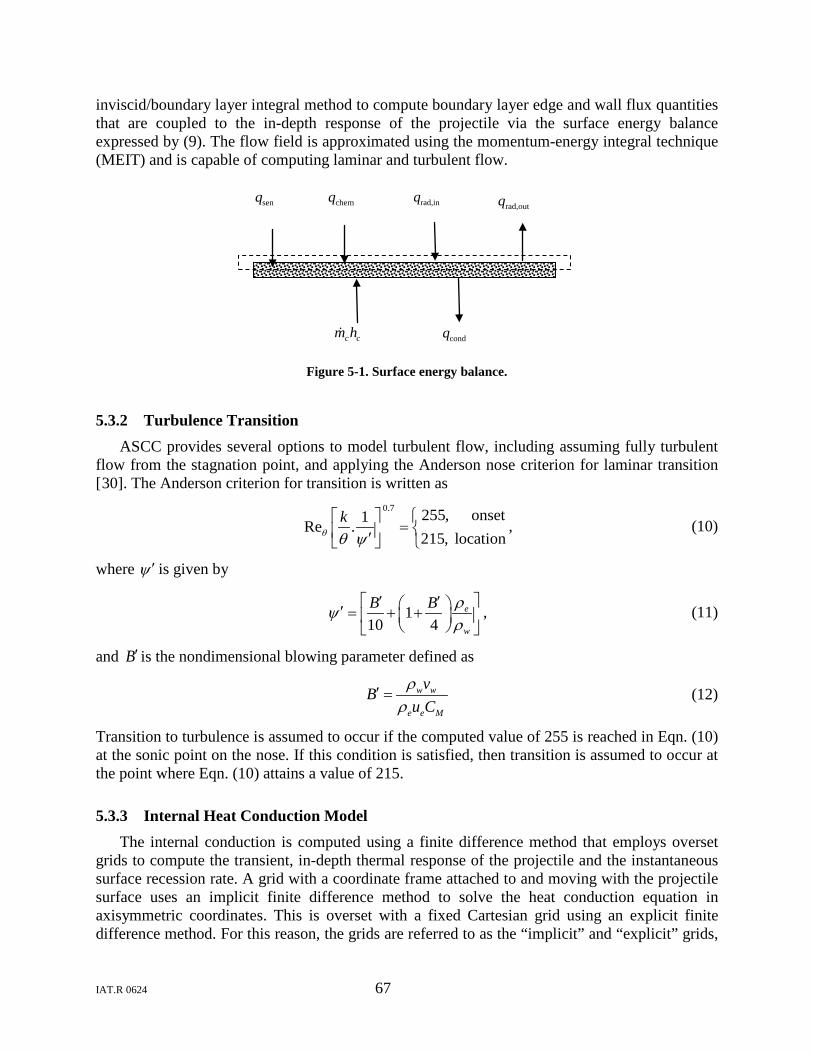
IAT.R 0624 67
inviscid/boundary layer integral method to compute boundary layer edge and wall flux quantities that are coupled to the in-depth response of the projectile via the surface energy balance expressed by (9). The flow field is approximated using the momentum-energy integral technique (MEIT) and is capable of computing laminar and turbulent flow.
Figure 5-1. Surface energy balance.
5.3.2 Turbulence Transition ASCC provides several options to model turbulent flow, including assuming fully turbulent
flow from the stagnation point, and applying the Anderson nose criterion for laminar transition [30
]. The Anderson criterion for transition is written as 0.7 255, onset1Re .
215, locationk
θ θ ψ
= ′ , (10)
where ψ ′ is given by
110 4
e
w
B B ρψρ
′ ′ ′ = + +
, (11)
and B′ is the nondimensional blowing parameter defined as
w w
e e M
vBu C
ρρ
′ = (12)
Transition to turbulence is assumed to occur if the computed value of 255 is reached in Eqn. (10) at the sonic point on the nose. If this condition is satisfied, then transition is assumed to occur at the point where Eqn. (10) attains a value of 215.
5.3.3 Internal Heat Conduction Model The internal conduction is computed using a finite difference method that employs overset
grids to compute the transient, in-depth thermal response of the projectile and the instantaneous surface recession rate. A grid with a coordinate frame attached to and moving with the projectile surface uses an implicit finite difference method to solve the heat conduction equation in axisymmetric coordinates. This is overset with a fixed Cartesian grid using an explicit finite difference method. For this reason, the grids are referred to as the “implicit” and “explicit” grids,
c cm h
condq
senq
chemq
rad,inq
rad,outq

IAT.R 0624 68
respectively. The implicit grid is characterized by the number of surface nodes sN and the number of internal layers. The Cartesian grid is described by the number of nodes in the radial and axial directions, respectively. A typical overlaid grid used in ASCC showing the Cartesian and body-fitted grids is presented in Figure 5-2.
Figure 5-2. Implicit/explicit overset grids used in ASCC.
The heat conduction equation is solved in Cartesian coordinates on the explicit grid. On the implicit grid the heat conduction equation is solve in a local moving coordinate system attached to the surface with axes ( , )r s oriented normal and tangential to the surface, respectively. The implicit grid heat conduction equation is written as
( ) ( )P1 1 /
1 / 1 /b
b c pb c c
rT T T Tc r r r c nt r r r s r r s r r r
ρ κ κ ρ ∂ ∂ ∂ ∂ ∂ ∂ = + + + ∂ + ∂ + ∂ ∂ ∂ ∂
. (13)
5.3.4 Trajectory Calculations-Equations of Motion ASCC is capable of computing internal trajectories by solving the equations of motion using
a three degrees of freedom (3-DOF) (point mass) model with or without ablation. The equations of motion are solved in a Cartesian (x,y,z) coordinate system attached to the Earth, with the origin at the center of the Earth and rotating with it. The x-y plane lies in the equatorial plane, the x-axis lies along the line of zero longitude, and the z-axis points north. The y-axis defines a right-handed coordinate system. The Earth is modeled as an ellipsoid with equatorial radius
6,378,050eR = m and polar radius 6,356,750pR = m.
ASCC can include aerodynamic AF , gravitational GF , and thrust TF forces. The aerodynamic forces are due to friction and pressure, which are resolved into lift and drag components. The drag force is computed using a drag coefficient based on the ablated geometry and is a function of time. With the forces defined, ASCC computes the solution to Newton’s second law in the Cartesian rotating frame of reference and is written as
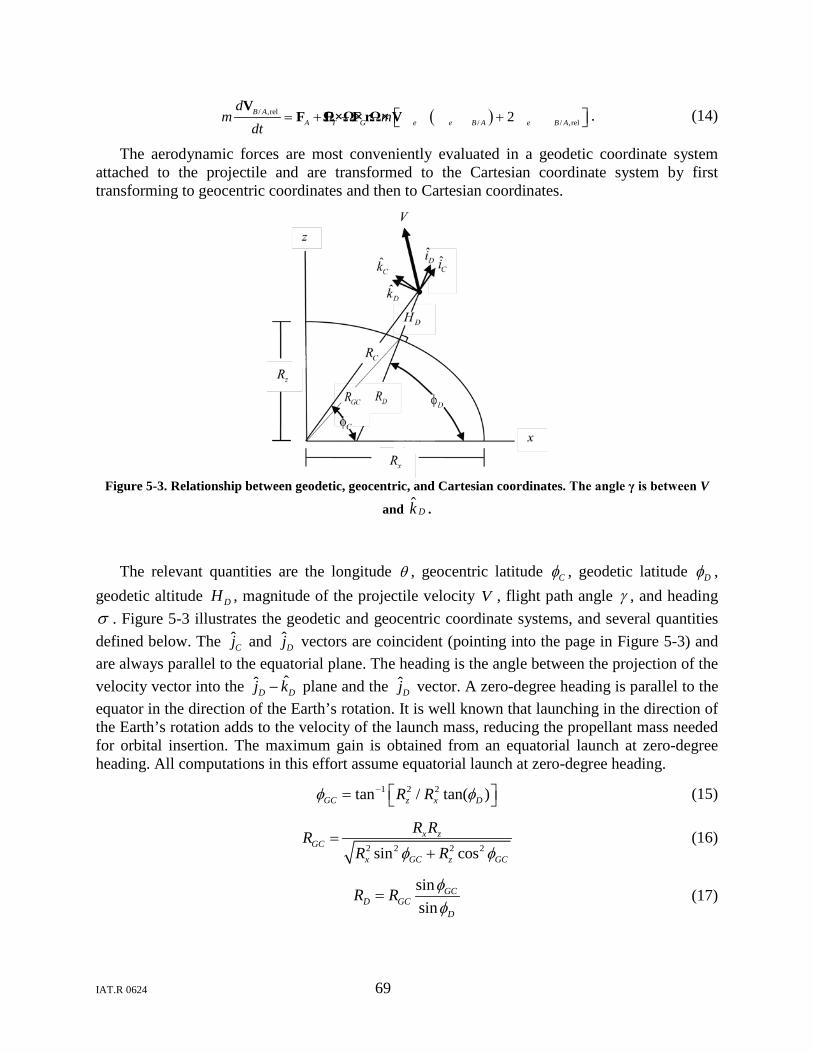
IAT.R 0624 69
( )/ ,rel/ / ,rel2B A
A T G e e B A e B A
dm m
dt= + + − +
VF F FΩ×Ω×rΩ× V . (14)
The aerodynamic forces are most conveniently evaluated in a geodetic coordinate system attached to the projectile and are transformed to the Cartesian coordinate system by first transforming to geocentric coordinates and then to Cartesian coordinates.
Figure 5-3. Relationship between geodetic, geocentric, and Cartesian coordinates. The angle γ is between V
and Dk .
The relevant quantities are the longitude θ , geocentric latitude Cφ , geodetic latitude Dφ , geodetic altitude DH , magnitude of the projectile velocity V , flight path angle γ , and heading σ . Figure 5-3 illustrates the geodetic and geocentric coordinate systems, and several quantities defined below. The ˆ
Cj and ˆDj vectors are coincident (pointing into the page in Figure 5-3) and
are always parallel to the equatorial plane. The heading is the angle between the projection of the velocity vector into the ˆˆ
D Dj k− plane and the ˆDj vector. A zero-degree heading is parallel to the
equator in the direction of the Earth’s rotation. It is well known that launching in the direction of the Earth’s rotation adds to the velocity of the launch mass, reducing the propellant mass needed for orbital insertion. The maximum gain is obtained from an equatorial launch at zero-degree heading. All computations in this effort assume equatorial launch at zero-degree heading.
1 2 2tan / tan( )GC z x DR Rφ φ− = (15)
2 2 2 2sin cos
x zGC
x GC z GC
R RRR Rφ φ
=+
(16)
sinsin
GCD GC
D
R R φφ
= (17)
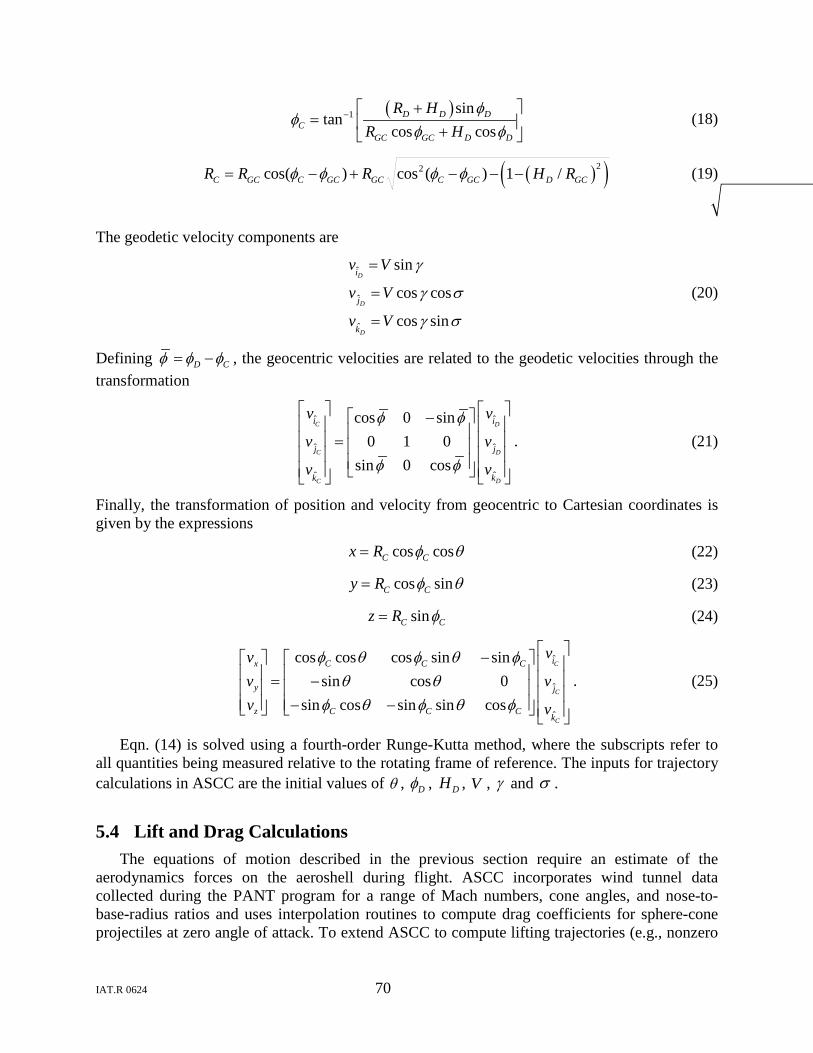
IAT.R 0624 70
( )1 sintan
cos cosD D D
CGC GC D D
R HR H
φφ
φ φ− +
= + (18)
( )( )22cos( ) cos ( ) 1 /C GC C GC GC C GC D GCR R R H Rφ φ φ φ= − + − − − (19)
The geodetic velocity components are
ˆ
ˆ
ˆ
sin
cos cos
cos sin
D
D
D
i
j
k
v V
v V
v V
γ
γ σ
γ σ
=
=
=
(20)
Defining D Cφ φ φ= − , the geocentric velocities are related to the geodetic velocities through the transformation
ˆ ˆ
ˆ ˆ
ˆˆ
cos 0 sin0 1 0
sin 0 cos
C D
C D
DC
i i
j j
kk
v v
v v
vv
φ φ
φ φ
− =
. (21)
Finally, the transformation of position and velocity from geocentric to Cartesian coordinates is given by the expressions
cos cosC Cx R φ θ= (22)
cos sinC Cy R φ θ= (23)
sinC Cz R φ= (24)
ˆ
ˆ
ˆ
cos cos cos sin sinsin cos 0
sin cos sin sin cos
C
C
C
ix C C C
y j
z C C Ck
vvv vv v
φ θ φ θ φθ θ
φ θ φ θ φ
− = − − −
. (25)
Eqn. (14) is solved using a fourth-order Runge-Kutta method, where the subscripts refer to all quantities being measured relative to the rotating frame of reference. The inputs for trajectory calculations in ASCC are the initial values of θ , Dφ , DH , V , γ and σ .
5.4 Lift and Drag Calculations The equations of motion described in the previous section require an estimate of the
aerodynamics forces on the aeroshell during flight. ASCC incorporates wind tunnel data collected during the PANT program for a range of Mach numbers, cone angles, and nose-to-base-radius ratios and uses interpolation routines to compute drag coefficients for sphere-cone projectiles at zero angle of attack. To extend ASCC to compute lifting trajectories (e.g., nonzero
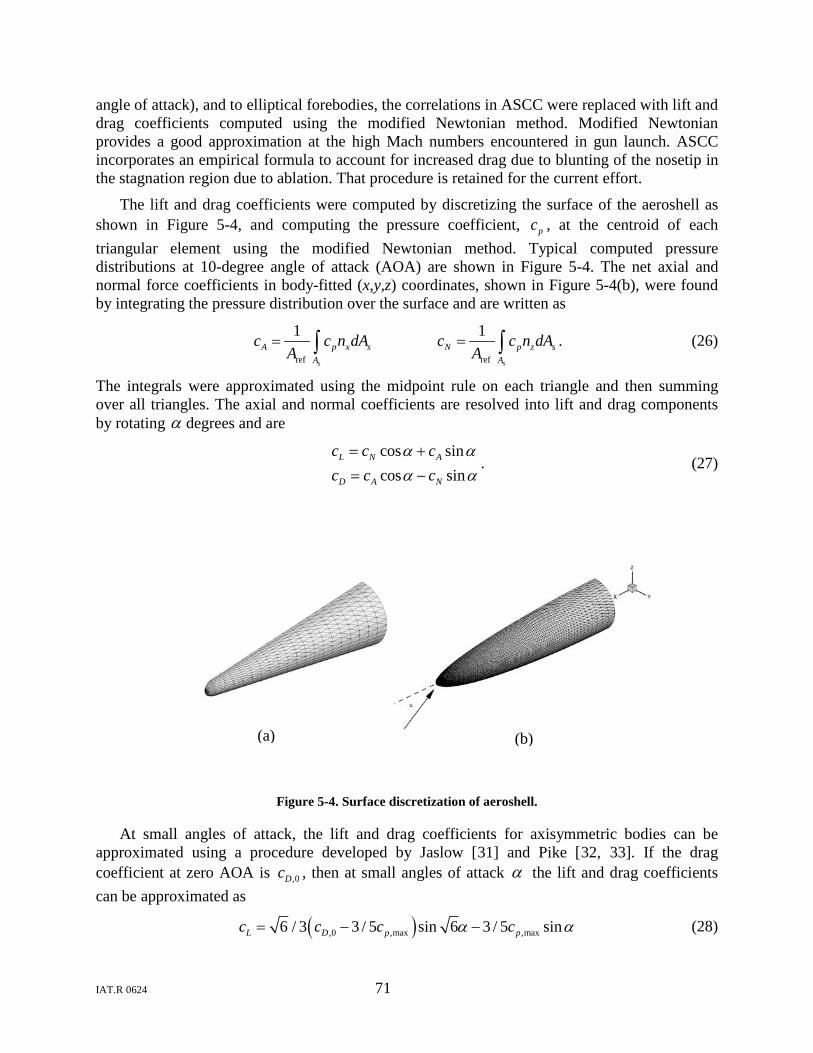
IAT.R 0624 71
angle of attack), and to elliptical forebodies, the correlations in ASCC were replaced with lift and drag coefficients computed using the modified Newtonian method. Modified Newtonian provides a good approximation at the high Mach numbers encountered in gun launch. ASCC incorporates an empirical formula to account for increased drag due to blunting of the nosetip in the stagnation region due to ablation. That procedure is retained for the current effort.
The lift and drag coefficients were computed by discretizing the surface of the aeroshell as shown in Figure 5-4, and computing the pressure coefficient, pc , at the centroid of each triangular element using the modified Newtonian method. Typical computed pressure distributions at 10-degree angle of attack (AOA) are shown in Figure 5-4. The net axial and normal force coefficients in body-fitted (x,y,z) coordinates, shown in Figure 5-4(b), were found by integrating the pressure distribution over the surface and are written as
ref ref
1 1 s s
A p x s N p z sA A
c c n dA c c n dAA A
= =∫ ∫ . (26)
The integrals were approximated using the midpoint rule on each triangle and then summing over all triangles. The axial and normal coefficients are resolved into lift and drag components by rotating α degrees and are
cos sincos sin
L N A
D A N
c c cc c c
α αα α
= += −
. (27)
Figure 5-4. Surface discretization of aeroshell.
At small angles of attack, the lift and drag coefficients for axisymmetric bodies can be approximated using a procedure developed by Jaslow [31] and Pike [32, 33
,0Dc]. If the drag
coefficient at zero AOA is , then at small angles of attack α the lift and drag coefficients can be approximated as
( ),0 ,max ,max6 / 3 3 / 5 sin 6 3 / 5 sinL D p pc c c cα α= − − (28)
(b)
(a)
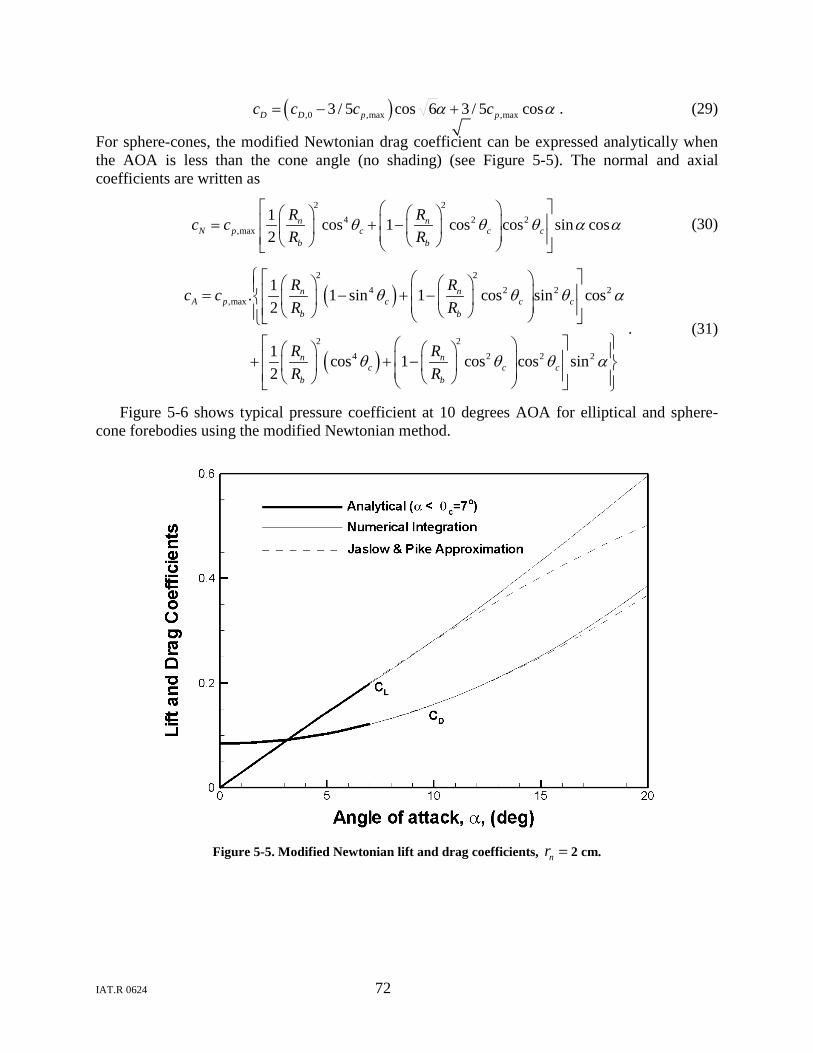
IAT.R 0624 72
( ),0 ,max ,max3 / 5 cos 6 3 / 5 cosD D p pc c c cα α= − + . (29)
For sphere-cones, the modified Newtonian drag coefficient can be expressed analytically when the AOA is less than the cone angle (no shading) (see Figure 5-5). The normal and axial coefficients are written as
2 2
4 2 2,max
1 cos 1 cos cos sin cos2
n nN p c c c
b b
R Rc cR R
θ θ θ α α = + −
(30)
( )
( )
2 24 2 2 2
,max
2 24 2 2 2
1. 1 sin 1 cos sin cos2
1 cos 1 cos cos sin2
n nA p c c c
b b
n nc c c
b b
R Rc cR R
R RR R
θ θ θ α
θ θ θ α
= − + − + + −
. (31)
Figure 5-6 shows typical pressure coefficient at 10 degrees AOA for elliptical and sphere-cone forebodies using the modified Newtonian method.
Figure 5-5. Modified Newtonian lift and drag coefficients, nr = 2 cm.
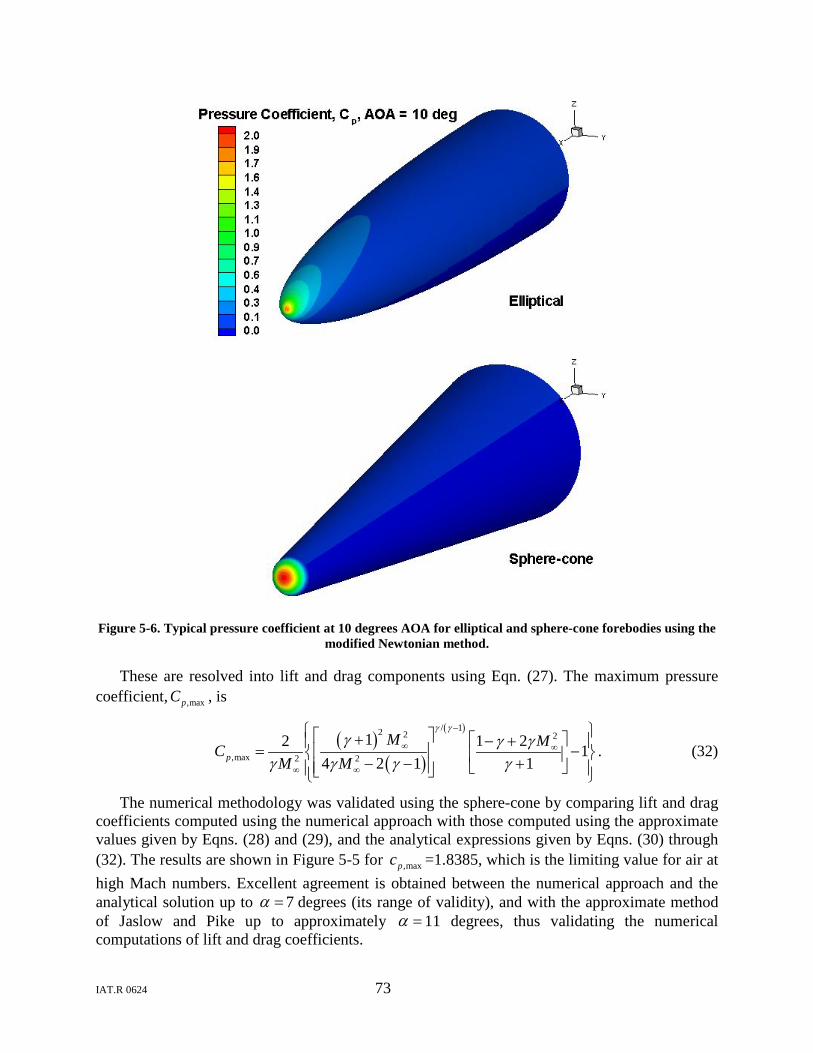
IAT.R 0624 73
Figure 5-6. Typical pressure coefficient at 10 degrees AOA for elliptical and sphere-cone forebodies using the
modified Newtonian method.
These are resolved into lift and drag components using Eqn. (27). The maximum pressure coefficient, ,maxpC , is
( )( )
( )/ 12 2 2
,max 2 2
1 1 22 14 2 1 1p
M MCM M
γ γγ γ γ
γ γ γ γ
−
∞ ∞
∞ ∞
+ − + = − − − +
. (32)
The numerical methodology was validated using the sphere-cone by comparing lift and drag coefficients computed using the numerical approach with those computed using the approximate values given by Eqns. (28) and (29), and the analytical expressions given by Eqns. (30) through (32). The results are shown in Figure 5-5 for ,maxpc =1.8385, which is the limiting value for air at high Mach numbers. Excellent agreement is obtained between the numerical approach and the analytical solution up to α = 7 degrees (its range of validity), and with the approximate method of Jaslow and Pike up to approximately α = 11 degrees, thus validating the numerical computations of lift and drag coefficients.
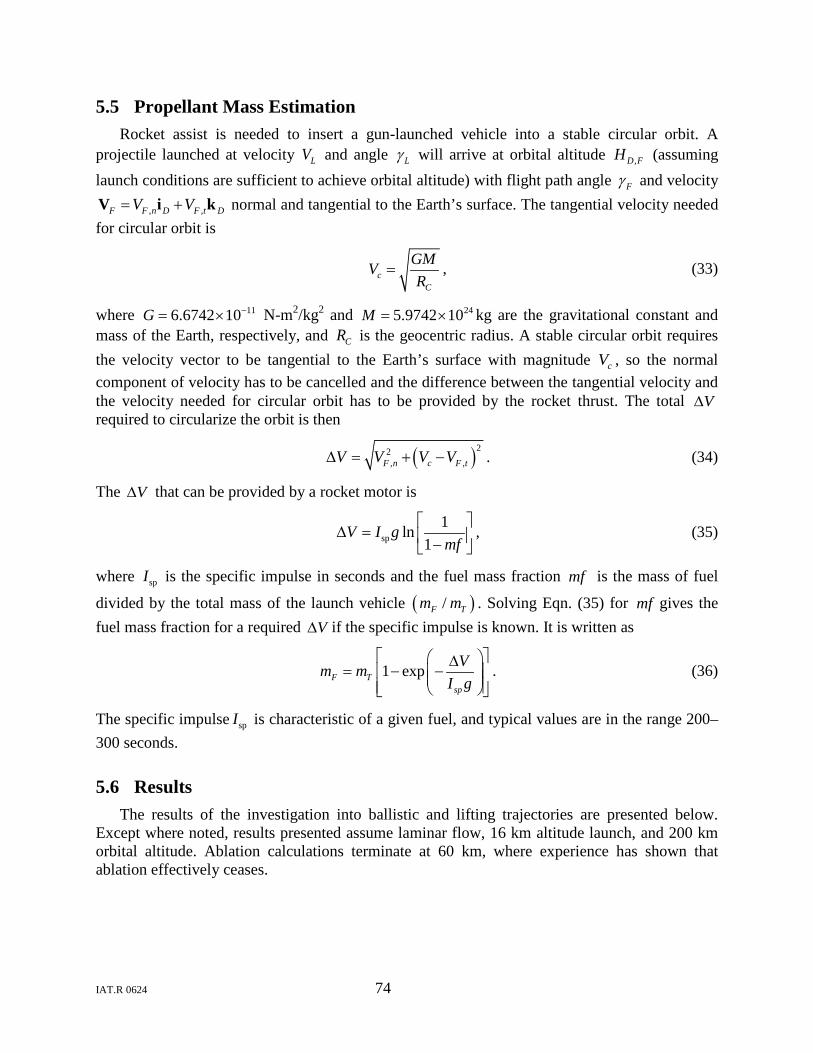
IAT.R 0624 74
5.5 Propellant Mass Estimation Rocket assist is needed to insert a gun-launched vehicle into a stable circular orbit. A
projectile launched at velocity LV and angle Lγ will arrive at orbital altitude ,D FH (assuming launch conditions are sufficient to achieve orbital altitude) with flight path angle Fγ and velocity
, ,F F n D F t DV V= +V i k normal and tangential to the Earth’s surface. The tangential velocity needed for circular orbit is
cC
GMVR
= , (33)
where 116.6742 10G −= × N-m2/kg2 and 245.9742 10M = × kg are the gravitational constant and mass of the Earth, respectively, and CR is the geocentric radius. A stable circular orbit requires the velocity vector to be tangential to the Earth’s surface with magnitude cV , so the normal component of velocity has to be cancelled and the difference between the tangential velocity and the velocity needed for circular orbit has to be provided by the rocket thrust. The total V∆ required to circularize the orbit is then
( )22, ,F n c F tV V V V∆ = + − . (34)
The V∆ that can be provided by a rocket motor is
sp1ln
1V I g
mf
∆ = − , (35)
where spI is the specific impulse in seconds and the fuel mass fraction mf is the mass of fuel
divided by the total mass of the launch vehicle ( )/F Tm m . Solving Eqn. (35) for mf gives the fuel mass fraction for a required V∆ if the specific impulse is known. It is written as
1 expF Tsp
Vm mI g
∆= − −
. (36)
The specific impulse spI is characteristic of a given fuel, and typical values are in the range 200–300 seconds.
5.6 Results The results of the investigation into ballistic and lifting trajectories are presented below.
Except where noted, results presented assume laminar flow, 16 km altitude launch, and 200 km orbital altitude. Ablation calculations terminate at 60 km, where experience has shown that ablation effectively ceases.
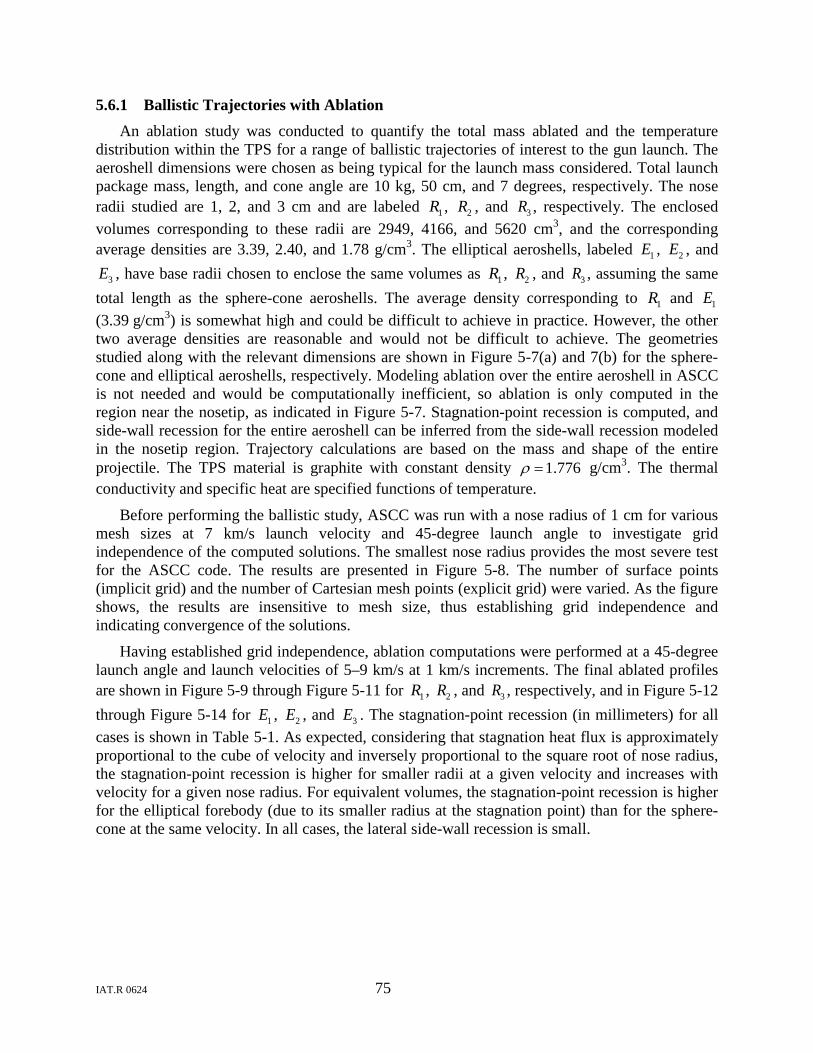
IAT.R 0624 75
5.6.1 Ballistic Trajectories with Ablation An ablation study was conducted to quantify the total mass ablated and the temperature
distribution within the TPS for a range of ballistic trajectories of interest to the gun launch. The aeroshell dimensions were chosen as being typical for the launch mass considered. Total launch package mass, length, and cone angle are 10 kg, 50 cm, and 7 degrees, respectively. The nose radii studied are 1, 2, and 3 cm and are labeled 1R , 2R , and 3R , respectively. The enclosed volumes corresponding to these radii are 2949, 4166, and 5620 cm3, and the corresponding average densities are 3.39, 2.40, and 1.78 g/cm3. The elliptical aeroshells, labeled 1E , 2E , and
3E , have base radii chosen to enclose the same volumes as 1R , 2R , and 3R , assuming the same total length as the sphere-cone aeroshells. The average density corresponding to 1R and 1E (3.39 g/cm3) is somewhat high and could be difficult to achieve in practice. However, the other two average densities are reasonable and would not be difficult to achieve. The geometries studied along with the relevant dimensions are shown in Figure 5-7(a) and 7(b) for the sphere-cone and elliptical aeroshells, respectively. Modeling ablation over the entire aeroshell in ASCC is not needed and would be computationally inefficient, so ablation is only computed in the region near the nosetip, as indicated in Figure 5-7. Stagnation-point recession is computed, and side-wall recession for the entire aeroshell can be inferred from the side-wall recession modeled in the nosetip region. Trajectory calculations are based on the mass and shape of the entire projectile. The TPS material is graphite with constant density 1.776ρ = g/cm3. The thermal conductivity and specific heat are specified functions of temperature.
Before performing the ballistic study, ASCC was run with a nose radius of 1 cm for various mesh sizes at 7 km/s launch velocity and 45-degree launch angle to investigate grid independence of the computed solutions. The smallest nose radius provides the most severe test for the ASCC code. The results are presented in Figure 5-8. The number of surface points (implicit grid) and the number of Cartesian mesh points (explicit grid) were varied. As the figure shows, the results are insensitive to mesh size, thus establishing grid independence and indicating convergence of the solutions.
Having established grid independence, ablation computations were performed at a 45-degree launch angle and launch velocities of 5–9 km/s at 1 km/s increments. The final ablated profiles are shown in Figure 5-9 through Figure 5-11 for 1R , 2R , and 3R , respectively, and in Figure 5-12 through Figure 5-14 for 1E , 2E , and 3E . The stagnation-point recession (in millimeters) for all cases is shown in Table 5-1. As expected, considering that stagnation heat flux is approximately proportional to the cube of velocity and inversely proportional to the square root of nose radius, the stagnation-point recession is higher for smaller radii at a given velocity and increases with velocity for a given nose radius. For equivalent volumes, the stagnation-point recession is higher for the elliptical forebody (due to its smaller radius at the stagnation point) than for the sphere-cone at the same velocity. In all cases, the lateral side-wall recession is small.
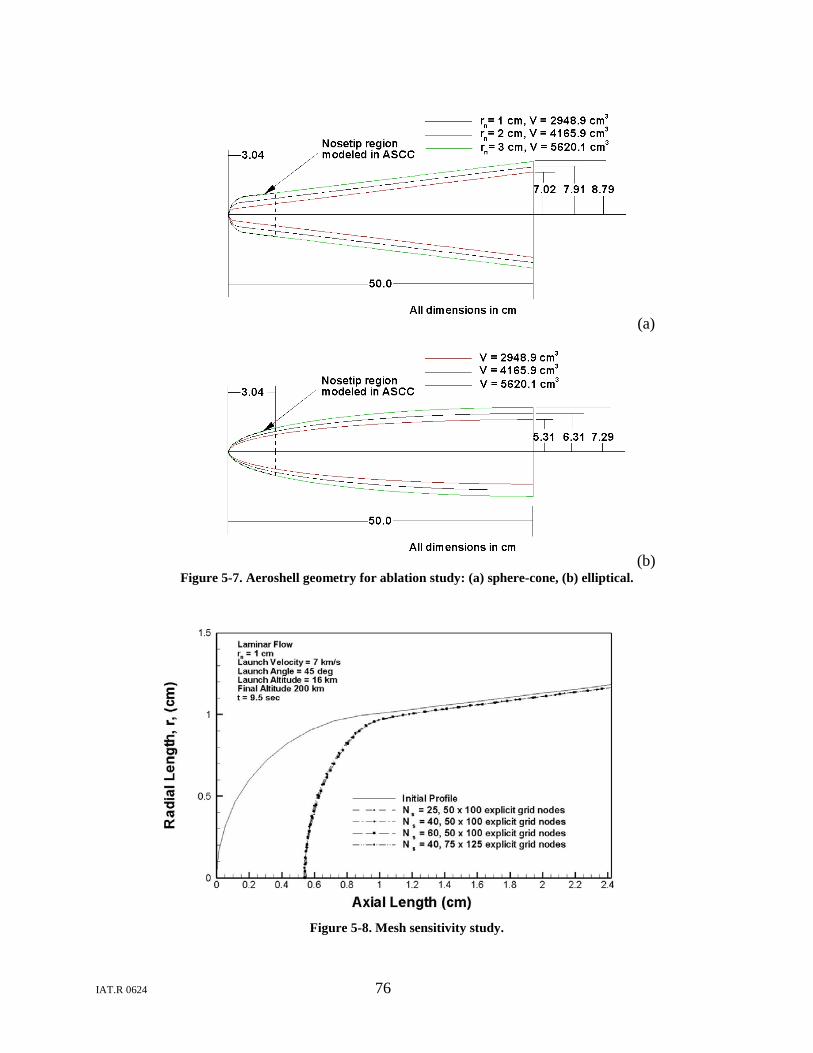
IAT.R 0624 76
(a)
(b) Figure 5-7. Aeroshell geometry for ablation study: (a) sphere-cone, (b) elliptical.
Figure 5-8. Mesh sensitivity study.
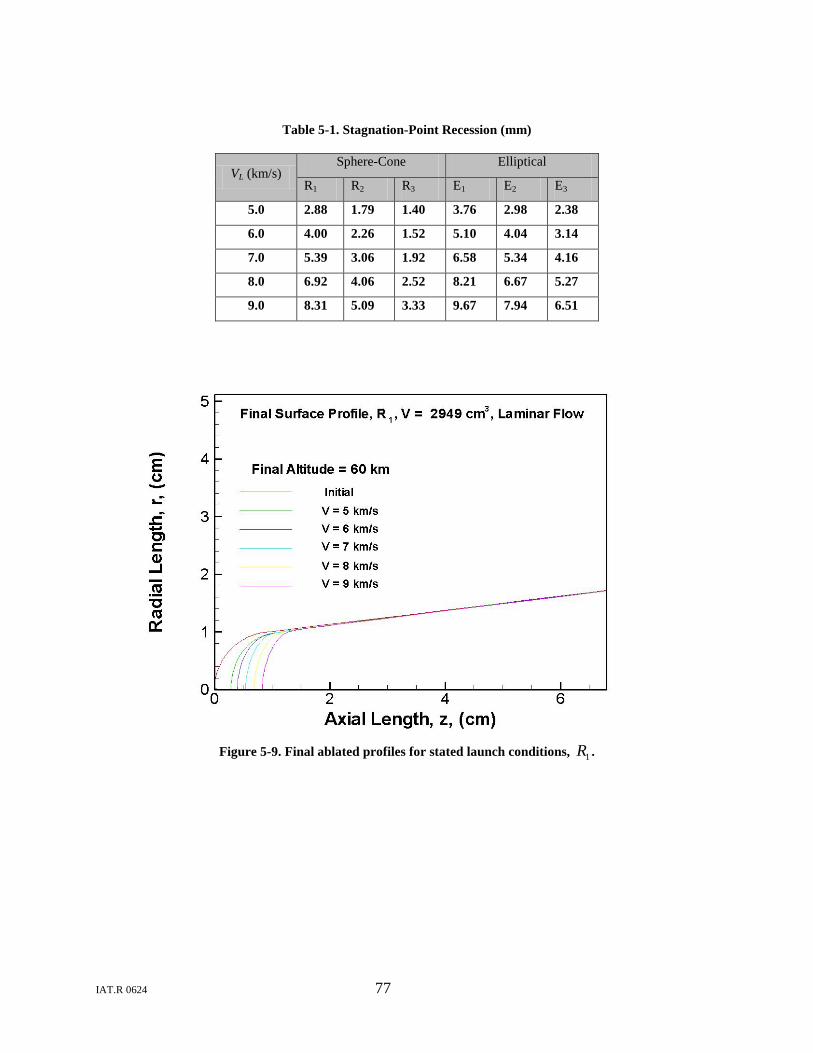
IAT.R 0624 77
Table 5-1. Stagnation-Point Recession (mm)
VL (km/s) Sphere-Cone Elliptical
R1 R2 R3 E1 E2 E3
5.0 2.88 1.79 1.40 3.76 2.98 2.38
6.0 4.00 2.26 1.52 5.10 4.04 3.14
7.0 5.39 3.06 1.92 6.58 5.34 4.16
8.0 6.92 4.06 2.52 8.21 6.67 5.27
9.0 8.31 5.09 3.33 9.67 7.94 6.51
Figure 5-9. Final ablated profiles for stated launch conditions, 1R .

IAT.R 0624 78
Figure 5-10. Final ablated profiles for stated launch conditions, 2R .
Figure 5-11. Final ablated profiles for stated launch conditions, 3R .
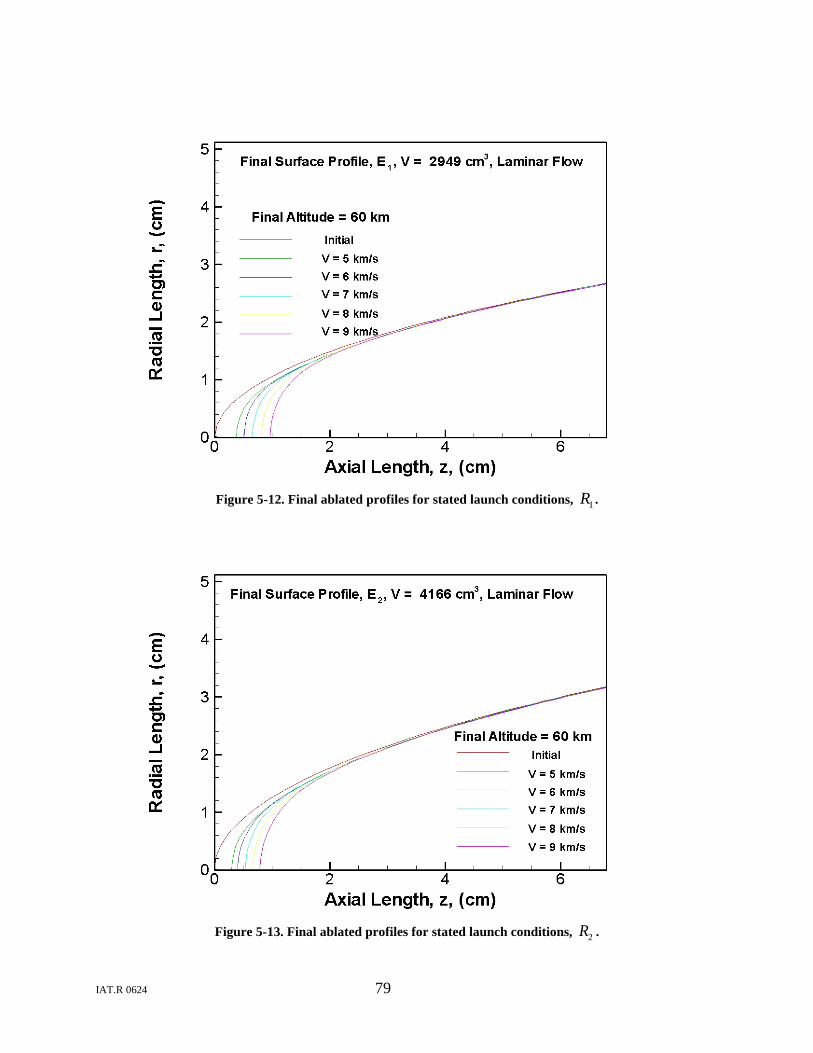
IAT.R 0624 79
Figure 5-12. Final ablated profiles for stated launch conditions, 1R .
Figure 5-13. Final ablated profiles for stated launch conditions, 2R .

IAT.R 0624 80
Figure 5-14. Final ablated profiles for stated launch conditions, 3R .
Velocity vs. altitude maps for each of the projectiles are shown in Figure 5-15 for LV = 7 km/s, Lγ = 45 degrees. Due to increased drag, the change in velocity between launch and orbital altitude increases as nose radius increases. This change is more pronounced for the sphere-cone than for the elliptical forebodies, because increasing the nose radius while keeping the total length and cone angle constant increases the sphere-cone base radius substantially. The velocity at orbital altitude for the elliptical forebodies ranges from 6.395 km/s (E1) to 5.735 km/s (E3) and for the sphere-cones from 6.370 km/s (R1) to 5.214 km/s (R3). The flight path angle at orbital altitude is 44 0.6± degrees for all projectiles. In all cases, the difference between the ablated and unablated shapes is small. As previously noted, the average density corresponding to R1 and E1 is somewhat high, and as Figure 5-15 indicates, drag-induced velocity loss begins to become unacceptably high for E3 and R3, and so the remainder of the study focuses on R2 and E2.
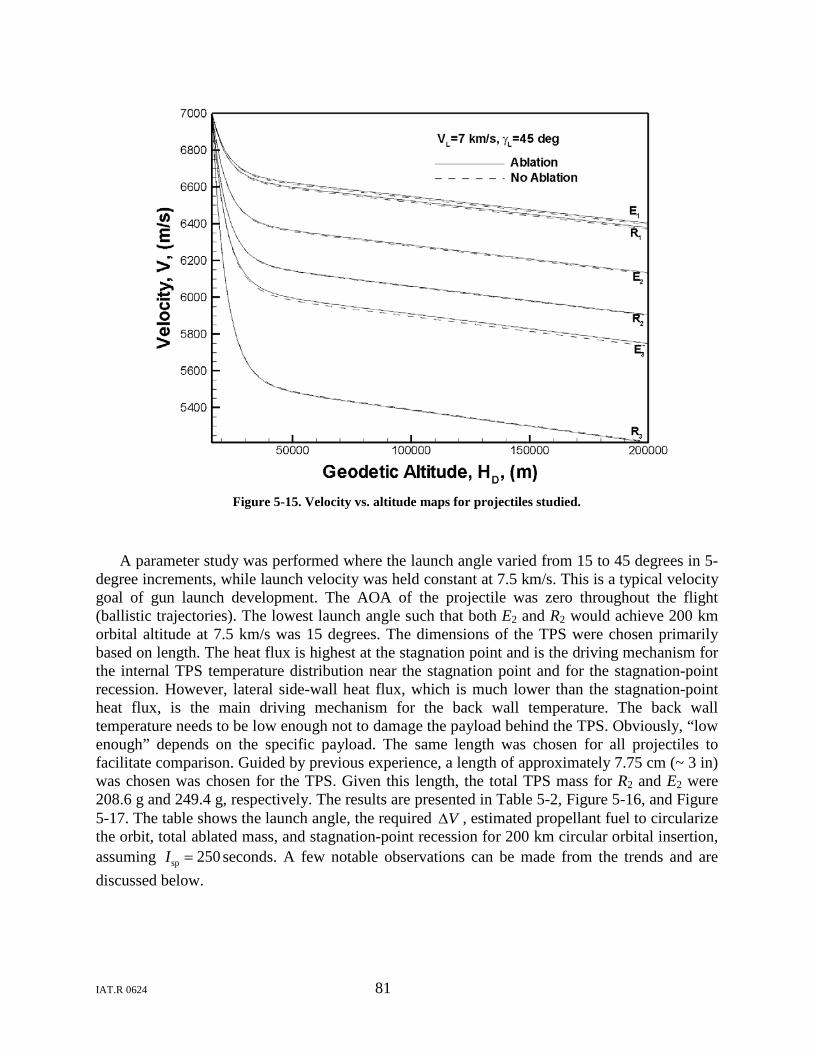
IAT.R 0624 81
Figure 5-15. Velocity vs. altitude maps for projectiles studied.
A parameter study was performed where the launch angle varied from 15 to 45 degrees in 5-degree increments, while launch velocity was held constant at 7.5 km/s. This is a typical velocity goal of gun launch development. The AOA of the projectile was zero throughout the flight (ballistic trajectories). The lowest launch angle such that both E2 and R2 would achieve 200 km orbital altitude at 7.5 km/s was 15 degrees. The dimensions of the TPS were chosen primarily based on length. The heat flux is highest at the stagnation point and is the driving mechanism for the internal TPS temperature distribution near the stagnation point and for the stagnation-point recession. However, lateral side-wall heat flux, which is much lower than the stagnation-point heat flux, is the main driving mechanism for the back wall temperature. The back wall temperature needs to be low enough not to damage the payload behind the TPS. Obviously, “low enough” depends on the specific payload. The same length was chosen for all projectiles to facilitate comparison. Guided by previous experience, a length of approximately 7.75 cm (~ 3 in) was chosen was chosen for the TPS. Given this length, the total TPS mass for R2 and E2 were 208.6 g and 249.4 g, respectively. The results are presented in Table 5-2, Figure 5-16, and Figure 5-17. The table shows the launch angle, the required V∆ , estimated propellant fuel to circularize the orbit, total ablated mass, and stagnation-point recession for 200 km circular orbital insertion, assuming sp 250I = seconds. A few notable observations can be made from the trends and are discussed below.
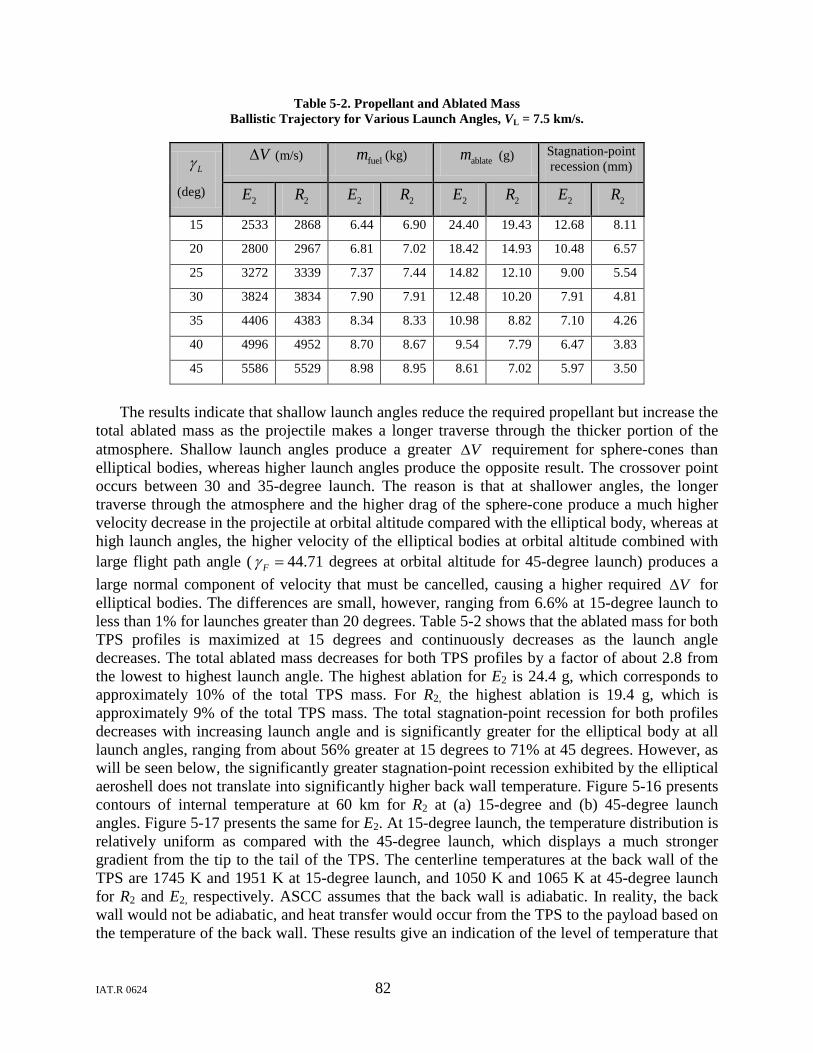
IAT.R 0624 82
Table 5-2. Propellant and Ablated Mass Ballistic Trajectory for Various Launch Angles, VL = 7.5 km/s.
Lγ
(deg)
V∆ (m/s) fuelm (kg) ablatem (g) Stagnation-point recession (mm)
2E 2R 2E 2R 2E 2R 2E 2R
15 2533 2868 6.44 6.90 24.40 19.43 12.68 8.11
20 2800 2967 6.81 7.02 18.42 14.93 10.48 6.57
25 3272 3339 7.37 7.44 14.82 12.10 9.00 5.54
30 3824 3834 7.90 7.91 12.48 10.20 7.91 4.81
35 4406 4383 8.34 8.33 10.98 8.82 7.10 4.26
40 4996 4952 8.70 8.67 9.54 7.79 6.47 3.83
45 5586 5529 8.98 8.95 8.61 7.02 5.97 3.50
The results indicate that shallow launch angles reduce the required propellant but increase the
total ablated mass as the projectile makes a longer traverse through the thicker portion of the atmosphere. Shallow launch angles produce a greater V∆ requirement for sphere-cones than elliptical bodies, whereas higher launch angles produce the opposite result. The crossover point occurs between 30 and 35-degree launch. The reason is that at shallower angles, the longer traverse through the atmosphere and the higher drag of the sphere-cone produce a much higher velocity decrease in the projectile at orbital altitude compared with the elliptical body, whereas at high launch angles, the higher velocity of the elliptical bodies at orbital altitude combined with large flight path angle ( Fγ = 44.71 degrees at orbital altitude for 45-degree launch) produces a large normal component of velocity that must be cancelled, causing a higher required V∆ for elliptical bodies. The differences are small, however, ranging from 6.6% at 15-degree launch to less than 1% for launches greater than 20 degrees. Table 5-2 shows that the ablated mass for both TPS profiles is maximized at 15 degrees and continuously decreases as the launch angle decreases. The total ablated mass decreases for both TPS profiles by a factor of about 2.8 from the lowest to highest launch angle. The highest ablation for E2 is 24.4 g, which corresponds to approximately 10% of the total TPS mass. For R2, the highest ablation is 19.4 g, which is approximately 9% of the total TPS mass. The total stagnation-point recession for both profiles decreases with increasing launch angle and is significantly greater for the elliptical body at all launch angles, ranging from about 56% greater at 15 degrees to 71% at 45 degrees. However, as will be seen below, the significantly greater stagnation-point recession exhibited by the elliptical aeroshell does not translate into significantly higher back wall temperature. Figure 5-16 presents contours of internal temperature at 60 km for R2 at (a) 15-degree and (b) 45-degree launch angles. Figure 5-17 presents the same for E2. At 15-degree launch, the temperature distribution is relatively uniform as compared with the 45-degree launch, which displays a much stronger gradient from the tip to the tail of the TPS. The centerline temperatures at the back wall of the TPS are 1745 K and 1951 K at 15-degree launch, and 1050 K and 1065 K at 45-degree launch for R2 and E2, respectively. ASCC assumes that the back wall is adiabatic. In reality, the back wall would not be adiabatic, and heat transfer would occur from the TPS to the payload based on the temperature of the back wall. These results give an indication of the level of temperature that
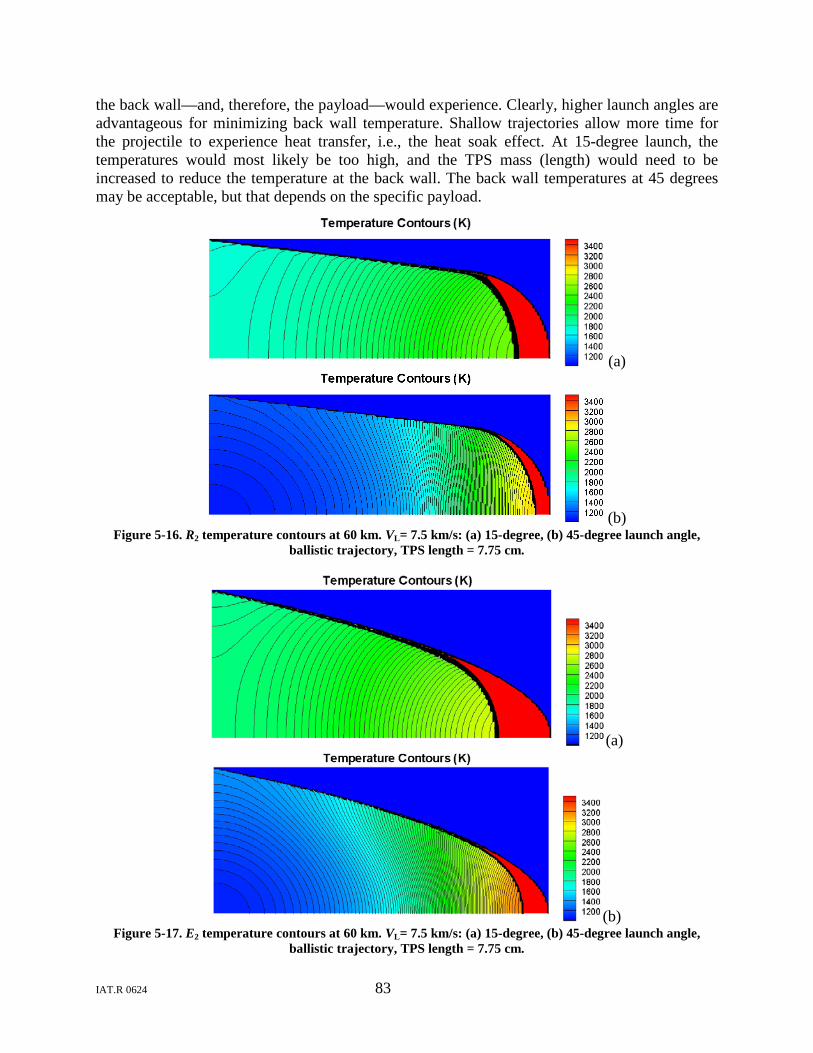
IAT.R 0624 83
the back wall—and, therefore, the payload—would experience. Clearly, higher launch angles are advantageous for minimizing back wall temperature. Shallow trajectories allow more time for the projectile to experience heat transfer, i.e., the heat soak effect. At 15-degree launch, the temperatures would most likely be too high, and the TPS mass (length) would need to be increased to reduce the temperature at the back wall. The back wall temperatures at 45 degrees may be acceptable, but that depends on the specific payload.
(a)
(b) Figure 5-16. R2 temperature contours at 60 km. VL= 7.5 km/s: (a) 15-degree, (b) 45-degree launch angle,
ballistic trajectory, TPS length = 7.75 cm.
(a)
(b) Figure 5-17. E2 temperature contours at 60 km. VL= 7.5 km/s: (a) 15-degree, (b) 45-degree launch angle,
ballistic trajectory, TPS length = 7.75 cm.
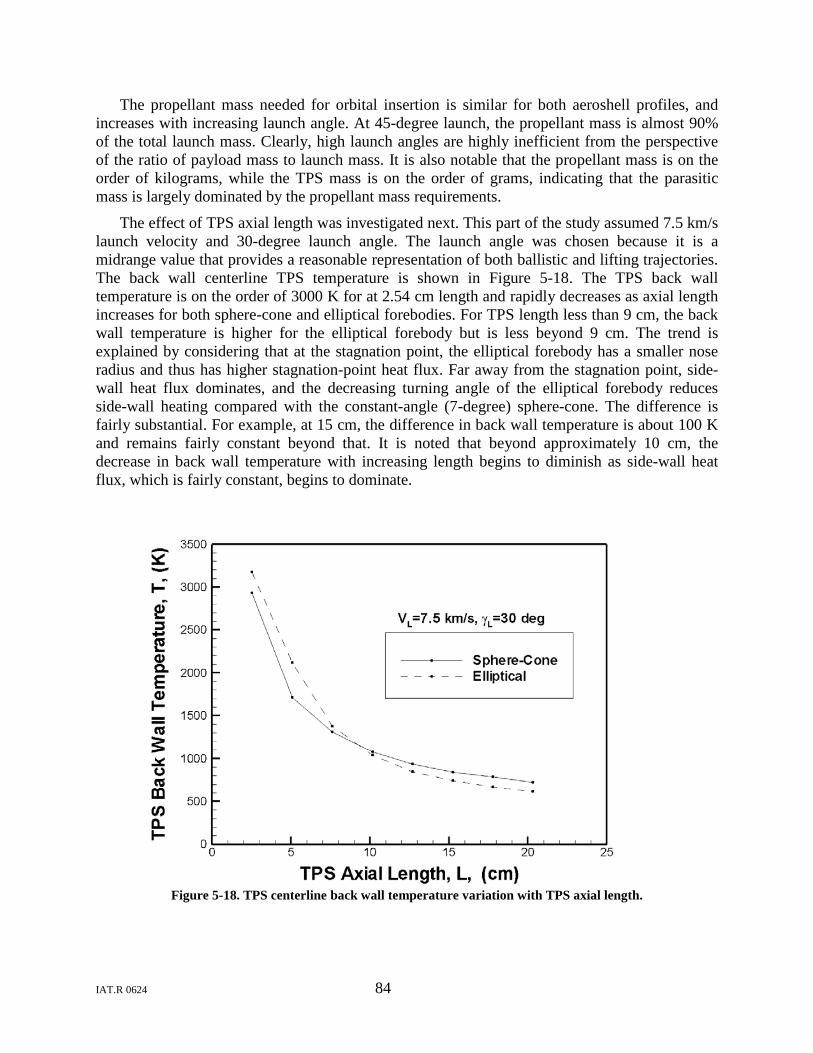
IAT.R 0624 84
The propellant mass needed for orbital insertion is similar for both aeroshell profiles, and increases with increasing launch angle. At 45-degree launch, the propellant mass is almost 90% of the total launch mass. Clearly, high launch angles are highly inefficient from the perspective of the ratio of payload mass to launch mass. It is also notable that the propellant mass is on the order of kilograms, while the TPS mass is on the order of grams, indicating that the parasitic mass is largely dominated by the propellant mass requirements.
The effect of TPS axial length was investigated next. This part of the study assumed 7.5 km/s launch velocity and 30-degree launch angle. The launch angle was chosen because it is a midrange value that provides a reasonable representation of both ballistic and lifting trajectories. The back wall centerline TPS temperature is shown in Figure 5-18. The TPS back wall temperature is on the order of 3000 K for at 2.54 cm length and rapidly decreases as axial length increases for both sphere-cone and elliptical forebodies. For TPS length less than 9 cm, the back wall temperature is higher for the elliptical forebody but is less beyond 9 cm. The trend is explained by considering that at the stagnation point, the elliptical forebody has a smaller nose radius and thus has higher stagnation-point heat flux. Far away from the stagnation point, side-wall heat flux dominates, and the decreasing turning angle of the elliptical forebody reduces side-wall heating compared with the constant-angle (7-degree) sphere-cone. The difference is fairly substantial. For example, at 15 cm, the difference in back wall temperature is about 100 K and remains fairly constant beyond that. It is noted that beyond approximately 10 cm, the decrease in back wall temperature with increasing length begins to diminish as side-wall heat flux, which is fairly constant, begins to dominate.
Figure 5-18. TPS centerline back wall temperature variation with TPS axial length.
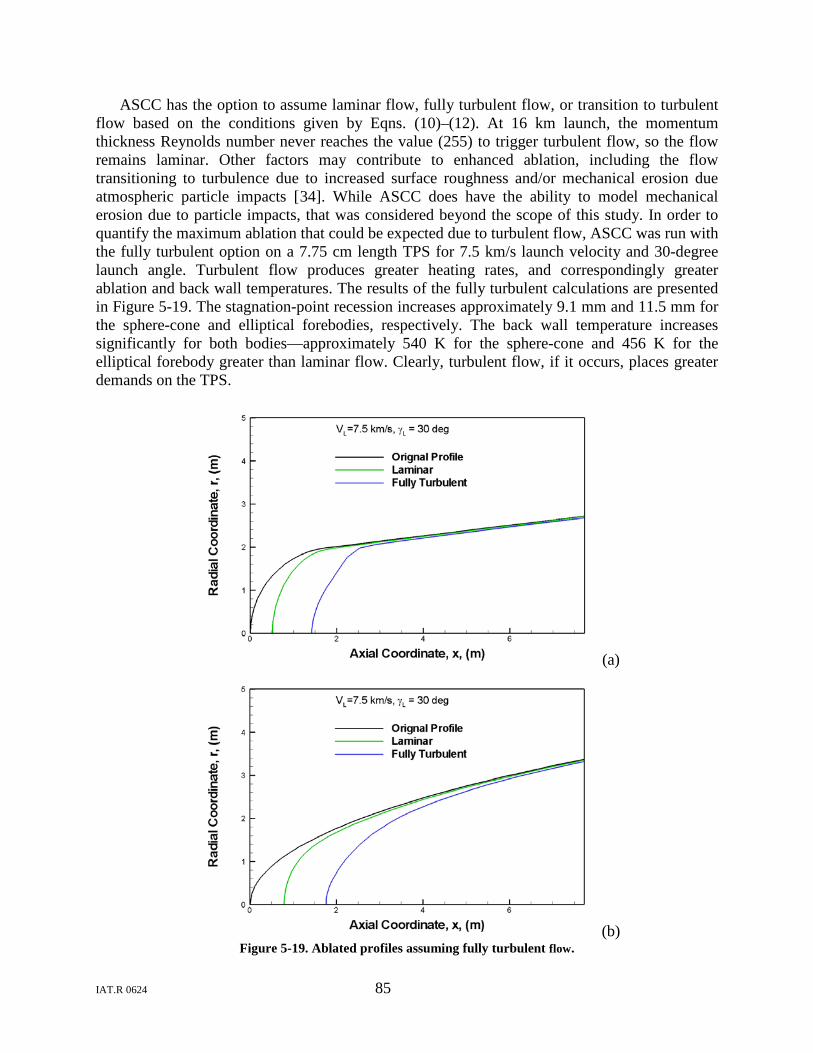
IAT.R 0624 85
ASCC has the option to assume laminar flow, fully turbulent flow, or transition to turbulent flow based on the conditions given by Eqns. (10)–(12). At 16 km launch, the momentum thickness Reynolds number never reaches the value (255) to trigger turbulent flow, so the flow remains laminar. Other factors may contribute to enhanced ablation, including the flow transitioning to turbulence due to increased surface roughness and/or mechanical erosion due atmospheric particle impacts [34
Figure 5-19
]. While ASCC does have the ability to model mechanical erosion due to particle impacts, that was considered beyond the scope of this study. In order to quantify the maximum ablation that could be expected due to turbulent flow, ASCC was run with the fully turbulent option on a 7.75 cm length TPS for 7.5 km/s launch velocity and 30-degree launch angle. Turbulent flow produces greater heating rates, and correspondingly greater ablation and back wall temperatures. The results of the fully turbulent calculations are presented in . The stagnation-point recession increases approximately 9.1 mm and 11.5 mm for the sphere-cone and elliptical forebodies, respectively. The back wall temperature increases significantly for both bodies—approximately 540 K for the sphere-cone and 456 K for the elliptical forebody greater than laminar flow. Clearly, turbulent flow, if it occurs, places greater demands on the TPS.
(a)
(b) Figure 5-19. Ablated profiles assuming fully turbulent flow.
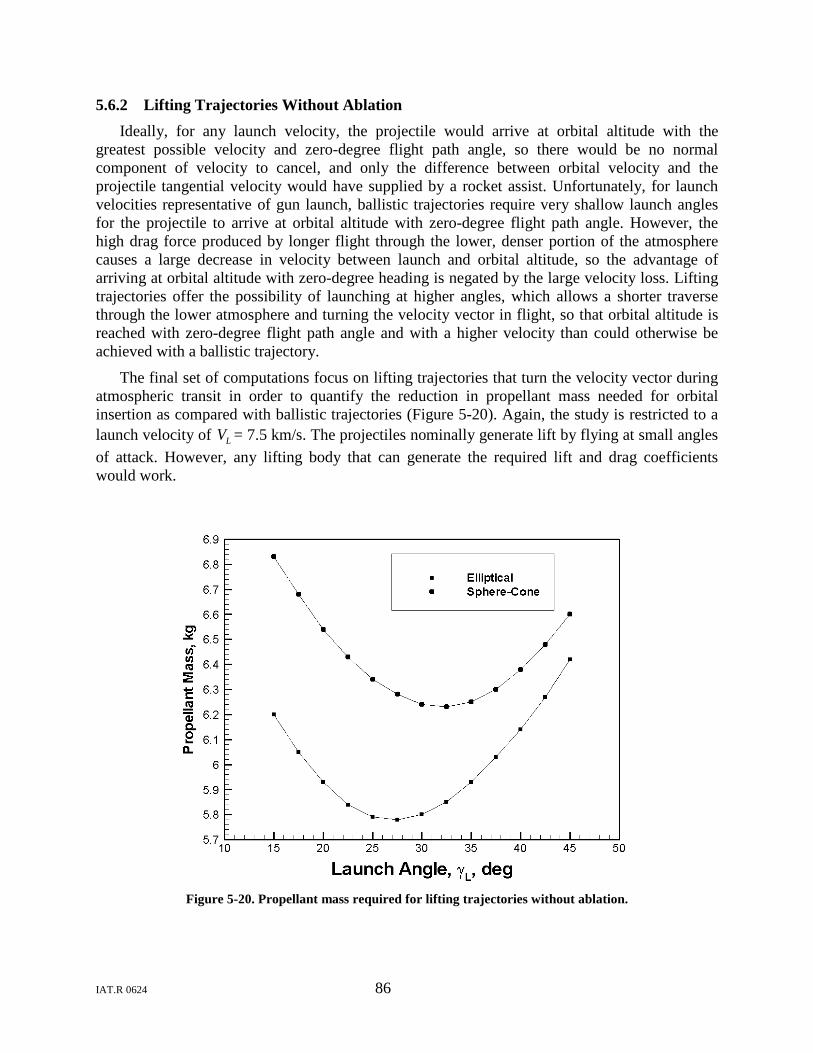
IAT.R 0624 86
5.6.2 Lifting Trajectories Without Ablation Ideally, for any launch velocity, the projectile would arrive at orbital altitude with the
greatest possible velocity and zero-degree flight path angle, so there would be no normal component of velocity to cancel, and only the difference between orbital velocity and the projectile tangential velocity would have supplied by a rocket assist. Unfortunately, for launch velocities representative of gun launch, ballistic trajectories require very shallow launch angles for the projectile to arrive at orbital altitude with zero-degree flight path angle. However, the high drag force produced by longer flight through the lower, denser portion of the atmosphere causes a large decrease in velocity between launch and orbital altitude, so the advantage of arriving at orbital altitude with zero-degree heading is negated by the large velocity loss. Lifting trajectories offer the possibility of launching at higher angles, which allows a shorter traverse through the lower atmosphere and turning the velocity vector in flight, so that orbital altitude is reached with zero-degree flight path angle and with a higher velocity than could otherwise be achieved with a ballistic trajectory.
The final set of computations focus on lifting trajectories that turn the velocity vector during atmospheric transit in order to quantify the reduction in propellant mass needed for orbital insertion as compared with ballistic trajectories (Figure 5-20). Again, the study is restricted to a launch velocity of LV = 7.5 km/s. The projectiles nominally generate lift by flying at small angles of attack. However, any lifting body that can generate the required lift and drag coefficients would work.
Figure 5-20. Propellant mass required for lifting trajectories without ablation.
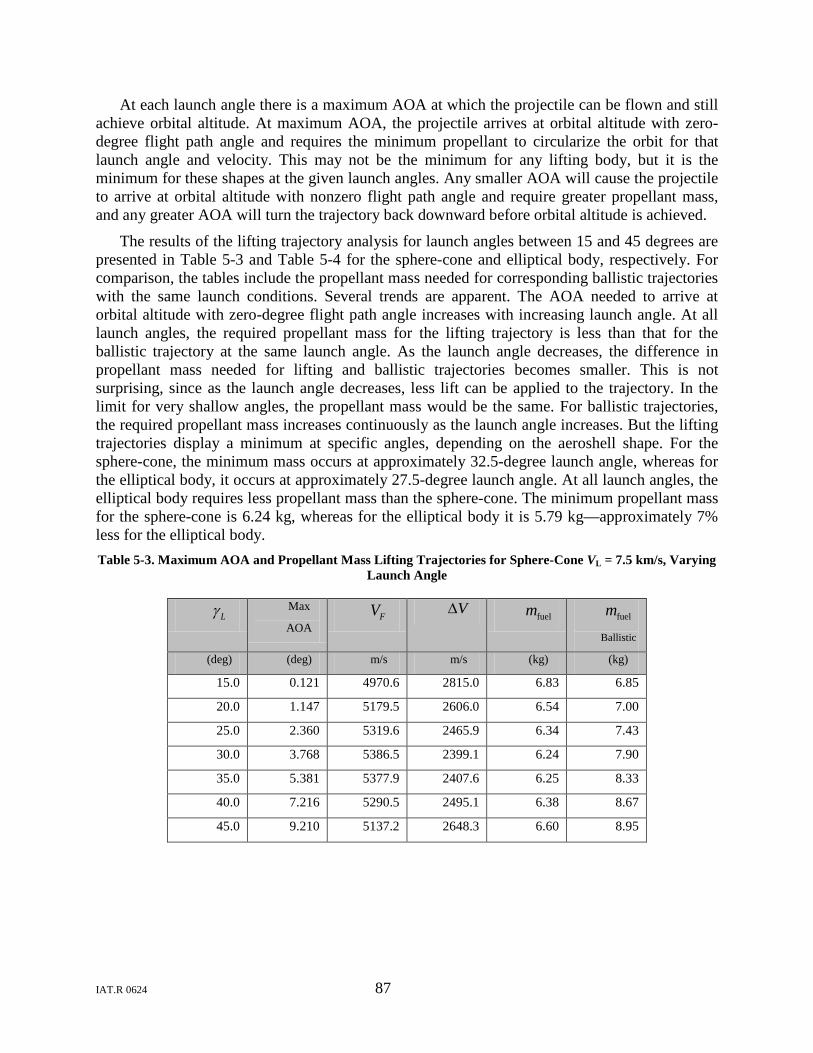
IAT.R 0624 87
At each launch angle there is a maximum AOA at which the projectile can be flown and still achieve orbital altitude. At maximum AOA, the projectile arrives at orbital altitude with zero-degree flight path angle and requires the minimum propellant to circularize the orbit for that launch angle and velocity. This may not be the minimum for any lifting body, but it is the minimum for these shapes at the given launch angles. Any smaller AOA will cause the projectile to arrive at orbital altitude with nonzero flight path angle and require greater propellant mass, and any greater AOA will turn the trajectory back downward before orbital altitude is achieved.
The results of the lifting trajectory analysis for launch angles between 15 and 45 degrees are presented in Table 5-3 and Table 5-4 for the sphere-cone and elliptical body, respectively. For comparison, the tables include the propellant mass needed for corresponding ballistic trajectories with the same launch conditions. Several trends are apparent. The AOA needed to arrive at orbital altitude with zero-degree flight path angle increases with increasing launch angle. At all launch angles, the required propellant mass for the lifting trajectory is less than that for the ballistic trajectory at the same launch angle. As the launch angle decreases, the difference in propellant mass needed for lifting and ballistic trajectories becomes smaller. This is not surprising, since as the launch angle decreases, less lift can be applied to the trajectory. In the limit for very shallow angles, the propellant mass would be the same. For ballistic trajectories, the required propellant mass increases continuously as the launch angle increases. But the lifting trajectories display a minimum at specific angles, depending on the aeroshell shape. For the sphere-cone, the minimum mass occurs at approximately 32.5-degree launch angle, whereas for the elliptical body, it occurs at approximately 27.5-degree launch angle. At all launch angles, the elliptical body requires less propellant mass than the sphere-cone. The minimum propellant mass for the sphere-cone is 6.24 kg, whereas for the elliptical body it is 5.79 kg—approximately 7% less for the elliptical body. Table 5-3. Maximum AOA and Propellant Mass Lifting Trajectories for Sphere-Cone VL = 7.5 km/s, Varying
Launch Angle
Lγ Max
AOA FV V∆
fuelm fuelm Ballistic
(deg) (deg) m/s m/s (kg) (kg)
15.0 0.121 4970.6 2815.0 6.83 6.85
20.0 1.147 5179.5 2606.0 6.54 7.00
25.0 2.360 5319.6 2465.9 6.34 7.43
30.0 3.768 5386.5 2399.1 6.24 7.90
35.0 5.381 5377.9 2407.6 6.25 8.33
40.0 7.216 5290.5 2495.1 6.38 8.67
45.0 9.210 5137.2 2648.3 6.60 8.95
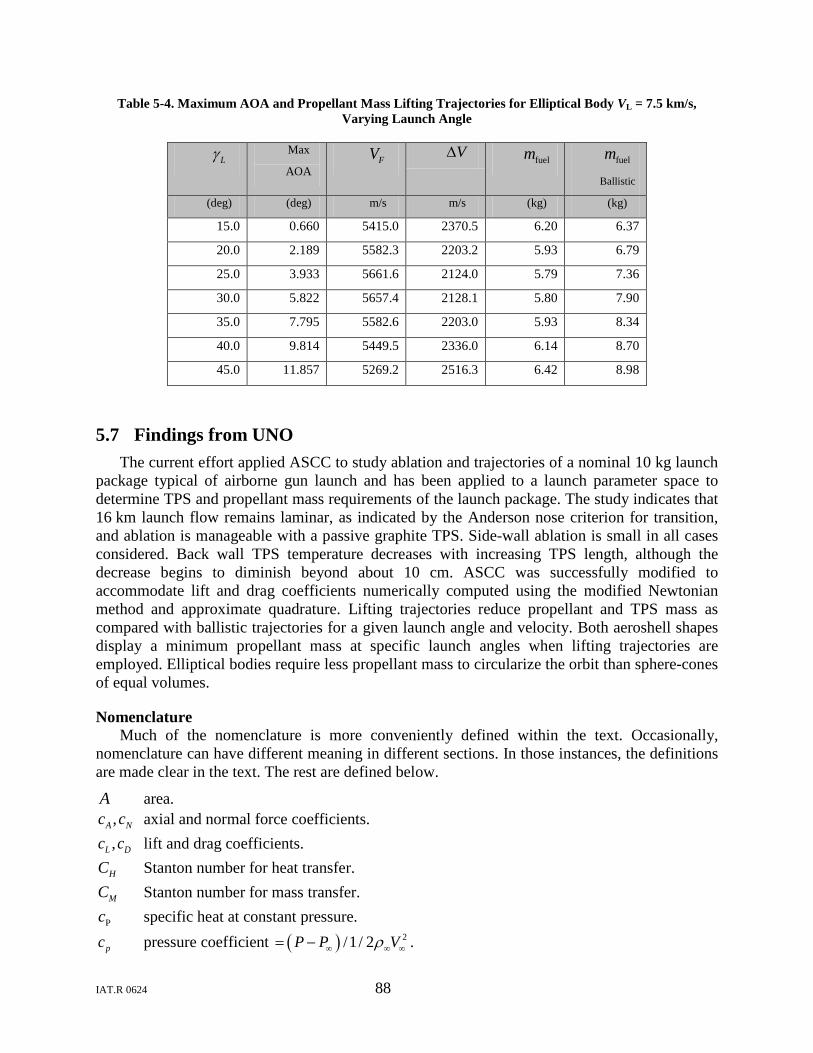
IAT.R 0624 88
Table 5-4. Maximum AOA and Propellant Mass Lifting Trajectories for Elliptical Body VL = 7.5 km/s, Varying Launch Angle
Lγ Max
AOA FV V∆
fuelm fuelm Ballistic
(deg) (deg) m/s m/s (kg) (kg)
15.0 0.660 5415.0 2370.5 6.20 6.37
20.0 2.189 5582.3 2203.2 5.93 6.79
25.0 3.933 5661.6 2124.0 5.79 7.36
30.0 5.822 5657.4 2128.1 5.80 7.90
35.0 7.795 5582.6 2203.0 5.93 8.34
40.0 9.814 5449.5 2336.0 6.14 8.70
45.0 11.857 5269.2 2516.3 6.42 8.98
5.7 Findings from UNO The current effort applied ASCC to study ablation and trajectories of a nominal 10 kg launch
package typical of airborne gun launch and has been applied to a launch parameter space to determine TPS and propellant mass requirements of the launch package. The study indicates that 16 km launch flow remains laminar, as indicated by the Anderson nose criterion for transition, and ablation is manageable with a passive graphite TPS. Side-wall ablation is small in all cases considered. Back wall TPS temperature decreases with increasing TPS length, although the decrease begins to diminish beyond about 10 cm. ASCC was successfully modified to accommodate lift and drag coefficients numerically computed using the modified Newtonian method and approximate quadrature. Lifting trajectories reduce propellant and TPS mass as compared with ballistic trajectories for a given launch angle and velocity. Both aeroshell shapes display a minimum propellant mass at specific launch angles when lifting trajectories are employed. Elliptical bodies require less propellant mass to circularize the orbit than sphere-cones of equal volumes.
Nomenclature Much of the nomenclature is more conveniently defined within the text. Occasionally,
nomenclature can have different meaning in different sections. In those instances, the definitions are made clear in the text. The rest are defined below.
A area. ,A Nc c axial and normal force coefficients. ,L Dc c lift and drag coefficients.
HC Stanton number for heat transfer.
MC Stanton number for mass transfer.
Pc specific heat at constant pressure.
pc pressure coefficient ( ) 2/1/ 2P P Vρ∞ ∞ ∞= − .

IAT.R 0624 89
h enthalpy per unit mass. rH recovery enthalpy per unit mass.
k roughness height. M Mach number. n recession rate normal to surface.
cm mass flow rate of char per unit area. P pressure. q Rate of heat transfer per unit area.
br ( )coso sr r θ= + .
or body circumferential radius of curvature.
cr local streamwise radius of curvature. Re Reynolds number.
,u v velocity components of V∞ . *iz diffusion driving potential for mass species i.
α Angle of attack (AOA). wα thermal absorptivity.
ε emissivity. κ thermal conductivity. ρ density. σ Stefan-Boltzman constant. θ momentum thickness.
cθ cone angle of sphere-cone.
sθ surface inclination with respect to x-axis.
Subscripts c char. e boundary layer edge. F final (orbital) condition. L launch condition. max maximum. s surface. w wall. ∞ freestream.
Superscripts
wT evaluated at wall temperature.
5.7.1 Summary Studies at the UNO have focused on an aerothermal and trajectory analysis of a nominal 10 kg payload launched from a 16 km altitude airborne platform into a 200 km circular orbit. The study computed ballistic trajectories of sphere-cones with ablation assuming laminar and turbulent flow and quantified total ablation and the required propellant mass needed to circularize the orbit
IAT.R 0624 90
for given launch conditions. In addition, lifting trajectories were studied (without ablation in this initial study) by flying sphere-cone and ellipsoid projectiles at small angles of attack to turn the velocity vector during climb to orbit through the upper atmosphere to achieve orbital insertion while reducing the initial launch velocity required. The results will be reported at an upcoming conference [7] and are included here as Appendix A.
5.8 Conferences, Meetings, and Seminar Participation 2009 IEEE International Pulsed Power Conference, Washington DC, June 28–July 2, 2009.
1 paper—UT-IAT
1 paper—TTU
56th JPM/39th &EDCS/28th NTS/24th S&EPS/17th NDES, April 14th – 17th, Las Vegas, Nevada.
2 papers—UT-IAT
6 Overall MURI Conclusions Substantial progress has been made in all technical areas by all co-principal investigators
over the course of the study. In summary, these have been as follows:
• The research effort at UT-IAT has focused on developing methods to improve the integrity of the augmented launcher bore using high-pressure assembly techniques and improved ceramic tiles to provide longer bore life for research at velocities up to 7 km/s.
• Researchers at TTU have designed and are in the process of building a 40-stage, high-efficiency, distributed synchronous launcher to demonstrate operation at high velocities (the goal is ~10 km/s) with plasma arcs.
• Researchers at UMN and UNO have continued to make progress in defining the requirements for the thermal protection system for hypervelocity projectile launches from high altitude at Mach numbers of ~25.
In parallel with these scientific and engineering efforts, contact has been made with three organizations that have an interest in pursuing related efforts in this area. These contacts include the Missile Defense Agency, which is considering such approaches as an alternative missile defense concept; researchers at Air Force Research Laboratory (AFRL) Edwards, who are developing plasma thrusters for space propulsion; and with a major airframe manufacturer.
In all cases, despite the excellent progress made this year, more remains to be done, as summarized in the following section.
It is notable that Dr. Wetz worked on this MURI and graduated from TTU before joining UT-IAT to continue to undertake research on this topic. In the last month, Dr. Wetz has moved to the University of Texas at Arlington to take up a position as Assistant Professor. At UMN, Mr. Gosse graduated with his PhD and joined the AFRL in Dayton. At TTU, Mr. Karhi completed his PhD in 2010. At UT-IAT, Dr. Stefani completed his PhD in December 2008.
The results achieved to date in this MURI and summarized above are encouraging:

IAT.R 0624 91
• A concept for achieving hypervelocity (> 6 km/s) in an EM launcher has been developed, and initial experiments at UT-IAT have proven encouraging in achieving > 5 km/s.
• Concepts for a distributed power-feed concept have been evaluated by TTU and have led to the design, assembly and testing of a 40-stage synchronous distributed-feed experiment in which plasma velocities > 14 km/s have been observed.
• Studies by UMN and UNO have shown high-altitude (15 km) launch to be feasible from a B-52-like aircraft with projectiles of about 10 kg, insofar as having acceptable stagnation-point nose-tip recession.
• Discussions with several organizations have led to potential areas for cooperation and possible follow-on studies on relevant topics.
Acknowledgments This work is based upon work supported by the AFOSR under Award No. FA9550-05-1-
0341 with guidance from the AFOSR Project Manager, Dr. Mitat Birkan, following initial support from Dr. Bob Barker. Any opinions, findings, and conclusions or recommendations expressed in this publication are those of the authors and do not necessarily reflect the views of the AFOSR.
The outstanding contributions made by the co-principal investigators (Professor Candler of the University of Minnesota, Professors. Giesselman and Mankowski of Texas Tech University, and Professor Guillot of the University of New Orleans) and their teams is most gratefully acknowledged, as are the efforts of the UT-IAT research scientists and engineers, especially Drs. David Wetz, Francis Stefani, and Jerry Parker.
References 1. S. C. Rashleigh and R. A. Marshall, “EM acceleration of macroparticles to high velocity,”
J. Appl. Phys., vol. 49, pp. 2540–2542, 1978.
2. I. R. McNab. “Launch to Space with an Electromagnetic Railgun,” IEEE Trans. Mag., vol. 39 (1), pp. 295–304, 2003.
3. IAT Report IAT.R 0506, August 2007.
4. C. H. Haight and M. M. Tower, “Distributed Energy Store (DES) Railgun Development,” Proc. of 3rd EML Symposium, pp. 81–84, Austin, Texas, April 1986.
5. R. Marshall, “Railgun Energy Stores and Systems,” Proc. of the IEEE International Pulsed Power Conference, pp. 193–196, 1981.
6. J. V. Parker, “Electromagnetic projectile acceleration utilizing distributed energy sources,” J. Appl. Phys., vol. No. 53, pp. 6710–6723, October 1982.
7. J. P. Barber and A. Challita, “Monthly Progress Letter,” IAP Research, Inc., Dayton, Ohio, LTVAD P.O. P-350272, April 1984.

IAT.R 0624 92
8. J. V. Parker, “Why Plasma Armature Railguns Don’t Work (And What Can Be Done About It),” IEEE Transactions on Magnetics, vol. 25, pp. 418 – 424, January 1989.
9. R. Karhi, “Instrumentation and Control of Electromagnetic Launchers,” Master’s Thesis, Texas Tech University, Lubbock, Texas, 2007.
10. J. V. Parker, W. Condit, and Y. Thio, “Investigation of Plasma Armature Dynamics,” AFATL report, Part 2, December 1990.
11. R. Karhi, J. Mankowski, J. Dickens, M. Kristiansen, and D. Wetz, “Secondary Arc Formation within a Distributed Energy Railgun,” IEEE Transactions on Plasma Science, October 2008.
12. J. F. Kerrisk, “Current Distribution and Inductance Calculations for Railgun Conductors,” LA-9092-MS, November 1981.
13. R. A. Marshall and W. F. Weldon, “Analysis of Performance of Railgun Accelerators Powered by Distributed Energy Stores,” 14th Pulse Power Modulator Symposium, Orlando, Florida, June 3-5, 1980.
14. R. Gosse and G. V. Candler, “CFD Study of an Electro-Magnetic Launched Projectile for Access to Space.” Presented at and published in the proceedings of the 26th AIAA Applied Aerodynamics Conference, 18–21 August 2008, Honolulu, Hawaii.
15. R. Gosse and G. V. Candler, “Evaluation of Carbon-Carbon Ablation Models Using a Fully Coupled CFD Solver.” Presented at and published in the proceedings of the 40th Thermophysics Conference, 23–26 June 2008, Seattle, Washington.
16. M. N. Sweeting, “Space at Surrey: Micro-mini satellites for affordable access to space,” Air and Space Europe, 2(1), Jan.–Feb. 2000.
17. A. D. Ketsdever, M. P. Young, and J. B. Mossman, “Overview of advanced concepts for space access,” AIAA Journal of Spacecraft and Rockets, 47(2), March–April 2010.
18. M. R. Palmer, “Motivation for a near term gun launch to space demonstration and a variable inductance power supply concept to minimize initial demonstration costs,” IEEE Transactions on Magnetics, 29(1), 478–483, Jan. 1993.
19. G. V. Bull and C. H. Murphy, “The Paris Guns and Project Harp,” Verlag, E, S, Mittler & Sohn GmbH Herford and Bonn, 1988.
20. Ian R. McNab, “Launch to space with an electromagnetic railgun,” IEEE Transactions on Magnetics, 39(1), 295–304, January 2003.
21. I. R. McNab, “Progress on hypervelocity railgun research for launch to space,” IEEE Transactions on Magnetics, 45(1), 381–388, January 2009.
22. C. B. Moyer and R. A. Rindal, “An Analysis of the Coupled Chemically Reacting Boundary Layer and Charring Ablator, Part I: Summary Report,” NASA CR-1061, June 1968.
23. C. B. Moyer and R. A. Rindal, “An Analysis of the Coupled Chemically Reacting Boundary Layer and Charring Ablator, Part II: Finite Difference Solution for the In-Depth Response of Charring Materials Considering Surface Chemical and Energy Balances,” NASA CR-1061, June 1968.
IAT.R 0624 93
24. E. P. Bartlett and R. M. Kendall, “An Analysis of the Coupled Chemically Reacting Boundary Layer and Charring Ablator, Part III: Non-similar Solution of the Multi-component Laminar Boundary Layer by an Integral Matrix Method,” NASA CR-1062, June 1968.
25. E. P. Bartlett, R. M. Kendall, and R. A. Rindal, “An Analysis of the Coupled Chemically Reacting Boundary Layer and Charring Ablator, Part IV: A Unified Approximation for the Mixture Transport Properties for Multi-component Boundary Layer Applications,” NASA CR-1063, June 1968.
26. R. M. Kendall, “An Analysis of the Coupled Chemically Reacting Boundary Layer and Charring Ablator, Part V: Solution of Mixed Equilibrium-Nonequilibrium Homogenous or Heterogeneous Systems,” NASA CR-1064, June 1968.
27. R. A. Rindal, “An Analysis of the Coupled Chemically Reacting Boundary Layer and Charring Ablator, Part VI: Charring Ablator Response with In-Depth ‘Coking Reactions’,” NASA CR-1065, June 1968.
28. M. R. Wool, “Final Summary Report: Passive Nosetip Technology (PANT) Program,” Prepared for SAMSO by Acurex/Aerotherm, Aerotherm TR-75-159, SAMSO-TR-75-250 (NTIS AD-A019-186), June 1975.
29. H. C. King, K. K. Muramoto, and S. W. Pronchick, “ABRES Shape Change Code (ASCC86): Technical Report and User’s Manual,” Report FR-86-24/ATD, Acurex Corp, Mountain View, CA, December 1986. Available through DTIC Accession # ADB128466 (export controlled).
30. A. D. Anderson, “Passive Nosetip Technology (PANT) Program, Vol. X: Summary of Experimental and Analytical Results,” Appendix A, SAMSO-TR-74-86, January 1975.
31. H. Jaslow, “Aerodynamic Relationships Inherent in Newtonian Impact Theory,” AIAA Journal, vol. 6, no. 4, pp. 609–612, April 1968.
32. J. Pike, “The Lift and Drag of Axisymmetric Bodies in Newtonian Flow,” AIAA Journal, vol. 7, no. 1, pp. 185–186, January 1969.
33. J. Pike, “Newtonian Lift and Drag of Blunt-Cone Cylinder Bodies,” AIAA Journal, vol. 10, no. 2, pp. 176–180, February 1972.
34. R. A. Rindal, M. R. Wool, and C. A. Powars, “Baseline Solutions for the Smooth Wall Thermochemical Ablation Response of Graphite and Carbon Phenolic,” AFML-TR-71-74, Air Force Materials Laboratory, Wright Patterson Air Force Base, Ohio, July 1971.