Embed Size (px)
Citation preview

Multispectral oximetry of murine tendonmicrovasculature with inflammation
MARIEKE A. VAN DER PUTTEN,1 JAMES M. BREWER,2 AND ANDREWR. HARVEY1,*
1School of Physics & Astronomy, University of Glasgow, G12 8QQ, UK2Institute for Infection, Immunity & Inflammation, University of Glasgow, G12 8QQ, UK*[email protected]
Abstract: We report a novel multispectral imaging technique for localised measurement ofvascular oxygen saturation (SO2) in vivo. Annular back-illumination is generated using aSchwarzchild-design reflective objective. Analysis of multispectral data is performed using acalibration-free oximetry algorithm. This technique is applied to oximetry in mice to measureSO2 in microvasculature supplying inflamed tendon tissue in the hind leg. Average SO2 for con-trols was 94.8 ± 7.0 % (N = 6), and 84.0 ± 13.5 % for mice with inflamed tendon tissue (N = 6).We believe this to be the first localised measurement of hypoxia in tendon microvasculaturedue to inflammation. Quantification of localised SO2 is important for the study of inflammatorydiseases such as rheumatoid arthritis, where hypoxia is thought to play a role in pathogenesis.
c© 2017 Optical Society of America
OCIS codes: (110.4234) Multispectral and hyperspectral imaging; (170.0110) Imaging systems; (170.1470) Blood or
tissue constituent monitoring; (170.3880) Medical and biological imaging.
References and links1. H. K. Eltzschig and P. Carmeliet, “Hypoxia and inflammation,” N. Engl. J. Med. 364(20), 656–665 (2011).2. P. C. Taylor and B. Sivakumar, “Hypoxia and angiogenesis in rheumatoid arthritis,” Curr. Opin. Rheumatol. 17(3),
293–298 (2005).3. D. Mordant, I. Al-Abboud, G. Muyo, A. Gorman, A. Sallam, P. Rodmell, J. Crowe, S. Morgan, P. Ritchie, A. R.
Harvey, and A. I. McNaught, “Validation of human whole blood oximetry, using a hyperspectral fundus camerawith a model eye,” Invest. Ophthalmol. Vis. Sci. 52(5), 2851–2859 (2011).
4. H. C. Hendargo, Y. Zhao, T. Allenby, and G.M. Palmer, “Snap-shot multispectral imaging of vascular dynamics ina mouse window-chamber model,” Opt. Lett. 40(14), 3292–3295 (2015).
5. F. C. Delori, “Noninvasive technique for oximetry of blood in retinal vessels,” Appl. Opt. 27(6), 1113–1125 (1988).6. J. M. Beach, K. J. Schwenzer, S. Srinivas, D. Kim, and J. S. Tiedeman, “Oximetry of retinal vessels by dual-
wavelength imaging: calibration and influence of pigmentation,” J. Appl. Physiol. 86(2), 748–758 (1999).7. T. R. Choudhary, D. Ball, J. Fernandez Ramos, A. I. McNaught, and A.R. Harvey, “Assessment of acute mild
hypoxia on retinal oxygen saturation using snapshot retinal oximetry,” Invest. Ophthalmol. Vis. Sci. 54(12), 7538–7543 (2013).
8. D. J. Mordant, I. Al-Abboud, G. Muyo, A. Gorman, A. R. Harvey, and A. I. McNaught, “Oxygen saturation measure-ments of the retinal vasculature in treated asymmetrical primary open-angle glaucoma using hyperspectral imaging,”Eye 28, 1190–1200 (2014).
9. W. R. Johnson, D. W. Wilson, W. Fink, M. Humayun, and G. Bearman, “Snapshot hyperspectral imaging in oph-thalmology,” J. Biomed. Opt. 12(1), 014036 (2014).
10. J. V. Kristjansdottir, S. H. Hardarson, G. H. Halldorsson, R. A. Karlsson, T. S. Eliasdottir, and E. Stefansson,“Retinal oximetry with a scanning laser ophthalmoscope,” Invest. Ophthalmol. Vis. Sci. 55(5), 3120–3126 (2014)
11. L. C. Clark and C. Lyons, “Electrode systems for continuous monitoring in cardiovascular surgery,” Ann. N. Y.Acad. Sci. 102, 29–45 (1962).
12. P. M. Gewehr and D. Delpy, “Optical oxygen sensor based on phosphorescence lifetime quenching and employinga polymer immobilised metalloporphyrin probe,” Med. Biol. Eng. Comput. 31, 2–21 (1993).
13. A. Rajaram, S. Ioussoufovitch, L. B. Morrison, K. St Lawrence, T. Lee, Y. Bureau, and M. Diop, “Joint blood flowis more sensitive to inflammatory arthritis than oxyhemoglobin, deoxyhemoglobin, and oxygen saturation,” Biomed.Opt. Express 7(10), 3843–3854 (2016).
14. A. H. Hielscher, K. K. Hyun, L. D. Montejo, S. Blaschke, U. J. Netz, P. A. Zwaka, G. Illing, G. A. Muller, andJ. Beuthan, “Frequency-domain optical tomographic imaging of arthritic finger joints,” IEEE Trans. Med. Imaging30(10), 1725–1736 (2011).
15. I. A. Artyukov, “Schwarzschild objective and similar two-mirror systems,” Short-Wavelength Imaging and Spec-troscopy Sources, Proc. of SPIE 8678, 86780A1–A6 (2012).
Vol. 8, No. 6 | 1 Jun 2017 | BIOMEDICAL OPTICS EXPRESS 2896
#286568 https://doi.org/10.1364/BOE.8.002896 Journal © 2017 Received 10 Feb 2017; revised 13 Apr 2017; accepted 24 Apr 2017; published 8 May 2017

16. P. I. Rodmell, J. A. Crowe, A. Gorman, A. R. Harvey, G. Muyo, D. J. Mordant, A. I. McNaught, and S. P. Morgan,“Light path-length distributions within the retina,” J. Biomed. Opt. 19(3), 036008 (2014).
17. M. J. M. Fischer, S. Uchida, and K. Messlinger, “Measurement of meningeal blood vessel diameter in vivo with aplug-in for ImageJ,” Microvasc. Res. 80(2), 258–266 (2010).
18. M. A. van der Putten, L. E. MacKenzie, A. L. Davies, J. Fernandez-Ramos, R. A. Desai, K. J. Smith, and A. R.Harvey, “A multispectral microscope for in vivo oximetry of rat dorsal spinal cord vasculature,” Physiol. Meas. 38,205–218 (2017).
19. M.H. Smith, K. R. Denninghoff, A. Lompado, and L. W. Hillman, “Effect of multiple light paths on retinal vesseloximetry,” Appl. Opt. 39(7), 1183–1193 (2000).
20. S. Prahl, “Optical Absorption of Haemoglobin,” http://omlc.org/spectra/hemoglobin/index.html, Oregan MedicalLaser Centre (1999), accessed April 2017.
21. M. Friebel, J. Helfmann, U. Netz, and M. Meinke, “Influence of oxygen saturation on the optical scattering proper-ties of human red blood cells in the spectral range 250 to 2000 nm,” J. Biomed. Opt. 14(3), 034001 (2009).
22. C. Hanning and J. M. Alexander-Williams, “Pulse oximetry: A Practical Review,” BMJ 311, 367–360 (1995).23. P. Gaehtgens, “Distribution of flow and red cell flux in the microcirculation,” Scand. J. Clin. Lab. Invest. 41(1),
83–87 (1981).24. D. Schweitzer, L. Leistritz, M. Hammer, M. Scibor, U. Bartsch, and J. Strobel, “Calibration-free measurement of
the oxygen saturation in retinal vessels of men,” Ophthalmic Technologies V, Proc. SPIE 3293, 210–218 (1995).25. R. H. Byrd, R. B. Schnabel, and G. A. Shultz, “A Trust Region Algorithm for Nonlinearly Constrained Optimiza-
tion,” SIAM J. Numer. Anal. 24(5), 1152-1170 (1987).26. J. Necas and L. Bartosikova, “Carrageenan: a review,” Vet. Med. Czech 58(4), 187–205 (2013).27. C. J. Morris, “Carrageenan-Induced Paw Edema in the Rat and Mouse,” Inflammation Protocols: Methods Mol.
Biol. 225(2), 115–121 (2003).28. C. G. Ellis, M. L. Ellsworth, and R. N. Pittman, “Determination of red blood cell oxygenation in vivo by dual video
densitometric image analysis,” Am. J. Physiol. 258(4), 1216–1223 (1990).29. L. E. MacKenzie, T. R. Choudhary, A. I. McNaught, and A. R. Harvey, “In vivo oximetry of human bulbar conjunc-
tival and episcleral microvasculature using snapshot multispectral imaging,” Exp. Eye Res. 149, 48-58 (2016).30. E. Salomatina and A. N. Yaroslavsky, “Evaluation of the in vivo and ex vivo optical properties in a mouse ear
model,” Phys. Med. Biol. 53(11), 2797–2807 (2008).31. D. L. Asquith, A. M. Miller, I. B. McInnes, and F. Y. Liew “Animal models of rheumatoid arthritis,” Eur. J. Immunol.
39(8), 2040-2044 (2009).32. K. Briely-Saebo and A. Bjornerud, “Accurate de-oxygenation of ex vivo whole blood using sodium Dithionite,”
Proc. Intl. Soc. Mag. Reson. Med. 8, 2025 (2000).33. M. Friebel, J. Helfmann, and M. C. Meinke, “Influence of osmolarity on the optical properties of human erythro-
cytes,” J. Biomed. Opt. 15(5), 055005 (2010).
1. Introduction
An adequate supply of oxygen is critical to the normal and healthy function of cells and tis-sues. The microvasculature, comprised of the smallest blood vessels in the body, is the meansby which oxygen is delivered. Hypoxia, a state of insufficient oxygen, may be caused either bya decreased supply of oxygen delivered by the vasculature, or increased demand in the tissue.The link between inflammation and tissue hypoxia is well established [1], with molecular mark-ers for hypoxia and associated angiogenesis linked to chronic immune-related disease such asrheumatoid arthritis (RA) [2]. It is not known, however, what role hypoxia plays in the progres-sion of RA, where hypoxia originates in the affected joint, or to what extent hypoxia may besuitable as a proxy biomarker of RA and inflammation for diagnostic purposes.
Multispectral oximetry can provide highly localised quantification of blood oxygen satu-ration (SO2), owing to the distinct spectral characteristics of oxygenated and deoxygenatedhaemoglobin [3, 4]. Much of the research to date into techniques for in vivo vascular oximetryhave focused on the eye, specifically the retina where it is of interest in the study of conditionssuch as glaucoma, diabetic retinopathy and retinopathy of prematurity [5–9]. These diseasesare often related to dysfunctional supplies of blood oxygen, and as such the study of SO2 inretinal vasculature can provide useful information regarding the health of the individual. Theprevalence of oximetry in the eye is perhaps owed to the ease with which retinal vessels canbe imaged non-invasively, using modified slit lamps and ophthalmoscopes, for example [10].Hypoxia associated with inflammatory disease is generally localised to the affected area; in the
Vol. 8, No. 6 | 1 Jun 2017 | BIOMEDICAL OPTICS EXPRESS 2897
case of RA, it is the tendons and joints which become inflamed and hypoxic [1]. Obtaininglocalised in vivo measurements of SO2 in tendon tissue is naturally more challenging as it is notoptically accessible due to overlaying layers of skin and other tissue. Bulk oximetry modalitiessuch as Clark electrodes and fibre-optic oxygen probes may be used for interrogation of oxy-gen levels in deep tissue [11, 12]. Previous studies of joints affected by RA carried out usingdiffuse optical spectroscopy (DOS) and diffuse optical tomography (DOT) [13, 14] used trans-mitted illumination to measure the absorption and scattering properties of the joint, to hencedistinguish between healthy and affected joints. However, the resolution of the measurements ispoor and does not provide absolute values of vascular oxygen saturation. Multispectral imagingoximetry provides highly localised SO2 information specific to individual blood vessels, at amuch higher resolution than achievable with bulk probe or DOT measurements. Future workwill investigate what the potential diagnostic advantages are to using these highly localisedmeasurements compared with bulk measurements. Regardless, localised oximetry is desirablefor helping to provide a greater understanding of the spatiotemporal manifestation of hypoxiain inflamed or diseased tissue.
In this paper, we describe multispectral imaging oximetry and analysis of oxygen saturationin the tendon microvasculature of the mouse hind leg, comparing control and inflamed mousetendons. In this case, optical access was achieved by surgical excision of the skin overlyingtendon tissue in the mouse hind leg. This study provides a basis upon which to further developminimally invasive oximetry techniques using microendoscopic probes, which will be highlytransferable for a range of in vivo applications.
2. Multispectral imaging and analysis technique
2.1. Imaging system and illumination
A schematic for the imaging system is shown in Fig. 1. Spectrally tunable illumination is pro-vided by a white-light supercontinuum source (Fianium SC400) coupled to an acousto-optictunable filter (AOTF). An oscillating polymer membrane (Optotune Laser Speckle Reducer3005) was used to reduce spatial coherence and associated image speckle.
A Schwarzchild-type reflective objective [15] (Thorlabs LMM-40X-UVV) and imaging lens(f = 200 mm) provided 40X magnification, corresponding to 0.165 µm per pixel. The reflec-tive objective provides achromatic imaging and also a means to simultaneously employ annularillumination as is commonly used in capillaroscopy. Annular illumination simplifies and im-proves the accuracy of the oximetry algorithm; with annular illumination, back-scattered lightis eliminated and detected light arises only from single-pass absorption through a blood vessel.This concept has been validated for retinal vessels by Rodmell et al [16]. Simplification and im-provement in the accuracy of the oximetry algorithm is hence achieved as described in section2.2.
Using a reflective objective to generate annular illumination is straightforward. When colli-mated light is incident on the back aperture of a Schwarzchild-type reflective objective, as withany lens, a focused spot is formed at the focal plane of the objective. If the illumination focusis offset from this focal plane, however, the defocused spot is approximately annular in shape.The central portion of the beam is blocked by the primary mirror of the objective, resulting ina shadow which creates an illumination pattern as shown in Fig. 1(C). A planoconvex lens (f= 80 mm, L3 in Fig. 1(A), was used to offset the focus of the illumination such that this annu-lus was just larger than the field of view. This resulted in an inner diameter of the annulus ofapproximately 240 µm.
Most of the light incident on the primary mirror of the objective is deflected towards thesecondary mirror before coming to a focus. However, a small central portion of the incidentbeam is directly back-reflected from the centre of the primary mirror, causing loss of contrastand interference patterns in the image. To prevent this, a beam block was introduced at the
Vol. 8, No. 6 | 1 Jun 2017 | BIOMEDICAL OPTICS EXPRESS 2898
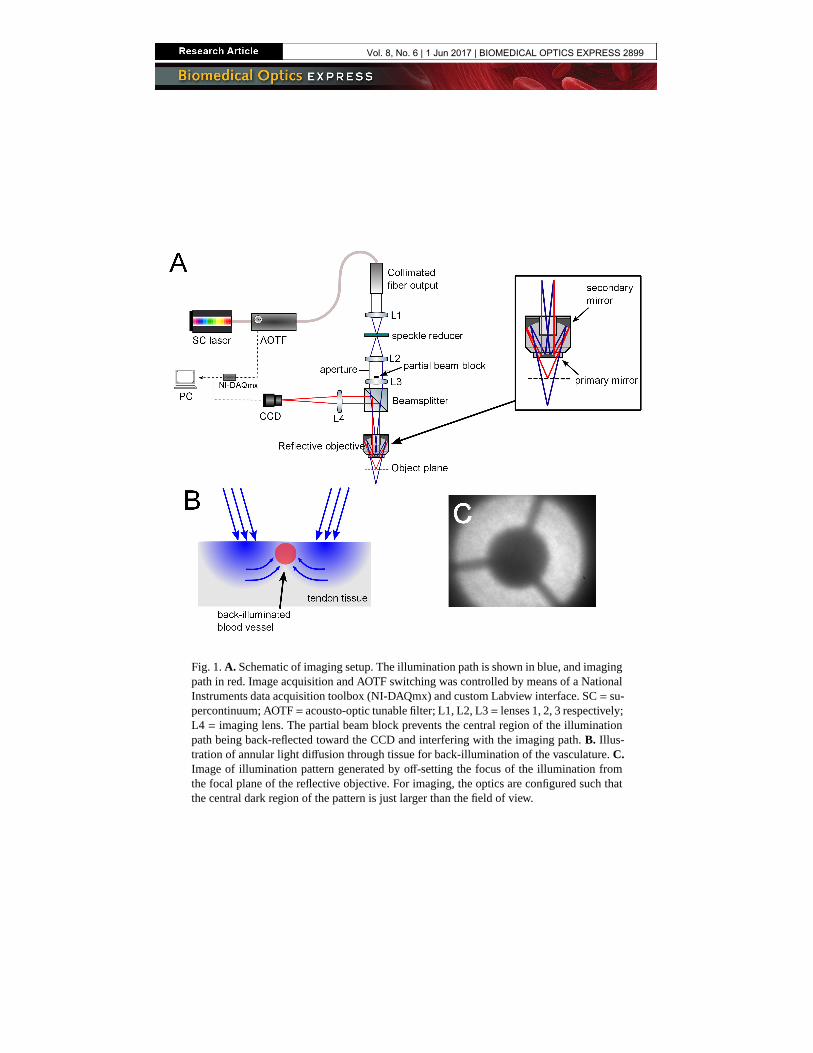
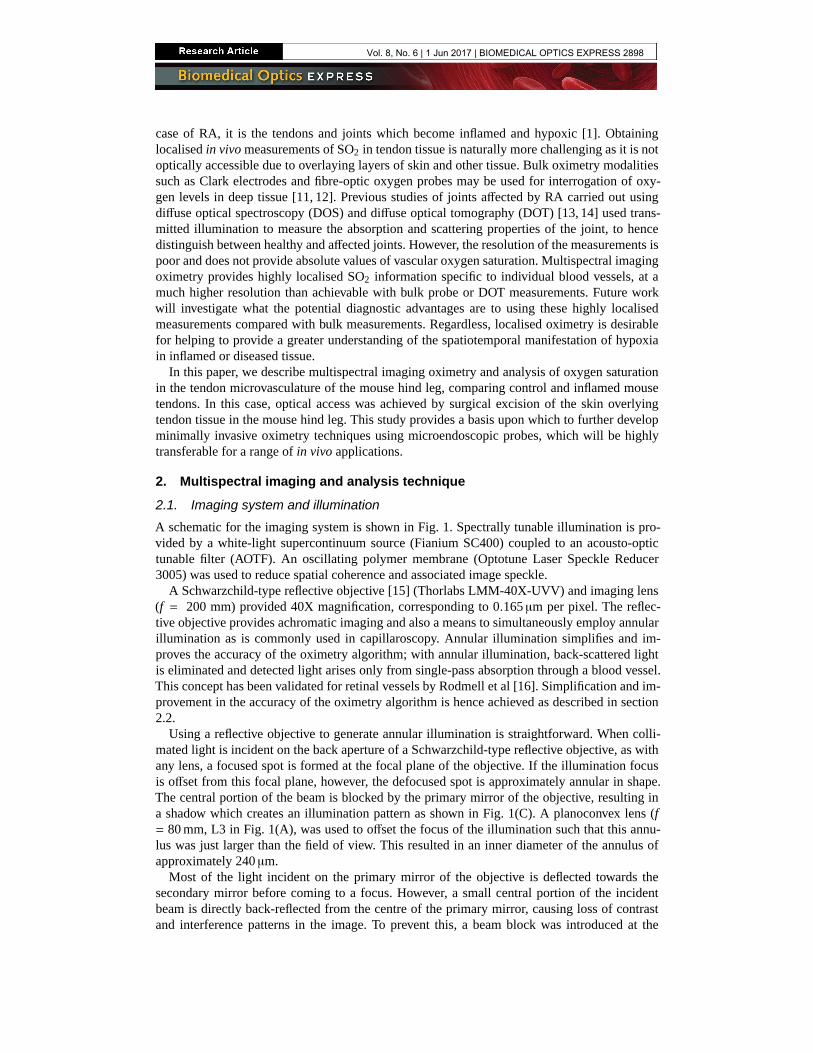
Fig. 1. A. Schematic of imaging setup. The illumination path is shown in blue, and imagingpath in red. Image acquisition and AOTF switching was controlled by means of a NationalInstruments data acquisition toolbox (NI-DAQmx) and custom Labview interface. SC = su-percontinuum; AOTF = acousto-optic tunable filter; L1, L2, L3 = lenses 1, 2, 3 respectively;L4 = imaging lens. The partial beam block prevents the central region of the illuminationpath being back-reflected toward the CCD and interfering with the imaging path. B. Illus-tration of annular light diffusion through tissue for back-illumination of the vasculature. C.Image of illumination pattern generated by off-setting the focus of the illumination fromthe focal plane of the reflective objective. For imaging, the optics are configured such thatthe central dark region of the pattern is just larger than the field of view.
Vol. 8, No. 6 | 1 Jun 2017 | BIOMEDICAL OPTICS EXPRESS 2899

centre of the illumination beam, which was placed directly above lens L3 (as depicted in Fig.1(A)). This effect is less of an issue for reflective objectives with anti-reflective coating at thecentre of the primary mirror.
For multispectral imaging of the microvasculature, an isosbestic wavelength (420 nm) and 5oxygen-sensitive wavelengths were chosen; 410 nm, 430 nm, 435 nm, 440 nm and 450 nm. Theextinction coefficients of haemoglobin are highest in this visible blue region, which is desirableto provide sufficient contrast when imaging the smallest blood vessels. The strong absorptionof light by blood in this wavelength range offers sufficient contrast even through thin layers ofoverlaying tissue. Further, the difference between the coefficients for oxygenated and deoxy-genated haemoglobin at these wavelengths is large enough to allow for accurate oximetry ofthese small vessels; optical densities of the vasculature will change significantly with oxygensaturation over this range. Previous oximetry studies performed on retinal blood vessels in vivohave employed wavelengths in the green and red regions [6,7], however the microvasculature ishighly transparent in this region due to lower extinction coefficients. A multispectral dataset ofa single scene consists of a set of images recorded at each waveband. Data acquisition was con-trolled by a custom LabVIEW interface, which switched the waveband being transmitted by theAOTF, and triggered the CCD image capture. The total acquisition time for one dataset was lessthan 2 seconds. The CCD exposure at each waveband (200 ms for 410 nm - 440 nm, 100 ms for450 nm because of source brightness) contributes to this time, as well as the read-write speedof the computer hard drive.
2.2. Oximetry algorithm
Although relative oximetry is possible with just two wavelengths, the algorithm used here formultispectral data analysis is insensitive to vessel diameter, pigmentation and scattering. As mul-tispectral imaging provides more measurements than unknowns, a least-squares error fit enablesabsolute oxygenation measurements. The algorithm first involves co-registering the six imagesat each waveband. Semi-automatic vessel tracking is then performed to determine coordinatesalong vessels appropriate for analysis. To quantify light transmission through the blood vesselsat each waveband, multiple line profiles are taken across each vessel in an image, perpendicularto each pair of successive image coordinates along the vessel. The transmission of light throughthe vessel is defined as T = I
Io, where Io is the background intensity and I is the intensity
of light transmitted through the vessel. An estimate of Io is obtained from a linear fit to eachline profile, ignoring the central vessel pixels. A second order polynomial fit is then applied tothe central region of the line profile, from which the minimum, I, is estimated. Transmission iscalculated at every point along the vessel, and at every waveband, producing an experimentaltransmission profile T (λ). The diameter of the vessel is also determined using these line profilesand the method described by Fischer et al., (2010) [17].
To determine values for SO2, we implemented an analytical model for optical transmission oflight through blood vessels. The data would then be applied to the model in a series of iterativenonlinear least-squares fits in order to extract unknown parameters, including SO2. Based on themodified Lambert-Beer law, previous work by van der Putten et al. [18] and Smith et al. [19],the optical transmission of a blood vessel can be written as:
T (λ) = s (1 − K ) · 10−(CHb (λ)ηd
[(εHbO2 (λ)−εHb (λ))SO2+εHb (λ)
]+
[(μ′HbO2
(λ)−μ′Hb
(λ))SO2+μ
′Hb
(λ)]ηd)+ K
(1)
where d is vessel diameter; εHbO2 (λ) and εHb (λ) are molar extinction coefficients of oxy-genated and deoxygenated haemoglobin respectively; and μ′
HbO2(λ) and μ′
Hb(λ) are empirical
values for the reduced scattering coefficients. In this work we take values for extinction coeffi-cients from Prahl (1999) [20] and scattering coefficients from Friebel et al., 2009 [21]. These
Vol. 8, No. 6 | 1 Jun 2017 | BIOMEDICAL OPTICS EXPRESS 2900

coefficients have been derived empirically using ex vivo blood, and therefore our technique isaccurate across all oxygen saturation values, unlike traditional pulse oximetry techniques whichare calibration-based and typically unreliable below oxygenations of 70% [22]. In theory it isnecessary to integrate over the illumination spectrum to achieve effective values for extinctionand reduced scattering coefficients for oxygenated and deoxygenated haemoglobin. However,the nominal bandwidth of the AOTF is 2 nm, and for the purposes of the analysis the illumina-tion is considered to be monochromatic. The calculated concentration of haemoglobin in blood,CHb , was allowed to vary from an accepted average value of 160 M/liter, as vessel size andshape is likely to influence haemoglobin concentration [23]. K is an unknown parameter, be-tween 0 and 1, which is introduced to compensate for contrast reduction which can occur dueto changes in tissue thickness above the vessel, and optical scattering in the imaging system.Contrast reduction is modelled as an additive intensity component Ic to both I and Io , where K=
IcIo+Ic
. The unknown parameter s accounts for the light collection geometry [24].The factor η represents the proportion of single-pass and double-pass illumination [19]. For
purely single-pass absorption, η will be 1, whilst for double-pass absorption, η would be equalto 2. The annular illumination configuration previously described ensured that light illuminatingthe field of view will be diffuse, having scattered through the tissue from the surrounding annu-lus of illumination. We assume that only light having undergone a single transmission will reachthe detector and so η = 1, reducing the number of free variables. This illumination configurationalso ensures that negligible back-scattered light would be detected, and so this component wasnot included in the model.
The iterative fits of the model to the data were employed using a trust-region reflective algo-rithm [25]. The fits were performed by first averaging the experimentally obtained transmissionprofile T (λ) over the length of the vessel, and performing an initial fit to give preliminary valuesfor s, SO2, K , and CHb . Three further fits were applied in which s, K and SO2 were allowed tovary respectively, with all other parameters held constant to its most recently determined value.This method proved to be robust with calculated SO2 approximately constant along each vessel;the average standard deviation of SO2 for all vessels was determined to be 2.3 %. The goodnessof fit was assessed by quantifying the coefficient of determination (R2) of the final fit producingthe SO2 parameter. The results for particularly noisy data, where R2 < 0.9, were excluded fromfurther analysis.
3. In vivo imaging of tendon microvasculature
3.1. Methods
All procedures involving the use of living animals were carried out in accordance with UKHome Office guidelines. The study involved 13 female inbred BALB/c mice (18-25 g, 6-8weeks old, Harlan). Six mice were used as controls, and inflammation was induced in an-other six mice using λ-carrageenan [26]. The remaining mouse was used for a kinetic studyof SO2 as a function of inflammation. Carrageenan is a group of complex polysaccharides, thelambda form of which is injectable and induces an acute inflammatory response, peaking 5hours post-inoculation [27]. 25 µl of 1% λ-carrageenan solution in sterile phosphate-bufferedsaline was injected into the mouse footpad of the left hind leg. Inflammation of the footpad wasvalidated by measuring footpad thickness prior to injection, and again 5 hours post-injection,prior to imaging. Footpad thickness increased in this time from an average of 1.6 ± 0.1 mm to3.0 ± 0.3 mm.
All mice were anaesthetized prior to surgery with fentanyl-fluanisone (Hypnorm), midazolam(Hypnovel) and water (1:1:2 by volume) at a dose of 10 µl/g injected intraperitoneally. Theperoneus longus tendon, proximal to the calcaneus in the hind leg, was then surgically exposedby removal of superficial skin layers, which can enable diffusion of oxygen into the bloodvessels through air. We used a layer of oxygen-impermeable plastic film placed in contact with
Vol. 8, No. 6 | 1 Jun 2017 | BIOMEDICAL OPTICS EXPRESS 2901
the exposed tendon tissue to prevent oxygen diffusion, as used in previous studies to isolateblood vessels from oxygen in the atmosphere [28]. This is an important issue for invasive invivo oximetry; exposure of blood vessels to air will result in an increase in SO2 with respect tonormal values, as has previously been observed in the human sclera [29]. The film also preventsthe tissue from drying out over the course of the experiment.
The mouse was placed on the microscope stage and heat pad, which was kept at approxi-mately 37◦C. The hind leg was secured to a small block using surgical tape and Vetbond tissueadhesive. To reduce motion artefacts due to mouse breathing, the leg was kept mechanicallystabilised with respect to the body using a custom, 3D-printed bridge. Setting up the mouse inthis manner reduced motion to an acceptable degree required for time-sequential multispectralimaging. A series of spectral datasets were recorded for each mouse tendon over the course ofseveral minutes.
3.2. Results and discussion
Image data was processed using the algorithm described in section 2.2. For each mouse, a rangeof vessels were selected for analysis. Fig. 2 shows an illustrative example of a tendon micro-vasculature image and the calculated SO2 map. The average values for SO2 produced for eachmouse are shown in Fig. 3, along with the overall average of all results for control and inflamedmice. These values were determined to be 94.8 ± 7.0 % for control SO2, and 84.0 ± 13.5 %for inflamed SO2 respectively (average ± standard deviation). Performing a two-sample t-test,the difference is highly significant (p < 0.001). This suggests that average SO2 levels are lowerin the inflamed tendon vasculature than for the controls. The link between inflammation andhypoxia is well established, so this result is not surprising, however we believe this to be thefirst quantification of localised hypoxia in the vasculature of inflamed tendons.
Fig. 2. Illustrative image of tendon microvasculature and SO2 map. The colour bar repre-sents SO2, and each vessel length analysed is numbered and labelled on the image. Thescale bar represents 20 µm.
As well as a comparison of control and inflamed tendons, an additional oximetry studywas performed on a mouse tendon post mortem as validation that the technique is sensitiveto changes in blood oxygenation. It is known that rapid deoxygenation of the vasculature occurspost mortem due to local metabolism of oxygen by cells which continues after death [30]. Forone case, a mouse was euthanised whilst secured to the imaging stage, and data was acquired 5minutes post mortem, at which point the blood vessels are assumed to be highly deoxygenated.It was found, as shown in Fig. 4, that calculated SO2 decreased in this time from 71.9 ± 7.4 %
Vol. 8, No. 6 | 1 Jun 2017 | BIOMEDICAL OPTICS EXPRESS 2902

Control Inflamed
SO
2 (
%)
70
75
80
85
90
95
100
105Individual tendonsControl averageInflamed average
Fig. 3. Oximetry of control and inflamed (5-6 hours post λ-carrageenan inoculation) mousetendon vasculature, shown as values for individual tendons averaged over multiple vessels.The overall average for control and inflamed tendons are shown in red and blue respectively± standard deviation between tendons.
to 48.2 ± 8.2 %, further supporting the responsivity of the technique to oxygen saturation.
Control average Individual tendon (inflamed)
Individual tendon(5 mins post mortem)
SO
2 (
%)
30
40
50
60
70
80
90
100
110
Fig. 4. Comparison of overall control SO2 (average over all tendons ± standard deviation),average inflamed SO2 for an individual mouse , and SO2 of the same tendon post mortem(both averaged over all vessels within tendon ± standard deviation)
Finally, for one additional mouse, a kinetic analysis was performed to investigate SO2 as afunction of time after inoculation with λ-carrageenan. As the inflammatory response peaks after5 hours, oximetry was conducted every half hour between 1 and 5 hours post inoculation, assum-ing that there is a correlation between hypoxia and degree of inflammation. The results shownin Fig. 5 indicate that whilst there was considerable scatter between individual measurements ateach time point, there was an overall downward trend in average SO2 value as expected, with thePearson correlation coefficient r = -0.63. For this correlation, the corresponding p-value = 0.095is not low enough to be considered highly statistically significant. It may be possible that thelinear correlation we have assumed between hypoxia and time since inoculation is not a validmodel. As a number of vessels were analysed at each time point, the scatter seen in the figure
Vol. 8, No. 6 | 1 Jun 2017 | BIOMEDICAL OPTICS EXPRESS 2903

most likely reflects the natural biological variation of SO2 in distributed blood vessels. Previ-ously it has not been possible to measure the variability of SO2 between individual blood vesselsin the tendon, and it may be the case that it is an inhomogeneous environment. The technical ap-proach described here, does however provide evidence to correlate hypoxia with inflammatorydisease, and provides a tool which will enable this relationship to be investigated in more detailwith longitudinal studies in animal models of inflammatory disease [31].
Time elapsed since inoculation (mins)60 80 100 120 140 160 180 200 220 240 260 280
SO
2 (
%)
65
70
75
80
85
90
95
Fig. 5. Kinetic analysis of SO2 as a function of increasing inflammation after inoculationwith λ-carrageenan, mean ± standard error, r = -0.63, p = 0.095
4. Conclusion
We have developed and demonstrated a novel multispectral imaging system and analysis tech-nique capable of performing oximetry in the microvasculature in vivo. We have performed thefirst measurements of localised microvasculature oxygen saturation in tendon tissue, and quan-tified hypoxia associated with an acute model for inflammation. Previously, it had been shownthrough bulk measurement and histological analysis that inflamed tendon tissue is hypoxic [1,2].We have now ascertained that hypoxia is present not only in the tissue, but have also quantifiedit in the associated microvasculature.
We obtained physiologically plausible values for SO2 of healthy microcirculation, and a de-crease in SO2 associated with hypoxia, as expected. We also measured reductions in SO2 overa time course following inoculation, as the degree of inflammation increased. Additionally, amarked decrease in SO2 of blood vessels immediately post mortem indicates that the techniqueis sensitive to changes in localised SO2. However, accurate validation of the absolute valuesproduced by the algorithm remains a challenge. There was significant scatter between individ-ual measurements of blood vessels between different tendons, and indeed also between differentblood vessels of the same tendon; the standard deviation for all control measurements was 7.0 %,and 13.4 % for the inflamed measurements. As we have studied the smallest vessels of the mi-crovasculature, there will naturally be a spread in true oxygen saturation values across differentvessels which is likely the cause of this high standard deviation. However, it is difficult to as-sess the extent to which this spread is caused by physiological differences or in fact caused bypotential inaccuracies in the imaging and analysis process. Due to the highly localised nature ofthese measurements, no other methods exist for localised determination of SO2 in the microvas-culature, with which our results could potentially be compared. Options for in vitro validation
Vol. 8, No. 6 | 1 Jun 2017 | BIOMEDICAL OPTICS EXPRESS 2904
exist, using phantoms that mimic blood vessels in tendon tissue; in vitro blood can be accuratelydeoxygenated using sodium dithionite [32]. However, this introduces problems such as increas-ing the osmolarity of blood, which has been shown to affect its optical properties [33]. Sucha method of validation is hence questionable, as the extinction and reduced scatter coefficientsemployed in our model would not be correct in this case. Further work is required for accuratevalidation and assessment of the accuracy of the oximetry algorithm.
This is an invasive technique, with surgical removal of the skin necessary in order to achieveoptical access to the tendon. Future work will pursue the incorporation of a minimally-invasivemicroendoscope, using a similar illumination scheme and analysis technique as presented inthis paper. The microendoscope will act as an optical relay from the vasculature within thetendon to the focal plane of the microscope described here. Initial tests with this probe setupex vivo indicate that the vasculature remains detectable through tissue at a working distance of100 µm, however challenges remain in order to ensure oximetry measurements are not adverselyaffected by potential contact pressure. Minimally-invasive oximetry will circumvent the needfor invasive surgery, and allow for the longitudinal study of SO2 in more realistic models ofRA, looking at the same mouse and vasculature over the course of several weeks. It will thenbe possible to determine whether correlates exist between hypoxia and conventional disease-scoring approaches. It is hoped that a greater understanding of the role that hypoxia plays indisease progression and inflammation will be gained, with the availability of localised SO2
information previously inaccessible using bulk oximetry probes. Looking forward, with suchminimally-invasive localised oximetry techniques now in development, it may be possible toperform localised measurement of SO2 of deep tissue in humans - using hypoxia as a proxybiomarker for a range of inflammatory diseases.
Funding
Lord Kelvin Adam Smith Scholarship (LKAS), University of Glasgow.
Vol. 8, No. 6 | 1 Jun 2017 | BIOMEDICAL OPTICS EXPRESS 2905