Embed Size (px)
Citation preview
Multiscale Gene Networks Remodeling in
Alzheimer’s Disease
Bin Zhang, PhD
Department of Genetics & Genomic Sciences
Icahn Institute of Genomics and Multiscale Biology
Icahn School of Medicine at Mount Sinai, New York, USA
Email: [email protected]
Web: http://research.mssm.edu/multiscalenetwork
2013 Network Analysis Course, UCLA, 7/18/2013
Lecture III
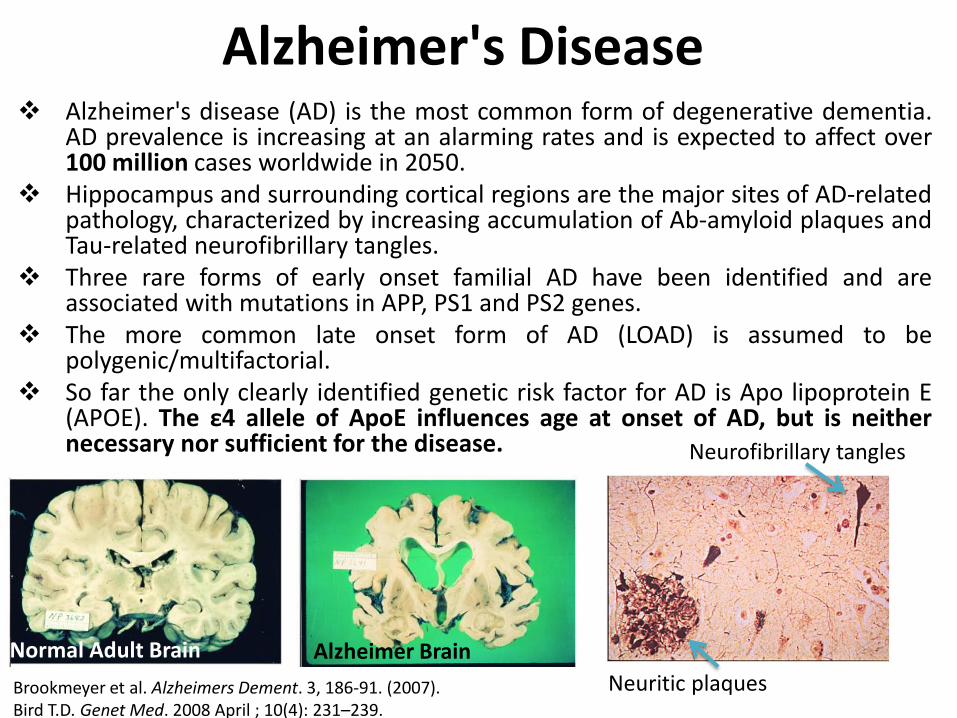
Alzheimer's Disease Alzheimer's disease (AD) is the most common form of degenerative dementia.
AD prevalence is increasing at an alarming rates and is expected to affect over 100 million cases worldwide in 2050.
Hippocampus and surrounding cortical regions are the major sites of AD-related pathology, characterized by increasing accumulation of Ab-amyloid plaques and Tau-related neurofibrillary tangles.
Three rare forms of early onset familial AD have been identified and are associated with mutations in APP, PS1 and PS2 genes.
The more common late onset form of AD (LOAD) is assumed to be polygenic/multifactorial.
So far the only clearly identified genetic risk factor for AD is Apo lipoprotein E (APOE). The ε4 allele of ApoE influences age at onset of AD, but is neither necessary nor sufficient for the disease.
Brookmeyer et al. Alzheimers Dement. 3, 186-91. (2007). Bird T.D. Genet Med. 2008 April ; 10(4): 231–239.
Neuritic plaques
Neurofibrillary tangles
Normal Adult Brain Alzheimer Brain
……………………….
……………………….

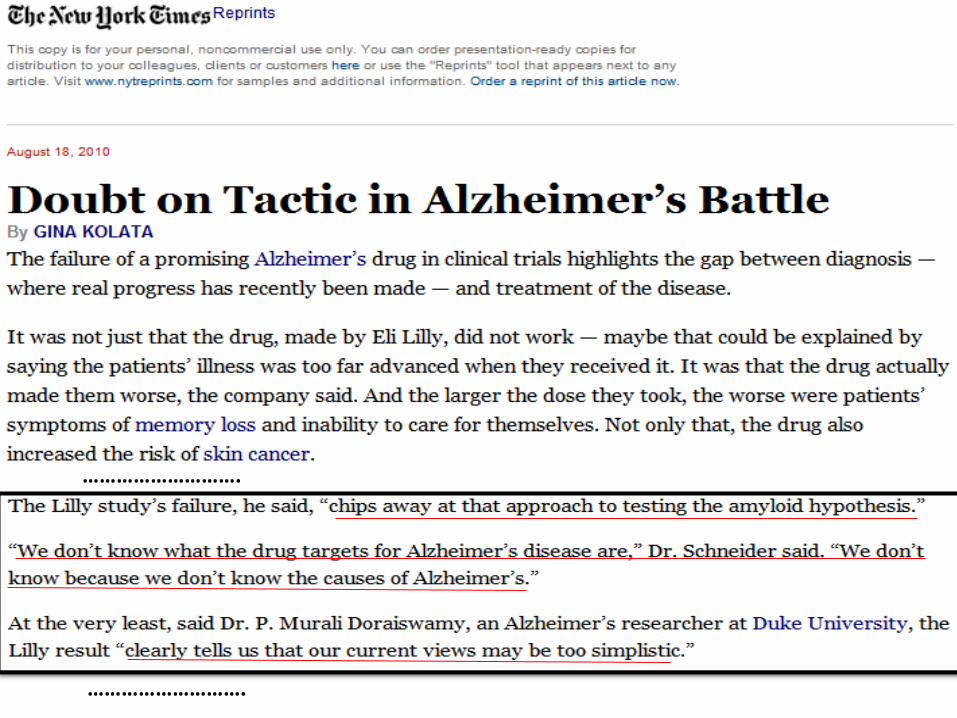
More AD Drugs Failed !!??
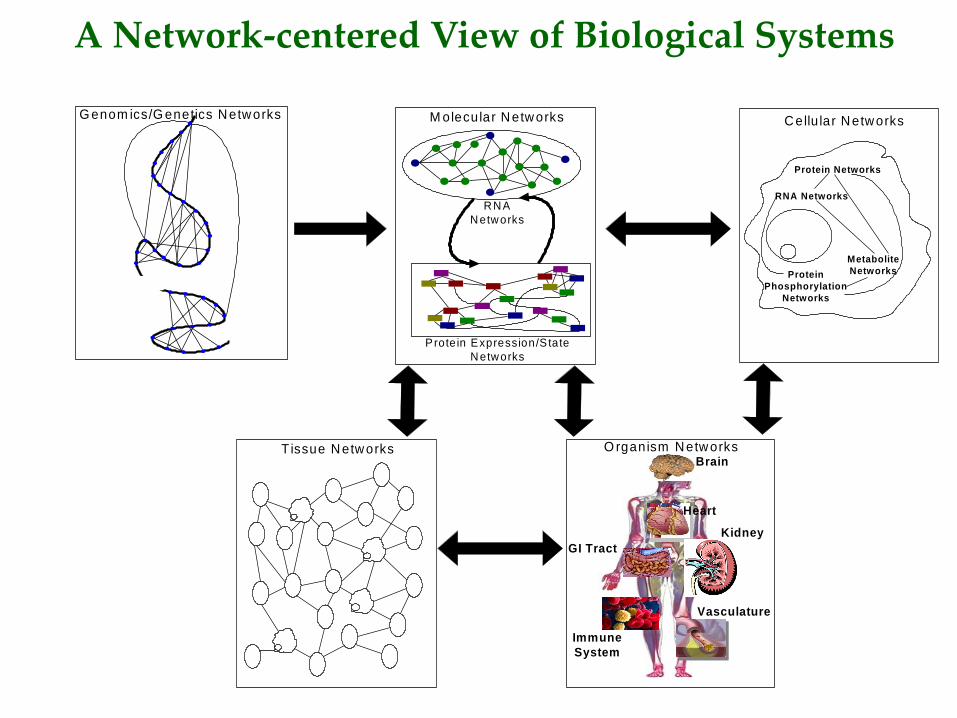
A Network-centered View of Biological Systems
M olecular N etw orks
Prote in Expression/S tate
Networks
R N A
Networks
Protein Networks
Protein
Phosphorylation
Networks
RNA Networks
Metabolite
Networks
Brain
Heart
GI Tract
Immune
System
Vasculature
Kidney
Tissue N etw orks O rganism N etw orks
C ellu lar N etw orksG enom ics/G enetics N etw orks
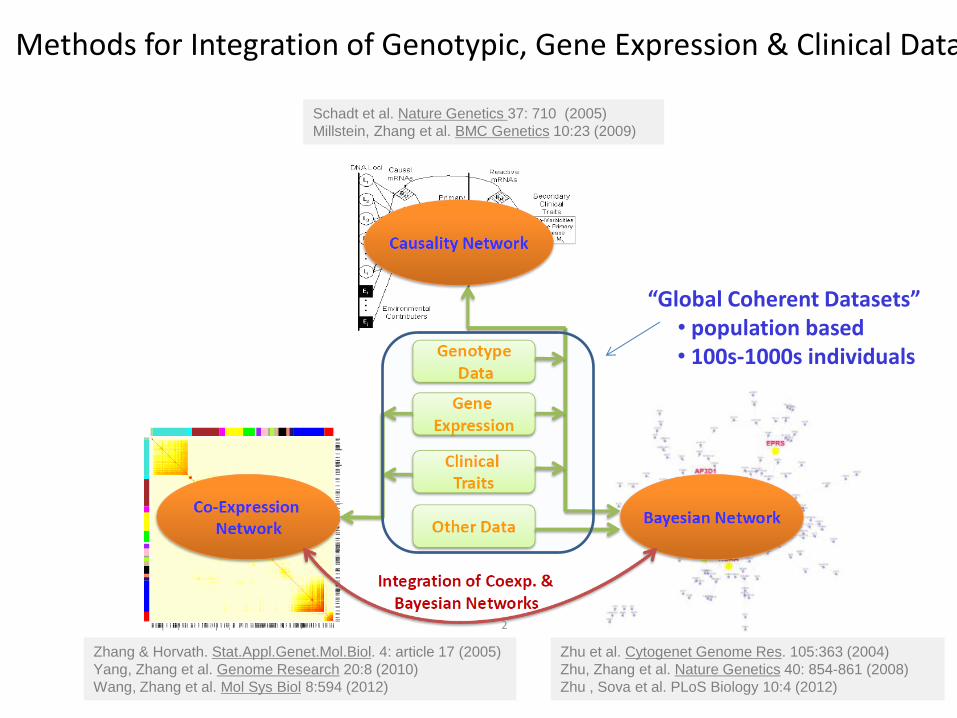
Methods for Integration of Genotypic, Gene Expression & Clinical Data
Schadt et al. Nature Genetics 37: 710 (2005)
Millstein, Zhang et al. BMC Genetics 10:23 (2009)
Zhang & Horvath. Stat.Appl.Genet.Mol.Biol. 4: article 17 (2005)
Yang, Zhang et al. Genome Research 20:8 (2010)
Wang, Zhang et al. Mol Sys Biol 8:594 (2012)
Zhu et al. Cytogenet Genome Res. 105:363 (2004)
Zhu, Zhang et al. Nature Genetics 40: 854-861 (2008)
Zhu , Sova et al. PLoS Biology 10:4 (2012)
“Global Coherent Datasets” • population based • 100s-1000s individuals
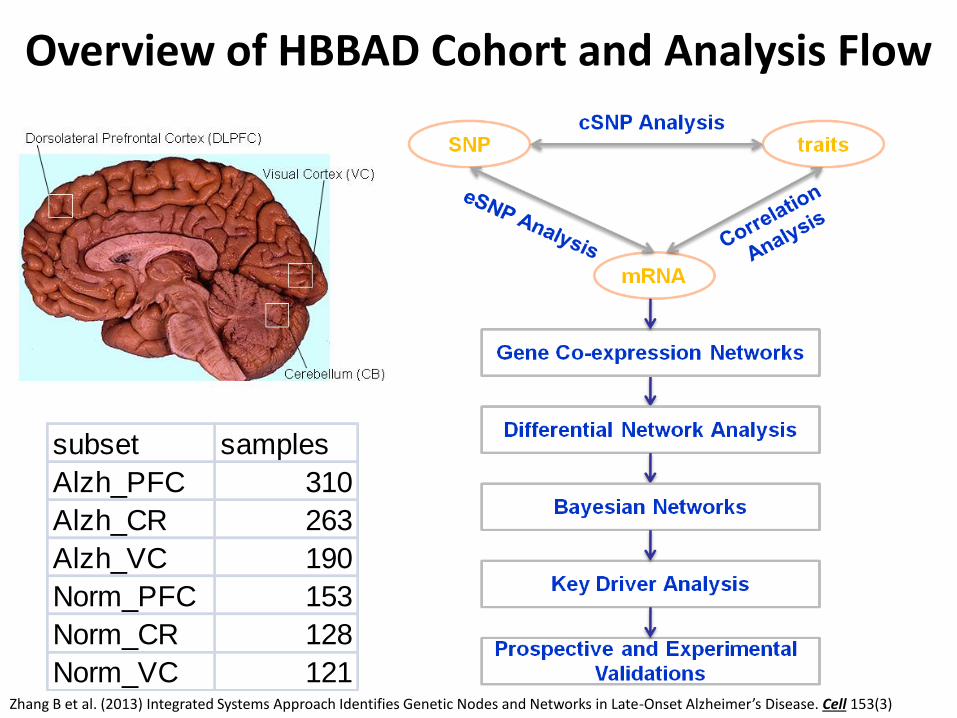
Overview of HBBAD Cohort and Analysis Flow
subset samples
Alzh_PFC 310
Alzh_CR 263
Alzh_VC 190
Norm_PFC 153
Norm_CR 128
Norm_VC 121Zhang B et al. (2013) Integrated Systems Approach Identifies Genetic Nodes and Networks in Late-Onset Alzheimer’s Disease. Cell 153(3)
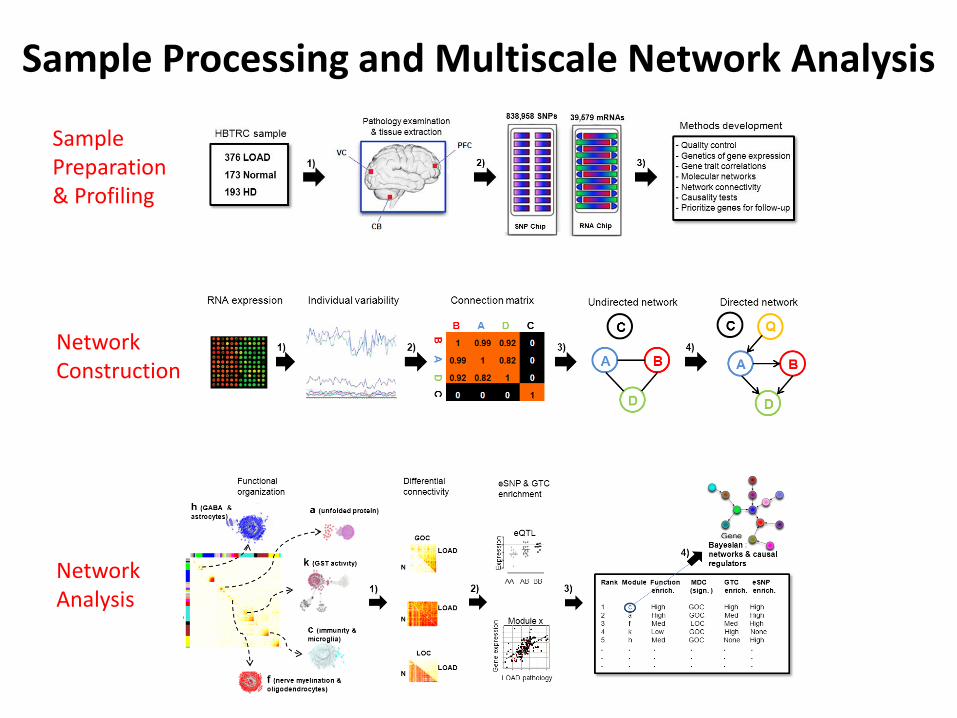
Sample Processing and Multiscale Network Analysis
Sample Preparation & Profiling
Network Construction
Network Analysis
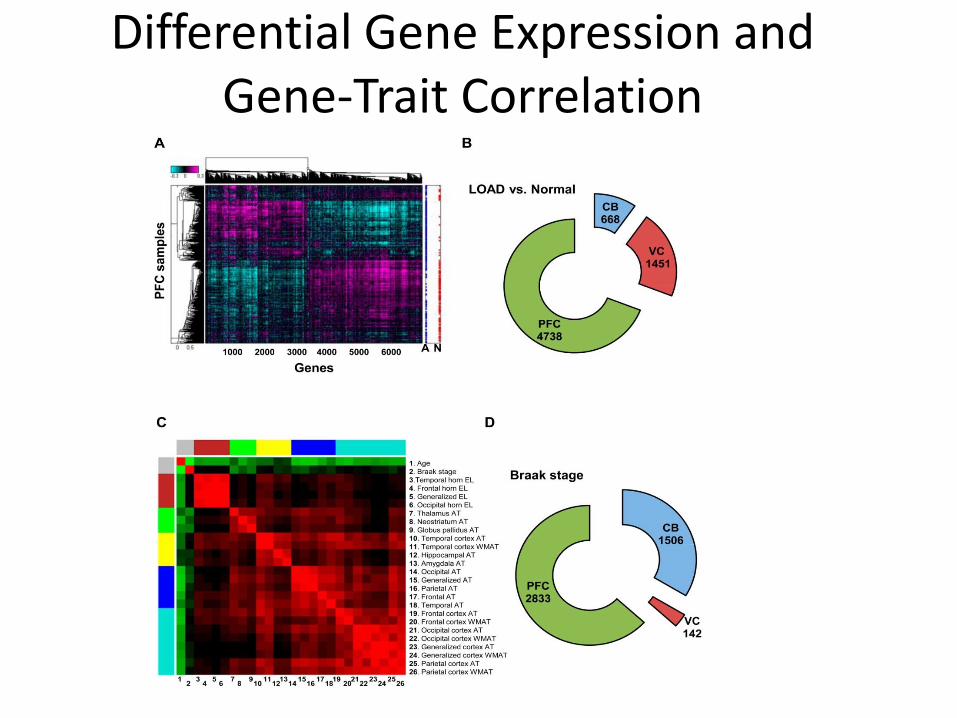
Differential Gene Expression and Gene-Trait Correlation
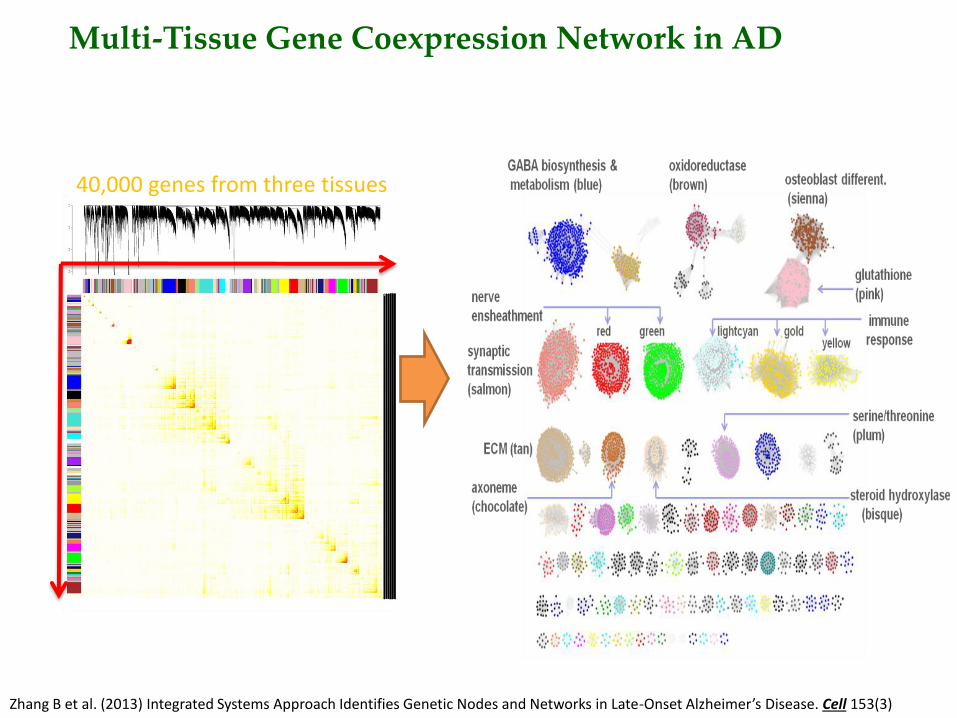
Multi-Tissue Gene Coexpression Network in AD
40,000 genes from three tissues
Zhang B et al. (2013) Integrated Systems Approach Identifies Genetic Nodes and Networks in Late-Onset Alzheimer’s Disease. Cell 153(3)
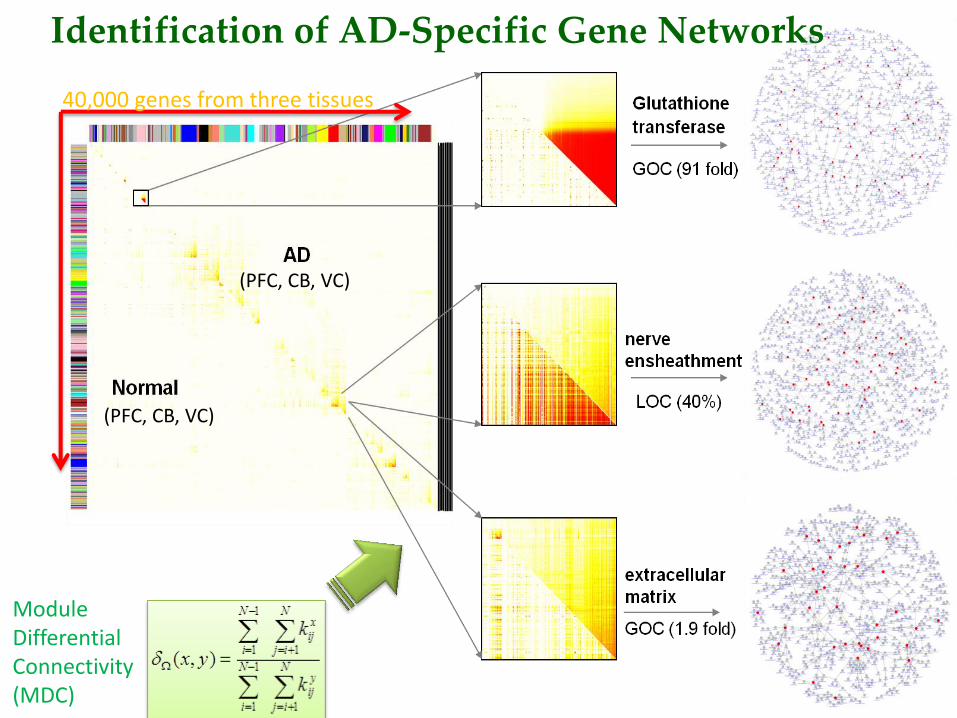
Identification of AD-Specific Gene Networks
40,000 genes from three tissues
(PFC, CB, VC)
(PFC, CB, VC)
Module Differential Connectivity (MDC)
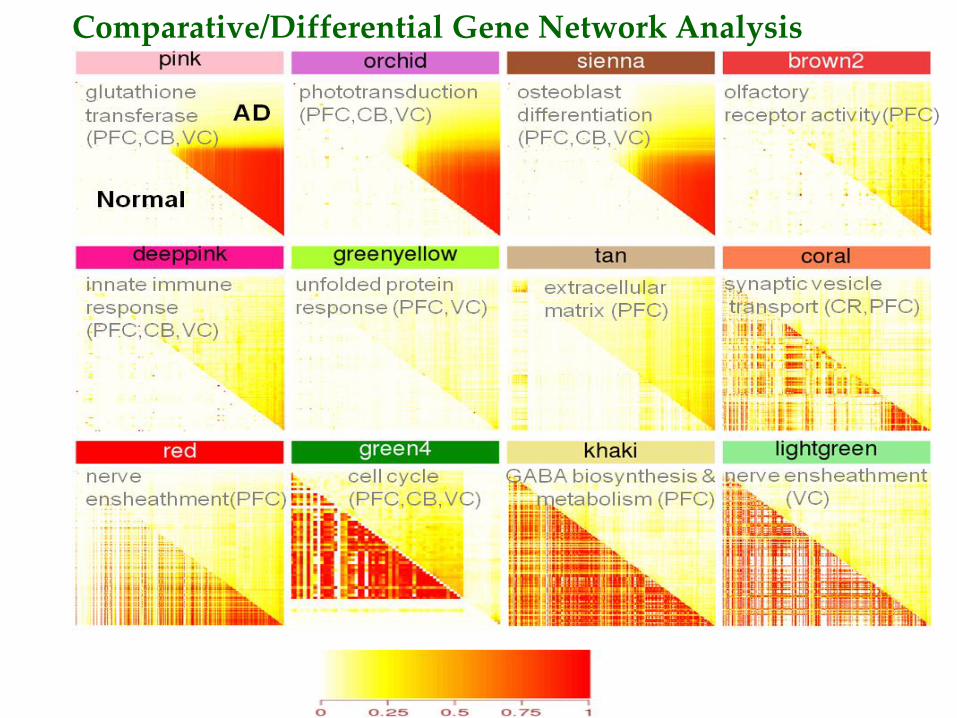
Comparative/Differential Gene Network Analysis
Functional Verification of the Modules Associated with AD
• The postsynaptic density proteome in the human neo-cortex of 748 proteins over-represented with risk loci known to underlie cognitive, affective and motor phenotypes are highly enriched in the synaptic transmission AD modules including the purple (2 fold enrichment, P = 1.4e-16) and salmon (2.5 fold enrichment, P = 5.7e-09)
• The macrophage-enriched metabolic network or MEMN, is remarkably enriched in all the immune modules of all three tissues, the yellow module in DLPFC (3.3 fold enrichment, P = 3.3e-98), the gold module in CB (7.8 fold enrichment, P = 2.5e-122) and the light cyan module in VC (7.3 fold enrichment, P = 3.5e-153)
• The mouse KO genes from the JAX database showing neurodegenerative related phenotypes, are enriched in two modules with LOC , khaki (4.1 fold, P = 7.2e-05) and blue (1.9 fold, P = 8e-04), enriched for the GABA biosynthesis pathway.
• The khaki module is significantly enriched for the 44 most strongly associated genes (6.6 fold, P=3.5e-3) listed in the AlzGene database (www.alzgene.org)
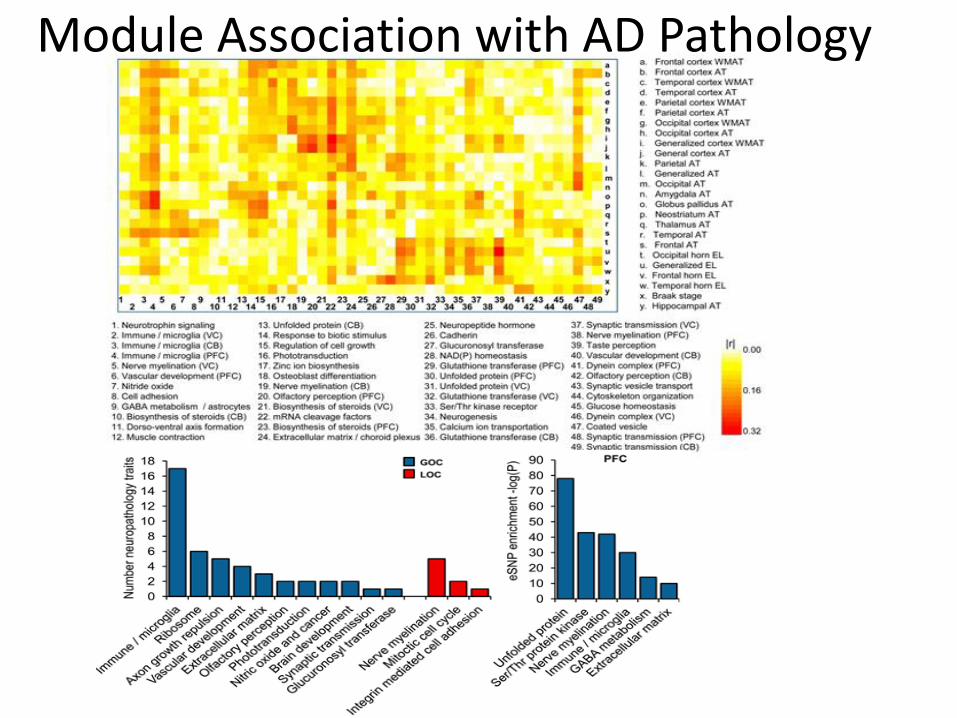
Module Association with AD Pathology
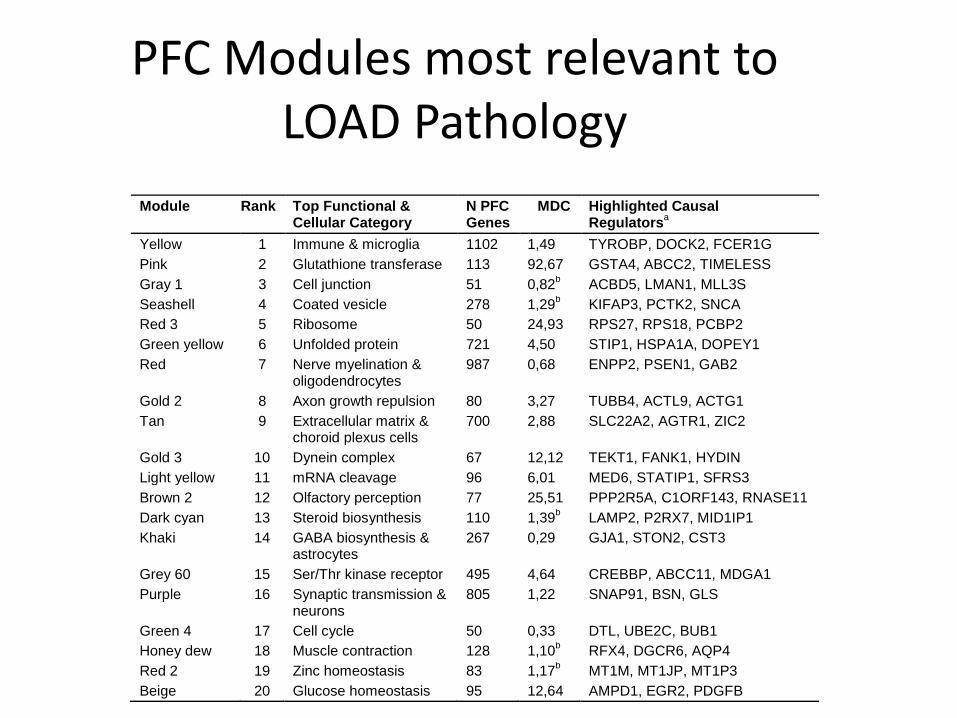
PFC Modules most relevant to LOAD Pathology
Module Rank Top Functional & Cellular Category
N PFC Genes
MDC Highlighted Causal Regulators
a
Yellow 1 Immune & microglia 1102 1,49 TYROBP, DOCK2, FCER1G
Pink 2 Glutathione transferase 113 92,67 GSTA4, ABCC2, TIMELESS
Gray 1 3 Cell junction 51 0,82b ACBD5, LMAN1, MLL3S
Seashell 4 Coated vesicle 278 1,29b KIFAP3, PCTK2, SNCA
Red 3 5 Ribosome 50 24,93 RPS27, RPS18, PCBP2
Green yellow 6 Unfolded protein 721 4,50 STIP1, HSPA1A, DOPEY1
Red 7 Nerve myelination & oligodendrocytes
987 0,68 ENPP2, PSEN1, GAB2
Gold 2 8 Axon growth repulsion 80 3,27 TUBB4, ACTL9, ACTG1
Tan 9 Extracellular matrix & choroid plexus cells
700 2,88 SLC22A2, AGTR1, ZIC2
Gold 3 10 Dynein complex 67 12,12 TEKT1, FANK1, HYDIN
Light yellow 11 mRNA cleavage 96 6,01 MED6, STATIP1, SFRS3
Brown 2 12 Olfactory perception 77 25,51 PPP2R5A, C1ORF143, RNASE11
Dark cyan 13 Steroid biosynthesis 110 1,39b LAMP2, P2RX7, MID1IP1
Khaki 14 GABA biosynthesis & astrocytes
267 0,29 GJA1, STON2, CST3
Grey 60 15 Ser/Thr kinase receptor 495 4,64 CREBBP, ABCC11, MDGA1
Purple 16 Synaptic transmission & neurons
805 1,22 SNAP91, BSN, GLS
Green 4 17 Cell cycle 50 0,33 DTL, UBE2C, BUB1
Honey dew 18 Muscle contraction 128 1,10b RFX4, DGCR6, AQP4
Red 2 19 Zinc homeostasis 83 1,17b MT1M, MT1JP, MT1P3
Beige 20 Glucose homeostasis 95 12,64 AMPD1, EGR2, PDGFB
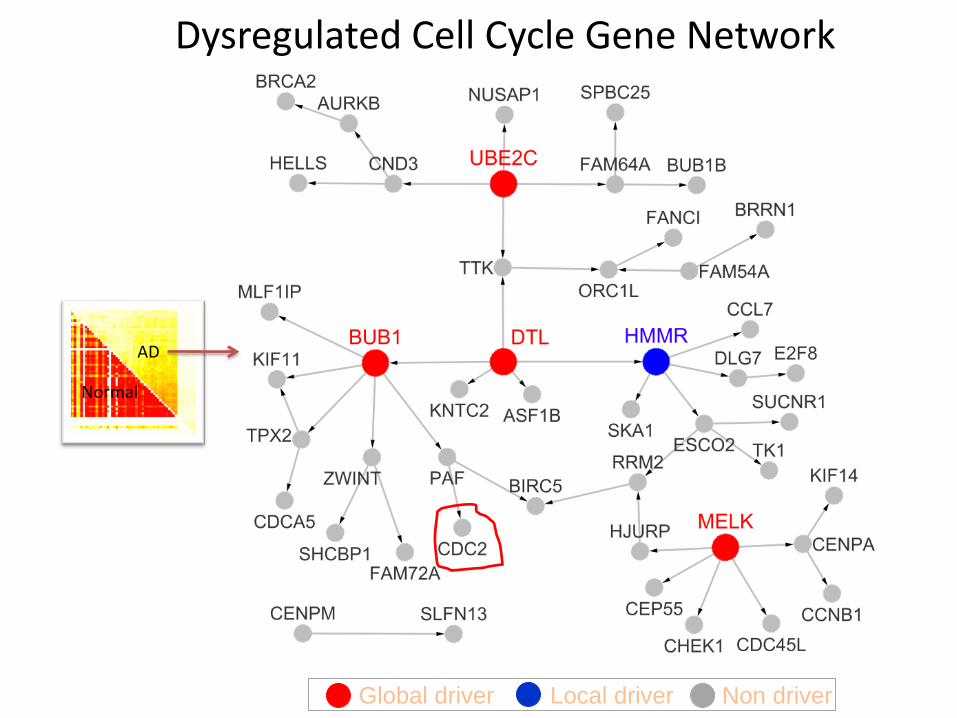
Dysregulated Cell Cycle Gene Network
Global driver Local driver Non driver
AD
Normal
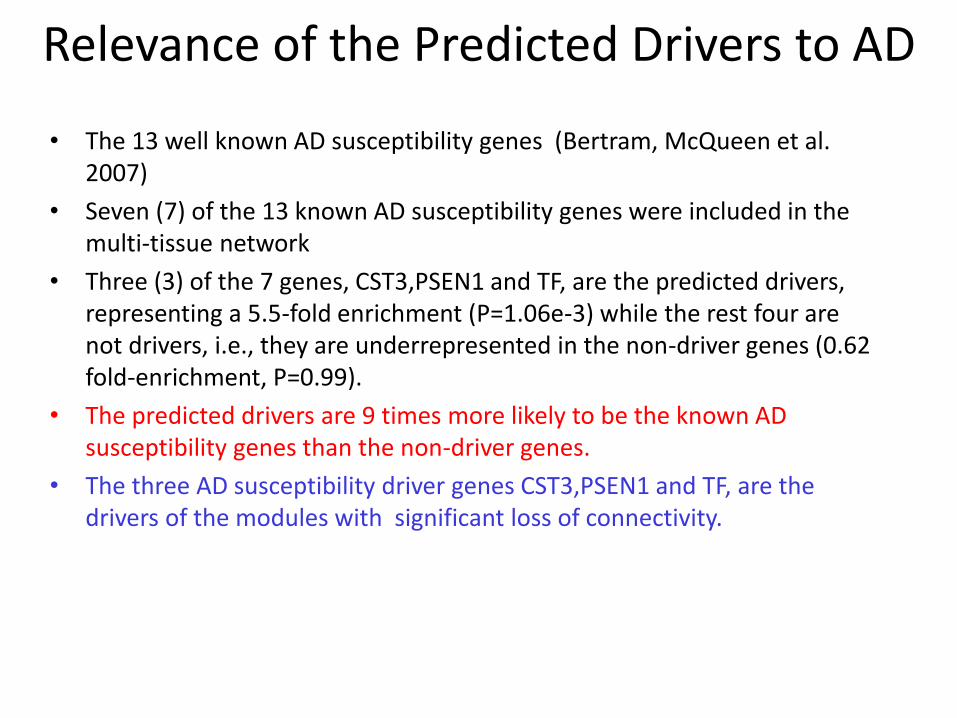
Relevance of the Predicted Drivers to AD
• The 13 well known AD susceptibility genes (Bertram, McQueen et al. 2007)
• Seven (7) of the 13 known AD susceptibility genes were included in the multi-tissue network
• Three (3) of the 7 genes, CST3,PSEN1 and TF, are the predicted drivers, representing a 5.5-fold enrichment (P=1.06e-3) while the rest four are not drivers, i.e., they are underrepresented in the non-driver genes (0.62 fold-enrichment, P=0.99).
• The predicted drivers are 9 times more likely to be the known AD susceptibility genes than the non-driver genes.
• The three AD susceptibility driver genes CST3,PSEN1 and TF, are the drivers of the modules with significant loss of connectivity.
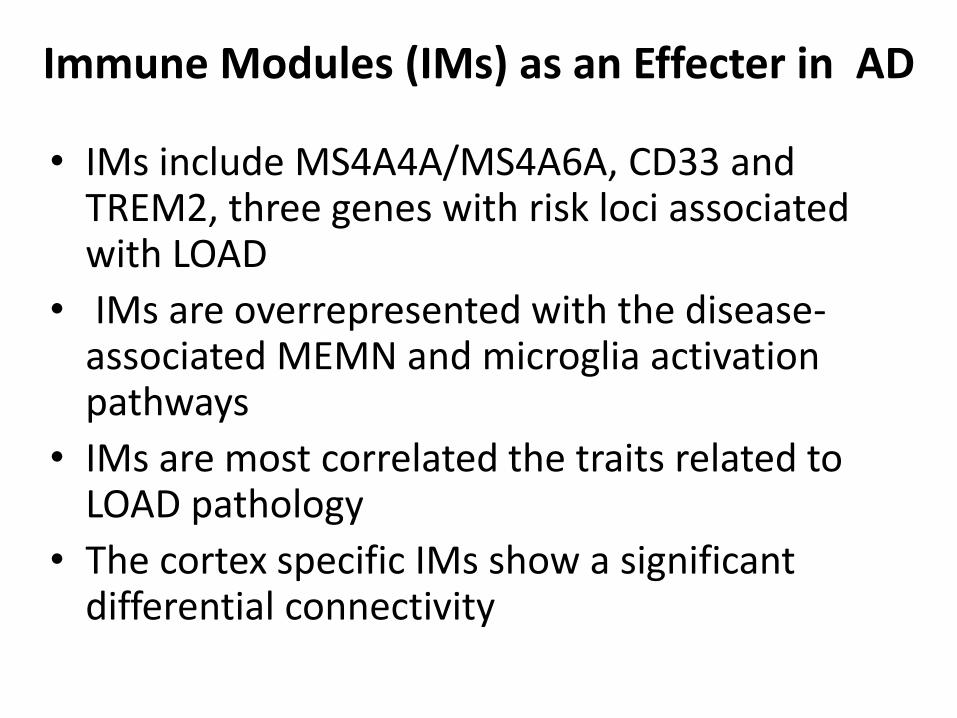
Immune Modules (IMs) as an Effecter in AD
• IMs include MS4A4A/MS4A6A, CD33 and TREM2, three genes with risk loci associated with LOAD
• IMs are overrepresented with the disease-associated MEMN and microglia activation pathways
• IMs are most correlated the traits related to LOAD pathology
• The cortex specific IMs show a significant differential connectivity
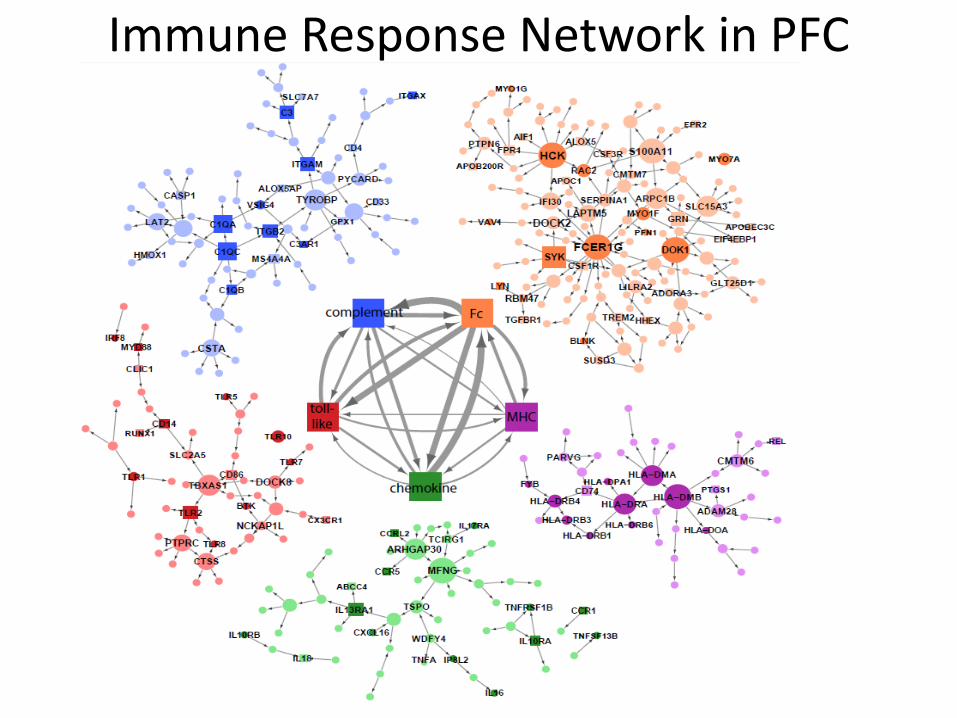
Immune Response Network in PFC
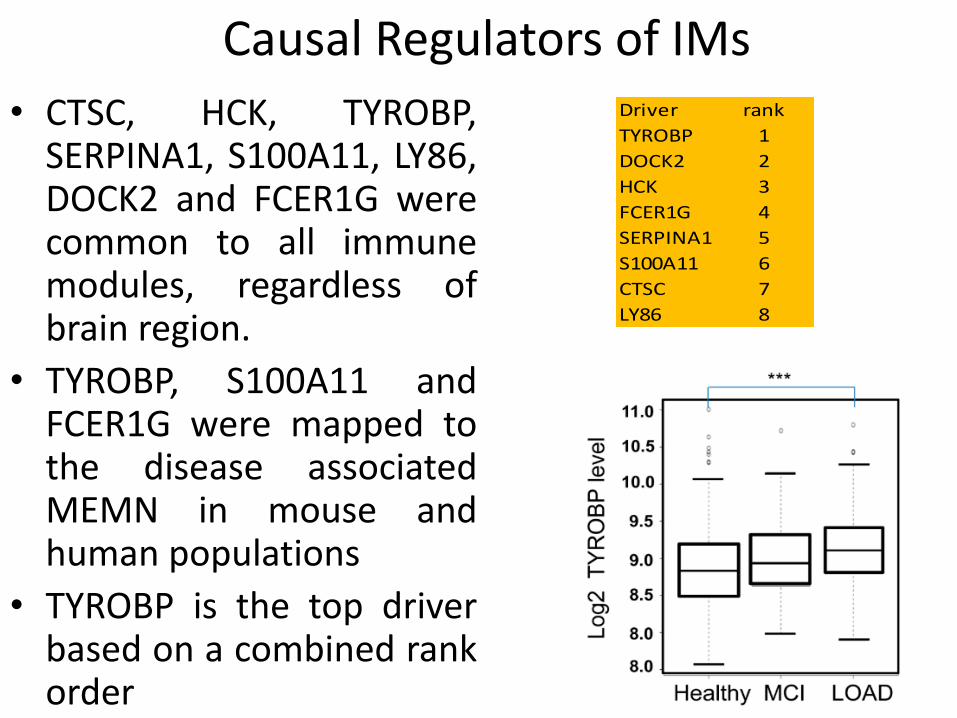
Causal Regulators of IMs
• CTSC, HCK, TYROBP, SERPINA1, S100A11, LY86, DOCK2 and FCER1G were common to all immune modules, regardless of brain region.
• TYROBP, S100A11 and FCER1G were mapped to the disease associated MEMN in mouse and human populations
• TYROBP is the top driver based on a combined rank order
Driver rank
TYROBP 1
DOCK2 2
HCK 3
FCER1G 4
SERPINA1 5
S100A11 6
CTSC 7
LY86 8
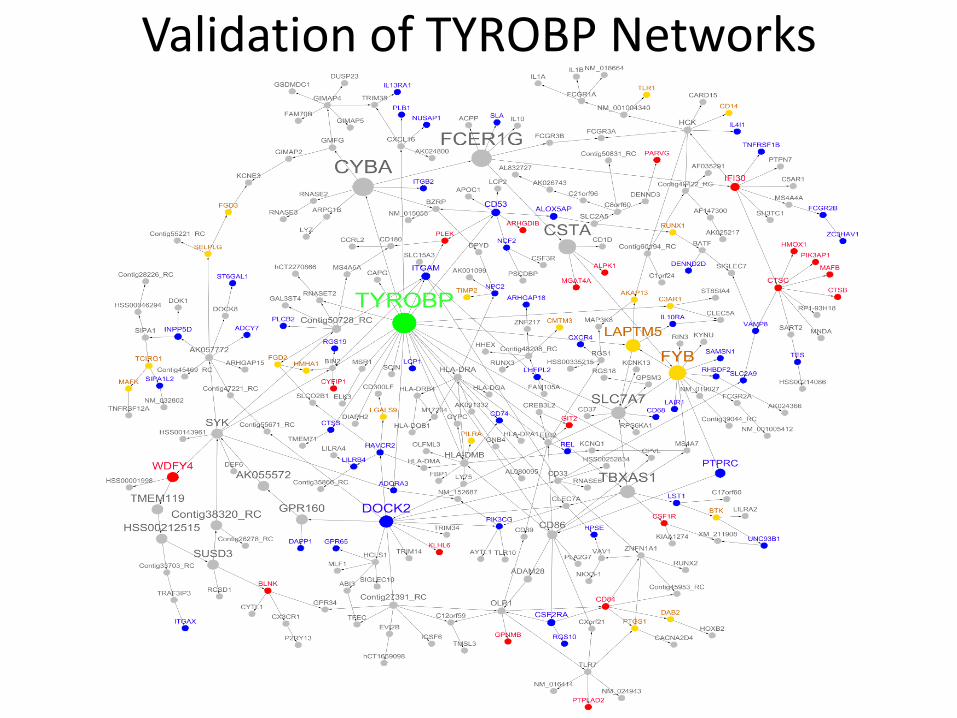
Validation of TYROBP Networks
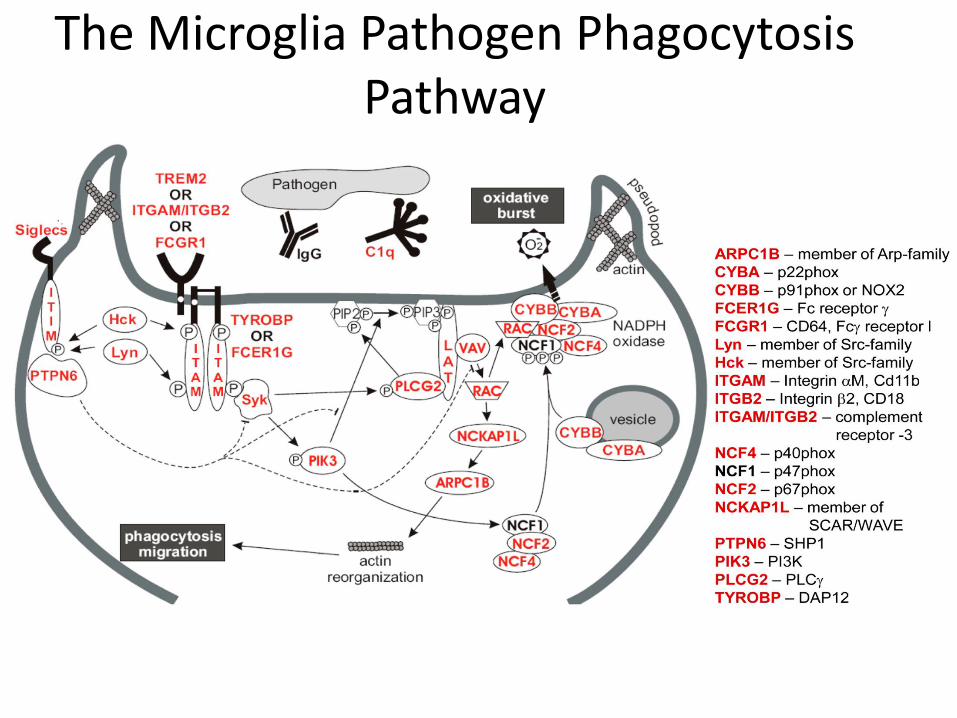
The Microglia Pathogen Phagocytosis Pathway
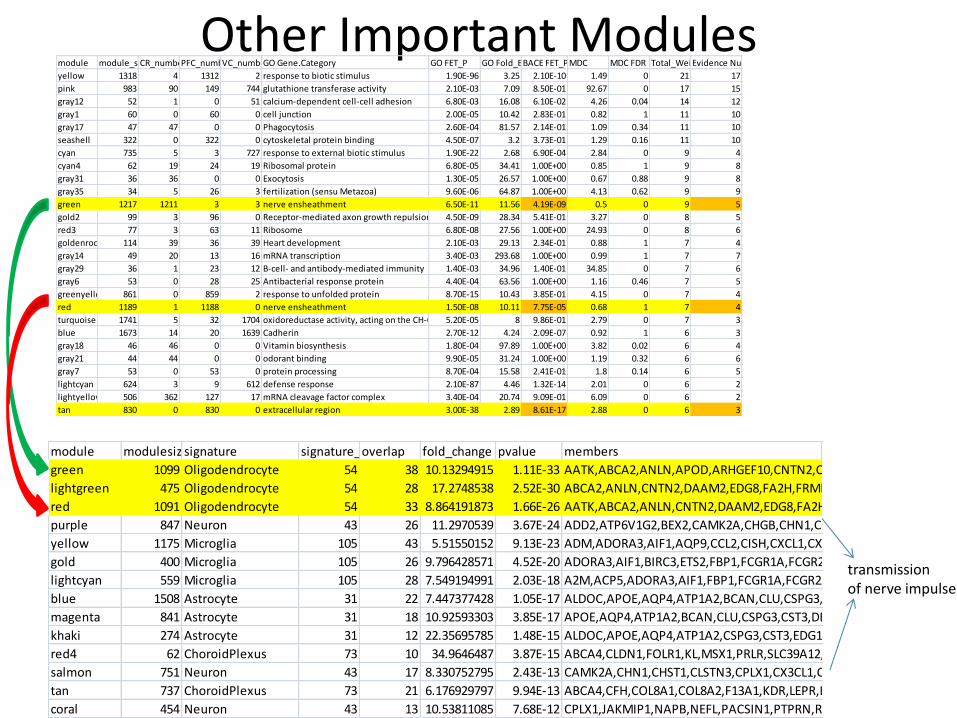
Other Important Modules
module modulesizesignature signature_sizeoverlap fold_change pvalue members
green 1099 Oligodendrocyte 54 38 10.13294915 1.11E-33 AATK,ABCA2,ANLN,APOD,ARHGEF10,CNTN2,CRYAB,CSRP1,DAAM2,EDG8,FA2H,FRMD4B,GJB1,GLTP,GPR37,GSN,LASS2,MAG,MAL,MBP,MOBP,MOG,NDRG1,NPC1,OLIG1,OLIG2,OMG,PACS2,PCYT2,PLEKHB1,QDPR,RNF13,SEPP1,SGK,SOX10,TMEM63A,TTYH2,UGT8
lightgreen 475 Oligodendrocyte 54 28 17.2748538 2.52E-30 ABCA2,ANLN,CNTN2,DAAM2,EDG8,FA2H,FRMD4B,GJB1,GLTP,GPR37,GSN,MAG,MAL,MBP,MOBP,MOG,MTRR,NDRG1,NPC1,OLIG2,OMG,QDPR,RNF13,SEPP1,SOX10,TMEM63A,TTYH2,UGT8
red 1091 Oligodendrocyte 54 33 8.864191873 1.66E-26 AATK,ABCA2,ANLN,CNTN2,DAAM2,EDG8,FA2H,FRMD4B,GJB1,GLTP,GPR37,MAG,MAL,MBP,MOBP,MOG,MTRR,NDRG1,NPC1,NRBP2,OLIG1,OLIG2,OMG,PLEKHB1,PLEKHG3,QDPR,RNF13,SEPP1,SOX10,TMEM10,TMEM63A,TTYH2,UGT8
purple 847 Neuron 43 26 11.2970539 3.67E-24 ADD2,ATP6V1G2,BEX2,CAMK2A,CHGB,CHN1,CHST1,CLSTN3,CPLX1,CYFIP2,GAP43,GRIA2,JAKMIP1,MAP2K1,MYO5A,NAPB,NEFL,PACSIN1,PRKAR1B,PTPRN,REPS2,RYR2,SH3GL2,SNAP25,SYNGR3,YWHAG
yellow 1175 Microglia 105 43 5.51550152 9.13E-23 ADM,ADORA3,AIF1,AQP9,CCL2,CISH,CXCL1,CXCL2,DUSP5,EMP1,FABP5,FBP1,FCGR1A,FCGR2A,FYB,HHEX,HLA-DMA,HLA-DMB,IER3,IL1B,IMPA2,INPP5D,ISG20,ITGB2,LIMK2,LMO2,LY86,MNDA,MPZL1,MS4A6A,NP,OSM,PDPN,PECAM1,PLAUR,PPARG,PTGS2,RGS1,SOCS3,SOD2,TNFAIP3,TREM2,VDR
gold 400 Microglia 105 26 9.796428571 4.52E-20 ADORA3,AIF1,BIRC3,ETS2,FBP1,FCGR1A,FCGR2A,FYB,HHEX,HLA-DMA,HLA-DMB,IER3,IL1A,IL1B,IMPA2,INPP5D,ITGB2,LMO2,LY86,MNDA,MS4A6A,OLR1,PTGS2,RGS1,TFPI2,TREM2
lightcyan 559 Microglia 105 28 7.549194991 2.03E-18 A2M,ACP5,ADORA3,AIF1,FBP1,FCGR1A,FCGR2A,FGL2,FYB,HHEX,HLA-DMA,HLA-DMB,IER3,IL1A,IL1RN,INPP5D,ITGB2,LY86,MAF,MNDA,MS4A6A,OLR1,OSM,PPARG,PROCR,RGS1,TNFAIP3,TREM2
blue 1508 Astrocyte 31 22 7.447377428 1.05E-17 ALDOC,APOE,AQP4,ATP1A2,BCAN,CLU,CSPG3,CST3,DBI,EDG1,EMX2,GFAP,GJA1,GLDC,GLUL,ID3,ITGB5,MAGI1,MFGE8,PPAP2B,PRDX6,SPARCL1
magenta 841 Astrocyte 31 18 10.92593303 3.85E-17 APOE,AQP4,ATP1A2,BCAN,CLU,CSPG3,CST3,DBI,EDG1,EMX2,GFAP,GJA1,GLDC,GLUL,ITGB5,PPAP2B,PRDX6,SPARCL1
khaki 274 Astrocyte 31 12 22.35695785 1.48E-15 ALDOC,APOE,AQP4,ATP1A2,CSPG3,CST3,EDG1,EMX2,GJA1,PPAP2B,PRDX6,SPARCL1
red4 62 ChoroidPlexus 73 10 34.9646487 3.87E-15 ABCA4,CLDN1,FOLR1,KL,MSX1,PRLR,SLC39A12,SOSTDC1,TRPV4,TTR
salmon 751 Neuron 43 17 8.330752795 2.43E-13 CAMK2A,CHN1,CHST1,CLSTN3,CPLX1,CX3CL1,CYFIP2,GRIA3,KIFC2,MYO5A,NAPB,PACSIN1,PRKAR1B,PTPRN,RYR2,SNAP25,SYNGR3
tan 737 ChoroidPlexus 73 21 6.176929797 9.94E-13 ABCA4,CFH,COL8A1,COL8A2,F13A1,KDR,LEPR,LUM,MSX1,MXRA8,NID2,PCOLCE,PERP,PLTP,PRLR,SPINT2,STRA6,SULF1,SYNE2,TCN2,TTR
coral 454 Neuron 43 13 10.53811085 7.68E-12 CPLX1,JAKMIP1,NAPB,NEFL,PACSIN1,PTPRN,RTN1,SH3GL2,SNAP25,SYNGR3,SYT1,UCHL1,YWHAG
module module_sizeCR_numberPFC_numberVC_numberGO Gene.Category GO FET_P GO Fold_EnrichmentBACE FET_PMDC MDC FDR Total_WeightEvidence Number_Of_Traits_Correlated
yellow 1318 4 1312 2 response to biotic stimulus 1.90E-96 3.25 2.10E-10 1.49 0 21 17
pink 983 90 149 744 glutathione transferase activity 2.10E-03 7.09 8.50E-01 92.67 0 17 15
gray12 52 1 0 51 calcium-dependent cell-cell adhesion 6.80E-03 16.08 6.10E-02 4.26 0.04 14 12
gray1 60 0 60 0 cell junction 2.00E-05 10.42 2.83E-01 0.82 1 11 10
gray17 47 47 0 0 Phagocytosis 2.60E-04 81.57 2.14E-01 1.09 0.34 11 10
seashell 322 0 322 0 cytoskeletal protein binding 4.50E-07 3.2 3.73E-01 1.29 0.16 11 10
cyan 735 5 3 727 response to external biotic stimulus 1.90E-22 2.68 6.90E-04 2.84 0 9 4
cyan4 62 19 24 19 Ribosomal protein 6.80E-05 34.41 1.00E+00 0.85 1 9 8
gray31 36 36 0 0 Exocytosis 1.30E-05 26.57 1.00E+00 0.67 0.88 9 8
gray35 34 5 26 3 fertilization (sensu Metazoa) 9.60E-06 64.87 1.00E+00 4.13 0.62 9 9
green 1217 1211 3 3 nerve ensheathment 6.50E-11 11.56 4.19E-09 0.5 0 9 5
gold2 99 3 96 0 Receptor-mediated axon growth repulsion 4.50E-09 28.34 5.41E-01 3.27 0 8 5
red3 77 3 63 11 Ribosome 6.80E-08 27.56 1.00E+00 24.93 0 8 6
goldenrod 114 39 36 39 Heart development 2.10E-03 29.13 2.34E-01 0.88 1 7 4
gray14 49 20 13 16 mRNA transcription 3.40E-03 293.68 1.00E+00 0.99 1 7 7
gray29 36 1 23 12 B-cell- and antibody-mediated immunity 1.40E-03 34.96 1.40E-01 34.85 0 7 6
gray6 53 0 28 25 Antibacterial response protein 4.40E-04 63.56 1.00E+00 1.16 0.46 7 5
greenyellow 861 0 859 2 response to unfolded protein 8.70E-15 10.43 3.85E-01 4.15 0 7 4
red 1189 1 1188 0 nerve ensheathment 1.50E-08 10.11 7.75E-05 0.68 1 7 4
turquoise 1741 5 32 1704 oxidoreductase activity, acting on the CH-CH group of donors, NAD or NADP as acceptor5.20E-05 8 9.86E-01 2.79 0 7 3
blue 1673 14 20 1639 Cadherin 2.70E-12 4.24 2.09E-07 0.92 1 6 3
gray18 46 46 0 0 Vitamin biosynthesis 1.80E-04 97.89 1.00E+00 3.82 0.02 6 4
gray21 44 44 0 0 odorant binding 9.90E-05 31.24 1.00E+00 1.19 0.32 6 6
gray7 53 0 53 0 protein processing 8.70E-04 15.58 2.41E-01 1.8 0.14 6 5
lightcyan 624 3 9 612 defense response 2.10E-87 4.46 1.32E-14 2.01 0 6 2
lightyellow 506 362 127 17 mRNA cleavage factor complex 3.40E-04 20.74 9.09E-01 6.09 0 6 2
tan 830 0 830 0 extracellular region 3.00E-38 2.89 8.61E-17 2.88 0 6 3
transmission of nerve impulse
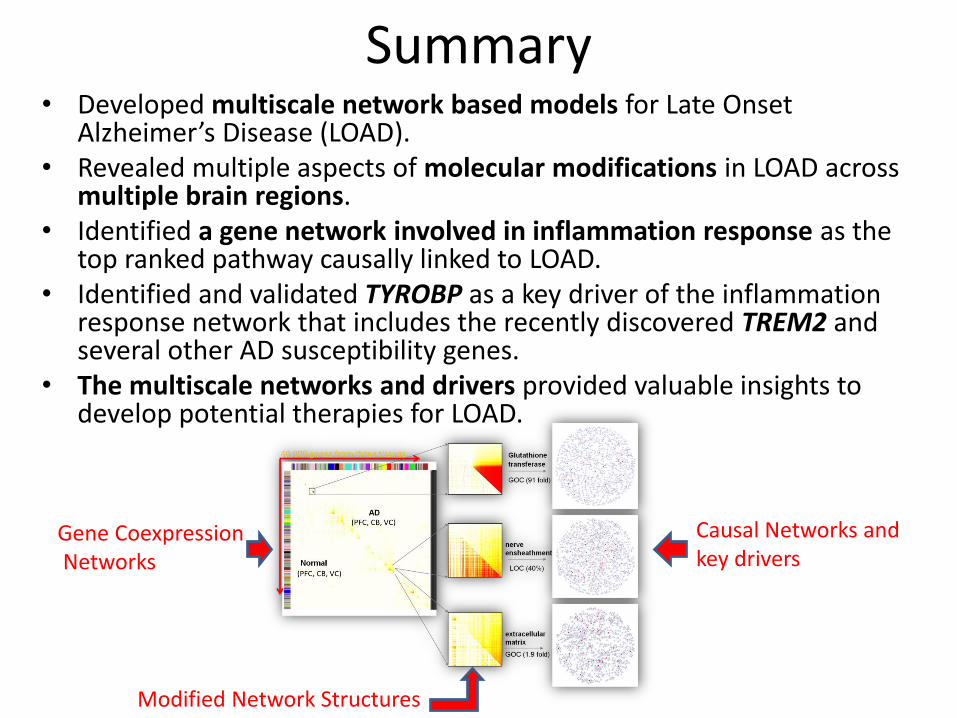
Summary • Developed multiscale network based models for Late Onset
Alzheimer’s Disease (LOAD). • Revealed multiple aspects of molecular modifications in LOAD across
multiple brain regions. • Identified a gene network involved in inflammation response as the
top ranked pathway causally linked to LOAD. • Identified and validated TYROBP as a key driver of the inflammation
response network that includes the recently discovered TREM2 and several other AD susceptibility genes.
• The multiscale networks and drivers provided valuable insights to develop potential therapies for LOAD.
Gene Coexpression Networks
Causal Networks and key drivers
Modified Network Structures
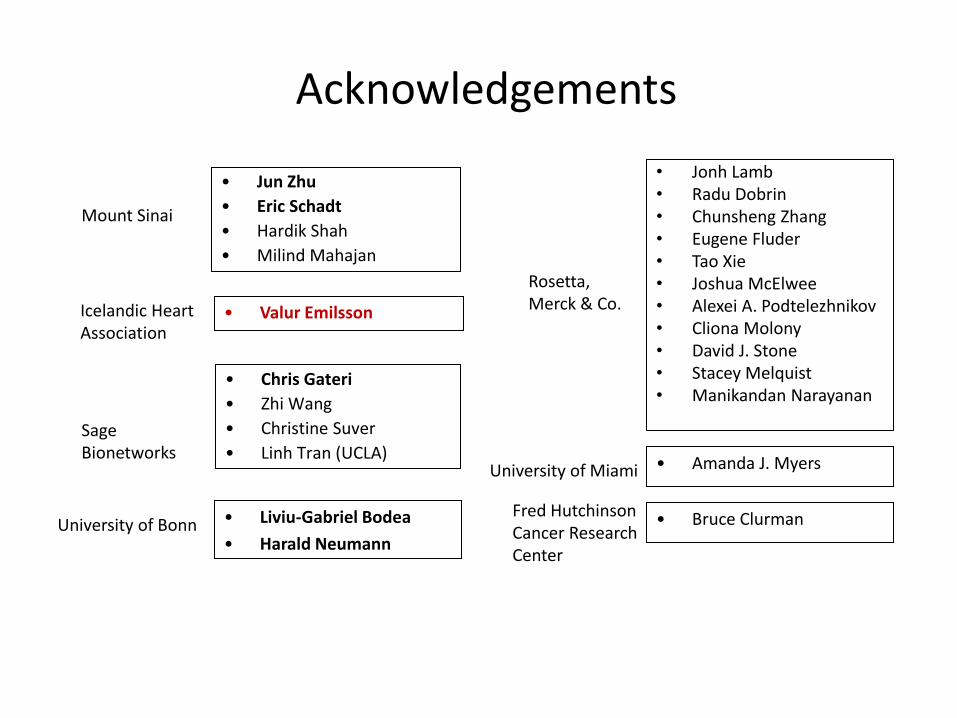
Acknowledgements
• Jonh Lamb • Radu Dobrin • Chunsheng Zhang • Eugene Fluder • Tao Xie • Joshua McElwee • Alexei A. Podtelezhnikov • Cliona Molony • David J. Stone • Stacey Melquist
• Manikandan Narayanan
Rosetta, Merck & Co.
• Liviu-Gabriel Bodea
• Harald Neumann
• Amanda J. Myers University of Miami
Icelandic Heart Association
• Valur Emilsson
Sage Bionetworks
• Chris Gateri
• Zhi Wang
• Christine Suver
• Linh Tran (UCLA)
University of Bonn
• Jun Zhu
• Eric Schadt
• Hardik Shah
• Milind Mahajan
Mount Sinai
• Bruce Clurman Fred Hutchinson Cancer Research Center
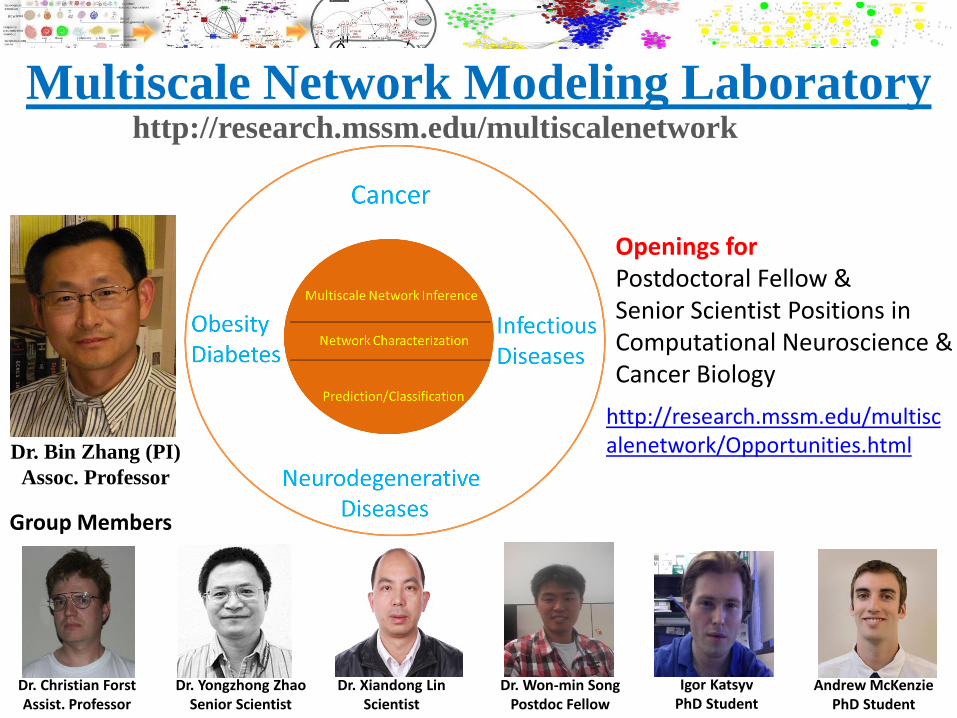
Multiscale Network Modeling Laboratory http://research.mssm.edu/multiscalenetwork
Openings for Postdoctoral Fellow & Senior Scientist Positions in Computational Neuroscience & Cancer Biology
Group Members
Dr. Christian Forst Assist. Professor
Dr. Yongzhong Zhao Senior Scientist
Dr. Xiandong Lin Scientist
Dr. Won-min Song Postdoc Fellow
Igor Katsyv PhD Student
Andrew McKenzie PhD Student
Dr. Bin Zhang (PI)
Assoc. Professor
http://research.mssm.edu/multiscalenetwork/Opportunities.html

Stay Connected with Us!
27
@IcahnInstitute