Embed Size (px)
Citation preview
PhD Thesis
Multiscale Analysis of AtrialFibrillation Mechanisms
Carlos Sanchez Tapia
Supervisors:Esther Pueyo Paules
Blanca Rodrıguez Lopez
Zaragoza, April 2014

PhD Thesis
Multiscale Analysis of AtrialFibrillation Mechanisms
Carlos Sanchez Tapia
Supervisors:Esther Pueyo Paules
Blanca Rodrıguez Lopez
Zaragoza, April 2014


Acknowledgements
There are many people that have been very important to me during thecourse of this thesis and I would like to express my gratitude to all of them.
First of all, I would like to thank the two persons without whom thisthesis would have never been done: Esther Pueyo and Blanca Rodrıguez.I have learnt a lot from both of them and it has been a real pleasure forme to be their PhD student all these past few years. I have found theirguidance, hard work, dedication and, primarily, their passion for scientificinvestigation really encouraging and helpful.
To Pablo Laguna, for his fantastic ability to manage our research groupand being a good support to all of us in both personal and academic stuff.
To Alfonso Bueno, for his invaluable help in so many occasions, becominga very good colleague but a better friend.
To Alberto Corrias, for being such a good flatmate and friend, and in-troducing me not only into Chaste but into the Oxonian life.
To Jose Felix Rodrıguez, the main Elvira-software developer, for his highefficacy and speed solving all the simulation problems I have had.
To all the people and institutions I have collaborated with: AstraZeneca,Karlsruhe Institute of Technology, Technische Universitat Dresden and Uni-versidad Politecnica de Valencia, for all the useful data, software and com-ments provided that helped me to improve the work performed in this thesis.
To all my colleagues of the signal processing group in Zaragoza, Juan,Fer, Julia, Alex, Pepo, Ana... and everyone who has ever been part of thisunique and special group in the last 6 years, for being like a second familyto me. They have made me feel comfortable since the first day and all thetime we have passed together has been full of unforgettable moments: thescientific discussions at the seminars or in the laboratory, the "coffee-dudes"time, the support they gave me when I had a bad day, the good and originalsense of humour that is always present in the laboratory, the "doodle-lies",the frequent celebrations, the moments of shared passion for doing science...Thanks for everything.
To my friends Alex, Carlos, Javi, Gema, Jose Ignacio, Montse, Cristina,Daniel, Juampa, Jose Luis... because relaxing moments and leisure timehave been very important to keep my mind clear.
v

vi Acknowledgements
To my family, Carlos, Rosa Blanca, David and Marıa Jose, for theirunconditional support and love. Their encouragement and wise advice havebeen essential for me to face all the issues I have encountered on the way tofinish this thesis.
Finally, to Lorena, my love, my honey, for being so comprehensive andpatient specially during my residencies in Oxford because it was really toughto be far away. Her company, affection and care for me are something I am,and always will, thankful to her for.
Abstract
Atrial fibrillation (AF) is the most commonly diagnosed cardiac arrhythmia,particularly in developed countries. AF is mainly initiated and sustained byreentrant circuits (rotors) and ectopic foci in different parts of the atria,which entail a chaotic electrical activation pattern in the muscular tissue.However, the ionic mechanisms underlying the generation and maintenanceof AF are not fully understood, thus leading to a limited efficacy of currentpharmacological AF therapies, which often require concomitant surgical ab-lation of atrial tissue. In this thesis we provide mechanistic descriptions ofthe physiological and pathophysiological behavior of atrial cells and tissuesby means of modeling and simulation of human atrial electrical activity.
During the course of this thesis, a number of models have been used tosimulate the electrical activity of human atrial cardiomyocytes and investi-gate properties related with arrhythmic risk. The models used in this thesisprovide a full description of all the ionic currents and intracellular dynam-ics of sodium, potassium and calcium ions that underlie differences betweenthe potentials in the intracellular and the extracellular spaces during eachcardiac cycle. The time course of this transmembrane potential when anexternal stimulus is applied to the cell is known as action potential (AP).
The first part of this thesis consisted of the analysis of the adaptation ofthe AP duration (APD), in both individual cells and unidimensional fibers,to changes in heart rate. Simulations showed that APD adaptation occurredin two phases, fast and slow, with different underlying ionic mechanisms.The maximal conductance of ICaL and the activity of the NaCa exchangerwere the main drivers of the fast adaptation phase, while the activity of theNaK pump was the major determinant of the slow phase.
In the second part of the present thesis, the investigations were extendedto study additional cell and tissue electrophysiological properties related tothe risk of suffering atrial arrhythmias, including APD and resting mem-brane potential at steady-state after periodic stimulation, APD restitutioncurves with S1S2 and dynamic restitution protocols, conduction velocity inunidimensional fibers, and effective refractory period, dominant frequencyand phase singularities in bidimensional tissue. The ionic mechanisms modu-lating these electrophysiological properties were investigated in sinus rhythm
vii
viii Abstract
(SR) and AF conditions. The results from the conducted simulations al-lowed to conclude that the activity of the NaK pump and the IK1 currentare the most important ionic mechanisms modulating properties at cell level,both in SR and AF conditions, whereas the role of INa was proved to bekey in the modulation of tissue properties, particularly in AF. Interestingly,simulations showed that temporal adaptation of atrial electrophysiologicalproperties to alterations in ionic currents was monotonic, except for alter-ations in the NaK pump where adaptation was biphasic (initial increasefollowed by progressive decrease, or viceversa).
The third part of this thesis dealt with the study of the large variabil-ity that exists between cells from different patients and different regions ofthe atria. Particularly, the ionic mechanisms involved in the variability inatrial cell repolarization and AP morphology were investigated. Populationsof models were built to mimic the variability of experimental data from pa-tients diagnosed with SR and with chronic AF by generating combinations ofthe most important ionic mechanisms in AP modulation. Only AP modelswithin experimentally determined physiological ranges were selected. Us-ing the developed populations of models, the ionic mechanisms underlyingvariability in the APD measured at different stages of repolarization wereascertained. IK1 and the NaK pump were identified as the most relevantmechanisms determining variability in APD90, whereas ICaL, Ito and IKurwere key in modulating inter-subject differences in APD20 and APD50, bothin SR and AF conditions. The unraveled ionic mechanisms underlying vari-ability in AP morphology were IK1, INaK and INaCa. Results obtained withdifferent AP models were consistent with each other, except for some differ-ences such as the relevance of ICaL in modulating variability in APD90, theimportance of IK1 and the NaK pump in modulating variability in APD20and the likelihood of presenting AP alternans within the population at fastpacing rates.
In the fourth part of this thesis, AF dynamics at whole atria level wereinvestigated using a three-dimensional (3D) virtual human atrial model de-veloped at the Karlsruhe Institute of Technology. From the analysis of 49pseudo-electrogram signals mapping the atria, we observed the dominantfrequency of the signals was strongly reduced when either inhibition INa or,to a lesser extent, IK1 and the NaK pump. The temporal regularity of thearrhythmia was increased by both INa and IK1 inhibition in left atrium, butthe effects were reduced in the right atrium, whereas NaK pump inhibitionacted to reduce the regularity in both atria. The effects on AF dynamics ofintroducing variability in APD90, APD50 and APD20 were studied by calcu-lating sub-populations of models (extracting them from the total populationof models previously described) and assigning each cell in the 3D model witha model of the sub-population. The results of the simulations showed thathuman atria presenting long APDs could be associated with slow but very

Abstract ix
regular fibrillatory patterns, whereas those with short APDs may have highfrequency reentrant rotors and high organization.
To summarize, the results presented in this thesis have improved the un-derstanding of the ionic mechanisms underlying electrophysiological prop-erties related to arrhythmic risk in human atria through the use of cardiaccomputational modeling techniques.

Resumen y conclusiones
La fibrilacion auricular (AF) es la arritmia cardiac mas comunmente diagnos-ticada, especialmente en paıses desarrollados. AF se inicia y mantiente prin-cipalmente por circuitos reentrantes (rotores) y focos ectopicos, los cualesproducen un patron de activacion caotico en el tejido cardiaco auricular. Sinembargo, los mecanismos ionicos subyacentes no son totalmente conocidos,lo que conlleva una efectividad limitada de las actuales terapias farmacologi-cas para tratar AF y, por tanto, la necesidad de utilizar ablacion quirurgica.En esta tesis describimos el comportamiento fisiologico y pato-fisiologico decelulas y tejidos auriculares mediante modelado y simulacion de la actividadelectrica auricular.
Durante el desarrollo de esta tesis se han utilizado varios modelos parasimular la actividad electrica de cardiomiocitos de aurıcula humana e investi-gar propiedades relacionadas con el riesgo arrıtmico. Los modelos utilizadosen esta tesis poseen una descripcion detallada de todas las corrientes ionicasy dinamicas intracelulares de los iones de sodio, potasio y calcio que subya-cen a las diferencias de potencial entre el interior y el exterior de la celuladurante cada ciclo cardiaco. La evolucion de este potencial transmembraatras aplicar un estımulo externo se conoce como potencial de accion (AP).
La primera parte de esta tesis consistio en el analisis de la adaptacionde la duracion del AP (APD) en celulas individuales y fibras unidimension-ales ante cambios en el ritmo cardiaco. Las simulaciones mostraron que laadaptacion del APD ocurrıa en dos fases, rapida y lenta, cada una con difer-entes mecanismos ionicos subyacentes. La maxima conductancia de ICaL yla actividad del intercambiador NaCa eran los mas relevantes en la fase rap-ida, mientras que la actividad de la bomba NaK era el principal moduladorde la fase lenta.
En la segunda parte de la presente tesis, las investigaciones se extendieronal estudio de un mayor numero de propiedades electrofisiologicas, en celulay tejido, relacionadas con el riesgo arrıtmico auricular, incluyendo el APD,el potencial de reposo, las curvas de restitucion de APD, la velocidad deconduccion, el perıodo refractario efectivo, la frecuencia dominante y las sin-gularidades de fase. Los mecanismos ionicos que modulan estas propiedadeselectrofisiologicas se investigaron en conditiciones de ritmo sinusal (SR) y
xi
xii Resumen y conclusiones
de AF. Los resultados de las simulaciones mostraron que la actividad de labomba NaK y la corriente IK1 eran los mecanismos ionicos mas importantesen la modulacion de las propiedades a nivel celular, mientras que INa eraesencial en las propiedades tisulares, especialmente en AF. En las simula-ciones se observo que la adaptacion temporal de las propiedades estudiadasante cambios en las corrientes ionicas se producıa de forma monotonica, ex-cepto para las alteraciones de la bomba NaK cuya adaptacion era bifasica(aumento inicial seguido de una reduccion progresiva, o viceversa).
La tercera parte de esta tesis trato del estudio de los mecanismos ionicosinvolucrados en las diferentes fases de la repolarizacion celular teniendo encuenta la gran variabilidad que existe entre celulas de distintos pacienteso incluso de diferentes partes de las aurıculas. Para imitar la variabilidadmedida en pacientes en SR y AF, se construyeron poblaciones de modeloscon combinaciones de los mecanismos ionicos con mayor relevancia en lamodulacion del AP, seleccionando finalmente aquellos dentro de un rangofisiologico determinado experimentalmente. Utilizando las poblaciones demodelos generadas, se identificaron los mecanismos ionicos mas relevantesen la variabilidad de cada fase de la repolarizacion. IK1 y la bomba NaK seidentificaron como los mas relevantes modulando la variabilidad en APD90;mientras que ICaL, Ito e IKur eran esenciales en la variabilidad de APD50y APD20. Los mecanismos ionicos subyacentes a la variabilidad en la mor-fologıa del AP fueron IK1, INaK e INaCa. Los resultados fueron consistentesentre los modelos de AP utilizados, excepto por algunas diferencias en elpapel de ICaL en la modulacion de la variabilidad en APD90, la importanciade IK1 como de la bomba NaK en la variabilidad de APD20 y la probabili-dad de presentar AP alternantes dentro de la poblacion ante ritmos rapidosde marcapaseado.
En la cuarta parte de esta tesis se investigo la dinamica de AF a nivel deaurıcula completa utilizando un modelo tridimensional (3D) desarrollado enel Karlsruhe Institute of Technology. Del analisis de 49 pseudo-electrogramasmapeando las aurıculas, se observo que la frecuencia dominante de las senalesse redujo considerablemente bloqueando INa o, en menor medida, IK1 y labomba NaK. La regularidad temporal de la arritmia se incremento en laaurıcula izquierda bloqueando tanto INa como IK1, pero con apenas cambiosen la aurıcula derecha, mientras que el bloqueo de la bomba NaK redujola regularidad en ambas aurıculas. Para estudiar los efectos de la variabili-dad en APD90, APD50 y APD20 se extrajeron sub-poblaciones de modelosrespecto a las calculadas previamente y se asigno a cada celula del modelo3D un modelo de la sub-poblacion. Los resultados mostraron que aurıcu-las humanas con APDs largos se asociaban con patrones fibrilatorios lentospero regulares, mientras que los APDs mostraban rotores reentrantes de altafrecuencia con alta organizacion.
En resumen, los resultados presentados en esta tesis han mejorado el

Resumen y conclusiones xiii
conocimiento de los mecanismos ionicos subyacentes a propiedades electrofi-siologicas relacionadas con riesgo arrıtmico en aurıcula human mediante eluso de tecnicas de modelado cardiaco computacional.

Contents
Acknowledgements v
Abstract vii
Resumen y conclusiones xi
Contents xiv
List of Figures xvi
List of Tables xviii
1 Introduction 1
1.1 Cardiac Arrhythmias . . . . . . . . . . . . . . . . . . . . . . . 1
1.2 Electrical Activity of the Heart . . . . . . . . . . . . . . . . . 1
1.2.1 Body Surface Electrocardiogram . . . . . . . . . . . . 2
1.2.2 Myocardial Wall Electrograms . . . . . . . . . . . . . 3
1.2.3 Cellular Electrical Activity . . . . . . . . . . . . . . . 4
1.2.4 Ionic Currents . . . . . . . . . . . . . . . . . . . . . . 11
1.2.5 Ionic Concentrations . . . . . . . . . . . . . . . . . . . 21
1.3 Atrial Fibrillation: Incidence and Pathophysiology . . . . . . 24
1.3.1 Types of Atrial Fibrillation . . . . . . . . . . . . . . . 24
1.3.2 Triggering and Maintenance of Atrial Fibrillation . . . 25
1.3.3 Therapies for Arrhythmia Treatment . . . . . . . . . . 26
1.4 Thesis Objectives . . . . . . . . . . . . . . . . . . . . . . . . . 29
1.5 Thesis Outline . . . . . . . . . . . . . . . . . . . . . . . . . . 30
2 General Materials and Methods 35
2.1 Materials . . . . . . . . . . . . . . . . . . . . . . . . . . . . . 35
2.1.1 Cardiac Computational Models . . . . . . . . . . . . . 35
2.2 Methods . . . . . . . . . . . . . . . . . . . . . . . . . . . . . . 40
2.2.1 Numerical Methods . . . . . . . . . . . . . . . . . . . 40
xv
xvi Contents
2.2.2 Computing Resources . . . . . . . . . . . . . . . . . . 41
3 Quantification of APD Rate Adaptation in Human Atriaand its Relationship with Arrhythmogenesis 43
3.1 Introduction . . . . . . . . . . . . . . . . . . . . . . . . . . . . 43
3.1.1 Objetives . . . . . . . . . . . . . . . . . . . . . . . . . 44
3.2 Methods . . . . . . . . . . . . . . . . . . . . . . . . . . . . . . 44
3.2.1 Stimulation Protocols . . . . . . . . . . . . . . . . . . 44
3.2.2 Characterization of APD Rate Adaptation and Un-derlying Mechanisms . . . . . . . . . . . . . . . . . . . 47
3.2.3 Preclinical Markers of Arrhythmic Risk . . . . . . . . 48
3.3 Results . . . . . . . . . . . . . . . . . . . . . . . . . . . . . . . 49
3.3.1 APD Rate Adaptation in Human Atrial Myocytes . . 49
3.3.2 APD Rate Adaptation in 1D Atrial Fibers . . . . . . . 52
3.3.3 Ionic Mechanisms of APD Rate Adaptation . . . . . . 55
3.3.4 Relation between APD Rate Adaptation and Arrhyth-mogenesis . . . . . . . . . . . . . . . . . . . . . . . . . 60
3.3.5 APD Rate Adaptation in Atrial versus VentricularMyocytes . . . . . . . . . . . . . . . . . . . . . . . . . 60
3.4 Discussion . . . . . . . . . . . . . . . . . . . . . . . . . . . . . 62
3.4.1 Limitations of the Study . . . . . . . . . . . . . . . . . 64
4 Ionic Modulation of Electrophysiological Properties and Ro-tor Dynamics in Human Atria 67
4.1 Introduction . . . . . . . . . . . . . . . . . . . . . . . . . . . . 67
4.1.1 Objectives . . . . . . . . . . . . . . . . . . . . . . . . . 68
4.2 Methods . . . . . . . . . . . . . . . . . . . . . . . . . . . . . . 68
4.2.1 Membrane Kinetics . . . . . . . . . . . . . . . . . . . . 68
4.2.2 Cell Simulations . . . . . . . . . . . . . . . . . . . . . 69
4.2.3 Tissue Simulations . . . . . . . . . . . . . . . . . . . . 70
4.2.4 Sensitivity Analysis . . . . . . . . . . . . . . . . . . . 71
4.3 Results . . . . . . . . . . . . . . . . . . . . . . . . . . . . . . . 72
4.3.1 Electrophysiological Markers Related to ArrhythmicRisk in SR versus AF . . . . . . . . . . . . . . . . . . 72
4.3.2 Role of Ionic Currents in Modulating Human AtrialElectrophysiological Markers . . . . . . . . . . . . . . 73
4.3.3 Temporal Adaptation of Human Atrial Electrophysi-ological Markers to Changes in Ionic Currents . . . . . 82
4.3.4 Reentrant Activity in Human Atrial Tissue and Roleof Ionic Currents in its Modulation . . . . . . . . . . . 84
4.4 Discussion . . . . . . . . . . . . . . . . . . . . . . . . . . . . . 91
4.4.1 Limitations of the Study . . . . . . . . . . . . . . . . . 94
Contents xvii
5 Intercellular Variability in Human Atrial Action Potentialin SR versus AF Patients 97
5.1 Introduction . . . . . . . . . . . . . . . . . . . . . . . . . . . . 97
5.1.1 Objectives . . . . . . . . . . . . . . . . . . . . . . . . . 98
5.2 Methods . . . . . . . . . . . . . . . . . . . . . . . . . . . . . . 98
5.2.1 Experimental Dataset . . . . . . . . . . . . . . . . . . 98
5.2.2 Populations of Models of Human Atrial Electrophysi-ology . . . . . . . . . . . . . . . . . . . . . . . . . . . . 100
5.2.3 Statistical Analysis . . . . . . . . . . . . . . . . . . . . 102
5.3 Results . . . . . . . . . . . . . . . . . . . . . . . . . . . . . . . 103
5.3.1 Ionic Determinants of Inter-subject Variability in APD 103
5.3.2 Ionic Determinants of Inter-subject Variability in APMorphology . . . . . . . . . . . . . . . . . . . . . . . . 106
5.3.3 Ionic Determinants of Inter-subject Variability in APRate Dependence . . . . . . . . . . . . . . . . . . . . . 109
5.4 Discussion . . . . . . . . . . . . . . . . . . . . . . . . . . . . . 110
5.4.1 Limitations of the Study . . . . . . . . . . . . . . . . . 113
6 Ionic Modulation of Atrial Fibrillation Dynamics in a Hu-man Atrial 3D Model 115
6.1 Introduction . . . . . . . . . . . . . . . . . . . . . . . . . . . . 115
6.1.1 Objectives . . . . . . . . . . . . . . . . . . . . . . . . . 116
6.2 Methods . . . . . . . . . . . . . . . . . . . . . . . . . . . . . . 116
6.2.1 Cell and 3D Models of Human Atria . . . . . . . . . . 116
6.2.2 Simulated Ionic Current Alterations . . . . . . . . . . 117
6.2.3 Repolarization Variability within the 3D Model . . . . 117
6.2.4 EGM Processing and Arrhythmia-related Indices . . . 119
6.2.5 Ann-Arbor Database . . . . . . . . . . . . . . . . . . . 121
6.3 Results . . . . . . . . . . . . . . . . . . . . . . . . . . . . . . . 121
6.3.1 Parasympathetic Influence on Fibrillatory Dynamics . 121
6.3.2 Ionic Modulation of Reentrant Behavior in Human Atria121
6.3.3 Impact of Inter-subject Variability in Cell Repolariza-tion on AF Dynamics . . . . . . . . . . . . . . . . . . 124
6.3.4 Validation of Simulation Results with EGMs from AFPatients . . . . . . . . . . . . . . . . . . . . . . . . . . 131
6.4 Discussion . . . . . . . . . . . . . . . . . . . . . . . . . . . . . 132
6.4.1 Limitations of the Study . . . . . . . . . . . . . . . . . 133
7 Conclusions and Future Extensions 135
7.1 Conclusions . . . . . . . . . . . . . . . . . . . . . . . . . . . . 135
7.1.1 Ionic Mechanisms Underlying Human Atrial Electro-physiology Markers in SR . . . . . . . . . . . . . . . . 135
xviii Contents
7.1.2 Ionic Mechanisms Underlying Human Atrial Electro-physiology Markers in AF Conditions . . . . . . . . . 137
7.1.3 Ionic Mechanisms Underlying Inter-subject Variabil-ity in Human Atrial AP . . . . . . . . . . . . . . . . . 137
7.1.4 Ionic Mechanisms Underlying AF Dynamics in 3D Vir-tual Human Atria . . . . . . . . . . . . . . . . . . . . 138
7.2 Future Extensions . . . . . . . . . . . . . . . . . . . . . . . . 139
Glossary 141
Publications Derived from the Thesis 147
Bibliography 149
List of Figures
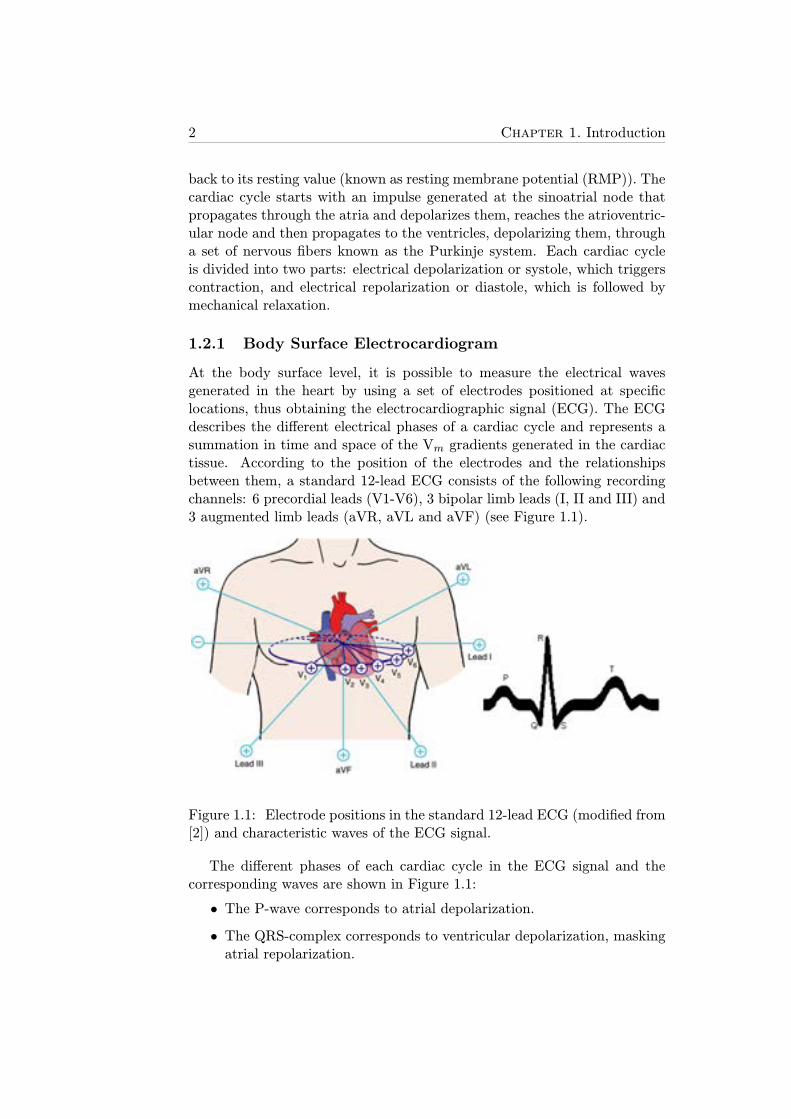
1.1 Electrode positions in the standard 12-lead ECG (modifiedfrom [2]) and characteristic waves of the ECG signal. . . . . . 2
1.2 Example of an ECG signal and the corresponding EGM mea-sured at the high right atrium (HRA). . . . . . . . . . . . . . 3
1.3 A: Capture of a rainbow trout cardiomyocyte with a mi-cropipette (modified from [6]). B: Schematic view of thePatch Clamp technique. . . . . . . . . . . . . . . . . . . . . . 4
1.4 A: Ionic current of a single potassium channel measured withthe Voltage Clamp technique in a cardiomyocyte (modifiedfrom [8]). B: Vm measured with the Current Clamp techniquein a murine neuron (modified from [9]). . . . . . . . . . . . . 5
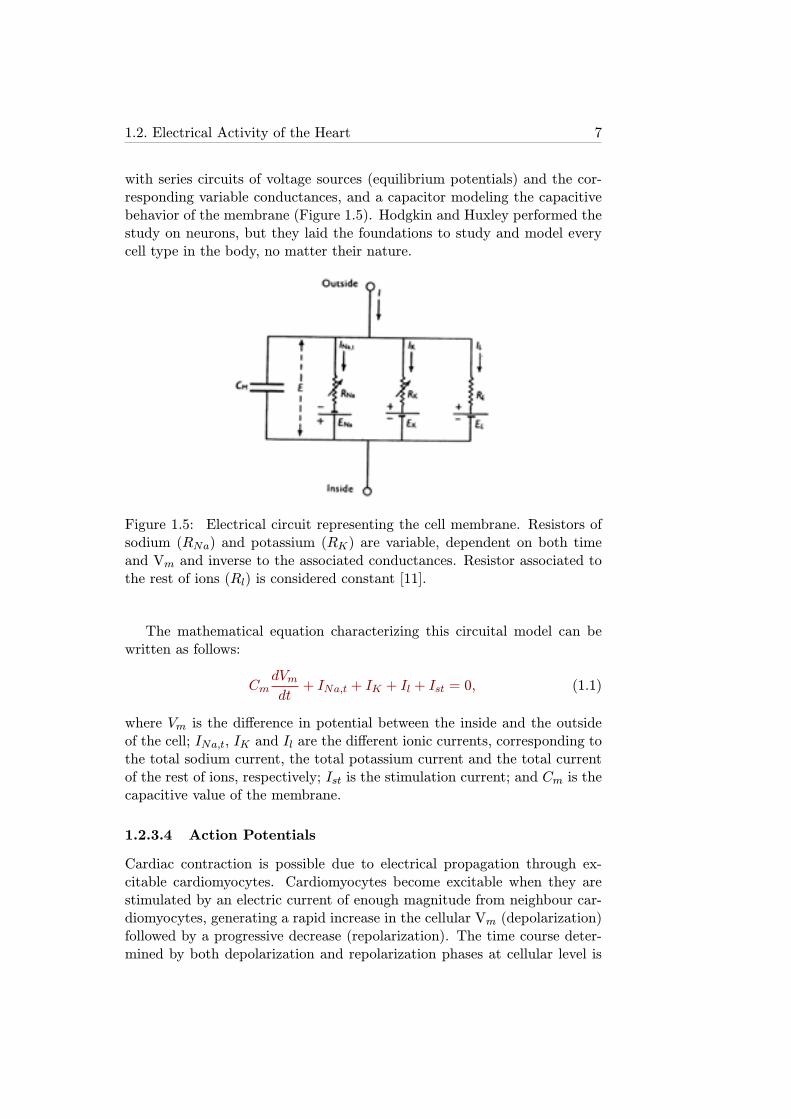
1.5 Electrical circuit representing the cell membrane. Resistors ofsodium (RNa) and potassium (RK) are variable, dependenton both time and Vm and inverse to the associated conduc-tances. Resistor associated to the rest of ions (Rl) is consid-ered constant [11]. . . . . . . . . . . . . . . . . . . . . . . . . 7
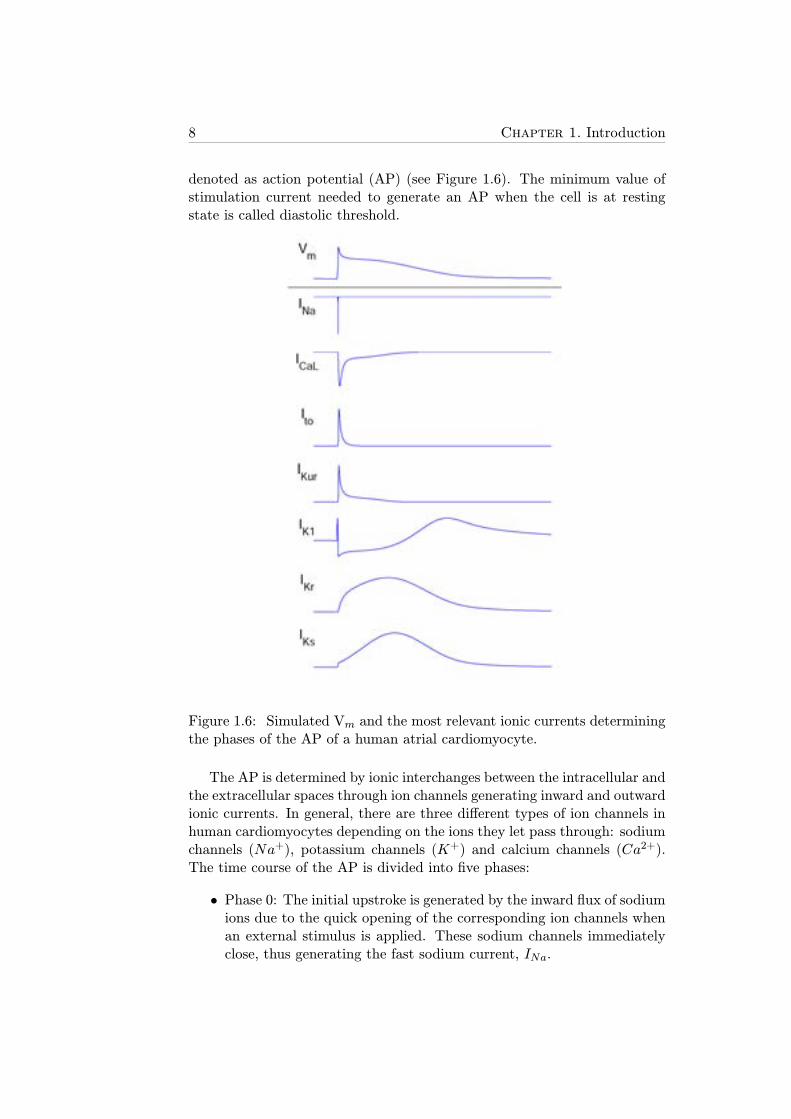
1.6 Simulated Vm and the most relevant ionic currents determin-ing the phases of the AP of a human atrial cardiomyocyte. . . 8
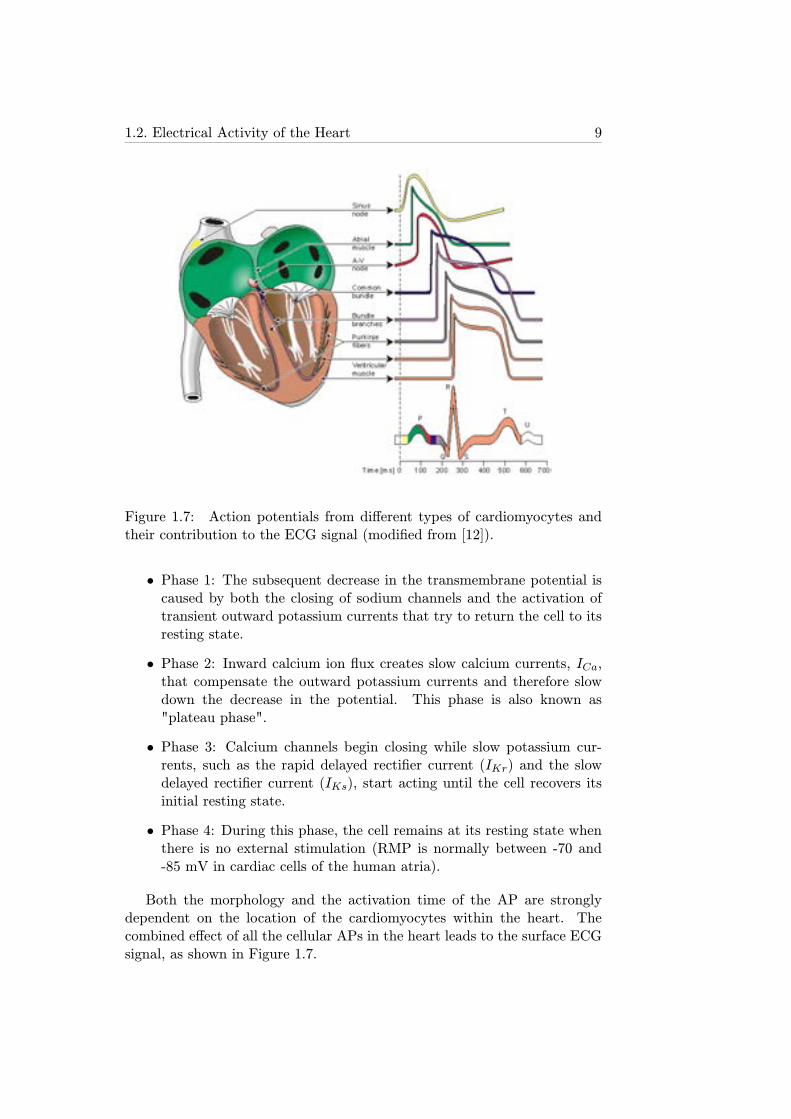
1.7 Action potentials from different types of cardiomyocytes andtheir contribution to the ECG signal (modified from [12]). . . 9
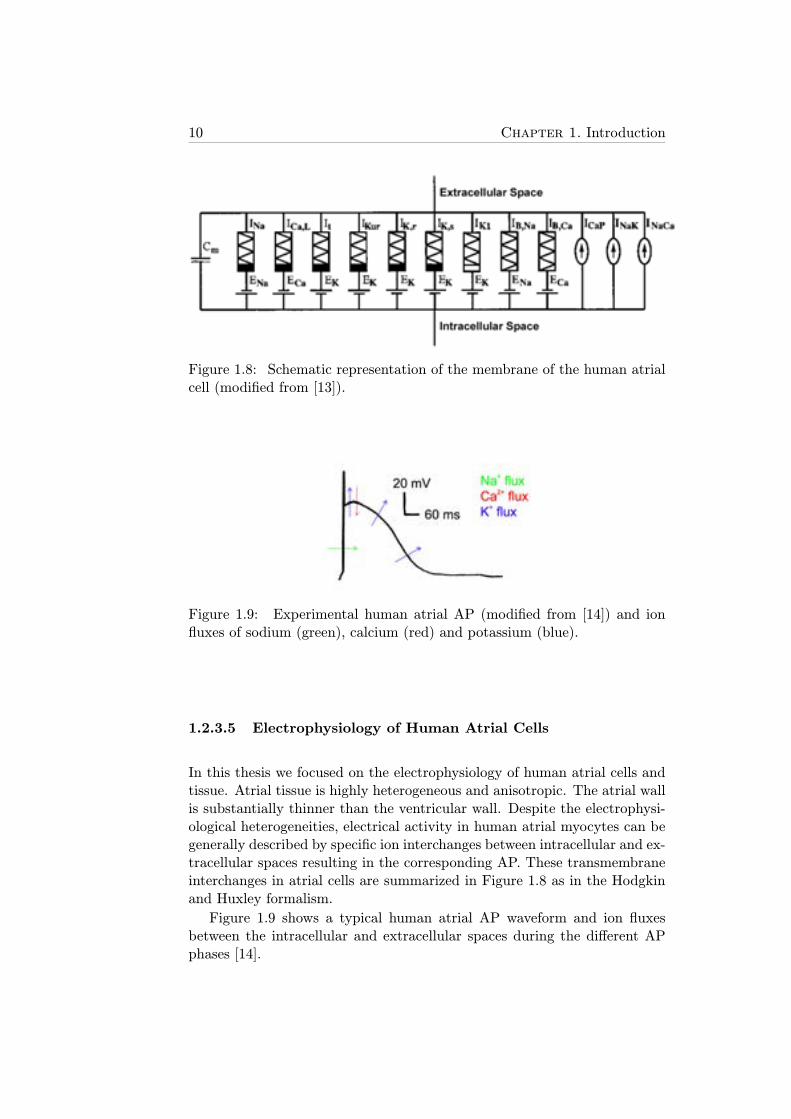
1.8 Schematic representation of the membrane of the human atrialcell (modified from [13]). . . . . . . . . . . . . . . . . . . . . 10
1.9 Experimental human atrial AP (modified from [14]) and ionfluxes of sodium (green), calcium (red) and potassium (blue). 10
1.10 Simulated human atrial AP (top panel) and correspondingINa (bottom panel) measured during the last cardiac cyclefollowing a train of periodic stimuli every 1 second for 20minutes. Note: the activation interval of INa is zoomed indue to its very short duration. . . . . . . . . . . . . . . . . . 12
1.11 Simulated human atrial calcium currents measured during thelast cardiac cycle following a train of periodic stimuli every 1second for 20 minutes: ICaL, Iup, Iup,leak, Itr and Irel. . . . . 13
xix
xx List of figures
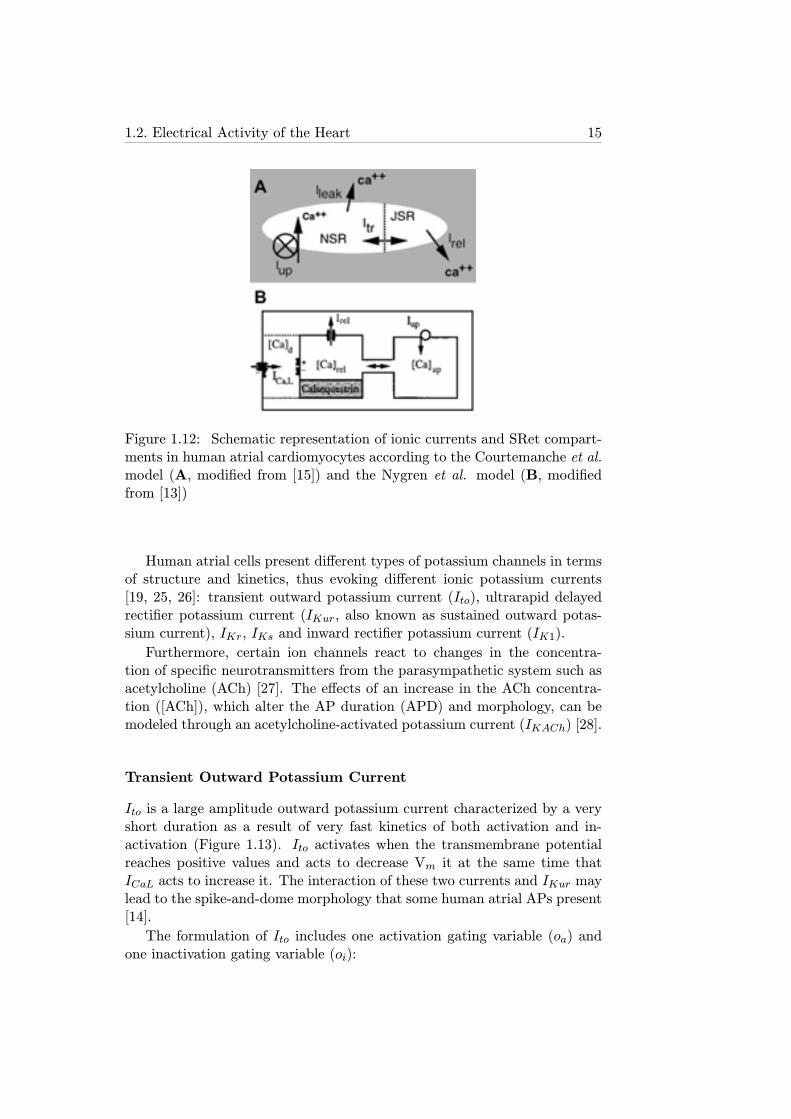
1.12 Schematic representation of ionic currents and SRet com-partments in human atrial cardiomyocytes according to theCourtemanche et al. model (A, modified from [15]) and theNygren et al. model (B, modified from [13]) . . . . . . . . . . 15
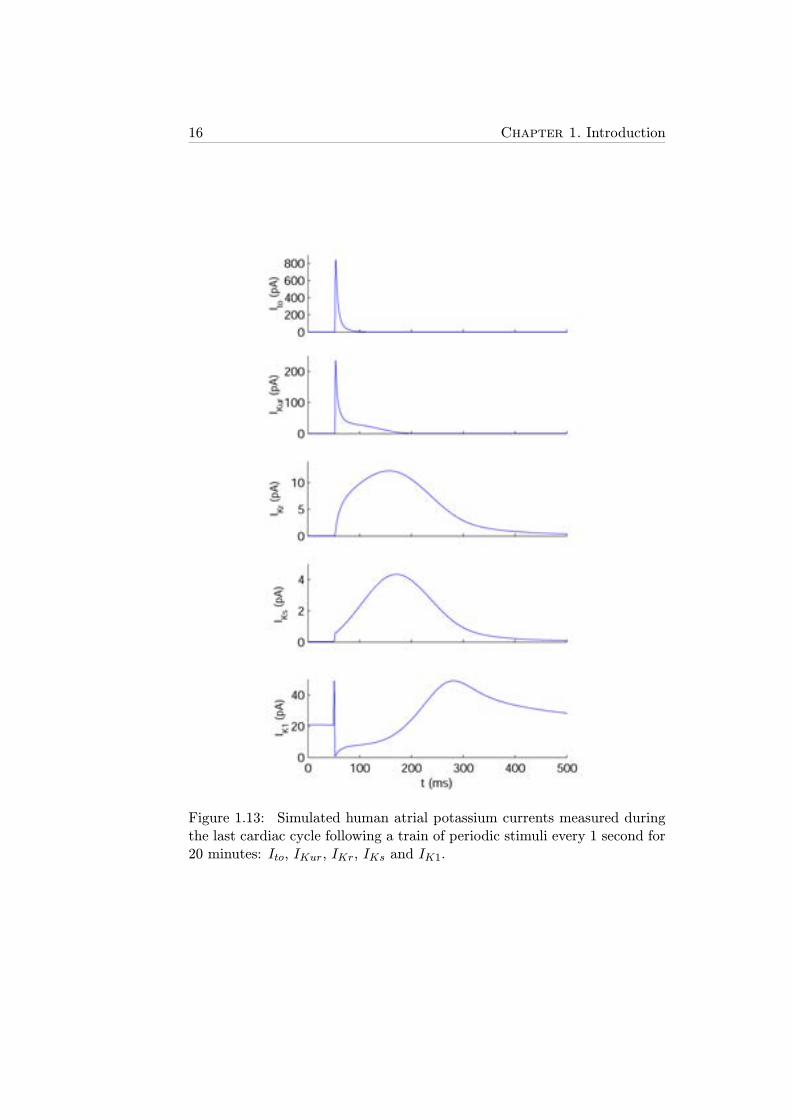
1.13 Simulated human atrial potassium currents measured duringthe last cardiac cycle following a train of periodic stimuli every1 second for 20 minutes: Ito, IKur, IKr, IKs and IK1. . . . . . 16
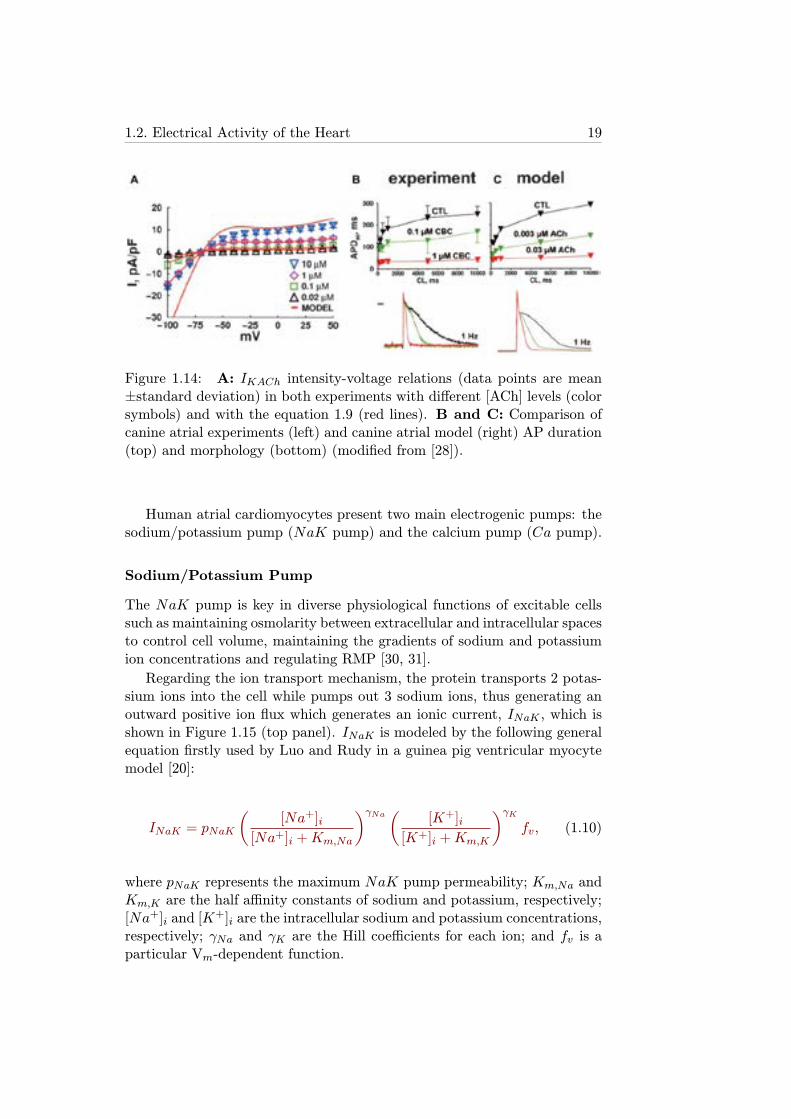
1.14 A: IKACh intensity-voltage relations (data points are mean±standard deviation) in both experiments with different [ACh]levels (color symbols) and with the equation 1.9 (red lines).B and C: Comparison of canine atrial experiments (left) andcanine atrial model (right) AP duration (top) and morphol-ogy (bottom) (modified from [28]). . . . . . . . . . . . . . . 19
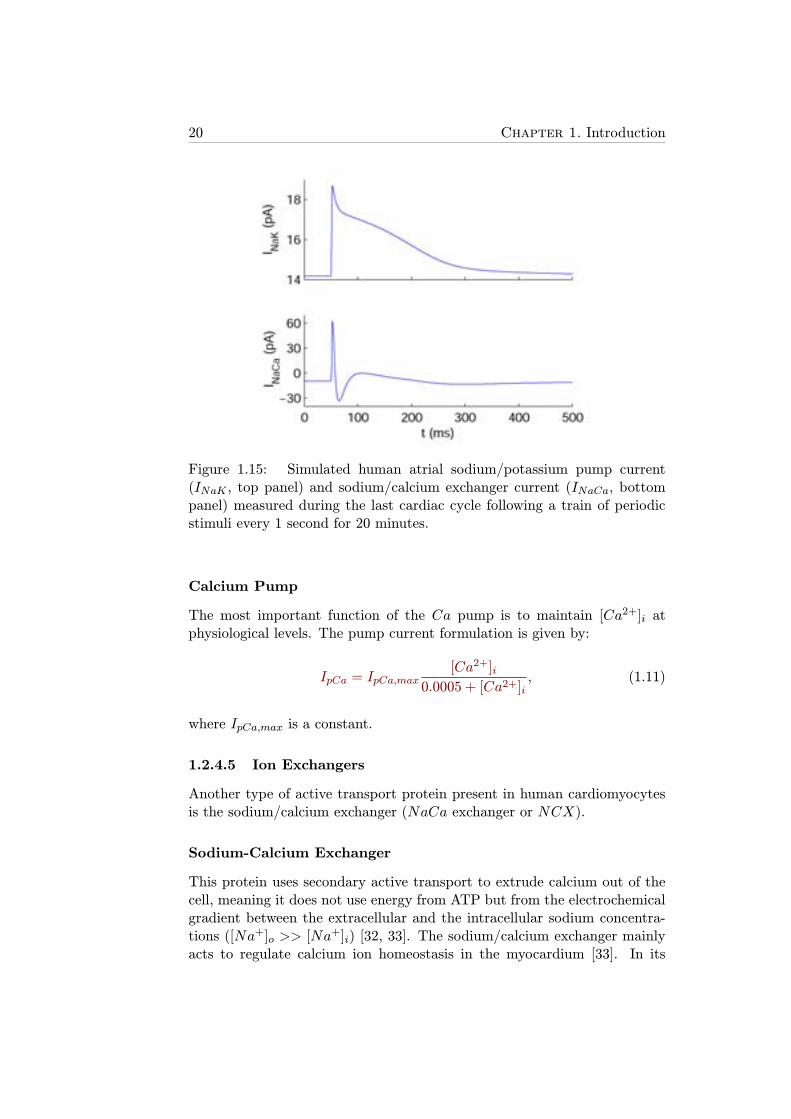
1.15 Simulated human atrial sodium/potassium pump current (INaK ,top panel) and sodium/calcium exchanger current (INaCa,bottom panel) measured during the last cardiac cycle follow-ing a train of periodic stimuli every 1 second for 20 minutes.. . . . . . . . . . . . . . . . . . . . . . . . . . . . . . . . . . . 20
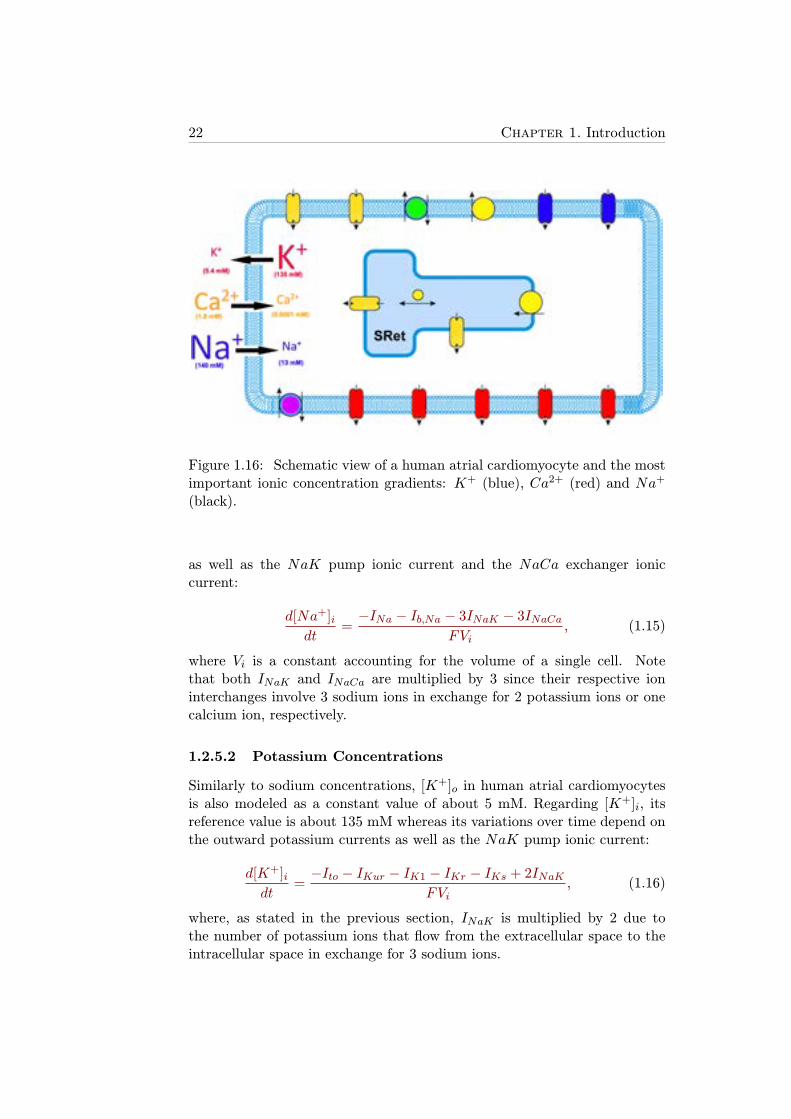
1.16 Schematic view of a human atrial cardiomyocyte and the mostimportant ionic concentration gradients: K+ (blue), Ca2+
(red) and Na+ (black). . . . . . . . . . . . . . . . . . . . . . 22
1.17 ECG signals corresponding to normal SR (top) and AF (bot-tom). . . . . . . . . . . . . . . . . . . . . . . . . . . . . . . . 24
1.18 Schematic view of the hypotheses for AF generation and main-tenance (modified from [47]). A:Multiple reentrant wavelets;B: Focal hypothesis; C: Rotor hypothesis. . . . . . . . . . . 26
1.19 Effects of class I antiarrhythmic drugs: ventricular AP incontrol conditions (solid black line), and after administrationof class IA (solid red line), class IB (solid blue line) and classIC (dashed green line) drugs (modified from [55]). . . . . . . 28
1.20 Magnetic resonance imaging (MRI) scan of the left atrium(viewed from the patient’s back). Chaotic electrical activationpattern associated with AF (left panel) and ablation lesionsproduced around pulmonary veins by a catheter in order toelectrically isolate them (right panel) (modified from [58]). . 29
2.1 Simulated APs obtained after pacing for 50 s with a cyclelength (CL) of 1 s with the five atrial cell models (modifiedfrom [60]). . . . . . . . . . . . . . . . . . . . . . . . . . . . . 36
2.2 Tissue model commonly used in propagation models consist-ing of cells (boxes) connected to each other with resistancesin both intracellular (white cylinders) and extracellular (greycylinders) space (modified from [61]). . . . . . . . . . . . . . 38
List of figures xxi
2.3 Anatomical 3D model of the human atria. A: RA in a frontalview. B: LA in a dorsal view. C: View through tricuspidand mitral valve. SAN, CT and PMs are visible in the RA.(modified from [65]). . . . . . . . . . . . . . . . . . . . . . . 40
3.1 Experimental devices in a confocal microscopy laboratory. . . 45
3.2 Example of a stimulation protocol with a series of 300-msconditioning potentials between -70 and +10 mV used to in-activate ICaL in a zebrafish ventricular myocyte followed bya 300-ms test pulse to measure ICaL after the conditioningpulse (left panel). The family of ICaL current traces obtained(right panel) for the potentials shown on the right side isshown (modified from [83]). . . . . . . . . . . . . . . . . . . . 46
3.3 APDR curves (APD vs. DI) with the S1S2 restitution proto-col (blue) and dynamic restitution protocol (red). . . . . . . . 47
3.4 CL time course with the default pacing protocol: CL1=1000ms and CL2=600 ms (left). APD time course correspondingto the pacing protocol (right). . . . . . . . . . . . . . . . . . . 50
3.5 Comparison between APD adaptation to changes in HR inatrial cell simulations with the Courtemanche model (left)versus results obtained experimentally in canine atrial tissue(right; modified from [81]). . . . . . . . . . . . . . . . . . . . 51
3.6 APD time courses with different combinations of CL changesusing the pacing protocol: the default case (1000-600-1000ms, black solid line), two cases with different initial CL butthe same magnitude of CL change (2000-1600-2000 ms, greensolid line; and 1600-1200-1600 ms, blue dash-dotted line), andtwo cases with different magnitude of change in CL but thesame initial CL (1000-800-1000 ms, pink dashed line; and1000-400-1000 ms, red dotted line). . . . . . . . . . . . . . . . 53
3.7 APs generated after the third stimulus with the Courtemanchemodel in a periodic protocol with CL = 1000 ms. APs cor-responding to cell 1 (blue), cell 50 (pink), cell 100 (red), cell150 (black) and cell 200 (green) in a 1D fiber consisting of200 cells. Stimuli applied only to cell 1. . . . . . . . . . . . . 54
3.8 APD time course of three cells in a one-dimensional fiber of200 cells when applying the pacing protocol 1000-600-1000ms with the Nygren model. Alternating behavior of the APDshown in the zoomed in box. . . . . . . . . . . . . . . . . . . 55
xxii List of figures
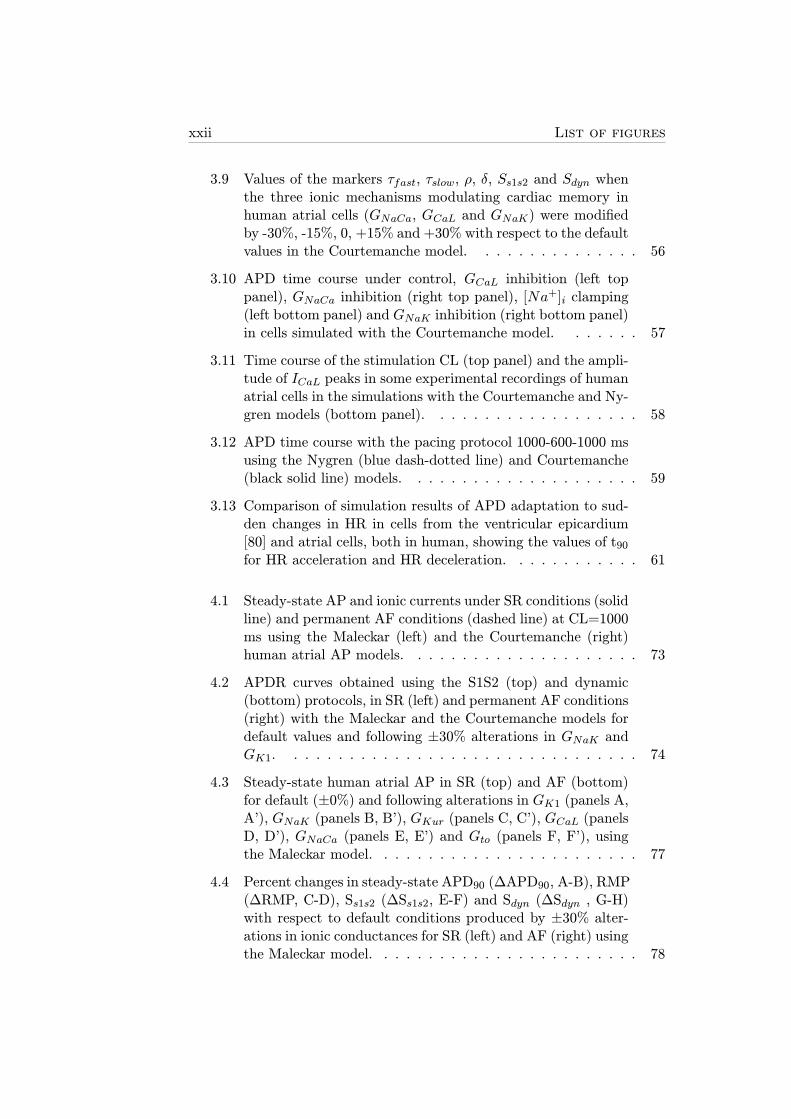
3.9 Values of the markers τfast, τslow, ρ, δ, Ss1s2 and Sdyn whenthe three ionic mechanisms modulating cardiac memory inhuman atrial cells (GNaCa, GCaL and GNaK) were modifiedby -30%, -15%, 0, +15% and +30% with respect to the defaultvalues in the Courtemanche model. . . . . . . . . . . . . . . 56
3.10 APD time course under control, GCaL inhibition (left toppanel), GNaCa inhibition (right top panel), [Na
+]i clamping(left bottom panel) and GNaK inhibition (right bottom panel)in cells simulated with the Courtemanche model. . . . . . . 57
3.11 Time course of the stimulation CL (top panel) and the ampli-tude of ICaL peaks in some experimental recordings of humanatrial cells in the simulations with the Courtemanche and Ny-gren models (bottom panel). . . . . . . . . . . . . . . . . . . 58
3.12 APD time course with the pacing protocol 1000-600-1000 msusing the Nygren (blue dash-dotted line) and Courtemanche(black solid line) models. . . . . . . . . . . . . . . . . . . . . 59
3.13 Comparison of simulation results of APD adaptation to sud-den changes in HR in cells from the ventricular epicardium[80] and atrial cells, both in human, showing the values of t90for HR acceleration and HR deceleration. . . . . . . . . . . . 61
4.1 Steady-state AP and ionic currents under SR conditions (solidline) and permanent AF conditions (dashed line) at CL=1000ms using the Maleckar (left) and the Courtemanche (right)human atrial AP models. . . . . . . . . . . . . . . . . . . . . 73
4.2 APDR curves obtained using the S1S2 (top) and dynamic(bottom) protocols, in SR (left) and permanent AF conditions(right) with the Maleckar and the Courtemanche models fordefault values and following ±30% alterations in GNaK andGK1. . . . . . . . . . . . . . . . . . . . . . . . . . . . . . . . 74
4.3 Steady-state human atrial AP in SR (top) and AF (bottom)for default (±0%) and following alterations in GK1 (panels A,A’), GNaK (panels B, B’), GKur (panels C, C’), GCaL (panelsD, D’), GNaCa (panels E, E’) and Gto (panels F, F’), usingthe Maleckar model. . . . . . . . . . . . . . . . . . . . . . . . 77
4.4 Percent changes in steady-state APD90 (ΔAPD90, A-B), RMP(ΔRMP, C-D), Ss1s2 (ΔSs1s2, E-F) and Sdyn (ΔSdyn , G-H)with respect to default conditions produced by ±30% alter-ations in ionic conductances for SR (left) and AF (right) usingthe Maleckar model. . . . . . . . . . . . . . . . . . . . . . . . 78
List of figures xxiii
4.5 Percent changes in steady-state APD90 (ΔAPD90, A-B), RMP(ΔRMP, C-D), Ss1s2 (ΔSs1s2, E-F) and Sdyn (ΔSdyn , G-H)with respect to default conditions produced by ±30% alter-ations in ionic conductances for SR (left) and AF (right) usingthe Courtemanche model. . . . . . . . . . . . . . . . . . . . . 79
4.6 Temporal adaptation of percent changes in APD90 (ΔAPD90,A-B) and RMP (ΔRMP, C-D), for single cell simulations, RP(ΔRP, E-F), for 2D tissue simulations, and CV (ΔCV, G-H),for 1D fiber simulations, with respect to default conditionsduring ±30% alterations in GNaK , GK1 and GNa in SR (left)and AF (right) using the Maleckar model. *Note: Following5 min of GK1 30% block repolarization fails. . . . . . . . . . 83
4.7 Time course of AP (A), [Na+]i (B), [Ca2+]i (C), INaCa (D)
, ICaL (E), Iup (F) and Irel (G) for default conditions (left),and following 15 s and 30 s after 30% GNaK block using theMaleckar model. APD90 values are shown in bold for eachAP. . . . . . . . . . . . . . . . . . . . . . . . . . . . . . . . . 85
4.8 Reentrant activity in 2D 5x5 cm2 atrial tissue. A: Snap-shots showing Vm distribution for different timings duringthe application of a S1S2 cross-stimulation protocol in SR.B: pEGM and power spectral density corresponding to thesimulation shown in A. C: Snapshots showing Vm distribu-tion for different timings during the application of an S1S2cross-stimulation protocol in AF. D: pEGM and power spec-tral density corresponding to the simulation shown in C. . . 86
4.9 Percent changes in DF (ΔDF) with respect to default condi-tions produced by ±30% alterations in GNaK , GK1 and GNain SR (A) and AF (B) using the Maleckar model. DF valuesare shown for reentry initiated at 10 s (blue bars) and 5 min(red bars) following changes in ionic parameters. Snapshotsof reentry 10 s after the change in ionic parameters underdefault conditions and 30% block of GNaK , GK1 and GNa inSR (C) and AF (D). Black lines on snapshots represent thecorresponding PS trajectories. . . . . . . . . . . . . . . . . . 87
4.10 Changes in the characteristics of simulated reentry caused bychanges in ionic current conductances for SR (black bars) andAF (grey bars). 30% increase/decrease of each ionic conduc-tance is shown in the last row. Panels A, B and C show VWupper and lower limits, Wvw and DF, respectively, for eachsimulation. Specific cases a, b, c and d are referred in thetext. . . . . . . . . . . . . . . . . . . . . . . . . . . . . . . . 89
xxiv List of figures
4.11 Changes in the characteristics of simulated reentry caused bysimultaneous changes in GK1, GNaK and GNa for SR (blackbars) and AF (grey bars). 30% increase/decrease in GK1,GNaK and GNa for each case is shown in the last row. PanelsA, B and C show VW upper and lower limits, Wvw and DF,respectively, for each simulation. Specific cases a (same as inFigure 4.10), e and f are referred in the text. . . . . . . . . . 90
5.1 APs recorded in atrial preparations from SR (left) and AF(right) patients. . . . . . . . . . . . . . . . . . . . . . . . . . 99
5.2 Variability of ionic conductances GK1, GNaK , GCaL, Gto,GKur and GNaCa in experimentally-calibrated populationsof human atrial AP models, sampled within a ±100% rangeof their original values in the Maleckar (A), Courtemanche(B) and Grandi (C) human atrial AP models in SR (black)and AF (gray). Estimated median physiological values areshown as central horizontal lines within each boxplot. (Mann-Whitney U test: *p<0.05; **p<0.01; ***p<0.001). . . . . . 102
5.3 Experimentally-calibrated human AP model populations forSR (left) and AF (right) patients. Initial unrestricted ±100%sampled population (A), experimentally calibrated±30% sam-pled populations (B) and histograms corresponding to APD90,APD50 and APD20 distributions in both the calibrated modelpopulations (C) and the experimental measrements (D) areshown based on the Courtemanche model. Histogram barwidths are 10 ms for both APD90 and APD50, and 4 ms forAPD20. . . . . . . . . . . . . . . . . . . . . . . . . . . . . . . 104
5.4 Transmembrane potential and ionic current traces in SR (left)and AF (right) with the Maleckar model corresponding tomaximum APD90 (red dash-dotted lines), minimum APD90(black dash-dotted lines), maximum APD50 (red thin solidlines), minimum APD50 (black thin solid lines), maximumAPD20 (red dashed lines) and minimum APD20 (black dashedlines). Note: Ito panels are zoomed in. . . . . . . . . . . . . 105
List of figures xxv
5.5 Ionic conductances determining inter-subject variability inthe different stages of human atrial repolarization under SRconditions at 1 Hz pacing. Regression surfaces for APD90,APD50 and APD20 are presented with respect to the twomost significant ionic factors determining their variability, us-ing populations of the Maleckar (A-C), Courtemanche (D-F),and Grandi (G-I) models of human atrial electrophysiology.Regression surfaces are color coded according to APD mag-nitudes, whereas each big dot denotes one simulated subjectin the calibrated populations of sampled models. . . . . . . . 107
5.6 Ionic conductances determining inter-subject variability inthe different stages of human atrial repolarization under AFconditions at 1 Hz pacing. Regression surfaces for APD90,APD50 and APD20 are presented with respect to the twomost significant ionic factors determining their variability, us-ing populations of the Maleckar (A-C), Courtemanche (D-F),and Grandi (G-I) models of human atrial electrophysiology.Regression surfaces are color coded according to APD mag-nitudes, whereas each big dot denotes one simulated subjectin the calibrated populations of sampled models. . . . . . . . 108
5.7 Main ionic determinants of inter-subject variability in humanatrial APD90 (blue), APD50 (green) and APD20 (pink) in SR(panel A) and permanent AF (panel B) with the Maleckar,Courtemanche and Grandi model populations. . . . . . . . . 109
5.8 Inter-subject variability in human atrial AP triangulation.The most and least triangular APs in each population areshown (solid and dotted lines, respectively), obtained withthe Maleckar (A), Courtemanche (B) and Grandi (C) modelsin SR. Corresponding time course of ionic mechanisms of APtriangulation are shown: IK1 and INaK (D and F), IK1 andINaCa (E). . . . . . . . . . . . . . . . . . . . . . . . . . . . . 110
5.9 A: AP traces with the Grandi model population for CL =400 ms in SR of the same accepted models as for CL =1000 ms (blue), the models showing AP alternans (|APD90,odd- APD90,even| > 30 ms; magenta) and the models showingstrong AP alternans (|APD90,odd - APD90,even|> 100 ms black).B: Variability of ionic conductances GK1, GNaK , GCaL, Gto,GKur and GNaCa for the models in panel A. (Mann-WhitneyU test alternans vs. accepted range: *p<0.05; **p<0.01;***p<0.001 ). . . . . . . . . . . . . . . . . . . . . . . . . . . 111
xxvi List of figures
6.1 Population of simulated AF cell models (panel A). First (blue)and fourth (red) quartile sub-populations according to APD90,APD50 and APD20, respectively (panels B-D). Note zoomedin time axis in panel D. . . . . . . . . . . . . . . . . . . . . . 118
6.2 Position of the 49 virtual electrodes (red dots) in LA (leftpanel) and RA (right panel). . . . . . . . . . . . . . . . . . . 119
6.3 Pseudo-EGM signal measured at one of the 49 electrodes dur-ing a simulation of 10 s duration (left). Example of LAWobtained from the pEGM signal (right). . . . . . . . . . . . . 120
6.4 Dorsal view of the atria. Vm map after 10 seconds of simula-tion for AF when [ACh]=1 nM (top panel) and 5 nM (bottompanel). . . . . . . . . . . . . . . . . . . . . . . . . . . . . . . . 122
6.5 Dorsal view of the atria. Interpolated maps of DF (A), OI(B), RI (C) and CP (D) for [ACh]=1 nM (left) and [ACh]=5nM (right). . . . . . . . . . . . . . . . . . . . . . . . . . . . . 123
6.6 Dorsal view of the atria. Vm map after 10 seconds of sim-ulation for AF, and following 30% IK1 inhibition, 15% INainhibition and 30% INaK inhibition in AF, respectively. . . . 124
6.7 Dorsal view of the atria. Interpolated OI (left) and RI (right)map for default conditions (permanent AF), 30% IK1 inhibi-tion, 15% INa inhibition and 30% INaK inhibition, respectively.125
6.8 Coupling between pEGM in adjacent electrodes for LA (left)and RA (right) for default conditions (permanent AF), 30%IK1 inhibition, 15% INa inhibition and 30% INaK inhibition,respectively. Thick white lines represent CP>0.9, thin solidlines represent 0.756CP<0.9 and soft gray lines represent0.66CP<0.75. CP<0.6 is represented by absence of lines. . . 125
6.9 Dorsal view of the atria. Interpolated DF (top-left), OI (top-right), RI (middle-left), CP (middle-right; thick white linesrepresent CP>0.9, thin solid lines represent 0.756CP<0.9and soft gray lines represent 0.66CP<0.75. CP<0.6 is repre-sented by absence of lines), CaT (bottom-left) and CaTmax(bottom-right) for AF conditions with no variability. . . . . . 127
6.10 Dorsal view of the atria. Interpolated maps of DF, OI and RIfor short and long APD90, APD50 and APD20 sub-populationsof models, respectively. . . . . . . . . . . . . . . . . . . . . . . 128
6.11 Dorsal view of the atria. CP between pEGM in adjacentelectrodes for LA (left) and RA (right) for short and longAPD90, APD50 and APD20 sub-populations of models, re-spectively. Thick white lines represent CP>0.9, thin solidlines represent 0.756CP<0.9 and soft gray lines represent0.66CP<0.75. CP<0.6 is represented by absence of lines. . . 129

List of figures xxvii
6.12 Dorsal view of the atria. Interpolated CaT and CaTmax forshort and long APD90, APD50 and APD20 sub-populations ofmodels, respectively. . . . . . . . . . . . . . . . . . . . . . . . 130
6.13 Scatter plot of DF, OI and RI calculated from the 20 EGMat the HRA in AF patients (A) and the corresponding his-tograms showing the number of EGMs for different intervalsof DF, OI and RI (B). . . . . . . . . . . . . . . . . . . . . . . 131

List of Tables
3.1 Time constants for fast and slow phases following HR decel-eration and acceleration. . . . . . . . . . . . . . . . . . . . . . 52
3.2 Time for 90% of APD adaptation, t90, and time constantfor the slow APD adaptation phase following HR decelera-tion and acceleration with D = 0.001 (top) and 0.01 cm2/ms(bottom) in cells 1, 100 and 200 with the Nygren model. . . . 54
4.1 Absolute and relative sensitivities in SR conditions obtainedfrom cell and tissue simulations. The highest absolute sensi-tivities of each marker (listed in the first column) to changesin ionic conductances (listed in the first row) are shown as a% of change. Negative values are represented as "-". Relativesensitivities, Rm,p, are calculated for each marker and shownin a grey scale. . . . . . . . . . . . . . . . . . . . . . . . . . . 80
4.2 Absolute and relative sensitivities in AF conditions obtainedfrom cell and tissue simulations. The highest absolute sensi-tivities of each marker (listed in the first column) to changesin ionic conductances (listed in the first row) are shown as a% of change. Negative values are represented as "-". Relativesensitivities, Rm,p, are calculated for each marker and shownin a grey scale. . . . . . . . . . . . . . . . . . . . . . . . . . . 81
4.3 Ionic currents investigated in this study, drugs targeting themand modulation of atrial electrophysiological properties. . . . 94
5.1 Range of human atrial AP features in SR and AF patients . . 100
5.2 Number and percentages of accepted sampled models in theexperimentally-calibrated Maleckar, Courtemanche and Grandipopulations in SR and permanent AF out of a total of 2275sampled models. . . . . . . . . . . . . . . . . . . . . . . . . . 103
6.1 Human atrial tissue anisotropy and heterogeneities. . . . . . . 117
xxix

Chapter 1
Introduction
1.1 Cardiac Arrhythmias
Over 30% of the total number of deaths in Spain and over 35% in the Eu-ropean Union are caused by circulatory system-related diseases, overcomingthe number of casualties caused by tumours and diseases on the respira-tory, nervous and digestive systems [1]. The origin of the diseases on thecirculatory system is often connected to cardiac dysfunctions leading to ab-normal beating, known as cardiac arrhythmias, other than the normal sinusrhythm. Despite big efforts in the clinical and pharmaceutical fields, theefficacy of antiarrhythmic therapies is far from being optimum in both pre-vention and post-treatment, thus highlighting the necessity of improving ourunderstanding of cardiac electrophysiology and the mechanisms involved inthe generation and maintenance of arrhythmias in the search for improvedtherapies. In this thesis, we investigate the ionic mechanisms underlyingelectrophysiological properties of the human atria for both sinus rhythm(SR) and the most common cardiac arrhythmia, i.e. atrial fibrillation (AF),with the main aim of aiding in the screening, design and development ofnew antiarrhythmic therapies.
1.2 Electrical Activity of the Heart
The human heart is a fist-sized organ whose main function is to pump bloodto the rest of the organs in the human body. The heart consists of four cham-bers, two atria and two ventricles, composed of thousands of aligned musclecells, known as cardiomyocytes, forming muscular fibers contracting and re-laxing synchronously. From the electrical point of view, cardiomyocytes arepolarized during their resting state, i.e. the transmembrane potential be-tween the intracellular and the extracellular space (Vm) is about -80 mV,depolarize when they receive a stimulation current, i.e. Vm increases to pos-itive voltages, and repolarize when depolarization finishes, i.e. Vm decreases
1
2 Chapter 1. Introduction
back to its resting value (known as resting membrane potential (RMP)). Thecardiac cycle starts with an impulse generated at the sinoatrial node thatpropagates through the atria and depolarizes them, reaches the atrioventric-ular node and then propagates to the ventricles, depolarizing them, througha set of nervous fibers known as the Purkinje system. Each cardiac cycleis divided into two parts: electrical depolarization or systole, which triggerscontraction, and electrical repolarization or diastole, which is followed bymechanical relaxation.
1.2.1 Body Surface Electrocardiogram
At the body surface level, it is possible to measure the electrical wavesgenerated in the heart by using a set of electrodes positioned at specificlocations, thus obtaining the electrocardiographic signal (ECG). The ECGdescribes the different electrical phases of a cardiac cycle and represents asummation in time and space of the Vm gradients generated in the cardiactissue. According to the position of the electrodes and the relationshipsbetween them, a standard 12-lead ECG consists of the following recordingchannels: 6 precordial leads (V1-V6), 3 bipolar limb leads (I, II and III) and3 augmented limb leads (aVR, aVL and aVF) (see Figure 1.1).
Figure 1.1: Electrode positions in the standard 12-lead ECG (modified from[2]) and characteristic waves of the ECG signal.
The different phases of each cardiac cycle in the ECG signal and thecorresponding waves are shown in Figure 1.1:
• The P-wave corresponds to atrial depolarization.
• The QRS-complex corresponds to ventricular depolarization, maskingatrial repolarization.
1.2. Electrical Activity of the Heart 3
• The T-wave corresponds to ventricular repolarization.
The ECG is easy to obtain and provides simultaneous information ofcardiac electrical events in time and space (as a function of the recordinglead) thus making it a powerful tool for diagnosis of cardiovascular-relateddiseases.
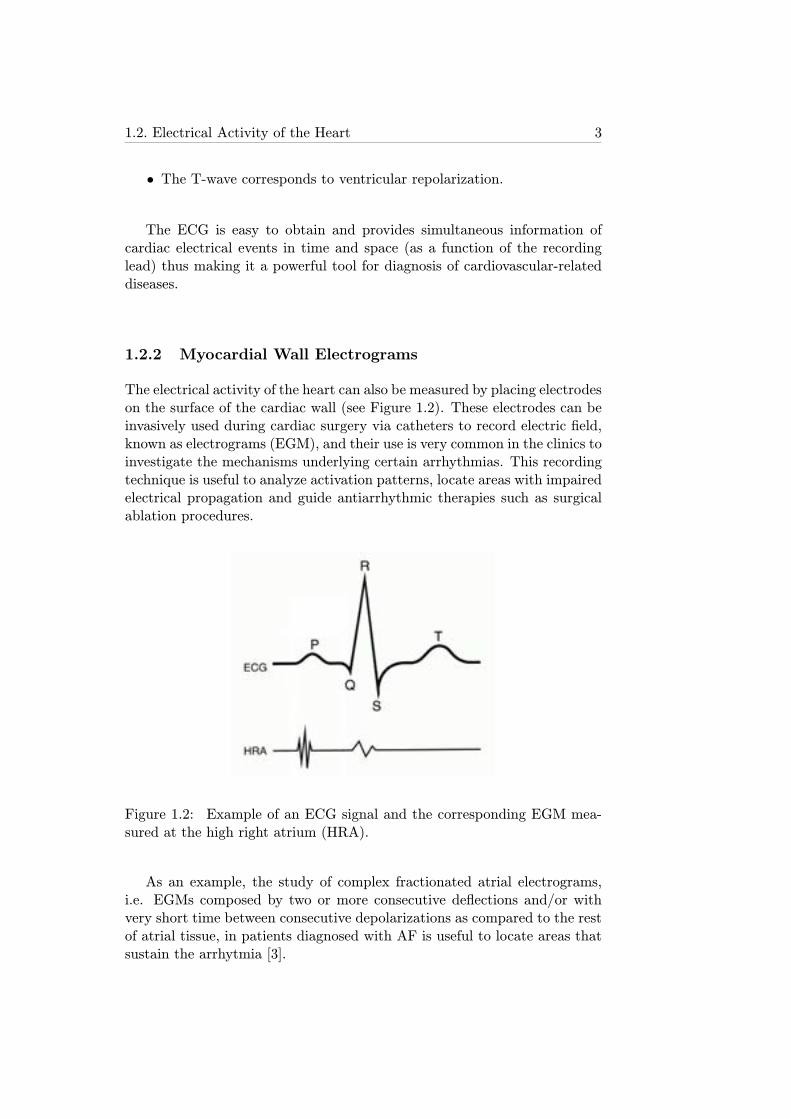
1.2.2 Myocardial Wall Electrograms
The electrical activity of the heart can also be measured by placing electrodeson the surface of the cardiac wall (see Figure 1.2). These electrodes can beinvasively used during cardiac surgery via catheters to record electric field,known as electrograms (EGM), and their use is very common in the clinics toinvestigate the mechanisms underlying certain arrhythmias. This recordingtechnique is useful to analyze activation patterns, locate areas with impairedelectrical propagation and guide antiarrhythmic therapies such as surgicalablation procedures.
Figure 1.2: Example of an ECG signal and the corresponding EGM mea-sured at the high right atrium (HRA).
As an example, the study of complex fractionated atrial electrograms,i.e. EGMs composed by two or more consecutive deflections and/or withvery short time between consecutive depolarizations as compared to the restof atrial tissue, in patients diagnosed with AF is useful to locate areas thatsustain the arrhytmia [3].
4 Chapter 1. Introduction
1.2.3 Cellular Electrical Activity
1.2.3.1 Patch Clamp Recording Techniques
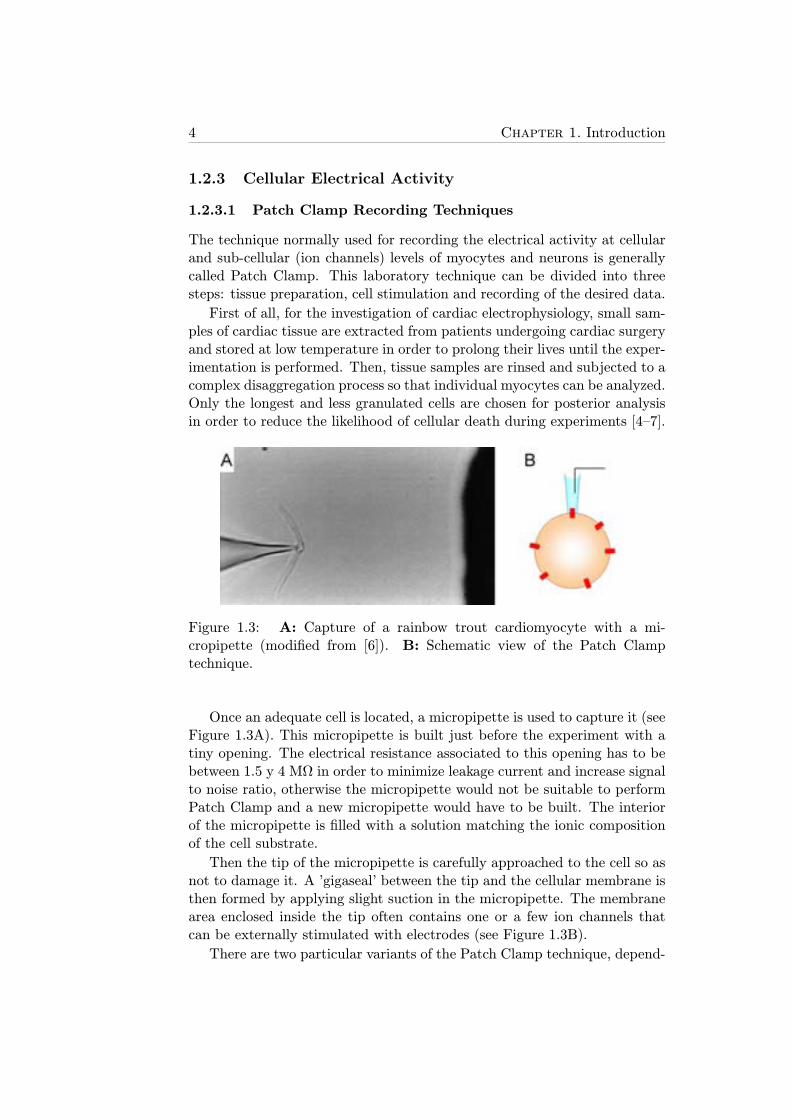
The technique normally used for recording the electrical activity at cellularand sub-cellular (ion channels) levels of myocytes and neurons is generallycalled Patch Clamp. This laboratory technique can be divided into threesteps: tissue preparation, cell stimulation and recording of the desired data.
First of all, for the investigation of cardiac electrophysiology, small sam-ples of cardiac tissue are extracted from patients undergoing cardiac surgeryand stored at low temperature in order to prolong their lives until the exper-imentation is performed. Then, tissue samples are rinsed and subjected to acomplex disaggregation process so that individual myocytes can be analyzed.Only the longest and less granulated cells are chosen for posterior analysisin order to reduce the likelihood of cellular death during experiments [4–7].
Figure 1.3: A: Capture of a rainbow trout cardiomyocyte with a mi-cropipette (modified from [6]). B: Schematic view of the Patch Clamptechnique.
Once an adequate cell is located, a micropipette is used to capture it (seeFigure 1.3A). This micropipette is built just before the experiment with atiny opening. The electrical resistance associated to this opening has to bebetween 1.5 y 4 MΩ in order to minimize leakage current and increase signalto noise ratio, otherwise the micropipette would not be suitable to performPatch Clamp and a new micropipette would have to be built. The interiorof the micropipette is filled with a solution matching the ionic compositionof the cell substrate.
Then the tip of the micropipette is carefully approached to the cell so asnot to damage it. A ’gigaseal’ between the tip and the cellular membrane isthen formed by applying slight suction in the micropipette. The membranearea enclosed inside the tip often contains one or a few ion channels thatcan be externally stimulated with electrodes (see Figure 1.3B).
There are two particular variants of the Patch Clamp technique, depend-
1.2. Electrical Activity of the Heart 5
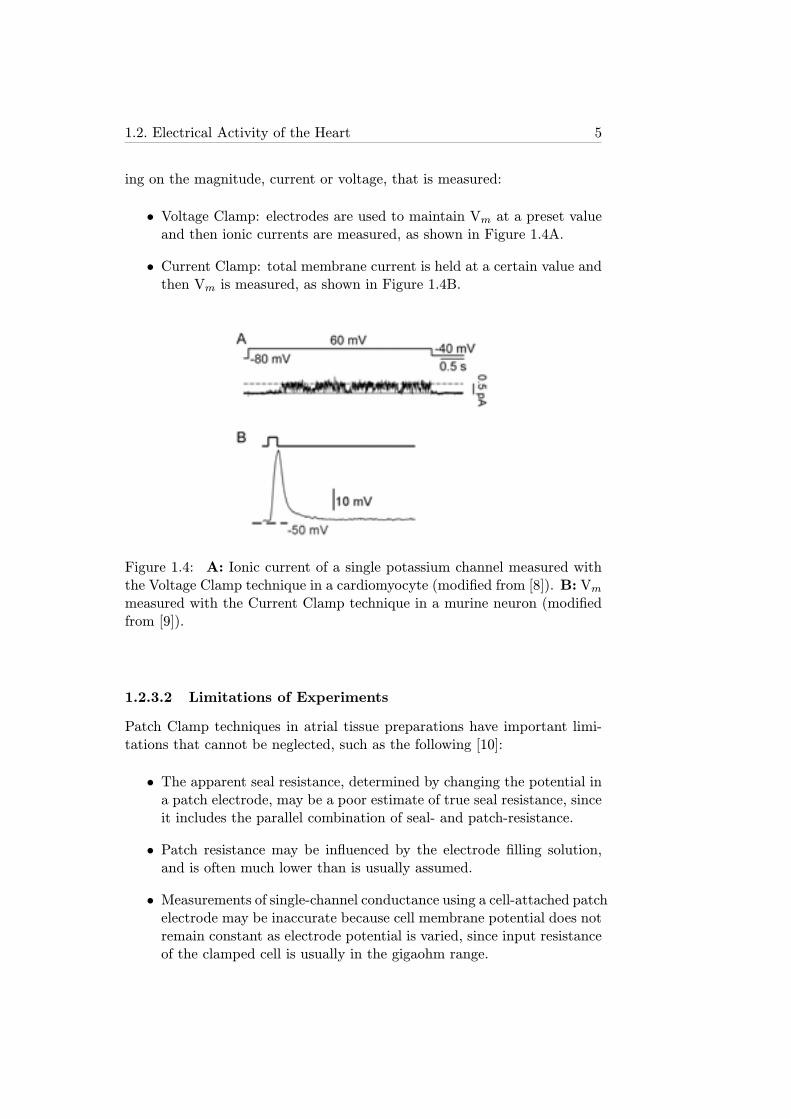
ing on the magnitude, current or voltage, that is measured:
• Voltage Clamp: electrodes are used to maintain Vm at a preset valueand then ionic currents are measured, as shown in Figure 1.4A.
• Current Clamp: total membrane current is held at a certain value andthen Vm is measured, as shown in Figure 1.4B.
Figure 1.4: A: Ionic current of a single potassium channel measured withthe Voltage Clamp technique in a cardiomyocyte (modified from [8]). B: Vmmeasured with the Current Clamp technique in a murine neuron (modifiedfrom [9]).
1.2.3.2 Limitations of Experiments
Patch Clamp techniques in atrial tissue preparations have important limi-tations that cannot be neglected, such as the following [10]:
• The apparent seal resistance, determined by changing the potential ina patch electrode, may be a poor estimate of true seal resistance, sinceit includes the parallel combination of seal- and patch-resistance.
• Patch resistance may be influenced by the electrode filling solution,and is often much lower than is usually assumed.
• Measurements of single-channel conductance using a cell-attached patchelectrode may be inaccurate because cell membrane potential does notremain constant as electrode potential is varied, since input resistanceof the clamped cell is usually in the gigaohm range.
6 Chapter 1. Introduction
• Stabilization of an adequate RMP by externally injecting a holdingcurrent is challenging but key to obtain reliable measurements. Sincethe ionic conductance associated to voltage values close to the RMPin human atrial myocytes is very low in comparison with ventricularmyocytes, small changes in the holding current may lead to significantchanges in the transmembrane voltage [7].
Furthermore, the number of intracardiac experiments on human beings,i.e. experiments aiming at obtaining data and/or tissue samples from theheart invasively through surgical procedures, is limited due to associatedethical constrains, thus making it difficult to draw accurate conclusions ingeneral. In addition, it is important to note that many patients undergo-ing cardiac surgery have cardiovascular related diseases, such as myocar-dial infarction, heart failure or cardiac arrhythmias, thus entailing a limitedamount of data on healthy hearts.
Due to all these ethical and intrinsic limitations of experiments, alter-native methods for the investigation of cardiac behavior at different levelsshould be exploited. During the last decades a new approach has beenwidely extended for giving solution to many questions about electrophysiol-ogy: computational modelling.
1.2.3.3 Computational Modeling
Computational modeling represents a useful tool for understanding the func-tioning of different parts or organs of animal species and humans at differentlevels (molecular, ionic, cellular, tissue, whole-organ, system) and sheddinglight on the mechanisms of specific physiopathological alterations that re-main unclear nowadays. Furthermore, the most important advantage ofusing computational models is the possibility of testing multiple hypothesiswith no risk for either patients or animals, with high spatio-temporal res-olution, thus allowing dissecting multiscale mechanisms from subcellular towhole organ level.
The origins of computational modeling date back to 1952, when thephysicists Alan Lloyd Hodgkin and Andrew Fielding Huxley performed astudy on squid nerve cells (chosen due to their large size) and theoreticallydescribed the ionic currents crossing the cell membrane [11]. In that study,they included details of activation and inactivation ionic gates correspondingto different types of ionic currents, equilibrium potentials (i.e. the poten-tial at which there is no net flow of a particular ion from one side of themembrane to the other) and time-varying ionic conductances (determiningthe number of channels open and thus the overall amplitude of the ioniccurrent). The electrical circuit equivalent to the cell membrane was a meshconsisting of some parallel branches representing both the different typesof ion channels between the intracellular space and the extracellular space,
1.2. Electrical Activity of the Heart 7
with series circuits of voltage sources (equilibrium potentials) and the cor-responding variable conductances, and a capacitor modeling the capacitivebehavior of the membrane (Figure 1.5). Hodgkin and Huxley performed thestudy on neurons, but they laid the foundations to study and model everycell type in the body, no matter their nature.
Figure 1.5: Electrical circuit representing the cell membrane. Resistors ofsodium (RNa) and potassium (RK) are variable, dependent on both timeand Vm and inverse to the associated conductances. Resistor associated tothe rest of ions (Rl) is considered constant [11].
The mathematical equation characterizing this circuital model can bewritten as follows:
CmdVm
dt+ INa,t + IK + Il + Ist = 0, (1.1)
where Vm is the difference in potential between the inside and the outsideof the cell; INa,t, IK and Il are the different ionic currents, corresponding tothe total sodium current, the total potassium current and the total currentof the rest of ions, respectively; Ist is the stimulation current; and Cm is thecapacitive value of the membrane.
1.2.3.4 Action Potentials
Cardiac contraction is possible due to electrical propagation through ex-citable cardiomyocytes. Cardiomyocytes become excitable when they arestimulated by an electric current of enough magnitude from neighbour car-diomyocytes, generating a rapid increase in the cellular Vm (depolarization)followed by a progressive decrease (repolarization). The time course deter-mined by both depolarization and repolarization phases at cellular level is
8 Chapter 1. Introduction
denoted as action potential (AP) (see Figure 1.6). The minimum value ofstimulation current needed to generate an AP when the cell is at restingstate is called diastolic threshold.
Figure 1.6: Simulated Vm and the most relevant ionic currents determiningthe phases of the AP of a human atrial cardiomyocyte.
The AP is determined by ionic interchanges between the intracellular andthe extracellular spaces through ion channels generating inward and outwardionic currents. In general, there are three different types of ion channels inhuman cardiomyocytes depending on the ions they let pass through: sodiumchannels (Na+), potassium channels (K+) and calcium channels (Ca2+).The time course of the AP is divided into five phases:
• Phase 0: The initial upstroke is generated by the inward flux of sodiumions due to the quick opening of the corresponding ion channels whenan external stimulus is applied. These sodium channels immediatelyclose, thus generating the fast sodium current, INa.
1.2. Electrical Activity of the Heart 9
Figure 1.7: Action potentials from different types of cardiomyocytes andtheir contribution to the ECG signal (modified from [12]).
• Phase 1: The subsequent decrease in the transmembrane potential iscaused by both the closing of sodium channels and the activation oftransient outward potassium currents that try to return the cell to itsresting state.
• Phase 2: Inward calcium ion flux creates slow calcium currents, ICa,that compensate the outward potassium currents and therefore slowdown the decrease in the potential. This phase is also known as"plateau phase".
• Phase 3: Calcium channels begin closing while slow potassium cur-rents, such as the rapid delayed rectifier current (IKr) and the slowdelayed rectifier current (IKs), start acting until the cell recovers itsinitial resting state.
• Phase 4: During this phase, the cell remains at its resting state whenthere is no external stimulation (RMP is normally between -70 and-85 mV in cardiac cells of the human atria).
Both the morphology and the activation time of the AP are stronglydependent on the location of the cardiomyocytes within the heart. Thecombined effect of all the cellular APs in the heart leads to the surface ECGsignal, as shown in Figure 1.7.
10 Chapter 1. Introduction
Figure 1.8: Schematic representation of the membrane of the human atrialcell (modified from [13]).
Figure 1.9: Experimental human atrial AP (modified from [14]) and ionfluxes of sodium (green), calcium (red) and potassium (blue).
1.2.3.5 Electrophysiology of Human Atrial Cells
In this thesis we focused on the electrophysiology of human atrial cells andtissue. Atrial tissue is highly heterogeneous and anisotropic. The atrial wallis substantially thinner than the ventricular wall. Despite the electrophysi-ological heterogeneities, electrical activity in human atrial myocytes can begenerally described by specific ion interchanges between intracellular and ex-tracellular spaces resulting in the corresponding AP. These transmembraneinterchanges in atrial cells are summarized in Figure 1.8 as in the Hodgkinand Huxley formalism.
Figure 1.9 shows a typical human atrial AP waveform and ion fluxesbetween the intracellular and extracellular spaces during the different APphases [14].
1.2. Electrical Activity of the Heart 11
1.2.4 Ionic Currents
In this section, ionic current formulations corresponding to the Courte-manche et al. model are described for illustration purposes [15]. Theseformulations include constants and variables (usually dependent on othervariables such as ’time’ or ’Vm’) whose values and equations are adjustedto fit specific experimental observations. Other human atrial cell models,which will be detailed in section 2.1.1.1, use different formulations for someionic currents as they aim at reproducing other sets of experimental data[13, 15–18].
1.2.4.1 Sodium Currents
Once the cell receives external stimulation of an amplitude above its diastolicthreshold, a chain of events begins, starting with fast opening and subse-quent fast closing of the sodium channels, that generate the INa current[19].
Fast Sodium Current
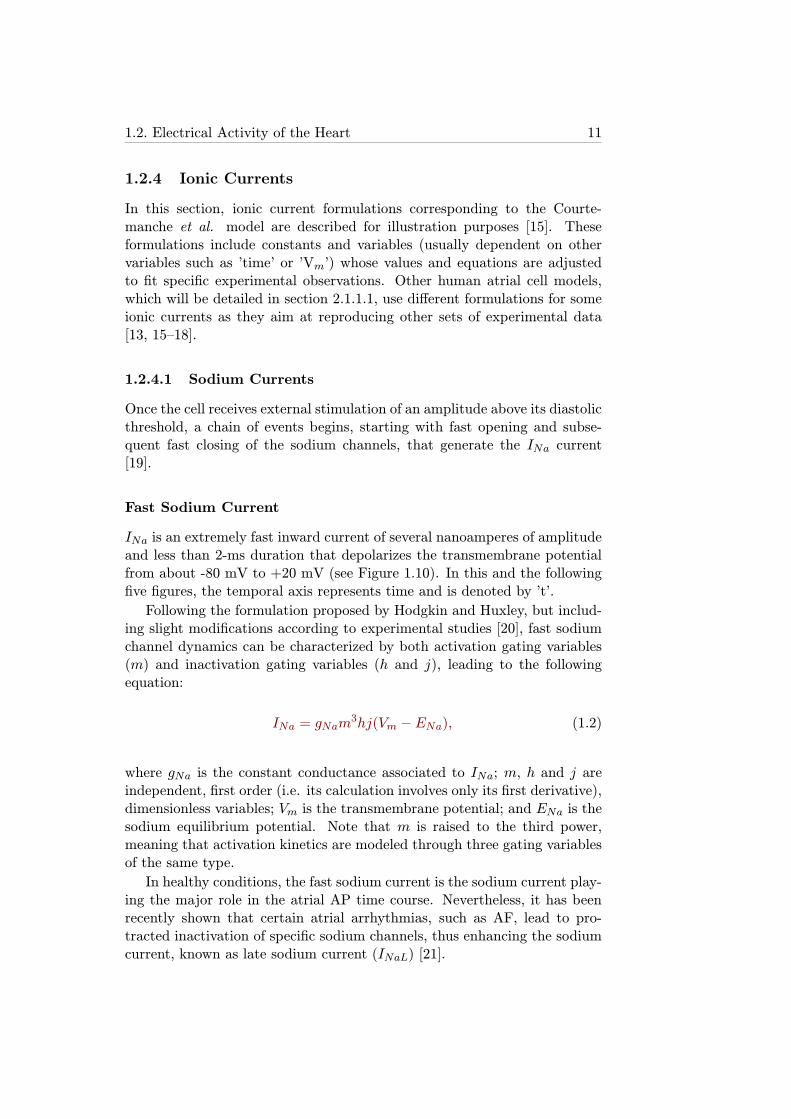
INa is an extremely fast inward current of several nanoamperes of amplitudeand less than 2-ms duration that depolarizes the transmembrane potentialfrom about -80 mV to +20 mV (see Figure 1.10). In this and the followingfive figures, the temporal axis represents time and is denoted by ’t’.
Following the formulation proposed by Hodgkin and Huxley, but includ-ing slight modifications according to experimental studies [20], fast sodiumchannel dynamics can be characterized by both activation gating variables(m) and inactivation gating variables (h and j), leading to the followingequation:
INa = gNam3hj(Vm − ENa), (1.2)
where gNa is the constant conductance associated to INa; m, h and j areindependent, first order (i.e. its calculation involves only its first derivative),dimensionless variables; Vm is the transmembrane potential; and ENa is thesodium equilibrium potential. Note that m is raised to the third power,meaning that activation kinetics are modeled through three gating variablesof the same type.
In healthy conditions, the fast sodium current is the sodium current play-ing the major role in the atrial AP time course. Nevertheless, it has beenrecently shown that certain atrial arrhythmias, such as AF, lead to pro-tracted inactivation of specific sodium channels, thus enhancing the sodiumcurrent, known as late sodium current (INaL) [21].
12 Chapter 1. Introduction
Figure 1.10: Simulated human atrial AP (top panel) and corresponding INa(bottom panel) measured during the last cardiac cycle following a train ofperiodic stimuli every 1 second for 20 minutes. Note: the activation intervalof INa is zoomed in due to its very short duration.
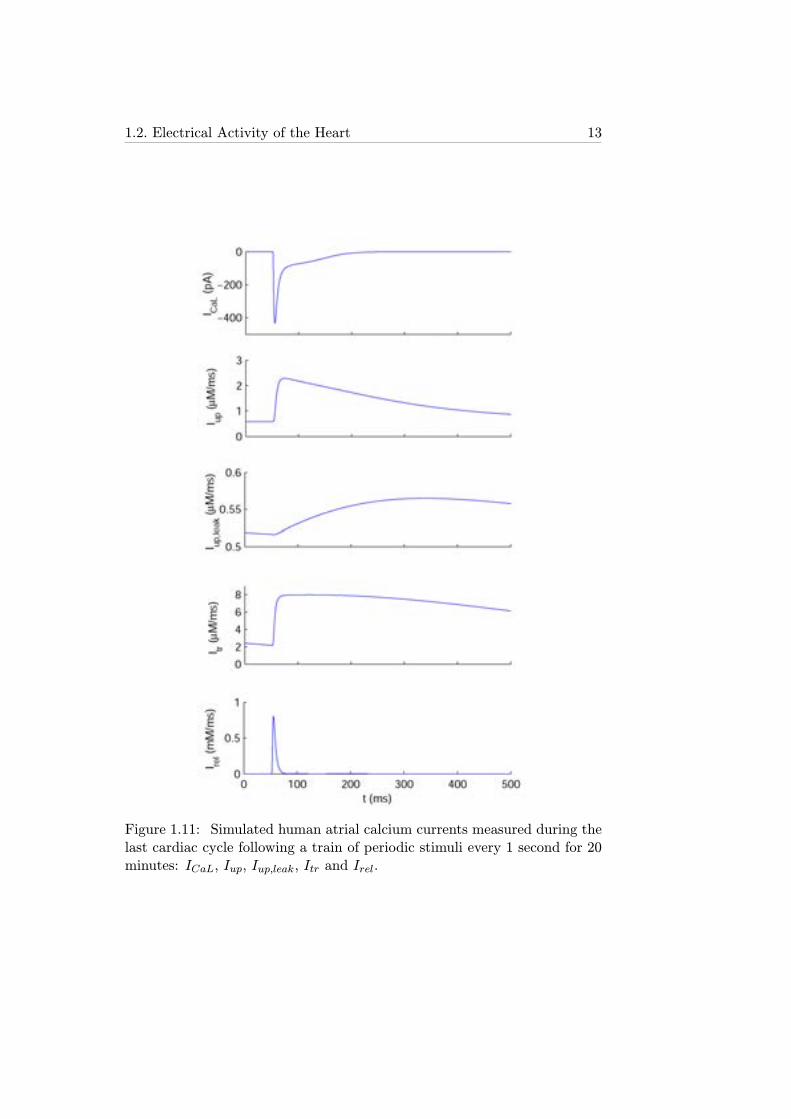
1.2.4.2 Calcium Currents
Inward calcium ion flux begins after the depolarization of the transmem-brane potential due to the initial upstroke. Human cardiomyocyte mem-brane mainly presents one type of calcium channels known as L-type cal-cium channels [22], with their associated ionic current being the L-type cal-cium current (ICaL). Other areas of the human heart, such as the sinoatrialnode (SAN), present another type of calcium channels in the cell membrane,known as T-type calcium channels, that contribute to pacemaker cell depo-larization [23]. The corresponding ionic current is known as T-type calciumcurrent (ICaT ).
Importantly, intracellular calcium in atrial cells is also regulated thanksto ionic interchanges between the intracellular space and the two main com-partments of the sarcoplasmic reticulum (an organelle in animal cells thatsurrounds its nucleus, denoted by SRet in this thesis): the network sar-coplasmic reticulum (NSR) and the junctional sarcoplasmic reticulum (JSR),which generate different ionic currents as well. The combined effects of ICaLand the SRet currents on the intracellular calcium concentration ([Ca2+]i)lead to so called intracellular calcium dynamics.
1.2. Electrical Activity of the Heart 13
Figure 1.11: Simulated human atrial calcium currents measured during thelast cardiac cycle following a train of periodic stimuli every 1 second for 20minutes: ICaL, Iup, Iup,leak, Itr and Irel.
14 Chapter 1. Introduction
L-Type Calcium Current
ICaL is an inward ionic current with slower activation time and lower am-plitude than INa, but with much longer duration, as shown in Figure 1.11.It is characterized by two voltage-dependent gating variables, an activationgating variable (d) and an inactivation gating variable (f), and a [Ca2+]i-dependent inactivation gating variable (fCa). This transmembrane ioniccurrent is essential in the "plateau" phase (phase 2) of the AP time-course,as described in section 1.2.3.
Similar formulation to that of INa can be used to describe ICaL as afunction of its associated gating variables:
ICaL = gCaLdffCa(Vm − ECa), (1.3)
where gCaL is the constant conductance associated to ICaL; d, f and fCaare independent, first order, dimensionless variables; and ECa is the calciumequilibrium potential.
Due to the role of ICaL in increasing [Ca2+]i, it plays a key role in
the excitation-contraction coupling, as an increase in intracellular calciumactivates calcium-sensitive contractile proteins that then use ATP to causecell contraction [22, 24].
Sarcoplasmic Reticulum Currents
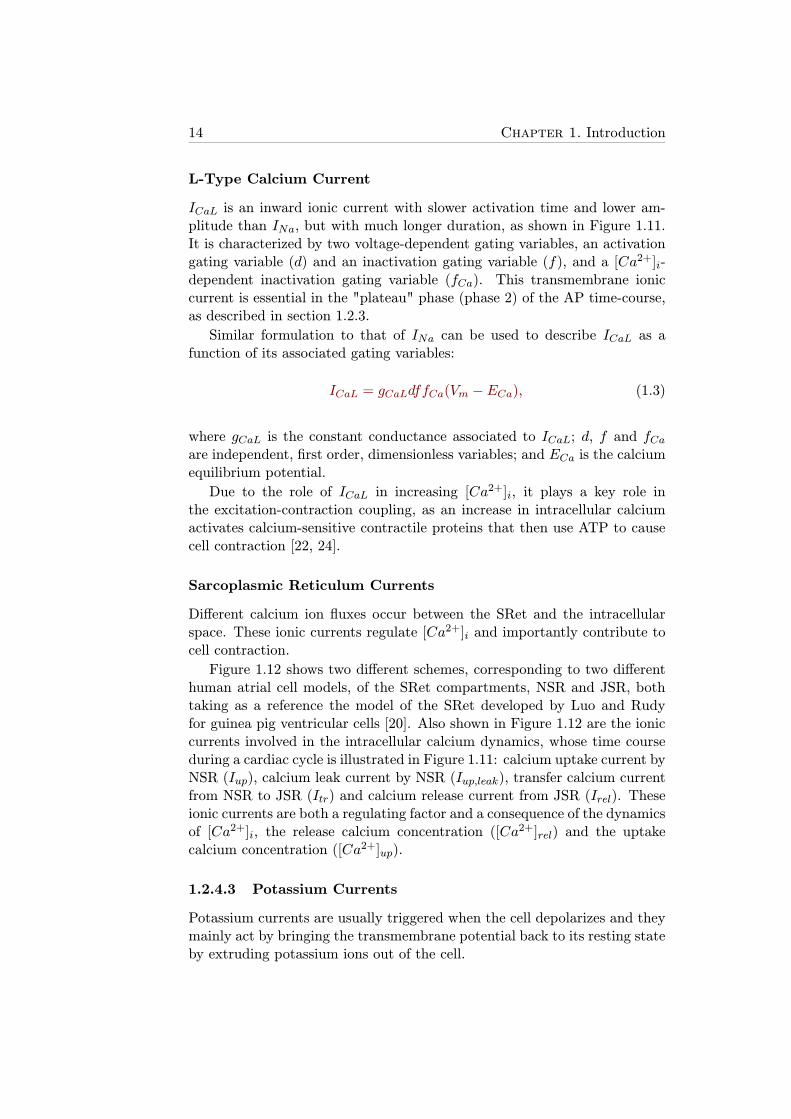
Different calcium ion fluxes occur between the SRet and the intracellularspace. These ionic currents regulate [Ca2+]i and importantly contribute tocell contraction.
Figure 1.12 shows two different schemes, corresponding to two differenthuman atrial cell models, of the SRet compartments, NSR and JSR, bothtaking as a reference the model of the SRet developed by Luo and Rudyfor guinea pig ventricular cells [20]. Also shown in Figure 1.12 are the ioniccurrents involved in the intracellular calcium dynamics, whose time courseduring a cardiac cycle is illustrated in Figure 1.11: calcium uptake current byNSR (Iup), calcium leak current by NSR (Iup,leak), transfer calcium currentfrom NSR to JSR (Itr) and calcium release current from JSR (Irel). Theseionic currents are both a regulating factor and a consequence of the dynamicsof [Ca2+]i, the release calcium concentration ([Ca
2+]rel) and the uptakecalcium concentration ([Ca2+]up).
1.2.4.3 Potassium Currents
Potassium currents are usually triggered when the cell depolarizes and theymainly act by bringing the transmembrane potential back to its resting stateby extruding potassium ions out of the cell.
1.2. Electrical Activity of the Heart 15
Figure 1.12: Schematic representation of ionic currents and SRet compart-ments in human atrial cardiomyocytes according to the Courtemanche et al.model (A, modified from [15]) and the Nygren et al. model (B, modifiedfrom [13])
Human atrial cells present different types of potassium channels in termsof structure and kinetics, thus evoking different ionic potassium currents[19, 25, 26]: transient outward potassium current (Ito), ultrarapid delayedrectifier potassium current (IKur, also known as sustained outward potas-sium current), IKr, IKs and inward rectifier potassium current (IK1).
Furthermore, certain ion channels react to changes in the concentra-tion of specific neurotransmitters from the parasympathetic system such asacetylcholine (ACh) [27]. The effects of an increase in the ACh concentra-tion ([ACh]), which alter the AP duration (APD) and morphology, can bemodeled through an acetylcholine-activated potassium current (IKACh) [28].
Transient Outward Potassium Current
Ito is a large amplitude outward potassium current characterized by a veryshort duration as a result of very fast kinetics of both activation and in-activation (Figure 1.13). Ito activates when the transmembrane potentialreaches positive values and acts to decrease Vm it at the same time thatICaL acts to increase it. The interaction of these two currents and IKur maylead to the spike-and-dome morphology that some human atrial APs present[14].
The formulation of Ito includes one activation gating variable (oa) andone inactivation gating variable (oi):
16 Chapter 1. Introduction
Figure 1.13: Simulated human atrial potassium currents measured duringthe last cardiac cycle following a train of periodic stimuli every 1 second for20 minutes: Ito, IKur, IKr, IKs and IK1.
1.2. Electrical Activity of the Heart 17
Ito = gtoo3aoi(Vm − EK), (1.4)
where gto is the constant conductance associated to Ito; oa and oi are in-dependent, first order, dimensionless variables; and EK is the potassiumequilibrium potential. Note that oa is raised to the third power, meaningthat activation kinetics are modeled through three gating variables of thesame type.
Ultrarapid Delayed Rectifier Potassium Current
IKur, also known as sustained outward potassium current, is an outwardpotassium current with activation kinetics similar to those of Ito but sig-nificantly slower inactivation gating variables, thus prolonging its duration(Figure 1.13). IKur is an atrial-specific current, with its expression in ven-tricular cardiomyocytes being almost negligible [29].
The IKur formulation is similar to that of Ito:
IKur = gKuru3aui(Vm − EK), (1.5)
where gKur is the constant conductance associated to IKur; and ua and uiare independent, first order, dimensionless variables. Note that ua is raisedto the third power, meaning that activation kinetics are modeled throughthree gating variables of the same type.
Rapid and Slow Delayed Rectifier Potassium Currents
Human atrial cardiomyocytes present two types of delayed rectifier potas-sium currents according to their activation kinetics: IKr, the rapid delayedrectifier potassium current, and IKs, the slow delayed rectifier potassiumcurrent [26]. IKr-associated channels, also known as hERG channels, startopening at more negative Vm than those associated with IKs (Figure 1.13).Both ionic currents have activation gating variables, xr for IKr and xs forIKs, and can be modeled as follows:
IKr =gKrxr(Vm − EK)
1 + eV+1522.4
, (1.6)
IKs = gKsx2s(Vm − EK), (1.7)
where gKr and gKs are the constant conductances associated to IKr andIKs, respectively; and xr and xs are independent, first order, dimensionlessvariables (notice IKs dependence on xs is quadratic, meaning that activation
18 Chapter 1. Introduction
kinetics are modeled through two gating variables of the same type, whileIKr dependence on xr is linear).
Inward Rectifier Potassium Current
IK1 is a time-independent potassium current that remains active during thewhole time-course of the AP including during the resting state [25], as shownin Figure 1.13. The magnitude of IK1 only reaches values close to 0 whenVm takes positive values. IK1 can be modeled as follows:
IK1 =gK1(Vm − EK)1 + e0.07(V+80)
, (1.8)
where gK1 is the constant conductance associated to IK1. Notice there areno time-dependent gating variables in equation 1.8, in contrast with thepreviously described potassium currents.
Acetylcholine-Activated Potassium Current
IKACh is an outward potassium current that accounts for the effects ofparasympathetic stimulation of the human atria. Its magnitude is directlydependent on the [ACh] level [27].
A formulation of IKACh was presented by Kneller et al. [28] based onexperiments in canine atria using carbamylcholine (CBC), whose effects onthe AP are very similar to those caused by ACh:
IKACh =
(10
1 + 9.13652[ACh]0.477811
)(
0.0517 +0.4516
1 + eVm+59.5317.18
)
. (1.9)
Figure 1.14 shows both the relations between the magnitude of IKAChand Vm for different levels of [ACh] in experiments and simulations, andthe correspondence between AP morphology and APD in experiments withCBC and simulations with ACh: [CBC] of 0.1 and 1 μmol/l correspond tothe effects of 0.003 and 0.03μmol/l of [ACh] in the model [28].
1.2.4.4 Electrogenic Pumps
Specific types of transport proteins located in the cellular membrane act tomaintain differences in ion concentrations between the extracellular and theintracellular spaces, thus counteracting the effects produced by the rest ofionic currents. These ionic mechanisms are known as electrogenic pumpssince they generate electricity by producing a net movement of positivecharge out of a cell. In contrast with the rest of ionic currents, electro-genic pumps need energy to work, usually obtained via the hydrolisis ofATP molecules.
1.2. Electrical Activity of the Heart 19
Figure 1.14: A: IKACh intensity-voltage relations (data points are mean±standard deviation) in both experiments with different [ACh] levels (colorsymbols) and with the equation 1.9 (red lines). B and C: Comparison ofcanine atrial experiments (left) and canine atrial model (right) AP duration(top) and morphology (bottom) (modified from [28]).
Human atrial cardiomyocytes present two main electrogenic pumps: thesodium/potassium pump (NaK pump) and the calcium pump (Ca pump).
Sodium/Potassium Pump
The NaK pump is key in diverse physiological functions of excitable cellssuch as maintaining osmolarity between extracellular and intracellular spacesto control cell volume, maintaining the gradients of sodium and potassiumion concentrations and regulating RMP [30, 31].
Regarding the ion transport mechanism, the protein transports 2 potas-sium ions into the cell while pumps out 3 sodium ions, thus generating anoutward positive ion flux which generates an ionic current, INaK , which isshown in Figure 1.15 (top panel). INaK is modeled by the following generalequation firstly used by Luo and Rudy in a guinea pig ventricular myocytemodel [20]:
INaK = pNaK
([Na+]i
[Na+]i +Km,Na
)γNa ( [K+]i[K+]i +Km,K
)γKfv, (1.10)
where pNaK represents the maximum NaK pump permeability; Km,Na andKm,K are the half affinity constants of sodium and potassium, respectively;[Na+]i and [K
+]i are the intracellular sodium and potassium concentrations,respectively; γNa and γK are the Hill coefficients for each ion; and fv is aparticular Vm-dependent function.
20 Chapter 1. Introduction
Figure 1.15: Simulated human atrial sodium/potassium pump current(INaK , top panel) and sodium/calcium exchanger current (INaCa, bottompanel) measured during the last cardiac cycle following a train of periodicstimuli every 1 second for 20 minutes.
Calcium Pump
The most important function of the Ca pump is to maintain [Ca2+]i atphysiological levels. The pump current formulation is given by:
IpCa = IpCa,max[Ca2+]i
0.0005 + [Ca2+]i, (1.11)
where IpCa,max is a constant.
1.2.4.5 Ion Exchangers
Another type of active transport protein present in human cardiomyocytesis the sodium/calcium exchanger (NaCa exchanger or NCX).
Sodium-Calcium Exchanger
This protein uses secondary active transport to extrude calcium out of thecell, meaning it does not use energy from ATP but from the electrochemicalgradient between the extracellular and the intracellular sodium concentra-tions ([Na+]o >> [Na
+]i) [32, 33]. The sodium/calcium exchanger mainlyacts to regulate calcium ion homeostasis in the myocardium [33]. In its
1.2. Electrical Activity of the Heart 21
forward mode, extrusion of one calcium ion is coupled with the entry ofthree sodium ions, thus generating a net inward current, whereas in its re-verse mode it generates an outward current to counteract the increase in[Na+]i produced when the cell depolarizes (see Figure 1.15). Equation 1.12represents this behavior:
INaCa = KNaCa(eγ
VmFRT [Na+]3i [Ca
2+]o − e(γ−1)VmFRT [Na+]3o[Ca
2+]i
(K3m,Na + [Na+]3o)(Km,Ca + [Ca
2+]o)(1 + ksate(γ−1)VmF
RT ),
(1.12)
where KNaCa is a constant that modulates the maximum amplitude ofINaCa; γ, F, R, T and ksat are constants; Km,Ca is the half affinity constantof calcium; [Ca2+]o is the extracellular calcium concentration, respectively.
1.2.4.6 Background Currents
The main purpose of both background sodium leak current and backgroundcalcium leak current is to maintain stable [Na+]i and [Ca
2+]i, respectively,at rest. These ionic currents are modeled as follows:
Ib,Na = gbNa(Vm − ENa), (1.13)
Ib,Ca = gbCa(Vm − ECa), (1.14)
where gbNa and gbCa are the constant conductances associated to IbNa andIbCa.
1.2.5 Ionic Concentrations
Both intracellular and extracellular spaces present notable differences intheir chemical composition, mainly in the ionic concentrations of sodium(Na+), potassium (K+) and calcium (Ca2+) (Figure 1.16). These ionicconcentration gradients are essential for ion transport between the intra-cellular and the extracellular spaces, thus generating the different currentsdescribed in previous sections.
The time course of all the ionic concentrations is determined by the netflux of ions of each type as a result of the ionic currents flowing between theextracellular and intracellular spaces.
1.2.5.1 Sodium Concentrations
[Na+]o in human atrial cardiomyocytes is usually modeled as a constantvalue of about 140 mM. Regarding [Na+]i, its reference value is about 13mM whereas its variations over time depend on the inward sodium currents
22 Chapter 1. Introduction
Figure 1.16: Schematic view of a human atrial cardiomyocyte and the mostimportant ionic concentration gradients: K+ (blue), Ca2+ (red) and Na+
(black).
as well as the NaK pump ionic current and the NaCa exchanger ioniccurrent:
d[Na+]idt
=−INa − Ib,Na − 3INaK − 3INaCa
FVi, (1.15)
where Vi is a constant accounting for the volume of a single cell. Notethat both INaK and INaCa are multiplied by 3 since their respective ioninterchanges involve 3 sodium ions in exchange for 2 potassium ions or onecalcium ion, respectively.
1.2.5.2 Potassium Concentrations
Similarly to sodium concentrations, [K+]o in human atrial cardiomyocytesis also modeled as a constant value of about 5 mM. Regarding [K+]i, itsreference value is about 135 mM whereas its variations over time depend onthe outward potassium currents as well as the NaK pump ionic current:
d[K+]idt
=−Ito − IKur − IK1 − IKr − IKs + 2INaK
FVi, (1.16)
where, as stated in the previous section, INaK is multiplied by 2 due tothe number of potassium ions that flow from the extracellular space to theintracellular space in exchange for 3 sodium ions.
1.2. Electrical Activity of the Heart 23
Importantly, some human atrial cell models include the external stim-ulation current in the calculation of potassium concentration, such as theMaleckar et al. model [18], since previous studies showed this preventedother electrophysiological properties from reaching values out of physiologi-cal range [34].
1.2.5.3 Calcium Concentrations
[Ca2+]o in human atrial cardiomyocyte models is about 1.8 mM. As regards[Ca2+]i, its values are significantly lower than those of sodium and potassium(about 0.1 μM), but its variations over a cardiac cycle are significant. Thetime course of [Ca2+]i is known as calcium transient (CaT) and is closelyrelated to muscular cell contraction. The dynamics involved in [Ca2+]i reg-ulation are much more complex than those in [Na+]i and [K
+]i because,apart from calcium transmembrane current flows, the leakage and storageof calcium ions in the SRet play a very important role.
Following the formulation proposed by Courtemanche et al. [15], varia-tions in [Ca2+]i can be obtained by:
d[Ca2+]idt
=
−ICaL−IpCa−Ib,Ca+2INaCa2FVi
+Vup(Iup,leak−Iup)+IrelVrel
Vi
1 +[Trpn]maxKm,Trpn([Ca2+]i+Km,Trpn)2
+[Cmdn]maxKm,Cmdn([Ca2+]i+Km,Cmdn)2
, (1.17)
where Vrel and Vup are the volumes of the SRet release and uptake com-partments, respectively; and [Trpn]max, Km,Trpn, [Cmdn]max and Km,Cmdnare constants standing for troponin and calmodulin calcium buffering in thecytoplasm, as in previous models [20, 35].
Furthermore, an increase in the calcium concentration of the calcium up-take compartment in the SRet, [Ca2+]up, through the net flux of calciumions entering NSR (Iup-Iup,leak), acts to decrease [Ca
2+]i, while the gradi-ent between the calcium concentration of the calcium release compartment,[Ca2+]rel, and [Ca
2+]i generates a calcium release current from the SRet,Irel, that acts to increase [Ca
2+]i. Therefore, calcium concentrations in theSRet compartments have strong influence in intracellular calcium dynamicsplaying an important role in cardiac cell contraction.
1.2.5.4 Other Ionic Concentrations
Extracellular and intracellular concentrations of other ions different fromsodium, potassium and calcium are almost negligible in healthy human car-diac cells. Only atrial chlorine-activated currents are notable under certainconditions [36]. However, cardiac cells in other animal species, such as rab-bit and dog, present chlorine ions both inside and outside the cytoplasm andalso transmembrane ionic currents transporting them [37, 38].
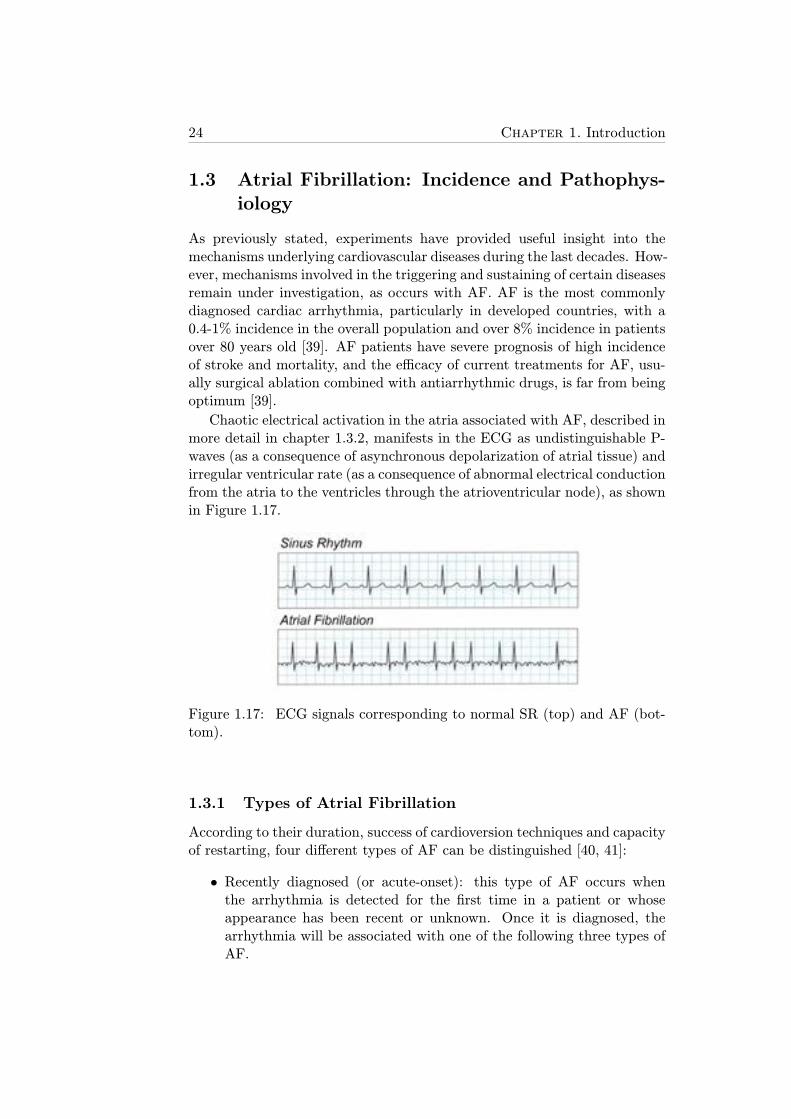
24 Chapter 1. Introduction
1.3 Atrial Fibrillation: Incidence and Pathophys-iology
As previously stated, experiments have provided useful insight into themechanisms underlying cardiovascular diseases during the last decades. How-ever, mechanisms involved in the triggering and sustaining of certain diseasesremain under investigation, as occurs with AF. AF is the most commonlydiagnosed cardiac arrhythmia, particularly in developed countries, with a0.4-1% incidence in the overall population and over 8% incidence in patientsover 80 years old [39]. AF patients have severe prognosis of high incidenceof stroke and mortality, and the efficacy of current treatments for AF, usu-ally surgical ablation combined with antiarrhythmic drugs, is far from beingoptimum [39].
Chaotic electrical activation in the atria associated with AF, described inmore detail in chapter 1.3.2, manifests in the ECG as undistinguishable P-waves (as a consequence of asynchronous depolarization of atrial tissue) andirregular ventricular rate (as a consequence of abnormal electrical conductionfrom the atria to the ventricles through the atrioventricular node), as shownin Figure 1.17.
Figure 1.17: ECG signals corresponding to normal SR (top) and AF (bot-tom).
1.3.1 Types of Atrial Fibrillation
According to their duration, success of cardioversion techniques and capacityof restarting, four different types of AF can be distinguished [40, 41]:
• Recently diagnosed (or acute-onset): this type of AF occurs whenthe arrhythmia is detected for the first time in a patient or whoseappearance has been recent or unknown. Once it is diagnosed, thearrhythmia will be associated with one of the following three types ofAF.
1.3. Atrial Fibrillation: Incidence and Pathophysiology 25
• Paroxysmal: it is characterized by spontaneous recovery of SR gener-ally in less than 24 hours and by definition in less than 7 days. If thepatient suffers two or more paroxysmal AF episodes, the patient couldbe diagnosed with persistent AF.
• Persistent: this type of AF lasts for longer than 7 days until pharma-cological or electrical cardioversion is performed. Persistent AF caneither be the first sign of AF or occur after some episodes of paroxys-mal AF. As occurs in paroxysmal AF, arrhythmic episodes in patientsdiagnosed with persistent AF are likely to be recurrent.
• Chronic (or permanent): in this case, cardioversion fails or the ar-rhythmia restarts in the first 48 hours following cardioversion. Longduration AF where no cardioversion is applied is also classified withinthis group.
This classification of AF categories is internationally accepted [42], but itis not unique. Different authors have reported slight differences in the classi-fying method [43] or included other patient characteristics to distinguish newtypes of AF, such as lone AF (absence of other cardiovascular-related dis-eases), nonvalvular AF (absence of valvular-related diseases) and secondaryAF (consequence of a primary condition, such as myocardial infarction, car-diac surgery...) [40].
1.3.2 Triggering and Maintenance of Atrial Fibrillation
AF is considered to be a reentrant arrhythmia sustained by mechanisms in-cluding rapid ectopic activity (usually generated in pulmonary veins), reen-trant circuits and structural and/or focal changes [44, 45]. Initiation of thearrhythmia is still a matter of debate. It is well established that pulmonaryveins play a crucial role since it is the most frequent area of AF generation[46]. However, there are three main hypotheses regarding the generationand maintenance of permanent AF [47]:
• Multiple reentrant wavelets: AF is generated by various wavefrontsthat spread throughout the excitable atrial tissue (Figure 1.18A).
• Focal hypothesis: AF is maintained by continuous discharge of a veryhigh frequency focal source in or around the pulmonary veins. Fibril-latory conduction is generated when the wavefronts arising from thefocus become fractionated and disorganized in the heterogeneous atrialtissue (Figure 1.18B).
• Rotor hypothesis: AF is triggered by a burst of ectopic beats originat-ing in the pulmonary veins whose wavefronts fragment in the surround-ing tissue generating rotating vortices. One of the vortices becomes

26 Chapter 1. Introduction
stable giving rise to the formation of a functional reentry or rotor thatacts as the main driver of the fibrillatory behavior [45, 48] (Figure1.18C).
Figure 1.18: Schematic view of the hypotheses for AF generation and main-tenance (modified from [47]). A: Multiple reentrant wavelets; B: Focal hy-pothesis; C: Rotor hypothesis.
A combination of the multiple reentrant wavelet hypothesis and the focalhypothesis has also been suggested as a new hypothesis in a recent studythat reported permanent AF to be started and maintained by multiple fociin the atria [49].
Independently of the hypothesis, fibrillatory behavior is favored by shortrefractory periods and slow conduction [50] and enhanced by both electricalremodeling of atrial cell electrophysiology caused by permanent AF [51] andsignificant dilation of atrial cavities leading to fibrosis [52].
1.3.3 Therapies for Arrhythmia Treatment
In clinical practice, two types of treatments are used to manage patientsdiagnosed with cardiac arrhythmias, including AF: pharmacological andnon-pharmacological. Most arrhythmia treatments frequently combine bothtypes.
1.3. Atrial Fibrillation: Incidence and Pathophysiology 27
1.3.3.1 Antiarrhythmic Drugs
A wide range of pharmacological drugs and medicines are available in themarket aimed at preventing arrhythmia from happening, maintaining SR,controlling cardiac frequency, anticoagulating blood or performing a chemi-cal cardioversion.
Properties of antiarrhythmic drugs primarily depend on the receptor theyaffect and, based on their prevailing effects, can be separated into differentcategories according to the Vaughan-Williams classification [53, 54]. There-fore, five principal classes of antiarrhythmic drugs can be distinguished andthe choice depends on the specific type of arrhythmia:
• Class I: antiarrhythmic drugs that block voltage-dependent sodiumchannels. They inhibit INa and thus reduce conduction velocity andcardiac excitability. They are also known as membrane stabilizingagents. This antiarrhythmic drugs are divided into three subclasses de-pending on their kinetics of association/dissociation (see Figure 1.19):
– Class IA: class I drugs with intermediate association/dissocia-tion. They prolong APD, reduce cardiac conductivity and in-crease effective refractory period (RP). They are useful for treat-ing ventricular and supraventricular tachycardia, premature ven-tricular beats and ventricular fibrillation. Examples: quinidineand disopyramide.
– Class IB: class I drugs with fast association/dissociation. Theyshorten APD and decrease refractoriness. They are frequentlyused for preventing ventricular fibrillation and treating both ven-tricular tachycardia and premature ventricular beats. Examples:lidocaine and ranolazine.
– Class IC: class I drugs with slow association/dissociation. Theyreduce cardiac contractility but their effects on APD are negli-gible. Their degree of sodium blocking is the most significant ofthe three subclasses. They are used for treating ventricular tachy-cardia, ventricular fibrillation and atrial fibrillation. Examples:flecainide and propafenone.
• Class II: also known as β-blockers, drugs classified within this classact to block sympathetic activity on the heart. They are useful fortreating supraventricular tachycardia since they reduce electrical con-duction through the atrioventricular node. Examples: propanolol andpronethalol.
• Class III: antiarrhythmic drugs that block potassium channels andtherefore prolong APD and RP. Furthermore, their effects on conduc-tion velocity (CV) are nonexistent, making them effective to prevent
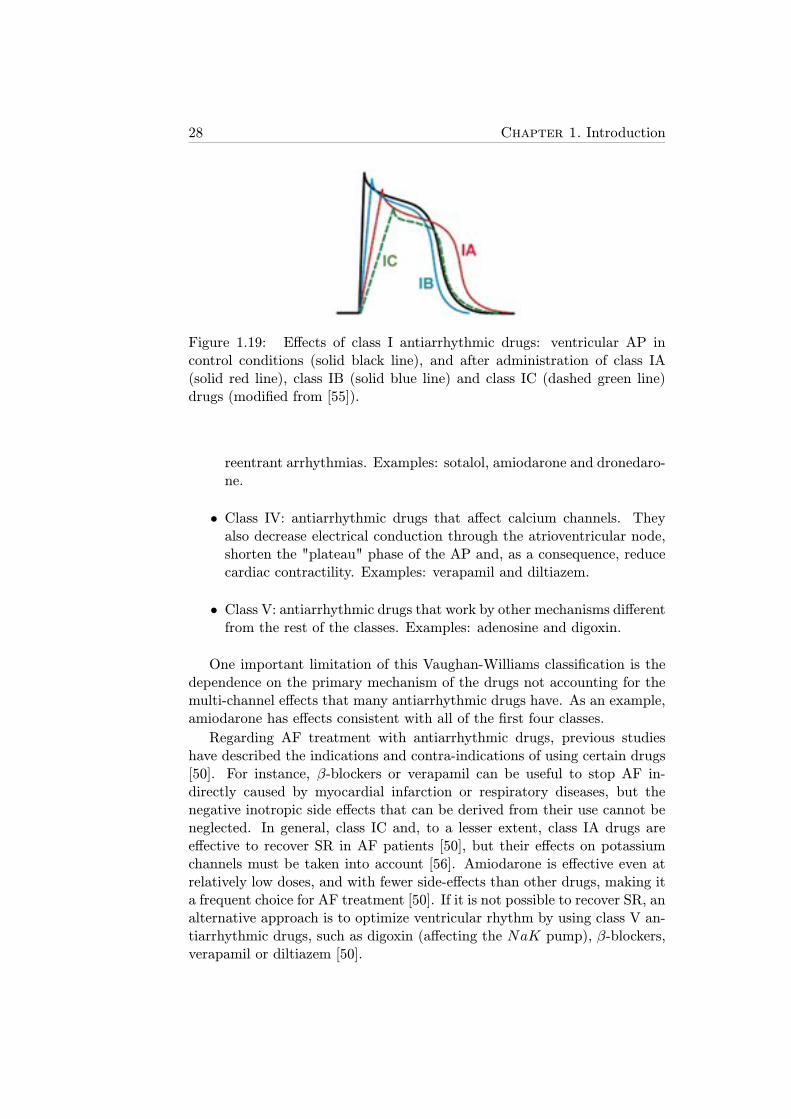
28 Chapter 1. Introduction
Figure 1.19: Effects of class I antiarrhythmic drugs: ventricular AP incontrol conditions (solid black line), and after administration of class IA(solid red line), class IB (solid blue line) and class IC (dashed green line)drugs (modified from [55]).
reentrant arrhythmias. Examples: sotalol, amiodarone and dronedaro-ne.
• Class IV: antiarrhythmic drugs that affect calcium channels. Theyalso decrease electrical conduction through the atrioventricular node,shorten the "plateau" phase of the AP and, as a consequence, reducecardiac contractility. Examples: verapamil and diltiazem.
• Class V: antiarrhythmic drugs that work by other mechanisms differentfrom the rest of the classes. Examples: adenosine and digoxin.
One important limitation of this Vaughan-Williams classification is thedependence on the primary mechanism of the drugs not accounting for themulti-channel effects that many antiarrhythmic drugs have. As an example,amiodarone has effects consistent with all of the first four classes.
Regarding AF treatment with antiarrhythmic drugs, previous studieshave described the indications and contra-indications of using certain drugs[50]. For instance, β-blockers or verapamil can be useful to stop AF in-directly caused by myocardial infarction or respiratory diseases, but thenegative inotropic side effects that can be derived from their use cannot beneglected. In general, class IC and, to a lesser extent, class IA drugs areeffective to recover SR in AF patients [50], but their effects on potassiumchannels must be taken into account [56]. Amiodarone is effective even atrelatively low doses, and with fewer side-effects than other drugs, making ita frequent choice for AF treatment [50]. If it is not possible to recover SR, analternative approach is to optimize ventricular rhythm by using class V an-tiarrhythmic drugs, such as digoxin (affecting the NaK pump), β-blockers,verapamil or diltiazem [50].
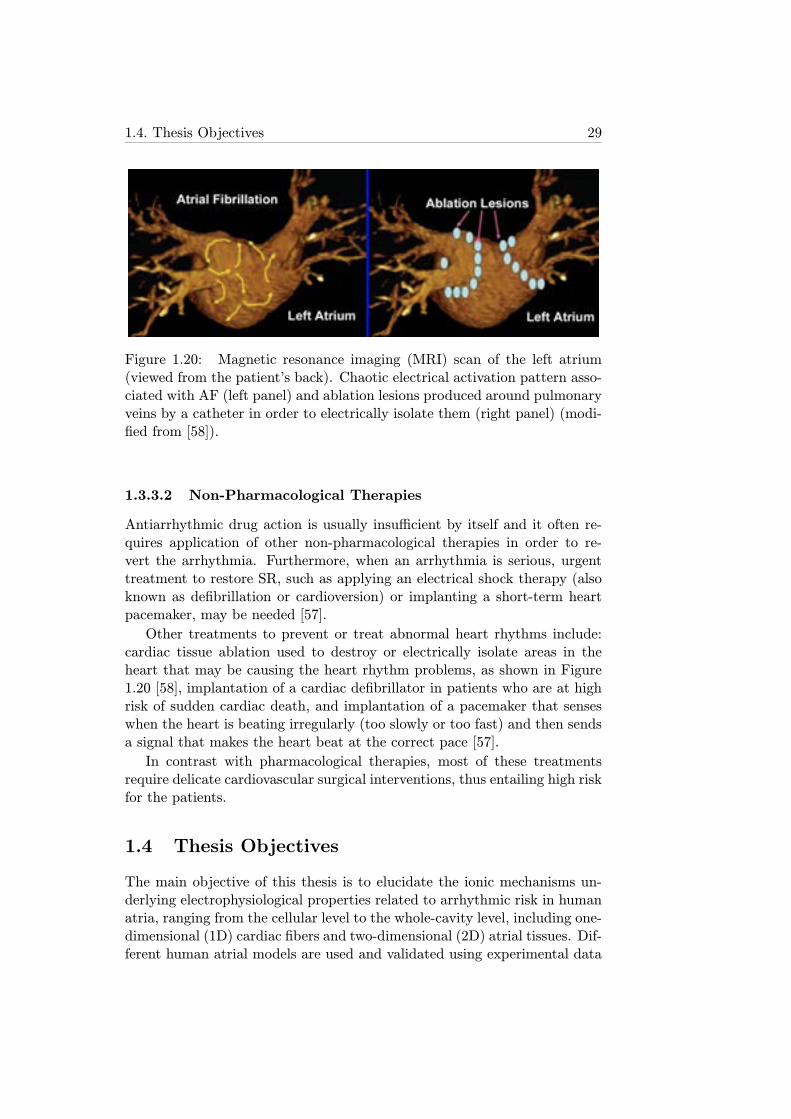
1.4. Thesis Objectives 29
Figure 1.20: Magnetic resonance imaging (MRI) scan of the left atrium(viewed from the patient’s back). Chaotic electrical activation pattern asso-ciated with AF (left panel) and ablation lesions produced around pulmonaryveins by a catheter in order to electrically isolate them (right panel) (modi-fied from [58]).
1.3.3.2 Non-Pharmacological Therapies
Antiarrhythmic drug action is usually insufficient by itself and it often re-quires application of other non-pharmacological therapies in order to re-vert the arrhythmia. Furthermore, when an arrhythmia is serious, urgenttreatment to restore SR, such as applying an electrical shock therapy (alsoknown as defibrillation or cardioversion) or implanting a short-term heartpacemaker, may be needed [57].
Other treatments to prevent or treat abnormal heart rhythms include:cardiac tissue ablation used to destroy or electrically isolate areas in theheart that may be causing the heart rhythm problems, as shown in Figure1.20 [58], implantation of a cardiac defibrillator in patients who are at highrisk of sudden cardiac death, and implantation of a pacemaker that senseswhen the heart is beating irregularly (too slowly or too fast) and then sendsa signal that makes the heart beat at the correct pace [57].
In contrast with pharmacological therapies, most of these treatmentsrequire delicate cardiovascular surgical interventions, thus entailing high riskfor the patients.
1.4 Thesis Objectives
The main objective of this thesis is to elucidate the ionic mechanisms un-derlying electrophysiological properties related to arrhythmic risk in humanatria, ranging from the cellular level to the whole-cavity level, including one-dimensional (1D) cardiac fibers and two-dimensional (2D) atrial tissues. Dif-ferent human atrial models are used and validated using experimental data
30 Chapter 1. Introduction
from both SR patients and patients diagnosed with permanent AF.
Specific objectives of the different parts of this thesis are:
• Elucidate the ionic mechanisms underlying APD adaptation to sud-den changes in heart rate in human atria. Impairment of APD rateadaptation has been reported to be proarrhythmic, but the sources un-derlying the relation to arrhythmic risk remain unclear. In this thesis,APD rate adaptation will be characterized in both individual cells and1D fibers and the relationship with arrhythmic risk will be evaluated.
• Unravel the ionic mechanisms underlying other electrophysiologicalproperties related to arrhythmic risk. These properties are: APD,RMP and APD restitution (APDR) in single cells; CV in 1D fibers;and RP, wavelength (WL) dominant frequency (DF), phase singulari-ties (PS) and vulnerability window (VW) in 2D tissues. The effects ofAF-related remodeling on these properties will be investigated and dif-ferences in the unraveled ionic mechanisms between SR and permanentAF patients will be established.
• Investigate inter-subject variability in APD and AP morphology ofhuman atrial cells from SR and AF patients and elucidate its under-lying ionic sources. The elucidated sources of inter-subject variabilitywill serve to postulate reasons for the different response of differentpatients to anti-AF treatments.
• Analyze arrhythmia-related electrophysiological properties in realisticanatomical human atrial three-dimensional (3D) models of AF pa-tients. Such analysis will aim at providing a full multi-scale charac-terization of the effects of the previously elucidated ionic mechanismsand at investigating the implications on AF dynamics of inter-subjectvariability.
1.5 Thesis Outline
The thesis is organised as follows:
• In Chapter 2, the materials and methods used in the thesis are thor-oughly described. In particular, details are provided about humanatrial electrophysiological cell models, propagation in cardiac tissue,3D human atrial models and computing facilities used to perform andrun the simulations of this thesis.
• Chapter 3 describes the analysis of cardiac memory and its relationto risk in human atria, including the use of different stimulation pro-tocols and arrhythmia-related markers. Two different human atrial
1.5. Thesis Outline 31
cell models are used for the investigations. Differences between car-diac memory, and underlying mechanisms, in atrial and ventricularmyocytes are analyzed. To extend cell results, cardiac memory in 1Dfibers is additionally investigated. The results of this chapter werepresented at an international conference:
– C. Sanchez, E. Pueyo, P. Laguna and B. Rodrıguez. CardiacMemory in Human Atria and Relation to Arrhythmogenesis. Com-puters in Cardiology, Park City (Utah, USA), September 2009,vol. 36, pp. 81-84.
• Chapter 4 presents the analysis of human atrial electrophysiologicalproperties in single cells, 1D fibers and 2D tissues. The role of ioniccurrents in the modulation of each property is evaluated by performinga sensitivity analysis, with particular focus on the temporal adaptationof the investigated properties. Furthermore, the combined effects ofalterations in ionic currents on vulnerability to arrhythmias are shown.These results were published in two scientific journals and three con-ference proceedings:
– C. Sanchez, A. Corrias, A. Bueno-Orovio, P. Laguna, M. Davies,J. Swinton, I. Jacobson, E. Pueyo and B. Rodrıguez. The Na+/K+Pump is an Important Modulator of Atrial Refractoriness and Ro-tor Dynamics in Human Atria.Am J Physiol Heart Circ Physiol,vol. 302, pp. H1146-H1159, 2012.
– A. Bueno-Orovio, C. Sanchez, E. Pueyo and B. Rodrıguez. Na/KPump Regulation of Cardiac Repolarization: Insights from a Sys-tems Biology Approach. Pflugers Arch Eur J Physiol, vol. 466,pp. 183-193, 2014.
– C. Sanchez, A. Corrias, P. Laguna, M. Davies, J. Swinton, I. Ja-cobson, E. Pueyo and B. Rodrıguez. Sensititivity of Atrial Fibril-lation Related Biomarkers to Changes in Ionic Current Proper-ties. Heart Rhythm Society Scientific Sessions, Denver (Colorado,USA), May 2010, vol. 7, no 5, pp. S227.
– C. Sanchez, A. Corrias, P. Laguna, M. Davies, J. Swinton, I. Ja-cobson, E. Pueyo and B. Rodrıguez. Potential PharmacologicalTherapies for Atrial Fibrillation. A Computational Study. Com-puting in Cardiology, Belfast (Northern Ireland, United King-dom), September 2010, vol. 37, pp. 413-416.
– C. Sanchez, B. Rodrıguez and E. Pueyo. Ionic Modulators ofElectrophysiology and Re-entry Properties in Human Atria. Com-puting in Cardiology, Hangzhou (China), September 2011, vol.38, pp. 77-80.
32 Chapter 1. Introduction
• In Chapter 5, inter-subject variability in APD and AP morphology andits underlying ionic mechanisms are described. Populations of atrialcell models are constructed to simulate AP variability and are cali-brated with experimental measurements. Multi-parametric regressiontechniques are used to investigate combined effects of ionic currents.The results of this chapter were published in a scientific journal andwere presented at two conferences:
– C. Sanchez, A. Bueno-Orovio, E. Wettwer, S. Loose, J. Simon, U.Ravens, E. Pueyo and B. Rodriguez. Inter-subject Variability inHuman Atrial Action Potential in Sinus Rhythm versus chronicAtrial Fibrillation. PLoS ONE, 2014, (submitted).
– C. Sanchez, A. Bueno-Orovio, E. Pueyo and B. Rodrıguez. Anal-ysis of Populations of Human Atrial Models Reveals the RelativeImportance of Ionic Conductances in the Different Stages of Re-polarization. 36th meeting of the European Working Group ofCardiac Cellular Electrophysiology, Nantes (France), September2012.
– C. Sanchez, A. Bueno-Orovio, E. Pueyo and B. Rodrıguez. Anal-ysis of Populations of Human Atrial Models Reveals the RelativeImportance of Ionic Conductances in the Different Stages of Re-polarization. Gordon Research Conference: Cardiac ArrhythmiaMechanisms, Ventura (California, USA), February 2013.
• Chapter 6 shows the influence of ionic mechanisms on atrial fibrilla-tion dynamics simulated in human atrial 3D models. This influenceis investigated by calculating arrhythmic markers from pEGM signalsrecorded on the atrial surface. Inter-subject variability is included bygenerating 3D models with different cell repolarization dynamics. Sim-ulation results are compared with measurements and obtained from theanalysis of EGM recordings of permanent AF patients. This work isprepared to be published in a scientific journal and was presented attwo international conferences:
– C. Sanchez, A. Bueno-Orovio, M. W. Krueger, G. Seemann, O.Dossel, E. Pueyo and B. Rodrıguez. Ionic Modulation of AtrialFibrillation Dynamics in Heterogeneous Human 3D Virtual Atriawith Repolarization Variability. (in preparation).
– C. Sanchez, M. W. Krueger, G. Seemann, O. Dossel, E. Pueyo andB. Rodrıguez. Ionic Modulation of Atrial Fibrillation Dynamicsin a Human 3D Atrial Model. Computing in Cardiology, Krakow(Poland), September 2012, vol. 39, pp. 137-140.

1.5. Thesis Outline 33
– C. Sanchez, A. Bueno-Orovio, E. Pueyo and B. Rodrıguez. CellRepolarization Variability Modulates Atrial Fibrillation Dynam-ics in 3D Virtual Human Atria. Computing in Cardiology, Zaragoza(Spain), September 2013, vol. 40, pp. 911-914.
• Finally, Chapter 7 presents the most important conclusions drawn inthe thesis and reproduces the principal characteristics of Ca2+ dy-namics possible future research lines.

Chapter 2
General Materials andMethods
In this chapter, general materials and methods used in the following chaptersare described. In particular, the materials explained here include the humanatrial cell computational models and the 3D human atrial model, whereasthe methods include the propagation model, the numerical techniques andthe computing resources. Specific simulations, signal processing methodsand experimental data will be described in detail in each chapter.
2.1 Materials
2.1.1 Cardiac Computational Models
In this thesis, different cardiac computational models have been used tosimulate electrical behavior in human atria. They can be separated intothree categories: cell, 1D and 2D tissue and 3D whole-atrial models.
2.1.1.1 Human Atrial Electrophysiological Cell Models
To date, there are five main human atrial electrophysiological cell models inthe literature, four of which have been used during the course of this thesis:the Courtemanche et al. [15], the Nygren et al. [13], the Maleckar et al.[18] and the Grandi et al. [16] models. The Koivumaki et al. model [17] isthe most recently developed model and the main novelty of this model withrespect to the others is its high accuracy to reproduce the principal charac-teristics of calcium dynamics, useful to investigate the excitation-contractioncoupling in human atrial myocytes. This has not been studied in this thesisand therefore this model has not been used. For simplicity, the models willbe referred to in the text by their first author’s names.
All of these models provide detailed descriptions of human atrial cellular
35
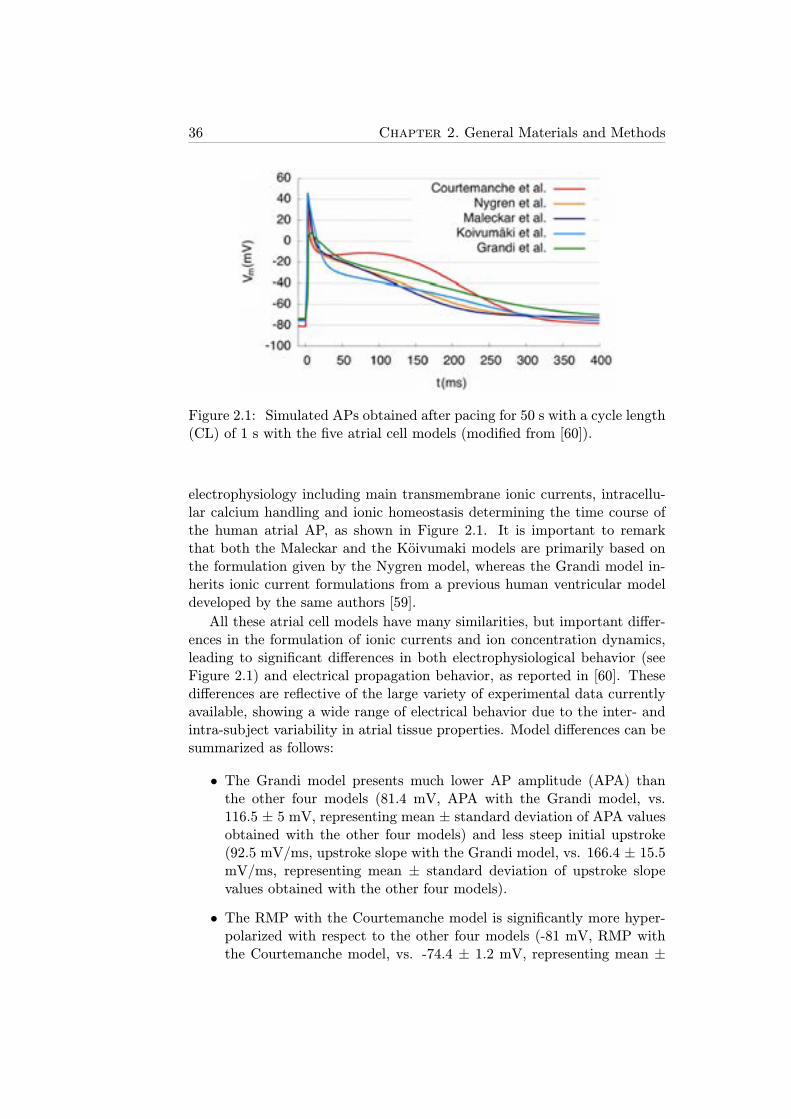
36 Chapter 2. General Materials and Methods
Figure 2.1: Simulated APs obtained after pacing for 50 s with a cycle length(CL) of 1 s with the five atrial cell models (modified from [60]).
electrophysiology including main transmembrane ionic currents, intracellu-lar calcium handling and ionic homeostasis determining the time course ofthe human atrial AP, as shown in Figure 2.1. It is important to remarkthat both the Maleckar and the Koivumaki models are primarily based onthe formulation given by the Nygren model, whereas the Grandi model in-herits ionic current formulations from a previous human ventricular modeldeveloped by the same authors [59].
All these atrial cell models have many similarities, but important differ-ences in the formulation of ionic currents and ion concentration dynamics,leading to significant differences in both electrophysiological behavior (seeFigure 2.1) and electrical propagation behavior, as reported in [60]. Thesedifferences are reflective of the large variety of experimental data currentlyavailable, showing a wide range of electrical behavior due to the inter- andintra-subject variability in atrial tissue properties. Model differences can besummarized as follows:
• The Grandi model presents much lower AP amplitude (APA) thanthe other four models (81.4 mV, APA with the Grandi model, vs.116.5 ± 5 mV, representing mean ± standard deviation of APA valuesobtained with the other four models) and less steep initial upstroke(92.5 mV/ms, upstroke slope with the Grandi model, vs. 166.4 ± 15.5mV/ms, representing mean ± standard deviation of upstroke slopevalues obtained with the other four models).
• The RMP with the Courtemanche model is significantly more hyper-polarized with respect to the other four models (-81 mV, RMP withthe Courtemanche model, vs. -74.4 ± 1.2 mV, representing mean ±
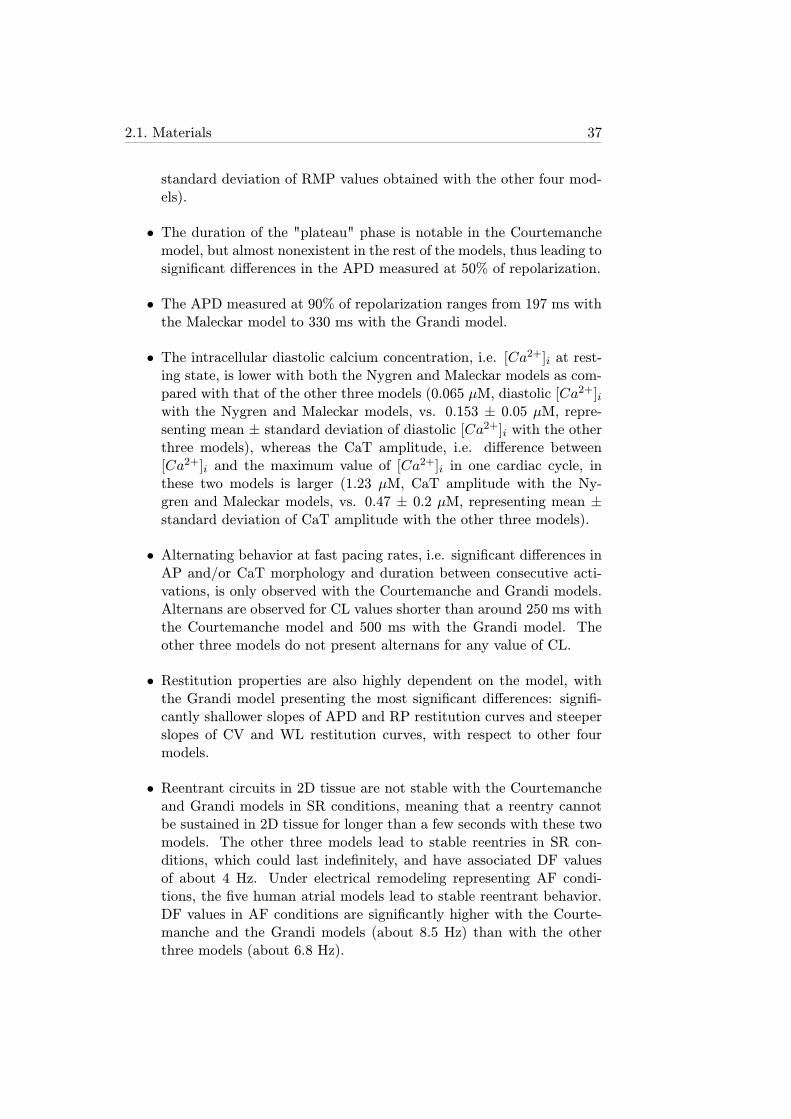
2.1. Materials 37
standard deviation of RMP values obtained with the other four mod-els).
• The duration of the "plateau" phase is notable in the Courtemanchemodel, but almost nonexistent in the rest of the models, thus leading tosignificant differences in the APD measured at 50% of repolarization.
• The APD measured at 90% of repolarization ranges from 197 ms withthe Maleckar model to 330 ms with the Grandi model.
• The intracellular diastolic calcium concentration, i.e. [Ca2+]i at rest-ing state, is lower with both the Nygren and Maleckar models as com-pared with that of the other three models (0.065 μM, diastolic [Ca2+]iwith the Nygren and Maleckar models, vs. 0.153 ± 0.05 μM, repre-senting mean ± standard deviation of diastolic [Ca2+]i with the otherthree models), whereas the CaT amplitude, i.e. difference between[Ca2+]i and the maximum value of [Ca
2+]i in one cardiac cycle, inthese two models is larger (1.23 μM, CaT amplitude with the Ny-gren and Maleckar models, vs. 0.47 ± 0.2 μM, representing mean ±standard deviation of CaT amplitude with the other three models).
• Alternating behavior at fast pacing rates, i.e. significant differences inAP and/or CaT morphology and duration between consecutive acti-vations, is only observed with the Courtemanche and Grandi models.Alternans are observed for CL values shorter than around 250 ms withthe Courtemanche model and 500 ms with the Grandi model. Theother three models do not present alternans for any value of CL.
• Restitution properties are also highly dependent on the model, withthe Grandi model presenting the most significant differences: signifi-cantly shallower slopes of APD and RP restitution curves and steeperslopes of CV and WL restitution curves, with respect to other fourmodels.
• Reentrant circuits in 2D tissue are not stable with the Courtemancheand Grandi models in SR conditions, meaning that a reentry cannotbe sustained in 2D tissue for longer than a few seconds with these twomodels. The other three models lead to stable reentries in SR con-ditions, which could last indefinitely, and have associated DF valuesof about 4 Hz. Under electrical remodeling representing AF condi-tions, the five human atrial models lead to stable reentrant behavior.DF values in AF conditions are significantly higher with the Courte-manche and the Grandi models (about 8.5 Hz) than with the otherthree models (about 6.8 Hz).
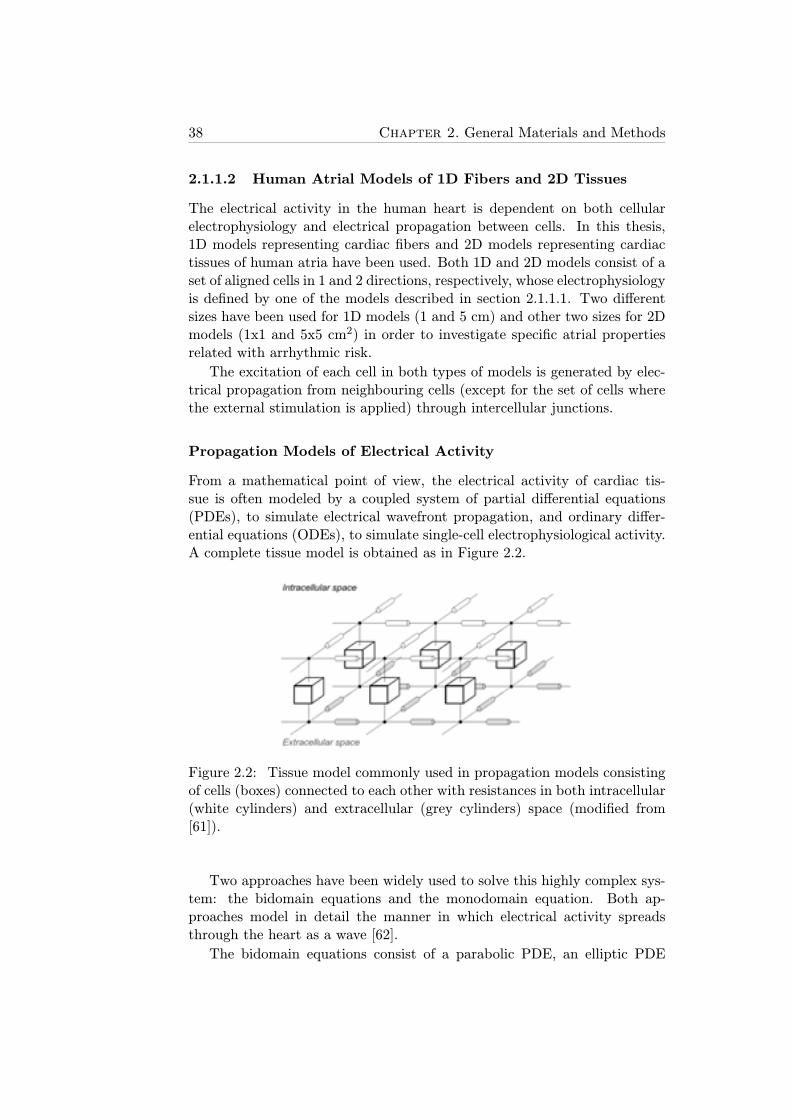
38 Chapter 2. General Materials and Methods
2.1.1.2 Human Atrial Models of 1D Fibers and 2D Tissues
The electrical activity in the human heart is dependent on both cellularelectrophysiology and electrical propagation between cells. In this thesis,1D models representing cardiac fibers and 2D models representing cardiactissues of human atria have been used. Both 1D and 2D models consist of aset of aligned cells in 1 and 2 directions, respectively, whose electrophysiologyis defined by one of the models described in section 2.1.1.1. Two differentsizes have been used for 1D models (1 and 5 cm) and other two sizes for 2Dmodels (1x1 and 5x5 cm2) in order to investigate specific atrial propertiesrelated with arrhythmic risk.
The excitation of each cell in both types of models is generated by elec-trical propagation from neighbouring cells (except for the set of cells wherethe external stimulation is applied) through intercellular junctions.
Propagation Models of Electrical Activity
From a mathematical point of view, the electrical activity of cardiac tis-sue is often modeled by a coupled system of partial differential equations(PDEs), to simulate electrical wavefront propagation, and ordinary differ-ential equations (ODEs), to simulate single-cell electrophysiological activity.A complete tissue model is obtained as in Figure 2.2.
Figure 2.2: Tissue model commonly used in propagation models consistingof cells (boxes) connected to each other with resistances in both intracellular(white cylinders) and extracellular (grey cylinders) space (modified from[61]).
Two approaches have been widely used to solve this highly complex sys-tem: the bidomain equations and the monodomain equation. Both ap-proaches model in detail the manner in which electrical activity spreadsthrough the heart as a wave [62].
The bidomain equations consist of a parabolic PDE, an elliptic PDE
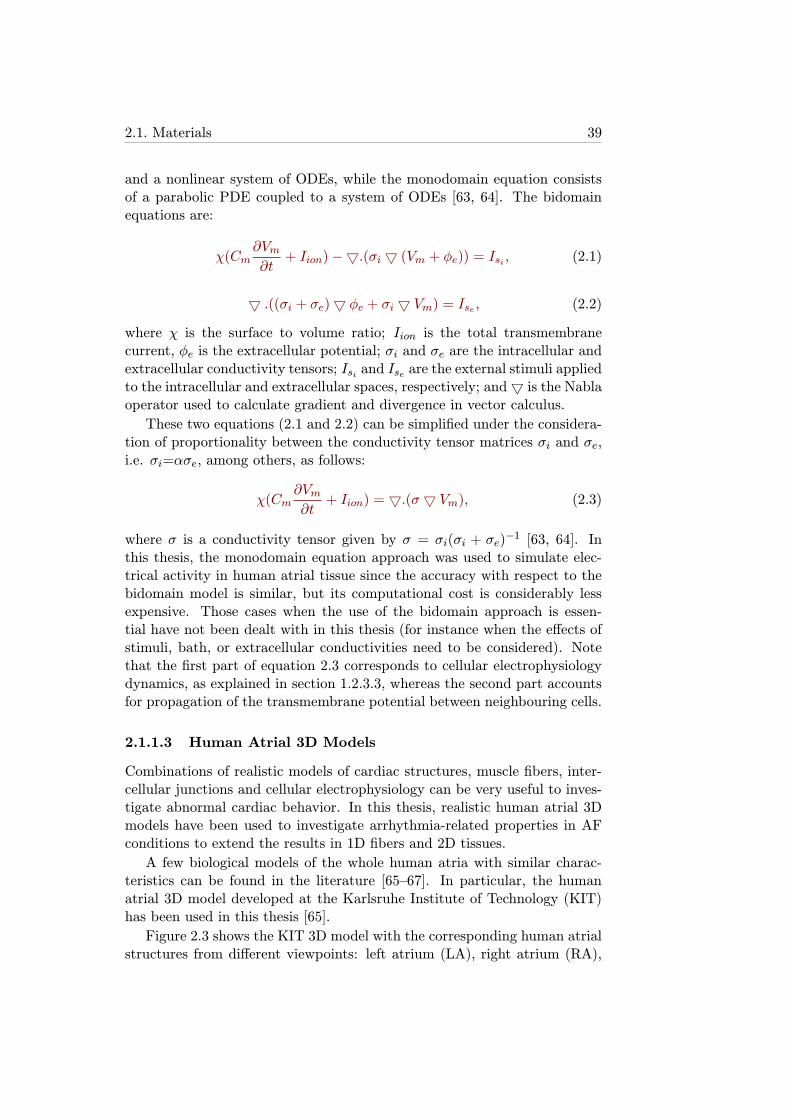
2.1. Materials 39
and a nonlinear system of ODEs, while the monodomain equation consistsof a parabolic PDE coupled to a system of ODEs [63, 64]. The bidomainequations are:
χ(Cm∂Vm∂t+ Iion)−5.(σi 5 (Vm + φe)) = Isi , (2.1)
5 .((σi + σe)5 φe + σi 5 Vm) = Ise , (2.2)
where χ is the surface to volume ratio; Iion is the total transmembranecurrent, φe is the extracellular potential; σi and σe are the intracellular andextracellular conductivity tensors; Isi and Ise are the external stimuli appliedto the intracellular and extracellular spaces, respectively; and5 is the Nablaoperator used to calculate gradient and divergence in vector calculus.
These two equations (2.1 and 2.2) can be simplified under the considera-tion of proportionality between the conductivity tensor matrices σi and σe,i.e. σi=ασe, among others, as follows:
χ(Cm∂Vm∂t+ Iion) = 5.(σ5 Vm), (2.3)
where σ is a conductivity tensor given by σ = σi(σi + σe)−1 [63, 64]. In
this thesis, the monodomain equation approach was used to simulate elec-trical activity in human atrial tissue since the accuracy with respect to thebidomain model is similar, but its computational cost is considerably lessexpensive. Those cases when the use of the bidomain approach is essen-tial have not been dealt with in this thesis (for instance when the effects ofstimuli, bath, or extracellular conductivities need to be considered). Notethat the first part of equation 2.3 corresponds to cellular electrophysiologydynamics, as explained in section 1.2.3.3, whereas the second part accountsfor propagation of the transmembrane potential between neighbouring cells.
2.1.1.3 Human Atrial 3D Models
Combinations of realistic models of cardiac structures, muscle fibers, inter-cellular junctions and cellular electrophysiology can be very useful to inves-tigate abnormal cardiac behavior. In this thesis, realistic human atrial 3Dmodels have been used to investigate arrhythmia-related properties in AFconditions to extend the results in 1D fibers and 2D tissues.
A few biological models of the whole human atria with similar charac-teristics can be found in the literature [65–67]. In particular, the humanatrial 3D model developed at the Karlsruhe Institute of Technology (KIT)has been used in this thesis [65].
Figure 2.3 shows the KIT 3D model with the corresponding human atrialstructures from different viewpoints: left atrium (LA), right atrium (RA),
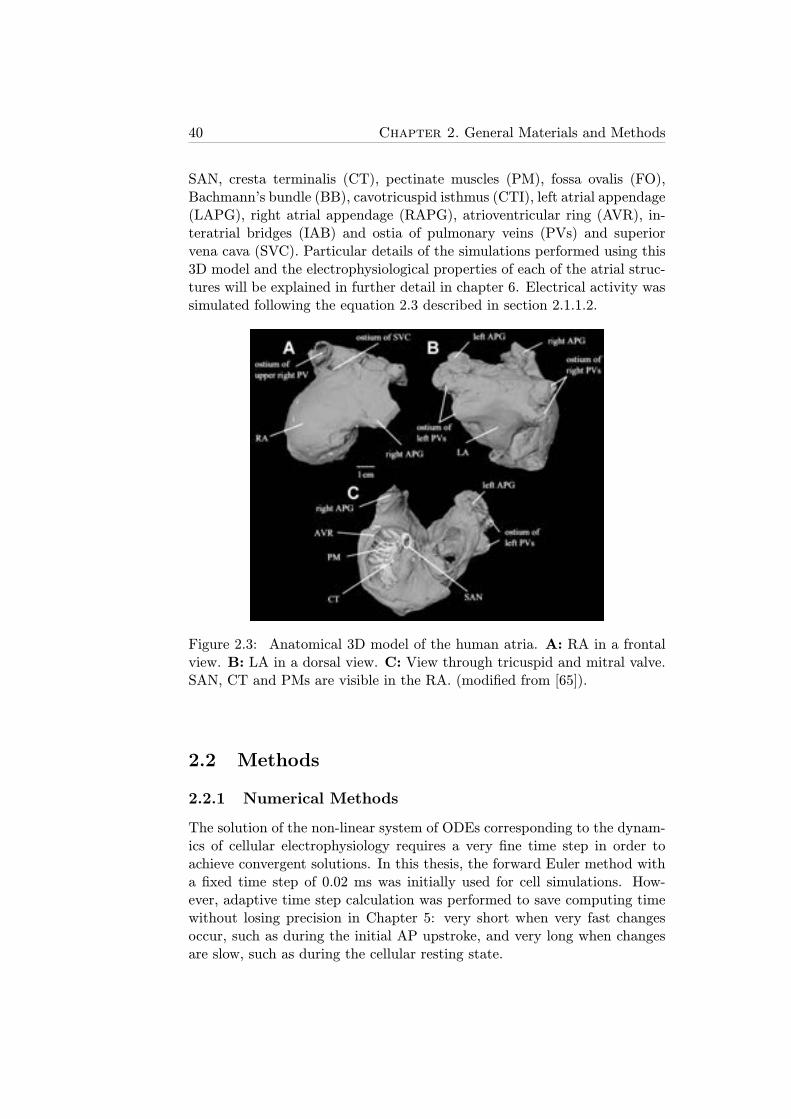
40 Chapter 2. General Materials and Methods
SAN, cresta terminalis (CT), pectinate muscles (PM), fossa ovalis (FO),Bachmann’s bundle (BB), cavotricuspid isthmus (CTI), left atrial appendage(LAPG), right atrial appendage (RAPG), atrioventricular ring (AVR), in-teratrial bridges (IAB) and ostia of pulmonary veins (PVs) and superiorvena cava (SVC). Particular details of the simulations performed using this3D model and the electrophysiological properties of each of the atrial struc-tures will be explained in further detail in chapter 6. Electrical activity wassimulated following the equation 2.3 described in section 2.1.1.2.
Figure 2.3: Anatomical 3D model of the human atria. A: RA in a frontalview. B: LA in a dorsal view. C: View through tricuspid and mitral valve.SAN, CT and PMs are visible in the RA. (modified from [65]).
2.2 Methods
2.2.1 Numerical Methods
The solution of the non-linear system of ODEs corresponding to the dynam-ics of cellular electrophysiology requires a very fine time step in order toachieve convergent solutions. In this thesis, the forward Euler method witha fixed time step of 0.02 ms was initially used for cell simulations. How-ever, adaptive time step calculation was performed to save computing timewithout losing precision in Chapter 5: very short when very fast changesoccur, such as during the initial AP upstroke, and very long when changesare slow, such as during the cellular resting state.
2.2. Methods 41
Similarly, the solution of the PDEs associated to propagation of electri-cal wavefronts in 1D fibers and 2D tissue requires fine resolution in bothtime and space, and thus fixed time and spatial steps of 0.02 ms and 250μm, respectively, were used. Convergence of the numerical methods wereproven by running simulations with different time steps ranging from 0.005ms to 0.05 ms, and spatial steps ranging from 100 μm to 1000 μm. Thesesimulations resulted in insignificant variations in the results for steps equalor shorter than 0.04 ms and 400 μm, respectively.
Regarding 3D simulations, the spatial resolution was given by the KIT3D model itself through the separation between neighbouring cells, whereasthe time step used to run the simulations was set to 0.04 ms, a bit coarserthan that of 1D and 2D simulations in order to reduce the very expensivecomputational cost while keeping the reliability of the results.
2.2.2 Computing Resources
The cellular simulations were run using either C++ or MATLAB. C++ wasused in the first parts of this thesis (Chapters 3 and 4) with a fixed time stepto solve the ODEs of the models, whereas a particular ODE solver, ode15s,was used in MATLAB to solve the stiff equation system with an adaptivetime step (Chapter 5). The main advantage of using C++ was that themodels could be easily implemented and several simulations could be run si-multaneously. However, we decided to change from C++ to MATLAB in thelast parts of the thesis for two main reasons: 1) MATLAB is slightly cheaperin terms of computational cost; 2) most of the postprocessing analysis andfigures of this thesis are obtained using MATLAB, therefore simulations andpost-processing could be managed more efficiently if MATLAB was used forboth.
For single cell simulations, an open-source software called COR [68], spe-cialized in running computational models through the use of a particularprogramming language called cellml [69], was also used. The main advan-tage of using COR is that many electrophysiological models are alreadyimplemented in cellml. Furthermore, its very intuitive interface allows si-multaneous simulation and visualization of the results during the course ofthe simulations.
The open source software Chaste [62, 70, 71], developed at the Depart-ment of Computer Science of the University of Oxford, was used in Chapter4 to run both 1D-fiber and 2D-tissue simulations. Chaste is a software spe-cialized in tissue simulations that allows the user to choose the electrophys-iological model, the characteristics of the tissue mesh and the stimulationprotocol to apply. All Chaste simulations were run on grid computing fa-cilities through use of the middleware platform Nimrod/G, accessible viaweb interface [72], allowing the simultaneous launch of a large number ofsimulations with different stimulation protocols and model parameters.

42 Chapter 2. General Materials and Methods
3D-atria simulations were run using the Elvira software, specialized inmulti-cell simulations and developed at the Department of Applied Mechan-ics and Bioengineering of the University of Zaragoza. This simulation soft-ware uses the finite element method described in [73]. The main advantageof using Elvira vs. Chaste is its cheaper computational cost for long sim-ulations, entailing shorter times to perform simulations. In order to savecomputation time, parallel computing techniques based on Condor havebeen used to run Elvira [74]. Visualization of the 3D simulation resultswas performed using the software ENSIGHT [75].
Chapter 3
Quantification of APD RateAdaptation in Human Atriaand its Relationship withArrhythmogenesis
3.1 Introduction
Cardiac memory refers to the time cardiomyocytes take to completely adaptto changes in heart rate (HR). It is well known that changes in HR entailalterations in the electrophysiology of atrial cells, thus leading to observ-able changes in AP. Two types of cardiac memory can be distinguished:short-term cardiac memory, i.e. the changes produced during the minutesfollowing the change in HR, and long-term cardiac memory, i.e. the processof cell recovery lasting for several days after the change in HR occurs. Atthe body surface level, the non-instantaneous adaptation of the QT intervalto changes in the RR interval (inversely dependent on HR) [76] or the vari-ations in both magnitude and duration of the T-wave following ventricularpacing [77] are examples of cardiac memory.
In this chapter, we study short-term cardiac memory in cells and 1Dfibers by analyzing the APD adaptation to changes in HR, an impairmentof which has been previously related to an increased likelihood for the de-velopment of arrythmias [76, 78]. It is well known that APD values stronglydepend on the stimulation CL (equivalent to 1/HR), as reported in previousstudies in human ventricular myocytes [79, 80] and canine atrial myocytes[81, 82]; however, cardiac memory in human atria has been less well inves-tigated and is the research focus of this thesis chapter.
43
44Chapter 3. Quantification of APD Rate Adaptation in Human Atria and
its Relationship with Arrhythmogenesis
3.1.1 Objetives
The main objectives of this part of the thesis can be summarized as follows:
1. Characterize and quantify APD rate adaptation in simulated humanatrial cardiomyocytes.
2. Validate, qualitatively and quantitatively, the results of simulated APDrate adaptation with experiments in human atrial myocytes, from boththe literature and the collaboration study with Hospital de la SantaCreu i Sant Pau in Barcelona.
3. Elucidate the cellular ionic mechanisms underlying APD adaptationin human atrial myocytes through the analysis of the contribution ofthe different ionic currents (both their conductances and their acti-vation/inactivation kinetics) and the concentrations of Na+, K+ andCa2+ to the different phases of adaptation.
4. Assess model independence of the elucidated ionic mechanisms in-volved in human atrial APD rate adaptation by comparing the resultsobtained with two atrial cell models.
5. Compare the results and the conclusions obtained for cardiac memoryin human atrial cells with those corresponding to cardiac memory inhuman ventricular cells.
6. Characterize and quantify APD rate adaptation in human atrial 1Dfibers and compare the results with those obtained in single cells.
7. Evaluate the relationship between atrial APD adaptation and proar-rhytmic risk by the use of preclinical markers.
3.2 Methods
3.2.1 Stimulation Protocols
Experimental and simulated stimulation protocols are described in the fol-lowing sections.
3.2.1.1 Experiments
The experiments used for validation of the simulation results in this part ofthe thesis were performed in collaboration with the Cellular Electrophysiol-ogy Research Group at Hospital de la Santa Creu i Sant Pau in Barcelona.This group has recognized expertise in the experimental study of cardiaccells, having developed advanced tools to visualize and extract informationof AP and ionic currents, particularly ICaL [4–7].
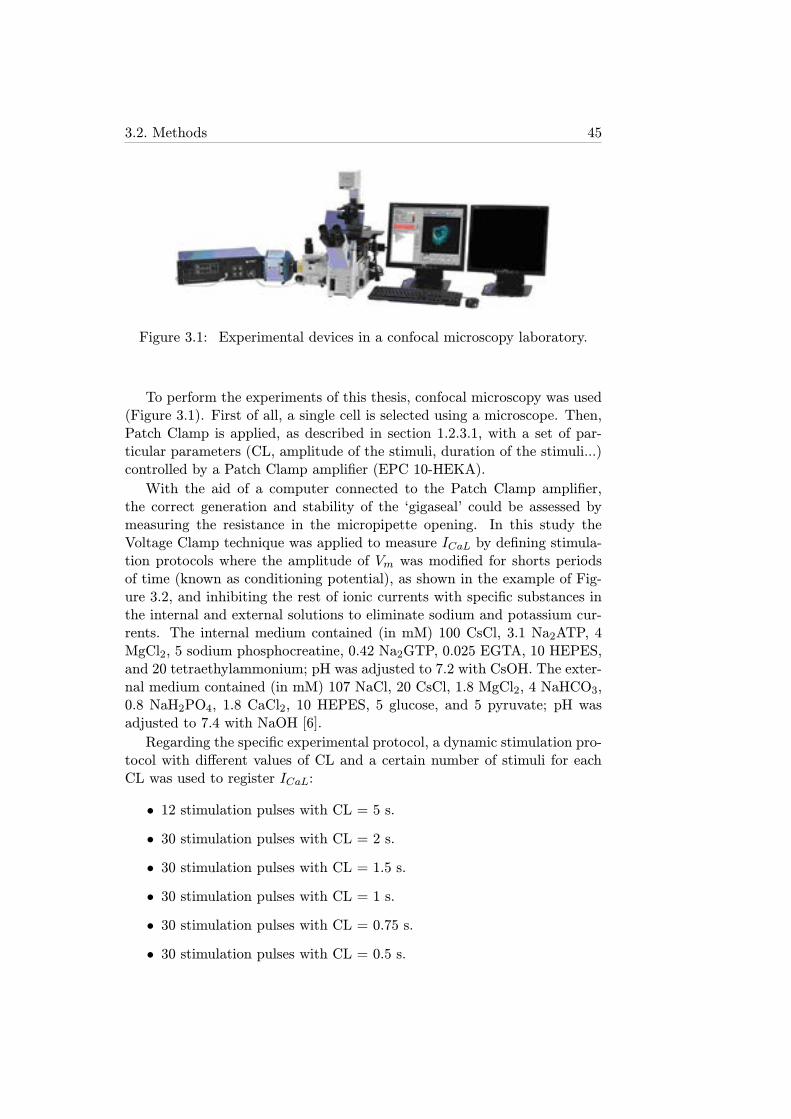
3.2. Methods 45
Figure 3.1: Experimental devices in a confocal microscopy laboratory.
To perform the experiments of this thesis, confocal microscopy was used(Figure 3.1). First of all, a single cell is selected using a microscope. Then,Patch Clamp is applied, as described in section 1.2.3.1, with a set of par-ticular parameters (CL, amplitude of the stimuli, duration of the stimuli...)controlled by a Patch Clamp amplifier (EPC 10-HEKA).
With the aid of a computer connected to the Patch Clamp amplifier,the correct generation and stability of the ‘gigaseal’ could be assessed bymeasuring the resistance in the micropipette opening. In this study theVoltage Clamp technique was applied to measure ICaL by defining stimula-tion protocols where the amplitude of Vm was modified for shorts periodsof time (known as conditioning potential), as shown in the example of Fig-ure 3.2, and inhibiting the rest of ionic currents with specific substances inthe internal and external solutions to eliminate sodium and potassium cur-rents. The internal medium contained (in mM) 100 CsCl, 3.1 Na2ATP, 4MgCl2, 5 sodium phosphocreatine, 0.42 Na2GTP, 0.025 EGTA, 10 HEPES,and 20 tetraethylammonium; pH was adjusted to 7.2 with CsOH. The exter-nal medium contained (in mM) 107 NaCl, 20 CsCl, 1.8 MgCl2, 4 NaHCO3,0.8 NaH2PO4, 1.8 CaCl2, 10 HEPES, 5 glucose, and 5 pyruvate; pH wasadjusted to 7.4 with NaOH [6].
Regarding the specific experimental protocol, a dynamic stimulation pro-tocol with different values of CL and a certain number of stimuli for eachCL was used to register ICaL:
• 12 stimulation pulses with CL = 5 s.
• 30 stimulation pulses with CL = 2 s.
• 30 stimulation pulses with CL = 1.5 s.
• 30 stimulation pulses with CL = 1 s.
• 30 stimulation pulses with CL = 0.75 s.
• 30 stimulation pulses with CL = 0.5 s.
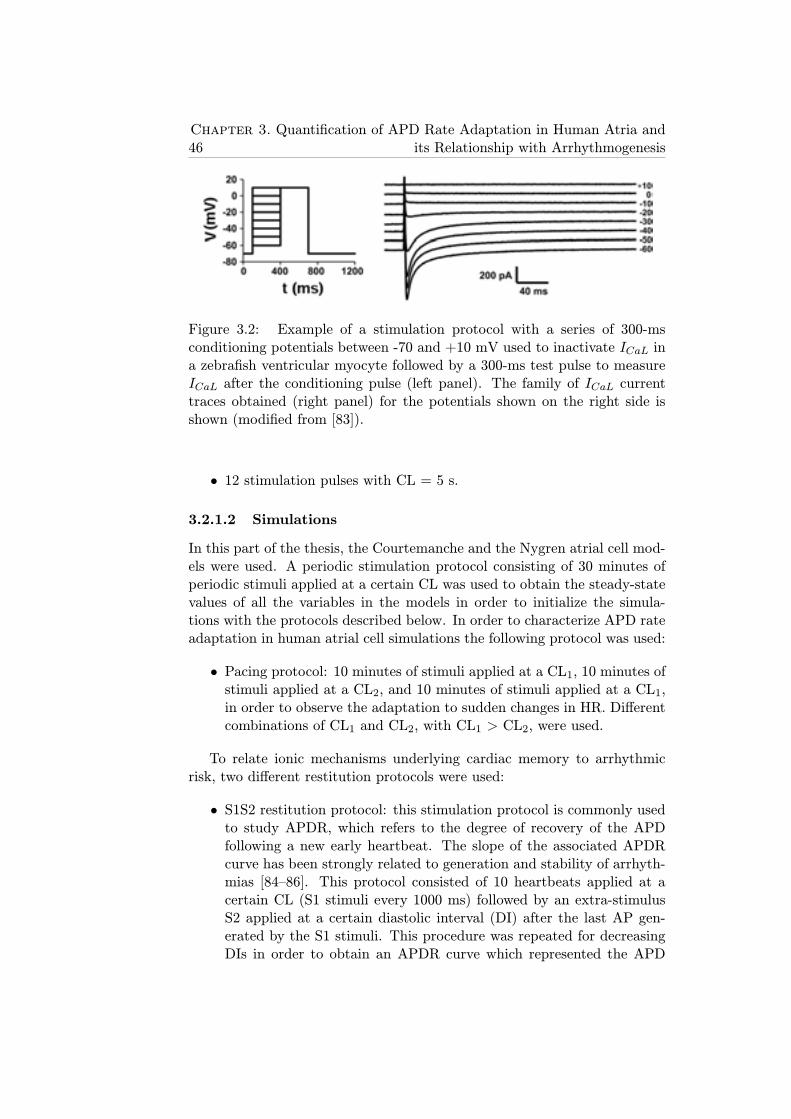
46Chapter 3. Quantification of APD Rate Adaptation in Human Atria and
its Relationship with Arrhythmogenesis
Figure 3.2: Example of a stimulation protocol with a series of 300-msconditioning potentials between -70 and +10 mV used to inactivate ICaL ina zebrafish ventricular myocyte followed by a 300-ms test pulse to measureICaL after the conditioning pulse (left panel). The family of ICaL currenttraces obtained (right panel) for the potentials shown on the right side isshown (modified from [83]).
• 12 stimulation pulses with CL = 5 s.
3.2.1.2 Simulations
In this part of the thesis, the Courtemanche and the Nygren atrial cell mod-els were used. A periodic stimulation protocol consisting of 30 minutes ofperiodic stimuli applied at a certain CL was used to obtain the steady-statevalues of all the variables in the models in order to initialize the simula-tions with the protocols described below. In order to characterize APD rateadaptation in human atrial cell simulations the following protocol was used:
• Pacing protocol: 10 minutes of stimuli applied at a CL1, 10 minutes ofstimuli applied at a CL2, and 10 minutes of stimuli applied at a CL1,in order to observe the adaptation to sudden changes in HR. Differentcombinations of CL1 and CL2, with CL1 > CL2, were used.
To relate ionic mechanisms underlying cardiac memory to arrhythmicrisk, two different restitution protocols were used:
• S1S2 restitution protocol: this stimulation protocol is commonly usedto study APDR, which refers to the degree of recovery of the APDfollowing a new early heartbeat. The slope of the associated APDRcurve has been strongly related to generation and stability of arrhyth-mias [84–86]. This protocol consisted of 10 heartbeats applied at acertain CL (S1 stimuli every 1000 ms) followed by an extra-stimulusS2 applied at a certain diastolic interval (DI) after the last AP gen-erated by the S1 stimuli. This procedure was repeated for decreasingDIs in order to obtain an APDR curve which represented the APD
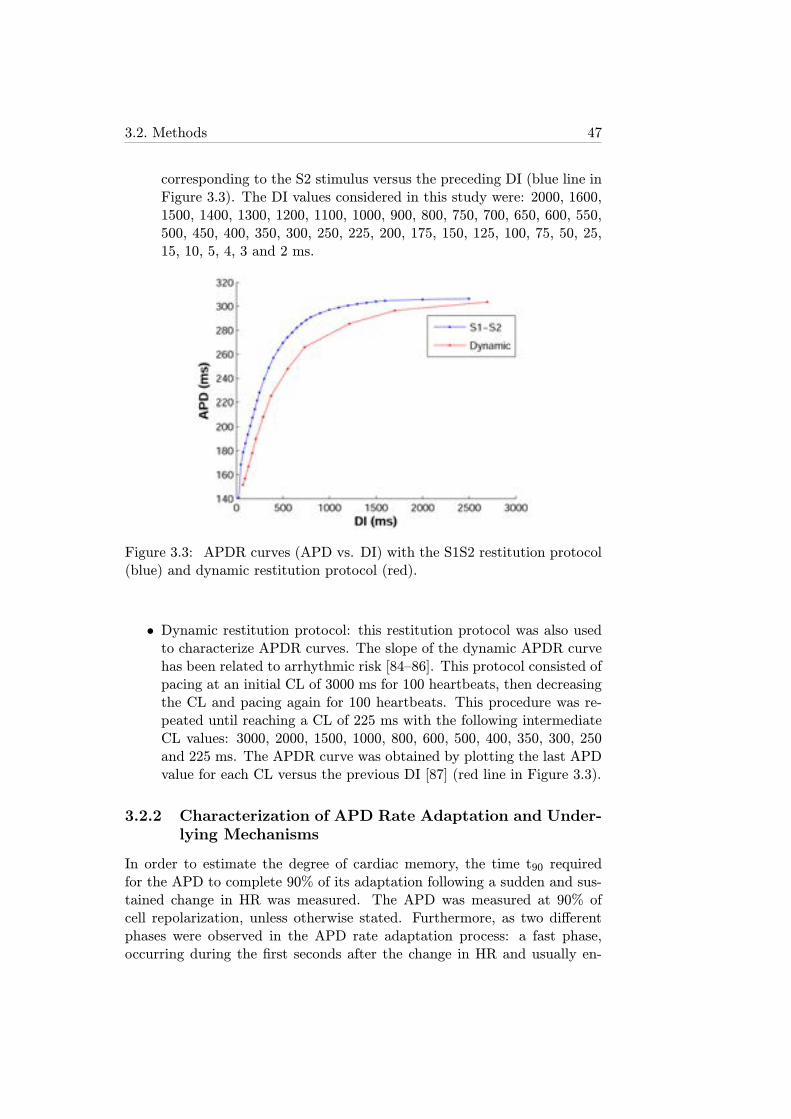
3.2. Methods 47
corresponding to the S2 stimulus versus the preceding DI (blue line inFigure 3.3). The DI values considered in this study were: 2000, 1600,1500, 1400, 1300, 1200, 1100, 1000, 900, 800, 750, 700, 650, 600, 550,500, 450, 400, 350, 300, 250, 225, 200, 175, 150, 125, 100, 75, 50, 25,15, 10, 5, 4, 3 and 2 ms.
Figure 3.3: APDR curves (APD vs. DI) with the S1S2 restitution protocol(blue) and dynamic restitution protocol (red).
• Dynamic restitution protocol: this restitution protocol was also usedto characterize APDR curves. The slope of the dynamic APDR curvehas been related to arrhythmic risk [84–86]. This protocol consisted ofpacing at an initial CL of 3000 ms for 100 heartbeats, then decreasingthe CL and pacing again for 100 heartbeats. This procedure was re-peated until reaching a CL of 225 ms with the following intermediateCL values: 3000, 2000, 1500, 1000, 800, 600, 500, 400, 350, 300, 250and 225 ms. The APDR curve was obtained by plotting the last APDvalue for each CL versus the previous DI [87] (red line in Figure 3.3).
3.2.2 Characterization of APD Rate Adaptation and Under-lying Mechanisms
In order to estimate the degree of cardiac memory, the time t90 requiredfor the APD to complete 90% of its adaptation following a sudden and sus-tained change in HR was measured. The APD was measured at 90% ofcell repolarization, unless otherwise stated. Furthermore, as two differentphases were observed in the APD rate adaptation process: a fast phase,occurring during the first seconds after the change in HR and usually en-
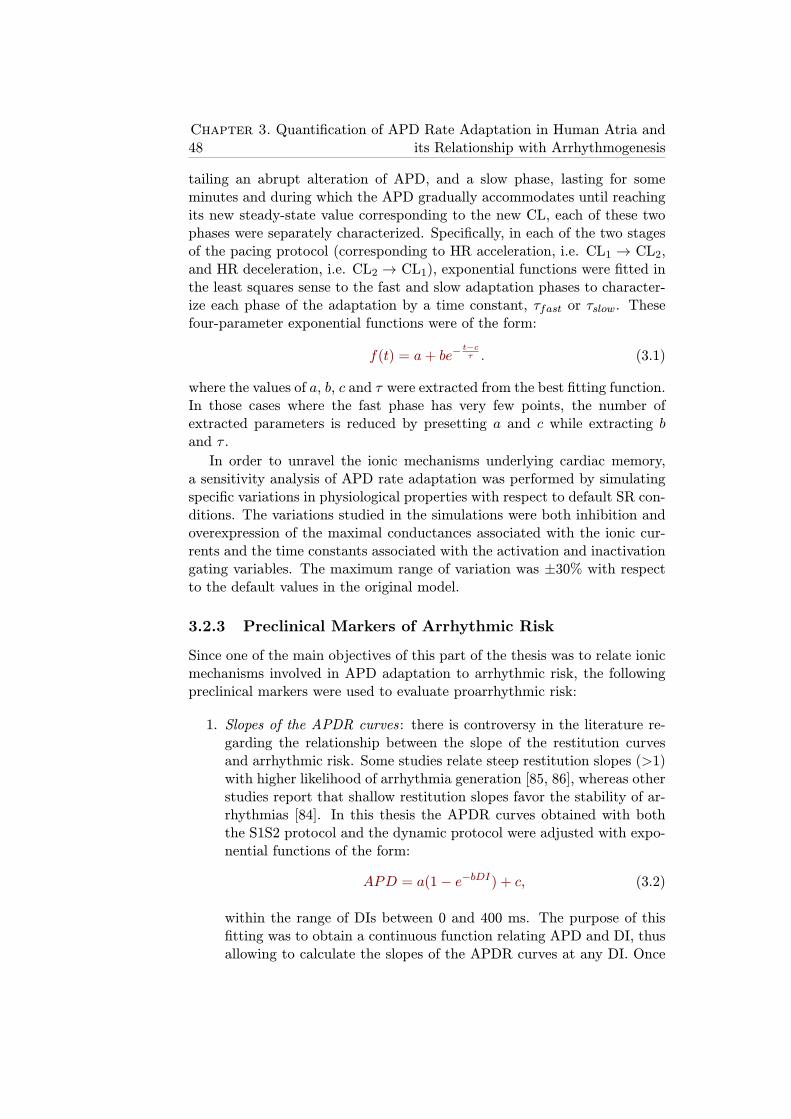
48Chapter 3. Quantification of APD Rate Adaptation in Human Atria and
its Relationship with Arrhythmogenesis
tailing an abrupt alteration of APD, and a slow phase, lasting for someminutes and during which the APD gradually accommodates until reachingits new steady-state value corresponding to the new CL, each of these twophases were separately characterized. Specifically, in each of the two stagesof the pacing protocol (corresponding to HR acceleration, i.e. CL1 → CL2,and HR deceleration, i.e. CL2 → CL1), exponential functions were fitted inthe least squares sense to the fast and slow adaptation phases to character-ize each phase of the adaptation by a time constant, τfast or τslow. Thesefour-parameter exponential functions were of the form:
f(t) = a+ be−t−cτ . (3.1)
where the values of a, b, c and τ were extracted from the best fitting function.In those cases where the fast phase has very few points, the number ofextracted parameters is reduced by presetting a and c while extracting band τ .
In order to unravel the ionic mechanisms underlying cardiac memory,a sensitivity analysis of APD rate adaptation was performed by simulatingspecific variations in physiological properties with respect to default SR con-ditions. The variations studied in the simulations were both inhibition andoverexpression of the maximal conductances associated with the ionic cur-rents and the time constants associated with the activation and inactivationgating variables. The maximum range of variation was ±30% with respectto the default values in the original model.
3.2.3 Preclinical Markers of Arrhythmic Risk
Since one of the main objectives of this part of the thesis was to relate ionicmechanisms involved in APD adaptation to arrhythmic risk, the followingpreclinical markers were used to evaluate proarrhythmic risk:
1. Slopes of the APDR curves : there is controversy in the literature re-garding the relationship between the slope of the restitution curvesand arrhythmic risk. Some studies relate steep restitution slopes (>1)with higher likelihood of arrhythmia generation [85, 86], whereas otherstudies report that shallow restitution slopes favor the stability of ar-rhythmias [84]. In this thesis the APDR curves obtained with boththe S1S2 protocol and the dynamic protocol were adjusted with expo-nential functions of the form:
APD = a(1− e−bDI) + c, (3.2)
within the range of DIs between 0 and 400 ms. The purpose of thisfitting was to obtain a continuous function relating APD and DI, thusallowing to calculate the slopes of the APDR curves at any DI. Once
3.3. Results 49
the fitting was performed, the slopes of the restitution curves wereevaluated for DI=100 ms in order to avoid the effects of AP alternans,i.e. the phenomenon that occurs in some cases for rapid pacing whensequences of consecutive long-short APs are generated. The derivativeof equation 3.2 was used to calculate the slope for DI=100 ms:
SDI = abe−bDI , (3.3)
2. Calcium current reactivation: the magnitude of ICaL recovery follow-ing inactivation has been proposed as an arrhythmic risk marker [88].Values of this marker close to 1 have been related to higher likelihoodof calcium current reactivation and, therefore, of generation of early af-terdepolarizations (EADs) that could result in arrhythmia generation[88]. In order to obtain this marker, represented by ρ, the inactiva-tion gating variables of ICaL were measured at 90% of AP repolariza-tion following periodic stimulation. Since values of inactivation gatingvariables represent probability of being open, ρ is calculated by mul-tiplying them with the Courtemanche model (fCa.f). The calculationof ρ is more complex with the Nygren model since it includes threeinactivation gating variables. It is obtained by adding two multipli-cations: a function of the calcium dependent gating variable in openstate (fCa.fL1) and a function of the calcium dependent gating variablein closed state ((1− fCa).fL2).
3. AP triangulation: Hondeghem et al. showed a strong relationshipbetween AP triangulation and arrhythmic risk [89]. This marker canbe obtained as the quotient of APD90 and APD50 (APD measured at90% and 50% of repolarization, respectively) and is represented in thisthesis by δ. Values close to 1 entail "square-shaped" APs, while largervalues correspond to triangular AP morphologies.
3.3 Results
3.3.1 APD Rate Adaptation in Human Atrial Myocytes
3.3.1.1 Characterization and Quantification of APD Rate Adap-tation
Figure 3.4 shows the default pacing protocol used to study APD adaptation(left panel, CL1 = 1000 ms and CL2 = 600 ms), as described in section3.2.1.2, and the corresponding APD time course when this protocol was ap-plied to cells simulated with the Courtemanche model (right panel). Thisfigure shows that HR acceleration (equivalent to CL decrease) entailed an
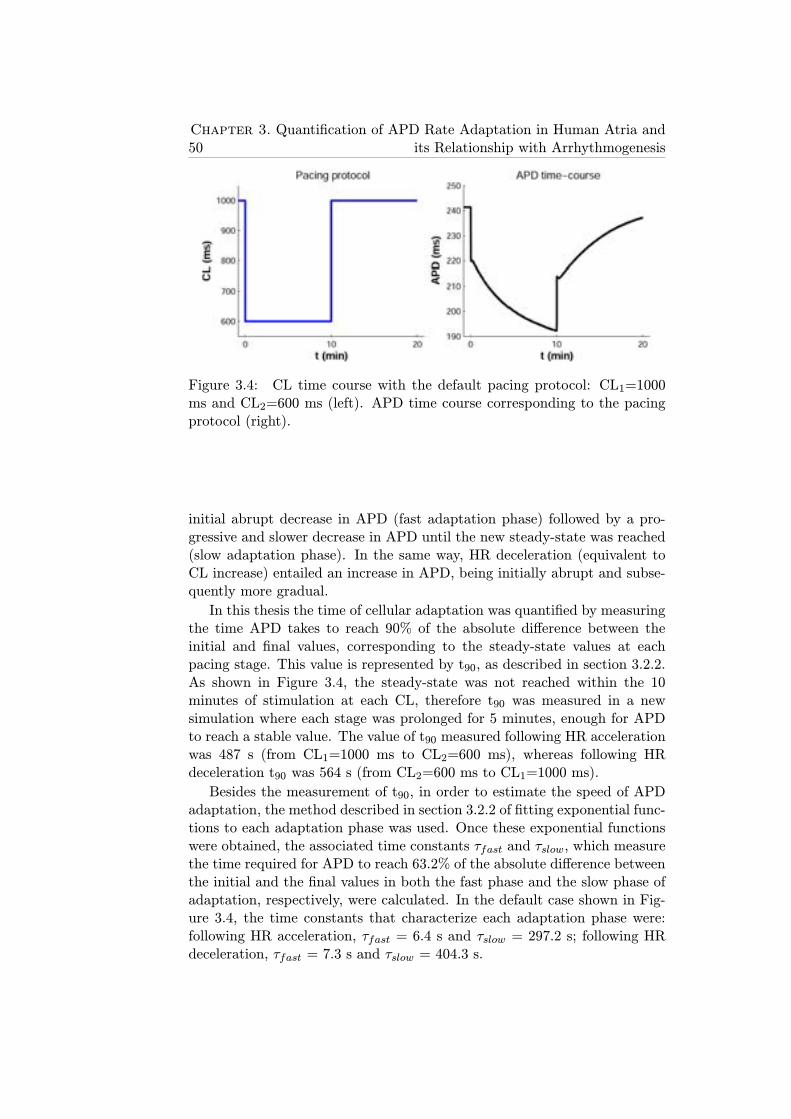
50Chapter 3. Quantification of APD Rate Adaptation in Human Atria and
its Relationship with Arrhythmogenesis
Figure 3.4: CL time course with the default pacing protocol: CL1=1000ms and CL2=600 ms (left). APD time course corresponding to the pacingprotocol (right).
initial abrupt decrease in APD (fast adaptation phase) followed by a pro-gressive and slower decrease in APD until the new steady-state was reached(slow adaptation phase). In the same way, HR deceleration (equivalent toCL increase) entailed an increase in APD, being initially abrupt and subse-quently more gradual.
In this thesis the time of cellular adaptation was quantified by measuringthe time APD takes to reach 90% of the absolute difference between theinitial and final values, corresponding to the steady-state values at eachpacing stage. This value is represented by t90, as described in section 3.2.2.As shown in Figure 3.4, the steady-state was not reached within the 10minutes of stimulation at each CL, therefore t90 was measured in a newsimulation where each stage was prolonged for 5 minutes, enough for APDto reach a stable value. The value of t90 measured following HR accelerationwas 487 s (from CL1=1000 ms to CL2=600 ms), whereas following HRdeceleration t90 was 564 s (from CL2=600 ms to CL1=1000 ms).
Besides the measurement of t90, in order to estimate the speed of APDadaptation, the method described in section 3.2.2 of fitting exponential func-tions to each adaptation phase was used. Once these exponential functionswere obtained, the associated time constants τfast and τslow, which measurethe time required for APD to reach 63.2% of the absolute difference betweenthe initial and the final values in both the fast phase and the slow phase ofadaptation, respectively, were calculated. In the default case shown in Fig-ure 3.4, the time constants that characterize each adaptation phase were:following HR acceleration, τfast = 6.4 s and τslow = 297.2 s; following HRdeceleration, τfast = 7.3 s and τslow = 404.3 s.
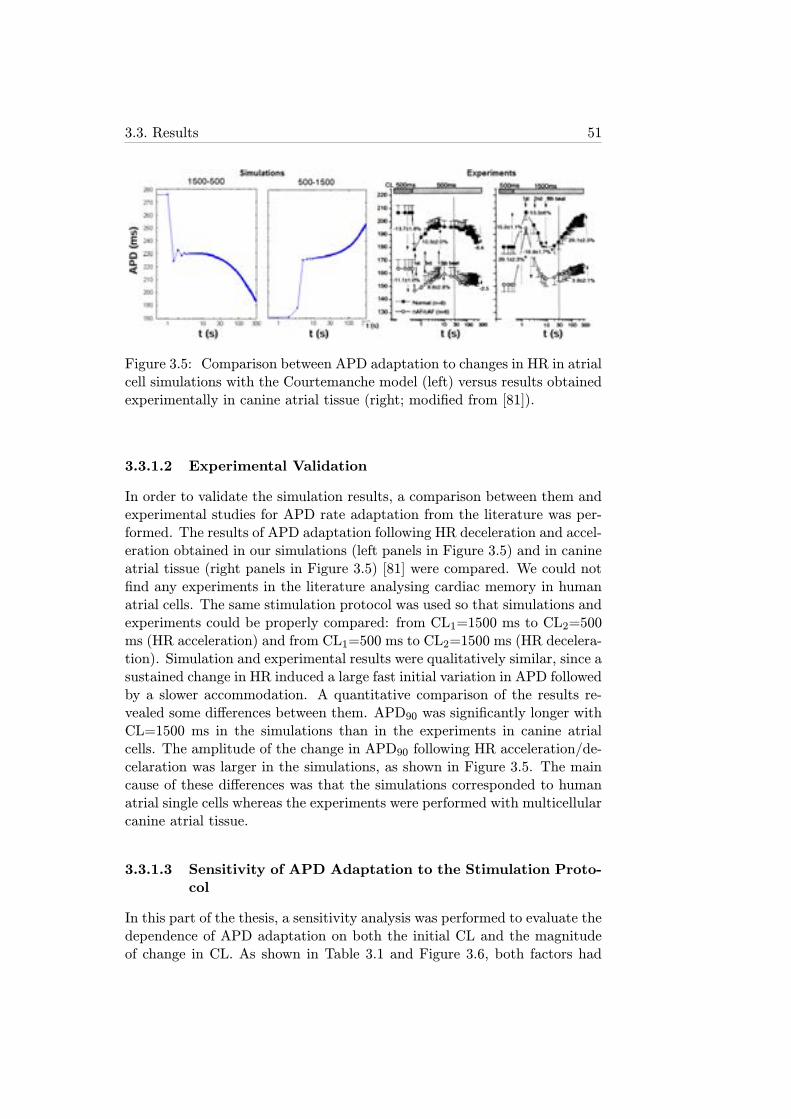
3.3. Results 51
Figure 3.5: Comparison between APD adaptation to changes in HR in atrialcell simulations with the Courtemanche model (left) versus results obtainedexperimentally in canine atrial tissue (right; modified from [81]).
3.3.1.2 Experimental Validation
In order to validate the simulation results, a comparison between them andexperimental studies for APD rate adaptation from the literature was per-formed. The results of APD adaptation following HR deceleration and accel-eration obtained in our simulations (left panels in Figure 3.5) and in canineatrial tissue (right panels in Figure 3.5) [81] were compared. We could notfind any experiments in the literature analysing cardiac memory in humanatrial cells. The same stimulation protocol was used so that simulations andexperiments could be properly compared: from CL1=1500 ms to CL2=500ms (HR acceleration) and from CL1=500 ms to CL2=1500 ms (HR decelera-tion). Simulation and experimental results were qualitatively similar, since asustained change in HR induced a large fast initial variation in APD followedby a slower accommodation. A quantitative comparison of the results re-vealed some differences between them. APD90 was significantly longer withCL=1500 ms in the simulations than in the experiments in canine atrialcells. The amplitude of the change in APD90 following HR acceleration/de-celaration was larger in the simulations, as shown in Figure 3.5. The maincause of these differences was that the simulations corresponded to humanatrial single cells whereas the experiments were performed with multicellularcanine atrial tissue.
3.3.1.3 Sensitivity of APD Adaptation to the Stimulation Proto-col
In this part of the thesis, a sensitivity analysis was performed to evaluate thedependence of APD adaptation on both the initial CL and the magnitudeof change in CL. As shown in Table 3.1 and Figure 3.6, both factors had
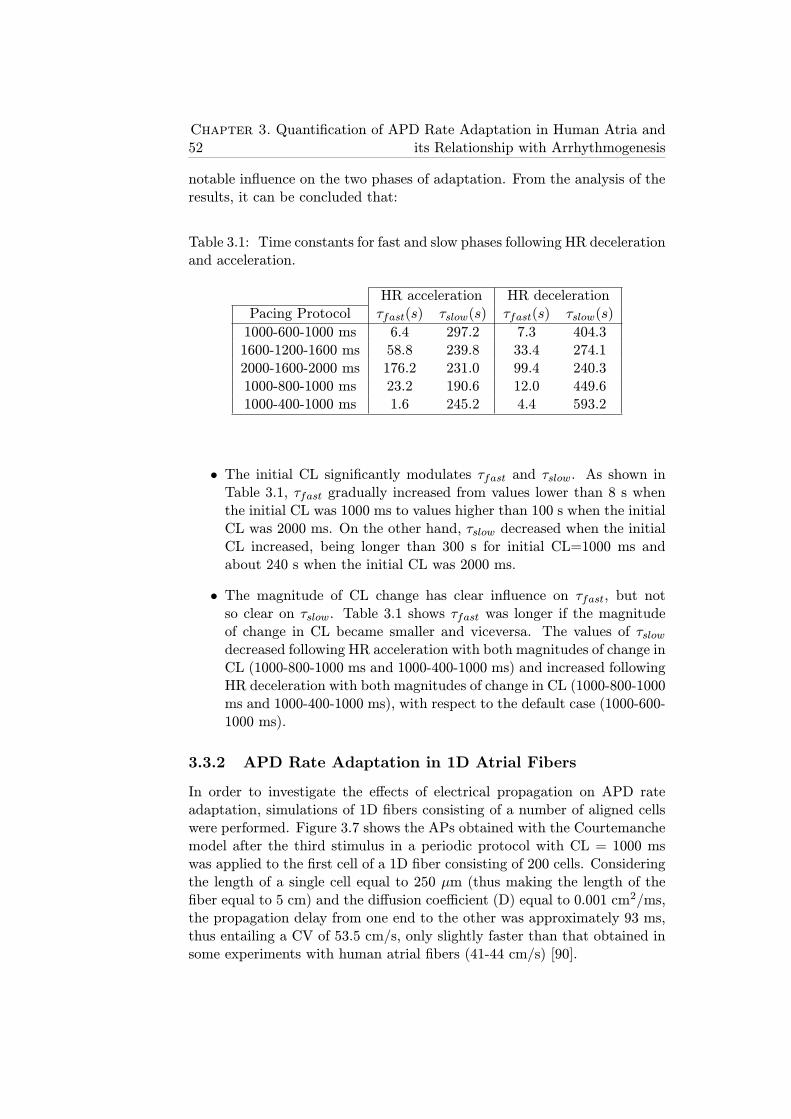
52Chapter 3. Quantification of APD Rate Adaptation in Human Atria and
its Relationship with Arrhythmogenesis
notable influence on the two phases of adaptation. From the analysis of theresults, it can be concluded that:
Table 3.1: Time constants for fast and slow phases following HR decelerationand acceleration.
HR acceleration HR decelerationPacing Protocol τfast(s) τslow(s) τfast(s) τslow(s)
1000-600-1000 ms 6.4 297.2 7.3 404.31600-1200-1600 ms 58.8 239.8 33.4 274.12000-1600-2000 ms 176.2 231.0 99.4 240.31000-800-1000 ms 23.2 190.6 12.0 449.61000-400-1000 ms 1.6 245.2 4.4 593.2
• The initial CL significantly modulates τfast and τslow. As shown inTable 3.1, τfast gradually increased from values lower than 8 s whenthe initial CL was 1000 ms to values higher than 100 s when the initialCL was 2000 ms. On the other hand, τslow decreased when the initialCL increased, being longer than 300 s for initial CL=1000 ms andabout 240 s when the initial CL was 2000 ms.
• The magnitude of CL change has clear influence on τfast, but notso clear on τslow. Table 3.1 shows τfast was longer if the magnitudeof change in CL became smaller and viceversa. The values of τslowdecreased following HR acceleration with both magnitudes of change inCL (1000-800-1000 ms and 1000-400-1000 ms) and increased followingHR deceleration with both magnitudes of change in CL (1000-800-1000ms and 1000-400-1000 ms), with respect to the default case (1000-600-1000 ms).
3.3.2 APD Rate Adaptation in 1D Atrial Fibers
In order to investigate the effects of electrical propagation on APD rateadaptation, simulations of 1D fibers consisting of a number of aligned cellswere performed. Figure 3.7 shows the APs obtained with the Courtemanchemodel after the third stimulus in a periodic protocol with CL = 1000 mswas applied to the first cell of a 1D fiber consisting of 200 cells. Consideringthe length of a single cell equal to 250 μm (thus making the length of thefiber equal to 5 cm) and the diffusion coefficient (D) equal to 0.001 cm2/ms,the propagation delay from one end to the other was approximately 93 ms,thus entailing a CV of 53.5 cm/s, only slightly faster than that obtained insome experiments with human atrial fibers (41-44 cm/s) [90].
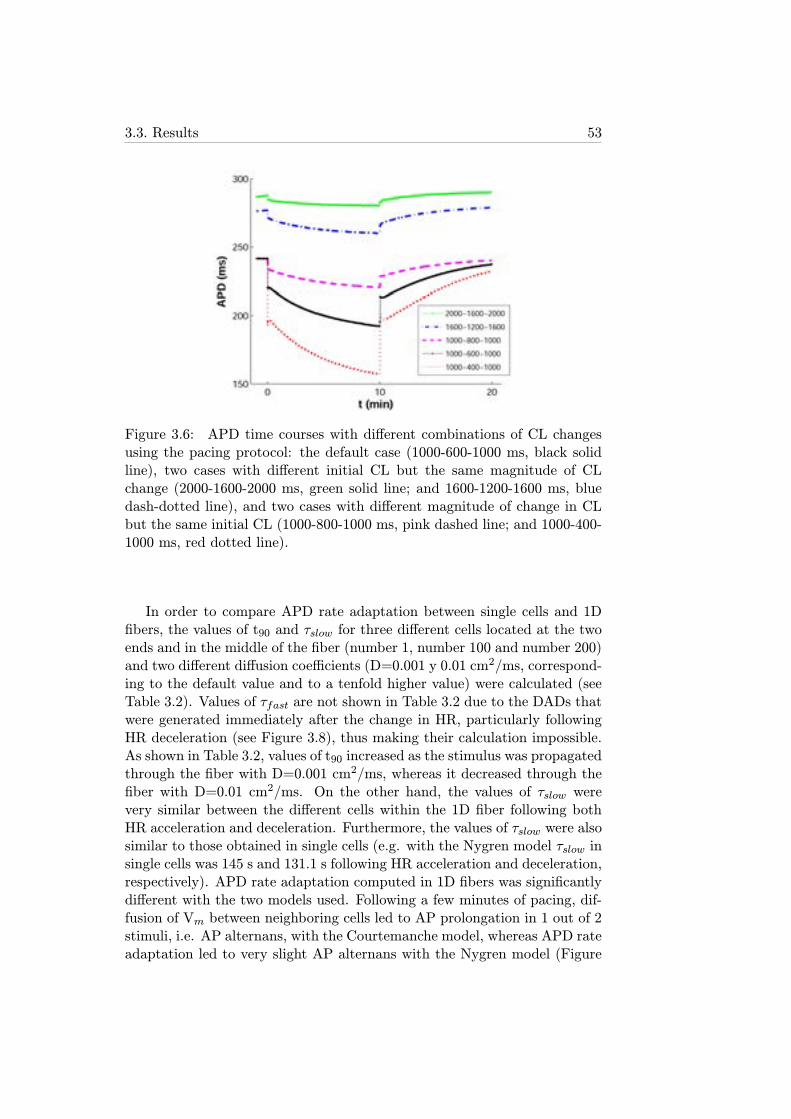
3.3. Results 53
Figure 3.6: APD time courses with different combinations of CL changesusing the pacing protocol: the default case (1000-600-1000 ms, black solidline), two cases with different initial CL but the same magnitude of CLchange (2000-1600-2000 ms, green solid line; and 1600-1200-1600 ms, bluedash-dotted line), and two cases with different magnitude of change in CLbut the same initial CL (1000-800-1000 ms, pink dashed line; and 1000-400-1000 ms, red dotted line).
In order to compare APD rate adaptation between single cells and 1Dfibers, the values of t90 and τslow for three different cells located at the twoends and in the middle of the fiber (number 1, number 100 and number 200)and two different diffusion coefficients (D=0.001 y 0.01 cm2/ms, correspond-ing to the default value and to a tenfold higher value) were calculated (seeTable 3.2). Values of τfast are not shown in Table 3.2 due to the DADs thatwere generated immediately after the change in HR, particularly followingHR deceleration (see Figure 3.8), thus making their calculation impossible.As shown in Table 3.2, values of t90 increased as the stimulus was propagatedthrough the fiber with D=0.001 cm2/ms, whereas it decreased through thefiber with D=0.01 cm2/ms. On the other hand, the values of τslow werevery similar between the different cells within the 1D fiber following bothHR acceleration and deceleration. Furthermore, the values of τslow were alsosimilar to those obtained in single cells (e.g. with the Nygren model τslow insingle cells was 145 s and 131.1 s following HR acceleration and deceleration,respectively). APD rate adaptation computed in 1D fibers was significantlydifferent with the two models used. Following a few minutes of pacing, dif-fusion of Vm between neighboring cells led to AP prolongation in 1 out of 2stimuli, i.e. AP alternans, with the Courtemanche model, whereas APD rateadaptation led to very slight AP alternans with the Nygren model (Figure
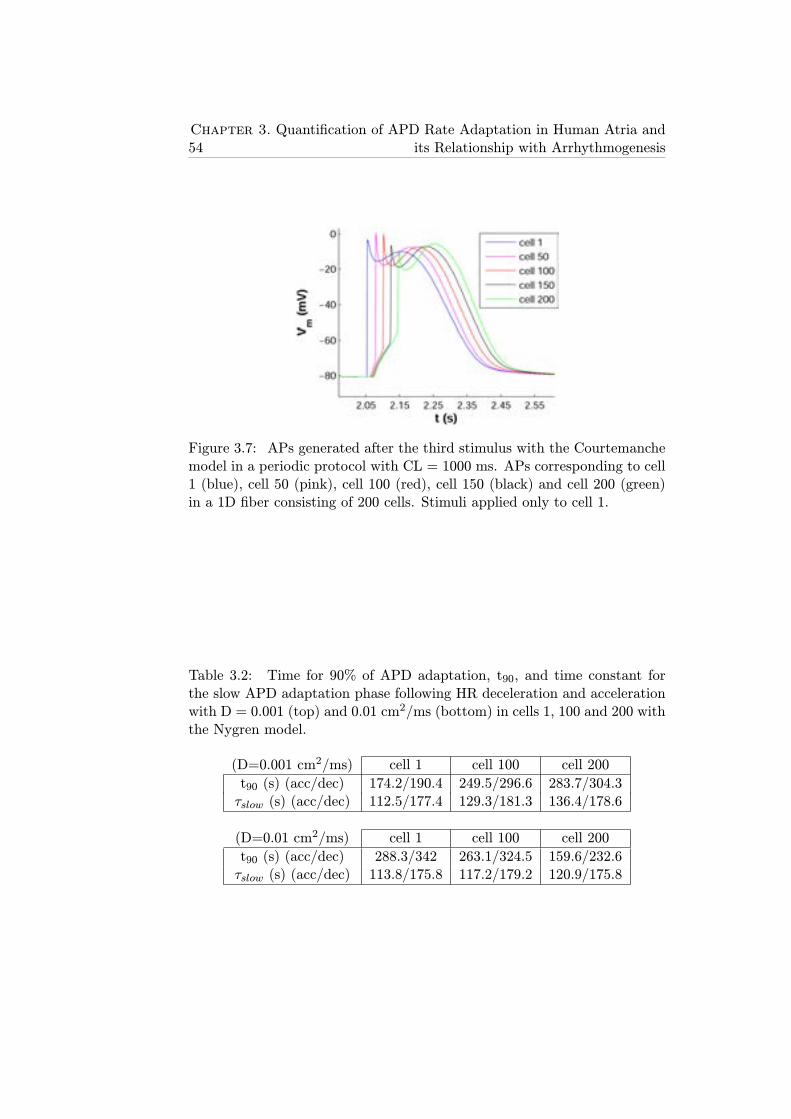
54Chapter 3. Quantification of APD Rate Adaptation in Human Atria and
its Relationship with Arrhythmogenesis
Figure 3.7: APs generated after the third stimulus with the Courtemanchemodel in a periodic protocol with CL = 1000 ms. APs corresponding to cell1 (blue), cell 50 (pink), cell 100 (red), cell 150 (black) and cell 200 (green)in a 1D fiber consisting of 200 cells. Stimuli applied only to cell 1.
Table 3.2: Time for 90% of APD adaptation, t90, and time constant forthe slow APD adaptation phase following HR deceleration and accelerationwith D = 0.001 (top) and 0.01 cm2/ms (bottom) in cells 1, 100 and 200 withthe Nygren model.
(D=0.001 cm2/ms) cell 1 cell 100 cell 200
t90 (s) (acc/dec) 174.2/190.4 249.5/296.6 283.7/304.3τslow (s) (acc/dec) 112.5/177.4 129.3/181.3 136.4/178.6
(D=0.01 cm2/ms) cell 1 cell 100 cell 200
t90 (s) (acc/dec) 288.3/342 263.1/324.5 159.6/232.6τslow (s) (acc/dec) 113.8/175.8 117.2/179.2 120.9/175.8
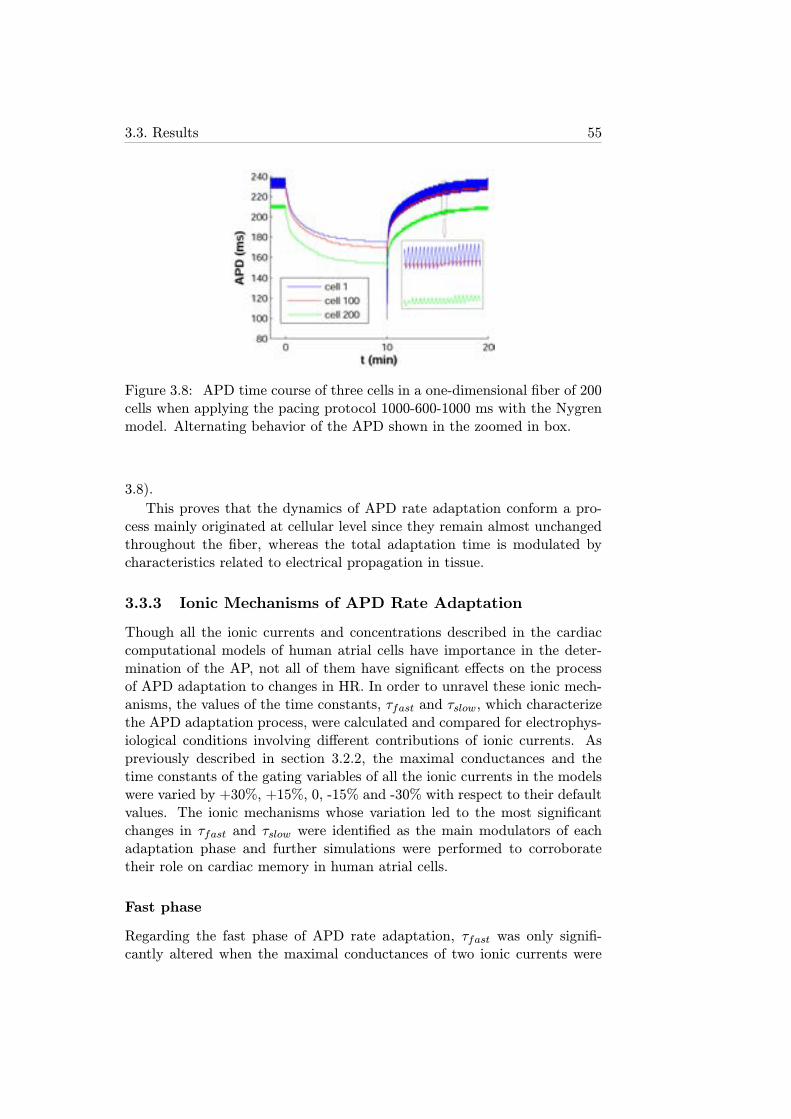
3.3. Results 55
Figure 3.8: APD time course of three cells in a one-dimensional fiber of 200cells when applying the pacing protocol 1000-600-1000 ms with the Nygrenmodel. Alternating behavior of the APD shown in the zoomed in box.
3.8).
This proves that the dynamics of APD rate adaptation conform a pro-cess mainly originated at cellular level since they remain almost unchangedthroughout the fiber, whereas the total adaptation time is modulated bycharacteristics related to electrical propagation in tissue.
3.3.3 Ionic Mechanisms of APD Rate Adaptation
Though all the ionic currents and concentrations described in the cardiaccomputational models of human atrial cells have importance in the deter-mination of the AP, not all of them have significant effects on the processof APD adaptation to changes in HR. In order to unravel these ionic mech-anisms, the values of the time constants, τfast and τslow, which characterizethe APD adaptation process, were calculated and compared for electrophys-iological conditions involving different contributions of ionic currents. Aspreviously described in section 3.2.2, the maximal conductances and thetime constants of the gating variables of all the ionic currents in the modelswere varied by +30%, +15%, 0, -15% and -30% with respect to their defaultvalues. The ionic mechanisms whose variation led to the most significantchanges in τfast and τslow were identified as the main modulators of eachadaptation phase and further simulations were performed to corroboratetheir role on cardiac memory in human atrial cells.
Fast phase
Regarding the fast phase of APD rate adaptation, τfast was only signifi-cantly altered when the maximal conductances of two ionic currents were
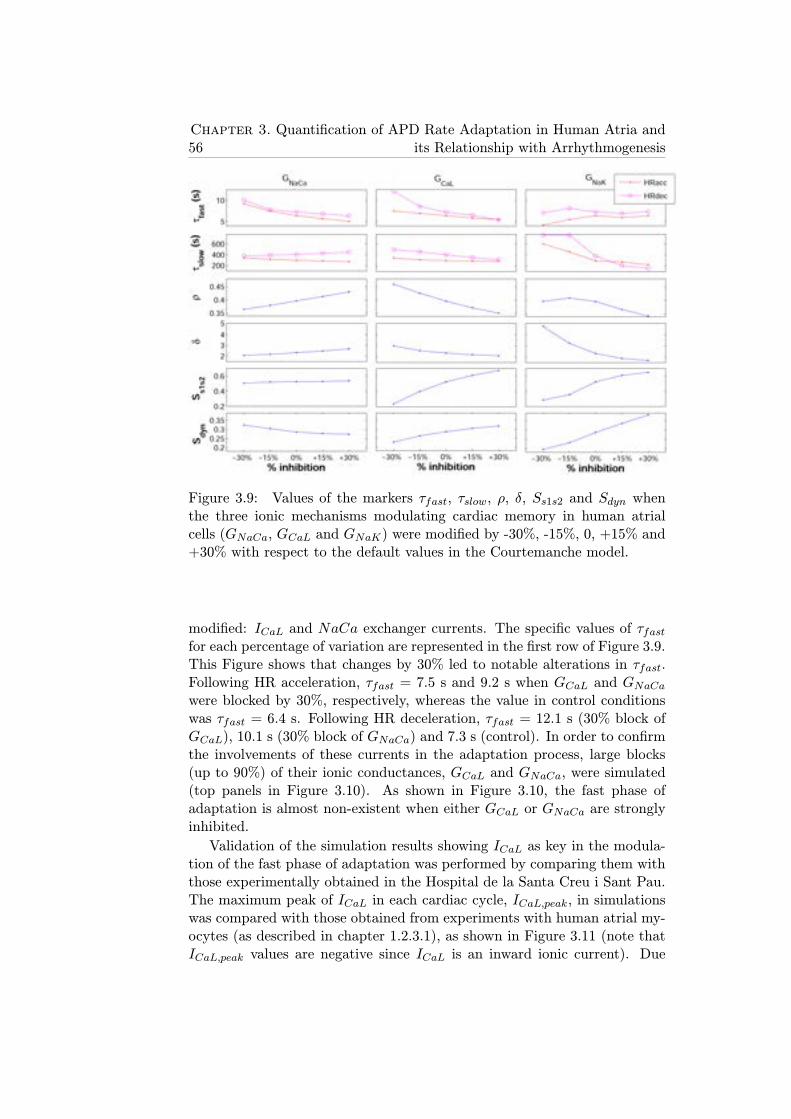
56Chapter 3. Quantification of APD Rate Adaptation in Human Atria and
its Relationship with Arrhythmogenesis
Figure 3.9: Values of the markers τfast, τslow, ρ, δ, Ss1s2 and Sdyn whenthe three ionic mechanisms modulating cardiac memory in human atrialcells (GNaCa, GCaL and GNaK) were modified by -30%, -15%, 0, +15% and+30% with respect to the default values in the Courtemanche model.
modified: ICaL and NaCa exchanger currents. The specific values of τfastfor each percentage of variation are represented in the first row of Figure 3.9.This Figure shows that changes by 30% led to notable alterations in τfast.Following HR acceleration, τfast = 7.5 s and 9.2 s when GCaL and GNaCawere blocked by 30%, respectively, whereas the value in control conditionswas τfast = 6.4 s. Following HR deceleration, τfast = 12.1 s (30% block ofGCaL), 10.1 s (30% block of GNaCa) and 7.3 s (control). In order to confirmthe involvements of these currents in the adaptation process, large blocks(up to 90%) of their ionic conductances, GCaL and GNaCa, were simulated(top panels in Figure 3.10). As shown in Figure 3.10, the fast phase ofadaptation is almost non-existent when either GCaL or GNaCa are stronglyinhibited.
Validation of the simulation results showing ICaL as key in the modula-tion of the fast phase of adaptation was performed by comparing them withthose experimentally obtained in the Hospital de la Santa Creu i Sant Pau.The maximum peak of ICaL in each cardiac cycle, ICaL,peak, in simulationswas compared with those obtained from experiments with human atrial my-ocytes (as described in chapter 1.2.3.1), as shown in Figure 3.11 (note thatICaL,peak values are negative since ICaL is an inward ionic current). Due
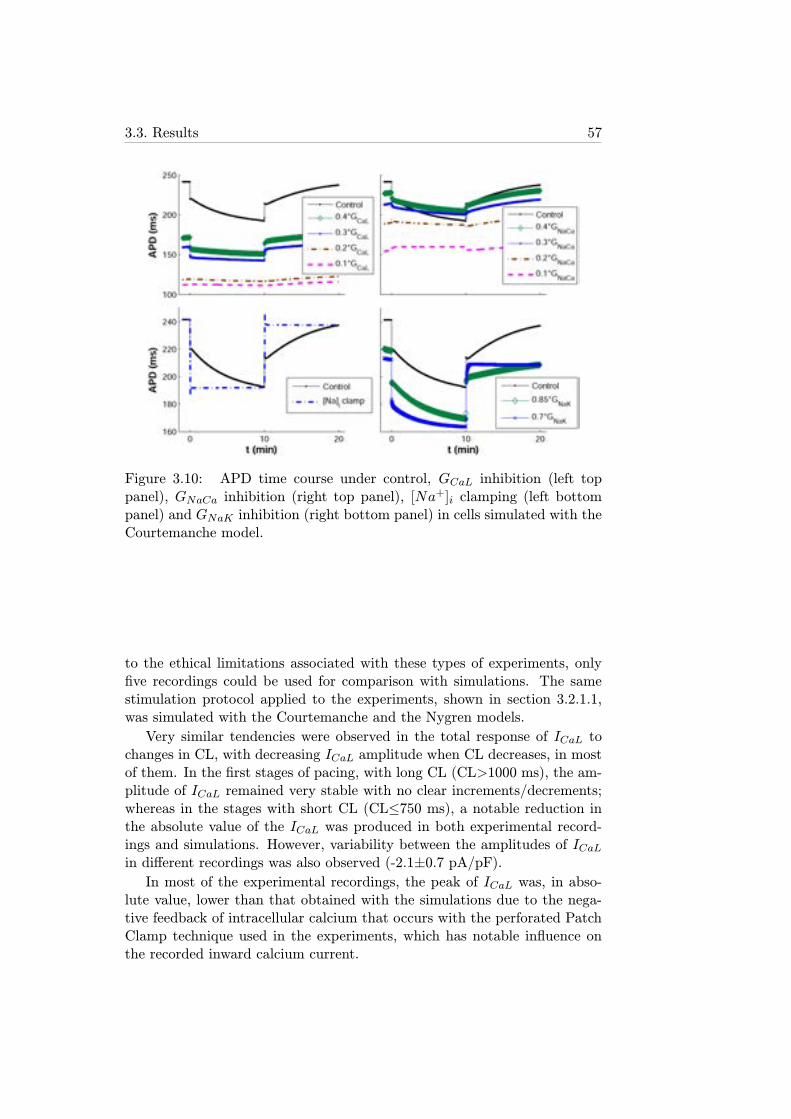
3.3. Results 57
Figure 3.10: APD time course under control, GCaL inhibition (left toppanel), GNaCa inhibition (right top panel), [Na
+]i clamping (left bottompanel) and GNaK inhibition (right bottom panel) in cells simulated with theCourtemanche model.
to the ethical limitations associated with these types of experiments, onlyfive recordings could be used for comparison with simulations. The samestimulation protocol applied to the experiments, shown in section 3.2.1.1,was simulated with the Courtemanche and the Nygren models.
Very similar tendencies were observed in the total response of ICaL tochanges in CL, with decreasing ICaL amplitude when CL decreases, in mostof them. In the first stages of pacing, with long CL (CL>1000 ms), the am-plitude of ICaL remained very stable with no clear increments/decrements;whereas in the stages with short CL (CL≤750 ms), a notable reduction inthe absolute value of the ICaL was produced in both experimental record-ings and simulations. However, variability between the amplitudes of ICaLin different recordings was also observed (-2.1±0.7 pA/pF).In most of the experimental recordings, the peak of ICaL was, in abso-
lute value, lower than that obtained with the simulations due to the nega-tive feedback of intracellular calcium that occurs with the perforated PatchClamp technique used in the experiments, which has notable influence onthe recorded inward calcium current.
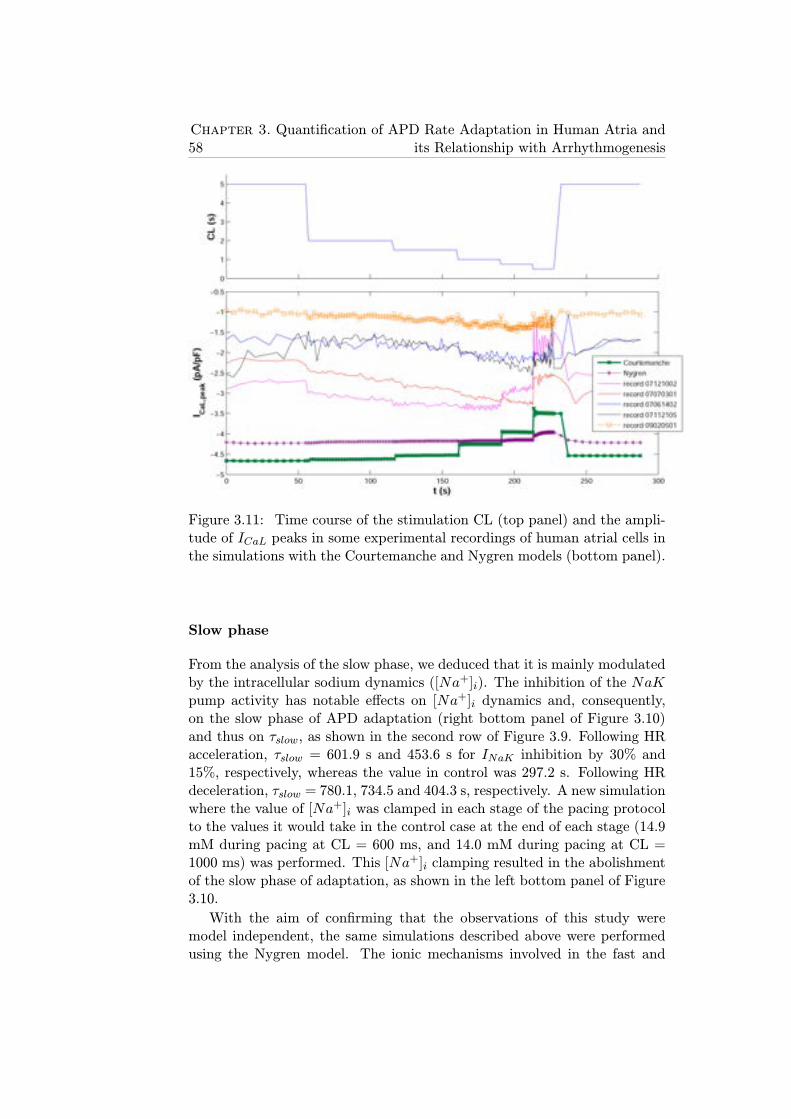
58Chapter 3. Quantification of APD Rate Adaptation in Human Atria and
its Relationship with Arrhythmogenesis
Figure 3.11: Time course of the stimulation CL (top panel) and the ampli-tude of ICaL peaks in some experimental recordings of human atrial cells inthe simulations with the Courtemanche and Nygren models (bottom panel).
Slow phase
From the analysis of the slow phase, we deduced that it is mainly modulatedby the intracellular sodium dynamics ([Na+]i). The inhibition of the NaKpump activity has notable effects on [Na+]i dynamics and, consequently,on the slow phase of APD adaptation (right bottom panel of Figure 3.10)and thus on τslow, as shown in the second row of Figure 3.9. Following HRacceleration, τslow = 601.9 s and 453.6 s for INaK inhibition by 30% and15%, respectively, whereas the value in control was 297.2 s. Following HRdeceleration, τslow = 780.1, 734.5 and 404.3 s, respectively. A new simulationwhere the value of [Na+]i was clamped in each stage of the pacing protocolto the values it would take in the control case at the end of each stage (14.9mM during pacing at CL = 600 ms, and 14.0 mM during pacing at CL =1000 ms) was performed. This [Na+]i clamping resulted in the abolishmentof the slow phase of adaptation, as shown in the left bottom panel of Figure3.10.
With the aim of confirming that the observations of this study weremodel independent, the same simulations described above were performedusing the Nygren model. The ionic mechanisms involved in the fast and
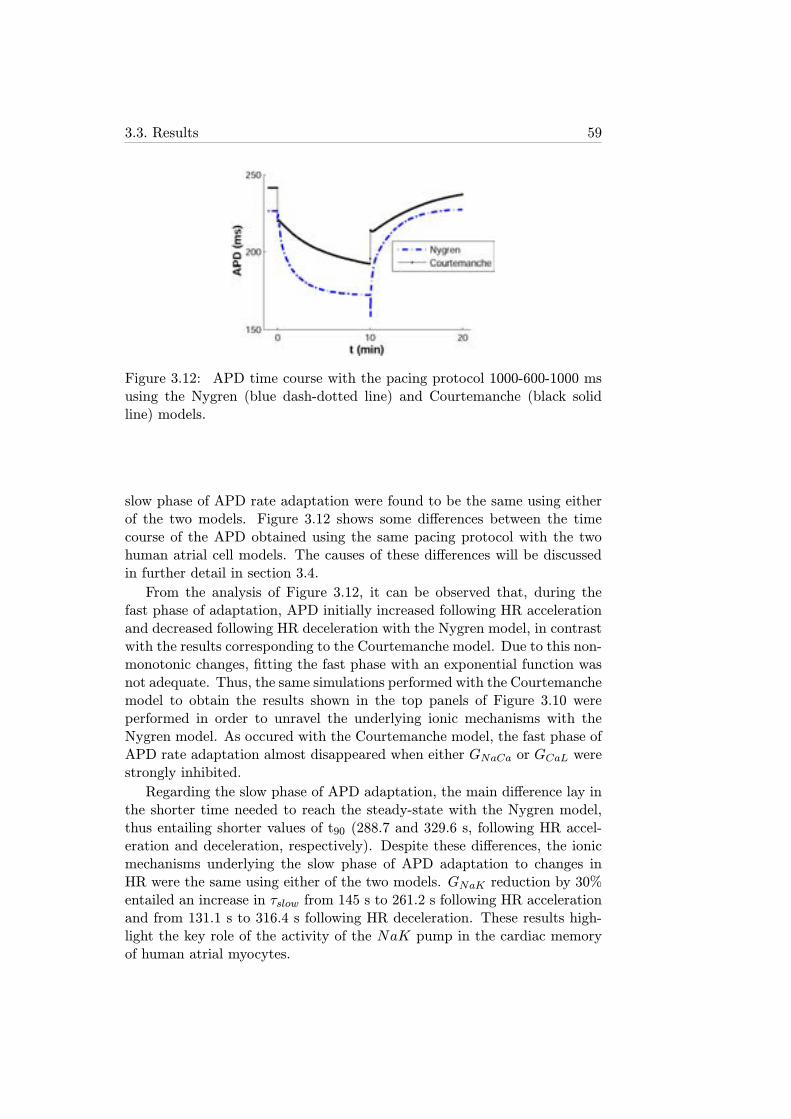
3.3. Results 59
Figure 3.12: APD time course with the pacing protocol 1000-600-1000 msusing the Nygren (blue dash-dotted line) and Courtemanche (black solidline) models.
slow phase of APD rate adaptation were found to be the same using eitherof the two models. Figure 3.12 shows some differences between the timecourse of the APD obtained using the same pacing protocol with the twohuman atrial cell models. The causes of these differences will be discussedin further detail in section 3.4.
From the analysis of Figure 3.12, it can be observed that, during thefast phase of adaptation, APD initially increased following HR accelerationand decreased following HR deceleration with the Nygren model, in contrastwith the results corresponding to the Courtemanche model. Due to this non-monotonic changes, fitting the fast phase with an exponential function wasnot adequate. Thus, the same simulations performed with the Courtemanchemodel to obtain the results shown in the top panels of Figure 3.10 wereperformed in order to unravel the underlying ionic mechanisms with theNygren model. As occured with the Courtemanche model, the fast phase ofAPD rate adaptation almost disappeared when either GNaCa or GCaL werestrongly inhibited.
Regarding the slow phase of APD adaptation, the main difference lay inthe shorter time needed to reach the steady-state with the Nygren model,thus entailing shorter values of t90 (288.7 and 329.6 s, following HR accel-eration and deceleration, respectively). Despite these differences, the ionicmechanisms underlying the slow phase of APD adaptation to changes inHR were the same using either of the two models. GNaK reduction by 30%entailed an increase in τslow from 145 s to 261.2 s following HR accelerationand from 131.1 s to 316.4 s following HR deceleration. These results high-light the key role of the activity of the NaK pump in the cardiac memoryof human atrial myocytes.
60Chapter 3. Quantification of APD Rate Adaptation in Human Atria and
its Relationship with Arrhythmogenesis
3.3.4 Relation between APD Rate Adaptation and Arrhyth-mogenesis
A relationship between protracted cardiac memory, i.e. slow APD adapta-tion entailing long values of τfast or τslow, and arrhythmic risk was investi-gated. In order to do this, the preclinical markers described in section 3.2.3,ρ, δ, Ss1s2 and Sdyn were quantified in simulations in which the ionic mech-anisms elucidated as underlying APD adaptation dynamics were varied by±30%Regarding the fast phase of adaptation, Figure 3.9 shows that the increase
in τfast caused by GNaCa inhibition is not directly related to an increasein the arrhythmic risk, as can be seen in the quantification of any of themarkers studied. However, an increase in τfast prompted by GCaL inhibitionwas associated with higher likelihood of generation of afterdepolarizations,produced by higher likelihood of calcium current reactivation (ρ took a valueof 0.46 when GCaL was blocked by 30%, whereas the value of ρ in controlwas 0.39), and more acute triangulation of the AP (δ = 2.99 when GCaLwas blocked by 30%, and 2.33 in control conditions). As regards the slopesof APDR curves, Ss1s2 and Sdyn, were shallower when GCaL was blocked by30% than in control conditions (Ss1s2 = 0.24 versus 0.52; Sdyn = 0.23 versus0.29). A decrease in the restitution slopes has been related in the literatureto a higher stability of reentrant arrhythmias [84].
Furthermore, Figure 3.9 shows that NaK pump inhibition contributedto notably delay the slow phase of APD adaptation. This is related to higherarrhythmic risk, as manifested by higher probability of calcium current reac-tivation (ρ = 0.40), larger AP triangulation (δ = 4.73) and shallower slopesof APDR curves (Ss1s2 = 0.29; Sdyn = 0.20) when GNaK was blocked by30%.
3.3.5 APD Rate Adaptation in Atrial versus Ventricular My-ocytes
The analogies and differences between cardiac memory in human atrial cellsand human ventricular cells were studied by comparing the results of thisstudy with those obtained with a human ventricular cell model, developedby ten Tusscher and Panfilov [91], in a previous study [80]. Despite the sub-stantial differences between AP shape and duration in atrial and ventricularcells (more triangular and significantly shorter in duration in atrial cells ascompared to ventricular cells) the APD adaptation to abrupt changes in HRfollows a very similar pattern in both types of cells and occurs in two phases:fast and slow. However, while the time needed for human ventricular cellsto adapt is about 3-4 minutes, the adaptation time in human atrial cells islonger than 8 minutes (Figure 3.13).
The ionic mechanisms underlying the fast phase of APD adaptation are
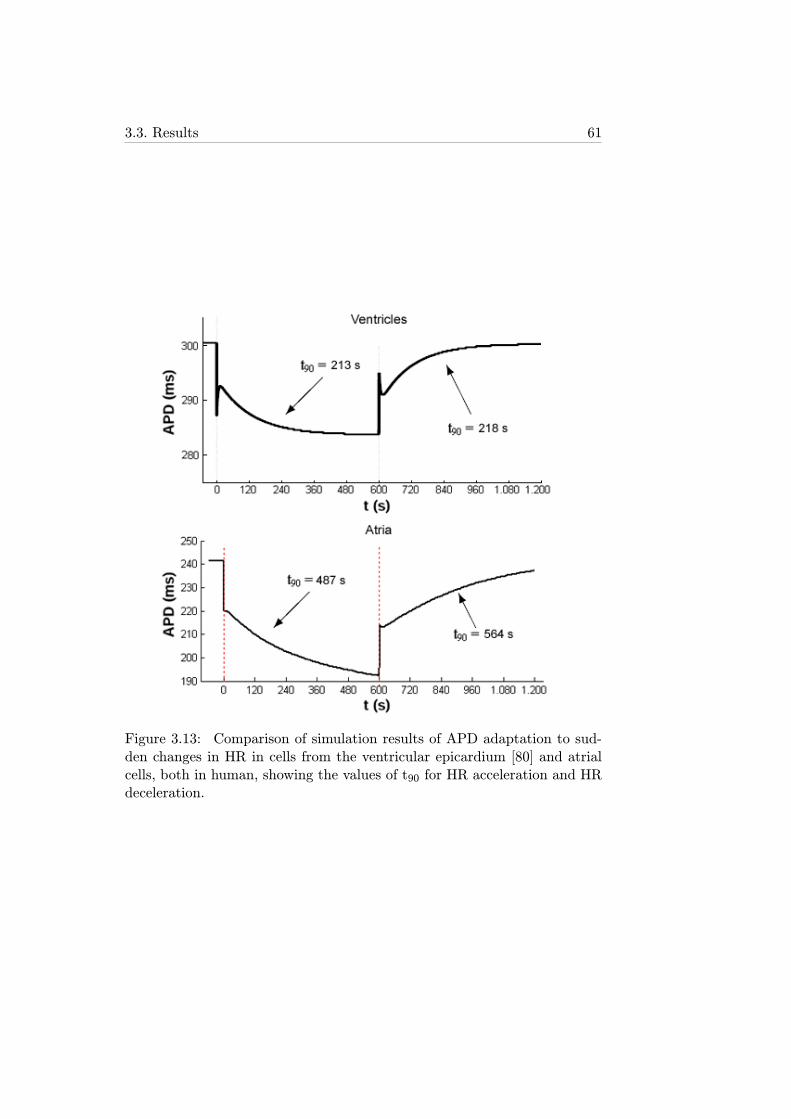
3.3. Results 61
Figure 3.13: Comparison of simulation results of APD adaptation to sud-den changes in HR in cells from the ventricular epicardium [80] and atrialcells, both in human, showing the values of t90 for HR acceleration and HRdeceleration.
62Chapter 3. Quantification of APD Rate Adaptation in Human Atria and
its Relationship with Arrhythmogenesis
somewhat different in atrium and ventricle, being the inactivation kinetics ofICaL and the activation kinetics of IKs the major determinants in ventricularcells [80], whereas in atrial cells the maximal conductances of ICaL and INaCaare the main mechanisms, as shown in the present thesis. On the otherhand, the ionic mechanisms modulating the slow phase of APD adaptationto changes in HR are common to atrial and ventricular cells, being theintracellular sodium dynamics, [Na+]i, the major determinant in both cases.
Another important difference between the activity of myocytes in bothcavities of the human heart is the generation of EADs in ventricular cellsunder conditions associated with protracted rate adaptation. EADs are pre-sented as increments in the transmembrane potential during phases 2 or 3of the AP, frequently caused by an early recovery of the activation calciumchannels. EADs do not occur when using human atrial cell models, no mat-ter the simulated conditions. However, delayed afterdepolarizations (DADs)could be generated under certain conditions with the Nygren model. DADsare characterized by the depolarization of Vm when the cell is at its rest-ing state and no external stimulation has been applied. The main cause forDADs generation is the opening of enough inward calcium channels to depo-larize the cell. An increased likelihood of generation of afterdepolarizationshas been associated in this thesis with delayed rate adaptation, as shown bythe AP triangulation and calcium current reactivation markers studied.
3.4 Discussion
The present chapter focused on investigating the response of the APD inatrial cells to sudden and sustained changes in HR. To the best of our knowl-edge, there is very little investigation on this dependence in the atria, par-ticularly in humans, and with only a few studies targeting cardiac memoryin dogs [81, 82]. Despite differences between species, this study shows thatdynamics of APD rate adaptation are similar in dog and human. In partic-ular, our simulations in human atrial cells showed that the complete processof APD adaptation to changes in HR lasts for several minutes and consistsof two phases, fast and slow, as occurs in canine experiments [81, 82].
A very limited number of experimental studies analyzing the role of theNaCa exchanger and ICaL in human atria can be found in the literature. Re-garding the NaCa exchanger, it is a protein that interchanges three sodiumions from the extracellular space with two calcium ions from the intracel-lular space in order to compensate for the large amount of inward calciumvia ICaL, as explained in section 1.2.4.5 [92]. Watano et al. related theeffects of the drug KB-R7943, a NaCa exchanger blocker, with arrhythmicprotection in guinea-pig hearts, concluding the drug acted more notably onthe NaCa exchanger in its reverse mode (extruding sodium from the celland importing calcium) and suppressed the arrhythmia previously generated
3.4. Discussion 63
with other drugs [93], in good agreement with results shown in this chapterwhere an inhibition of the NaCa exchanger protracting the fast phase ofadaptation was associated with lower arrhythmic risk through a lower like-lihood of calcium current reactivation and AP triangulation. However, anexperimental study in dogs showed that the effect of inhibiting the NaCaexchanger in its reverse mode was not useful to prevent arrhythmias gener-ated through ischemia or reperfusion [94], so the role of these mechanismscould be controversial and dependent on the species. On the other hand, theinvestigation performed by Pott et al. showed that the effect of suppressingthe NaCa exchanger in murine cardiomyocytes, which entailed a reductionin ICaL, had very slight effects in the repolarization and duration of the AP[95].
Regarding ICaL, Klein et al. studied the relationship between L-typecalcium channels and AF in human beings, concluding that the likelihoodof these channels to be open is higher in AF conditions, thus entailing ahigher activity of each individual channel, but with a reduction in the totaltransmembrane current [96]. Other experimental studies in AF, like thoseperformed by Bosch et al. in human [97] and by Laszlo et al. in rabbit[98], concluded that ICaL was significantly reduced (> 35%) in fibrillationconditions, thus entailing a notable shortening of the APDs and a decreaseddependence of atrial repolarization on HR. Yue et al. investigated the ef-fects of pacing for a long time in canine atria and concluded that ICaLplayed a key role in the modulation of the "plateau" phase of the AP thatwas strongly attenuated under AF conditions [99]. In other studies thatattempted to identify the contribution of ICaL in human atrial cells to thevalue of APD, it was conluded that this ionic current had an important rolein the autonomous control of the APD and its dependence on HR [100], ingood agreement with the results obtained in this thesis showing ICaL as akey mechanism modulating fast adaptation to HR.
The last of the ionic mechanisms involved in APD adaptation, as shownin this chapter, is the NaK pump, which has been the focus of a large num-ber of investigations. This electrogenic pump interchanges three sodium ionsfrom the intracellular space with two potassium ions from the extracellularspace using the energy provided by ATP molecules (see section 1.2.4.4).Carmeliet described its relevance on atrial cardiac memory, mainly regu-lated by the intracellular sodium concentration ([Na+]i) [92, 101]. Thisdependence explains the fact that the pumping rate is very sensitive to thestimulation rate (an increase in the stimulation rate entails an increase in[Na+]i, resulting in a larger outward ionic current). According to the studiesperformed by Wang et al. [102] and Bers et al. [103], the NaK pump hadlower activity in atrial cells than in ventricular cells (about 50% lower) dueto the lower levels of certain subunits forming the proteins that make thefunction of electrogenic pump (NaK-ATPasa). Furthermore, Bers et al. de-
64Chapter 3. Quantification of APD Rate Adaptation in Human Atria and
its Relationship with Arrhythmogenesis
scribed the numerous mechanisms of transport affecting intracellular sodiumin cardiac cells and explained that the inhibition of the NaK pump had di-rect influence on the calcium transient, increasing its maximum peak due tothe lower necessity of interchanging external sodium with internal calciumvia the NaCa exchanger [103]. As regards cardiac memory, the importanceof the NaK pump to APD adaptation at different HR was previously inves-tigated in experiments with ventricular cardiomyocytes in dogs by Boyett etal., who observed that the slow phase of adaptation practically disappearedafter blocking the NaK pump with strophantidin and ouabain [104]. Drakeet al. described the relevance of the NaK pump on the APD shortening incanine ventricular cells when the HR was increased, stating that a higheractivity of the NaK pump generated a higher density of outward currentfrom the cell, thus leading to shorter APD values [105].
In addition to elucidating the ionic mechanisms underlying cardiac mem-ory, an important point of this chapter focused on investigating how differentcardiac memory was in cells from the atria and the ventricles. Cardiac mem-ory is more pronounced in the atria, with both the fast and the slow phases ofAPD adaptation showing significantly longer time constants in comparisonwith ventricular cells [80]. The ionic mechanisms underlying cardiac mem-ory are similar in both cavities in the slow phase of adaptation (intracellularsodium dynamics and NaK pump), but not in the fast phase (conductancesof ICaL and NaCa exchanger in the atria versus kinetics of ICaL and IKs inthe ventricles).
Another important objective of this study was to relate cardiac memoryin human atria and arrhythmic risk. Simulation results show that protractedAPD rate adaptation is associated with a higher risk of generation and main-tenance of arrhythmias due to the increased likelihood of developing afterde-polarizations and the facilitation of reentrant arrhythmia stabilization. Ourresults are in good agreement with previous studies in canine atria whereAPD rate adaptation was evaluated in both normal and AF-induced condi-tions showing that protracted adaptation was strongly related to an increasein the probability of arrhythmia reactivation [81]. Furthermore, the slopesof APDR curves in conditions associated with prolonged cardiac memoryare much shallower, which could favor the stability of reentries, as describedin previous studies where CL oscillations effects on APD were analyzed [87].
3.4.1 Limitations of the Study
In this part of the thesis, the computational simulations were performedusing two different models of human atrial cells: the Courtemanche modeland the Nygren model. Each model has specific formulations for each ioniccurrent and ionic concentration, thus entailing differences in the simulationresults. Since both models were developed almost simultaneously, these dif-ferences come from the different nature and techniques of the experiments
3.4. Discussion 65
they are based on. As a consequence, this has a significant influence on therelative importance of each ionic current with respect to the rest of themin each model, thus affecting the values of the transmembrane potentialand, consequently, the AP, which is more triangular, shorter and with aless hyperpolarized resting potential. Nygren et al. thoroughly analysed thecauses of the differences between the two models and observed that almostidentical results can be obtained with both models if some ionic current con-ductances are weighted adequately [106]. Cherry et al. also studied bothmodels and compared their results when applying the same stimulation pro-tocols, concluding that both notably differ in some properties, [107, 108].This is in good agreement with the results presented here showing quanti-tative differences in the analysis of cardiac memory with the Courtemanchemodel and the Nygren model, although both shared the same underlyingionic mechanisms.
On the other hand, in this chapter cardiac memory was studied in singlecardiomyocytes and 1D fibers. However, muscle fibers in real patients arepart of 2D tissues that are also part of the whole heart, therefore the effectson arrhythmia development or reentry maintenance may vary depending onthe dimensionality of the study [109]. The extremely high computationalcost associated to combine 3D simulations and the pacing protocol neededto assess cardiac memory made it practically unaffordable (one simulationcould take a few weeks, depending on the simulation parameters and com-puting facilities). Nevertheless, APD rate adaptation in 1D fibers presentssimilar dynamics to single cells and therefore we would not expect largedifferences if the study was extended to 2D or 3D models.
Despite the mentioned limitations, the simulations performed in thisstudy provide new insights into the ionic mechanisms involved in the adapta-tion of the APD to changes in HR in human atrial cells and 1D fibers that laythe foundations of the detailed analysis performed in the next episode wheremore electrophysiological properties and their mechanisms are investigated.

Chapter 4
Ionic Modulation ofElectrophysiologicalProperties and RotorDynamics in Human Atria
4.1 Introduction
Despite the large number of studies focused on the investigation of AF mech-anisms, these remain largely unknown. As described in Chapter 1, AF isconsidered to be a reentrant arrhythmia sustained by mechanisms includ-ing rapid ectopic activity (asynchronous excitation of cells usually aroundpulmonary veins), reentrant circuits (wavefronts of electrical propagationencountering excitable tissue due to different repolarization velocities be-tween cardiac regions) and structural changes [44, 45]. Establishment andstability of reentrant circuits are favored by short refractory periods and slowconduction, enhanced by AF-induced electrical remodeling (AFER) causedby persistent AF [51]. Recent studies have stated that there are 4 generaltypes of disturbances that promote ectopic firing and reentrant mechanisms,and include the following: (1) ion channel dysfunction, (2) calcium-handlingabnormalities, (3) structural remodeling, and (4) autonomic neural dysreg-ulation [110]. Monogenic causes of AF typically promote the arrhythmia viaion channel dysfunction, but the mechanisms of the more common polygenicrisk factors are still poorly understood and under intense investigation [110].
Pharmacological management is still the main option for AF treatment[111], targeting modulation of excitability and refractoriness for rate orrhythm control [112]. Anti-arrhythmic Class I and Class III drugs are usedto decrease excitability (by inhibiting the sodium current), and prolong therefractory period (by blocking potassium currents), respectively. Multichan-
67
68Chapter 4. Ionic Modulation of Electrophysiological Properties and
Rotor Dynamics in Human Atria
nel action compounds such as amiodarone and dronedarone are commonlyused but they exhibit limited efficacy and numerous adverse side effects [113].Therefore, major breakthroughs are urgently needed for a more effective con-trol of AF [113–117], which would benefit from a systems approach to drugdevelopment [118]. A large number of studies have provided insights intothe ionic basis of atrial electrophysiology [107, 108, 117, 119–122]. Researchhas focused primarily on the role of either sodium or potassium channelblock in modulating atrial electrophysiology [123, 124], and has often beenperformed in different animal species, usually either before or after AFER[51, 99]. Importantly, new agents such as vernakalant and dronedarone, andthe commonly used amiodarone, all exhibit multichannel effects on a varietyof sodium, potassium and calcium currents [125], and even NaK pump activ-ity [126, 127]. However, very little is known about the relative importanceof drug action on each current in modulating AF-related electrophysiologyin human.
4.1.1 Objectives
The main objectives of this part of the thesis are the following:
1. Provide a systematic characterization of the relative importance oftransmembrane ionic currents in modulating key electrophysiologicalproperties and reentrant activity in human atrial tissue.
2. Assess the consequences of AF on the ionic modulators of human atrialelectrophysiology.
3. Investigate the modulation of rotor inducibility and dynamics by al-teration of key ionic current properties in SR and cAF conditions.
4. Aid in the identification of novel avenues for a more effective manage-ment of patients with AF and in the interpretation of existing findings.
5. Provide insight into differences in the response of atrial tissue to phar-macological interventions in short-term versus long-term AF.
4.2 Methods
4.2.1 Membrane Kinetics
Human atrial electrophysiology was simulated using the human atrial APmodel proposed by Maleckar et al. [18] based on the original Nygren model[13]. The Courtemanche model [15] was also used to confirmmodel-independence
4.2. Methods 69
of the main results obtained in this chapter. Both models include formula-tions for the main transmembrane ionic currents in human atrial electrophys-iology and detailed intracellular calcium dynamics, as well as homeostasisof the main ionic species involved in the course of the human atrial AP.
4.2.1.1 SR vs. AF-remodeled Cells
Default values and parameters in the models correspond to SR conditions.Specific model modifications were applied to simulate fibrillatory behaviorand the corresponding electrical remodeling that accompanies permanentAF. Permanent AF was simulated by altering the following ionic properties[119, 121, 122, 128]: 70% reduction in L-type calcium current conductance(GCaL); 50% reduction in transient outward current conductance (Gto); 50%reduction in ultrarapid delayed potassium current conductance (GKur); and100% increment in inward rectifier potassium current conductance (GK1).
4.2.2 Cell Simulations
Simulations were conducted for 20 min of periodic stimulation at a CL of1000 ms [99], for default SR and permanent AF conditions. Furthermore,simulations following variations in conductances and gate time constantsof ionic currents in a range between -100% and +300% were performed.The varied conductances included maximal value of the NaK pump currentGNaK , GK1, GKur, GCaL, maximal value of the NaCa exchanger currentGNaCa, Gto, fast inward sodium current conductance (GNa), rapid delayedrectifier potassium conductance (GKr), and slow delayed rectifier potassiumcurrent (GKs). Ionic current kinetics of INa, ICaL, Ito, IKur, IKr and IKswere also varied in the simulations, with varied parameters including activa-tion and inactivation time constants of all gating variables. APD, measuredat 90% repolarization (APD90), and RMP were calculated.
The pacing protocol described in section 3.2.1.2 was applied to charac-terize APD rate adaptation through the calculation of τfast and τslow. Thetwo APDR protocols described in section 3.2.1.2 were used to determine theS1S2 and the dynamic restitution curves, respectively. The maximal valuesof the slopes of the S1S2 and dynamic APD90 restitution curves (Ss1s2 andSdyn) were computed, as they have been previously proposed as arrhythmicrisk biomarkers related to rotor stability [86, 99]. In all single cell simula-tions, stimuli were of 2-ms duration and twice diastolic threshold amplitude(threshold is 750 pA for the Maleckar model, and 1000 pA for the Courte-manche model, for SR conditions).
70Chapter 4. Ionic Modulation of Electrophysiological Properties and
Rotor Dynamics in Human Atria
4.2.3 Tissue Simulations
Tissue simulations were conducted to characterize the main determinants ofRP, CV and rotor dynamics in human atrial tissue in SR and permanentAF conditions. Electrical propagation through atrial tissue was simulatedusing the monodomain equation with isotropic diffusion coefficient of 0.0013cm2/ms in a homogeneous tissue, similar to those used in previous stud-ies [107, 129]. Stimuli were of 2-ms duration and twice diastolic thresholdamplitude (threshold is 0.025 pA/μm3, for SR conditions with both theMaleckar and the Courtemanche models). RP and CV obtained from tis-sue simulations were evaluated in both SR and permanent AF for defaultconditions (i.e. original model parameters) and at different timings follow-ing the alteration of ionic currents properties (i.e. 1 s, 1, 3 and 5 min).In this study, a S1S2 protocol was chosen to determine the RP as in pre-vious studies [51, 130]. Thus, RP was determined by applying a train ofS1 stimuli (CL=1000 ms) at the center of a 1x1 cm2 tissue followed by anextra-stimulus (S2) at the same location for varying coupling intervals (CIs)(step of 1 ms). RP was defined as the shortest CI that ensured propaga-tion following S2 [51, 56, 130]. The tissue size in the simulations was largeenough to avoid boundary effects on RP measurements, as these were onlynoticeable in a strip of 0.25 cm close to the domain boundaries [131].
Additional simulations were conducted to determine ionic modulators ofCV. As in [107, 131, 132], CV was measured in 1D simulations following atrain of S1 stimuli (CL=1000 ms) at one end of a 1-cm long fiber. CV wascalculated as the ratio between the distance separating two distant nodes(separated 0.1 cm) located at the center of the fiber, and the time taken bythe wavefront to propagate between the two nodes following the last appliedstimulus [51, 107, 131, 132]. This approach avoids measuring CV at locationsthat are too close to the domain boundaries, as well as to avoid furtherdifficulties derived from front curvature [133]. No significant differences inCV were observed using longer fibers stimulated at CL=1000 ms.
Reentrant activity was initiated in 2D 5x5 cm2 atrial tissue by applying across-field stimulation protocol [134, 135]. As in previous studies [120, 136,137], the choice of the 2D tissue geometry avoids confounding interpretationof the ionic mechanisms with added complexities such as structural andelectrophysiological heterogeneities. A planar wavefront was initiated bya stimulus applied at the lower tissue edge, followed by another stimulusapplied on a square area in the tissue bottom-left corner at a CI within thevulnerable window (VW). The limits of the VW for reentry were calculatedas the shortest and the longest CI that resulted in sustained reentry (witha precision of 1 ms), whereas the width of the VW (Wvw) was obtained asthe difference between both VW limits.
In this thesis, simulations were conducted using the Maleckar model toassess changes in reentrant activity occurring immediately (10 s) and 5 min
4.2. Methods 71
after each ionic alteration in SR and AF. Similar simulations were not con-ducted using the Courtemanche model due to the instability of the rotors inSR conditions, as stated in previous studies [107]. Tissue simulations wereinitialized using the steady-state values obtained in single cell simulationsfor default SR and AF conditions, and following 5 min of application of thecorresponding ionic current alteration. Once established, rotors remainedstable for all conditions simulated using the Maleckar model.
Corresponding pseudo-EGM (pEGM), measured with a virtual electrodelocated at the centre of the tissue, was calculated as in [138–140]. For thecalculation of the DF, the pEGM signal was preprocessed with a fourth-order Butterworth band-pass-filter (fc1=40 Hz; fc2=250 Hz), followed by asignal-rectifier and finally a fourth-order Butterworth high-pass-filter (fc=20Hz) in order to minimize spectral components different from those of themain activation wavefront [141]. DF was obtained as the location of themaximum peak of the power spectral density of the preprocessed pEGM witha precision of 0.1 Hz. The trajectory of PS, defined as wavetips where allAP phases intersect, was calculated using the zero-normal-velocity condition[132].
4.2.4 Sensitivity Analysis
In order to ascertain the role played by ionic properties on human atrialelectrophysiological markers, a sensitivity analysis was performed. Absoluteand relative sensitivities for each of the markers to changes in each of theionic properties (ionic current conductances and time constants of the gatingvariables) were calculated as in the study of Romero et al. [142]. In brief,the absolute sensitivity Sm,p of each marker m to ±30% changes in an ionicproperty p was calculated as:
Sm,p =Cm,p,+30% − Cm,p,−30%
0.6 Cm,p,±0%100, (4.1)
where Cm,p,+30% and Cm,p,−30% are the values for the marker m after 30%increase and decrease in the value of a certain ionic property p, respectively;Cm,p,±0% is the value for the marker m when no ionic properties are varied.Therefore, Sm,p reflects the extent to which the marker m changes whenthe ionic property p is altered from -30% to +30% (i.e. by 60%). For eachmarker m, the maximum sensitivity amongst all property variations wasdefined as maxp{Sm,p}. Relative sensitivities, Rm,p, for each marker m tochanges in each ionic property p were calculated as:
Rm,p =
∣∣∣∣
Sm,p
maxp{Sm,p}
∣∣∣∣ , (4.2)
Therefore, Rm,p gives an indication of the relative importance of each ionicproperty p in modulating marker m.
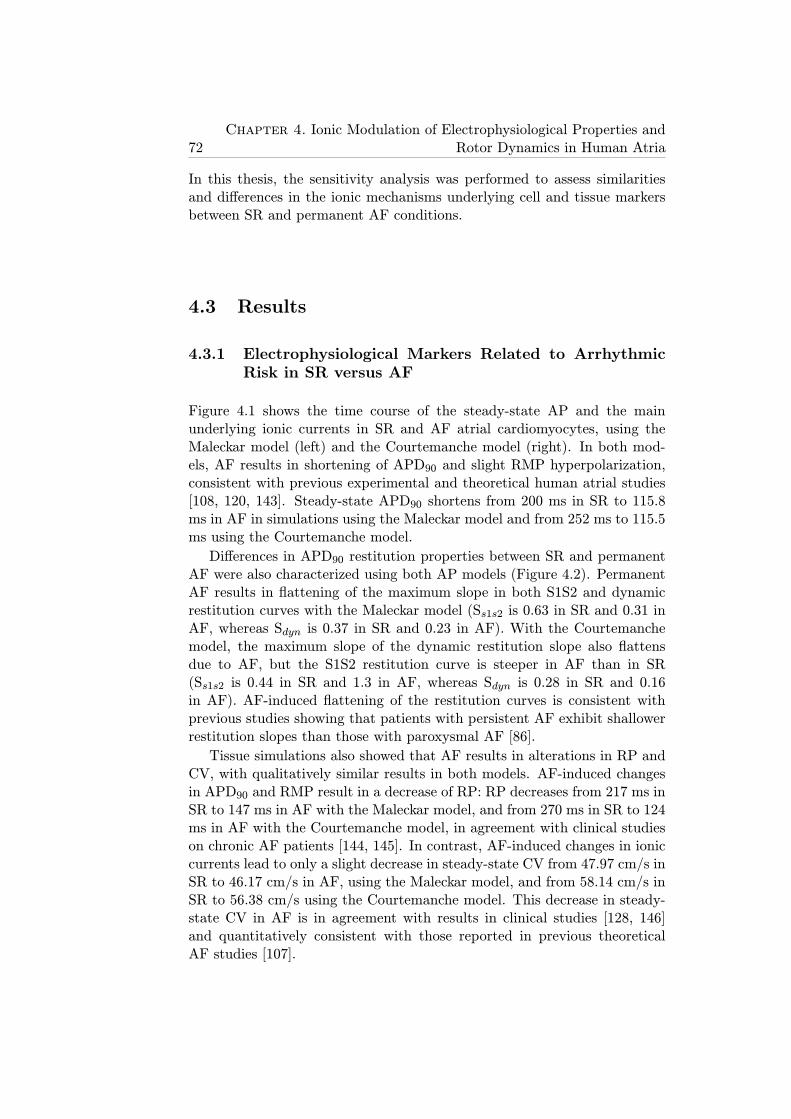
72Chapter 4. Ionic Modulation of Electrophysiological Properties and
Rotor Dynamics in Human Atria
In this thesis, the sensitivity analysis was performed to assess similaritiesand differences in the ionic mechanisms underlying cell and tissue markersbetween SR and permanent AF conditions.
4.3 Results
4.3.1 Electrophysiological Markers Related to ArrhythmicRisk in SR versus AF
Figure 4.1 shows the time course of the steady-state AP and the mainunderlying ionic currents in SR and AF atrial cardiomyocytes, using theMaleckar model (left) and the Courtemanche model (right). In both mod-els, AF results in shortening of APD90 and slight RMP hyperpolarization,consistent with previous experimental and theoretical human atrial studies[108, 120, 143]. Steady-state APD90 shortens from 200 ms in SR to 115.8ms in AF in simulations using the Maleckar model and from 252 ms to 115.5ms using the Courtemanche model.
Differences in APD90 restitution properties between SR and permanentAF were also characterized using both AP models (Figure 4.2). PermanentAF results in flattening of the maximum slope in both S1S2 and dynamicrestitution curves with the Maleckar model (Ss1s2 is 0.63 in SR and 0.31 inAF, whereas Sdyn is 0.37 in SR and 0.23 in AF). With the Courtemanchemodel, the maximum slope of the dynamic restitution slope also flattensdue to AF, but the S1S2 restitution curve is steeper in AF than in SR(Ss1s2 is 0.44 in SR and 1.3 in AF, whereas Sdyn is 0.28 in SR and 0.16in AF). AF-induced flattening of the restitution curves is consistent withprevious studies showing that patients with persistent AF exhibit shallowerrestitution slopes than those with paroxysmal AF [86].
Tissue simulations also showed that AF results in alterations in RP andCV, with qualitatively similar results in both models. AF-induced changesin APD90 and RMP result in a decrease of RP: RP decreases from 217 ms inSR to 147 ms in AF with the Maleckar model, and from 270 ms in SR to 124ms in AF with the Courtemanche model, in agreement with clinical studieson chronic AF patients [144, 145]. In contrast, AF-induced changes in ioniccurrents lead to only a slight decrease in steady-state CV from 47.97 cm/s inSR to 46.17 cm/s in AF, using the Maleckar model, and from 58.14 cm/s inSR to 56.38 cm/s using the Courtemanche model. This decrease in steady-state CV in AF is in agreement with results in clinical studies [128, 146]and quantitatively consistent with those reported in previous theoreticalAF studies [107].
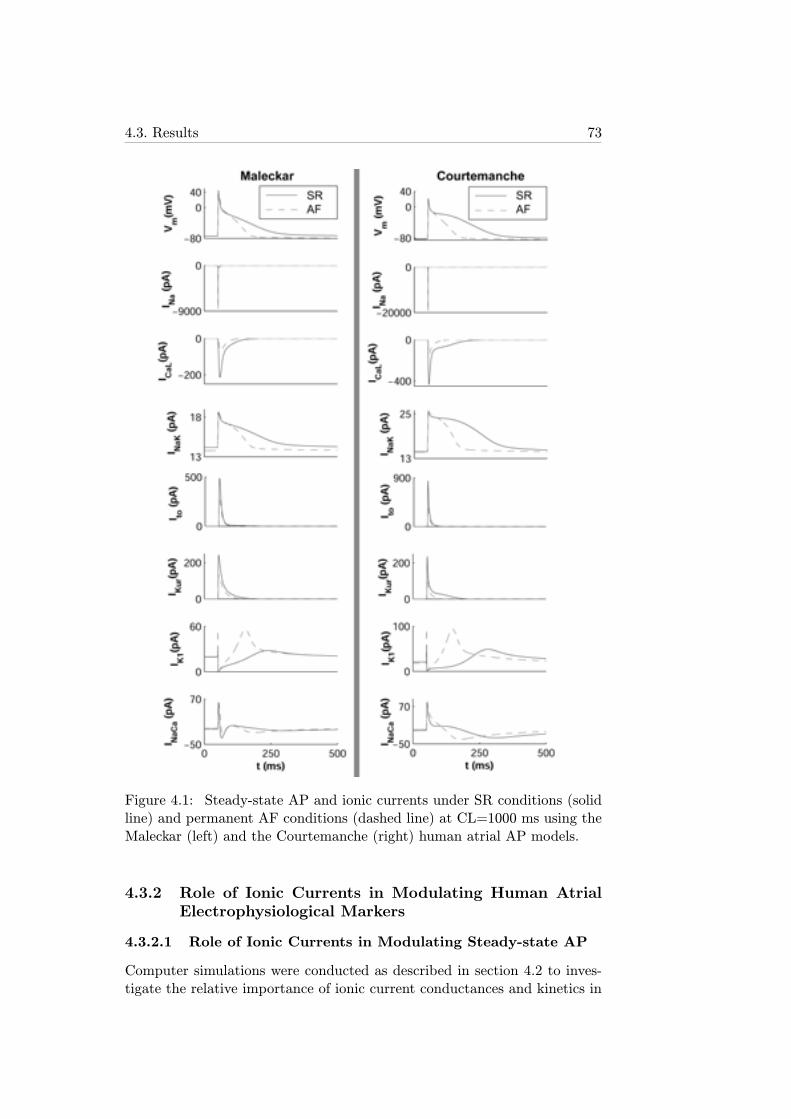
4.3. Results 73
Figure 4.1: Steady-state AP and ionic currents under SR conditions (solidline) and permanent AF conditions (dashed line) at CL=1000 ms using theMaleckar (left) and the Courtemanche (right) human atrial AP models.
4.3.2 Role of Ionic Currents in Modulating Human AtrialElectrophysiological Markers
4.3.2.1 Role of Ionic Currents in Modulating Steady-state AP
Computer simulations were conducted as described in section 4.2 to inves-tigate the relative importance of ionic current conductances and kinetics in
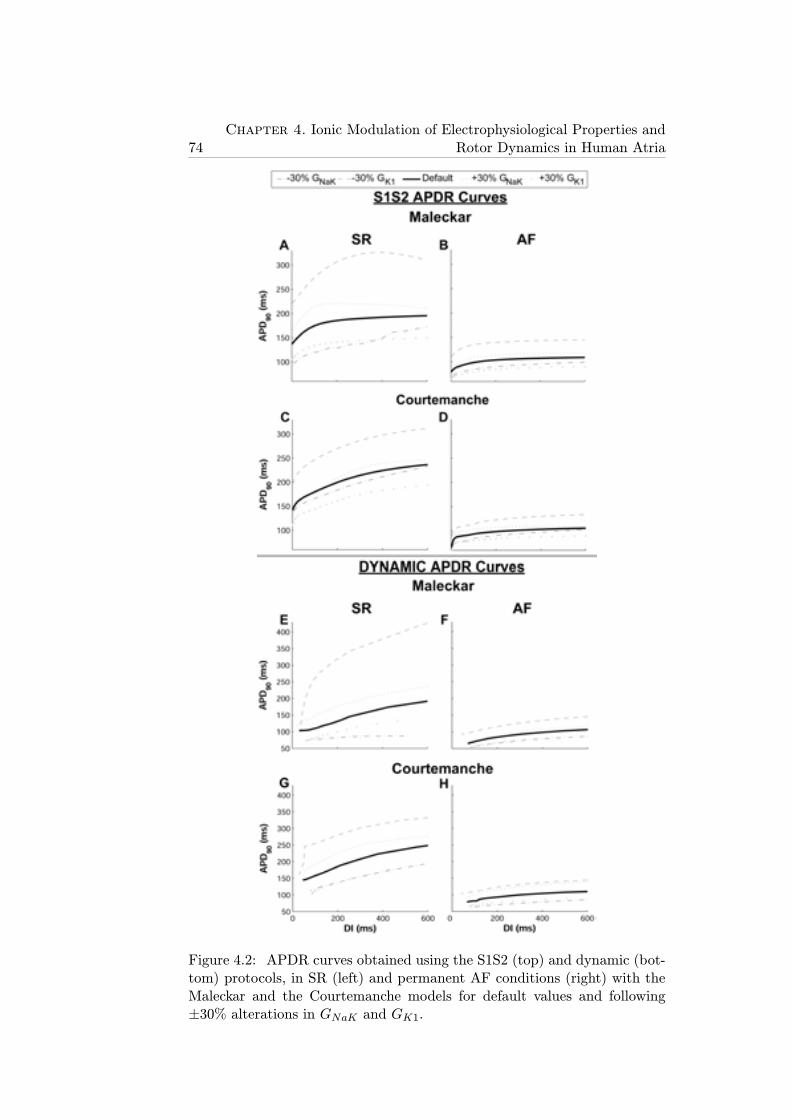
74Chapter 4. Ionic Modulation of Electrophysiological Properties and
Rotor Dynamics in Human Atria
Figure 4.2: APDR curves obtained using the S1S2 (top) and dynamic (bot-tom) protocols, in SR (left) and permanent AF conditions (right) with theMaleckar and the Courtemanche models for default values and following±30% alterations in GNaK and GK1.
4.3. Results 75
modulating human atrial electrophysiology in SR and permanent AF. Figure4.3 shows changes in steady-state AP induced by alterations in ionic conduc-tances for SR (top) and AF (bottom) using the Maleckar model. Alterationsin time constants, i.e. activation and inactivation kinetics of ionic currents,were also evaluated but results showed only small effects, i.e. <10%, inthe investigated human atrial electrophysiological properties (APD90, RMP,Ss1s2, Sdyn, RP, CV) both in SR and AF.
In SR and AF, alterations in GK1 and GNaK resulted in the largest APchanges (Figures 4.3 and 4.4 for the Maleckar model and Figure 4.5 for theCourtemanche model). GK1 inhibition resulted in significant APD90 prolon-gation and RMP depolarization (Figure 4.3A and 4.3A’ and Figure 4.4A-Dfor the Maleckar model; Figure 4.5A-D for the Courtemanche model). Thisis caused by a decrease in the total outward current and is in agreement withprevious studies [147, 148]. Interestingly, GNaK inhibition results in APD90shortening and RMP elevation (Figure 4.3B and 4.3B’ and Figure 4.4A-Dfor the Maleckar model; Figure 4.5A-D for the Courtemanche model), inagreement with experiments conducted in atrial tissue from patients treatedwith digoxin [149]. The causes underlying this counterintuitive effect willbe further described in section 4.3.3. As shown in Figure 4.4A-D for theMaleckar model and 4.5A-D for the Courtemanche model, the relative rele-vance of other conductances, such as GNa, GKur, GCaL and Gto, on steady-state APD90 is considerably lower than that of GK1 and GNaK , both in SRand AF (with the exception of the effect of GCaL in AF using the Courte-manche model, which is possibly explained by the larger magnitude of ICaLin this model (Figure 4.1)). Simulations were repeated at a shorter CL value(CL=500 ms) with the two models, confirming that GNaK and GK1 are theproperties exerting the maximum influence in modulating APD90 and RMPin human atrial cells for both stimulation rates.
Whereas, in most cases, ionic alterations resulted in similar effects inSR and AF, some differences were identified. Firstly, changes caused byionic alterations were overall smaller in AF than in SR (Figures 4.4 and 4.5,using the Maleckar and the Courtemanche model, respectively). Secondly,the effect of a 30% inhibition of GNaK implied opposite changes in RMP inSR (slight hyperpolarization) and AF (depolarization) (panels C and D inFigures 4.4 and 4.5). Larger degrees of GNaK inhibition (>50%) howeverled to RMP depolarization both in control and AF (Figure 4.3B and 4.3B’).GNaK upregulation resulted in insignificant changes in RMP in SR, but inlarger RMP depolarization in AF.
4.3.2.2 Role of Ionic Currents in Modulating APD Restitution
Simulations using the two human atrial AP models were also conducted toinvestigate the ionic mechanisms modulating S1S2 and dynamic APD resti-tution properties (Figure 4.2, Figure 4.4E-H for the Maleckar model and
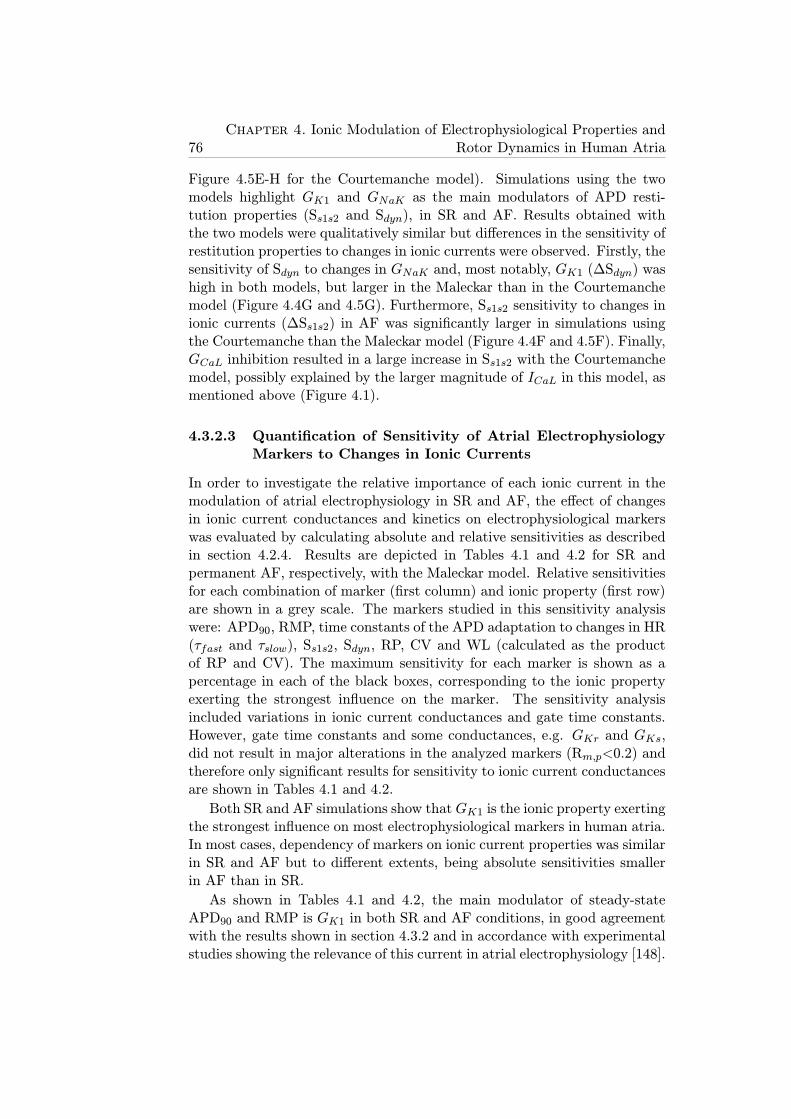
76Chapter 4. Ionic Modulation of Electrophysiological Properties and
Rotor Dynamics in Human Atria
Figure 4.5E-H for the Courtemanche model). Simulations using the twomodels highlight GK1 and GNaK as the main modulators of APD resti-tution properties (Ss1s2 and Sdyn), in SR and AF. Results obtained withthe two models were qualitatively similar but differences in the sensitivity ofrestitution properties to changes in ionic currents were observed. Firstly, thesensitivity of Sdyn to changes in GNaK and, most notably, GK1 (ΔSdyn) washigh in both models, but larger in the Maleckar than in the Courtemanchemodel (Figure 4.4G and 4.5G). Furthermore, Ss1s2 sensitivity to changes inionic currents (ΔSs1s2) in AF was significantly larger in simulations usingthe Courtemanche than the Maleckar model (Figure 4.4F and 4.5F). Finally,GCaL inhibition resulted in a large increase in Ss1s2 with the Courtemanchemodel, possibly explained by the larger magnitude of ICaL in this model, asmentioned above (Figure 4.1).
4.3.2.3 Quantification of Sensitivity of Atrial ElectrophysiologyMarkers to Changes in Ionic Currents
In order to investigate the relative importance of each ionic current in themodulation of atrial electrophysiology in SR and AF, the effect of changesin ionic current conductances and kinetics on electrophysiological markerswas evaluated by calculating absolute and relative sensitivities as describedin section 4.2.4. Results are depicted in Tables 4.1 and 4.2 for SR andpermanent AF, respectively, with the Maleckar model. Relative sensitivitiesfor each combination of marker (first column) and ionic property (first row)are shown in a grey scale. The markers studied in this sensitivity analysiswere: APD90, RMP, time constants of the APD adaptation to changes in HR(τfast and τslow), Ss1s2, Sdyn, RP, CV and WL (calculated as the productof RP and CV). The maximum sensitivity for each marker is shown as apercentage in each of the black boxes, corresponding to the ionic propertyexerting the strongest influence on the marker. The sensitivity analysisincluded variations in ionic current conductances and gate time constants.However, gate time constants and some conductances, e.g. GKr and GKs,did not result in major alterations in the analyzed markers (Rm,p<0.2) andtherefore only significant results for sensitivity to ionic current conductancesare shown in Tables 4.1 and 4.2.
Both SR and AF simulations show that GK1 is the ionic property exertingthe strongest influence on most electrophysiological markers in human atria.In most cases, dependency of markers on ionic current properties was similarin SR and AF but to different extents, being absolute sensitivities smallerin AF than in SR.
As shown in Tables 4.1 and 4.2, the main modulator of steady-stateAPD90 and RMP is GK1 in both SR and AF conditions, in good agreementwith the results shown in section 4.3.2 and in accordance with experimentalstudies showing the relevance of this current in atrial electrophysiology [148].
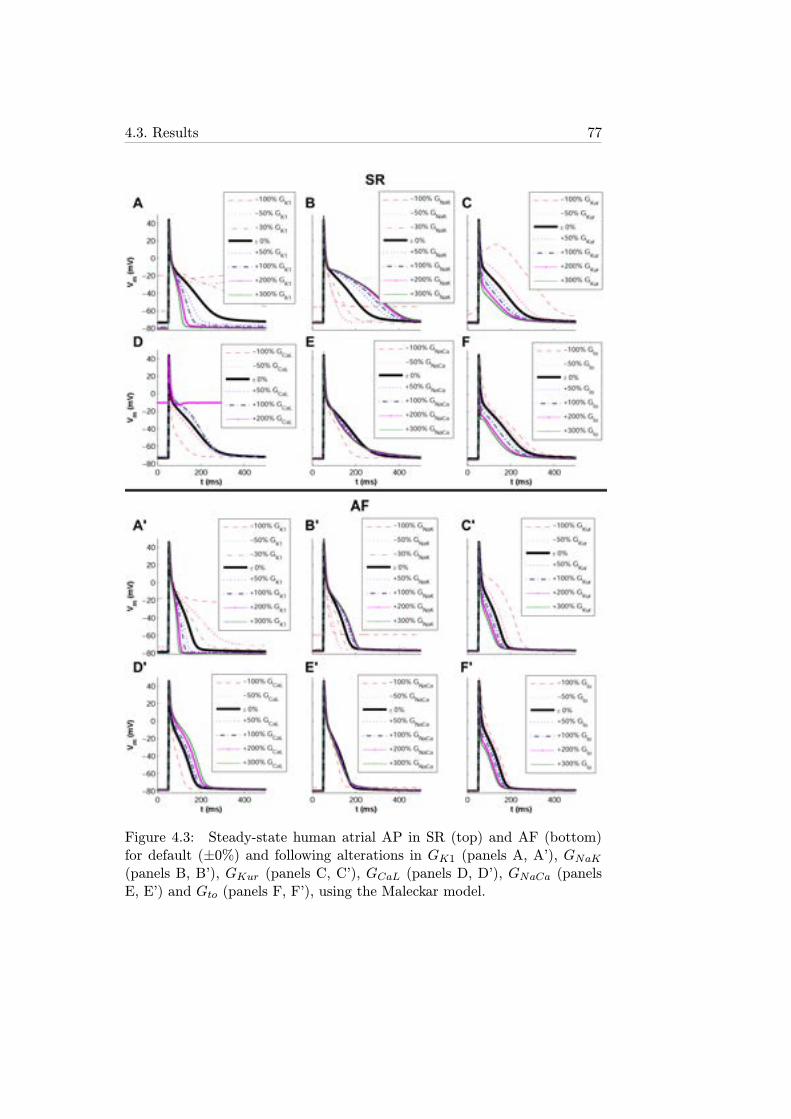
4.3. Results 77
Figure 4.3: Steady-state human atrial AP in SR (top) and AF (bottom)for default (±0%) and following alterations in GK1 (panels A, A’), GNaK(panels B, B’), GKur (panels C, C’), GCaL (panels D, D’), GNaCa (panelsE, E’) and Gto (panels F, F’), using the Maleckar model.
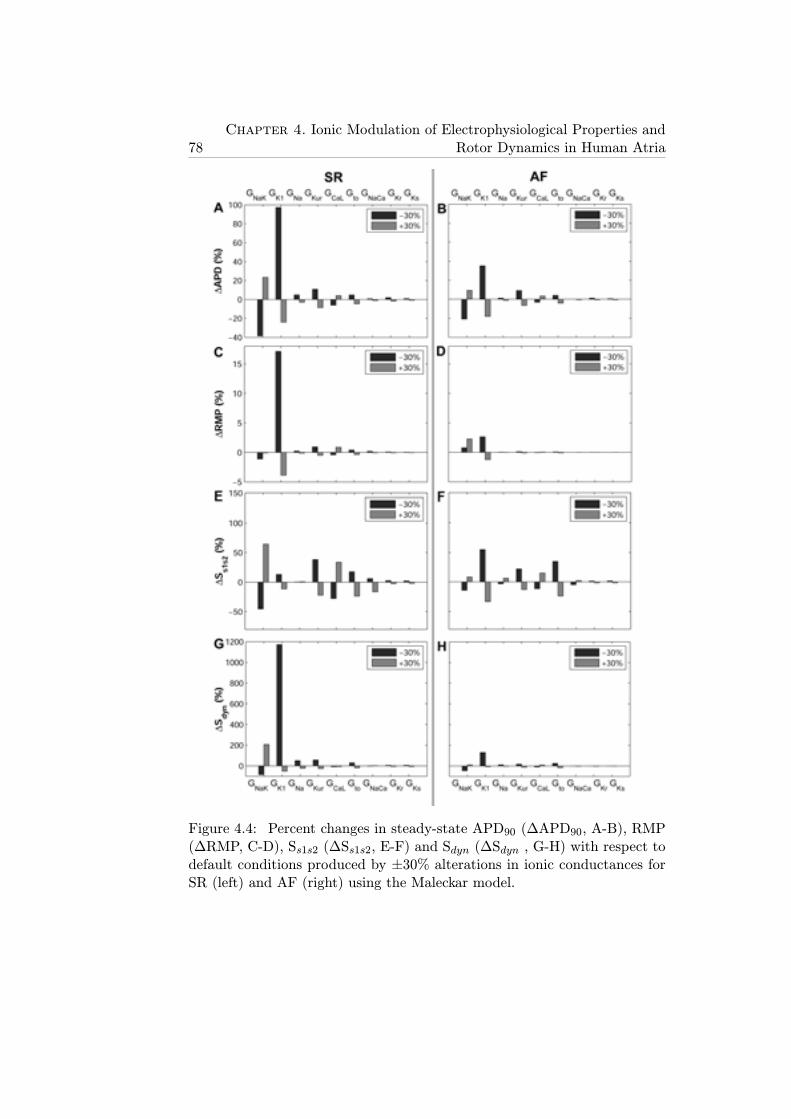
78Chapter 4. Ionic Modulation of Electrophysiological Properties and
Rotor Dynamics in Human Atria
Figure 4.4: Percent changes in steady-state APD90 (ΔAPD90, A-B), RMP(ΔRMP, C-D), Ss1s2 (ΔSs1s2, E-F) and Sdyn (ΔSdyn , G-H) with respect todefault conditions produced by ±30% alterations in ionic conductances forSR (left) and AF (right) using the Maleckar model.
4.3. Results 79
Figure 4.5: Percent changes in steady-state APD90 (ΔAPD90, A-B), RMP(ΔRMP, C-D), Ss1s2 (ΔSs1s2, E-F) and Sdyn (ΔSdyn , G-H) with respect todefault conditions produced by ±30% alterations in ionic conductances forSR (left) and AF (right) using the Courtemanche model.
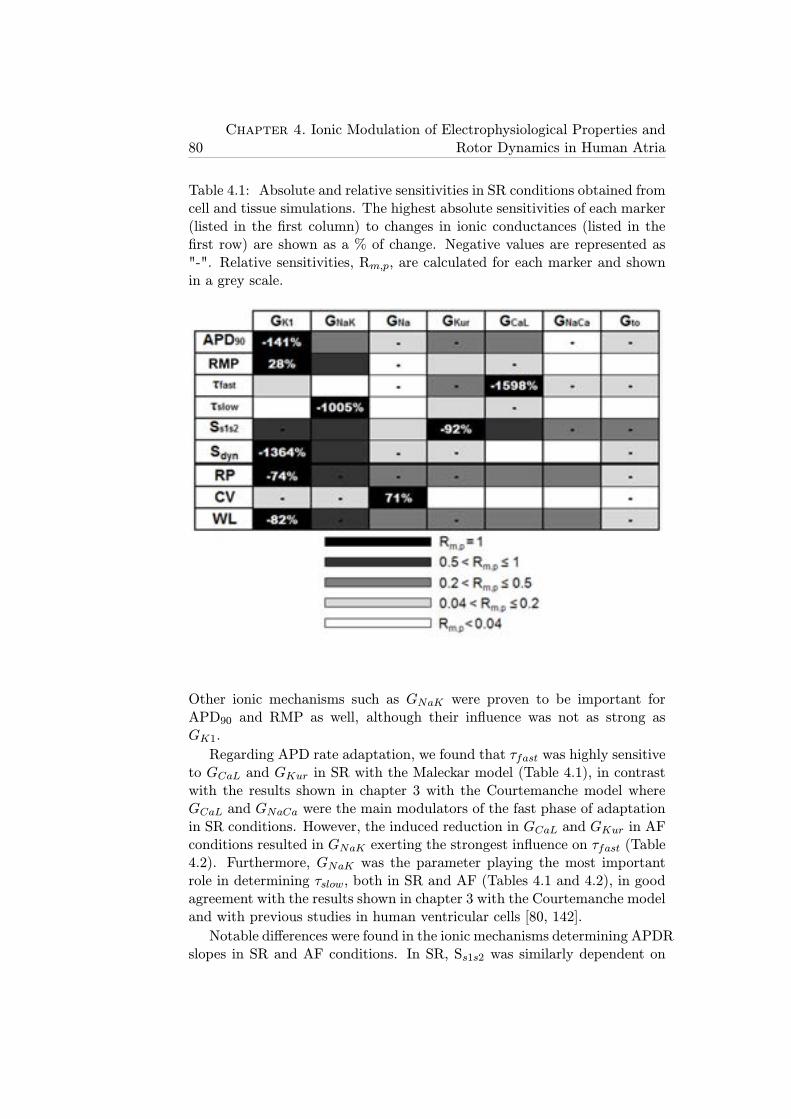
80Chapter 4. Ionic Modulation of Electrophysiological Properties and
Rotor Dynamics in Human Atria
Table 4.1: Absolute and relative sensitivities in SR conditions obtained fromcell and tissue simulations. The highest absolute sensitivities of each marker(listed in the first column) to changes in ionic conductances (listed in thefirst row) are shown as a % of change. Negative values are represented as"-". Relative sensitivities, Rm,p, are calculated for each marker and shownin a grey scale.
Other ionic mechanisms such as GNaK were proven to be important forAPD90 and RMP as well, although their influence was not as strong asGK1.
Regarding APD rate adaptation, we found that τfast was highly sensitiveto GCaL and GKur in SR with the Maleckar model (Table 4.1), in contrastwith the results shown in chapter 3 with the Courtemanche model whereGCaL and GNaCa were the main modulators of the fast phase of adaptationin SR conditions. However, the induced reduction in GCaL and GKur in AFconditions resulted in GNaK exerting the strongest influence on τfast (Table4.2). Furthermore, GNaK was the parameter playing the most importantrole in determining τslow, both in SR and AF (Tables 4.1 and 4.2), in goodagreement with the results shown in chapter 3 with the Courtemanche modeland with previous studies in human ventricular cells [80, 142].
Notable differences were found in the ionic mechanisms determining APDRslopes in SR and AF conditions. In SR, Ss1s2 was similarly dependent on
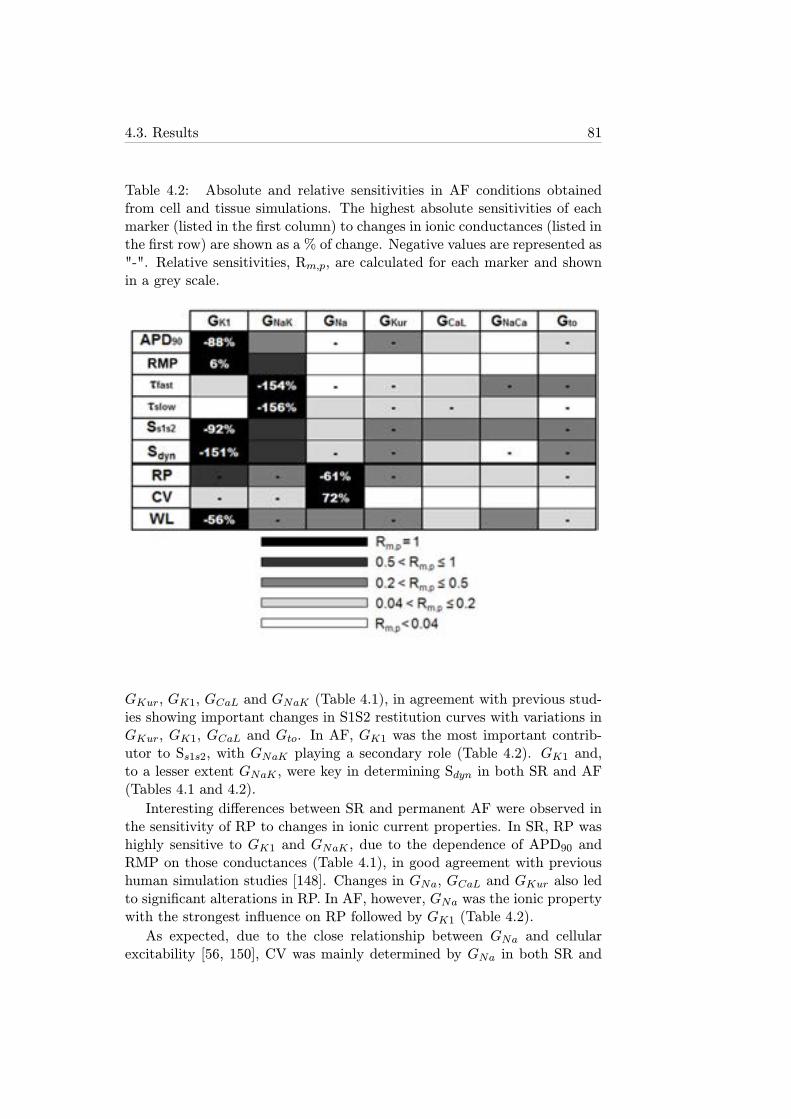
4.3. Results 81
Table 4.2: Absolute and relative sensitivities in AF conditions obtainedfrom cell and tissue simulations. The highest absolute sensitivities of eachmarker (listed in the first column) to changes in ionic conductances (listed inthe first row) are shown as a % of change. Negative values are represented as"-". Relative sensitivities, Rm,p, are calculated for each marker and shownin a grey scale.
GKur, GK1, GCaL and GNaK (Table 4.1), in agreement with previous stud-ies showing important changes in S1S2 restitution curves with variations inGKur, GK1, GCaL and Gto. In AF, GK1 was the most important contrib-utor to Ss1s2, with GNaK playing a secondary role (Table 4.2). GK1 and,to a lesser extent GNaK , were key in determining Sdyn in both SR and AF(Tables 4.1 and 4.2).
Interesting differences between SR and permanent AF were observed inthe sensitivity of RP to changes in ionic current properties. In SR, RP washighly sensitive to GK1 and GNaK , due to the dependence of APD90 andRMP on those conductances (Table 4.1), in good agreement with previoushuman simulation studies [148]. Changes in GNa, GCaL and GKur also ledto significant alterations in RP. In AF, however, GNa was the ionic propertywith the strongest influence on RP followed by GK1 (Table 4.2).
As expected, due to the close relationship between GNa and cellularexcitability [56, 150], CV was mainly determined by GNa in both SR and
82Chapter 4. Ionic Modulation of Electrophysiological Properties and
Rotor Dynamics in Human Atria
AF with similar absolute sensitivities, whereas the influence of other ionicmechanisms on CV was insignificant (Tables 4.1 and 4.2).
Interestingly, WL was strongly affected by GK1 and, to a lesser extent,GNaK in both SR and AF. The importance of GNa in modulating WL washowever reduced by the fact that it led to opposite-sign effects in RP andCV (Tables 4.1 and 4.2)[56, 150].
4.3.3 Temporal Adaptation of Human Atrial Electrophysio-logical Markers to Changes in Ionic Currents
Simulation results shown in the previous section highlight the importanceof GNaK and GK1 in modulating steady-state AP and restitution propertiesusing two human atrial models, but the transient response of these prop-erties is important to determine underlying causes of the steady-state val-ues obtained, particularly in those cases presenting counterintuitive resultssuch as GNaK inhibition. An analysis of the temporal evolution of elec-trophysiological properties following ionic current alterations showed thatatrial electrophysiological properties do not adapt instantaneously. Boththe time required to complete the adaptation and the temporal evolutionof the analyzed properties strongly depended on the specific ionic currentbeing altered. Figure 4.6 illustrates the temporal evolution of human atrialAP properties (APD90 and RMP) following ±30% changes in ionic currentsin SR (Figure 4.6A, 4.6C) and AF (Figure 4.6B, 4.6D) using the Maleckarmodel. The effects of ionic changes in modulating the temporal evolution ofRP and CV were also investigated, as shown in Figure 4.6E-H. In these simu-lations, alterations in GNaK , GK1 and GNa were considered, since GNaK andGK1 were identified as the main modulators of steady-state repolarizationproperties in our study and GNa has been shown to have an important effecton atrial conductivity [151]. Alterations in ionic conductances other thanGNaK , GK1 and GNa led to a fast adaptation response and small changesin the investigated properties and are therefore not shown.
As shown in Figure 4.6, RP and CV values could not be obtained fol-lowing 5 min of IK1 blockade due to repolarization failure and subsequentpropagation failure (panels E and G). This was caused by the gradual accu-mulation of electrotonic effects associated with the propagation of the tri-angular atrial AP. In this setting, the electrotonic current resulted in a netinward current opposing the outward potassium currents during the repolar-ization phase of the AP, which eventually resulted in repolarization failure.This was observed using the two models, although with a smaller degree ofIK1 blockade in the Maleckar than in the Courtemanche model, due to thesmaller contribution of IK1 to repolarization reserve in the Courtemanchemodel. RP and CV results computed with the Courtemanche model werequalitatively similar to those obtained with the Maleckar model, but therelative importance of GNa in modulating RP in AF was slightly decreased
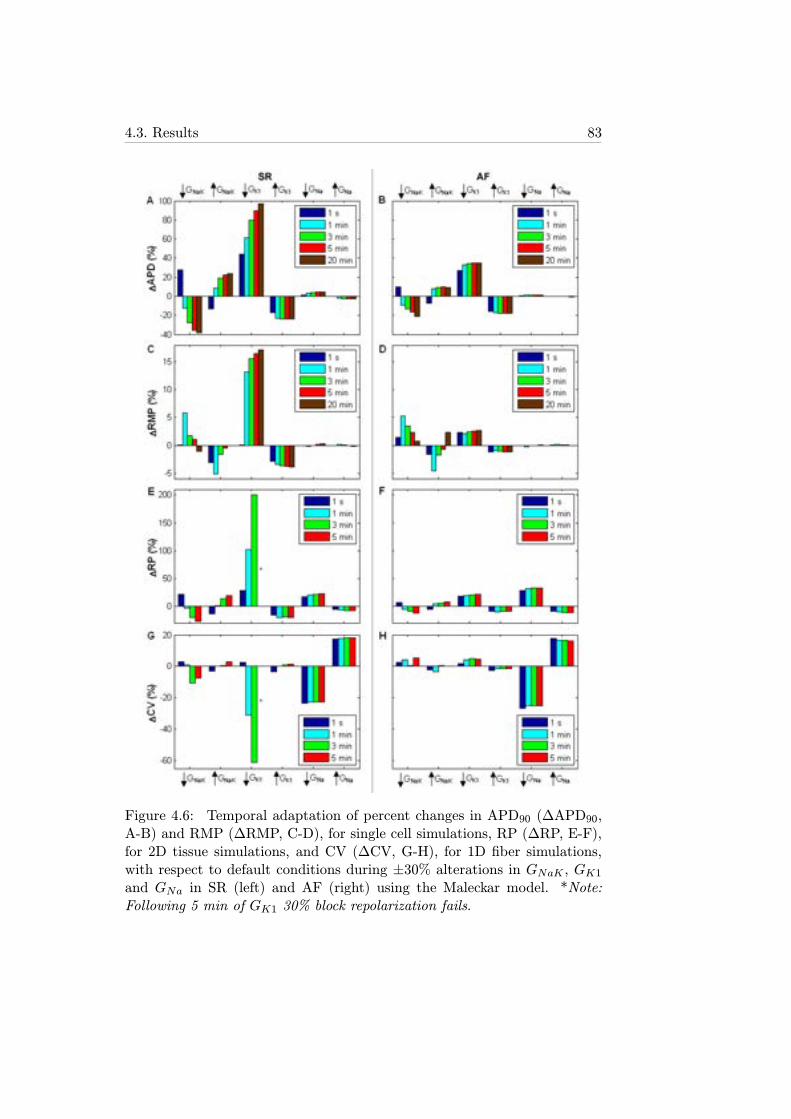
4.3. Results 83
Figure 4.6: Temporal adaptation of percent changes in APD90 (ΔAPD90,A-B) and RMP (ΔRMP, C-D), for single cell simulations, RP (ΔRP, E-F),for 2D tissue simulations, and CV (ΔCV, G-H), for 1D fiber simulations,with respect to default conditions during ±30% alterations in GNaK , GK1and GNa in SR (left) and AF (right) using the Maleckar model. *Note:Following 5 min of GK1 30% block repolarization fails.
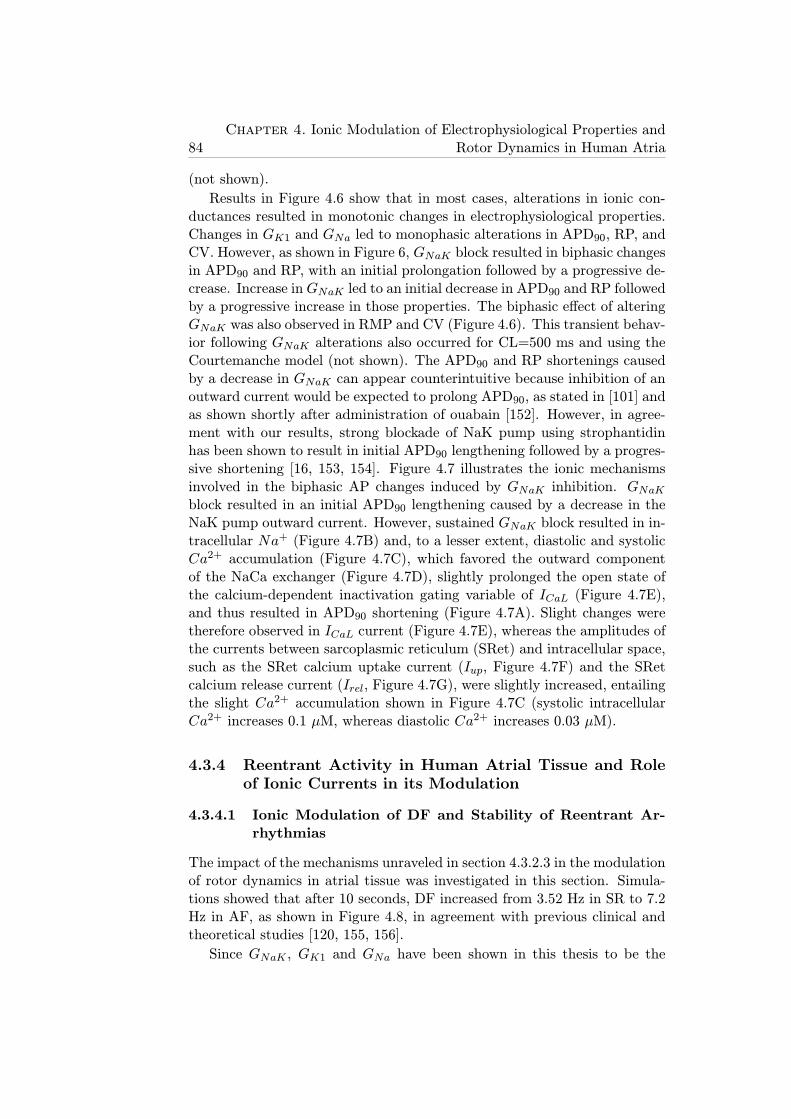
84Chapter 4. Ionic Modulation of Electrophysiological Properties and
Rotor Dynamics in Human Atria
(not shown).
Results in Figure 4.6 show that in most cases, alterations in ionic con-ductances resulted in monotonic changes in electrophysiological properties.Changes in GK1 and GNa led to monophasic alterations in APD90, RP, andCV. However, as shown in Figure 6, GNaK block resulted in biphasic changesin APD90 and RP, with an initial prolongation followed by a progressive de-crease. Increase inGNaK led to an initial decrease in APD90 and RP followedby a progressive increase in those properties. The biphasic effect of alteringGNaK was also observed in RMP and CV (Figure 4.6). This transient behav-ior following GNaK alterations also occurred for CL=500 ms and using theCourtemanche model (not shown). The APD90 and RP shortenings causedby a decrease in GNaK can appear counterintuitive because inhibition of anoutward current would be expected to prolong APD90, as stated in [101] andas shown shortly after administration of ouabain [152]. However, in agree-ment with our results, strong blockade of NaK pump using strophantidinhas been shown to result in initial APD90 lengthening followed by a progres-sive shortening [16, 153, 154]. Figure 4.7 illustrates the ionic mechanismsinvolved in the biphasic AP changes induced by GNaK inhibition. GNaKblock resulted in an initial APD90 lengthening caused by a decrease in theNaK pump outward current. However, sustained GNaK block resulted in in-tracellular Na+ (Figure 4.7B) and, to a lesser extent, diastolic and systolicCa2+ accumulation (Figure 4.7C), which favored the outward componentof the NaCa exchanger (Figure 4.7D), slightly prolonged the open state ofthe calcium-dependent inactivation gating variable of ICaL (Figure 4.7E),and thus resulted in APD90 shortening (Figure 4.7A). Slight changes weretherefore observed in ICaL current (Figure 4.7E), whereas the amplitudes ofthe currents between sarcoplasmic reticulum (SRet) and intracellular space,such as the SRet calcium uptake current (Iup, Figure 4.7F) and the SRetcalcium release current (Irel, Figure 4.7G), were slightly increased, entailingthe slight Ca2+ accumulation shown in Figure 4.7C (systolic intracellularCa2+ increases 0.1 μM, whereas diastolic Ca2+ increases 0.03 μM).
4.3.4 Reentrant Activity in Human Atrial Tissue and Roleof Ionic Currents in its Modulation
4.3.4.1 Ionic Modulation of DF and Stability of Reentrant Ar-rhythmias
The impact of the mechanisms unraveled in section 4.3.2.3 in the modulationof rotor dynamics in atrial tissue was investigated in this section. Simula-tions showed that after 10 seconds, DF increased from 3.52 Hz in SR to 7.2Hz in AF, as shown in Figure 4.8, in agreement with previous clinical andtheoretical studies [120, 155, 156].
Since GNaK , GK1 and GNa have been shown in this thesis to be the
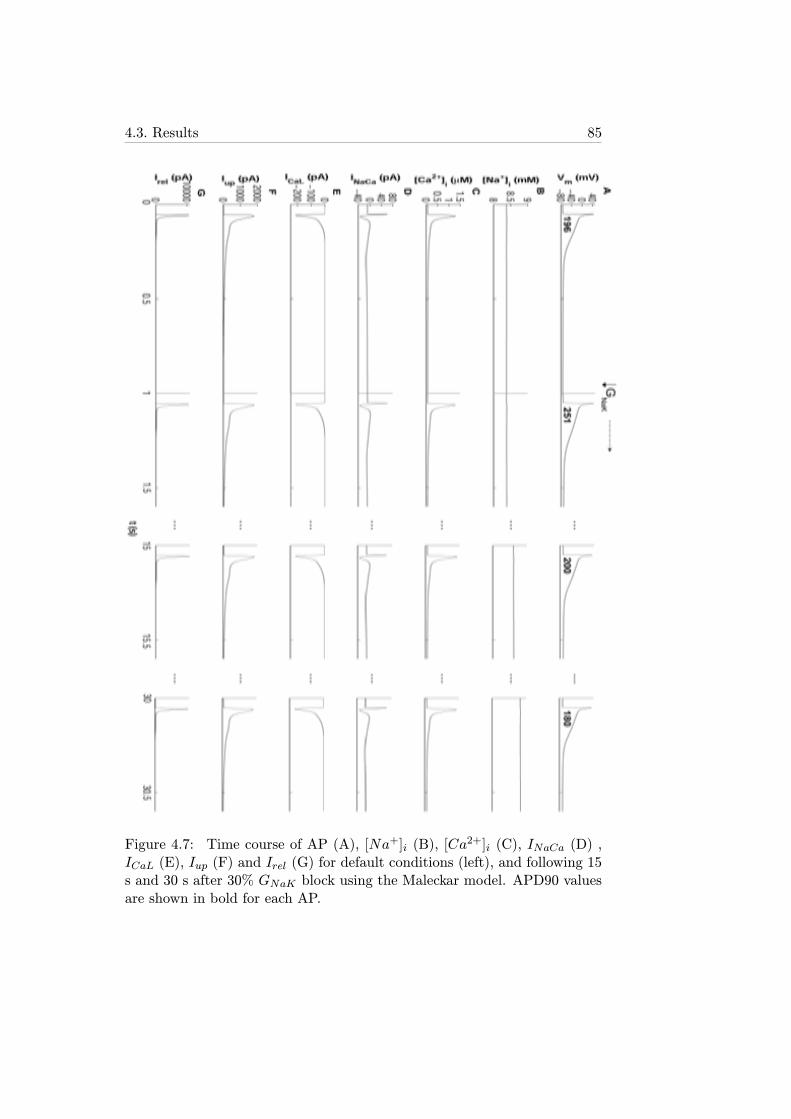
4.3. Results 85
Figure 4.7: Time course of AP (A), [Na+]i (B), [Ca2+]i (C), INaCa (D) ,
ICaL (E), Iup (F) and Irel (G) for default conditions (left), and following 15s and 30 s after 30% GNaK block using the Maleckar model. APD90 valuesare shown in bold for each AP.
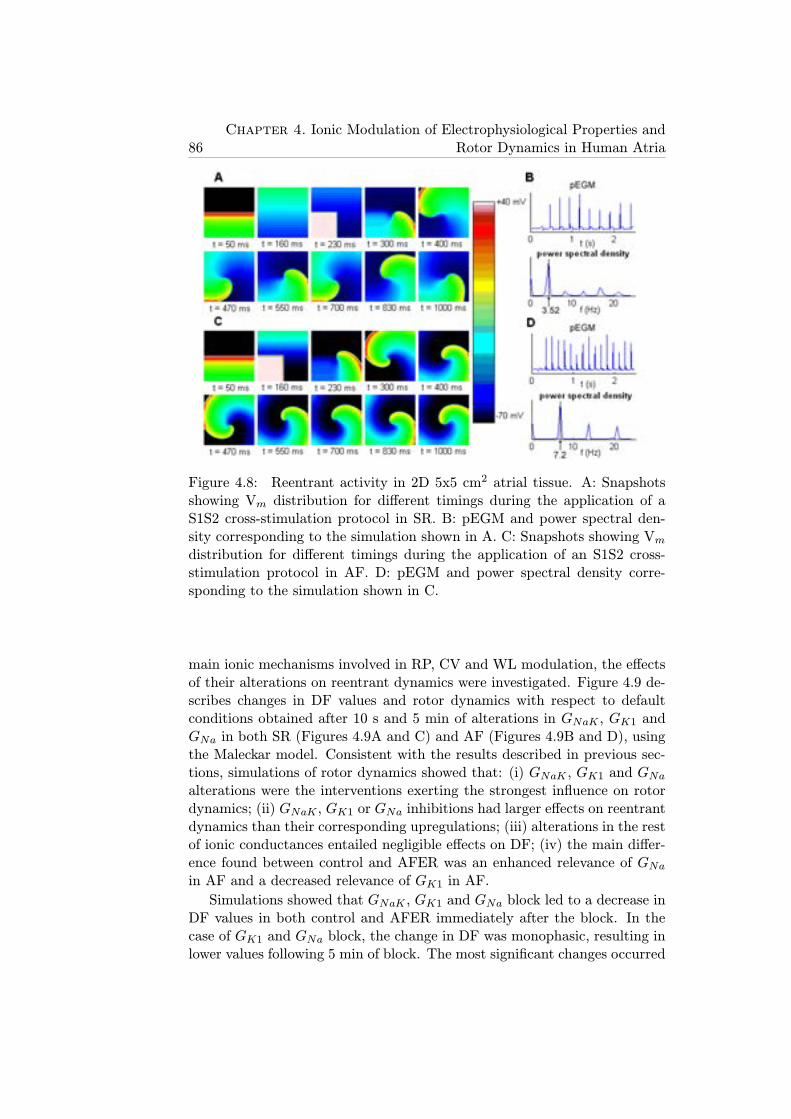
86Chapter 4. Ionic Modulation of Electrophysiological Properties and
Rotor Dynamics in Human Atria
Figure 4.8: Reentrant activity in 2D 5x5 cm2 atrial tissue. A: Snapshotsshowing Vm distribution for different timings during the application of aS1S2 cross-stimulation protocol in SR. B: pEGM and power spectral den-sity corresponding to the simulation shown in A. C: Snapshots showing Vmdistribution for different timings during the application of an S1S2 cross-stimulation protocol in AF. D: pEGM and power spectral density corre-sponding to the simulation shown in C.
main ionic mechanisms involved in RP, CV and WL modulation, the effectsof their alterations on reentrant dynamics were investigated. Figure 4.9 de-scribes changes in DF values and rotor dynamics with respect to defaultconditions obtained after 10 s and 5 min of alterations in GNaK , GK1 andGNa in both SR (Figures 4.9A and C) and AF (Figures 4.9B and D), usingthe Maleckar model. Consistent with the results described in previous sec-tions, simulations of rotor dynamics showed that: (i) GNaK , GK1 and GNaalterations were the interventions exerting the strongest influence on rotordynamics; (ii) GNaK , GK1 or GNa inhibitions had larger effects on reentrantdynamics than their corresponding upregulations; (iii) alterations in the restof ionic conductances entailed negligible effects on DF; (iv) the main differ-ence found between control and AFER was an enhanced relevance of GNain AF and a decreased relevance of GK1 in AF.
Simulations showed that GNaK , GK1 and GNa block led to a decrease inDF values in both control and AFER immediately after the block. In thecase of GK1 and GNa block, the change in DF was monophasic, resulting inlower values following 5 min of block. The most significant changes occurred
4.3. Results 87
Figure 4.9: Percent changes in DF (ΔDF) with respect to default conditionsproduced by ±30% alterations in GNaK , GK1 and GNa in SR (A) and AF(B) using the Maleckar model. DF values are shown for reentry initiated at10 s (blue bars) and 5 min (red bars) following changes in ionic parameters.Snapshots of reentry 10 s after the change in ionic parameters under defaultconditions and 30% block of GNaK , GK1 and GNa in SR (C) and AF (D).Black lines on snapshots represent the corresponding PS trajectories.
in two cases. Firstly, GK1 block in SR led to an immediate decrease in DFwith respect to default conditions (Figure 4.9A). Secondly, GNa block inAF resulted in a decrease in DF (Figure 4.9B). These effects were explainedby the relative importance of GK1 and GNa in modulating RP and CV inSR and AF, respectively, as highlighted in Figure 4.6E-H. As expected fromthe results shown in the previous section, alterations in GNaK resultED inbiphasic temporal changes in DF. A decrease in GNaK initially decreasedDF, but then led to an increase following 5 min block. An increase in GNaKhad the opposite effect (Figures 4.9A and B).
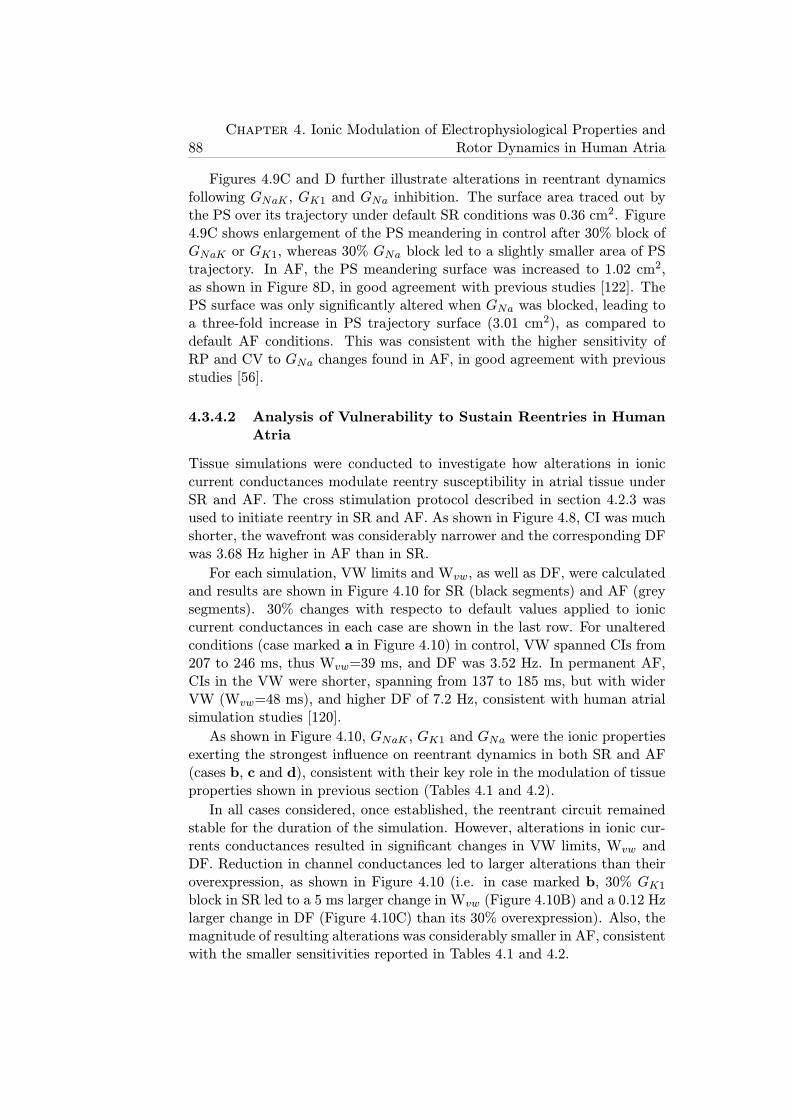
88Chapter 4. Ionic Modulation of Electrophysiological Properties and
Rotor Dynamics in Human Atria
Figures 4.9C and D further illustrate alterations in reentrant dynamicsfollowing GNaK , GK1 and GNa inhibition. The surface area traced out bythe PS over its trajectory under default SR conditions was 0.36 cm2. Figure4.9C shows enlargement of the PS meandering in control after 30% block ofGNaK or GK1, whereas 30% GNa block led to a slightly smaller area of PStrajectory. In AF, the PS meandering surface was increased to 1.02 cm2,as shown in Figure 8D, in good agreement with previous studies [122]. ThePS surface was only significantly altered when GNa was blocked, leading toa three-fold increase in PS trajectory surface (3.01 cm2), as compared todefault AF conditions. This was consistent with the higher sensitivity ofRP and CV to GNa changes found in AF, in good agreement with previousstudies [56].
4.3.4.2 Analysis of Vulnerability to Sustain Reentries in HumanAtria
Tissue simulations were conducted to investigate how alterations in ioniccurrent conductances modulate reentry susceptibility in atrial tissue underSR and AF. The cross stimulation protocol described in section 4.2.3 wasused to initiate reentry in SR and AF. As shown in Figure 4.8, CI was muchshorter, the wavefront was considerably narrower and the corresponding DFwas 3.68 Hz higher in AF than in SR.
For each simulation, VW limits and Wvw, as well as DF, were calculatedand results are shown in Figure 4.10 for SR (black segments) and AF (greysegments). 30% changes with respecto to default values applied to ioniccurrent conductances in each case are shown in the last row. For unalteredconditions (case marked a in Figure 4.10) in control, VW spanned CIs from207 to 246 ms, thus Wvw=39 ms, and DF was 3.52 Hz. In permanent AF,CIs in the VW were shorter, spanning from 137 to 185 ms, but with widerVW (Wvw=48 ms), and higher DF of 7.2 Hz, consistent with human atrialsimulation studies [120].
As shown in Figure 4.10, GNaK , GK1 and GNa were the ionic propertiesexerting the strongest influence on reentrant dynamics in both SR and AF(cases b, c and d), consistent with their key role in the modulation of tissueproperties shown in previous section (Tables 4.1 and 4.2).
In all cases considered, once established, the reentrant circuit remainedstable for the duration of the simulation. However, alterations in ionic cur-rents conductances resulted in significant changes in VW limits, Wvw andDF. Reduction in channel conductances led to larger alterations than theiroverexpression, as shown in Figure 4.10 (i.e. in case marked b, 30% GK1block in SR led to a 5 ms larger change in Wvw (Figure 4.10B) and a 0.12 Hzlarger change in DF (Figure 4.10C) than its 30% overexpression). Also, themagnitude of resulting alterations was considerably smaller in AF, consistentwith the smaller sensitivities reported in Tables 4.1 and 4.2.
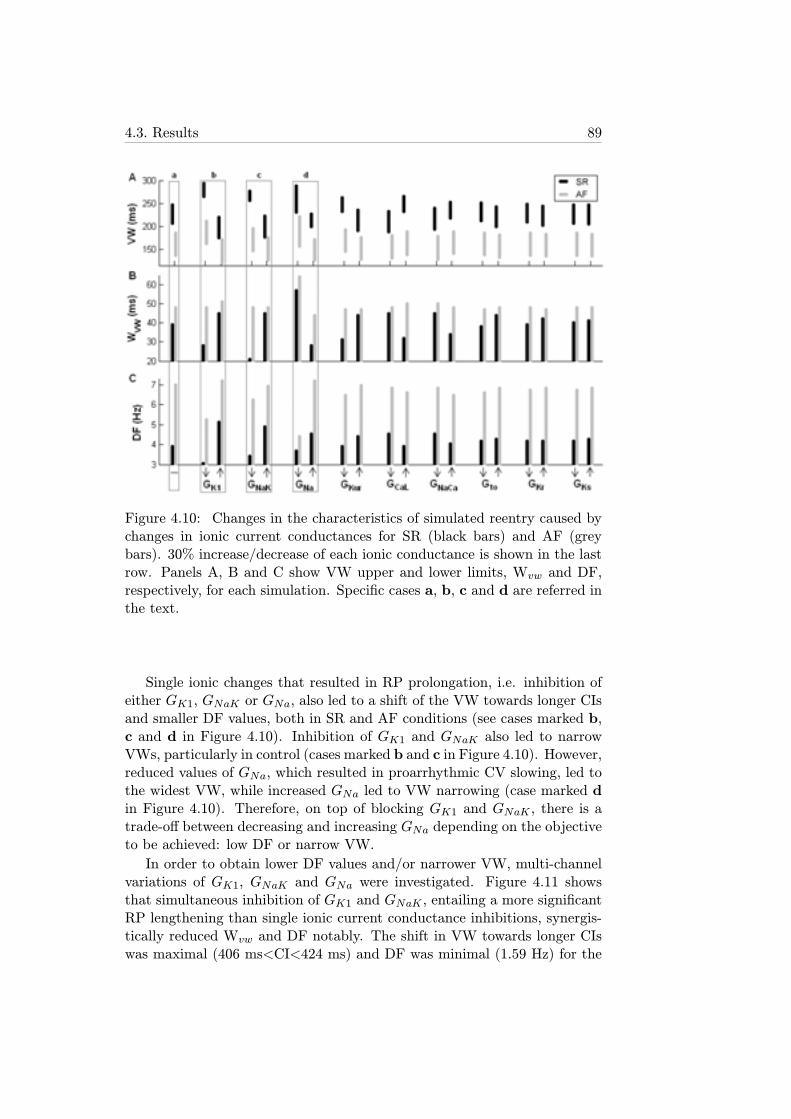
4.3. Results 89
Figure 4.10: Changes in the characteristics of simulated reentry caused bychanges in ionic current conductances for SR (black bars) and AF (greybars). 30% increase/decrease of each ionic conductance is shown in the lastrow. Panels A, B and C show VW upper and lower limits, Wvw and DF,respectively, for each simulation. Specific cases a, b, c and d are referred inthe text.
Single ionic changes that resulted in RP prolongation, i.e. inhibition ofeither GK1, GNaK or GNa, also led to a shift of the VW towards longer CIsand smaller DF values, both in SR and AF conditions (see cases marked b,c and d in Figure 4.10). Inhibition of GK1 and GNaK also led to narrowVWs, particularly in control (cases marked b and c in Figure 4.10). However,reduced values of GNa, which resulted in proarrhythmic CV slowing, led tothe widest VW, while increased GNa led to VW narrowing (case marked din Figure 4.10). Therefore, on top of blocking GK1 and GNaK , there is atrade-off between decreasing and increasing GNa depending on the objectiveto be achieved: low DF or narrow VW.
In order to obtain lower DF values and/or narrower VW, multi-channelvariations of GK1, GNaK and GNa were investigated. Figure 4.11 showsthat simultaneous inhibition of GK1 and GNaK , entailing a more significantRP lengthening than single ionic current conductance inhibitions, synergis-tically reduced Wvw and DF notably. The shift in VW towards longer CIswas maximal (406 ms<CI<424 ms) and DF was minimal (1.59 Hz) for the
90Chapter 4. Ionic Modulation of Electrophysiological Properties and
Rotor Dynamics in Human Atria
concomitant inhibition of the three conductances: GK1, GNaK and GNa(case marked e in Figure 4.11). This can be explained by the fact that, asshown in Tables 4.1 and 4.2, alterations in GK1, GNaK and GNa resultedin changes in RP of the same sign, and thus their simultaneous inhibitionby 30% resulted in a large RP prolongation. Importantly, the concomitantoverexpression of GNa and inhibition of GK1 and GNaK resulted in the nar-rowest VW (case marked f in Figure 4.11) spanning only 3 ms in controland 28 ms in AF, making the establishment of reentrant circuits unlikely.This can be explained by the fact that WL is almost doubled under theseconditions, in both SR and AF, due to the concurrent increment in RP andCV (Tables 4.1 and 4.2).
Figure 4.11: Changes in the characteristics of simulated reentry caused bysimultaneous changes in GK1, GNaK and GNa for SR (black bars) and AF(grey bars). 30% increase/decrease in GK1, GNaK and GNa for each case isshown in the last row. Panels A, B and C show VW upper and lower limits,Wvw and DF, respectively, for each simulation. Specific cases a (same as inFigure 4.10), e and f are referred in the text.
Interestingly, a single rotor was initiated in most of the simulated cases
4.4. Discussion 91
when the CI between stimuli was within the VW, whereas a double rotorwas only generated under very specific conditions, such as the simultaneousinhibition of GNa and overexpression of GK1 in AF with a CI=215 ms.
4.4 Discussion
In this chapter, a systematic investigation was conducted to identify the rel-ative importance of ionic current conductances and kinetics in modulatingrefractoriness, CV and rotor dynamics in human atrial tissue in the pres-ence and absence of AF. Throughout the present study, simulation resultswere compared to previous experimental and theoretical studies to recon-struct the complex mosaic of the ionic basis of AF-related mechanisms inhuman in a systematic framework. Simulations using two human atrial APmodels were conducted to support the model independence of the mainfindings of the study. The simulation results obtained with the two modelswere overall qualitatively similar, but quantitative differences were observed,which could possibly be due to variability in human atrial electrophysiolog-ical measurements or differences in model construction. This analysis aidsin the interpretation of existing controversies in our understanding of theionic modulators of AF, and helps in the identification of novel aspects ofhuman atrial electrophysiology. Importantly, our results identify GNaK asa key modulator of human atrial steady-state and restitution properties aswell as rotor dynamics, and confirm the importance of GK1 and GNa in hu-man atrial electrophysiology in both SR and AF. Other current propertiesincluding GKur and GCaL play only a secondary role, which is in most casesnegligible under the conditions investigated. Importantly, the ionic basisof human atrial dynamics were similar in SR and AF, but the sensitivityof electrophysiological properties to changes in ionic currents was in mostcases smaller in AF than in SR. This could explain, at least in part, thelower efficacy of pharmacological treatment in patients with long-term ver-sus short-term AF. Furthermore, our results revealed the great importanceof GK1 in control and GNa in AF in modulating rotor dynamics.
Role of INaKOur simulation results highlight the importance of GNaK as an essential
determinant of human atrial electrophysiology, both in SR and AF. Alter-ations in GNaK result in important changes in APD90, APD restitution andRP, and therefore in DF. Our results also show biphasic adaptation of bothAPD90, RP and DF after changes in GNaK . These findings are supportedby previous data showing that the pump current is a strong modulator ofAPD90 and RMP in patients with and without chronic AF [149, 152]. Theimportance of the NaK pump as one of the key modulators of repolarizationand rotor dynamics in human atria should be taken into consideration in the
92Chapter 4. Ionic Modulation of Electrophysiological Properties and
Rotor Dynamics in Human Atria
evaluation and development of pharmacological treatments for AF. Previ-ous investigations into AF-related mechanisms have, however, preferentiallyfocused on sodium and potassium currents [157], systematically ignoringthe effect of other currents and in particular the NaK pump [124]. Similarly,screening of drug compounds usually targets sodium, calcium and potassiumchannels. It is nevertheless important to note that some anti-AF drugs suchas amiodarone interfere with NaK pump regulation [126]. Amiodarone isknown to be more efficient in maintaining SR than some of their derivatives,such as dronedarone, which do not affect the activity of the pump [113, 126].According to our results, the effects of amiodarone on NaK pump regulationcould be important in explaining the anti-arrhythmic action of the drug.Furthermore, digitalis (i.e. INaK blocker) is also moderately successful inthe treatment of AF patients with heart failure. The positive effects of digi-talis in AF patients have been explained through the modulation of sodiumand calcium concentrations [158]. Indeed, the NaK pump is essential to themaintenance of cell homeostasis but, as highlighted in our study, it is alsoa critical determinant of atrial refractoriness. Our results suggest that theantiarrhythmic properties of drugs such as amiodarone and digitalis used forAF treatment could at least in part be due to the modulation of importantelectrophysiological properties, such as APD restitution, by partial blockingof the NaK pump. The importance of GNaK in modulating atrial electro-physiology is consistent in both human atrial models used in this study,and also in agreement with previous theoretical studies using human andrabbit ventricular AP models [80, 142, 159–161]. In all the models tested,GNaK was consistently found to be one of the most important modulatorsof APD90, restitution properties and rate adaptation dynamics. The impor-tance of GNaK therefore appears to be model-independent and consistent inatrial and ventricular models, even if the specific formulation of INaK in themodels is different, as in the Maleckar and Courtemanche models. Experi-mental evidence also shows that the expression of some subunits of the NaKpump is 30-50% lower in human atria than in ventricles [158]. This couldexplain the higher sensitivity of atrial electrophysiology to a particular doseof drugs affecting GNaK [102]. Experimental confirmation of the findings ofthe present study on the importance of GNaK in AF-related dynamics couldexplain the outcome of current pharmacological therapies and guide the de-velopment of new avenues for a more effective treatment of patients with AF.
Role of IK1As in this study, previous investigations have highlighted the importance
of IK1 in human atrial electrophysiology [120, 148] and therefore IK1 isconsidered a potential antiarrhythmic target. Furthermore, activation of in-ward rectifier potassium channels has been shown to increase DF in humanatria [47], in good agreement with our results. Our simulations corroborate
4.4. Discussion 93
GK1 as the most important modulator of electrophysiology and reentrantdynamics both in SR and AF atrial tissue. The antiarrhythmic effects ofIK1 blockade are based on APD90 and RP lengthening and therefore DFreduction.
Role of INaThe simulations performed in this chapter also confirm the strong influ-
ence of GNa in the modulation of atrial rotor dynamics through alterationof CV and, to a minor extent, RP. GNa alterations have a stronger effectfollowing permanent AF-related remodeling than in SR. Sodium channelblockers such as flecainide, propafenone or pilsicainide are widely used forthe treatment of short-term AF [56, 120, 123, 150]. A decrease in DF hasbeen suggested as one of their mechanisms of action [151], which is in goodagreement with our results (Figure 4.9). The identification of Class I com-pounds with different modes of action in atria and ventricles minimizing sideeffects, such as ranolazine, could be a promising path for AF treatment, inparticular following permanent AF-related remodeling [123, 124].
Role of other ionic currents
In addition to GNaK , GK1 and GNa, conductances such as GKur, GCaLand Gto also contribute to the regulation of atrial electrophysiology, par-ticularly in control, before AF-related remodeling causes their reduction(Figure 4.1). Much attention has been paid to GKur because of its prefer-ential expression in atrial tissue. Promising results have shown that drugsblocking IKur such as AVE0118 prolong atrial refractoriness with no effectson QT-interval in animal studies [162], but resulting in an increase in thepeak intracellular calcium transient [16]. In agreement with these results,our simulations show that GKur modulates APD90, and thus RP, Ss1s2 andSdyn. However, GKur effects are reduced in AF due to its lower conduc-tance, and this could indicate potentially smaller efficacy of GKur block inthe treatment of long-term AF (Figure 4.2). GCaL is important in determin-ing APD90, Ss1s2 and RP, which is consistent with previous studies showingits influence on PS tip meandering during reentry [120]. Our results couldalso explain the ability of verapamil, a calcium channel blocker, to attenu-ate the RP shortening caused by AF remodeling [163]. Gto, GKr and GKshave slight effects on atrial AP (Figures 4.3, 4.4, 4.5), and their alterationsare delicate due to potential increase in ventricular arrhythmic risk. TheIKr blockers sotalol and dofetilide are used for AF prevention due to theirstronger effect on RP at slow rather than rapid heart rates [125, 157]. Thisis also reported in our simulations, which show larger increments in APD90,and thus RP, when Gto, GKr and GKs are blocked in control than followingAF.
Table 4.3 summarizes the ionic currents investigated in this simulation
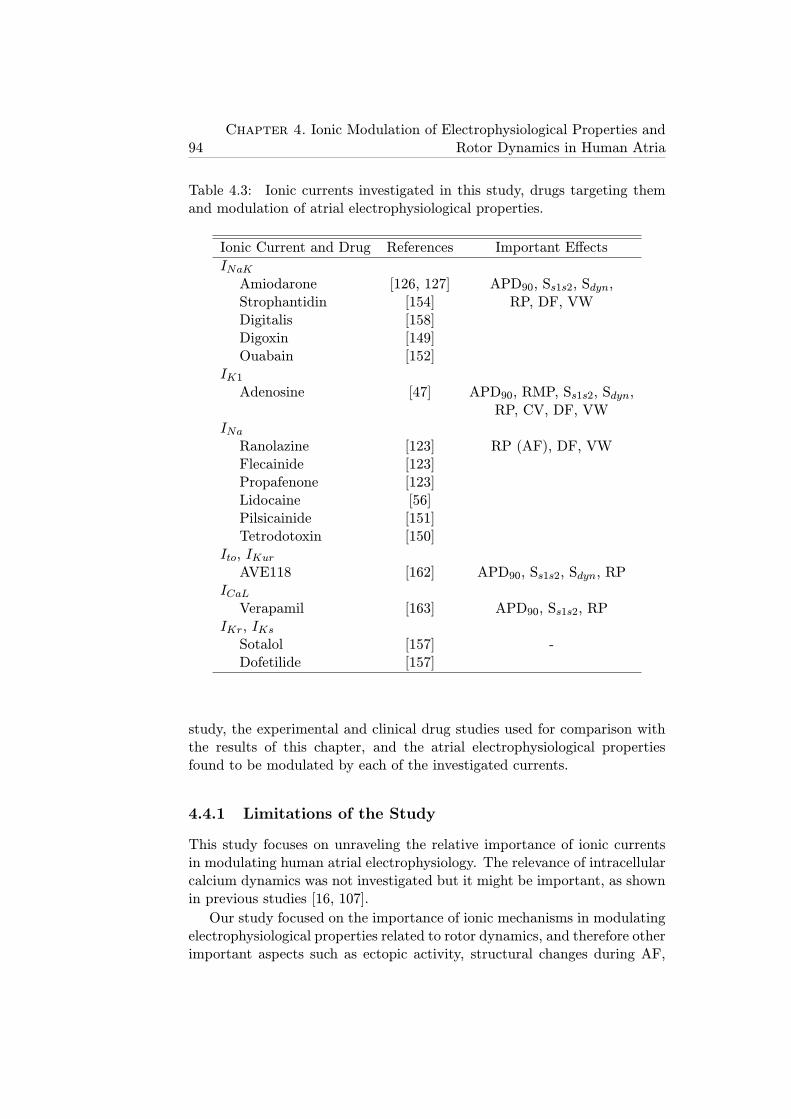
94Chapter 4. Ionic Modulation of Electrophysiological Properties and
Rotor Dynamics in Human Atria
Table 4.3: Ionic currents investigated in this study, drugs targeting themand modulation of atrial electrophysiological properties.
Ionic Current and Drug References Important Effects
INaKAmiodarone [126, 127] APD90, Ss1s2, Sdyn,Strophantidin [154] RP, DF, VWDigitalis [158]Digoxin [149]Ouabain [152]
IK1Adenosine [47] APD90, RMP, Ss1s2, Sdyn,
RP, CV, DF, VWINaRanolazine [123] RP (AF), DF, VWFlecainide [123]Propafenone [123]Lidocaine [56]Pilsicainide [151]Tetrodotoxin [150]
Ito, IKurAVE118 [162] APD90, Ss1s2, Sdyn, RP
ICaLVerapamil [163] APD90, Ss1s2, RP
IKr, IKsSotalol [157] -Dofetilide [157]
study, the experimental and clinical drug studies used for comparison withthe results of this chapter, and the atrial electrophysiological propertiesfound to be modulated by each of the investigated currents.
4.4.1 Limitations of the Study
This study focuses on unraveling the relative importance of ionic currentsin modulating human atrial electrophysiology. The relevance of intracellularcalcium dynamics was not investigated but it might be important, as shownin previous studies [16, 107].
Our study focused on the importance of ionic mechanisms in modulatingelectrophysiological properties related to rotor dynamics, and therefore otherimportant aspects such as ectopic activity, structural changes during AF,
4.4. Discussion 95
tissue anisotropy and heterogeneities caused by vagal stimulation were notinvestigated [56, 146, 147, 150]. Even though their effects on AF-relatedreentry could be important as shown in previous studies [56], they wouldhave a confounding effect on the results interpretation and should be thefocus of further investigations. Tissue simulations were restricted to 2D andthus a 3D atrial geometry was not considered. Previous studies, however,have shown that sodium blockers effects are qualitatively similar in 2D and3D models [108, 124]. The role of atrial anatomy and heterogeneity inmodulating pharmacological anti-AF interventions should be explored infurther studies, building on insights provided by this study.
Finally, a few recent studies have focused on the comparison of differentAP models aiming at targeting similar cell type and mammalian species,and have highlighted differences in dynamics because of differences in themodel equations and parameters [107, 108, 142, 159, 161, 164]. The resultsof this study should be interpreted with caution since there could be dif-ferent combinations of changes in the model parameters leading to similarresults [165]. These limitations are common to other computational studiesin cardiac electrophysiology. We have however conducted simulations usingtwo different human atrial AP models varying model parameters to addresssome of these limitations.
Furthermore, specific conditions were used in this chapter to simulate SRand permanent AF, but these are likely to exhibit significant inter-subjectvariability, which is the focus of chapter 5 [119, 121, 122].

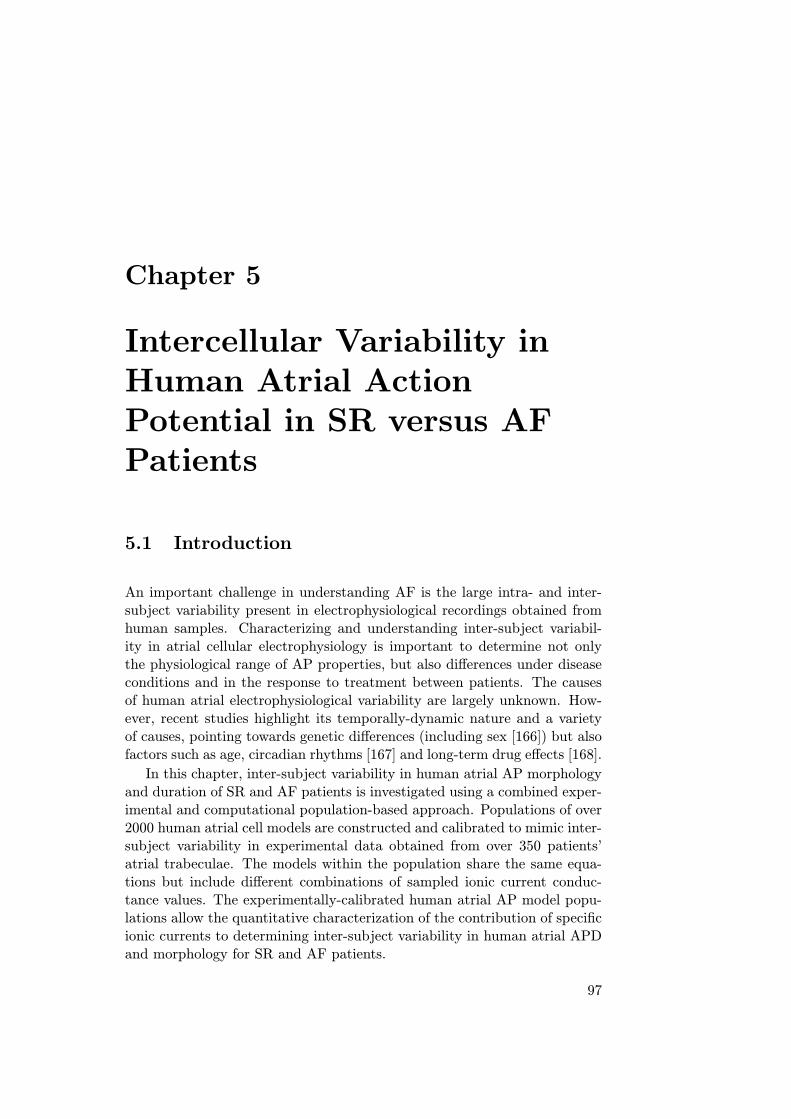
Chapter 5
Intercellular Variability inHuman Atrial ActionPotential in SR versus AFPatients
5.1 Introduction
An important challenge in understanding AF is the large intra- and inter-subject variability present in electrophysiological recordings obtained fromhuman samples. Characterizing and understanding inter-subject variabil-ity in atrial cellular electrophysiology is important to determine not onlythe physiological range of AP properties, but also differences under diseaseconditions and in the response to treatment between patients. The causesof human atrial electrophysiological variability are largely unknown. How-ever, recent studies highlight its temporally-dynamic nature and a varietyof causes, pointing towards genetic differences (including sex [166]) but alsofactors such as age, circadian rhythms [167] and long-term drug effects [168].
In this chapter, inter-subject variability in human atrial AP morphologyand duration of SR and AF patients is investigated using a combined exper-imental and computational population-based approach. Populations of over2000 human atrial cell models are constructed and calibrated to mimic inter-subject variability in experimental data obtained from over 350 patients’atrial trabeculae. The models within the population share the same equa-tions but include different combinations of sampled ionic current conduc-tance values. The experimentally-calibrated human atrial AP model popu-lations allow the quantitative characterization of the contribution of specificionic currents to determining inter-subject variability in human atrial APDand morphology for SR and AF patients.
97
98Chapter 5. Intercellular Variability in Human Atrial Action Potential in
SR versus AF Patients
5.1.1 Objectives
The aims of this part of the thesis are:
1. Elucidate the main ionic determinants of inter-subject variability inhuman atrial cardiomyocytes from SR versus permanent AF patientsthrough the generation of population of models mimicking this vari-ability.
2. Investigate the synergistic effects of ionic variability on APD modula-tion measured at different stages of repolarization.
3. Analyze inter-subject variability in AP dependence on pacing rate.
4. Compare the ionic mechanisms underlying inter-subject variability ob-tained with different AP models.
5.2 Methods
5.2.1 Experimental Dataset
In order to validate the simulation results and properly calibrate the popula-tions of models that were used in this part of the thesis, a set of experimentalrecordings and measurements performed at the Department of Pharmacol-ogy and Toxicology of the Dresden University of Technology (Germany) wasused.
5.2.1.1 Patients Characteristics
All work with human samples conformed to the Declaration of Helsinki.The study was approved by the ethics committee of Dresden University ofTechnology (No. EK790799). Each patient gave written, informed con-sent. Right atrial appendages were obtained from 363 patients with SR(214 patients with paroxysmal, recent onset or non-signs of AF) and withpermanent AF (149 patients with permanent AF for longer than 6 monthsat the time of tissue collection) receiving cardiac surgery because of coro-nary artery or valve disease. Preparations from patients with prescriptionsof antiarrhythmic drugs were not included.
5.2.1.2 Experimental Measurements
Small pieces of human right atrial appendages were transported to the labo-ratory in a special Ca2+-free transport medium at 20-25 oC, whose compo-sition in mM was: 100.0 NaCl, 10.0 KCl, 1,2 KH2PO4, 5.0 MgSO4, Taurin50 mM, MOPS 5 mM, 30 mM BDM pH 7.0. Either free-running trabec-ulae or trabeculae together with attached atrial wall were dissected and
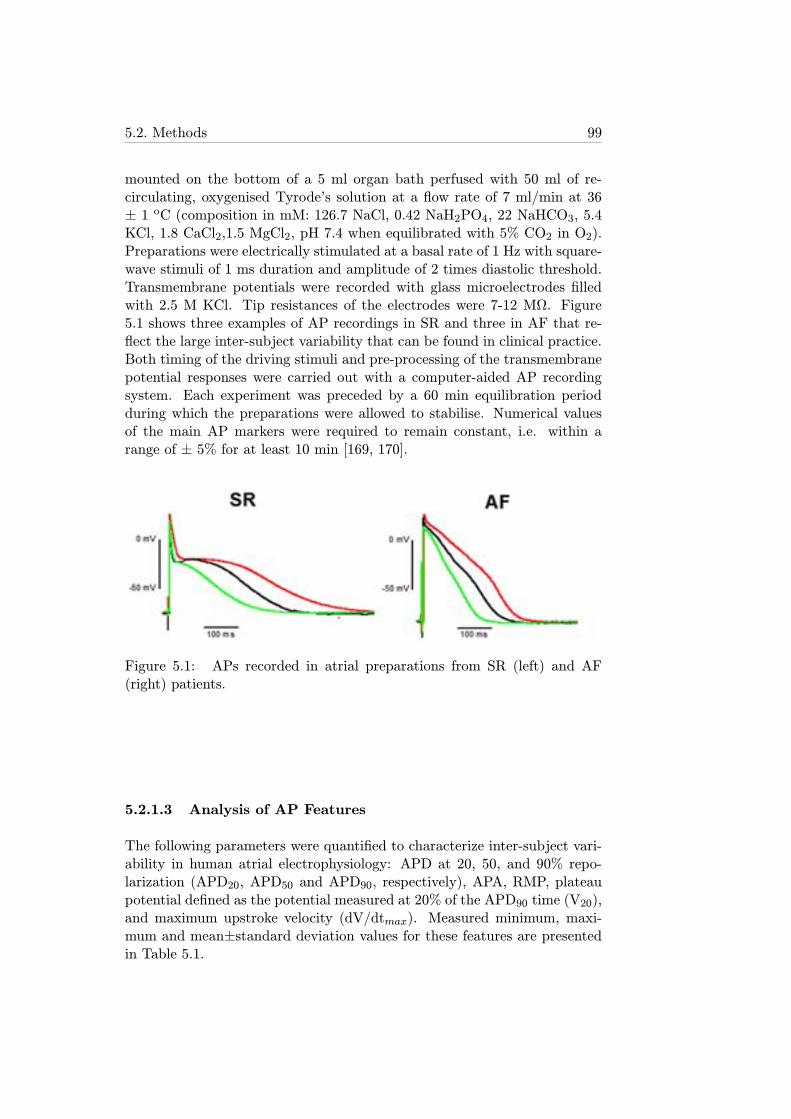
5.2. Methods 99
mounted on the bottom of a 5 ml organ bath perfused with 50 ml of re-circulating, oxygenised Tyrode’s solution at a flow rate of 7 ml/min at 36± 1 oC (composition in mM: 126.7 NaCl, 0.42 NaH2PO4, 22 NaHCO3, 5.4KCl, 1.8 CaCl2,1.5 MgCl2, pH 7.4 when equilibrated with 5% CO2 in O2).Preparations were electrically stimulated at a basal rate of 1 Hz with square-wave stimuli of 1 ms duration and amplitude of 2 times diastolic threshold.Transmembrane potentials were recorded with glass microelectrodes filledwith 2.5 M KCl. Tip resistances of the electrodes were 7-12 MΩ. Figure5.1 shows three examples of AP recordings in SR and three in AF that re-flect the large inter-subject variability that can be found in clinical practice.Both timing of the driving stimuli and pre-processing of the transmembranepotential responses were carried out with a computer-aided AP recordingsystem. Each experiment was preceded by a 60 min equilibration periodduring which the preparations were allowed to stabilise. Numerical valuesof the main AP markers were required to remain constant, i.e. within arange of ± 5% for at least 10 min [169, 170].
Figure 5.1: APs recorded in atrial preparations from SR (left) and AF(right) patients.
5.2.1.3 Analysis of AP Features
The following parameters were quantified to characterize inter-subject vari-ability in human atrial electrophysiology: APD at 20, 50, and 90% repo-larization (APD20, APD50 and APD90, respectively), APA, RMP, plateaupotential defined as the potential measured at 20% of the APD90 time (V20),and maximum upstroke velocity (dV/dtmax). Measured minimum, maxi-mum and mean±standard deviation values for these features are presentedin Table 5.1.
100Chapter 5. Intercellular Variability in Human Atrial Action Potential in
SR versus AF Patients
Table 5.1: Range of human atrial AP features in SR and AF patients
SR AFMin. Max. Mean± Min. Max. Mean±Value Value SD Value Value SD
APD90 (ms) 190 440 318±42 140 330 216±35***APD50 (ms) 6 200 139±44 30 180 102±28***APD20 (ms) 1 60 7±8 1 75 30±18***APA (mV) 75 120 95±7 80 130 102±8***RMP (mV) -85 -65 -74±4 -85 -65 -77±4***V20 (mV) -35 10 -16±6 -30 20 -4±11***
dV/dtmax (V/s) 40 420 220±68 40 420 232±70*(Mann-Whitney U test AF vs. SR: *p<0.05; **p<0.01; ***p<0.001 )
5.2.2 Populations of Models of Human Atrial Electrophysi-ology
To account for inter-subject variability in atrial electrophysiology, three pop-ulations of sampled models of human atrial AP for SR and AF were gen-erated, each one based on one of the original AP models (i.e. Maleckar,Courtemanche and Grandi models). All models in each population sharedthe same equations, as previously described [171–175], but the most impor-tant ionic current conductances in determining the human atrial AP (eluci-dated in chapter 4) were varied with respect to their original values. Thesewere the conductances of IK1, ICaL, Ito, IKur and maximal NaK pump(INaK) and NaCa exchanger currents (INaCa), according to our previoussensitivity analysis study. Most other ionic current conductances and gat-ing variable kinetics were shown to have significantly smaller or neglibibleeffect on AP features.
Due to the high computational demand associated with the constructionand calibration of the model populations, we first constructed coarse modelpopulations with 2275 different ionic conductance combinations sampledover a ±100% variation range around their values in the original models,using the methodology described in the study of Marino et al. [176]. Theaim of this step was to estimate median values and range of variation forthe six key ionic conductances, required for simulated APs to be withinexperimental range. 2275 combinations were used to be consistent with thesampling methodology without losing sampling resolution [176].
The Maleckar, Courtemanche and Grandi default models were initiallypreconditioned by pacing at 1 Hz (using a 2-ms stimulus duration, twice dias-tolic threshold amplitude) until steady-state was reached. All APs within thepopulations were analyzed following a train of 90 periodic stimuli to quantify
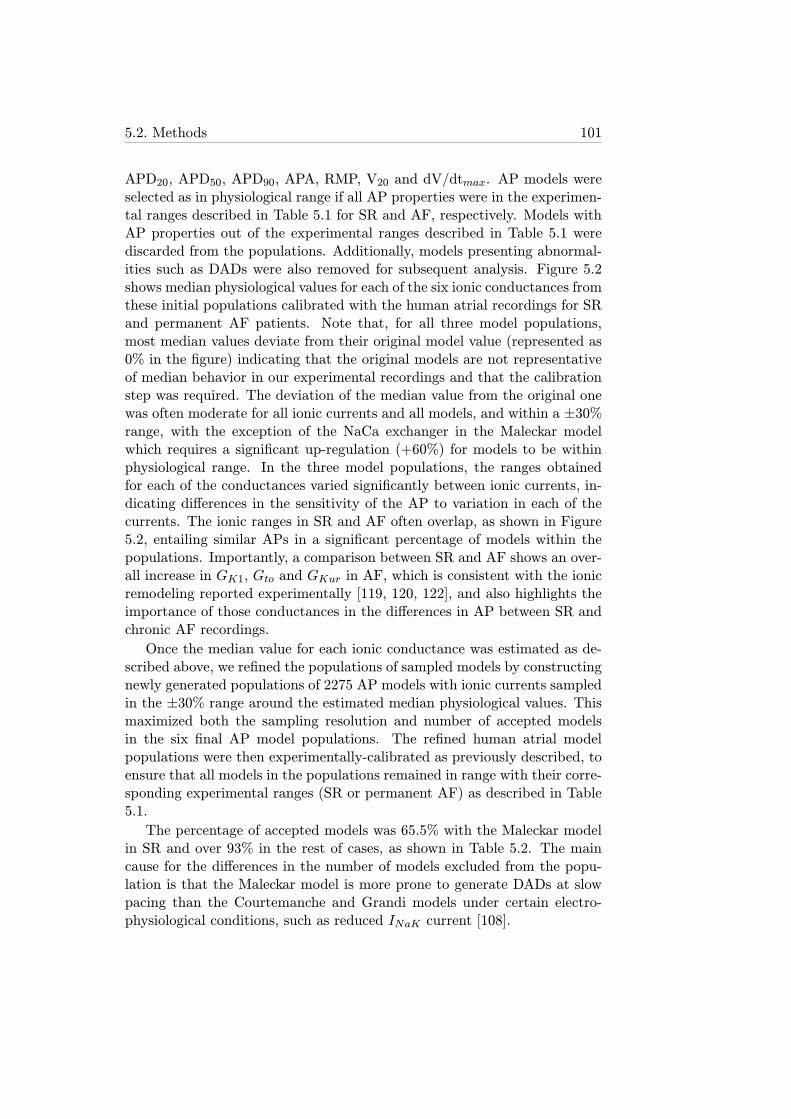
5.2. Methods 101
APD20, APD50, APD90, APA, RMP, V20 and dV/dtmax. AP models wereselected as in physiological range if all AP properties were in the experimen-tal ranges described in Table 5.1 for SR and AF, respectively. Models withAP properties out of the experimental ranges described in Table 5.1 werediscarded from the populations. Additionally, models presenting abnormal-ities such as DADs were also removed for subsequent analysis. Figure 5.2shows median physiological values for each of the six ionic conductances fromthese initial populations calibrated with the human atrial recordings for SRand permanent AF patients. Note that, for all three model populations,most median values deviate from their original model value (represented as0% in the figure) indicating that the original models are not representativeof median behavior in our experimental recordings and that the calibrationstep was required. The deviation of the median value from the original onewas often moderate for all ionic currents and all models, and within a ±30%range, with the exception of the NaCa exchanger in the Maleckar modelwhich requires a significant up-regulation (+60%) for models to be withinphysiological range. In the three model populations, the ranges obtainedfor each of the conductances varied significantly between ionic currents, in-dicating differences in the sensitivity of the AP to variation in each of thecurrents. The ionic ranges in SR and AF often overlap, as shown in Figure5.2, entailing similar APs in a significant percentage of models within thepopulations. Importantly, a comparison between SR and AF shows an over-all increase in GK1, Gto and GKur in AF, which is consistent with the ionicremodeling reported experimentally [119, 120, 122], and also highlights theimportance of those conductances in the differences in AP between SR andchronic AF recordings.
Once the median value for each ionic conductance was estimated as de-scribed above, we refined the populations of sampled models by constructingnewly generated populations of 2275 AP models with ionic currents sampledin the ±30% range around the estimated median physiological values. Thismaximized both the sampling resolution and number of accepted modelsin the six final AP model populations. The refined human atrial modelpopulations were then experimentally-calibrated as previously described, toensure that all models in the populations remained in range with their corre-sponding experimental ranges (SR or permanent AF) as described in Table5.1.
The percentage of accepted models was 65.5% with the Maleckar modelin SR and over 93% in the rest of cases, as shown in Table 5.2. The maincause for the differences in the number of models excluded from the popu-lation is that the Maleckar model is more prone to generate DADs at slowpacing than the Courtemanche and Grandi models under certain electro-physiological conditions, such as reduced INaK current [108].
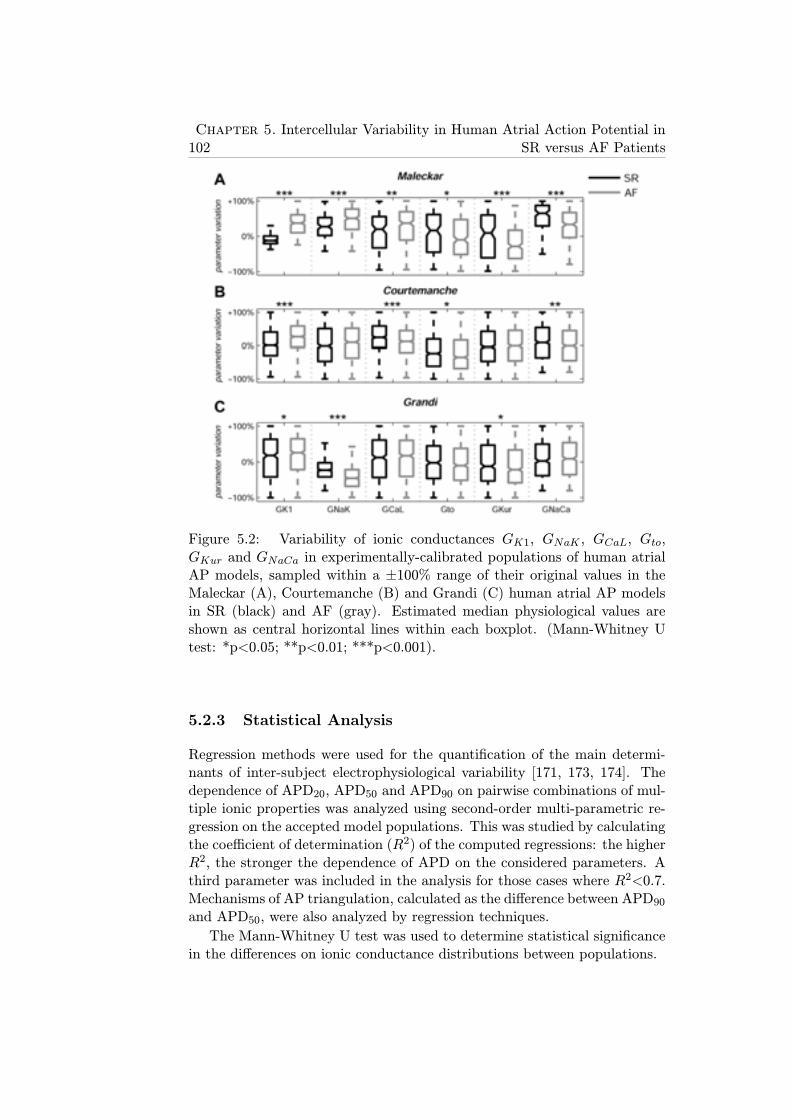
102Chapter 5. Intercellular Variability in Human Atrial Action Potential in
SR versus AF Patients
Figure 5.2: Variability of ionic conductances GK1, GNaK , GCaL, Gto,GKur and GNaCa in experimentally-calibrated populations of human atrialAP models, sampled within a ±100% range of their original values in theMaleckar (A), Courtemanche (B) and Grandi (C) human atrial AP modelsin SR (black) and AF (gray). Estimated median physiological values areshown as central horizontal lines within each boxplot. (Mann-Whitney Utest: *p<0.05; **p<0.01; ***p<0.001).
5.2.3 Statistical Analysis
Regression methods were used for the quantification of the main determi-nants of inter-subject electrophysiological variability [171, 173, 174]. Thedependence of APD20, APD50 and APD90 on pairwise combinations of mul-tiple ionic properties was analyzed using second-order multi-parametric re-gression on the accepted model populations. This was studied by calculatingthe coefficient of determination (R2) of the computed regressions: the higherR2, the stronger the dependence of APD on the considered parameters. Athird parameter was included in the analysis for those cases where R2<0.7.Mechanisms of AP triangulation, calculated as the difference between APD90and APD50, were also analyzed by regression techniques.
The Mann-Whitney U test was used to determine statistical significancein the differences on ionic conductance distributions between populations.
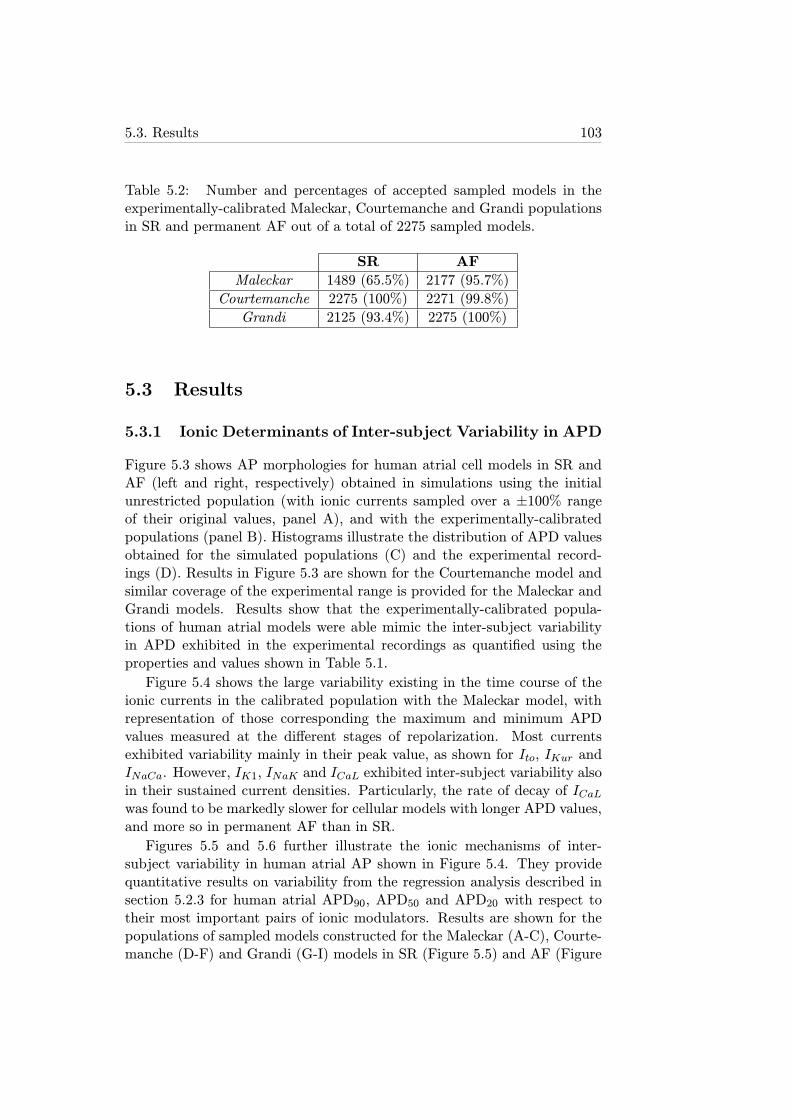
5.3. Results 103
Table 5.2: Number and percentages of accepted sampled models in theexperimentally-calibrated Maleckar, Courtemanche and Grandi populationsin SR and permanent AF out of a total of 2275 sampled models.
SR AF
Maleckar 1489 (65.5%) 2177 (95.7%)
Courtemanche 2275 (100%) 2271 (99.8%)
Grandi 2125 (93.4%) 2275 (100%)
5.3 Results
5.3.1 Ionic Determinants of Inter-subject Variability in APD
Figure 5.3 shows AP morphologies for human atrial cell models in SR andAF (left and right, respectively) obtained in simulations using the initialunrestricted population (with ionic currents sampled over a ±100% rangeof their original values, panel A), and with the experimentally-calibratedpopulations (panel B). Histograms illustrate the distribution of APD valuesobtained for the simulated populations (C) and the experimental record-ings (D). Results in Figure 5.3 are shown for the Courtemanche model andsimilar coverage of the experimental range is provided for the Maleckar andGrandi models. Results show that the experimentally-calibrated popula-tions of human atrial models were able mimic the inter-subject variabilityin APD exhibited in the experimental recordings as quantified using theproperties and values shown in Table 5.1.
Figure 5.4 shows the large variability existing in the time course of theionic currents in the calibrated population with the Maleckar model, withrepresentation of those corresponding the maximum and minimum APDvalues measured at the different stages of repolarization. Most currentsexhibited variability mainly in their peak value, as shown for Ito, IKur andINaCa. However, IK1, INaK and ICaL exhibited inter-subject variability alsoin their sustained current densities. Particularly, the rate of decay of ICaLwas found to be markedly slower for cellular models with longer APD values,and more so in permanent AF than in SR.
Figures 5.5 and 5.6 further illustrate the ionic mechanisms of inter-subject variability in human atrial AP shown in Figure 5.4. They providequantitative results on variability from the regression analysis described insection 5.2.3 for human atrial APD90, APD50 and APD20 with respect totheir most important pairs of ionic modulators. Results are shown for thepopulations of sampled models constructed for the Maleckar (A-C), Courte-manche (D-F) and Grandi (G-I) models in SR (Figure 5.5) and AF (Figure
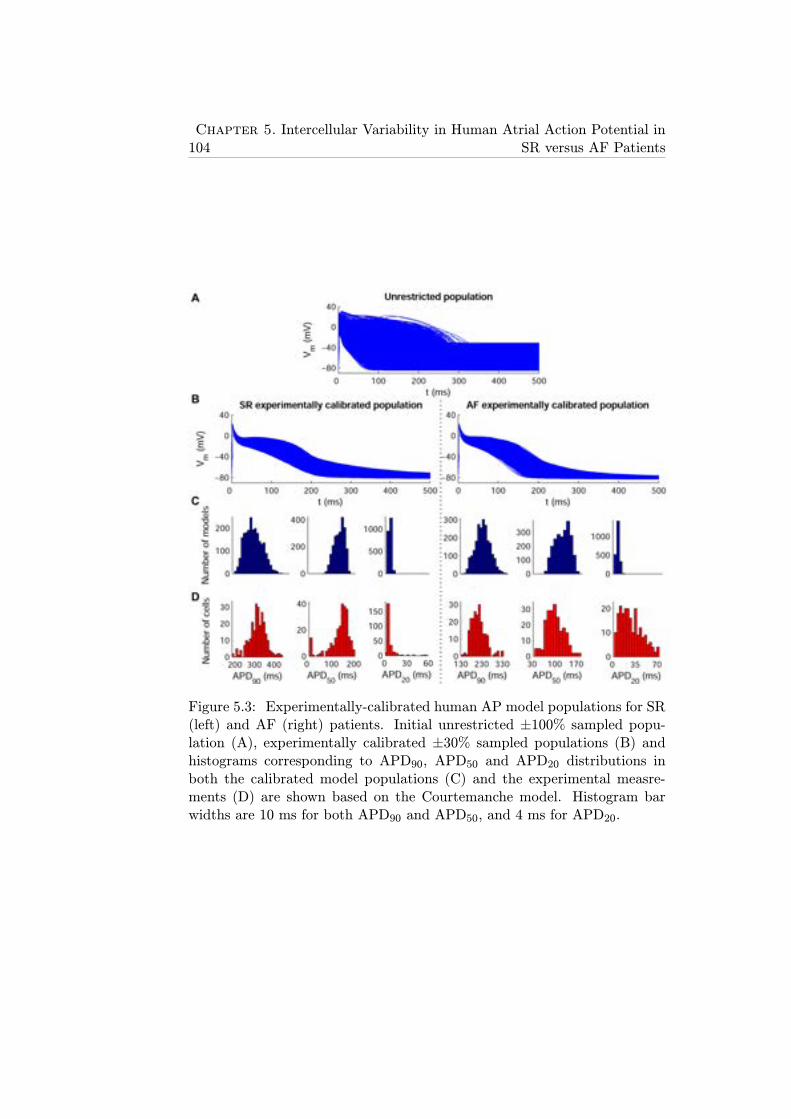
104Chapter 5. Intercellular Variability in Human Atrial Action Potential in
SR versus AF Patients
Figure 5.3: Experimentally-calibrated human AP model populations for SR(left) and AF (right) patients. Initial unrestricted ±100% sampled popu-lation (A), experimentally calibrated ±30% sampled populations (B) andhistograms corresponding to APD90, APD50 and APD20 distributions inboth the calibrated model populations (C) and the experimental measre-ments (D) are shown based on the Courtemanche model. Histogram barwidths are 10 ms for both APD90 and APD50, and 4 ms for APD20.
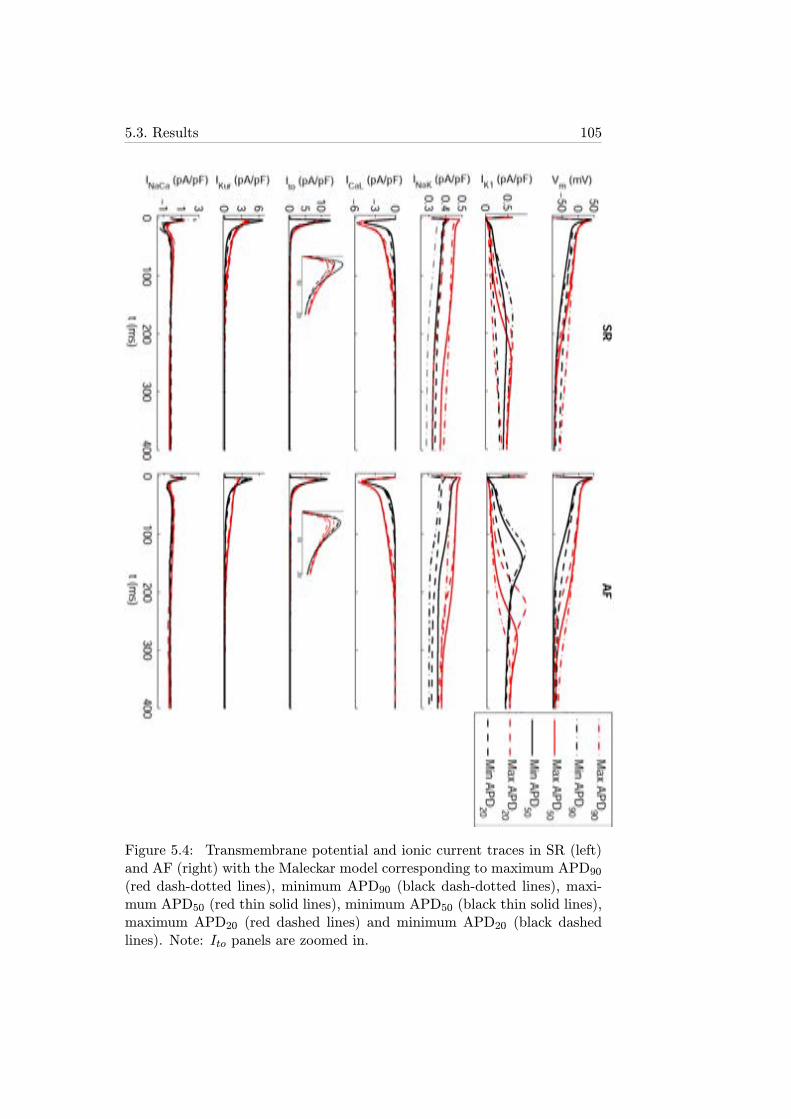
5.3. Results 105
Figure 5.4: Transmembrane potential and ionic current traces in SR (left)and AF (right) with the Maleckar model corresponding to maximum APD90(red dash-dotted lines), minimum APD90 (black dash-dotted lines), maxi-mum APD50 (red thin solid lines), minimum APD50 (black thin solid lines),maximum APD20 (red dashed lines) and minimum APD20 (black dashedlines). Note: Ito panels are zoomed in.
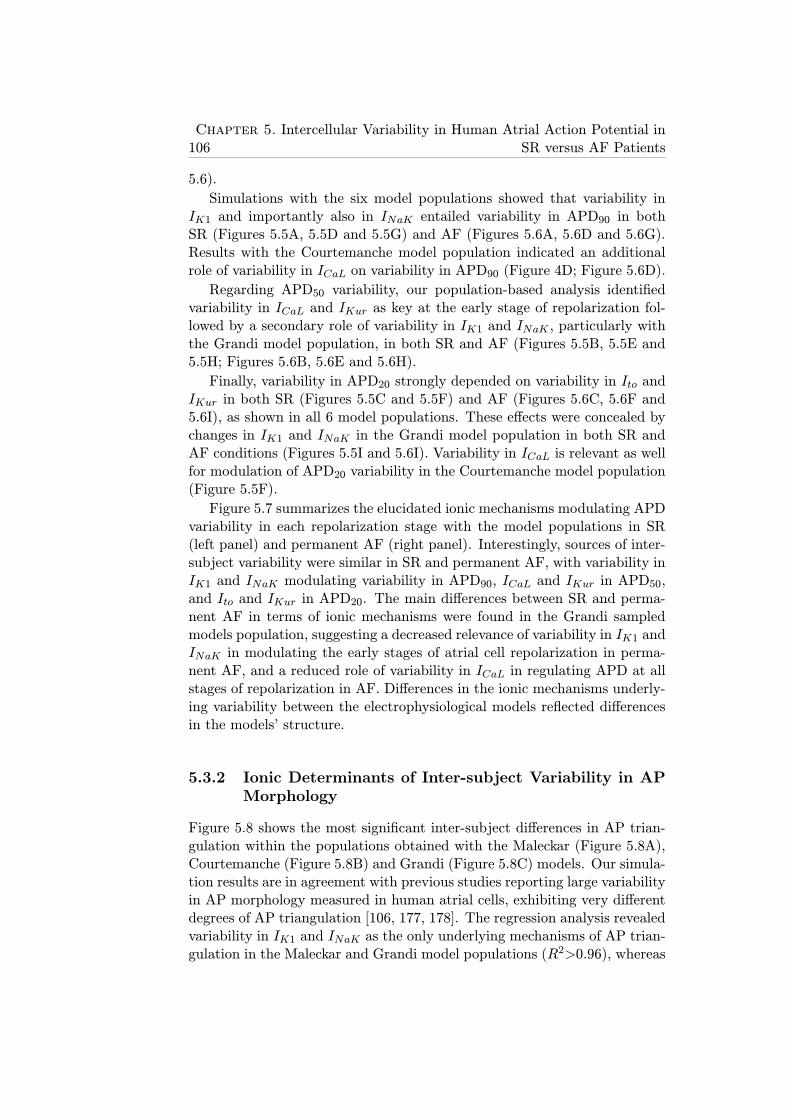
106Chapter 5. Intercellular Variability in Human Atrial Action Potential in
SR versus AF Patients
5.6).
Simulations with the six model populations showed that variability inIK1 and importantly also in INaK entailed variability in APD90 in bothSR (Figures 5.5A, 5.5D and 5.5G) and AF (Figures 5.6A, 5.6D and 5.6G).Results with the Courtemanche model population indicated an additionalrole of variability in ICaL on variability in APD90 (Figure 4D; Figure 5.6D).
Regarding APD50 variability, our population-based analysis identifiedvariability in ICaL and IKur as key at the early stage of repolarization fol-lowed by a secondary role of variability in IK1 and INaK , particularly withthe Grandi model population, in both SR and AF (Figures 5.5B, 5.5E and5.5H; Figures 5.6B, 5.6E and 5.6H).
Finally, variability in APD20 strongly depended on variability in Ito andIKur in both SR (Figures 5.5C and 5.5F) and AF (Figures 5.6C, 5.6F and5.6I), as shown in all 6 model populations. These effects were concealed bychanges in IK1 and INaK in the Grandi model population in both SR andAF conditions (Figures 5.5I and 5.6I). Variability in ICaL is relevant as wellfor modulation of APD20 variability in the Courtemanche model population(Figure 5.5F).
Figure 5.7 summarizes the elucidated ionic mechanisms modulating APDvariability in each repolarization stage with the model populations in SR(left panel) and permanent AF (right panel). Interestingly, sources of inter-subject variability were similar in SR and permanent AF, with variability inIK1 and INaK modulating variability in APD90, ICaL and IKur in APD50,and Ito and IKur in APD20. The main differences between SR and perma-nent AF in terms of ionic mechanisms were found in the Grandi sampledmodels population, suggesting a decreased relevance of variability in IK1 andINaK in modulating the early stages of atrial cell repolarization in perma-nent AF, and a reduced role of variability in ICaL in regulating APD at allstages of repolarization in AF. Differences in the ionic mechanisms underly-ing variability between the electrophysiological models reflected differencesin the models’ structure.
5.3.2 Ionic Determinants of Inter-subject Variability in APMorphology
Figure 5.8 shows the most significant inter-subject differences in AP trian-gulation within the populations obtained with the Maleckar (Figure 5.8A),Courtemanche (Figure 5.8B) and Grandi (Figure 5.8C) models. Our simula-tion results are in agreement with previous studies reporting large variabilityin AP morphology measured in human atrial cells, exhibiting very differentdegrees of AP triangulation [106, 177, 178]. The regression analysis revealedvariability in IK1 and INaK as the only underlying mechanisms of AP trian-gulation in the Maleckar and Grandi model populations (R2>0.96), whereas
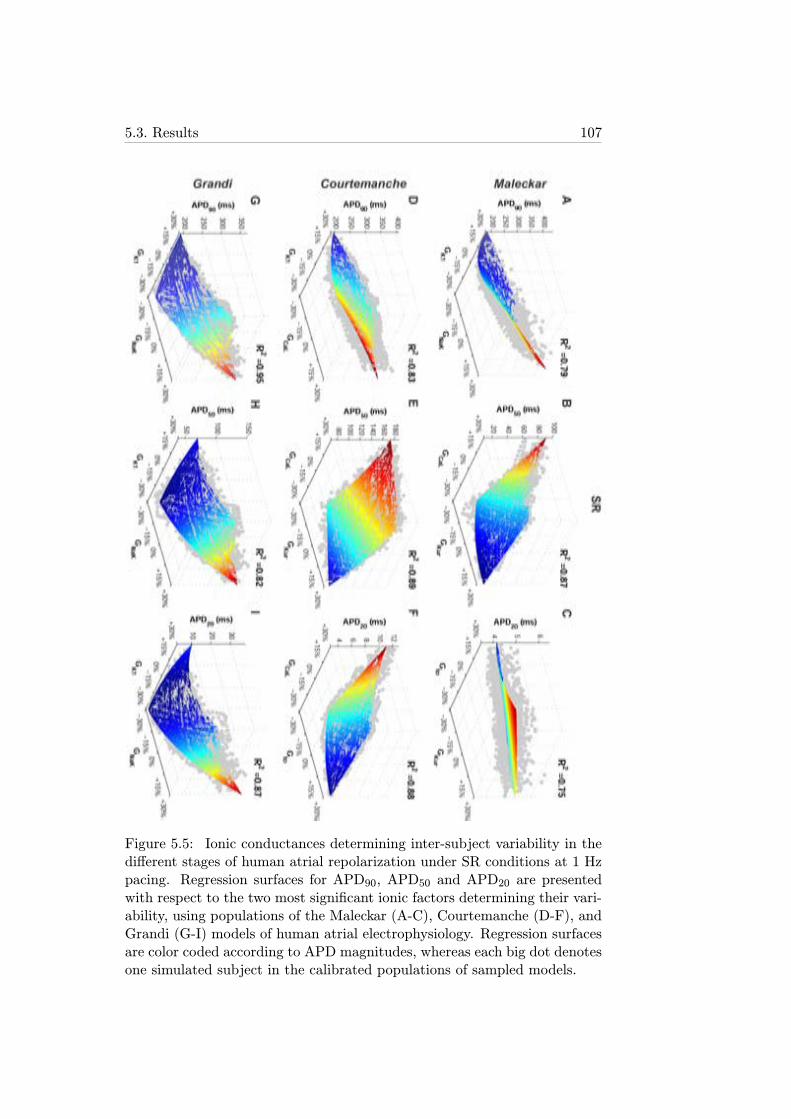
5.3. Results 107
Figure 5.5: Ionic conductances determining inter-subject variability in thedifferent stages of human atrial repolarization under SR conditions at 1 Hzpacing. Regression surfaces for APD90, APD50 and APD20 are presentedwith respect to the two most significant ionic factors determining their vari-ability, using populations of the Maleckar (A-C), Courtemanche (D-F), andGrandi (G-I) models of human atrial electrophysiology. Regression surfacesare color coded according to APD magnitudes, whereas each big dot denotesone simulated subject in the calibrated populations of sampled models.
108Chapter 5. Intercellular Variability in Human Atrial Action Potential in
SR versus AF Patients
Figure 5.6: Ionic conductances determining inter-subject variability in thedifferent stages of human atrial repolarization under AF conditions at 1 Hzpacing. Regression surfaces for APD90, APD50 and APD20 are presentedwith respect to the two most significant ionic factors determining their vari-ability, using populations of the Maleckar (A-C), Courtemanche (D-F), andGrandi (G-I) models of human atrial electrophysiology. Regression surfacesare color coded according to APD magnitudes, whereas each big dot denotesone simulated subject in the calibrated populations of sampled models.
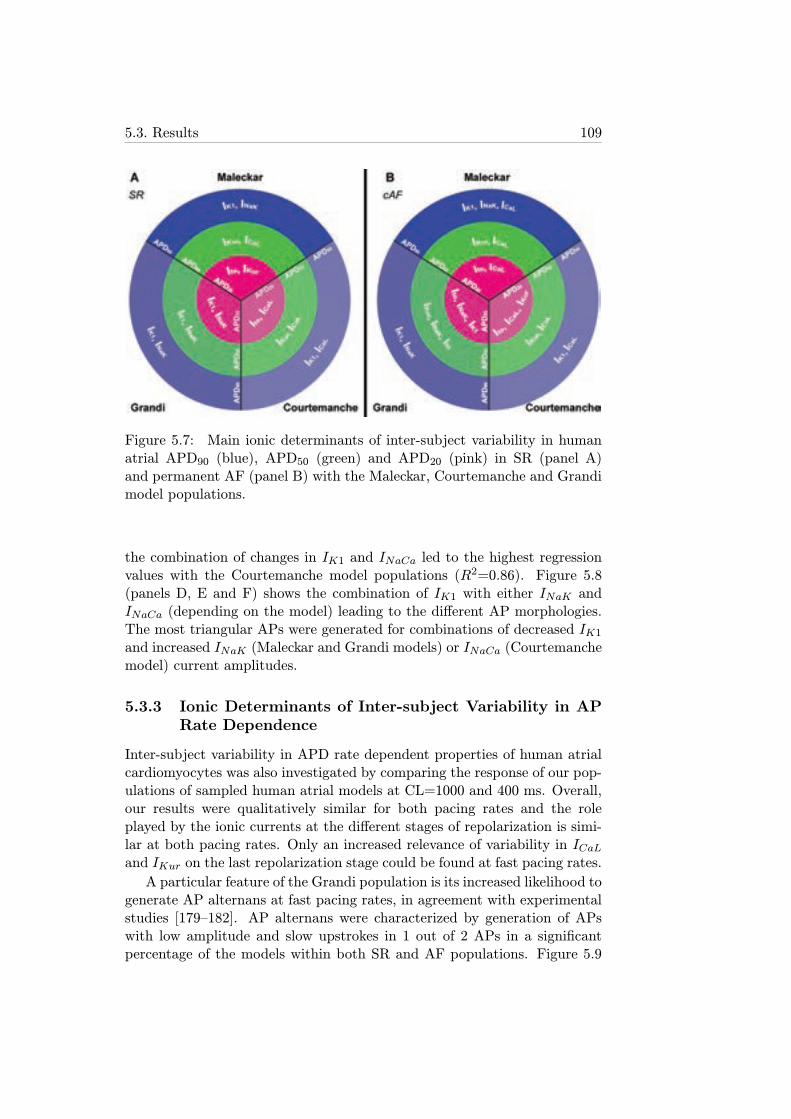
5.3. Results 109
Figure 5.7: Main ionic determinants of inter-subject variability in humanatrial APD90 (blue), APD50 (green) and APD20 (pink) in SR (panel A)and permanent AF (panel B) with the Maleckar, Courtemanche and Grandimodel populations.
the combination of changes in IK1 and INaCa led to the highest regressionvalues with the Courtemanche model populations (R2=0.86). Figure 5.8(panels D, E and F) shows the combination of IK1 with either INaK andINaCa (depending on the model) leading to the different AP morphologies.The most triangular APs were generated for combinations of decreased IK1and increased INaK (Maleckar and Grandi models) or INaCa (Courtemanchemodel) current amplitudes.
5.3.3 Ionic Determinants of Inter-subject Variability in APRate Dependence
Inter-subject variability in APD rate dependent properties of human atrialcardiomyocytes was also investigated by comparing the response of our pop-ulations of sampled human atrial models at CL=1000 and 400 ms. Overall,our results were qualitatively similar for both pacing rates and the roleplayed by the ionic currents at the different stages of repolarization is simi-lar at both pacing rates. Only an increased relevance of variability in ICaLand IKur on the last repolarization stage could be found at fast pacing rates.
A particular feature of the Grandi population is its increased likelihood togenerate AP alternans at fast pacing rates, in agreement with experimentalstudies [179–182]. AP alternans were characterized by generation of APswith low amplitude and slow upstrokes in 1 out of 2 APs in a significantpercentage of the models within both SR and AF populations. Figure 5.9
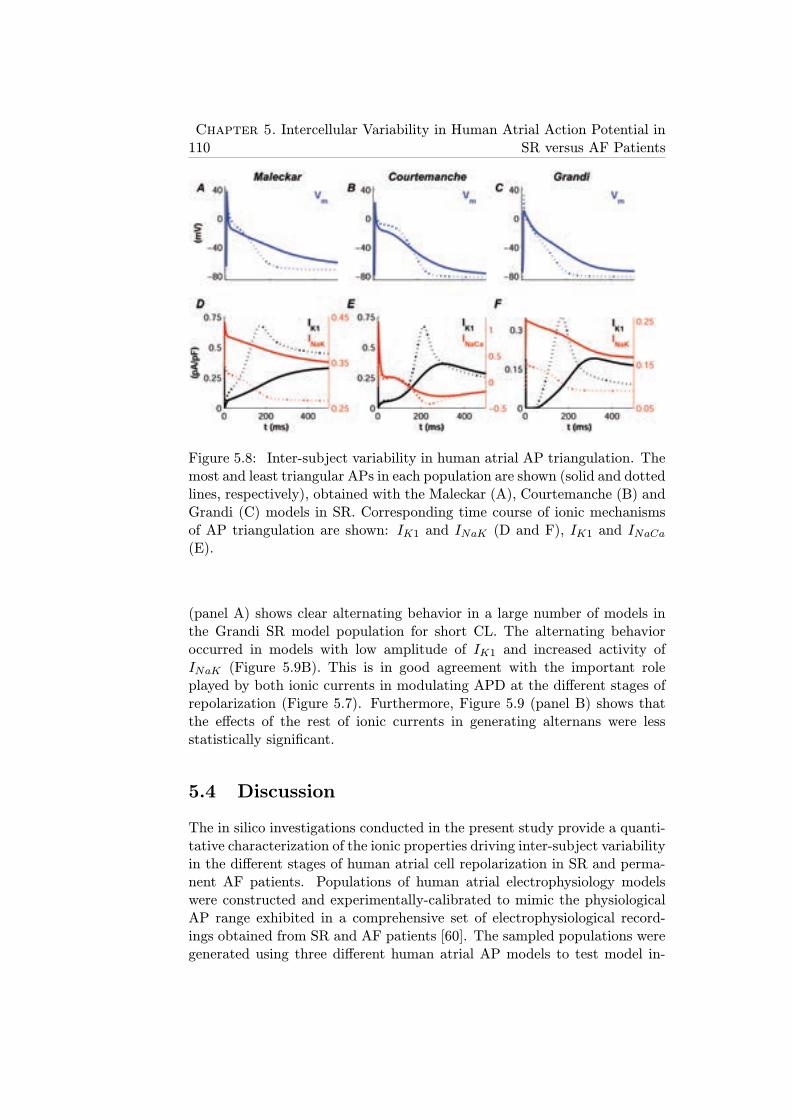
110Chapter 5. Intercellular Variability in Human Atrial Action Potential in
SR versus AF Patients
Figure 5.8: Inter-subject variability in human atrial AP triangulation. Themost and least triangular APs in each population are shown (solid and dottedlines, respectively), obtained with the Maleckar (A), Courtemanche (B) andGrandi (C) models in SR. Corresponding time course of ionic mechanismsof AP triangulation are shown: IK1 and INaK (D and F), IK1 and INaCa(E).
(panel A) shows clear alternating behavior in a large number of models inthe Grandi SR model population for short CL. The alternating behavioroccurred in models with low amplitude of IK1 and increased activity ofINaK (Figure 5.9B). This is in good agreement with the important roleplayed by both ionic currents in modulating APD at the different stages ofrepolarization (Figure 5.7). Furthermore, Figure 5.9 (panel B) shows thatthe effects of the rest of ionic currents in generating alternans were lessstatistically significant.
5.4 Discussion
The in silico investigations conducted in the present study provide a quanti-tative characterization of the ionic properties driving inter-subject variabilityin the different stages of human atrial cell repolarization in SR and perma-nent AF patients. Populations of human atrial electrophysiology modelswere constructed and experimentally-calibrated to mimic the physiologicalAP range exhibited in a comprehensive set of electrophysiological record-ings obtained from SR and AF patients [60]. The sampled populations weregenerated using three different human atrial AP models to test model in-
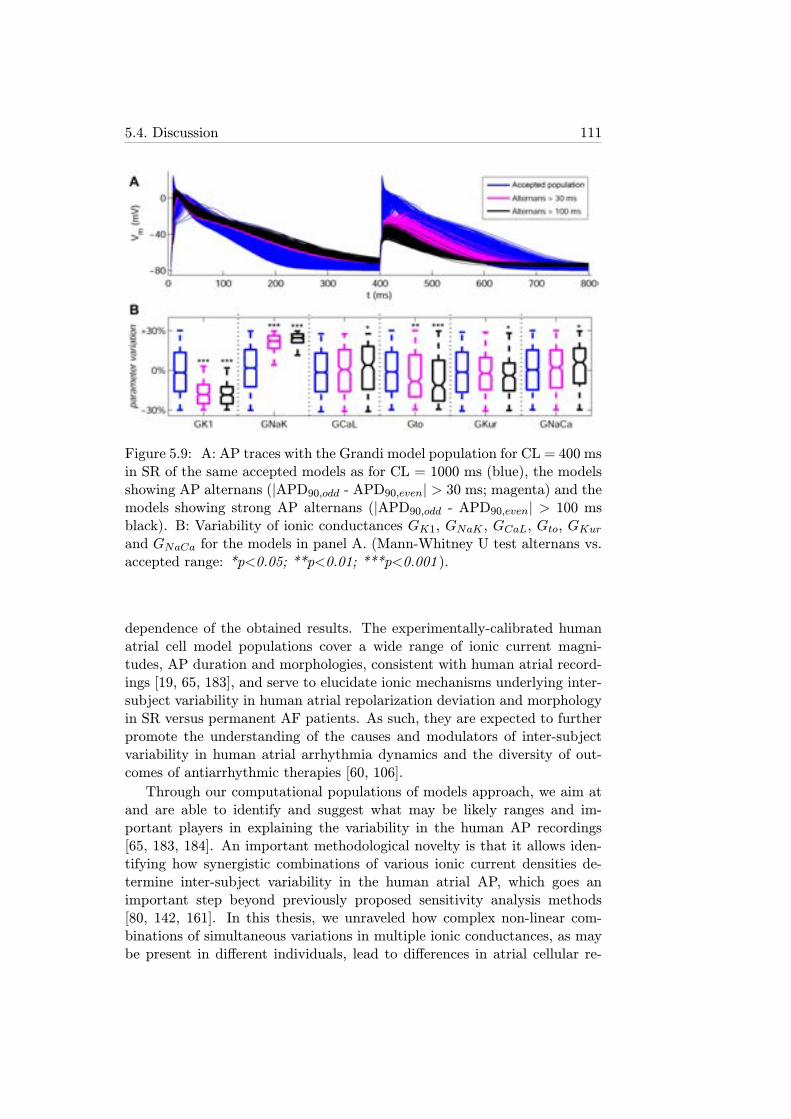
5.4. Discussion 111
Figure 5.9: A: AP traces with the Grandi model population for CL = 400 msin SR of the same accepted models as for CL = 1000 ms (blue), the modelsshowing AP alternans (|APD90,odd - APD90,even| > 30 ms; magenta) and themodels showing strong AP alternans (|APD90,odd - APD90,even| > 100 msblack). B: Variability of ionic conductances GK1, GNaK , GCaL, Gto, GKurand GNaCa for the models in panel A. (Mann-Whitney U test alternans vs.accepted range: *p<0.05; **p<0.01; ***p<0.001 ).
dependence of the obtained results. The experimentally-calibrated humanatrial cell model populations cover a wide range of ionic current magni-tudes, AP duration and morphologies, consistent with human atrial record-ings [19, 65, 183], and serve to elucidate ionic mechanisms underlying inter-subject variability in human atrial repolarization deviation and morphologyin SR versus permanent AF patients. As such, they are expected to furtherpromote the understanding of the causes and modulators of inter-subjectvariability in human atrial arrhythmia dynamics and the diversity of out-comes of antiarrhythmic therapies [60, 106].
Through our computational populations of models approach, we aim atand are able to identify and suggest what may be likely ranges and im-portant players in explaining the variability in the human AP recordings[65, 183, 184]. An important methodological novelty is that it allows iden-tifying how synergistic combinations of various ionic current densities de-termine inter-subject variability in the human atrial AP, which goes animportant step beyond previously proposed sensitivity analysis methods[80, 142, 161]. In this thesis, we unraveled how complex non-linear com-binations of simultaneous variations in multiple ionic conductances, as maybe present in different individuals, lead to differences in atrial cellular re-
112Chapter 5. Intercellular Variability in Human Atrial Action Potential in
SR versus AF Patients
polarization in SR versus permanent AF patients. Our results offer thepossibility to provide a deeper understanding on the penetration of differentpharmacological therapies at the population level, which is critical in theinterpretation of outcomes for anti-arrhythmic drug development and thelack of pharmacological response in some individuals.
The median electrophysiological values and ranges extracted from theunrestricted ±100% populations differed between SR and AF, as shown inFigure 5.2. Calibration of the Maleckar and Grandi populations with per-manent AF recordings led to notably higher median values of GK1 in AFwith respect to SR, reduction in Gto and reduction in GKur, which is in goodagreement with the ionic remodeling observed in permanent AF patients inprevious experimental studies [119, 120, 122]. The Courtemanche popula-tion, however, exhibited similar ionic ranges in SR and AF for GK1, Gtoand GKur. Insignificant differences were also observed in the GCaL rangesbetween the SR and AF calibrated populations with the three models, whichdiffers from experimental studies that reported a reduction of GCaL in per-manent AF patients [121].
The results obtained in this chapter of the thesis identify variability inIK1 as key in explaining inter-subject variability in APD90, which supportsthe well-established importance of IK1 in human atrial electrophysiology[120, 148]. Alterations in IK1 may also modulate variations in APD50 andAPD20 by modifying cellular excitability through the resting membrane po-tential. Importantly, our study highlights the importance of variability inINaK in inter-subject variability in APD90, which further supports the re-sults shown in chapter 4. The results therefore suggest the need for phar-macological assessment of potential drug effects on the NaK pump (as is thecase of amiodarone, for example) due to its importance on atrial repolariza-tion, in addition to effects on currently evaluated currents such as sodium,potassium and calcium channels [30, 113, 126, 127]. The results presentedhere also indicate that IK1 and INaK are the key determinants of variabilityin AP morphology in human atrial cardiomyocytes.
Our population-based results also highlight the importance of variabilityin ICaL in determining inter-subject variability in APD50, while its role inmodulating variability in APD90 and APD20 is less significant. This mayexplain why some calcium channel blockers, such as verapamil, although sig-nificantly reducing the degree of electrical remodeling, only yield a minimalreduction in inducibility of AF, despite aiming at modifying tissue refrac-toriness in permanent AF patients [163].
Due to its atria specificity and negligible ventricular expression levels,IKur has been previously proposed as a potentially important ionic targetfor atrial antiarrhythmic therapies aiming at exclusively prolonging atrialrefractoriness [29, 162, 170, 178, 185, 186]. The results of this study sup-port its importance in modulating inter-subject variability in APD50 and
5.4. Discussion 113
APD20, with smaller importance in modulating APD90. Another importantmodulator of variability in APD20 is variability in Ito, which in contrast hasonly small effects on APD90 and APD50. This supports the potential ofdrugs such as AVE0118, which interfere with both Ito and IKur, and havebeen shown to modulate atrial repolarization with no apparent effects onventricular repolarization [16, 162, 170, 186].
Finally, our results show a secondary role of INaCa in modulating APDinter-subject APD variability, as its effects are less prominent than thoseof the other currents. However, its influence on AP morphology cannotbe neglected. Recent INaCa inhibitors have shown the potential to preventarrhythmogenic events in ventricular myocardium by decreasing the am-plitude of pharmacologically-induced early and delayed afterdepolarizations[33, 187], although their effects in atrial tissue still remain unexplored.
5.4.1 Limitations of the Study
The populations of human atrial models developed in this chapter werebased on a large amount of experimental recordings obtained from trabeculaeextracted from the right atrial appendage, which is available from biopsies.APs from other atrial locations may exhibit a different degree of variability.In this chapter, populations of sampled models were built to represent inter-subject variability in AP of human atrial cells, with additional effects beingpresent in tissue preparations, such as inter-cellular coupling. These othereffects of tissue coupling should be investigated in further studies, aiming attranslating investigations of this study from cell to tissue model populations.
Furthermore, there are some other ionic currents not investigated in thepresent work whose effects on APD variability may not be negligible, such asthe background chloride current (IbCL). This ionic current was not includedin the populations because it is only present in the Grandi model.

Chapter 6
Ionic Modulation of AtrialFibrillation Dynamics in aHuman Atrial 3D Model
6.1 Introduction
AF causes both structural changes, such as physical dilation, and electricalremodeling of ion channels in cardiac tissue involving short refractoriness andslow conduction favoring reentries [16, 119, 121, 122, 188]. These changesand the intrinsic electrophysiological and structural heterogeneities in thehuman atria favor the generation and stabilization of reentrant circuits thatsustain the arrhythmia and entail chaotic activation patterns. This is asso-ciated with irregular HR and difficulty to distinguish P-waves on the ECG[40]. It is also well established that AF normally arises by rapid ectopic ac-tivity around the pulmonary veins (PV) generating stable reentrant circuitsin LA combined with short duration wavelets that propagate through thewhole atria to RA creating a chaotic activation that may then affect theventricular rhythm [188]. Left-to-right atrial gradients are also an arrhyth-mic risk factor that may favor the stability of AF, as reported in previousstudies [47, 189–192].
In combination with the analysis of the ECG, the understanding ofthe electrical behavior on the atrial surface by measuring EGM at differ-ent points to extract arrhythmia-related markers is key to properly applyanti-AF therapies (normally ablation combined with antiarrhythmic drugs).Disorganization in atrial activation is reflected on measurable indices in theEGM, such as heterogeneous DF, and reduced values of the morphologicalregularity index (RI), the spectral organization index (OI) and the morpho-logical coupling between pairs of EGMs (CP), which will be further explainedin section 6.2.4. Furthermore, disorganization can also be reflected in areas
115
116Chapter 6. Ionic Modulation of Atrial Fibrillation Dynamics in a Human
Atrial 3D Model
of generation of complex fractionated atrial electrograms (CFAEs), usuallyassociated with arrhythmia drivers and thus potentially suitable for surgicalablation [3, 193–195].
6.1.1 Objectives
The goals of this chapter are:
1. Investigate the effects of ionic changes on simulated arrhythmias usingrealistic 3D human atrial models.
2. Characterize fibrillatory behavior in a 3D human atrial model by ana-lyzing a map of pseudo-EGM (pEGM) signals distributed throughoutthe whole atria in order to obtain arrhythmia-related markers.
3. Investigate the implications of inter-subject variability on arrhythmicbehavior in 3D human atrial models.
4. Validate the results of AF simulations in 3D human atria with ex-perimental data from both the literature and clinical EGM recordingsfrom AF patients.
6.2 Methods
6.2.1 Cell and 3D Models of Human Atria
The Maleckar model was used to simulate cellular electrophysiology in arealistic 3D atrial model developed at the Karlsruhe Institute of Technology,as described in section 2.3 [65, 196]. In order to study the effect of alteringspecific ionic currents on AF dynamics, the simulations were performed inpermanent AF conditions by altering ion channel conductances as describedin section 4.2.1.1 according to previous studies [16, 119, 121, 122]: 70% ICaLreduction; 50% Ito reduction; 50% IKur reduction; and 100% IK1 increment.Two different levels of [ACh], 1 nM (value used by default) and 5 nM, wereincluded in the simulations through an IKACh to investigate the effects ofthe parasympathetic activity [28].
As stated in section 2.3, the 3D model contains the main atrial struc-tures: LA, RA, SAN, CT, PM, FO, BB, CTI, LAPG, RAPG, AVR andIAB. Furthermore, we included fiber orientation, conduction anisotropy andspatial heterogeneities in both ionic currents and CV in the 3D model, basedon previous studies [65, 196, 197]. Simulated anisotropic ratio (transversalto longitudinal ratio of conductivity) and spatial heterogeneities are sum-marized in Table 6.1. In this thesis, we included differences between ioniccurrents in LA versus RA by simulating gradients in IKr (1.6 times greater
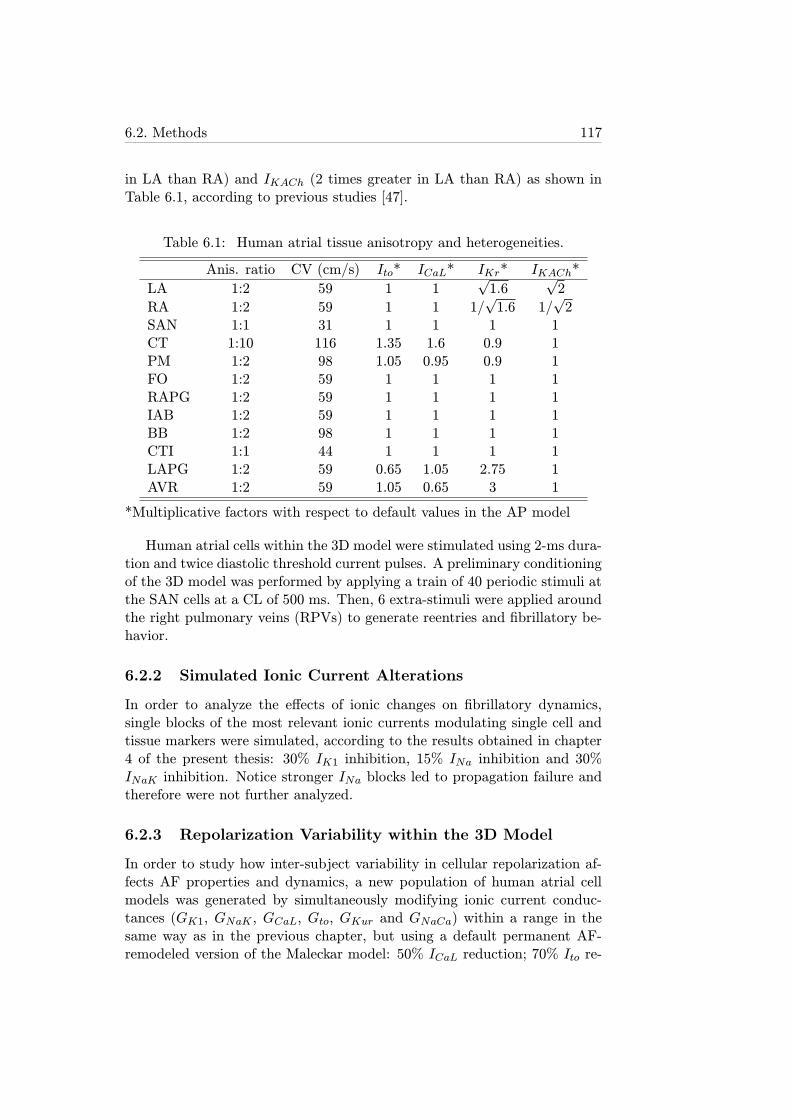
6.2. Methods 117
in LA than RA) and IKACh (2 times greater in LA than RA) as shown inTable 6.1, according to previous studies [47].
Table 6.1: Human atrial tissue anisotropy and heterogeneities.
Anis. ratio CV (cm/s) Ito* ICaL* IKr* IKACh*
LA 1:2 59 1 1√1.6
√2
RA 1:2 59 1 1 1/√1.6 1/
√2
SAN 1:1 31 1 1 1 1CT 1:10 116 1.35 1.6 0.9 1PM 1:2 98 1.05 0.95 0.9 1FO 1:2 59 1 1 1 1RAPG 1:2 59 1 1 1 1IAB 1:2 59 1 1 1 1BB 1:2 98 1 1 1 1CTI 1:1 44 1 1 1 1LAPG 1:2 59 0.65 1.05 2.75 1AVR 1:2 59 1.05 0.65 3 1
*Multiplicative factors with respect to default values in the AP model
Human atrial cells within the 3D model were stimulated using 2-ms dura-tion and twice diastolic threshold current pulses. A preliminary conditioningof the 3D model was performed by applying a train of 40 periodic stimuli atthe SAN cells at a CL of 500 ms. Then, 6 extra-stimuli were applied aroundthe right pulmonary veins (RPVs) to generate reentries and fibrillatory be-havior.
6.2.2 Simulated Ionic Current Alterations
In order to analyze the effects of ionic changes on fibrillatory dynamics,single blocks of the most relevant ionic currents modulating single cell andtissue markers were simulated, according to the results obtained in chapter4 of the present thesis: 30% IK1 inhibition, 15% INa inhibition and 30%INaK inhibition. Notice stronger INa blocks led to propagation failure andtherefore were not further analyzed.
6.2.3 Repolarization Variability within the 3D Model
In order to study how inter-subject variability in cellular repolarization af-fects AF properties and dynamics, a new population of human atrial cellmodels was generated by simultaneously modifying ionic current conduc-tances (GK1, GNaK , GCaL, Gto, GKur and GNaCa) within a range in thesame way as in the previous chapter, but using a default permanent AF-remodeled version of the Maleckar model: 50% ICaL reduction; 70% Ito re-
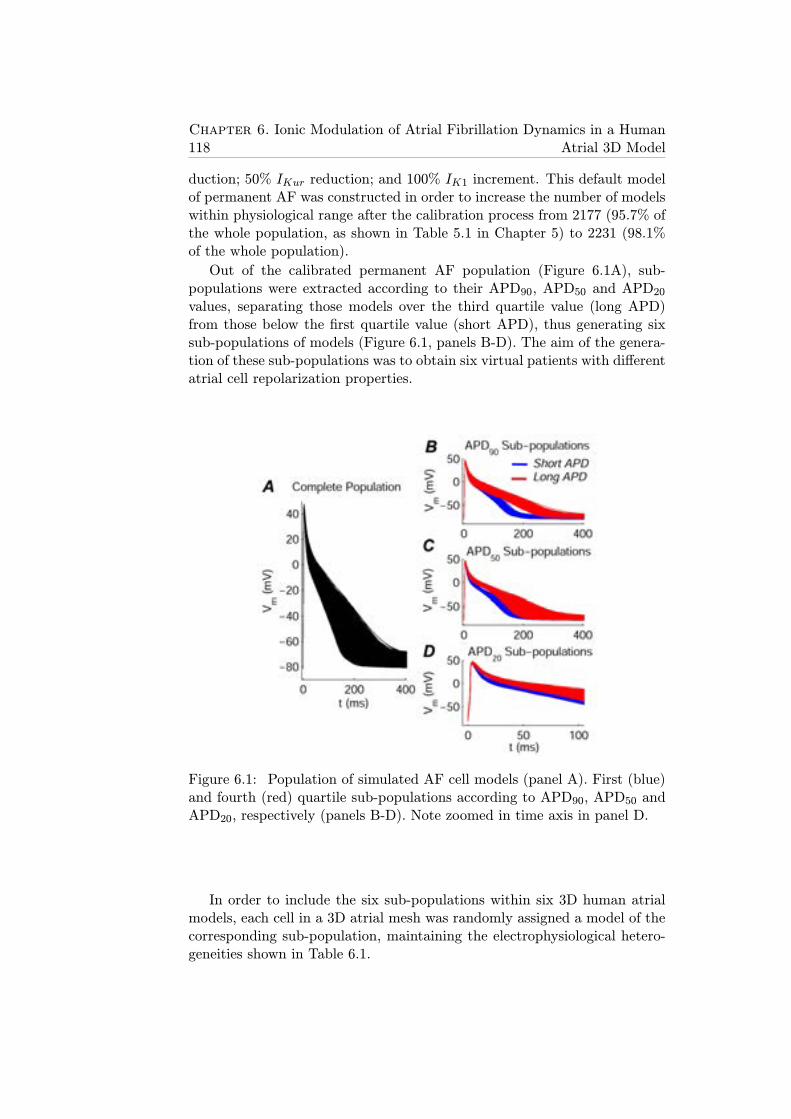
118Chapter 6. Ionic Modulation of Atrial Fibrillation Dynamics in a Human
Atrial 3D Model
duction; 50% IKur reduction; and 100% IK1 increment. This default modelof permanent AF was constructed in order to increase the number of modelswithin physiological range after the calibration process from 2177 (95.7% ofthe whole population, as shown in Table 5.1 in Chapter 5) to 2231 (98.1%of the whole population).
Out of the calibrated permanent AF population (Figure 6.1A), sub-populations were extracted according to their APD90, APD50 and APD20values, separating those models over the third quartile value (long APD)from those below the first quartile value (short APD), thus generating sixsub-populations of models (Figure 6.1, panels B-D). The aim of the genera-tion of these sub-populations was to obtain six virtual patients with differentatrial cell repolarization properties.
Figure 6.1: Population of simulated AF cell models (panel A). First (blue)and fourth (red) quartile sub-populations according to APD90, APD50 andAPD20, respectively (panels B-D). Note zoomed in time axis in panel D.
In order to include the six sub-populations within six 3D human atrialmodels, each cell in a 3D atrial mesh was randomly assigned a model of thecorresponding sub-population, maintaining the electrophysiological hetero-geneities shown in Table 6.1.
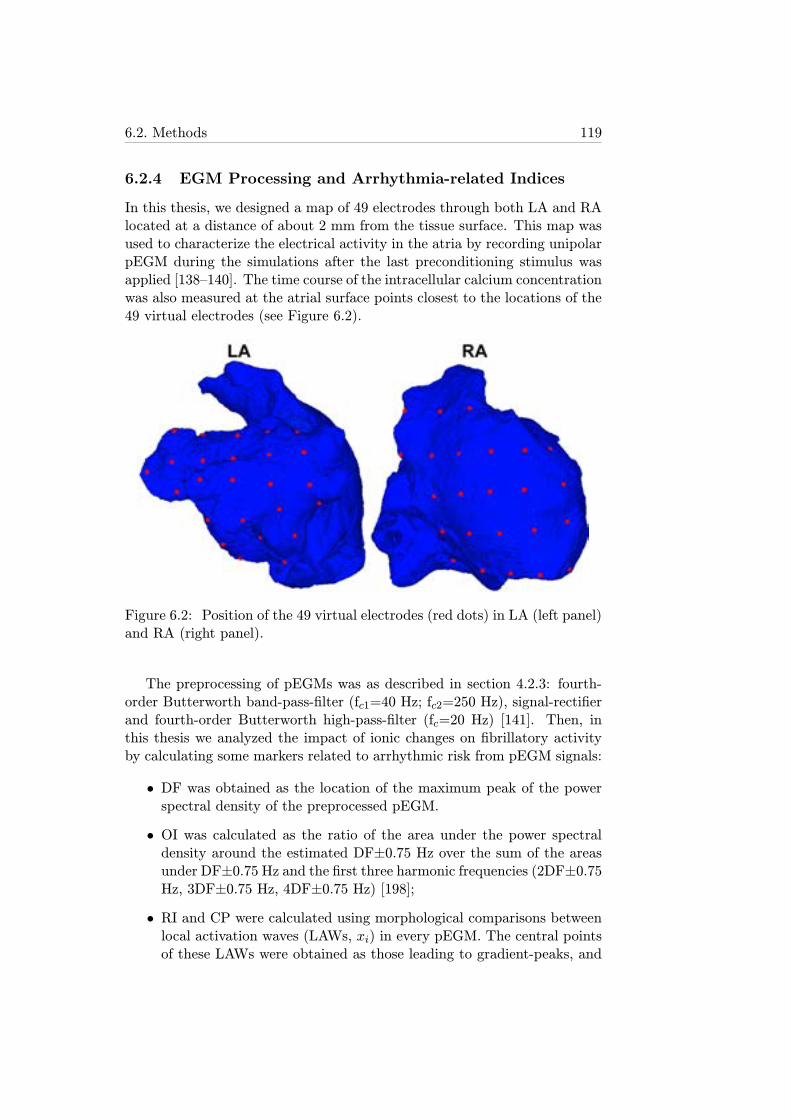
6.2. Methods 119
6.2.4 EGM Processing and Arrhythmia-related Indices
In this thesis, we designed a map of 49 electrodes through both LA and RAlocated at a distance of about 2 mm from the tissue surface. This map wasused to characterize the electrical activity in the atria by recording unipolarpEGM during the simulations after the last preconditioning stimulus wasapplied [138–140]. The time course of the intracellular calcium concentrationwas also measured at the atrial surface points closest to the locations of the49 virtual electrodes (see Figure 6.2).
Figure 6.2: Position of the 49 virtual electrodes (red dots) in LA (left panel)and RA (right panel).
The preprocessing of pEGMs was as described in section 4.2.3: fourth-order Butterworth band-pass-filter (fc1=40 Hz; fc2=250 Hz), signal-rectifierand fourth-order Butterworth high-pass-filter (fc=20 Hz) [141]. Then, inthis thesis we analyzed the impact of ionic changes on fibrillatory activityby calculating some markers related to arrhythmic risk from pEGM signals:
• DF was obtained as the location of the maximum peak of the powerspectral density of the preprocessed pEGM.
• OI was calculated as the ratio of the area under the power spectraldensity around the estimated DF±0.75 Hz over the sum of the areasunder DF±0.75 Hz and the first three harmonic frequencies (2DF±0.75Hz, 3DF±0.75 Hz, 4DF±0.75 Hz) [198];
• RI and CP were calculated using morphological comparisons betweenlocal activation waves (LAWs, xi) in every pEGM. The central pointsof these LAWs were obtained as those leading to gradient-peaks, and
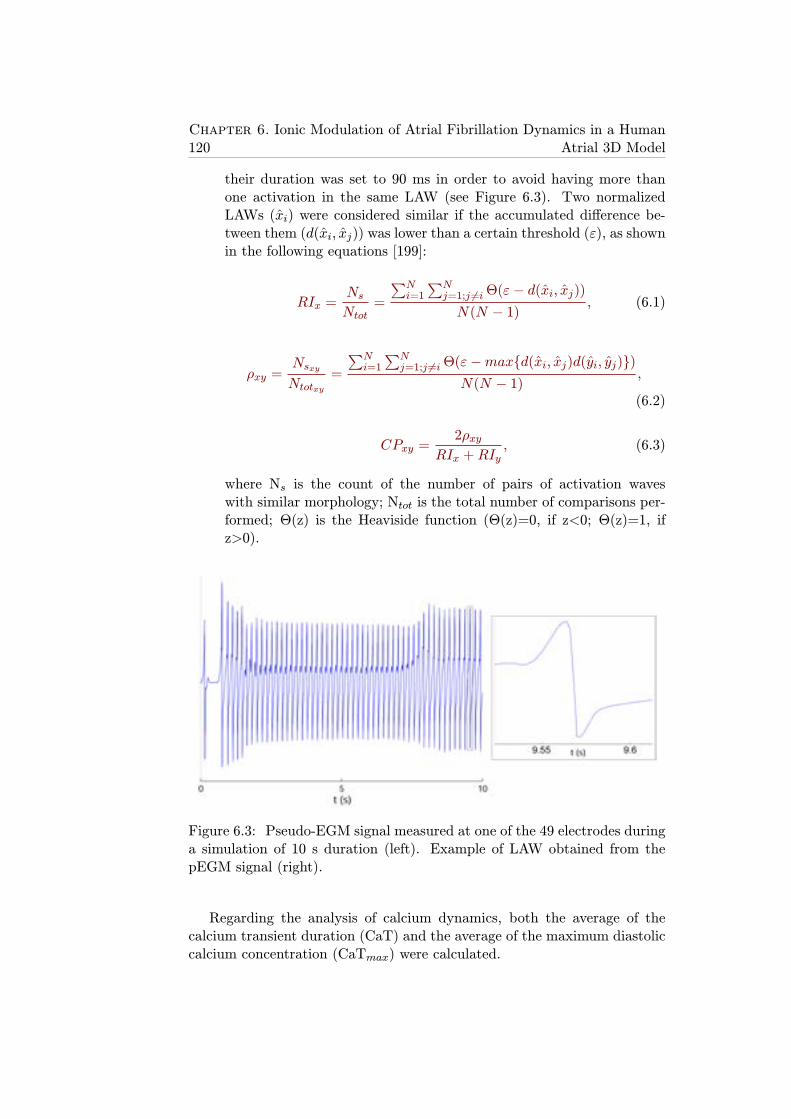
120Chapter 6. Ionic Modulation of Atrial Fibrillation Dynamics in a Human
Atrial 3D Model
their duration was set to 90 ms in order to avoid having more thanone activation in the same LAW (see Figure 6.3). Two normalizedLAWs (xi) were considered similar if the accumulated difference be-tween them (d(xi, xj)) was lower than a certain threshold (ε), as shownin the following equations [199]:
RIx =NsNtot
=
∑Ni=1
∑Nj=1;j 6=iΘ(ε− d(xi, xj))
N(N − 1), (6.1)
ρxy =NsxyNtotxy
=
∑Ni=1
∑Nj=1;j 6=iΘ(ε−max{d(xi, xj)d(yi, yj)})
N(N − 1),
(6.2)
CPxy =2ρxy
RIx +RIy, (6.3)
where Ns is the count of the number of pairs of activation waveswith similar morphology; Ntot is the total number of comparisons per-formed; Θ(z) is the Heaviside function (Θ(z)=0, if z<0; Θ(z)=1, ifz>0).
Figure 6.3: Pseudo-EGM signal measured at one of the 49 electrodes duringa simulation of 10 s duration (left). Example of LAW obtained from thepEGM signal (right).
Regarding the analysis of calcium dynamics, both the average of thecalcium transient duration (CaT) and the average of the maximum diastoliccalcium concentration (CaTmax) were calculated.
6.3. Results 121
6.2.5 Ann-Arbor Database
In order to validate our simulation results, we compared them with a setof intracardiac recordings provided by the Ann Arbor database [Ann ArborElectrogram Libraries, Chicago, IL, USA]. Only recordings of patients withAF were analyzed in this study. Furthermore, out of all the registered signals(ECG leads and EGM at different points on cardiac surface), in this thesiswe focused on the 20 unipolar EGM registered on either the HRA or theRAPG, since the rest of the signals in the database were registered in otherparts of the cardiac surface different from that of the atria. The samplingrate used for signal acquisition was 1000 Hz.
The signal processing techniques described in section 6.2.4 were appliedto calculate DF, OI and RI. CP was not calculated as only one EGM signalper patient was available.
6.3 Results
6.3.1 Parasympathetic Influence on Fibrillatory Dynamics
As shown in Figure 6.4, the level of [ACh] led to different propagation pat-terns through the atria. When [ACh] was set to 1 nM in the whole atria, thereentrant behavior was sustained by two main rotors located near the RPVand the RAPG, whereas when [ACh] was 5 nM, there was one main rotorat the RAPG and a few secondary rotors lasting for a few seconds (aroundthe left pulmonary veins (LPV)) or being blocked by the main rotor (inthe superior vena cava (SVC) or the mitral valve (MV)). DF distributionthroughout the tissue was almost uniform due to the highly stable rotorswhen both [ACh] levels were simulated, but on average its value was slightlyreduced for 5 nM (DF about 5.92 Hz) compared to 1 nM (DF about 6.15Hz). The organization and regularity of the simulated arrhythmias were an-alyzed by calculating OI, RI and CP indices on the pEGM. OI distributionwas also very homogeneous for both values of [ACh], taking higher values for[ACh]=1 nM. Regarding RI and CP, they were generally much lower when[ACh] was 5 nM due to the effects of temporary rotors on closely locatedpEGM (Figure 6.5).
6.3.2 Ionic Modulation of Reentrant Behavior in Human Atria
The effects of alterations in the ionic mechanisms unraveled in previous stud-ies on AF dynamics were investigated to assess their relevance as potentialtargets of anti-AF drugs. As expected from our results shown in chapter 4 oncell and tissue properties, IK1, INa and INaK modulate fibrillatory proper-ties and rotor dynamics. It is important to remark that, once the re-entrantwavefronts were generated following the applied stimulati, the fibrillatory
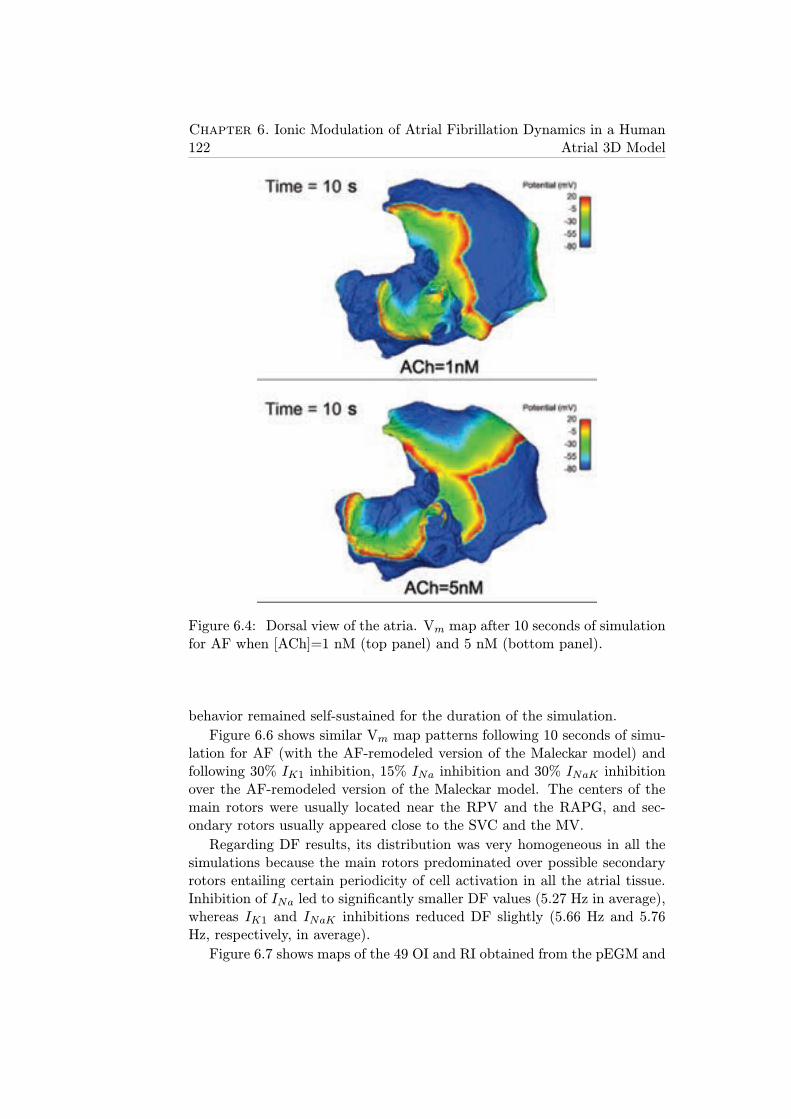
122Chapter 6. Ionic Modulation of Atrial Fibrillation Dynamics in a Human
Atrial 3D Model
Figure 6.4: Dorsal view of the atria. Vm map after 10 seconds of simulationfor AF when [ACh]=1 nM (top panel) and 5 nM (bottom panel).
behavior remained self-sustained for the duration of the simulation.
Figure 6.6 shows similar Vm map patterns following 10 seconds of simu-lation for AF (with the AF-remodeled version of the Maleckar model) andfollowing 30% IK1 inhibition, 15% INa inhibition and 30% INaK inhibitionover the AF-remodeled version of the Maleckar model. The centers of themain rotors were usually located near the RPV and the RAPG, and sec-ondary rotors usually appeared close to the SVC and the MV.
Regarding DF results, its distribution was very homogeneous in all thesimulations because the main rotors predominated over possible secondaryrotors entailing certain periodicity of cell activation in all the atrial tissue.Inhibition of INa led to significantly smaller DF values (5.27 Hz in average),whereas IK1 and INaK inhibitions reduced DF slightly (5.66 Hz and 5.76Hz, respectively, in average).
Figure 6.7 shows maps of the 49 OI and RI obtained from the pEGM and
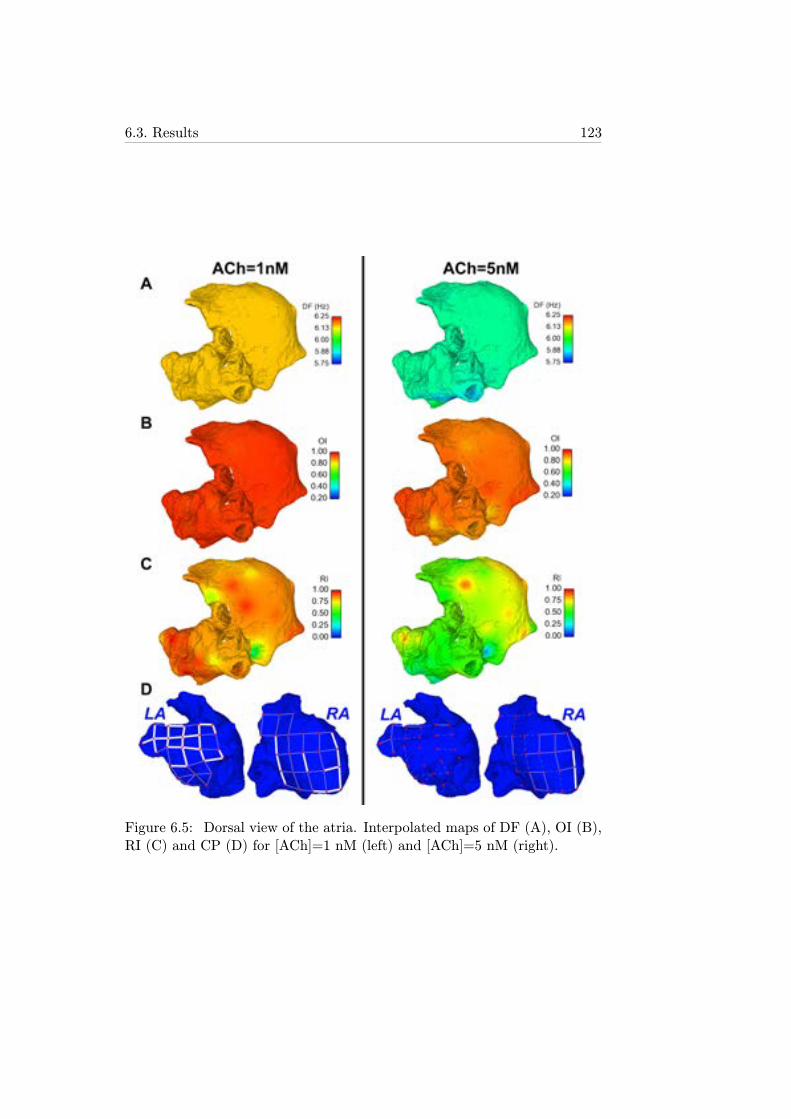
6.3. Results 123
Figure 6.5: Dorsal view of the atria. Interpolated maps of DF (A), OI (B),RI (C) and CP (D) for [ACh]=1 nM (left) and [ACh]=5 nM (right).
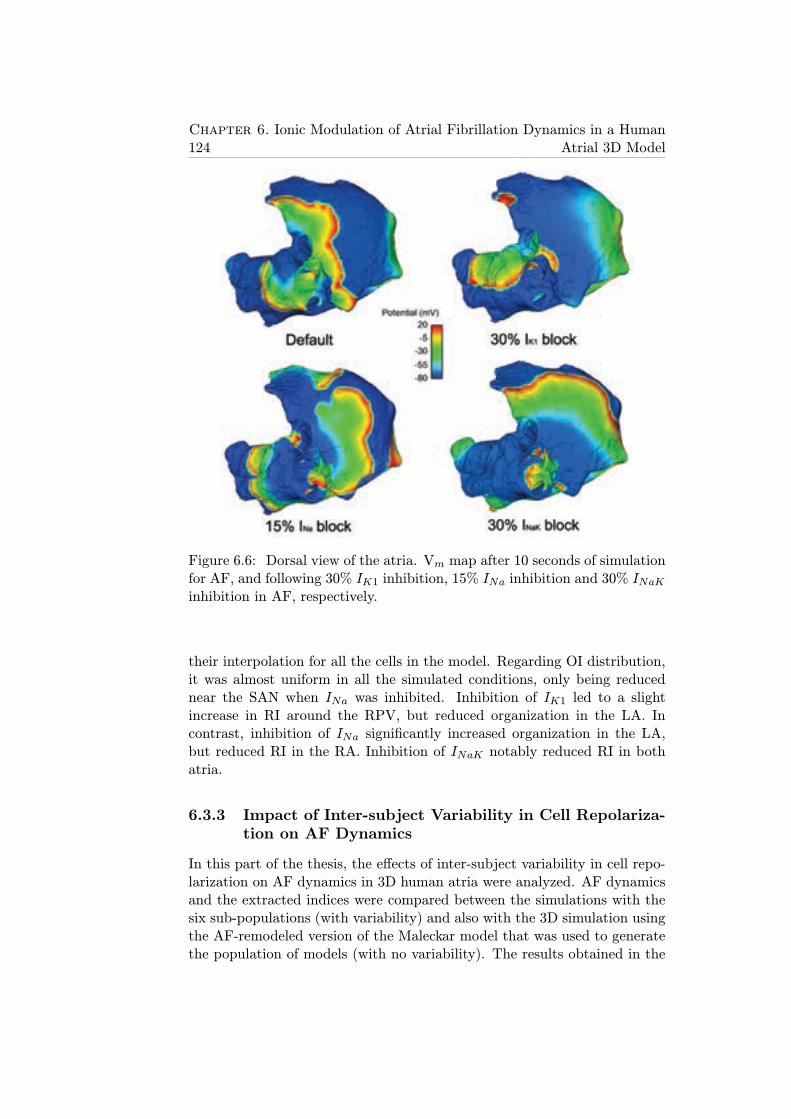
124Chapter 6. Ionic Modulation of Atrial Fibrillation Dynamics in a Human
Atrial 3D Model
Figure 6.6: Dorsal view of the atria. Vm map after 10 seconds of simulationfor AF, and following 30% IK1 inhibition, 15% INa inhibition and 30% INaKinhibition in AF, respectively.
their interpolation for all the cells in the model. Regarding OI distribution,it was almost uniform in all the simulated conditions, only being reducednear the SAN when INa was inhibited. Inhibition of IK1 led to a slightincrease in RI around the RPV, but reduced organization in the LA. Incontrast, inhibition of INa significantly increased organization in the LA,but reduced RI in the RA. Inhibition of INaK notably reduced RI in bothatria.
6.3.3 Impact of Inter-subject Variability in Cell Repolariza-tion on AF Dynamics
In this part of the thesis, the effects of inter-subject variability in cell repo-larization on AF dynamics in 3D human atria were analyzed. AF dynamicsand the extracted indices were compared between the simulations with thesix sub-populations (with variability) and also with the 3D simulation usingthe AF-remodeled version of the Maleckar model that was used to generatethe population of models (with no variability). The results obtained in the
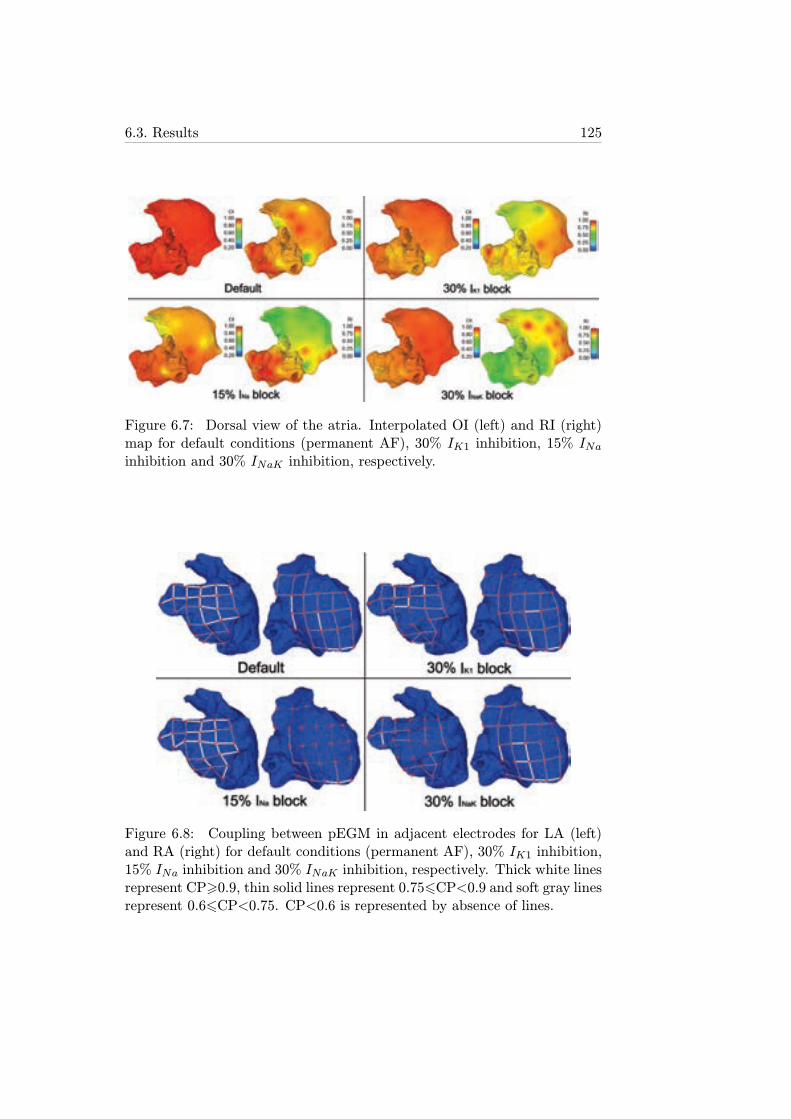
6.3. Results 125
Figure 6.7: Dorsal view of the atria. Interpolated OI (left) and RI (right)map for default conditions (permanent AF), 30% IK1 inhibition, 15% INainhibition and 30% INaK inhibition, respectively.
Figure 6.8: Coupling between pEGM in adjacent electrodes for LA (left)and RA (right) for default conditions (permanent AF), 30% IK1 inhibition,15% INa inhibition and 30% INaK inhibition, respectively. Thick white linesrepresent CP>0.9, thin solid lines represent 0.756CP<0.9 and soft gray linesrepresent 0.66CP<0.75. CP<0.6 is represented by absence of lines.
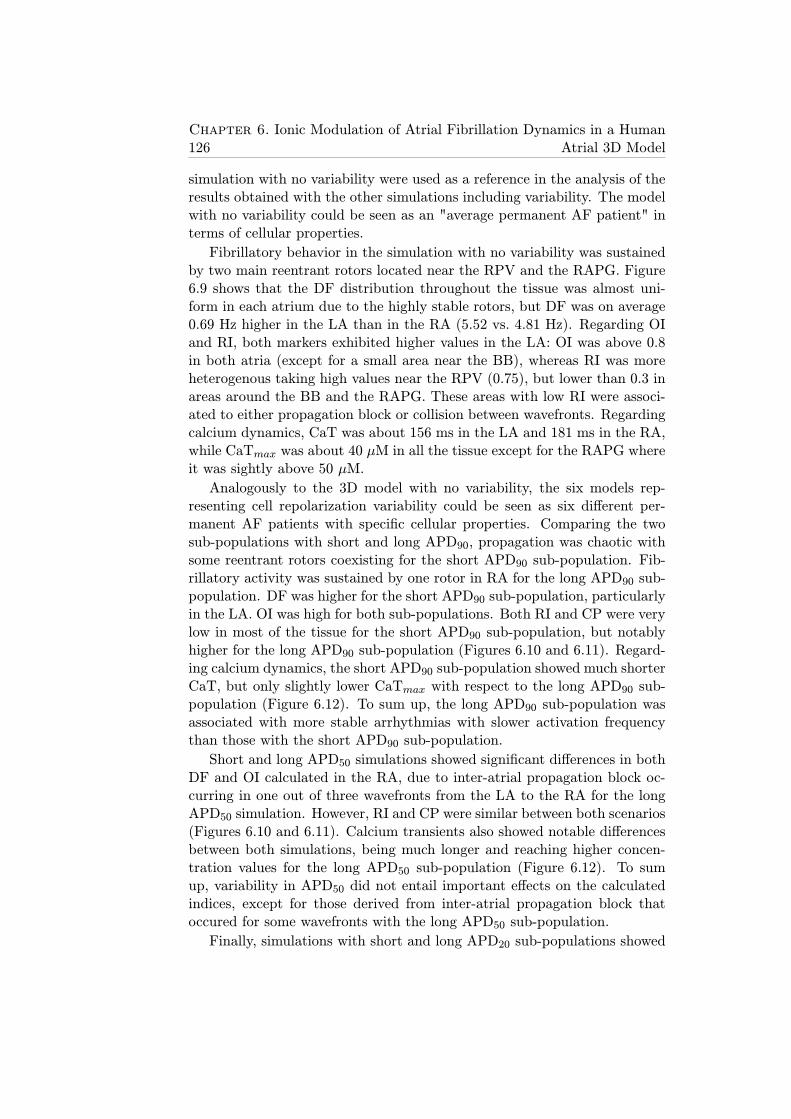
126Chapter 6. Ionic Modulation of Atrial Fibrillation Dynamics in a Human
Atrial 3D Model
simulation with no variability were used as a reference in the analysis of theresults obtained with the other simulations including variability. The modelwith no variability could be seen as an "average permanent AF patient" interms of cellular properties.
Fibrillatory behavior in the simulation with no variability was sustainedby two main reentrant rotors located near the RPV and the RAPG. Figure6.9 shows that the DF distribution throughout the tissue was almost uni-form in each atrium due to the highly stable rotors, but DF was on average0.69 Hz higher in the LA than in the RA (5.52 vs. 4.81 Hz). Regarding OIand RI, both markers exhibited higher values in the LA: OI was above 0.8in both atria (except for a small area near the BB), whereas RI was moreheterogenous taking high values near the RPV (0.75), but lower than 0.3 inareas around the BB and the RAPG. These areas with low RI were associ-ated to either propagation block or collision between wavefronts. Regardingcalcium dynamics, CaT was about 156 ms in the LA and 181 ms in the RA,while CaTmax was about 40 μM in all the tissue except for the RAPG whereit was sightly above 50 μM.
Analogously to the 3D model with no variability, the six models rep-resenting cell repolarization variability could be seen as six different per-manent AF patients with specific cellular properties. Comparing the twosub-populations with short and long APD90, propagation was chaotic withsome reentrant rotors coexisting for the short APD90 sub-population. Fib-rillatory activity was sustained by one rotor in RA for the long APD90 sub-population. DF was higher for the short APD90 sub-population, particularlyin the LA. OI was high for both sub-populations. Both RI and CP were verylow in most of the tissue for the short APD90 sub-population, but notablyhigher for the long APD90 sub-population (Figures 6.10 and 6.11). Regard-ing calcium dynamics, the short APD90 sub-population showed much shorterCaT, but only slightly lower CaTmax with respect to the long APD90 sub-population (Figure 6.12). To sum up, the long APD90 sub-population wasassociated with more stable arrhythmias with slower activation frequencythan those with the short APD90 sub-population.
Short and long APD50 simulations showed significant differences in bothDF and OI calculated in the RA, due to inter-atrial propagation block oc-curring in one out of three wavefronts from the LA to the RA for the longAPD50 simulation. However, RI and CP were similar between both scenarios(Figures 6.10 and 6.11). Calcium transients also showed notable differencesbetween both simulations, being much longer and reaching higher concen-tration values for the long APD50 sub-population (Figure 6.12). To sumup, variability in APD50 did not entail important effects on the calculatedindices, except for those derived from inter-atrial propagation block thatoccured for some wavefronts with the long APD50 sub-population.
Finally, simulations with short and long APD20 sub-populations showed
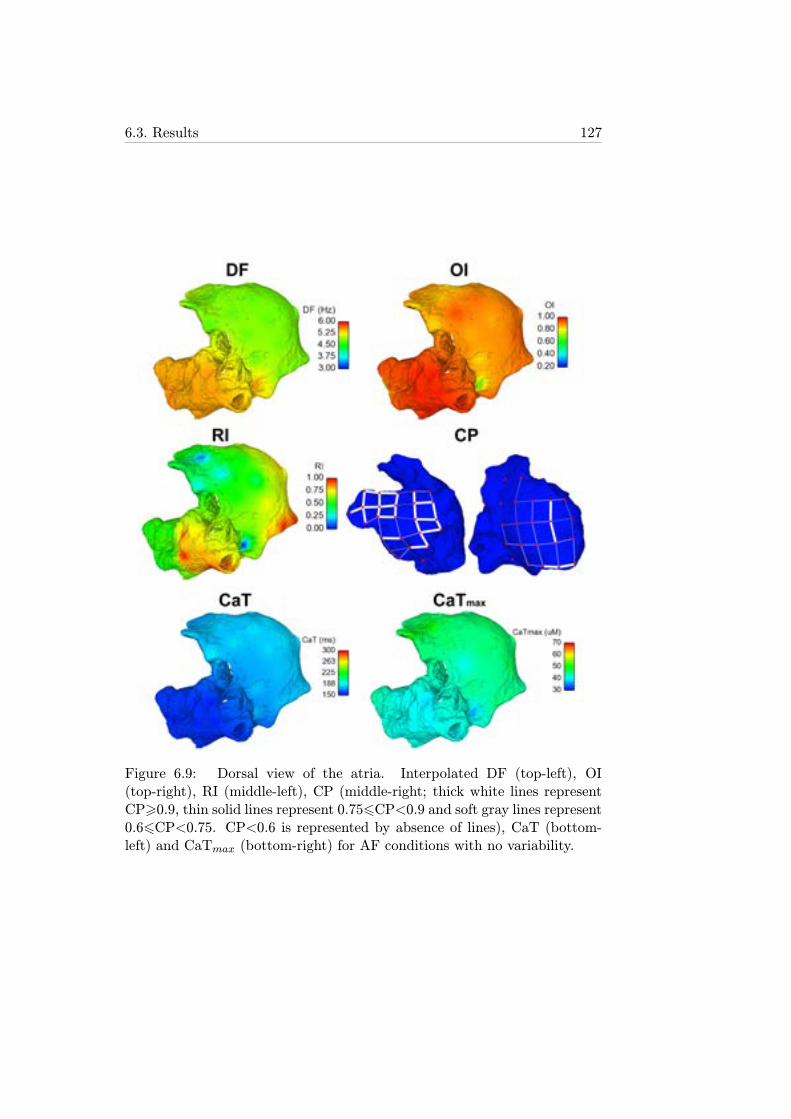
6.3. Results 127
Figure 6.9: Dorsal view of the atria. Interpolated DF (top-left), OI(top-right), RI (middle-left), CP (middle-right; thick white lines representCP>0.9, thin solid lines represent 0.756CP<0.9 and soft gray lines represent0.66CP<0.75. CP<0.6 is represented by absence of lines), CaT (bottom-left) and CaTmax (bottom-right) for AF conditions with no variability.
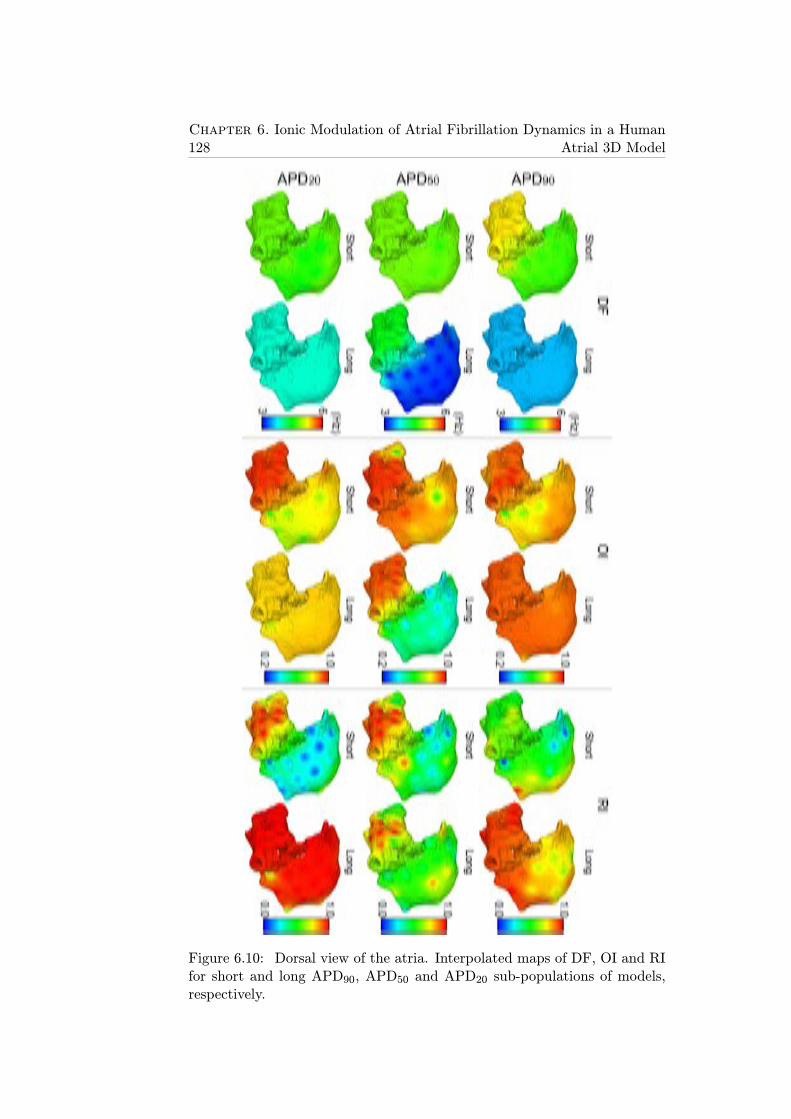
128Chapter 6. Ionic Modulation of Atrial Fibrillation Dynamics in a Human
Atrial 3D Model
Figure 6.10: Dorsal view of the atria. Interpolated maps of DF, OI and RIfor short and long APD90, APD50 and APD20 sub-populations of models,respectively.
6.3. Results 129
Figure 6.11: Dorsal view of the atria. CP between pEGM in adjacentelectrodes for LA (left) and RA (right) for short and long APD90, APD50 andAPD20 sub-populations of models, respectively. Thick white lines representCP>0.9, thin solid lines represent 0.756CP<0.9 and soft gray lines represent0.66CP<0.75. CP<0.6 is represented by absence of lines.
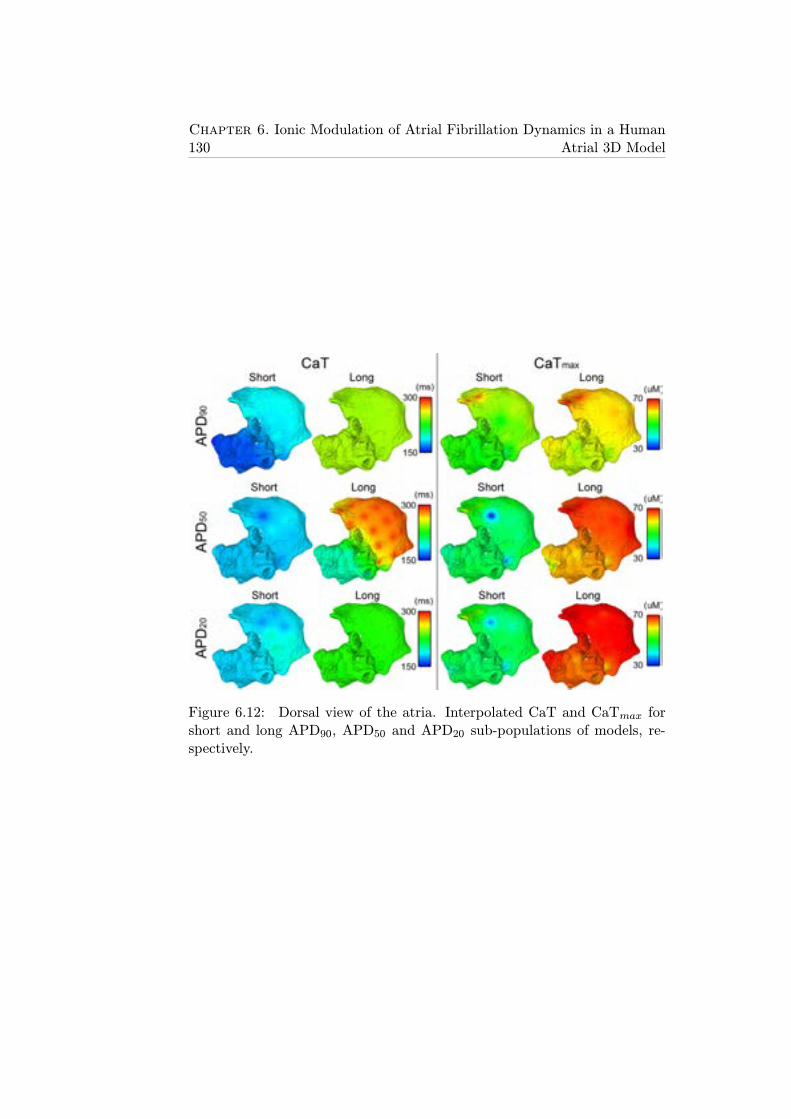
130Chapter 6. Ionic Modulation of Atrial Fibrillation Dynamics in a Human
Atrial 3D Model
Figure 6.12: Dorsal view of the atria. Interpolated CaT and CaTmax forshort and long APD90, APD50 and APD20 sub-populations of models, re-spectively.
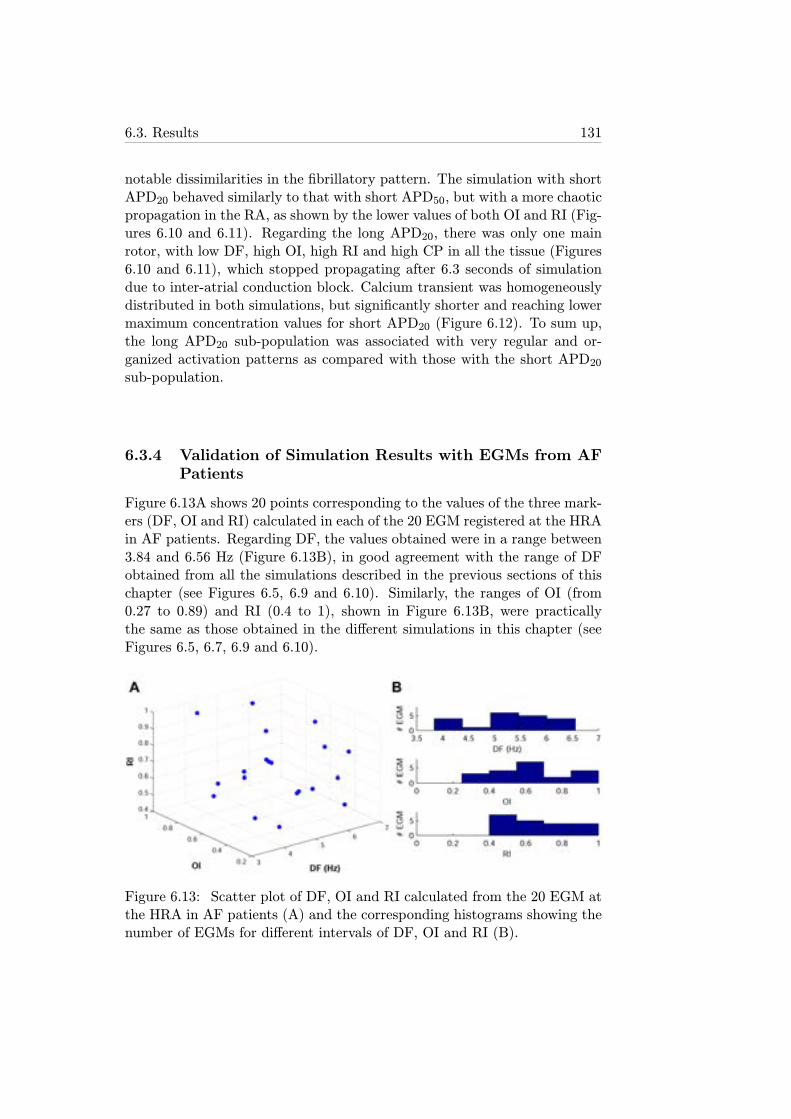
6.3. Results 131
notable dissimilarities in the fibrillatory pattern. The simulation with shortAPD20 behaved similarly to that with short APD50, but with a more chaoticpropagation in the RA, as shown by the lower values of both OI and RI (Fig-ures 6.10 and 6.11). Regarding the long APD20, there was only one mainrotor, with low DF, high OI, high RI and high CP in all the tissue (Figures6.10 and 6.11), which stopped propagating after 6.3 seconds of simulationdue to inter-atrial conduction block. Calcium transient was homogeneouslydistributed in both simulations, but significantly shorter and reaching lowermaximum concentration values for short APD20 (Figure 6.12). To sum up,the long APD20 sub-population was associated with very regular and or-ganized activation patterns as compared with those with the short APD20sub-population.
6.3.4 Validation of Simulation Results with EGMs from AFPatients
Figure 6.13A shows 20 points corresponding to the values of the three mark-ers (DF, OI and RI) calculated in each of the 20 EGM registered at the HRAin AF patients. Regarding DF, the values obtained were in a range between3.84 and 6.56 Hz (Figure 6.13B), in good agreement with the range of DFobtained from all the simulations described in the previous sections of thischapter (see Figures 6.5, 6.9 and 6.10). Similarly, the ranges of OI (from0.27 to 0.89) and RI (0.4 to 1), shown in Figure 6.13B, were practicallythe same as those obtained in the different simulations in this chapter (seeFigures 6.5, 6.7, 6.9 and 6.10).
Figure 6.13: Scatter plot of DF, OI and RI calculated from the 20 EGM atthe HRA in AF patients (A) and the corresponding histograms showing thenumber of EGMs for different intervals of DF, OI and RI (B).
132Chapter 6. Ionic Modulation of Atrial Fibrillation Dynamics in a Human
Atrial 3D Model
6.4 Discussion
The results obtained in this chapter confirmed the importance of the parasym-pathetic system, through the inclusion of [ACh], on the modulation of AFdynamics. High levels of [ACh] significantly shortened both cellular APDand tissue RP, thus allowing several wavelets to propagate simultaneously asoccurs in AF [28]. The simulations showed that high [ACh] levels promoteddisorganization of arrhythmia despite not entailing very significant changesin DF.
Furthermore, in this study the relevance of certain ionic currents in mod-ulating arrhythmic markers was confirmed (DF, OI, RI and CP). Thesemarkers can also be used in clinical practice with real EGMs in order toguide anti-arrhythmic therapies, such as ablation procedures. The main ad-vantage of this technique was the capability of fully characterize the wholeatria with only 49 electrodes. Regarding the ionic current alteration effects,changes in INa and, to a lesser extent, IK1 and INaK induced importanteffects on arrhythmogenesis in atrial tissue. Their inhibition led to an anti-arrhythmic decrease in DF, more prominent when the inhibited ionic currentis INa than when IK1 or INaK were inhibited. Organization and regularityof fibrillatory waves were increased in the LA if an inhibition of INa was sim-ulated, whereas reduction in either IK1 or INaK led to more disorganizedelectrical propagation in the LA. In contrast, inhibitions of IK1 or INaKmaintained organization of the waves in the RA, whereas INa inhibitionreduced RI and CP in this heart chamber.
Previous studies have remarked that smaller IK1 in human atria maylead to deceleration and decreased stability of rotors, as occured in ourstudy, but entails depolarized RMP associated with increased susceptibilityto arrhythmias [125]. This is in agreement with our results showing highlyorganized arrhythmias with areas of low regularity when IK1 was inhibited.
INa inhibition effectively slows down CV, increases WL of reentrant cir-cuits and reduces DF [120], in agreement with the results of the presentstudy. However, the possible side effects on ventricular electrophysiologyof sodium channel blockers highlight the necessity of finding more effectiveatrial selective therapies.
Regarding INaK , it is shown that alterations in the activity of the NaKpump in atrial tissue induced slight effects on fibrillatory dynamics andorganization, despite its key role on cellular APD and rate adaptation, asshown in chapter 4.
In the study of the effects of inter-subject variability on AF-related mark-ers, seven whole human atrial models with specific variability in cell repolar-ization dynamics were used: 1 corresponding the AF-remodeled version ofthe Maleckar model and 6 corresponding to the six-subpopulations extractedaccording to their APD. A more heterogeneous tissue has been associated in
6.4. Discussion 133
previous studies with slower reentrant circuits, thus favoring the generationof secondary rotors and wavelets [51]. The simulations conducted in the pre-sen thesis showed notable differences in fibrillatory behavior between rapidand slow repolarization dynamics, with the results being highly dependenton the stage of atrial cell repolarization under investigation.
In this regard, differences in the final phase of repolarization (APD90)led to significant changes in the fibrillatory pattern and therefore in themodulation of DF, RI and CaT, in good agreement with the effects of phar-macological interventions targeting ionic currents involved in this phase,such as IK1, INaK , IKr or IKs (see section 1.3.3.1 of this thesis).
Differences in the middle repolarization phase (APD50) highly influ-enced the propagation pattern, including inter-atrial conduction block whenAPD50 is long, leading to significant inter-atrial differences in DF, OI, andCaT. CaTmax was also strongly modulated by APD50 variability, as expectedby the role of ICaL in this repolarization phase.
Analysis of the initial phase of repolarization (APD20) was similar tothat of the middle phase, with the exception of the total propagation blockof the reentrant circuit that occured after 6.3 seconds of simulation whenthe APD20 was long. Differences in RI and CaTmax were explained by tothe role of ionic currents involved in this repolarization phase, particularlyIto, IKur and ICaL.
6.4.1 Limitations of the Study
In this chapter of the thesis, reentrant behavior was generated using a par-ticular stimulation protocol consisting of periodic stimuli applied at the SANfollowed by 6 extra-stimuli near the RPV. However, AF in clinical practicemay present multiple ectopic foci that trigger and sustain the arrhythmia,whereas their location may be variable as well.
Regarding the database used for experimental validation, only 20 EGMsof AF patients were recorded in either HRA or RAPG. An increase in boththe number of recordings and the number of electrode locations in atrialsurface would improve the accuracy of the validation of the simulations.
Another limitation of this study is the small number of virtual electrodesused (49) thus leading to visible interpolation artifacts. This number wasthe result of mapping both atria, LA and RA, with a precision of about1 cm. Precision was high enough to properly characterize the arrhythmicbehavior since the electrical propagation wavefronts were much coarser thanthe separation between adjacent electrodes.
As a final remark, the random assignment of a specific model withineach sub-population to each cell in the 3D model could potentially lead toneighboring cells with very different electrophysiological properties. Thiseffect was however reduced for two reasons: 1) variability in the AP within

134Chapter 6. Ionic Modulation of Atrial Fibrillation Dynamics in a Human
Atrial 3D Model
each sub-population was relatively small (first and fourth quartiles of thesubpopulations were chosen to represent the slight variability present withinone subject); 2) the electrotonic coupling between cells strongly smoothedelectrical gradients during propagation.
Chapter 7
Conclusions and FutureExtensions
7.1 Conclusions
The results presented in this thesis improve the understanding of the mech-anisms underlying properties related to human atrial arrhythmias throughthe use of cardiac computational modeling techniques. In this section thespecific conclusions drawn through the chapters of this thesis are summa-rized.
7.1.1 Ionic Mechanisms Underlying Human Atrial Electro-physiology Markers in SR
Measurable markers in individual cardiomyocytes and cardiac tissue pro-vide useful knowledge about the likelihood of arrhythmia generation. Inthis thesis, we unravel the ionic mechanisms underlying electrophysiologicalproperties in human atria in order to improve the limited understandingof the intrinsic changes underlying AF and help in the design of new anti-arrhythmic therapies.
Among these properties, we start studying the ability of cardiac cells toadapt to changes in HR since its impairment has been related to higher ar-rhythmic risk. This property has been previously studied in ventricular cellsand therefore its characterization understanding of the underlying mecha-nisms in atrial cells complements the knowledge of cellular rate adaptationin the whole heart. In this thesis, we calculate APD during the course of apacing protocol simulating sudden and sustained changes in HR. We haveconfirmed that atrial APD adaptation takes several minutes to complete andconsists of two different phases: an initial fast phase lasting for a few seconds(with an associated time constant τfast between 6 and 8 s, depending on theHR change (acceleration or deceleration)) followed by a slow phase lasting
135
136 Chapter 7. Conclusions and Future Extensions
for several minutes (time constant, τslow, between 4 and 7 minutes). Slightquantitative differences in the characterization of APD rate adaptation, i.e.different values of APD and time constants, are found between human atrialmodels.
The ionic mechanisms underlying both phases of APD rate adaptationare different. In the fast phase, the maximal activity of the NaCa exchangerand the conductance of ICaL are responsible for the abrupt alteration of theAPD value during the first seconds following the HR acceleration or decel-eration. Regarding the slow phase, intracellular sodium dynamics, [Na+]i,modulate slow accomodation of APD. The NaK pump plays an importantrole in [Na+]i dynamics, and thus is key in the modulation of the slow APDadaptation. These mechanisms are different from those obtained in humanventricular cells regarding the fast phase of adaptation, where the activationkinetics of ICaL and the inactivation kinetics of IKs were identified as themajor determinants. However, the ionic mechanisms modulating the slowadaptation are consistent in cells from both cardiac cavities, being [Na+]iand NaK pump the most relevant players in both cases.
Regarding the relationship between APD adaptation and arrhythmogen-esis, protracted APD adaptation to changes in HR has been associated withhigher arryhthmic risk in the ventricle and have been investigated here inthe human atrium. Conditions entailing longer time constants for both thefast phase and the slow phase of adaptation are related to higher likelihoodof generating atrial arrhythmias, as shown by the markers studied in thisthesis: calcium current reactivation, AP triangulation and slopes of APDRcurves.
To extend the analysis of the ionic mechanisms underlying arrhythmia-related properties, we also quantify the relative importance of ionic currentconductances and kinetics in modulating AP (APD and RMP) and APDrestitution curves in single human atrial cell, and refractoriness (RP), CVand rotor dynamics (WL, PS and VW) in human atrial tissue. The analysisperformed in this thesis uncovers GNaK as a key modulator of refractorinessand rotor dynamics in human atria and confirms GK1 and GNa as importantdeterminants of AF-related electrophysiological properties. Simultaneouschanges in these three ionic properties are also studied in this thesis to assesstheir effects on the dynamics and vulnerability of human atrial tissue toreentrant arrhythmias. We evaluate vulnerability to reentries by calculatingthe range of CIs between consecutive stimuli leading to stable rotors. Thisvulnerability is found to be minimized by simultaneous reduction in bothGK1 and GNaK and increase in GNa, while the lowest reentrant frequencyis obtained when GK1, GNaK and GNa are simultaneously reduced.
Furthermore, in this thesis we analyze the temporal adaptation that oc-curs following the application of an ionic change, since in most cases thesteady-state is not reached instantaneously. Changes in GNaK entail bipha-
7.1. Conclusions 137
sic adaptation of the electrophysiological markers studied, while adaptationis monophasic when changes in the rest of the ionic properties are simulated.The relevance of GNaK in modulating atrial electrophysiology is anticipatedto have important implications for the interpretation of the efficacy of anti-AF drugs that interfere with GNaK , such as amiodarone and digitalis.
7.1.2 Ionic Mechanisms Underlying Human Atrial Electro-physiology Markers in AF Conditions
In order to study the effects of the changes associated with AF on the ionicmechanisms underlying atrial electrophysiology, AF-remodeled versions ofthe models are used in this thesis. Simulation results are compared to thoseobtained in SR.
Overall, similar results regarding the ionic mechanisms underlying atrialelectrophysiological markers are obtained in AF conditions with respect toSR, but with smaller effects of ionic current changes on atrial electrophysiol-ogy in AF. This may explain the reported lower efficacy of pharmacologicalinterventions targeting ionic currents in the treatment of long-term versusshort-term AF patients. Regarding the ionic mechanisms underlying electro-physiological properties, the most significant changes in AF with respect toSR are: enhaced relevance of GK1 in modulating APD restitution, increasedimportance of GNa in modulating tissue refractoriness and reduced relativeimportance of GCaL.
The in-depth characterization of the ionic basis of atrial electrophysi-ology and AF-related mechanisms provided in this thesis could guide theidentification of more effective therapies against AF.
7.1.3 Ionic Mechanisms Underlying Inter-subject Variabilityin Human Atrial AP
In the first parts of this thesis, cardiac computational models with no vari-ability are used to ascertain the ionic mechanisms underlying electrophysio-logical properties related to arrhythmic risk. However, inter-subject variabil-ity present in nature is often responsible for both the different likelihood ofarrhythmia generation and the different response to anti-arrhythmic agentsbetween patients. Variability in APD at different repolarization stages(APD90, APD50 and APD20) and variability in AP morphology (calculatedas the difference between APD90 and APD50) are particularly notable inboth SR and AF patients: APD90 ranges from about 190 ms to 440 ms inSR and from about 140 to 330 in AF, APD50 ranges from about 6 ms to 200ms in SR and from about 30 ms to 180 ms in AF and APD20 ranges fromabout 1 ms to 60 ms in SR and from about 140 ms to 330 ms in AF. The ionicdeterminants of this variability in SR and AF patients are investigated in thepresent thesis. To do so, we design a computational model population-based
138 Chapter 7. Conclusions and Future Extensions
approach developed based on a large range of human atrial electrophysio-logical recordings: 469 AP recordings corresponding to 363 patients withSR (214 patients with paroxysmal, recent onset or non-signs of AF) andwith AF (149 patients with permanent AF for longer than 6 months at thetime of tissue collection). We use three atrial AP models as a reference togenerate populations of models in SR and AF conditions by simulating 2275combinations of the six ionic conductances previously unraveled in this the-sis as exerting the strongest effects on atrial properties: GK1, GNaK , GCaL,Gto, GKur and GNaCa.
Analysis of model populations reveals that the main ionic mechanismsmodulating inter-subject variability in the different stages of repolarizationof the AP are similar in SR and AF. In both populations of models, GCaL,Gto and GKur are key in modulating inter-subject differences in APD20 andAPD50, whereas GK1 and GNaK determine patient-specific values of APD90,in good agreement with their key role in APD modulation ascertained inprevious parts of this thesis. The unraveled ionic mechanisms underlyingvariability in AP morphology are GK1, GNaK and GNaCa.
Simulation results of this part of the thesis are slightly dependent on thecomputational model taken as reference to generate the populations. Differ-ent relevance in the role of GCaL in modulating variability in APD90 and ofboth GK1 and GNaK in modulating variability in APD20 was observed.
The populations of human atrial cell models are used to provide informa-tion on the ionic mechanisms of variability, which may underlie AP measure-ments. Elucidating ionic mechanisms underlying inter-subject variability inatrial electrophysiological properties may be crucial in the understandingof inter-subject differences in human atrial dynamics and the response toanti-AF pharmacological therapies.
7.1.4 Ionic Mechanisms Underlying AF Dynamics in 3D Vir-tual Human Atria
The use of realistic 3D atrial models is very useful to analyze arrhythmicdynamics from a macroscopic point of view close to what occurs in realhearts. Since a whole atria is a combination of thousands of cells and tissueswith specific properties, the simulation results obtained in previous parts ofthis thesis are useful to guide simulations in 3D virtual human atria.
In the last part of this thesis, the role of ionic currents in modulating AFdynamics in realistic 3D atrial models is determined. We simulate arrhyth-mic behavior by applying rapid pacing near PV. Then, the distribution ofDF, organization and morphological regularity of the arrhythmia are calcu-lated through signal processing of pEGM signals recorded at different pointsof atrial surface.
Since the main mechanisms modulating atrial cell and tissue properties
7.2. Future Extensions 139
are GK1, GNaK and GNa, as previously described in the thesis, changes inthese ionic properties are investigated in realistic 3D atrial models. Simu-lations confirm the potential interest of developing atrial selective anti-AFdrugs aiming at inhibiting either GK1 or GNa or GNaK . Inhibition of anyof these ionic current conductances reduces DF, in good agreement with theresults shown in previous parts of the thesis, whereas the regularity andorganization of the electrical propagation increase in the LA when GNa isreduced, but not when either GK1 or GNaK are inhibited. Effects of ionicchanges on the electrical activity in the RA are negligible.
Furthermore, since the activity of the parasympathetic system has beensuggested to play a role in modulating AF dynamics via the modulation ofAPD and tissue refractoriness, this is evaluated in this thesis through thesimulation of different levels of [ACh]. Simulations show that high [ACh]levels promote more disorganized activation patterns, whereas their effecton DF is not significant.
As previously stated, inter-subject variability plays a key role in botharrhythmogenesis and response to anti-arrhythmic drugs between differentpatients. Furthermore, the analysis of inter-subject variability in 3D vir-tual human atria contributes to improve our understanding of concurrentmechanisms promoting and maintaining AF. In this part of the thesis, wesimulate six realistic human atria with different cell repolarization dynamics.In order to do this, populations of models in AF are generated to respre-sent inter-subject variability in AF patients, and then six sub-populations ofmodels are extracted out of the whole population according to their values ofAPD20, APD50 or APD90. Those models in the first quartile are classified asassociated with short repolarization, and those models in the fourth quartileare classified as associated with long repolarization. Simulations show thatpatients with long atrial APD present slow but very regular fibrillatory pat-terns, whereas short APDs may entail high frequency reentrant rotors andhigher organization. Furthermore, fibrillatory dynamics and electrical prop-agation depend on the specific repolarization characteristics of each subject:short APD20, long APD20, short APD50, long APD50, short APD90 and longAPD90.
7.2 Future Extensions
Some of the possible future research lines identified during the developmentof this thesis are:
1. New 3D atrial models and fibrosis. In this thesis we have used one3D atrial model as a basis for our investigations, but it would beworthwhile exploring if significant differences are found when usingrefined 3D meshes or distinct anatomical structures. Furthermore, it
140 Chapter 7. Conclusions and Future Extensions
woult be of interest to include the effects of fibrosis in the 3D models,whose generation is closely related to AF structural remodeling, soas to more realistic investigate atrial tissue characteristics under AFconditions.
2. Whole heart model. One of the most challenging tasks in the develop-ment of human heart models is the generation of a unique 3D modelincluding the four cavities and the Purkinje system. Most studies usemodels from ionic to 3D levels for either the atria, as done in thisthesis, or the ventricles or the Purkinje system, but not all of them to-gether. This would provide a global view of the behavior of the humanheart under physiological or pathophysiological conditions.
3. Electromechanic effects. In this thesis, we have only focused on electro-physiological aspects of atrial activity. The effects of heart movementsduring its contraction-relaxation course could be investigated throughthe use of more complex human atrial models with the ability of beingdeformable in order to simulate more realistic cardiac behavior.
4. Torso model. In this thesis, electrical signals measured on the atrialsurface of a 3D atrial model are analyzed, representing EGM signals.The use of a torso model would provide the possibility of computingsimulated signals on the body surface, which could then be comparedwith ECG recordings of AF patients.
5. Patient-specific models. In this thesis, inter-subject variability hasbeen proven to be relevant in the study of arrhythmogenesis, withdifferent patients showing different proneness to suffer an arrhythmia.Therefore, a promising future line could be to investigate and generateelectrophysiological models adapted to each specific patient aiming atimproving the treatments and therapies to apply.
6. Populations of models to study dependence on gender. We have studiedand compared populations of models in SR and AF, but other aspectssuch as gender could be included in the populations to specificallyinvestigate their contribution to arrhythmogenesis. As regards gender,experimental studies have proven the existence of differences in themRNA between atrial cells in male vs. female patients. The analysisof the differences between male and female in the ionic mechanismsunderlying atrial electrophysiology and their relation to arrhythmicrisk could be a matter of future investigations, particularly consideringthat the incidence of AF is significantly higher in men than in women.
Glossary
1D One-dimensional2D Two-dimensional3D Three-dimensionalACh Acetylcholine[ACh] Acetylcholine concentrationAF Atrial fibrillationAP Action potentialAPA AP amplitudeAPD AP durationAPD20 APD at 20% repolarizationAPD50 APD at 50% repolarizationAPD90 APD at 90% repolarizationAPDR APD restitutionATP Adenosine triphosphateAVR Atrioventricular ring[Ca2+]i Intracellular calcium concentration[Ca2+]o Extracellular calcium concentration[Ca2+]rel Calcium concentration in release compartment[Ca2+]up Calcium concentration in uptake compartmentCaT Calcium transientCaTmax Maximum concentration during CaTCBC CarbamylcholineCFAE Complex fractionated atrial EGMCI Coupling intervalCL Cycle lengthCm Membrane capacitance[Cmdn]max Total calmodulin concentration in myoplasmCm,p Parameter value for sensitivity analysisCP Coupling index between pairs of EGMsCT Cresta terminalisCTI Cavotricuspid isthmusCV Conduction velocityd Activation gating variable of ICaL
141
142 Chapter 7. Conclusions and Future Extensions
D Diffusion coefficientDAD Delayed afterdepolarizationDF Dominant frequencydV/dtmax Maximum AP upstroke velocityd(xi, xj) Accumulated difference between xi and xjEAD Early afterdepolarizationECa Equilibrium potential for calcium ionsECG ElectrocardiogramEGM ElectrogramEK Equilibrium potential for potassium ionsENa Equilibrium potential for sodium ionsf Inactivation gating variable of ICaLF Faraday constantfc Cutoff frequencyfCa Calcium-dependent inactivation gating variable of ICaLFO Fossa ovalisfv Vm-dependent variable of INaKgbCa Constant conductance associated with Ib,CagbNa Constant conductance associated with Ib,NagCaL Constant conductance associated with ICaLGCaL Maximal conductance associated with ICaLgK1 Constant conductance associated with IK1GK1 Maximal conductance associated with IK1GKACh Maximal conductance associated with IKAChgKr Constant conductance associated with IKrGKr Maximal conductance associated with IKrgKs Constant conductance associated with IKsGKs Maximal conductance associated with IKsgKur Constant conductance associated with IKurGKur Maximal conductance associated with IKurgNa Constant conductance associated with INaGNa Maximal conductance associated with INaGNaK Maximal conductance associated with INaKGNaCa Maximal conductance associated with INaCagto Constant conductance associated with ItoGto Maximal conductance associated with Itoh Inactivation gating variable of INahERG IKr-associated channelsHR Heart rateHRA High right atriumIAB Inter-atrial bridgesIb,Na Background sodium leak currentIb,Ca Background calcium leak currentICa Total calcium current
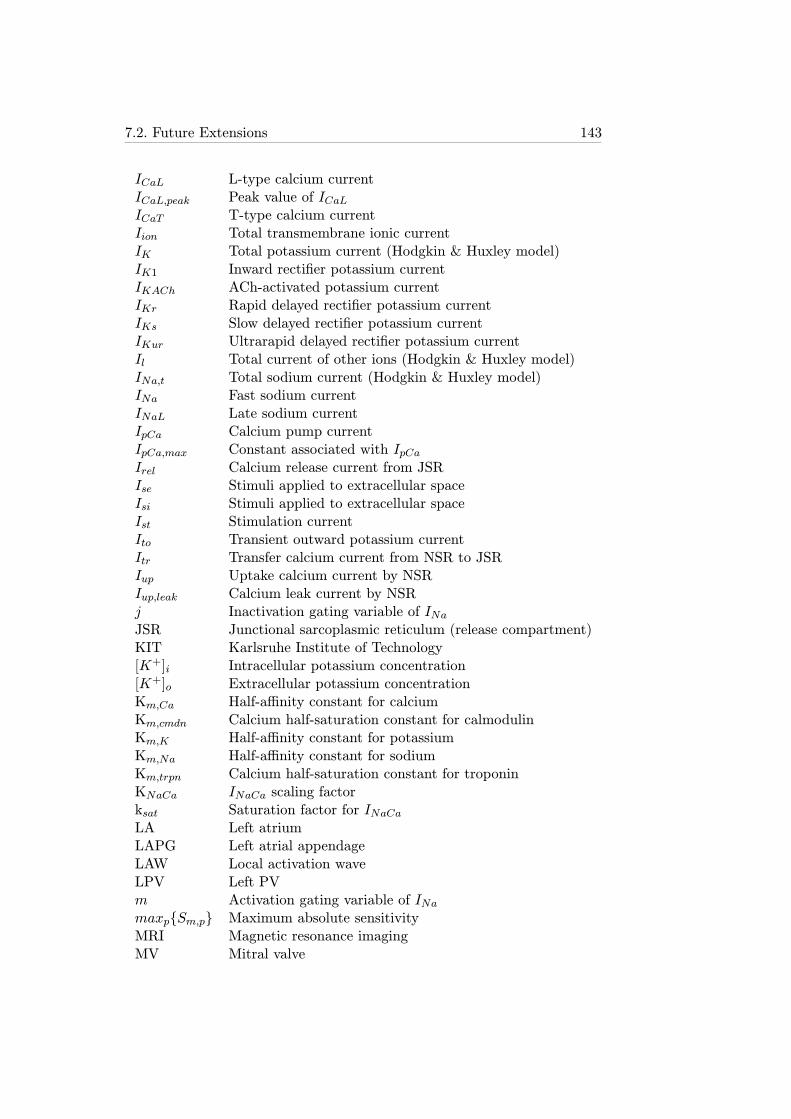
7.2. Future Extensions 143
ICaL L-type calcium currentICaL,peak Peak value of ICaLICaT T-type calcium currentIion Total transmembrane ionic currentIK Total potassium current (Hodgkin & Huxley model)IK1 Inward rectifier potassium currentIKACh ACh-activated potassium currentIKr Rapid delayed rectifier potassium currentIKs Slow delayed rectifier potassium currentIKur Ultrarapid delayed rectifier potassium currentIl Total current of other ions (Hodgkin & Huxley model)INa,t Total sodium current (Hodgkin & Huxley model)INa Fast sodium currentINaL Late sodium currentIpCa Calcium pump currentIpCa,max Constant associated with IpCaIrel Calcium release current from JSRIse Stimuli applied to extracellular spaceIsi Stimuli applied to extracellular spaceIst Stimulation currentIto Transient outward potassium currentItr Transfer calcium current from NSR to JSRIup Uptake calcium current by NSRIup,leak Calcium leak current by NSRj Inactivation gating variable of INaJSR Junctional sarcoplasmic reticulum (release compartment)KIT Karlsruhe Institute of Technology[K+]i Intracellular potassium concentration[K+]o Extracellular potassium concentrationKm,Ca Half-affinity constant for calciumKm,cmdn Calcium half-saturation constant for calmodulinKm,K Half-affinity constant for potassiumKm,Na Half-affinity constant for sodiumKm,trpn Calcium half-saturation constant for troponinKNaCa INaCa scaling factorksat Saturation factor for INaCaLA Left atriumLAPG Left atrial appendageLAW Local activation waveLPV Left PVm Activation gating variable of INamaxp{Sm,p} Maximum absolute sensitivityMRI Magnetic resonance imagingMV Mitral valve
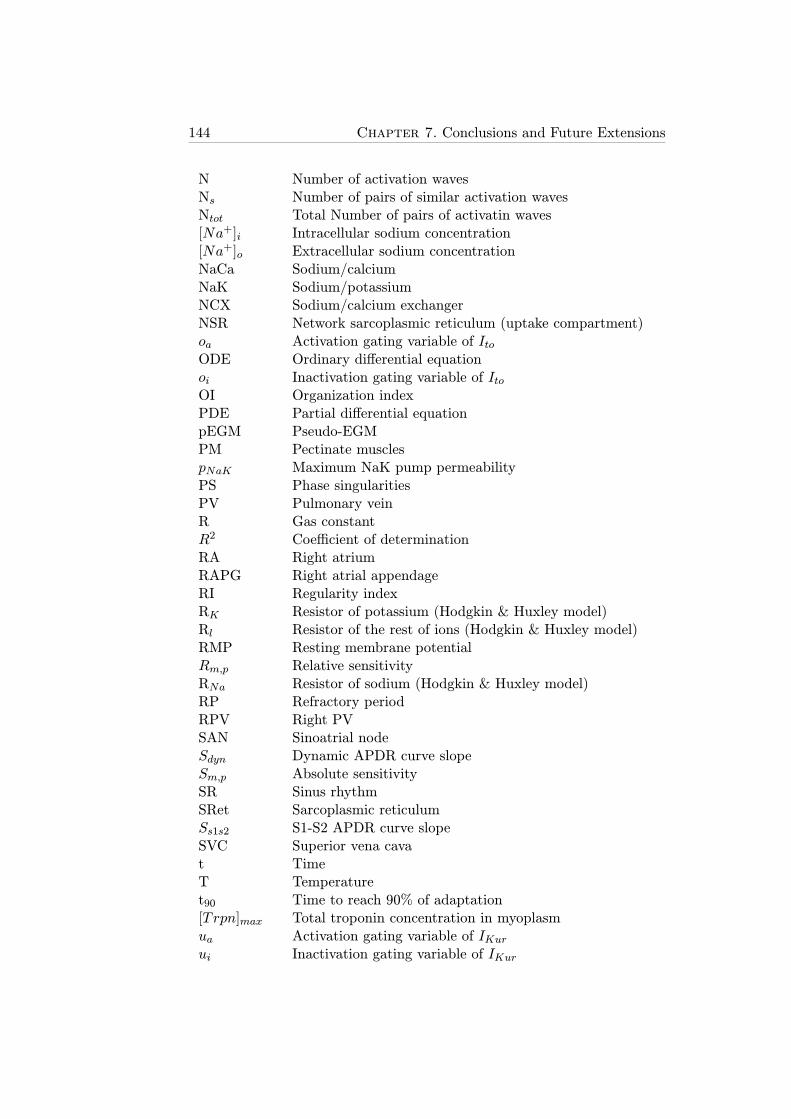
144 Chapter 7. Conclusions and Future Extensions
N Number of activation wavesNs Number of pairs of similar activation wavesNtot Total Number of pairs of activatin waves[Na+]i Intracellular sodium concentration[Na+]o Extracellular sodium concentrationNaCa Sodium/calciumNaK Sodium/potassiumNCX Sodium/calcium exchangerNSR Network sarcoplasmic reticulum (uptake compartment)oa Activation gating variable of ItoODE Ordinary differential equationoi Inactivation gating variable of ItoOI Organization indexPDE Partial differential equationpEGM Pseudo-EGMPM Pectinate musclespNaK Maximum NaK pump permeabilityPS Phase singularitiesPV Pulmonary veinR Gas constantR2 Coefficient of determinationRA Right atriumRAPG Right atrial appendageRI Regularity indexRK Resistor of potassium (Hodgkin & Huxley model)Rl Resistor of the rest of ions (Hodgkin & Huxley model)RMP Resting membrane potentialRm,p Relative sensitivityRNa Resistor of sodium (Hodgkin & Huxley model)RP Refractory periodRPV Right PVSAN Sinoatrial nodeSdyn Dynamic APDR curve slopeSm,p Absolute sensitivitySR Sinus rhythmSRet Sarcoplasmic reticulumSs1s2 S1-S2 APDR curve slopeSVC Superior vena cavat TimeT Temperaturet90 Time to reach 90% of adaptation[Trpn]max Total troponin concentration in myoplasmua Activation gating variable of IKurui Inactivation gating variable of IKur
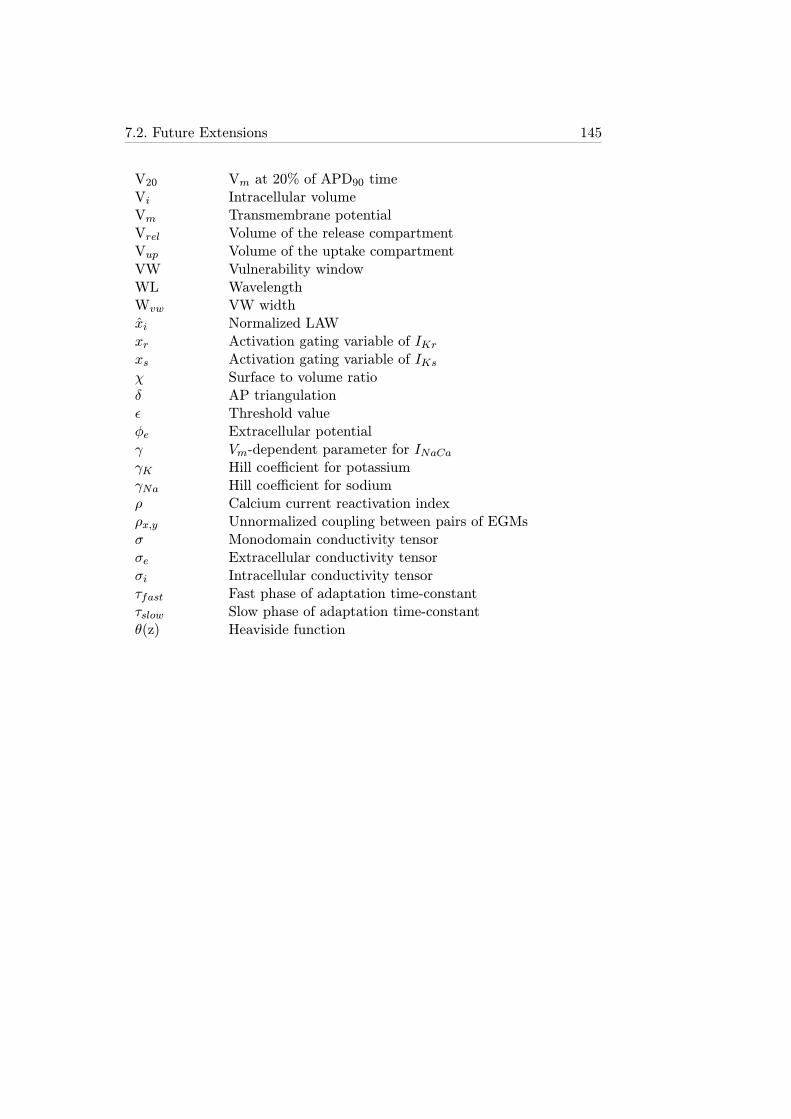
7.2. Future Extensions 145
V20 Vm at 20% of APD90 timeVi Intracellular volumeVm Transmembrane potentialVrel Volume of the release compartmentVup Volume of the uptake compartmentVW Vulnerability windowWL WavelengthWvw VW widthxi Normalized LAWxr Activation gating variable of IKrxs Activation gating variable of IKsχ Surface to volume ratioδ AP triangulationε Threshold valueφe Extracellular potentialγ Vm-dependent parameter for INaCaγK Hill coefficient for potassiumγNa Hill coefficient for sodiumρ Calcium current reactivation indexρx,y Unnormalized coupling between pairs of EGMsσ Monodomain conductivity tensorσe Extracellular conductivity tensorσi Intracellular conductivity tensorτfast Fast phase of adaptation time-constantτslow Slow phase of adaptation time-constantθ(z) Heaviside function

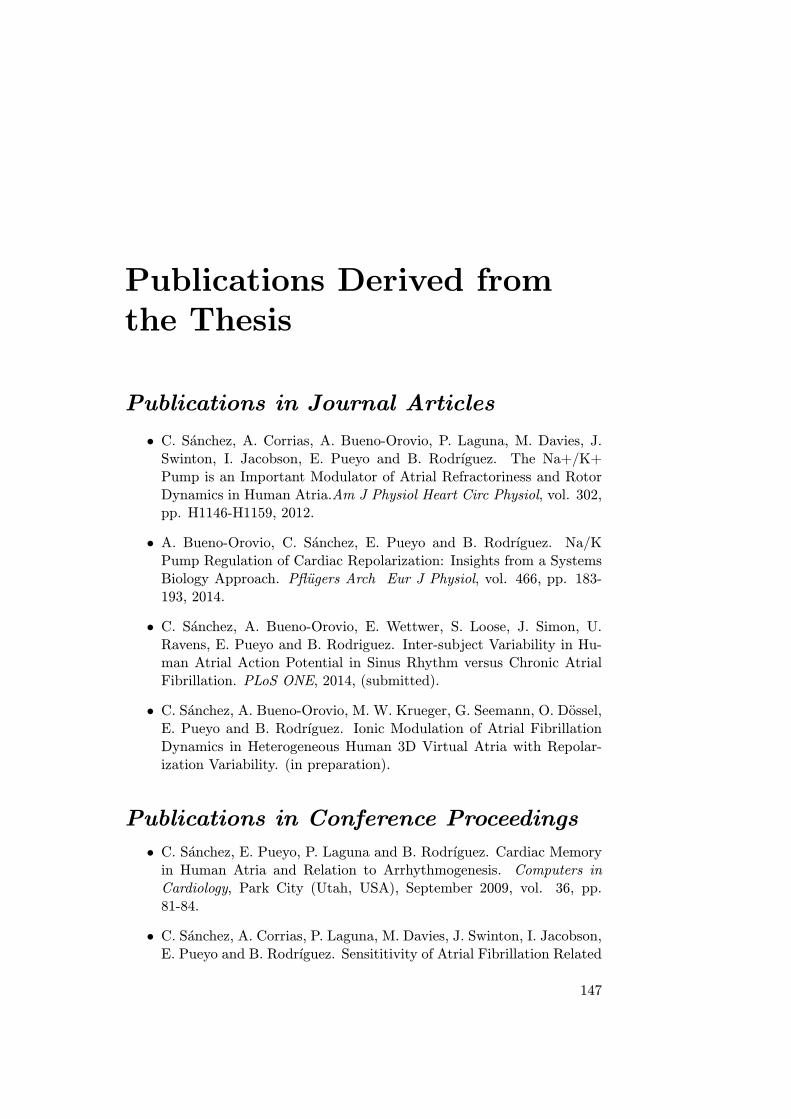
Publications Derived fromthe Thesis
Publications in Journal Articles
• C. Sanchez, A. Corrias, A. Bueno-Orovio, P. Laguna, M. Davies, J.Swinton, I. Jacobson, E. Pueyo and B. Rodrıguez. The Na+/K+Pump is an Important Modulator of Atrial Refractoriness and RotorDynamics in Human Atria.Am J Physiol Heart Circ Physiol, vol. 302,pp. H1146-H1159, 2012.
• A. Bueno-Orovio, C. Sanchez, E. Pueyo and B. Rodrıguez. Na/KPump Regulation of Cardiac Repolarization: Insights from a SystemsBiology Approach. Pflugers Arch Eur J Physiol, vol. 466, pp. 183-193, 2014.
• C. Sanchez, A. Bueno-Orovio, E. Wettwer, S. Loose, J. Simon, U.Ravens, E. Pueyo and B. Rodriguez. Inter-subject Variability in Hu-man Atrial Action Potential in Sinus Rhythm versus Chronic AtrialFibrillation. PLoS ONE, 2014, (submitted).
• C. Sanchez, A. Bueno-Orovio, M. W. Krueger, G. Seemann, O. Dossel,E. Pueyo and B. Rodrıguez. Ionic Modulation of Atrial FibrillationDynamics in Heterogeneous Human 3D Virtual Atria with Repolar-ization Variability. (in preparation).
Publications in Conference Proceedings
• C. Sanchez, E. Pueyo, P. Laguna and B. Rodrıguez. Cardiac Memoryin Human Atria and Relation to Arrhythmogenesis. Computers inCardiology, Park City (Utah, USA), September 2009, vol. 36, pp.81-84.
• C. Sanchez, A. Corrias, P. Laguna, M. Davies, J. Swinton, I. Jacobson,E. Pueyo and B. Rodrıguez. Sensititivity of Atrial Fibrillation Related
147
148 Chapter 7. Conclusions and Future Extensions
Biomarkers to Changes in Ionic Current Properties. Heart RhythmSociety Scientific Sessions, Denver (Colorado, USA), May 2010, vol.7, no 5, pp. S227.
• C. Sanchez, A. Corrias, P. Laguna, M. Davies, J. Swinton, I. Jacobson,E. Pueyo and B. Rodrıguez. Potential Pharmacological Therapies forAtrial Fibrillation. A Computational Study. Computing in Cardiology,Belfast (Northern Ireland, United Kingdom), September 2010, vol. 37,pp. 413-416.
• C. Sanchez, B. Rodrıguez and E. Pueyo. Ionic Modulators of Electro-physiology and Re-entry Properties in Human Atria. Computing inCardiology, Hangzhou (China), September 2011, vol. 38, pp. 77-80.
• C. Sanchez, M. W. Krueger, G. Seemann, O. Dossel, E. Pueyo andB. Rodrıguez. Ionic Modulation of Atrial Fibrillation Dynamics in aHuman 3D Atrial Model. Computing in Cardiology, Krakow (Poland),September 2012, vol. 39, pp. 137-140.
• C. Sanchez, A. Bueno-Orovio, E. Pueyo and B. Rodrıguez. Cell Re-polarization Variability Modulates Atrial Fibrillation Dynamics in 3DVirtual Human Atria. Computing in Cardiology, Zaragoza (Spain),September 2013, vol. 40, pp. 911-914.
Bibliography
[1] “Inebase,” tech. rep., Instituto Nacional de Estadıstica, Feb. 2012.
[2] P. G. Morton, Critical Care Nursing: A Holistic Approach. LippincottWilliams&Wilki, 2005.
[3] K. Nademanee, J. McKenzie, E. Kosar, M. Schwab, B. Sunsanee-witayakul, T. Vasavakul, C. Khunnawat, and T. Ngarmukos, “A newapproach for catheter ablation of atrial fibrillation: mapping of theelectrophysiologic substrate,” Journal of the American College of Car-diology, vol. 43, pp. 2044–2053, June 2004.
[4] L. Hove-Madsen, A. Llach, A. Bayes-Genis, S. Roura, E. Ro-driguez Font, A. Aris, and J. Cinca, “Atrial fibrillation is associ-ated with increased spontaneous calcium release from the sarcoplasmicreticulum in human atrial myocytes,”Circulation, vol. 110, pp. 1358–1363, Sept. 2004.
[5] L. Hove-Madsen, C. Prat-Vidal, A. Llach, F. Ciruela, V. Casado,C. Lluis, A. Bayes-Genis, J. Cinca, and R. Franco, “Adenosine A2A re-ceptors are expressed in human atrial myocytes and modulate sponta-neous sarcoplasmic reticulum calcium release,”Cardiovasc Res, vol. 72,pp. 292–302, Nov. 2006.
[6] L. Hove-Madsen and L. Tort, “L-type ca2+ current and excitation-contraction coupling in single atrial myocytes from rainbow trout,”American Journal of Physiology - Regulatory, Integrative and Com-parative Physiology, vol. 275, pp. R2061–R2069, Dec. 1998.
[7] C. E. Molina, H. Gesser, A. Llach, L. Tort, and L. Hove-Madsen,“Mod-ulation of membrane potential by an acetylcholine-activated potassiumcurrent in trout atrial myocytes,”Am. J. Physiol. Regul. Integr. Comp.Physiol., vol. 292, pp. R388–395, Jan. 2007.
[8] D. Werry, J. Eldstrom, Z. Wang, and D. Fedida, “Single-channel basisfor the slow activation of the repolarizing cardiac potassium current,IKs,” PNAS, vol. 110, pp. E996–E1005, Mar. 2013.
149
150 BIBLIOGRAPHY
[9] X. Grosmaitre, A. Vassalli, P. Mombaerts, G. M. Shepherd, andM. Ma, “Odorant responses of olfactory sensory neurons expressingthe odorant receptor MOR23: a patch clamp analysis in gene-targetedmice,” PNAS, vol. 103, pp. 1970–1975, Feb. 2006.
[10] R. Fischmeister, R. K. A. Jr, and R. L. DeHaan, “Some limitationsof the cell-attached patch clamp technique: a two-electrode analysis,”Pflugers Arch., vol. 406, pp. 73–82, Jan. 1986.
[11] A. L. Hodgkin and A. F. Huxley, “A quantitative description of mem-brane current and its application to conduction and excitation innerve,” J. Physiol. (Lond.), vol. 117, pp. 500–544, Aug. 1952.
[12] L. Sornmo and P. Laguna, Bioelectrical signal processing in cardiacand neurological applications. Elsevier Academic Press, June 2005.
[13] A. Nygren, C. Fiset, L. Firek, J. W. Clark, D. S. Lindblad, R. B. Clark,and W. R. Giles, “Mathematical model of an adult human atrial cell:the role of k+ currents in repolarization,”Circ. Res., vol. 82, pp. 63–81,Jan. 1998.
[14] Z. Wang, B. Fermini, and S. Nattel, “Delayed rectifier outward cur-rent and repolarization in human atrial myocytes,”Circ. Res., vol. 73,pp. 276–285, Aug. 1993.
[15] M. Courtemanche, R. J. Ramirez, and S. Nattel, “Ionic mechanismsunderlying human atrial action potential properties: insights from amathematical model,” Am. J. Physiol., vol. 275, pp. H301–321, July1998.
[16] E. Grandi, S. V. Pandit, N. Voigt, A. J. Workman, D. Dobrev, J. Jalife,and D. M. Bers, “Human atrial action potential and ca2+ model: sinusrhythm and chronic atrial fibrillation,”Circ. Res., vol. 109, pp. 1055–1066, Oct. 2011.
[17] J. T. Koivumaki, T. Korhonen, and P. Tavi, “Impact of sarcoplasmicreticulum calcium release on calcium dynamics and action potentialmorphology in human atrial myocytes: a computational study,” PLoSComput. Biol., vol. 7, no. 1, p. e1001067, 2011.
[18] M. M. Maleckar, J. L. Greenstein, W. R. Giles, and N. A. Trayanova,“K+ current changes account for the rate dependence of the actionpotential in the human atrial myocyte,” Am. J. Physiol. Heart Circ.Physiol., vol. 297, pp. H1398–1410, Oct. 2009.
[19] J. Feng, G. R. Li, B. Fermini, and S. Nattel, “Properties of sodium andpotassium currents of cultured adult human atrial myocytes,”Am. J.Physiol., vol. 270, pp. H1676–1686, May 1996.
BIBLIOGRAPHY 151
[20] C. H. Luo and Y. Rudy, “A dynamic model of the cardiac ventricu-lar action potential. i. simulations of ionic currents and concentrationchanges,”Circ. Res., vol. 74, pp. 1071–1096, June 1994.
[21] S. Sossalla, B. Kallmeyer, S. Wagner, M. Mazur, U. Maurer, K. Tois-cher, J. D. Schmitto, R. Seipelt, F. A. Schondube, G. Hasenfuss, L. Be-lardinelli, and L. S. Maier, “Altered na(+) currents in atrial fibrillationeffects of ranolazine on arrhythmias and contractility in human atrialmyocardium,”J. Am. Coll. Cardiol., vol. 55, pp. 2330–2342, May 2010.
[22] T. J. Kamp and J. W. Hell, “Regulation of cardiac l-type calcium chan-nels by protein kinase a and protein kinase c,” Circulation Research,vol. 87, pp. 1095–1102, Dec. 2000.
[23] H. Irisawa, H. F. Brown, and W. Giles, “Cardiac pacemaking in thesinoatrial node,” Physiol. Rev., vol. 73, pp. 197–227, Jan. 1993.
[24] H. Karaki, H. Ozaki, M. Hori, M. Mitsui-Saito, K.-I. Amano, K.-I.Harada, S. Miyamoto, H. Nakazawa, K.-J. Won, and K. Sato,“Calciummovements, distribution, and functions in smooth muscle,”PharmacolRev, vol. 49, pp. 157–230, June 1997.
[25] S. Koumi, C. L. Backer, and C. E. Arentzen, “Characterization ofinwardly rectifying k+ channel in human cardiac myocytes. alterationsin channel behavior in myocytes isolated from patients with idiopathicdilated cardiomyopathy,”Circulation, vol. 92, pp. 164–174, July 1995.
[26] Z. Wang, B. Fermini, and S. Nattel, “Rapid and slow components ofdelayed rectifier current in human atrial myocytes,”Cardiovasc. Res.,vol. 28, pp. 1540–1546, Oct. 1994.
[27] S. S. Demir, J. W. Clark, and W. R. Giles, “Parasympathetic modula-tion of sinoatrial node pacemaker activity in rabbit heart: a unifyingmodel,”American Journal of Physiology - Heart and Circulatory Phys-iology, vol. 276, pp. H2221–H2244, June 1999.
[28] J. Kneller, R. Zou, E. J. Vigmond, Z. Wang, L. J. Leon, and S. Nat-tel, “Cholinergic atrial fibrillation in a computer model of a two-dimensional sheet of canine atrial cells with realistic ionic properties,”Circ. Res., vol. 90, pp. E73–87, May 2002.
[29] G. J. Amos, E. Wettwer, F. Metzger, Q. Li, H. M. Himmel, andU. Ravens, “Differences between outward currents of human atrial andsubepicardial ventricular myocytes.,” J Physiol, vol. 491, pp. 31–50,Feb. 1996.
152 BIBLIOGRAPHY
[30] A. Bueno-Orovio, C. Sanchez, E. Pueyo, and B. Rodriguez, “Na/Kpump regulation of cardiac repolarization: insights from a systemsbiology approach,” Pflugers Arch., vol. 466, pp. 183–193, Feb. 2014.
[31] D. C. Gadsby,“Ion channels versus ion pumps: the principal difference,in principle,”Nat. Rev. Mol. Cell Biol., vol. 10, pp. 344–352, May 2009.
[32] D. M. Bers, “Calcium fluxes involved in control of cardiac myocytecontraction,”Circ. Res., vol. 87, pp. 275–281, Aug. 2000.
[33] N. Jost, N. Nagy, C. Corici, Z. Kohajda, A. Horvath, K. Acsai, P. Bil-iczki, J. Levijoki, P. Pollesello, T. Koskelainen, L. Otsomaa, A. Toth,J. G. Papp, A. Varro, and L. Virag, “ORM-10103, a novel specific in-hibitor of the na(+) /Ca(2+) exchanger, decreases early and delayedafterdepolarizations in the canine heart,”Br. J. Pharmacol., vol. 170,pp. 768–778, Oct. 2013.
[34] T. J. Hund, J. P. Kucera, N. F. Otani, and Y. Rudy, “Ionic chargeconservation and long-term steady state in the luo-rudy dynamic cellmodel,”Biophys. J., vol. 81, pp. 3324–3331, Dec. 2001.
[35] R. L. Rasmusson, J. W. Clark, W. R. Giles, K. Robinson, R. B. Clark,E. F. Shibata, and D. L. Campbell, “A mathematical model of electro-physiological activity in a bullfrog atrial cell,”Am. J. Physiol., vol. 259,pp. H370–389, Aug. 1990.
[36] L. Gr, F. J, W. Z, and N. S, “Transmembrane chloride currents inhuman atrial myocytes.,” Am J Physiol, vol. 270, pp. C500–7, Feb.1996.
[37] L. Yue, J. Feng, G. R. Li, and S. Nattel, “Transient outward and de-layed rectifier currents in canine atrium: properties and role of isola-tion methods,”Am. J. Physiol., vol. 270, pp. H2157–2168, June 1996.
[38] A. C. Zygmunt and W. R. Gibbons, “Properties of the calcium-activated chloride current in heart,” J. Gen. Physiol., vol. 99, pp. 391–414, Mar. 1992.
[39] T. O. of Health Economics, “Estimating the direct costs of atrial fibril-lation to the NHS in the constituent countries of the UK and at SHAlevel in england, 2008,” Nov. 2009.
[40] V. Fuster, L. E. Ryden, D. S. Cannom, H. J. Crijns, A. B. Curtis,K. A. Ellenbogen, J. L. Halperin, G. N. Kay, J.-Y. Le Huezey, J. E.Lowe, S. B. Olsson, E. N. Prystowsky, J. L. Tamargo, and L. S. Wann,“2011 ACCF/AHA/HRS focused updates incorporated into the AC-C/AHA/ESC 2006 guidelines for the management of patients with
BIBLIOGRAPHY 153
atrial fibrillation: a report of the american college of cardiology Foun-dation/American heart association task force on practice guidelinesdeveloped in partnership with the european society of cardiology andin collaboration with the european heart rhythm association and theheart rhythm society,” J. Am. Coll. Cardiol., vol. 57, pp. e101–198,Mar. 2011.
[41] S. Levy, “Classification system of atrial fibrillation,”Curr. Opin. Car-diol., vol. 15, pp. 54–57, Jan. 2000.
[42] S. Levy, A. J. Camm, S. Saksena, E. Aliot, G. Breithardt, H. J. G. M.Crijns, D. W. Davies, G. N. Kay, E. N. Prystowsky, R. Sutton, A. L.Waldo, D. G. Wyse, Working Group on Arrhythmias of EuropeanSociety of Cardiology, Working Group of Cardiac Pacing of Euro-pean Society of Cardiology, and North American Society of Pacingand Electrophysiology, “International consensus on nomenclature andclassification of atrial fibrillation: A collaborative project of the work-ing group on arrhythmias and the working group of cardiac pacing ofthe european society of cardiology and the north american society ofpacing and electrophysiology,” J. Cardiovasc. Electrophysiol., vol. 14,pp. 443–445, Apr. 2003.
[43] V. Markides and R. J. Schilling, “Atrial fibrillation: classification,pathophysiology, mechanisms and drug treatment,” Heart, vol. 89,pp. 939–943, Aug. 2003.
[44] M. Haıssaguerre, P. Jaıs, D. C. Shah, A. Takahashi, M. Hocini,G. Quiniou, S. Garrigue, A. Le Mouroux, P. Le Metayer, and J. Cle-menty, “Spontaneous initiation of atrial fibrillation by ectopic beatsoriginating in the pulmonary veins,” N. Engl. J. Med., vol. 339,pp. 659–666, Sept. 1998.
[45] J. Jalife, “Rotors and spiral waves in atrial fibrillation,” J. Cardiovasc.Electrophysiol., vol. 14, pp. 776–780, July 2003.
[46] J. Kalifa, J. Jalife, A. V. Zaitsev, S. Bagwe, M. Warren, J. Moreno,O. Berenfeld, and S. Nattel, “Intra-atrial pressure increases rate andorganization of waves emanating from the superior pulmonary veinsduring atrial fibrillation,” Circulation, vol. 108, pp. 668–671, Aug.2003.
[47] F. Atienza, J. Almendral, J. Moreno, R. Vaidyanathan, A. Talkachou,J. Kalifa, A. Arenal, J. P. Villacastın, E. G. Torrecilla, A. Sanchez,R. Ploutz-Snyder, J. Jalife, and O. Berenfeld, “Activation of inwardrectifier potassium channels accelerates atrial fibrillation in humans:evidence for a reentrant mechanism,” Circulation, vol. 114, pp. 2434–2442, Dec. 2006.
154 BIBLIOGRAPHY
[48] G. Moe, “On the multiple wavelet hypothesis of atrial fibrillation,”Arch Int Pharmacodyn Ther, vol. 140, pp. 183–188, 1962.
[49] S. Lee, J. Sahadevan, C. M. Khrestian, D. M. Durand, and A. L.Waldo, “High density mapping of atrial fibrillation during vagal nervestimulation in the canine heart: Restudying the moe hypothesis,”Journal of Cardiovascular Electrophysiology, vol. 24, no. 3, p. 328a335,2013.
[50] F. D. Murgatroyd and A. J. Camm, “Atrial arrhythmias,” Lancet,vol. 341, pp. 1317–1322, May 1993.
[51] M. C. Wijffels, C. J. Kirchhof, R. Dorland, and M. A. Allessie, “Atrialfibrillation begets atrial fibrillation. a study in awake chronically in-strumented goats,”Circulation, vol. 92, pp. 1954–1968, Oct. 1995.
[52] B. Burstein and S. Nattel, “Atrial fibrosis: mechanisms and clinicalrelevance in atrial fibrillation,” J. Am. Coll. Cardiol., vol. 51, pp. 802–809, Feb. 2008.
[53] M. R. Rosen, “Classification of antiarrhythmic drugs,” Card Electro-physiol Rev, vol. 4, pp. 181–185, Sept. 2000.
[54] E. M. Vaughan Williams, “A classification of antiarrhythmic actionsreassessed after a decade of new drugs,” J Clin Pharmacol, vol. 24,pp. 129–147, Apr. 1984.
[55] R. E. Klabunde, “Sodium-channel blockers (class i antiarrhythmics),http://www.cvpharmacology.com/antiarrhy/sodium-blockers.htm,”2011.
[56] P. Comtois, M. Sakabe, E. J. Vigmond, M. Munoz, A. Texier,A. Shiroshita-Takeshita, and S. Nattel, “Mechanisms of atrial fibrilla-tion termination by rapidly unbinding na+ channel blockers: insightsfrom mathematical models and experimental correlates,”Am. J. Phys-iol. Heart Circ. Physiol., vol. 295, pp. H1489–1504, Oct. 2008.
[57] C. M. Tracy, A. E. Epstein, D. Darbar, J. P. DiMarco, S. B. Dunbar,N. M. Estes III, T. B. Ferguson Jr, S. C. Hammill, P. E. Karasik,M. S. Link, J. E. Marine, M. H. Schoenfeld, A. J. Shanker, M. J.Silka, L. W. Stevenson, W. G. Stevenson, and P. D. Varosy, “2012ACCF/AHA/HRS focused update incorporated into the ACCF/A-HA/HRS 2008 guidelines for device-based therapy of cardiac rhythmabnormalities: A report of the american college of cardiology Foun-dation/American heart association task force on practice guidelinesand the heart rhythm society,” Journal of the American College ofCardiology, vol. 61, pp. e6–e75, Jan. 2013.
BIBLIOGRAPHY 155
[58] A. Ames and W. G. Stevenson, “Cardiology patient page. catheterablation of atrial fibrillation,”Circulation, vol. 113, pp. e666–668, Apr.2006.
[59] E. Grandi, F. S. Pasqualini, and D. M. Bers, “A novel computationalmodel of the human ventricular action potential and ca transient,” J.Mol. Cell. Cardiol., vol. 48, pp. 112–121, Jan. 2010.
[60] M. Wilhelms, H. Hettmann, M. M. Maleckar, J. T. Koivumaki, O. Dos-sel, and G. Seemann, “Benchmarking electrophysiological models ofhuman atrial myocytes,” Front Physiol, vol. 3, p. 487, 2012.
[61] M. Potse, Integrated Electrocardiographic Mapping: Combined Analy-sis of Multichannel Endocardial and Body Surface ECG Data. PhDthesis, Universiteit van Amsterdam [Host], 2001.
[62] J. Pitt-Francis, M. O. Bernabeu, J. Cooper, A. Garny, L. Momtahan,J. Osborne, P. Pathmanathan, B. Rodriguez, J. P. Whiteley, and D. J.Gavaghan, “Chaste: using agile programming techniques to developcomputational biology software,” Philos Trans A Math Phys Eng Sci,vol. 366, pp. 3111–3136, Sept. 2008.
[63] J. P. Keener and J. Sneyd, Mathematical Physiology. Springer, Jan.1998.
[64] J. P. Whiteley, “An efficient numerical technique for the solution ofthe monodomain and bidomain equations,” IEEE Trans Biomed Eng,vol. 53, pp. 2139–2147, Nov. 2006.
[65] G. Seemann, C. Hoper, F. B. Sachse, O. Dossel, A. V. Holden, andH. Zhang, “Heterogeneous three-dimensional anatomical and electro-physiological model of human atria,” Philos Trans A Math Phys EngSci, vol. 364, pp. 1465–1481, June 2006.
[66] L. Dang, N. Virag, Z. Ihara, V. Jacquemet, J. M. Vesin, J. Schlaepfer,P. Ruchat, and L. Kappenberger, “Evaluation of ablation patterns us-ing a biophysical model of atrial fibrillation,”Ann Biomed Eng, vol. 33,pp. 465–474, Apr. 2005.
[67] C. Tobon, C. A. Ruiz-Villa, E. Heidenreich, L. Romero, F. Hornero,and J. Saiz, “A three-dimensional human atrial model with fiber orien-tation. electrograms and arrhythmic activation patterns relationship,”PLoS ONE, vol. 8, no. 2, p. e50883, 2013.
[68] “COR web, http://cor.physiol.ox.ac.uk/.”
[69] “Cellml web, http://www.cellml.org/.”
156 BIBLIOGRAPHY
[70] “Chaste web, http://www.cs.ox.ac.uk/chaste/.”
[71] G. R. Mirams, C. J. Arthurs, M. O. Bernabeu, R. Bordas, J. Cooper,A. Corrias, Y. Davit, S.-J. Dunn, A. G. Fletcher, D. G. Harvey, M. E.Marsh, J. M. Osborne, P. Pathmanathan, J. Pitt-Francis, J. Southern,N. Zemzemi, and D. J. Gavaghan, “Chaste: an open source c++ li-brary for computational physiology and biology,”PLoS Comput. Biol.,vol. 9, no. 3, p. e1002970, 2013. PMID: 23516352.
[72] D. Abramson, M. O. Bernabeu, B. Bethwaite, K. Burrage, A. Cor-rias, C. Enticott, S. Garic, D. Gavaghan, T. Peachey, J. Pitt-Francis,E. Pueyo, B. Rodriguez, A. Sher, and J. Tan, “High-throughput car-diac science on the grid,”Philos Trans A Math Phys Eng Sci, vol. 368,pp. 3907–3923, Aug. 2010.
[73] E. A. Heidenreich, J. M. Ferrero, M. Doblare, and J. F. Rodrıguez,“Adaptive macro finite elements for the numerical solution of mon-odomain equations in cardiac electrophysiology,” Ann Biomed Eng,vol. 38, pp. 2331–2345, July 2010.
[74] D. Thain, T. Tannenbaum, and M. Livny, “Distributed computing inpractice: The condor experience: Research articles,” Concurr. Com-put. : Pract. Exper., vol. 17, p. 323a356, Feb. 2005.
[75] “EnSight gold, http://www.ceisoftware.com/ensight-gold/.”
[76] E. Pueyo, P. Smetana, P. Caminal, A. B. de Luna, M. Malik, andP. Laguna, “Characterization of QT interval adaptation to RR inter-val changes and its use as a risk-stratifier of arrhythmic mortality inamiodarone-treated survivors of acute myocardial infarction,” IEEETrans Biomed Eng, vol. 51, pp. 1511–1520, Sept. 2004.
[77] A. Shvilkin, J. Danilo, P, J. Wang, D. Burkhoff, E. P. Anyukhovsky,E. A. Sosunov, M. Hara, and M. R. Rosen, “Evolution and resolutionof long-term cardiac memory,” Circulation, vol. 97, pp. 1810–1817,May 1998.
[78] A. Grom, T. S. Faber, M. Brunner, C. Bode, and M. Zehender, “De-layed adaptation of ventricular repolarization after sudden changes inheart rate due to conversion of atrial fibrillation. a potential risk factorfor proarrhythmia?,” Europace, vol. 7, pp. 113–121, Mar. 2005.
[79] M. R. Franz, C. D. Swerdlow, L. B. Liem, and J. Schaefer, “Cyclelength dependence of human action potential duration in vivo. effectsof single extrastimuli, sudden sustained rate acceleration and deceler-ation, and different steady-state frequencies,” J. Clin. Invest., vol. 82,pp. 972–979, Sept. 1988.
BIBLIOGRAPHY 157
[80] E. Pueyo, Z. Husti, T. Hornyik, I. Baczko, P. Laguna, A. Varro, andB. Rodriguez, “Mechanisms of ventricular rate adaptation as a predic-tor of arrhythmic risk,”Am. J. Physiol. Heart Circ. Physiol., vol. 298,pp. H1577–1587, May 2010.
[81] M. Hara, A. Shvilkin, M. R. Rosen, J. Danilo, P, and P. A. Boyden,“Steady-state and nonsteady-state action potentials in fibrillating ca-nine atrium: abnormal rate adaptation and its possible mechanisms,”Cardiovasc. Res., vol. 42, pp. 455–469, May 1999.
[82] K. Hoshiyama, M. Hara, K. Yasui, H. Mitamura, F. Ohsuzu, I. Ko-dama, and S. Ogawa,“Altered action potential dynamics in electricallyremodeled canine atria: evidence for altered intracellular ca2+ han-dling,”Circ. J., vol. 70, pp. 1488–1496, Nov. 2006.
[83] P.-C. Zhang, A. Llach, X. Y. Sheng, L. Hove-Madsen, and G. F. Tib-bits, “Calcium handling in zebrafish ventricular myocytes,” Am. J.Physiol. Regul. Integr. Comp. Physiol., vol. 300, pp. R56–66, Jan.2011.
[84] M. R. Franz, “The electrical restitution curve revisited: steep orflat slope–which is better?,” J. Cardiovasc. Electrophysiol., vol. 14,pp. S140–147, Oct. 2003. PMID: 14760916.
[85] B.-S. Kim, Y.-H. Kim, G.-S. Hwang, H.-N. Pak, S. C. Lee, W. J.Shim, D. J. Oh, and Y. M. Ro, “Action potential duration restitutionkinetics in human atrial fibrillation,” J. Am. Coll. Cardiol., vol. 39,pp. 1329–1336, Apr. 2002. PMID: 11955851.
[86] S. M. Narayan, D. Kazi, D. E. Krummen, and W.-J. Rappel, “Repo-larization and activation restitution near human pulmonary veins andatrial fibrillation initiation: a mechanism for the initiation of atrial fib-rillation by premature beats,” J. Am. Coll. Cardiol., vol. 52, pp. 1222–1230, Oct. 2008. PMID: 18926325.
[87] L. H. Frame and M. B. Simson, “Oscillations of conduction, actionpotential duration, and refractoriness. a mechanism for spontaneoustermination of reentrant tachycardias,”Circulation, vol. 78, pp. 1277–1287, Nov. 1988. PMID: 3180384.
[88] P. C. Viswanathan and Y. Rudy, “Pause induced early afterdepolar-izations in the long QT syndrome: a simulation study,” Cardiovasc.Res., vol. 42, pp. 530–542, May 1999.
[89] L. M. Hondeghem, L. Carlsson, and G. Duker, “Instability and tri-angulation of the action potential predict serious proarrhythmia, butaction potential duration prolongation is antiarrhythmic,”Circulation,vol. 103, pp. 2004–2013, Apr. 2001.
158 BIBLIOGRAPHY
[90] H. Gelband, H. L. Bush, M. R. Rosen, R. J. Myerburg, and B. F. Hoff-man, “Electrophysiologic properties of isolated preparations of humanatrial myocardium,”Circ. Res., vol. 30, pp. 293–300, Mar. 1972.
[91] K. H. W. J. ten Tusscher and A. V. Panfilov, “Alternans and spiralbreakup in a human ventricular tissue model,” Am. J. Physiol. HeartCirc. Physiol., vol. 291, pp. H1088–1100, Sept. 2006.
[92] E. Carmeliet, “Intracellular ca(2+) concentration and rate adaptationof the cardiac action potential,” Cell Calcium, vol. 35, pp. 557–573,June 2004.
[93] T. Watano, Y. Harada, K. Harada, and N. Nishimura, “Effect ofNa+/Ca2+ exchange inhibitor, KB-R7943 on ouabain-induced ar-rhythmias in guinea-pigs,”Br. J. Pharmacol., vol. 127, pp. 1846–1850,Aug. 1999. PMID: 10482915 PMCID: PMC1566184.
[94] S. Miyamoto, B.-M. Zhu, K. Kamiya, Y. Nagasawa, and K. Hashimoto,“KB-R7943, a Na+/Ca2+ exchange inhibitor, does not suppress is-chemia/reperfusion arrhythmias nor digitalis arrhythmias in dogs,”Jpn. J. Pharmacol., vol. 90, pp. 229–235, Nov. 2002.
[95] C. Pott, X. Ren, D. X. Tran, M.-J. Yang, S. Henderson, M. C. Jordan,K. P. Roos, A. Garfinkel, K. D. Philipson, and J. I. Goldhaber, “Mech-anism of shortened action potential duration in na+-ca2+ exchangerknockout mice,”Am. J. Physiol., Cell Physiol., vol. 292, pp. C968–973,Feb. 2007.
[96] G. Klein, F. Schroder, D. Vogler, A. Schaefer, A. Haverich, B. Schieffer,T. Korte, and H. Drexler, “Increased open probability of single cardiacl-type calcium channels in patients with chronic atrial fibrillation. roleof phosphatase 2A,”Cardiovasc. Res., vol. 59, pp. 37–45, July 2003.
[97] R. F. Bosch, X. Zeng, J. B. Grammer, K. Popovic, C. Mewis, andV. Kuhlkamp, “Ionic mechanisms of electrical remodeling in humanatrial fibrillation,”Cardiovasc. Res., vol. 44, pp. 121–131, Oct. 1999.
[98] R. Laszlo, C. Eick, N. Rueb, S. Weretka, H.-J. Weig, J. Schreieck, andR. F. Bosch, “Inhibition of the renin-angiotensin system: effects ontachycardia-induced early electrical remodelling in rabbit atrium,” JRenin Angiotensin Aldosterone Syst, vol. 9, pp. 125–132, Sept. 2008.
[99] L. Yue, J. Feng, R. Gaspo, G. R. Li, Z. Wang, and S. Nattel, “Ionicremodeling underlying action potential changes in a canine model ofatrial fibrillation,”Circ. Res., vol. 81, pp. 512–525, Oct. 1997.
BIBLIOGRAPHY 159
[100] G. R. Li and S. Nattel, “Properties of human atrial ICa at physiolog-ical temperatures and relevance to action potential,”Am. J. Physiol.,vol. 272, pp. H227–235, Jan. 1997.
[101] E. Carmeliet, “Action potential duration, rate of stimulation, and in-tracellular sodium,” J. Cardiovasc. Electrophysiol., vol. 17 Suppl 1,pp. S2–S7, May 2006.
[102] J. Wang, R. H. Schwinger, K. Frank, J. Muller-Ehmsen, P. Martin-Vasallo, T. A. Pressley, A. Xiang, E. Erdmann, and A. A. Mc-Donough, “Regional expression of sodium pump subunits isoforms andna+-ca++ exchanger in the human heart,” J. Clin. Invest., vol. 98,pp. 1650–1658, Oct. 1996.
[103] D. M. Bers, W. H. Barry, and S. Despa, “Intracellular na+ regulationin cardiac myocytes,” Cardiovasc. Res., vol. 57, pp. 897–912, Mar.2003.
[104] M. R. Boyett and D. Fedida, “Changes in the electrical activity ofdog cardiac purkinje fibres at high heart rates,” J. Physiol. (Lond.),vol. 350, pp. 361–391, May 1984.
[105] A. J. Drake, M. I. Noble, V. Schouten, A. Seed, H. E. Ter Keurs,and B. Wohlfart, “Is action potential duration of the intact dog heartrelated to contractility or stimulus rate?,”J. Physiol. (Lond.), vol. 331,pp. 499–510, Oct. 1982.
[106] A. Nygren, L. J. Leon, and W. R. Giles, “Simulations of the hu-man atrial action potential,” Phil. Trans. R. Soc. Lond. A, vol. 359,pp. 1111–1125, June 2001.
[107] E. M. Cherry and S. J. Evans, “Properties of two human atrial cellmodels in tissue: restitution, memory, propagation, and reentry,” J.Theor. Biol., vol. 254, pp. 674–690, Oct. 2008.
[108] E. M. Cherry, H. M. Hastings, and S. J. Evans, “Dynamics of humanatrial cell models: restitution, memory, and intracellular calcium dy-namics in single cells,” Prog. Biophys. Mol. Biol., vol. 98, pp. 24–37,Sept. 2008.
[109] B. Trenor, L. Romero, J. Ferrero, Jose Maria, J. Saiz, G. Molto, andJ. M. Alonso, “Vulnerability to reentry in a regionally ischemic tissue:a simulation study,” Ann Biomed Eng, vol. 35, pp. 1756–1770, Oct.2007.
[110] J. Andrade, P. Khairy, D. Dobrev, and S. Nattel, “The clinical pro-file and pathophysiology of atrial fibrillation relationships among clin-
160 BIBLIOGRAPHY
ical features, epidemiology, and mechanisms,” Circulation Research,vol. 114, pp. 1453–1468, Apr. 2014.
[111] P. Jais and D. L. Packer, “Ablation vs. drug use for atrial fibrillation,”European Heart Journal Supplements, vol. 9, pp. G26–G34, Sept. 2007.
[112] P. A. Schweizer, R. Becker, H. A. Katus, and D. Thomas,“Dronedarone: current evidence for its safety and efficacy in the man-agement of atrial fibrillation,”Drug Des Devel Ther, vol. 5, pp. 27–39,2011.
[113] J. P. Piccini, V. Hasselblad, E. D. Peterson, J. B. Washam, R. M.Califf, and D. F. Kong, “Comparative efficacy of dronedarone andamiodarone for the maintenance of sinus rhythm in patients with atrialfibrillation,” J. Am. Coll. Cardiol., vol. 54, pp. 1089–1095, Sept. 2009.
[114] C. M. Ambrosi, C. M. Ripplinger, I. R. Efimov, and V. V. Fedorov,“Termination of sustained atrial flutter and fibrillation using low-voltage multiple-shock therapy,” Heart Rhythm, vol. 8, pp. 101–108,Jan. 2011.
[115] F. H. Fenton, S. Luther, E. M. Cherry, N. F. Otani, V. Krinsky,A. Pumir, E. Bodenschatz, and J. Gilmour, Robert F, “Terminationof atrial fibrillation using pulsed low-energy far-field stimulation,”Cir-culation, vol. 120, pp. 467–476, Aug. 2009.
[116] S. Luther, F. H. Fenton, B. G. Kornreich, A. Squires, P. Bittihn,D. Hornung, M. Zabel, J. Flanders, A. Gladuli, L. Campoy, E. M.Cherry, G. Luther, G. Hasenfuss, V. I. Krinsky, A. Pumir, J. Gilmour,Robert F, and E. Bodenschatz, “Low-energy control of electrical tur-bulence in the heart,”Nature, vol. 475, pp. 235–239, July 2011.
[117] S. M. Schumacher and J. R. Martens, “Ion channel trafficking: anew therapeutic horizon for atrial fibrillation,” Heart Rhythm, vol. 7,pp. 1309–1315, Sept. 2010.
[118] B. Rodriguez, K. Burrage, D. Gavaghan, V. Grau, P. Kohl, and D. No-ble, “The systems biology approach to drug development: applica-tion to toxicity assessment of cardiac drugs,”Clin. Pharmacol. Ther.,vol. 88, pp. 130–134, July 2010.
[119] M. Courtemanche, R. J. Ramirez, and S. Nattel, “Ionic targets for drugtherapy and atrial fibrillation-induced electrical remodeling: insightsfrom a mathematical model,” Cardiovasc. Res., vol. 42, pp. 477–489,May 1999.
BIBLIOGRAPHY 161
[120] S. V. Pandit, O. Berenfeld, J. M. B. Anumonwo, R. M. Zaritski,J. Kneller, S. Nattel, and J. Jalife, “Ionic determinants of functionalreentry in a 2-d model of human atrial cells during simulated chronicatrial fibrillation,”Biophys. J., vol. 88, pp. 3806–3821, June 2005.
[121] D. R. Van Wagoner, A. L. Pond, M. Lamorgese, S. S. Rossie, P. M. Mc-Carthy, and J. M. Nerbonne, “Atrial l-type ca2+ currents and humanatrial fibrillation,”Circ. Res., vol. 85, pp. 428–436, Sept. 1999.
[122] D. R. Van Wagoner, A. L. Pond, P. M. McCarthy, J. S. Trimmer, andJ. M. Nerbonne, “Outward k+ current densities and kv1.5 expressionare reduced in chronic human atrial fibrillation,” Circ. Res., vol. 80,pp. 772–781, June 1997.
[123] A. Burashnikov, J. M. Di Diego, A. C. Zygmunt, L. Belardinelli, andC. Antzelevitch, “Atrium-selective sodium channel block as a strat-egy for suppression of atrial fibrillation: differences in sodium channelinactivation between atria and ventricles and the role of ranolazine,”Circulation, vol. 116, pp. 1449–1457, Sept. 2007.
[124] S. Nattel and B. N. Singh, “Evolution, mechanisms, and classificationof antiarrhythmic drugs: focus on class III actions,” Am. J. Cardiol.,vol. 84, pp. 11R–19R, Nov. 1999. PMID: 10568655.
[125] J. R. Ehrlich and S. Nattel, “Novel approaches for pharmacologicalmanagement of atrial fibrillation,” Drugs, vol. 69, no. 7, pp. 757–774,2009.
[126] F. Forini, G. Nicolini, S. Balzan, G. M. Ratto, B. Murzi, V. Vanini, andG. Iervasi, “Amiodarone inhibits the 3,5,3’-triiodothyronine-dependentincrease of sodium/potassium adenosine triphosphatase activity andconcentration in human atrial myocardial tissue,” Thyroid, vol. 14,pp. 493–499, July 2004.
[127] D. F. Gray, A. S. Mihailidou, P. S. Hansen, K. A. Buhagiar, N. L.Bewick, H. H. Rasmussen, and D. W. Whalley, “Amiodarone inhibitsthe na(+)-k+ pump in rabbit cardiac myocytes after acute and chronictreatment,” J. Pharmacol. Exp. Ther., vol. 284, pp. 75–82, Jan. 1998.
[128] S. Nattel, D. Li, and L. Yue, “Basic mechanisms of atrial fibrillation–very new insights into very old ideas,” Annu. Rev. Physiol., vol. 62,pp. 51–77, 2000.
[129] F. Xie, Z. Qu, A. Garfinkel, and J. N. Weiss, “Electrical refractoryperiod restitution and spiral wave reentry in simulated cardiac tissue,”Am. J. Physiol. Heart Circ. Physiol., vol. 283, pp. H448–460, July2002.
162 BIBLIOGRAPHY
[130] B. Rodriguez, B. Tice, R. Blake, D. Gavaghan, and N. Trayanova,“Vulnerability to electric shocks in the regionally-ischemic ventricles,”Conf Proc IEEE Eng Med Biol Soc, vol. 1, pp. 2280–2283, 2006.
[131] E. M. Cherry and F. H. Fenton,“Effects of boundaries and geometry onthe spatial distribution of action potential duration in cardiac tissue,”J. Theor. Biol., vol. 285, pp. 164–176, Sept. 2011.
[132] F. Fenton and A. Karma, “Vortex dynamics in three-dimensional con-tinuous myocardium with fiber rotation: Filament instability and fib-rillation,”Chaos, vol. 8, pp. 20–47, Mar. 1998.
[133] J. P. Keener, “An eikonal-curvature equation for action potential prop-agation in myocardium,”J Math Biol, vol. 29, no. 7, pp. 629–651, 1991.
[134] D. W. Frazier, P. D. Wolf, J. M. Wharton, A. S. Tang, W. M. Smith,and R. E. Ideker, “Stimulus-induced critical point. mechanism for elec-trical initiation of reentry in normal canine myocardium,” J. Clin. In-vest., vol. 83, pp. 1039–1052, Mar. 1989.
[135] A. T. Winfree, “Various ways to make phase singularities by electricshock,”J. Cardiovasc. Electrophysiol., vol. 11, pp. 286–289, Mar. 2000.
[136] Z. J. Engelman, M. L. Trew, and B. H. Smaill, “Structural heterogene-ity alone is a sufficient substrate for dynamic instability and alteredrestitution,” Circ Arrhythm Electrophysiol, vol. 3, pp. 195–203, Apr.2010.
[137] L. Hou, M. Deo, P. Furspan, S. V. Pandit, S. Mironov, D. S. Auerbach,Q. Gong, Z. Zhou, O. Berenfeld, and J. Jalife, “A major role for HERGin determining frequency of reentry in neonatal rat ventricular myocytemonolayer,”Circ. Res., vol. 107, pp. 1503–1511, Dec. 2010.
[138] A. Baher, Z. Qu, A. Hayatdavoudi, S. T. Lamp, M.-J. Yang, F. Xie,S. Turner, A. Garfinkel, and J. N. Weiss, “Short-term cardiac memoryand mother rotor fibrillation,” Am. J. Physiol. Heart Circ. Physiol.,vol. 292, pp. H180–189, Jan. 2007.
[139] K. Gima and Y. Rudy, “Ionic current basis of electrocardiographicwaveforms: a model study,” Circ. Res., vol. 90, pp. 889–896, May2002.
[140] R. Plonsey and Y. Rudy, “Electrocardiogram sources in a 2-dimensional anisotropic activation model,” Med Biol Eng Comput,vol. 18, pp. 87–94, Jan. 1980.
BIBLIOGRAPHY 163
[141] G. W. Botteron and J. M. Smith, “A technique for measurement ofthe extent of spatial organization of atrial activation during atrial fib-rillation in the intact human heart,” IEEE Trans Biomed Eng, vol. 42,pp. 579–586, June 1995.
[142] L. Romero, E. Pueyo, M. Fink, and B. Rodriguez, “Impact of ioniccurrent variability on human ventricular cellular electrophysiology,”Am. J. Physiol. Heart Circ. Physiol., vol. 297, pp. H1436–1445, Oct.2009.
[143] M. Boutjdir, J. Y. Le Heuzey, T. Lavergne, S. Chauvaud, L. Guize,A. Carpentier, and P. Peronneau, “Inhomogeneity of cellular refrac-toriness in human atrium: factor of arrhythmia?,” Pacing Clin Elec-trophysiol, vol. 9, pp. 1095–1100, Nov. 1986.
[144] A. J. Workman, K. A. Kane, and A. C. Rankin, “Cellular bases forhuman atrial fibrillation,”Heart Rhythm, vol. 5, pp. S1–6, June 2008.
[145] A. J. Workman, K. A. Kane, and A. C. Rankin, “The contribution ofionic currents to changes in refractoriness of human atrial myocytesassociated with chronic atrial fibrillation,” Cardiovasc. Res., vol. 52,pp. 226–235, Nov. 2001.
[146] K. Miyamoto, T. Tsuchiya, S. Narita, T. Yamaguchi, Y. Nagamoto,S.-i. Ando, K. Hayashida, Y. Tanioka, and N. Takahashi, “Bipolarelectrogram amplitudes in the left atrium are related to local con-duction velocity in patients with atrial fibrillation,”Europace, vol. 11,pp. 1597–1605, Dec. 2009.
[147] D. Dobrev, E. Graf, E. Wettwer, H. M. Himmel, O. Hala, C. Doerfel,T. Christ, S. Schuler, and U. Ravens, “Molecular basis of downregula-tion of g-protein-coupled inward rectifying k(+) current (i(K,ACh) inchronic human atrial fibrillation: decrease in GIRK4 mRNA correlateswith reduced i(K,ACh) and muscarinic receptor-mediated shorteningof action potentials,”Circulation, vol. 104, pp. 2551–2557, Nov. 2001.
[148] S. Kharche, C. J. Garratt, M. R. Boyett, S. Inada, A. V. Holden, J. C.Hancox, and H. Zhang, “Atrial proarrhythmia due to increased inwardrectifier current (i(k1)) arising from KCNJ2 mutation–a simulationstudy,” Prog. Biophys. Mol. Biol., vol. 98, pp. 186–197, Nov. 2008.PMID: 19041665.
[149] H. H. Rasmussen, G. T. Okita, R. S. Hartz, and R. E. ten Eick, “In-hibition of electrogenic na(+)-pumping in isolated atrial tissue frompatients treated with digoxin,” J. Pharmacol. Exp. Ther., vol. 252,pp. 60–64, Jan. 1990.
164 BIBLIOGRAPHY
[150] J. Kneller, J. Kalifa, R. Zou, A. V. Zaitsev, M. Warren, O. Berenfeld,E. J. Vigmond, L. J. Leon, S. Nattel, and J. Jalife, “Mechanisms ofatrial fibrillation termination by pure sodium channel blockade in anionically-realistic mathematical model,”Circ. Res., vol. 96, pp. e35–47,Mar. 2005.
[151] D. Horiuchi, A. Iwasa, K. Sasaki, S. Owada, M. Kimura, S. Sasaki, andK. Okumura, “Effect of pilsicainide on dominant frequency in the rightand left atria and pulmonary veins during atrial fibrillation: associa-tion with its atrial fibrillation terminating effect,”Eur. J. Pharmacol.,vol. 608, pp. 54–61, Apr. 2009.
[152] A. J. Workman, K. A. Kane, and A. C. Rankin, “Characterisation ofthe na, k pump current in atrial cells from patients with and withoutchronic atrial fibrillation,”Cardiovasc. Res., vol. 59, pp. 593–602, Sept.2003.
[153] G. M. Faber and Y. Rudy, “Action potential and contractility changesin [na(+)](i) overloaded cardiac myocytes: a simulation study,” Bio-phys. J., vol. 78, pp. 2392–2404, May 2000.
[154] A. J. Levi, “The effect of strophanthidin on action potential, calciumcurrent and contraction in isolated guinea-pig ventricular myocytes,”J. Physiol. (Lond.), vol. 443, pp. 1–23, Nov. 1991.
[155] A. Harada, K. Sasaki, T. Fukushima, M. Ikeshita, T. Asano, S. Ya-mauchi, S. Tanaka, and T. Shoji, “Atrial activation during chronicatrial fibrillation in patients with isolated mitral valve disease,” Ann.Thorac. Surg., vol. 61, pp. 104–111; discussion 111–112, Jan. 1996.
[156] S. Nattel, “New ideas about atrial fibrillation 50 years on,” Nature,vol. 415, pp. 219–226, Jan. 2002.
[157] K. Derakhchan, C. Villemaire, M. Talajic, and S. Nattel, “The classIII antiarrhythmic drugs dofetilide and sotalol prevent AF inductionby atrial premature complexes at doses that fail to terminate AF,”Cardiovasc. Res., vol. 50, pp. 75–84, Apr. 2001.
[158] A. A. McDonough, J. B. Velotta, R. H. G. Schwinger, K. D. Philipson,and R. A. Farley, “The cardiac sodium pump: structure and function,”Basic Res. Cardiol., vol. 97 Suppl 1, pp. I19–24, 2002.
[159] J. Carro, J. F. Rodrıguez, P. Laguna, and E. Pueyo, “A human ven-tricular cell model for investigation of cardiac arrhythmias under hy-perkalaemic conditions,”Philos Trans A Math Phys Eng Sci, vol. 369,pp. 4205–4232, Nov. 2011.
BIBLIOGRAPHY 165
[160] A. Corrias, W. Giles, and B. Rodriguez, “Ionic mechanisms of elec-trophysiological properties and repolarization abnormalities in rab-bit purkinje fibers,” Am. J. Physiol. Heart Circ. Physiol., vol. 300,pp. H1806–1813, May 2011.
[161] L. Romero, B. Carbonell, B. Trenor, B. Rodrıguez, J. Saiz, and J. M.Ferrero, “Systematic characterization of the ionic basis of rabbit cel-lular electrophysiology using two ventricular models,” Prog. Biophys.Mol. Biol., vol. 107, pp. 60–73, Oct. 2011.
[162] Y. Blaauw, H. Gogelein, R. G. Tieleman, A. van Hunnik, U. Schotten,and M. A. Allessie, “"Early" class III drugs for the treatment of atrialfibrillation: efficacy and atrial selectivity of AVE0118 in remodeledatria of the goat,”Circulation, vol. 110, pp. 1717–1724, Sept. 2004.
[163] R. G. Tieleman, C. De Langen, I. C. Van Gelder, P. J. de Kam,J. Grandjean, K. J. Bel, M. C. Wijffels, M. A. Allessie, and H. J.Crijns, “Verapamil reduces tachycardia-induced electrical remodelingof the atria,”Circulation, vol. 95, pp. 1945–1953, Apr. 1997.
[164] A. Bueno-Orovio, E. M. Cherry, and F. H. Fenton, “Minimal model forhuman ventricular action potentials in tissue,”J. Theor. Biol., vol. 253,pp. 544–560, Aug. 2008.
[165] Z. Syed, E. Vigmond, and L. Leon, “Automated modeling of cardiacelectrical activity,” in Proceedings of the 25th Annual InternationalConference of the IEEE Engineering in Medicine and Biology Society,2003, vol. 1, pp. 55–58 Vol.1, Sept. 2003.
[166] C. M. Ambrosi, K. A. Yamada, J. M. Nerbonne, and I. R. Efimov,“Gender differences in electrophysiological gene expression in failingand non-failing human hearts,” PLoS ONE, vol. 8, no. 1, p. e54635,2013. PMID: 23355885 PMCID: PMC3552854.
[167] D. Jeyaraj, S. M. Haldar, X. Wan, M. D. McCauley, J. A. Ripperger,K. Hu, Y. Lu, B. L. Eapen, N. Sharma, E. Ficker, M. J. Cutler,J. Gulick, A. Sanbe, J. Robbins, S. Demolombe, R. V. Kondratov,S. A. Shea, U. Albrecht, X. H. T. Wehrens, D. S. Rosenbaum, andM. K. Jain, “Circadian rhythms govern cardiac repolarization andarrhythmogenesis,” Nature, vol. 483, pp. 96–99, Mar. 2012. PMID:22367544 PMCID: PMC3297978.
[168] L. Xiao, J. Xiao, X. Luo, H. Lin, Z. Wang, and S. Nattel, “Feedbackremodeling of cardiac potassium current expression: a novel potentialmechanism for control of repolarization reserve,”Circulation, vol. 118,pp. 983–992, Sept. 2008. PMID: 18711016.
166 BIBLIOGRAPHY
[169] E. Wettwer, T. Christ, S. Endig, N. Rozmaritsa, K. Matschke,J. J. Lynch, M. Pourrier, J. K. Gibson, D. Fedida, M. Knaut, andU. Ravens, “The new antiarrhythmic drug vernakalant: ex vivo studyof human atrial tissue from sinus rhythm and chronic atrial fibrilla-tion,”Cardiovasc. Res., vol. 98, pp. 145–154, Apr. 2013.
[170] E. Wettwer, O. Hala, T. Christ, J. F. Heubach, D. Dobrev, M. Knaut,A. Varro, and U. Ravens, “Role of IKur in controlling action potentialshape and contractility in the human atrium: influence of chronic atrialfibrillation,”Circulation, vol. 110, pp. 2299–2306, Oct. 2004.
[171] O. J. Britton, A. Bueno-Orovio, K. Van Ammel, H. R. Lu, R. Towart,D. J. Gallacher, and B. Rodriguez, “Experimentally calibrated popula-tion of models predicts and explains intersubject variability in cardiaccellular electrophysiology,” Proc. Natl. Acad. Sci. U.S.A., vol. 110,pp. E2098–2105, June 2013.
[172] E. Pueyo, A. Corrias, L. Virag, N. Jost, T. Szel, A. Varro, N. Szen-tandrassy, P. P. Nanasi, K. Burrage, and B. Rodrıguez, “A multiscaleinvestigation of repolarization variability and its role in cardiac ar-rhythmogenesis,”Biophys. J., vol. 101, pp. 2892–2902, Dec. 2011.
[173] A. X. Sarkar, D. J. Christini, and E. A. Sobie, “Exploiting mathe-matical models to illuminate electrophysiological variability betweenindividuals,” J. Physiol. (Lond.), vol. 590, pp. 2555–2567, June 2012.
[174] E. A. Sobie and A. X. Sarkar, “Regression methods for parametersensitivity analysis: applications to cardiac arrhythmia mechanisms,”Conf Proc IEEE Eng Med Biol Soc, vol. 2011, pp. 4657–4660, 2011.
[175] J. Walmsley, J. F. Rodriguez, G. R. Mirams, K. Burrage, I. R. Efimov,and B. Rodriguez, “mRNA expression levels in failing human heartspredict cellular electrophysiological remodeling: a population-basedsimulation study,” PLoS ONE, vol. 8, no. 2, p. e56359, 2013.
[176] S. Marino, I. B. Hogue, C. J. Ray, and D. E. Kirschner, “A methodol-ogy for performing global uncertainty and sensitivity analysis in sys-tems biology,” J. Theor. Biol., vol. 254, pp. 178–196, Sept. 2008.
[177] Z. Syed, E. Vigmond, S. Nattel, and L. J. Leon, “Atrial cell actionpotential parameter fitting using genetic algorithms,” Med Biol EngComput, vol. 43, pp. 561–571, Sept. 2005.
[178] Z. Wang, B. Fermini, and S. Nattel, “Sustained depolarization-inducedoutward current in human atrial myocytes. evidence for a novel delayedrectifier k+ current similar to kv1.5 cloned channel currents,” Circ.Res., vol. 73, pp. 1061–1076, Dec. 1993.
BIBLIOGRAPHY 167
[179] M. E. Dıaz, S. C. O’Neill, and D. A. Eisner, “Sarcoplasmic reticulumcalcium content fluctuation is the key to cardiac alternans,”Circ. Res.,vol. 94, pp. 650–656, Mar. 2004.
[180] M. R. Franz, S. M. Jamal, and S. M. Narayan, “The role of actionpotential alternans in the initiation of atrial fibrillation in humans: areview and future directions,”Europace, vol. 14 Suppl 5, pp. v58–v64,Nov. 2012.
[181] M. L. Koller, M. L. Riccio, and J. Gilmour, R F, “Dynamic restitutionof action potential duration during electrical alternans and ventricularfibrillation,”Am. J. Physiol., vol. 275, pp. H1635–1642, Nov. 1998.
[182] E. J. Pruvot, R. P. Katra, D. S. Rosenbaum, and K. R. Laurita, “Roleof calcium cycling versus restitution in the mechanism of repolarizationalternans,”Circ. Res., vol. 94, pp. 1083–1090, Apr. 2004.
[183] M. W. Krueger, G. Seemann, K. Rhode, D. U. J. Keller, C. Schilling,A. Arujuna, J. Gill, M. D. O’Neill, R. Razavi, and O. Dossel, “Person-alization of atrial anatomy and electrophysiology as a basis for clinicalmodeling of radio-frequency ablation of atrial fibrillation,” IEEE TransMed Imaging, vol. 32, pp. 73–84, Jan. 2013.
[184] J. Feng, L. Yue, Z. Wang, and S. Nattel, “Ionic mechanisms of regionalaction potential heterogeneity in the canine right atrium,”Circ. Res.,vol. 83, pp. 541–551, Sept. 1998.
[185] L. Firek and W. R. Giles, “Outward currents underlying repolarizationin human atrial myocytes,” Cardiovasc. Res., vol. 30, pp. 31–38, July1995.
[186] U. Ravens, C. Poulet, E. Wettwer, and M. Knaut, “Atrial selectivityof antiarrhythmic drugs,” J. Physiol. (Lond.), June 2013.
[187] P. Milberg, C. Pott, G. Frommeyer, M. Fink, M. Ruhe, T. Matsuda,A. Baba, R. Klocke, T. H. Quang, S. Nikol, J. Stypmann, N. Osada,F. U. Muller, G. Breithardt, D. Noble, and L. Eckardt, “Acute inhi-bition of the na(+)/Ca(2+) exchanger reduces proarrhythmia in anexperimental model of chronic heart failure,” Heart Rhythm, vol. 9,pp. 570–578, Apr. 2012.
[188] S. Nattel, B. Burstein, and D. Dobrev, “Atrial remodeling and atrialfibrillation mechanisms and implications,”Circ Arrhythm Electrophys-iol, vol. 1, pp. 62–73, Apr. 2008.
[189] F. Atienza, J. Almendral, J. Jalife, S. Zlochiver, R. Ploutz-Snyder,E. G. Torrecilla, A. Arenal, J. Kalifa, F. Fernandez-Aviles, and
168 BIBLIOGRAPHY
O. Berenfeld, “Real-time dominant frequency mapping and ablationof dominant frequency sites in atrial fibrillation with left-to-right fre-quency gradients predicts long-term maintenance of sinus rhythm,”Heart Rhythm, vol. 6, pp. 33–40, Jan. 2009.
[190] M. Mansour, R. Mandapati, O. Berenfeld, J. Chen, F. H. Samie, andJ. Jalife, “Left-to-right gradient of atrial frequencies during acute atrialfibrillation in the isolated sheep heart,”Circulation, vol. 103, pp. 2631–2636, May 2001.
[191] F. Sarmast, A. Kolli, A. Zaitsev, K. Parisian, A. S. Dhamoon, P. K.Guha, M. Warren, J. M. B. Anumonwo, S. M. Taffet, O. Berenfeld, andJ. Jalife, “Cholinergic atrial fibrillation: I(K,ACh) gradients determineunequal left/right atrial frequencies and rotor dynamics,”Cardiovasc.Res., vol. 59, pp. 863–873, Oct. 2003.
[192] N. Voigt, A. Trausch, M. Knaut, K. Matschke, A. Varro, D. R.Van Wagoner, S. Nattel, U. Ravens, and D. Dobrev, “Left-to-rightatrial inward rectifier potassium current gradients in patients withparoxysmal versus chronic atrial fibrillation,” Circ Arrhythm Electro-physiol, vol. 3, pp. 472–480, Oct. 2010.
[193] O. Berenfeld and J. Jalife, “Complex fractionated atrial electrograms:is this the beast to tame in atrial fibrillation?,” Circ Arrhythm Elec-trophysiol, vol. 4, pp. 426–428, Aug. 2011.
[194] K. Nademanee and N. Oketani, “The role of complex fractionatedatrial electrograms in atrial fibrillation ablation moving to the beatof a different drum,” J. Am. Coll. Cardiol., vol. 53, pp. 790–791, Mar.2009.
[195] S. M. Narayan, M. Wright, N. Derval, A. Jadidi, A. Forclaz, I. Nault,S. Miyazaki, F. Sacher, P. Bordachar, J. Clementy, P. Jaıs, M. Haıs-saguerre, and M. Hocini, “Classifying fractionated electrograms in hu-man atrial fibrillation using monophasic action potentials and activa-tion mapping: evidence for localized drivers, rate acceleration, andnonlocal signal etiologies,” Heart Rhythm, vol. 8, pp. 244–253, Feb.2011.
[196] M. W. Krueger, V. Schmidt, C. Tobon, F. M. Weber, C. Lorenz,D. U. J. Keller, H. Barschdorf, M. Burdumy, P. Neher, G. Plank,K. Rhode, G. Seemann, D. Sanchez-Quintana, J. Saiz, R. Razavi, andO. Dossel, “Modeling atrial fiber orientation in patient-specific geome-tries: A semi-automatic rule-based approach,” in Functional Imagingand Modeling of the Heart (D. N. Metaxas and L. Axel, eds.), no. 6666in Lecture Notes in Computer Science, pp. 223–232, Springer BerlinHeidelberg, Jan. 2011.
BIBLIOGRAPHY 169
[197] C. Tobon Zuluaga,Modelizacion y evaluacion de factores que favorecenlas arritmias auriculares y su tratamiento mediante tecnicas quirurgi-cas. Estudio de simulacion. PhD thesis, June 2010.
[198] t. Everett, T H, L. C. Kok, R. H. Vaughn, J. R. Moorman, and D. E.Haines, “Frequency domain algorithm for quantifying atrial fibrillationorganization to increase defibrillation efficacy,” IEEE Trans BiomedEng, vol. 48, pp. 969–978, Sept. 2001.
[199] L. Faes and F. Ravelli, “A morphology-based approach to the eval-uation of atrial fibrillation organization,” IEEE Eng Med Biol Mag,vol. 26, pp. 59–67, Aug. 2007.