Embed Size (px)
Citation preview

MULTIRESOLUTION LANDSAT TM AND AWIFS SENSOR ASSESSMENT FOR CROP AREA ESTIMATION IN NEBRASKA
Claire Boryan, Remote Sensing Analyst
Mike Craig, Senior Remote Sensing Analyst USDA, National Agricultural Statistics Service
3251 Old Lee Highway, Suite 305, Fairfax, Virginia 22030 [email protected]
[email protected] ABSTRACT
This paper describes a multiresolution Landsat TM and AWiFS sensor assessment conducted by the USDA's National Agricultural Statistics Service (NASS). NASS’ Remote Sensing Acreage Estimation Program has used Landsat TM and ETM+ data successfully for years for crop acreage estimation at the state and county levels. However, NASS is currently faced with a reduction in the supply of available imagery due to a malfunction in the Landsat 7 sensor. Consequently, NASS has begun evaluating alternative sources of imagery. The goal of this investigation was to assess the suitability of AWiFS data for crop acreage estimation. Three crop land classifications of Nebraska (2004) were produced including a multitemporal TM classification, a unitemporal TM classification and a unitemporal AWiFS classification. Once the classifications were completed, classifier statistics for corn, soybean and overall crops were evaluated for accuracy. Strata regression (r-square) statistics were derived by crop type for all classifications. State level estimates for corn and soybeans using ground survey data alone were compared to estimates from the remote sensing classifications. The AWiFS classification results were less accurate than the results from either Landsat classification. Reductions in classification accuracy can be attributed to the moderate spatial resolution (56 meters) and the reduced number of spectral bands of AWiFS relative to the TM sensor. However, it is anticipated that the increased temporal frequency of AWiFS (5 day) versus the TM sensor (16 day) should improve classification accuracy. Furthermore, AWiFS data appears acceptable for acreage estimation over large, spectrally homogenous, crop areas.
INTRODUCTION
The National Agricultural Statistics Service (NASS) of the U.S. Department of Agriculture has used digital multi-spectral satellite imagery since the 1970's to aid in the acreage estimation of large area crops in major producing states. Early research and later operational NASS remote sensing programs used imagery from the Landsat multi-spectral scanner (MSS) instruments until the late 1980's, research on the Landsat 5 Thematic Mapper (TM) started in 1986 and it was adopted for operational acreage estimation use in 1991. By April of 1999, Landsat 5 (TM) and Landsat 7 Enhanced Thematic Mapper Plus (ETM+) data were used in combination to produce major crops estimates at the state and county levels plus digital Crop Land Data Layer (CDL) GIS products for six major crop producing states. An advantage of using both types of Landsat data was that the polar orbits of the two Landsat satellites were controlled to give eight-day coverage to any area from one of the sensors. The eight day repeat coverage is very important to any vegetation related remote sensing analysis, and is particularly important for real time, within season crop acreage and or yield estimation. Crop types are distinguishable from each other for only a short period during the crop season, and thus have a very limited number of chances to be covered by cloud-free satellite imagery.
Unfortunately, on May 31, 2003, the Landsat 7 ETM+ sensor experienced an anomaly in its scan line detector. The problem is considered permanent and NASS has not used the ETM+ data since the malfunction took place, but is currently evaluating an SLC-off product produced by the U.S. Geological Survey (USGS). Faced with a 50% reduction in the supply of available imagery, NASS has begun looking to alternative sources of data to ensure the continuation of the Remote Sensing Acreage Estimation Program (Craig, 2001b). Numerous documents about the history of the Remote Sensing Acreage Estimation Program are included in the Reference section.
The Indian Space Research Organization launched RESOURCESAT-1 in October of 2003, as the latest of the Indian Remote Sensing series of satellites. The payload of RESOURCESAT-1includes three sensors: the Linear Imaging Self Scanner (LISS) IV, LISS-III and the Advanced Wide Field Sensor (AWiFS). Although AWiFS has a
Pecora 16 “Global Priorities in Land Remote Sensing” October 23-27, 2005 * Sioux Falls, South Dakota

moderate spatial resolution (56 meters), the sensor appears promising as a source of supplemental imagery due to its large swath width, spectral characteristics and 5-day revisit capability. A number of investigations have been conducted evaluating the effectiveness of AWiFS data for crop acreage estimation. A study conducted over a site in Kota, India, demonstrated improved classification accuracy with multitemporal AWiFS when compared with multitemporal WiFS data (NNRMS, 2004c). Another investigation evaluated AWiFS data for acreage estimation for cotton crops in 15 major cotton-growing districts and Rabi sorghum in 6 districts in Maharashtra, India. The study demonstrated the usefulness of AWiFS data for crop discrimination and acreage estimation. Another study revealed that AWiFS 10 bit data improved separability of overlapping classes such as rice and forest. AWiFS effectively discriminated between different crops grown in multiple cropped areas (NNRMS, 2004b). To evaluate the AWiFS data for crop acreage estimation, a multiresolution Landsat TM and AWiFS sensor assessment was conducted in Nebraska. This paper describes the results of this investigation.
IMAGE PROCESSING AND ESTIMATION METHODOLOGY
To evaluate the effectiveness of the AWiFS data for crop acreage estimation, three separate crop land classifications of Nebraska (2004) were performed. Different data, but identical methodologies, were employed. The first was a multitemporal (two-date) crop land classification using Landsat 5 TM data. The results of this multitemporal classification provided a “best case” basis for comparison. Multitemporal data are considered optimal for the separation and subsequent classification of crop covers. (Maxwell and Hoffer, 1996). Second was a unitemporal crop land classification using AWiFS data. AWiFS data acquired during August of 2004 were obtained through a cooperative agreement with the USDA Foreign Agriculture Service (Bethel and Doorn, 1998). Although the Advanced Wide Field Sensor acquired data every 5 days, only single date imagery could be used due to the limited acquisition period (1 month) and persistent cloud cover in the region. A third classification was conducted using unitemporal Landsat TM data (late summer dates). Sensor Characteristics
Table 1 describes the characteristics of the Landsat 5 TM sensor and AWiFS. Although AWiFS has a reduced spatial resolution (56 meters at nadir) relative to Landsat TM (30 meters), it was expected that the 56-meter resolution might be sufficient for crop acreage estimation in regions with large fields such as the Mid West, the Delta, and the Northern Great Plains. In addition, the large 370 km (per camera) and 700 km (combined) swath width provides the opportunity to perform classifications with same date imagery over significantly larger geographic areas than was possible with Landsat TM alone (185 km swath). Furthermore, AWiFS Bands 2-5, which are the most significant for vegetation discrimination, correspond closely to Landsat Bands 2-5 (Jensen, 2000).
Table 1. Sensor Specifications
Sensor Characteristics Landsat 5 (TM) AWiFS
In Field of View (IFOV) 30 meters (Bands 1-5) 120 meters (Band 6)
56 meters ( at nadir) 70 meters (at field edges)
Spectral Bands Band 1: 0.45 - 0.52 (um) Band 2: 0.52 - 0.60 (um) Band 3: 0.63 - 0.69 (um) Band 4: 0.76 - 0.90 (um) Band 5: 1.55 - 1.75 (um)
Band 6: 10.40 - 12.5 (um) Band 7: 2.07-2.35 (um)
Band 2: 0.52 - 0.59 (um) Band 3: 0.62 - 0.68 (um) Band 4: 0.77 - 0.86 (um) Band 5: 1.55 - 1.70 (um)
Swath Width 185 km 370 km (for each camera) 740 km (combined)
Quantization 8 bits 10 bits
Repeat Cycle 16 days 5 days
Pecora 16 “Global Priorities in Land Remote Sensing” October 23-27, 2005 * Sioux Falls, South Dakota

Analysis Districts The first step in performing the multitemporal TM crop land classification was the selection of optimal date
Landsat 5 TM imagery, taking into consideration the phenological cycles of the crop covers and the availability of cloud free imagery. The selection of imagery for the unitemporal classifications was considerably more limited. The selection of AWiFS imagery was restricted by the brief (August 2004) period of data acquisition. The percentage of cloud cover in the AWiFS scenes was the primary consideration in the selection of AWiFS data. To match the AWiFS dates as closely as possible, only late summer TM dates were used in the TM unitemporal classification. After selecting the imagery for the three crop land classifications, analysis districts were derived. NASS defines analysis districts as geographic areas that are classified using same date imagery. They can be defined by sensor scene (path/row) or county boundaries. The analysis districts can be contiguous or discrete in nature. The main criterion defining an analysis district is the fact that the date of imagery acquisition must be the same. If two scene dates are used, then both dates of observation are the same over the area of interest. The analysis districts derived during this investigation are described in Tables 2-4 and displayed in Figures 1-3.
Table 2. Landsat 5 TM Multitemporal Classification of Nebraska
Analysis District
Path Row Dates of Acquisition
1 27 32 08/22/04 & 09/07/04
2 28 31 04/07/04 & 08/29/04
3 28 32 07/12/04 & 08/29/04
4 4
29 29
30 31
07/19/04 & 08/20/04 07/19/04 & 08/20/04
5 29 32 07/03/04 & 07/19/04
6 30 30 03/20/04 & 09/12/04
7 30 31 05/07/03 & 09/12/04
8 8
30 30
31 32
08/11/04 & 09/12/04 08/11/04 & 09/12/04
9 9
31 31
30 31
08/02/04 & 09/03/04 08/02/04 & 09/03/04
10 10
32 32
30 31
06/22/04 & 07/08/04 06/22/04 & 07/08/04
11 32 32 07/08/04 & 08/25/04
12 12 12
33 33 33
30 31 32
08/16/04 & 09/01/04 08/16/04 & 09/01/04 08/16/04 & 09/01/04
13 31 32 08/02/04 & 09/03/0
Table 3. Landsat TM Unitemporal Classification of Nebraska
Analysis District
Path Row Date of Acquisition
21 27 32 08/22/04
22 28 32 08/29/04
23 28 32 07/12/04
24 29 30 08/20/04
25 29 32 07/19/04
26 26 26
30 30 30
30 31 32
09/12/04 09/12/04 09/12/04
29 29 29
31 31 31
30 31 32
09/03/04 09/03/04 09/03/04
30 32 30 06/22/04
31 31
32 32
31 32
07/08/04 07/08/04
32 32 32
32 32 32
30 31 32
09/01/04 09/01/04 09/01/04
Table 4. AWiFS Unitemporal Classification
Analysis District
Path Row Date of Acquisition
64 264 41 08/08/04
65 265 41 08/13/04
69 269 41 08/09/04
70 270 41 08/14/04
Pecora 16 “Global Priorities in Land Remote Sensing” October 23-27, 2005 * Sioux Falls, South Dakota

Multitemporal Landsat TM Analysis
Figure 1
Unitemporal Landsat TM Analysis
Figure 2
Pecora 16 “Global Priorities in Land Remote Sensing” October 23-27, 2005 * Sioux Falls, South Dakota

Unitemporal AWiFS Analysis
Figure 3 Ground Truth Data
Ground truth for the three crop land classifications came from a pre-existing NASS nationwide survey program, called the June Agricultural Survey (JAS). The JAS uses an area frame to select areas of land, called segments, for field visits. The area frame for a given state is a land use stratification of the state based on percent cultivation of crops. The sample is randomly drawn by strata, with an emphasis toward minimizing the variances of major crops and livestock estimates. Segments are visited each year in early June, with data collected directly from personal contacts with farmers. The size of an individual segment is approximately one square mile in high percent cultivation strata, larger in less cultivated but open area strata and small in urban areas. Field boundaries are drawn on black and white aerial photo enlargements of the segment area, and later entered into digital form and geo-registered to a Landsat scene in the NASS field office. It should be noted that crops estimates at the state (but not county) level can be produced using only the ground survey data without the application of remote sensing imagery. Software and Hardware
NASS used the PEDITOR software system (Ozga, 1995; Ozga, 2000; Day, 2002) to process the Landsat TM and AWiFS digital imagery for all three cropland classifications on high-end desktop computers using the Windows XP operating system. PEDITOR is an in-house created and maintained software system of over 100 program modules, some of which are expert systems designed to automate parts of the process by running other modules in sequence. There is one main difference between this software and commercial software: the regression analysis procedure and its concept of a segment as a clustered sample (as opposed to just as individual fields for training) from a specific stratum. Segment analysis is not available in commercial software without major work in an outside statistical package. Imagery Import and Review of Sample Segments
Location and review of sampled areas started with the reformatting (import) of selected Landsat TM and AWiFS imagery into PEDITOR format. The Landsat TM data was 8 bit (values O-255) and the AWiFS data was resampled from 10 bit to 8 bit. NASS used all seven Landsat TM bands and all four AWiFS bands for training and classification. The overlay of multi-temporal (two date) Landsat TM imagery was created using an automated block
Pecora 16 “Global Priorities in Land Remote Sensing” October 23-27, 2005 * Sioux Falls, South Dakota
correlation approach. Segment and internal field boundaries were overlaid on both the Landsat TM and AWiFS imagery, and reviewed on a field-by-field basis to identify any ‘bad’ fields where the reported data did not match the information seen in the digital satellite imagery. This process included such things as crop land already harvested, poor crop stands, cloud and haze affected areas, poorly drawn boundaries, and areas where the planted cover observed during enumeration does not match the farmer reported cover. Fields with problems that could not be corrected were identified and later marked as ‘bad for training’. Cloud affected segments were removed from consideration with respect to the specified scene. Training the Classifier Based on Known Sample Information
The NASS automated procedure used a modified supervised approach in the creation of cover type signatures. In this approach interior (non-boundary) pixels from known fields, not labeled as bad for training, were sorted according to cover type into separate files. Using a principle components analysis, additional outlier pixels were deleted (‘clipped’) from the files (Winings, 1990). Each updated file was then clustered, using a modified ISODATA algorithm, which allows cluster splitting and merging (Bellow and Ozga, 1991). A similar process was used to cluster ‘extra’ cover types, such as clouds, urban, and deep water. The resultant signature statistics for clusters from all cover types were then combined into one statistics file for input to the maximum likelihood classifier. All available known pixels from the sample segments were categorized using this classifier for regression analysis. Evaluation of the Maximum Likelihood Classifier
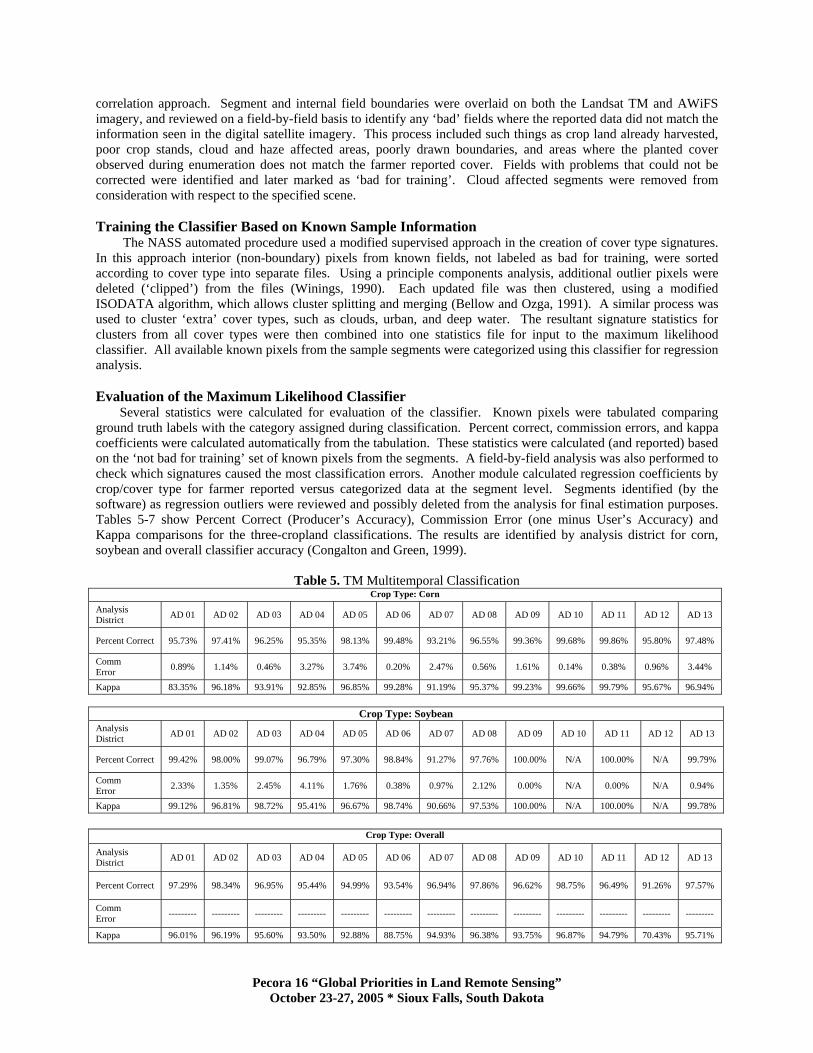
Several statistics were calculated for evaluation of the classifier. Known pixels were tabulated comparing ground truth labels with the category assigned during classification. Percent correct, commission errors, and kappa coefficients were calculated automatically from the tabulation. These statistics were calculated (and reported) based on the ‘not bad for training’ set of known pixels from the segments. A field-by-field analysis was also performed to check which signatures caused the most classification errors. Another module calculated regression coefficients by crop/cover type for farmer reported versus categorized data at the segment level. Segments identified (by the software) as regression outliers were reviewed and possibly deleted from the analysis for final estimation purposes. Tables 5-7 show Percent Correct (Producer’s Accuracy), Commission Error (one minus User’s Accuracy) and Kappa comparisons for the three-cropland classifications. The results are identified by analysis district for corn, soybean and overall classifier accuracy (Congalton and Green, 1999).
Table 5. TM Multitemporal Classification Crop Type: Corn
Analysis District AD 01 AD 02 AD 03 AD 04 AD 05 AD 06 AD 07 AD 08 AD 09 AD 10 AD 11 AD 12 AD 13
Percent Correct 95.73% 97.41% 96.25% 95.35% 98.13% 99.48% 93.21% 96.55% 99.36% 99.68% 99.86% 95.80% 97.48%
Comm Error 0.89% 1.14% 0.46% 3.27% 3.74% 0.20% 2.47% 0.56% 1.61% 0.14% 0.38% 0.96% 3.44%
Kappa 83.35% 96.18% 93.91% 92.85% 96.85% 99.28% 91.19% 95.37% 99.23% 99.66% 99.79% 95.67% 96.94%
Crop Type: Soybean Analysis District AD 01 AD 02 AD 03 AD 04 AD 05 AD 06 AD 07 AD 08 AD 09 AD 10 AD 11 AD 12 AD 13
Percent Correct 99.42% 98.00% 99.07% 96.79% 97.30% 98.84% 91.27% 97.76% 100.00% N/A 100.00% N/A 99.79%
Comm Error 2.33% 1.35% 2.45% 4.11% 1.76% 0.38% 0.97% 2.12% 0.00% N/A 0.00% N/A 0.94%
Kappa 99.12% 96.81% 98.72% 95.41% 96.67% 98.74% 90.66% 97.53% 100.00% N/A 100.00% N/A 99.78%
Crop Type: Overall
Analysis District AD 01 AD 02 AD 03 AD 04 AD 05 AD 06 AD 07 AD 08 AD 09 AD 10 AD 11 AD 12 AD 13
Percent Correct 97.29% 98.34% 96.95% 95.44% 94.99% 93.54% 96.94% 97.86% 96.62% 98.75% 96.49% 91.26% 97.57%
Comm Error --------- --------- --------- --------- --------- --------- --------- --------- --------- --------- --------- --------- ---------
Kappa 96.01% 96.19% 95.60% 93.50% 92.88% 88.75% 94.93% 96.38% 93.75% 96.87% 94.79% 70.43% 95.71%
Pecora 16 “Global Priorities in Land Remote Sensing” October 23-27, 2005 * Sioux Falls, South Dakota

Table 6. TM Unitemporal Classification Crop Type: Corn
Analysis District AD 21 AD 22 AD 23 AD 24 AD 25 AD 26 AD 29 AD 31 AD 32
Percent Correct 81.49% 95.64% 95.53% 93.48% 96.04% 93.97% 90.95% 90.96% 84.45%
Commission Error 15.47% 6.03% 5.61% 7.57% 3.99% 13.54% 9.07% 11.21% 7.50%
Kappa 73.42% 93.54% 92.67% 89.80% 93.22% 91.63% 89.14% 89.44% 84.00%
Crop Type: Soybean Analysis District AD 21 AD 22 AD 23 AD 24 AD 25 AD 26 AD 29 AD 31 AD 32
Percent Correct 95.62% 93.73% 95.43% 91.69% 88.39% 77.19% 96.23% 75.97% N/A
Commission Error 4.21% 5.29% 7.95% 7.25% 9.08% 21.48% 12.45% 10.04% N/A
Kappa 93.39% 89.93% 93.407% 88.37% 85.69% 74.70% 96.09% 75.55% N/A
Crop Type: Overall
Analysis District AD 21 AD 22 AD 23 AD 24 AD 25 AD 26 AD 29 AD 31 AD 32
Percent Correct 86.19% 90.60% 89.87% 87.10% 90.13% 85.31% 89.27% 91.55% 92.63%
Commission Error -------- -------- --------- -------- -------- -------- -------- -------- --------
Kappa 80.02% 86.57% 85.37% 81.79% 85.91% 77.33% 80.29% 84.26% 75.42%
Table 7. AWiFS Unitemporal Classifications
Crop Type: Corn Analysis District
AD 264
AD 265
AD 269
AD 270
Percent Correct 87.23% 86.63% 92.16% 86.83%
Commission Error 16.29% 22.17% 16.09% 22.17%
Kappa 83.35% 80.02% 86.47% 80.02% Crop Type: Soybean
Analysis District
AD 264
AD 265
AD 269
AD 270
Percent Correct 69.76% 74.29% 82.53% 74.29%
Commission Error 20.22% 9.30% 9.59% 9.30%
Kappa 67.16% 64.86% 77.41% 64.83% Crop Type: Overall
Analysis District
AD 264
AD 265
AD 269
AD 270
Percent Correct 77.86% 71.59% 82.52% 71.59%
Commission Error -------- -------- -------- --------
Kappa 64.81% 61.59% 75.18% 61.59%
Pecora 16 “Global Priorities in Land Remote Sensing” October 23-27, 2005 * Sioux Falls, South Dakota

Estimation Full scene classifications provide the last piece of the estimation process. The classification output is
summarized based on land use strata and boundaries from the area sampling frame. A regression estimation approach is then applied using classified pixels as the independent variable and farmer reported acres as the dependent variable in a set of area frame stratum based simple linear regressions. The county and state crop acreage estimates produced by this system greatly reduce the sampling variation ('error') found in the estimates produced by the ground data alone; and have the added benefits of producing county estimates with measurable precision. Tables 8-10 display the strata regression square statistics for corn and soybean for the three crop land classifications. Given the availability of sufficient segment data, statistics were calculated by individual land use stratum (11, 12, 20). If segment data were insufficient to conduct the estimation, a combined strata regression square statistic was derived. NASS defines stratum 11, for Nebraska, as land with greater than 80% cultivation. Stratum 12 is defined as land with between 50% - 80% cultivation. Stratum 20 is defined as land with between 15% - 50% cultivation. Regression line slopes were also calculated. Graphs 1 and 2 show the results of the regression analysis from unitemporal sample estimation for corn, for TM Analysis District (AD) 24 and AWiFS Analysis District (AD) 69. Combined Strata Regression R-square Statistics by Crop Type
Table 8. TM Multitemporal Classification R-sq (Strata) R-sq (Strata) Analysis District Crop Type: Corn Crop Type: Soybean
AD 01 0.911 (11) 0.947 (11) AD 02 0.915 (11, 12) 0.936 (11); 0.976 (12) AD 03 0.960 (11, 12) 0.912 (11) AD 04 0.954 (11); 0.949 (12, 20) 0.964 (11); 0.944 (12); 0.893 (20) AD 05 0.980 (11); 0.983 (12, 20) 0.919 (11); 0.931 (12, 20) AD 06 0.973 (11, 12) 0.856 (11, 12) AD 08 0.965 (12, 20) 0.958 (11, 12, 20) AD 09 0.935 (11, 12, 20) 0.998 (11, 12, 20) AD 10 0.995 (11, 20) AD 11 0.968 (11, 12, 20) AD 12 0.958 (11, 12, 20) AD 13 0.912 (11, 12, 20) 0.854 (11, 12, 20)
Table 9. TM Unitemporal Classification
R-sq (Strata) R-sq (Strata) Analysis District Crop Type: Corn Crop Type: Soybean
AD 21 0.926 (11) 0.918 (11) AD 22 0.849 (11, 12) 0.900 (11, 12) AD 23 0.891 (11, 12) 0.825 (11, 12) AD 24 0.881 (11, 12, 20) 0.922 (11, 12, 20) AD 25 0.955 (11); 0.947 (12, 20) 0.919 (11, 12, 20) AD 26 0.956 (11); 0.962 (12, 20) 0.897 (11); 0.948 (12) AD 29 0.926 (11, 12, 20) 0.994 (11, 12) AD 31 0.924 (11, 12, 20) 0.957 (11, 12) AD 32 0.971 (11, 12, 20)
Table 10. AWiFS Unitemporal Classification
R-sq (Strata) R-sq (Strata) Analysis District Crop Type: Corn Crop Type: Soybean
AD 264 0.907 (11, 12, 20) 0.905 (11, 12, 20) AD 265 0.809 (11, 12) AD 269 0.864 (11); 0.699 (12, 20) 0.869 (11); 0.909 (12, 20) AD 270 0.711 (11, 12) 0.221 (11, 12)
Pecora 16 “Global Priorities in Land Remote Sensing” October 23-27, 2005 * Sioux Falls, South Dakota

Regression Analysis from Unitemporal Sample Estimation Graph 1 - Landsat TM Corn AD 24 Pixel Sq meter/acres - .2224
R-sq (11, 12, 20) = 0.881 Slope (11, 12, 20) = 0.2176
Graph 2 – AWiFS Corn AD 69 Pixel Sq meter/acres - .7747
Outliers Removed
R-sq (11) = 0.864 Slope (11) = 0.7230 R-sq (12, 20) = 0.699 Slope (12, 20) = 0.6033
Pecora 16 “Global Priorities in Land Remote Sensing” October 23-27, 2005 * Sioux Falls, South Dakota

State Level Estimation The results of the Nebraska (2004) state level crop acreage estimation, for corn and soybeans, using ground
survey data (JAS) alone are compared in Graph 3 to the corn and soybeans state level estimates resulting from the application of remote sensing imagery. The Nebraska estimates are displayed as an approximate percentage over and under the Agricultural Statistics Board (ASB) final estimates as reported by NASS. The corn estimates are identified by the yellow columns. The soybean estimates are identified by the green columns. The y-axis shows the percentage over and under the ASB final estimate. The x-axis shows the source of the estimate. The June Agricultural Survey (JAS) corn estimate was 2 % above and the soybean estimate was 4.5 % above the ASB final estimate. The TM multitemporal corn estimate was 2.25 % below and the soybean estimate was .25 % below the ASB final estimate. The TM unitemporal corn estimate was 4.0 % above and the soybean estimate was 1.0 % above the ASB final estimate. The AWiFS unitemporal corn estimate was .50 % below and the soybean estimate was 1.0 % above the ASB final estimate. All percentages are approximate. Graph 3 State Level Estimates as % Over/Under
Agricultural Statistics Board (Final)
Graph 4 illustrates the same Nebraska 2004 state level crop acreage estimates as Graph 3. The difference is that this graph displays the amount of variation (plus or minus two coefficients of variation) in the estimates. The state level estimates for corn and soybean are identified by the bold black line in the center of the yellow (corn) and green (soybean) bars. The vertical length of the bars identifies the degree of variation in the estimates. All percentages are approximate. The variation in the JAS corn estimate ranged from 9.5% above to 5% below the ASB final estimate. The variation in the JAS soybean estimate ranged from 12.5% above to 3.75 % below the ASB final estimate. The variation in the TM multitemporal corn estimate ranged from 1% to 3.0 % below the ASB final estimate. The variation in the TM multitemporal soybean estimate ranged from 1.5% above to 2.5 % below the ASB final estimate. The variation in the TM unitemporal corn estimate ranged from 2.25% to 6.0 % above the ASB final estimate. The variation in the TM unitemporal soybean estimate ranged from 1.5% above to 2.25 % below the ASB final estimate. The variation in the AWiFS unitemporal corn estimate ranged from 2.00% above to 3.0 % below the ASB final estimate. The variation in the AWiFS unitemporal soybean estimate ranged from 3.5% above to 1.5 % below the ASB final estimate. Graph 4
State Level Estimates +/- 2 CVs (Coefficient of Variation)
Pecora 16 “Global Priorities in Land Remote Sensing” October 23-27, 2005 * Sioux Falls, South Dakota

DISCUSSION AND CONCLUSION The goal of this investigation was to determine if AWiFS imagery could serve as a supplemental source of data
for NASS' Remote Sensing Acreage Estimation Program. Landsat 5 TM and Landsat 7 ETM+ data have been used successfully for many years for crop acreage estimation at the state and county levels, as well as, for the production of the Crop Land Data Layer (CDL) product. However, due to the reduction in currently available imagery, the identification of appropriate additional sources of data has become a necessity for the continuation of the program.
Three separate crop land classifications of Nebraska (2004) were conducted to provide a framework for the evaluation and comparison of classification accuracy. The Landsat 5 TM multitemporal classification was used as a basis for comparison. Optimal classification results are achieved when two date imagery is utilized. Multitemporal imagery affords the most distinct separation of crop covers (Maxwell and Hoffer, 1996). Since only unitemporal AWiFS data (August dates) were available due to persistent cloud cover at the time of data acquisition, a unitemporal (summer dates) Landsat TM classification was conducted to provide a more comparable basis for evaluation. Identical methodologies were employed for all of the classifications. Results for the three crop land classification were evaluated on the basis of classifier accuracy. Strata Regression (R-square) statistics were determined by crop type for all classifications. Corn and soybean state level estimates from the three crop land classifications were evaluated and compared with the state level estimates from the June Agricultural Survey (JAS) as well as the Agricultural Statistics Board (ASB) final estimates. In addition, the state level crop acreage estimates from the JAS and the three crop land classifications were evaluated for the degree of variation (plus or minus two coefficients of variation) in the results.
After reviewing the classifier statistics (percent correct, comm. error, and kappa statistics), for the three crop land classifications, it was apparent that the AWiFS classification results were less accurate than the results from either the multitemporal or unitemporal Landsat classifications. Reductions in classification accuracy can be attributed to the 56 meter spatial resolution of AWiFS vs. the 30 meter resolution of the Landsat TM sensor and the reduced spectral resolution of AWiFS (4 bands) vs. TM (7 bands). However, it is anticipated that future improvements in classification accuracy are likely to be achieved due to the increased temporal frequency of AWiFS (5 day) versus the TM sensor (16 day) repeat cycle. The enhanced revisit cycle should significantly increase the availability of cloud free imagery.
Furthermore, it appears that AWiFS data will be acceptable for acreage estimation over large, spectrally homogenous, crop areas such as the Mid-West, the Delta and the Northern Great Plains. The unitemporal AWiFS data provided reasonable and consistent crop acreage estimates for production of the Crop Land Data Layer (CDL) product. In addition, it is anticipated that the use of multitemporal AWiFS data would improve the classification results to a level that is acceptable to NASS. In conclusion, although the spatial and spectral resolutions of the AWiFS sensor are inferior to Landsat TM, these shortcomings may be overcome by the large swath width and enhanced temporal resolution of AWiFS. It is anticipated that AWiFS imagery can serve as a suitable source of supplemental data to produce major crop estimates at the state and county levels plus digital CDL products.
REFERENCES Bellow, M., and M. Ozga (1991). Evaluation of Clustering Techniques for Crop Area Estimation Using Remotely
Sensed Data. 1991 Proceedings of the Section on Survey Research Methods, American Statistical Association, Atlanta, GA. pp. 466-471.
Bethel, G. and B. Doorn (1998). USDA Remote Sensing Technical and Systems Support for Operational Worldwide Agriculture Analysis. In: Proceedings of the 1st International Conference: Geospatial Information in Agriculture and Forestry, ERIM International Inc., Ann Arbor, MI-USA, pp. 44-51.
Congalton, R.G. and K. Green (1999). Assessing the Accuracy of Remotely Sensed Data: Principles and Practices, Boca Raton, FL: CRS Press, Inc.
Craig, M. (2001). The NASS Cropland Data Layer Program. Presented at the Third International Conference on Geospatial Information in Agriculture and Forestry, Denver, Colorado, 5-7 November 2001.
Day, C. (2002), A Compilation of PEDITOR Estimation Formulas. RDD Research Paper RDD-02-03, USDA/NASS, National Agricultural Statistics Service, Washington, D. Jan. 2002.
Hanuschak, G., Allen, R., and W. Wigton (1982). Integration of Landsat Data into the Crop Estimation Program of USDA’s Statistical Reporting Service. In: Proceedings of the 1982 Machine Processing of Remotely
Pecora 16 “Global Priorities in Land Remote Sensing” October 23-27, 2005 * Sioux Falls, South Dakota

Sensed Data Symposium, Eighth International Symposium, LARS, Purdue University, West Lafayette, IN-USA, pp. 45-56.
Hanuschak, G., Hale, R., Craig, M., Mueller, R., and G. Hart (2001), The New Economics of Remote Sensing for Agricultural Statistics in the United States. To be included in the: Proceedings of the CAESAR Conference, June 2001, Italian Statistics Agency (ISTAT), Rome, Italy
Jensen, J. R. (2000). Remote Sensing of the Environment: An Earth Resource Perspective, Upper Saddle River, NJ: Prentice-Hall, Inc.
Maxwell, S.K. and R. M. Hoffer (1996). Mapping agriculture crops with multi-date Landsat data, Proceedings of the National ASPRS/ACSM 1996 Annual Convention, Baltimore, MD, pp. 433-443.
Mueller, R. (2000). Categorized Mosaicked Imagery from the National Agricultural Statistics Service Crop Acreage Estimation Program. Available on the CD: Proceedings of the ASPRS 2000 Conference, ASPRS, Bethesda, MD. May 2000.
National Natural Resource Management System, (NNRMS) Bulletin, 2004a, “Utilization of Resourcesat-1 Data in Agriculture Applications”, http://nnrms.gov.in/bul2004/2004_5.pdf. July 29, 2005.
National Natural Resource Management System (NNRMS) Bulletin, 2004b, “Utilization of Resourcesat-1 Data for Improved Crop Discrimination and Surface Soil Wetness Zonation”, http://nnrms.gov.in/bul2004/2004_4.pdf. July 29, 2005.
National Natural Resource Management System (NNRMS) Bulletin, 2004c, “Potential of Resourcesat- 1 Data for Crop Inventory Studies”, http://nnrms.gov.in/bul2004/2004_3.pdf. July 29, 2005.
Ozga, M., and Craig, M (1995). PEDITOR - Statistical Image Analysis for Agriculture. Presentation at the Washington Statistical Society (WSS) Seminar, April, 1995, USDA, National Agricultural Statistics Service, Washington, DC-USA.
Ozga, M. (2000). Batch Processing of Remote Sensing Jobs on the PC. Available on the CD: Proceedings of the ASPRS 2000 Conference, ASPRS, Bethesda, MD-USA.
Winings, S., Ozga, M., and J. Stakenborg (1990). The Effects of the Applications of Smoothing and Orthogonal Transforms to SPOT and TM Data on Regression Based Crop Acreage Estimates. In: Proceedings of the IGARSS '90 Symposium, College Park, MD-USA, Vol. 1, pp. 647-650.
Pecora 16 “Global Priorities in Land Remote Sensing” October 23-27, 2005 * Sioux Falls, South Dakota