Embed Size (px)
Citation preview

Multiplier Analysis
Arthur C. Nelson, Ph.D., FAICPPresidential Professor of City & Metropolitan PlanningDirector, Metropolitan Research CenterUniversity of UtahFebruary 2010
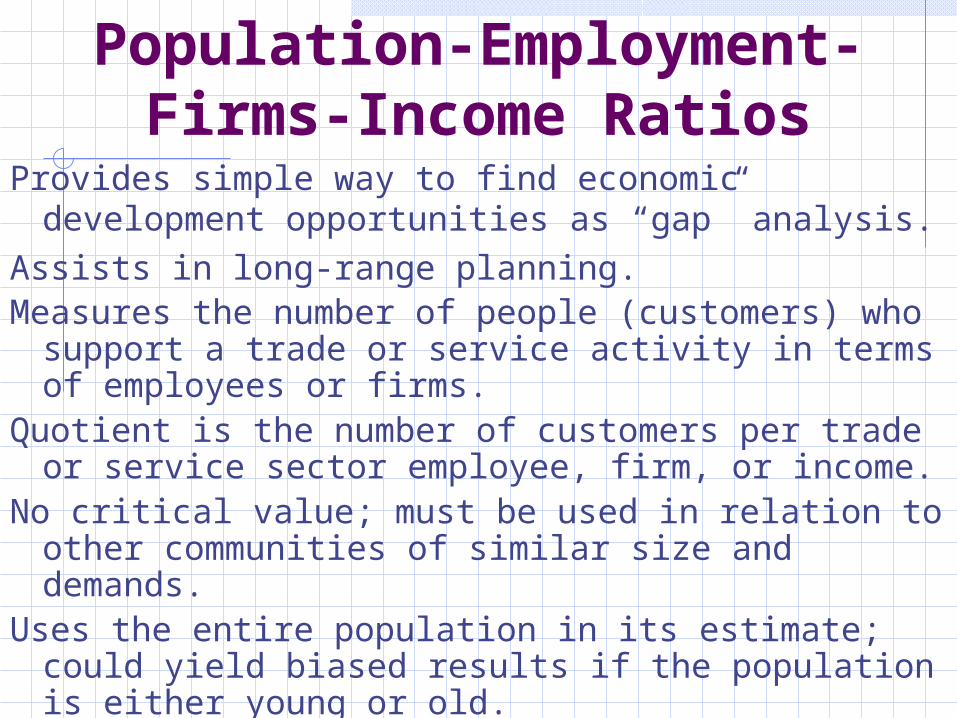
Population-Employment-Firms-Income Ratios
Provides simple way to find economic development opportunities as “gap” analysis.
Assists in long-range planning.Measures the number of people (customers) who
support a trade or service activity in terms of employees or firms.
Quotient is the number of customers per trade or service sector employee, firm, or income.
No critical value; must be used in relation to other communities of similar size and demands.
Uses the entire population in its estimate; could yield biased results if the population is either young or old.
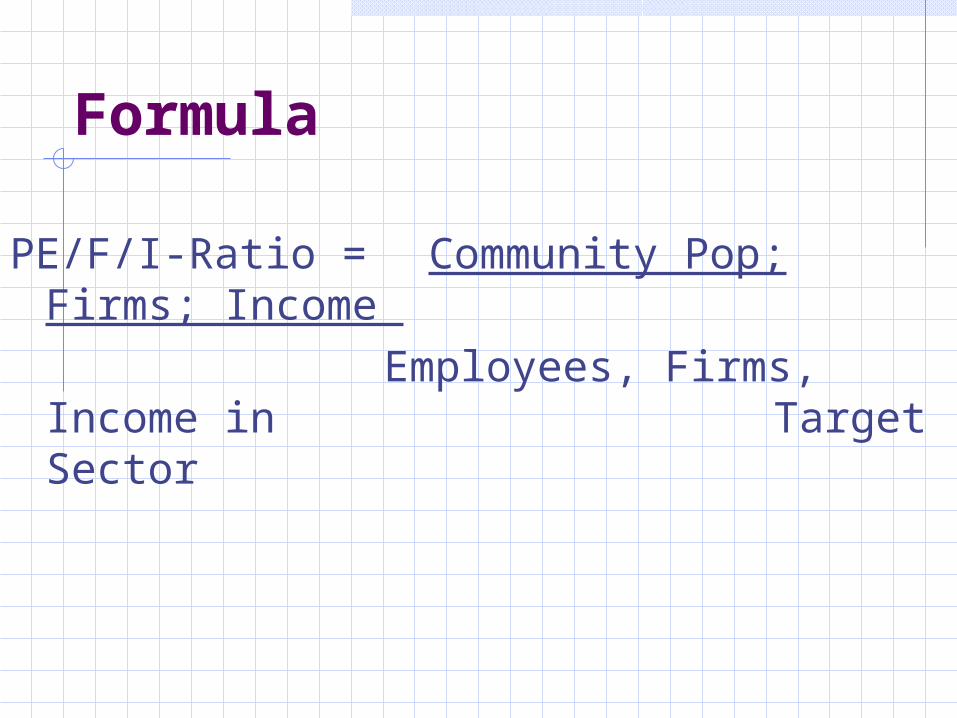
Formula
PE/F/I-Ratio = Community Pop; Firms; Income
Employees, Firms, Income in Target Sector
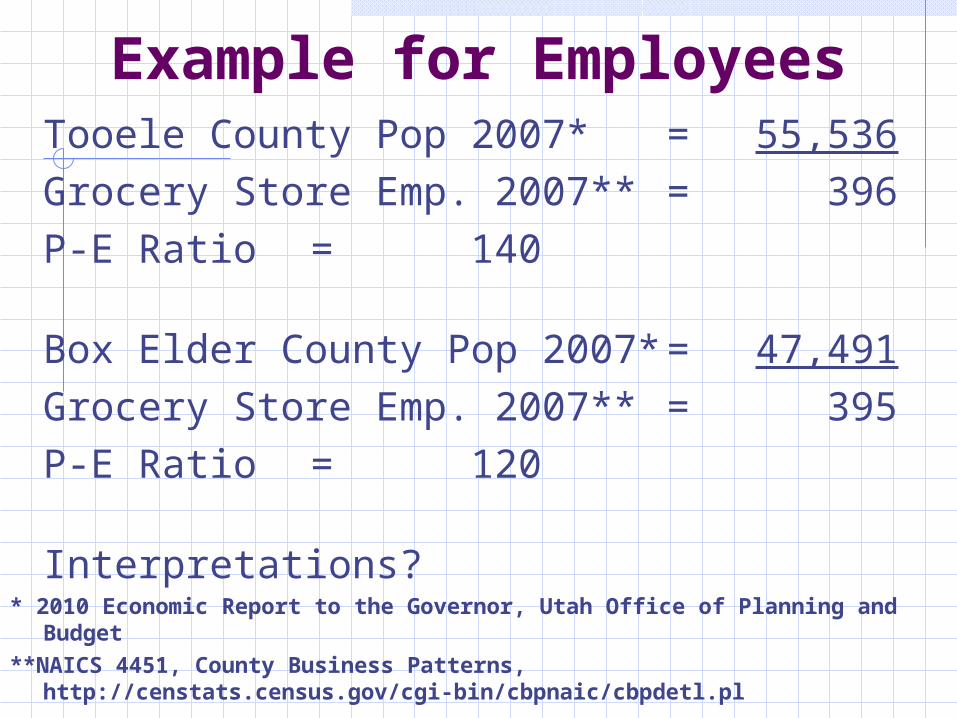
Example for EmployeesTooele County Pop 2007* = 55,536Grocery Store Emp. 2007** = 396P-E Ratio = 140
Box Elder County Pop 2007* = 47,491Grocery Store Emp. 2007** = 395P-E Ratio = 120
Interpretations?* 2010 Economic Report to the Governor, Utah Office of Planning and Budget**NAICS 4451, County Business Patterns,
http://censtats.census.gov/cgi-bin/cbpnaic/cbpdetl.pl
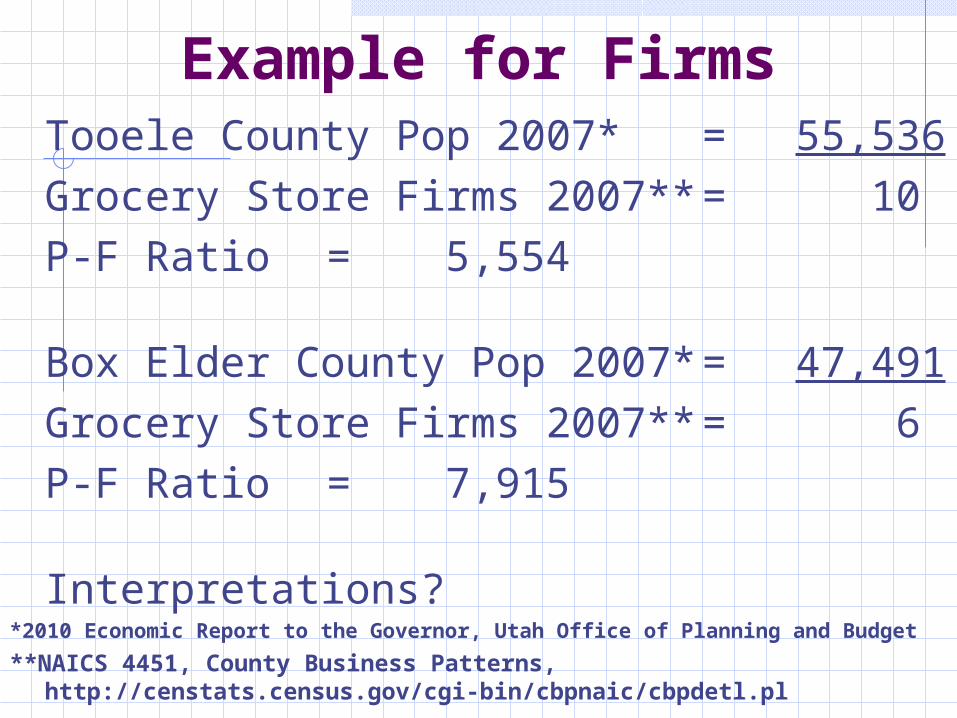
Example for FirmsTooele County Pop 2007* = 55,536Grocery Store Firms 2007** = 10P-F Ratio = 5,554
Box Elder County Pop 2007* =47,491Grocery Store Firms 2007** = 6P-F Ratio = 7,915
Interpretations?*2010 Economic Report to the Governor, Utah Office of Planning and Budget
**NAICS 4451, County Business Patterns, http://censtats.census.gov/cgi-bin/cbpnaic/cbpdetl.pl
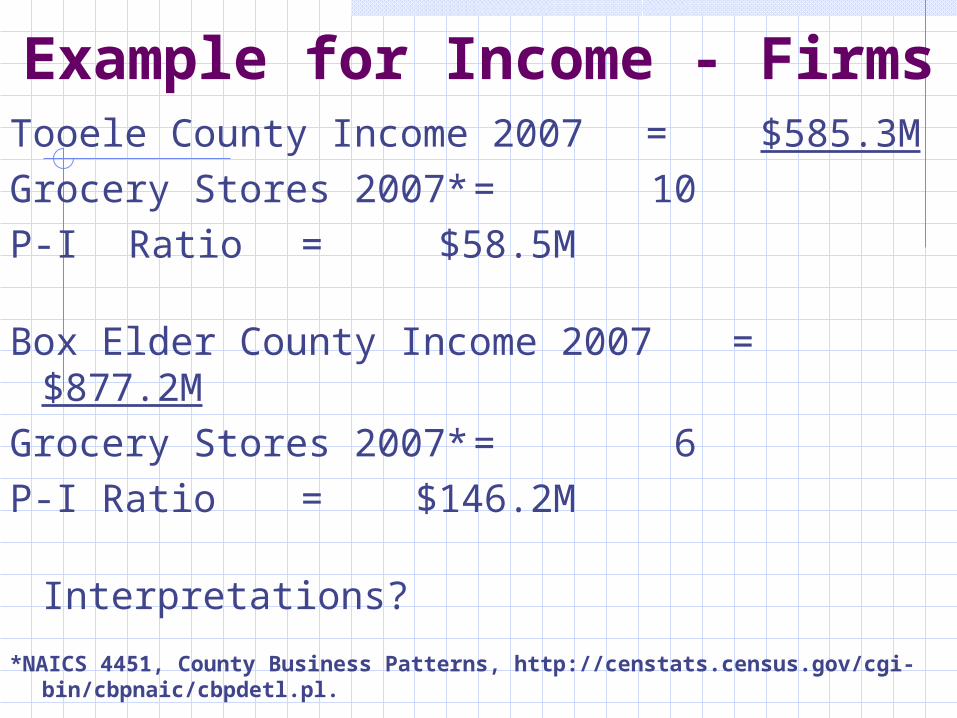
Example for Income - FirmsTooele County Income 2007 = $585.3MGrocery Stores 2007* = 10P-I Ratio = $58.5M
Box Elder County Income 2007 = $877.2MGrocery Stores 2007* = 6P-I Ratio = $146.2M
Interpretations?
*NAICS 4451, County Business Patterns, http://censtats.census.gov/cgi-bin/cbpnaic/cbpdetl.pl.
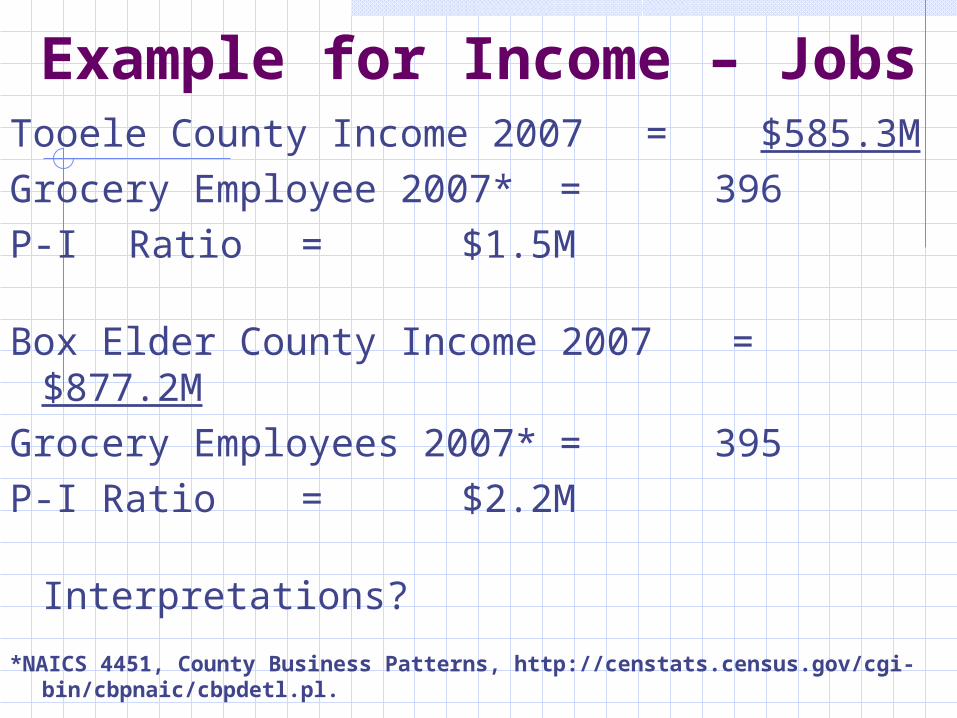
Example for Income – JobsTooele County Income 2007 = $585.3MGrocery Employee 2007* =
396P-I Ratio = $1.5M
Box Elder County Income 2007 = $877.2MGrocery Employees 2007* = 395P-I Ratio = $2.2M
Interpretations?
*NAICS 4451, County Business Patterns, http://censtats.census.gov/cgi-bin/cbpnaic/cbpdetl.pl.
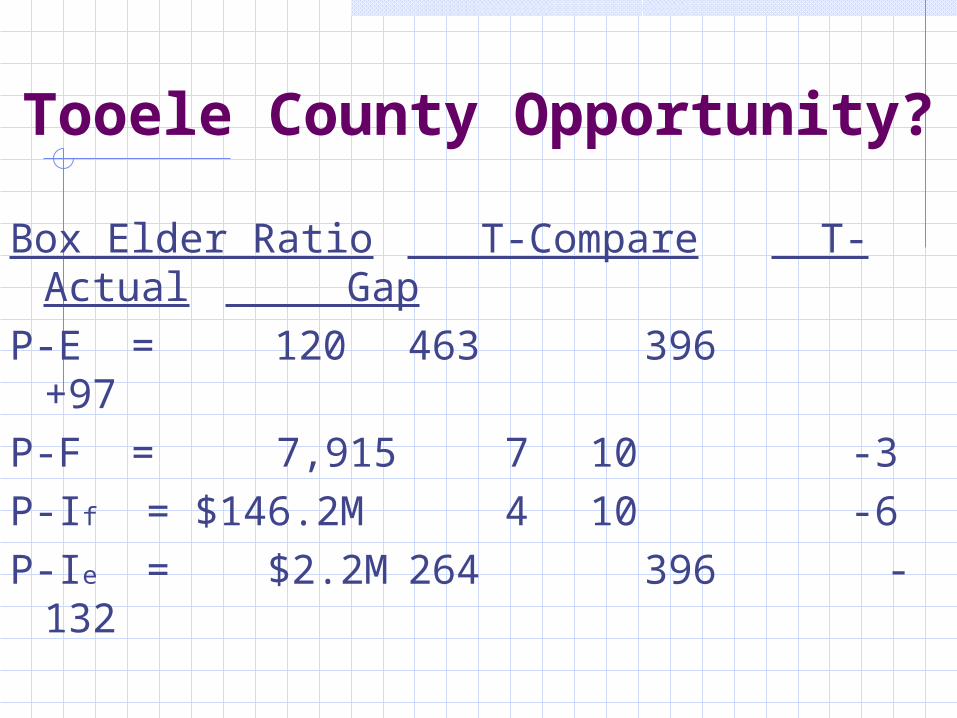
Tooele County Opportunity?
Box Elder Ratio T-Compare T-Actual Gap
P-E = 120 463 396 +97
P-F = 7,915 7 10 -3P-If = $146.2M 4 10 -
6P-Ie = $2.2M264 396 -132
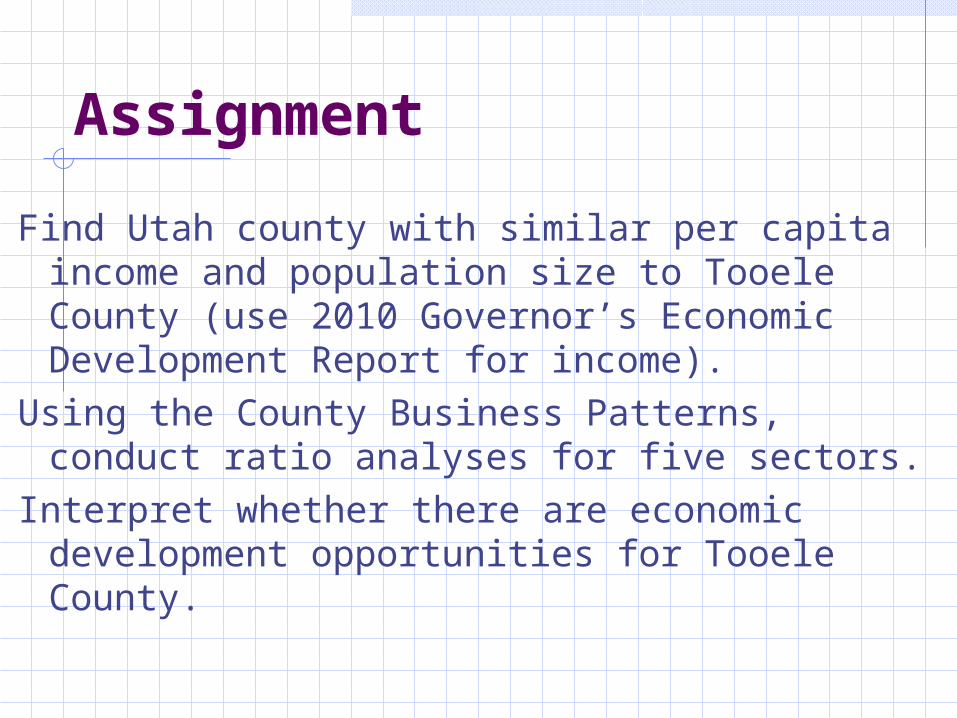
Assignment
Find Utah county with similar per capita income and population size to Tooele County (use 2010 Governor’s Economic Development Report for income).
Using the County Business Patterns, conduct ratio analyses for five sectors.
Interpret whether there are economic development opportunities for Tooele County.
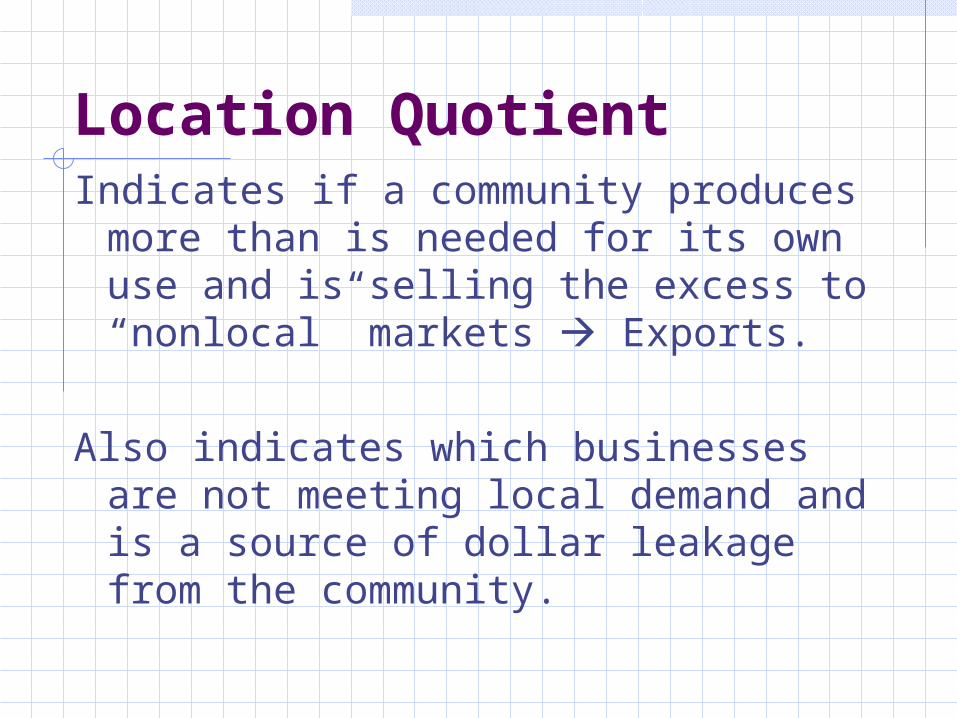
Location QuotientIndicates if a community produces
more than is needed for its own use and is selling the excess to “nonlocal” markets Exports.
Also indicates which businesses are not meeting local demand and is a source of dollar leakage from the community.
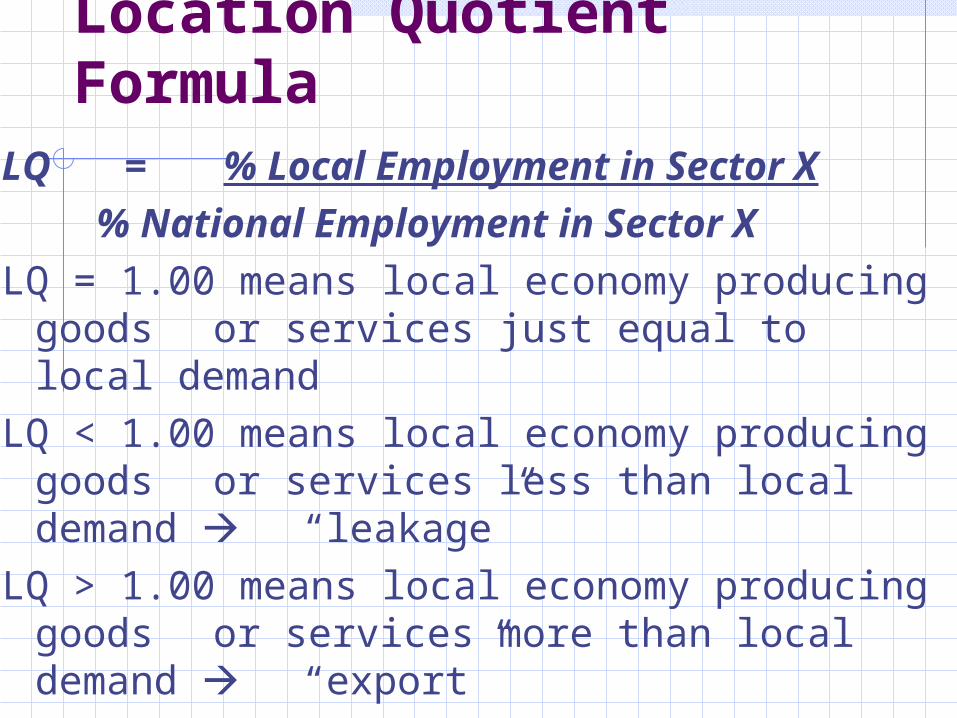
Location Quotient Formula
LQ = % Local Employment in Sector X % National Employment in Sector
XLQ = 1.00 means local economy producing
goods or services just equal to local demand
LQ < 1.00 means local economy producing goods or services less than local demand “leakage”
LQ > 1.00 means local economy producing goods or services more than local demand “export”
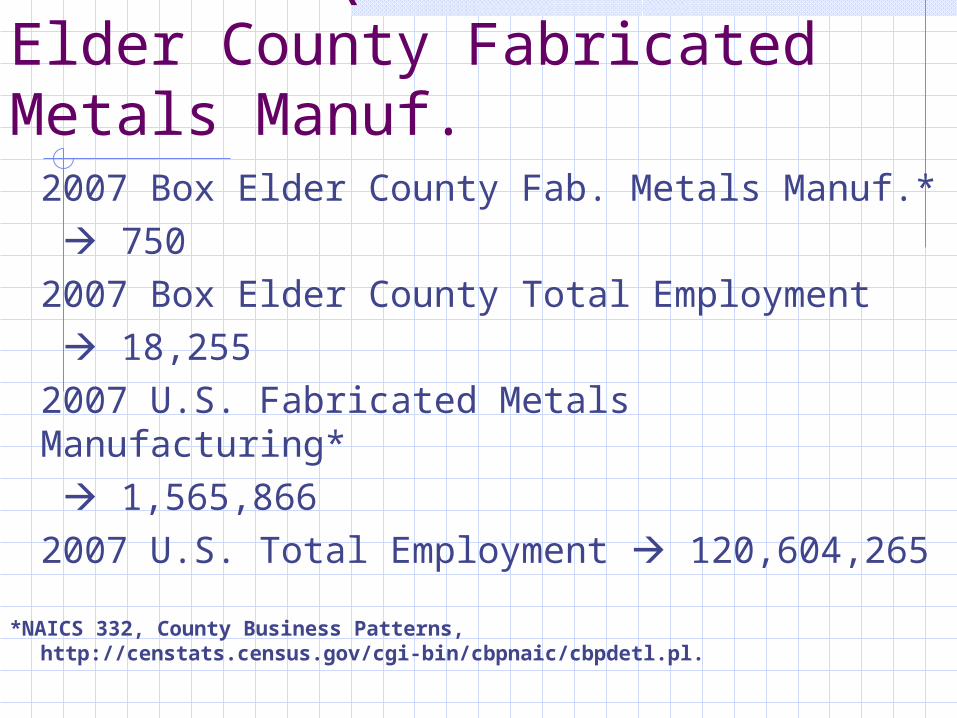
Location Quotient – Box Elder County Fabricated Metals Manuf.
2007 Box Elder County Fab. Metals Manuf.* 750
2007 Box Elder County Total Employment 18,255
2007 U.S. Fabricated Metals Manufacturing* 1,565,866
2007 U.S. Total Employment 120,604,265
*NAICS 332, County Business Patterns, http://censtats.census.gov/cgi-bin/cbpnaic/cbpdetl.pl.
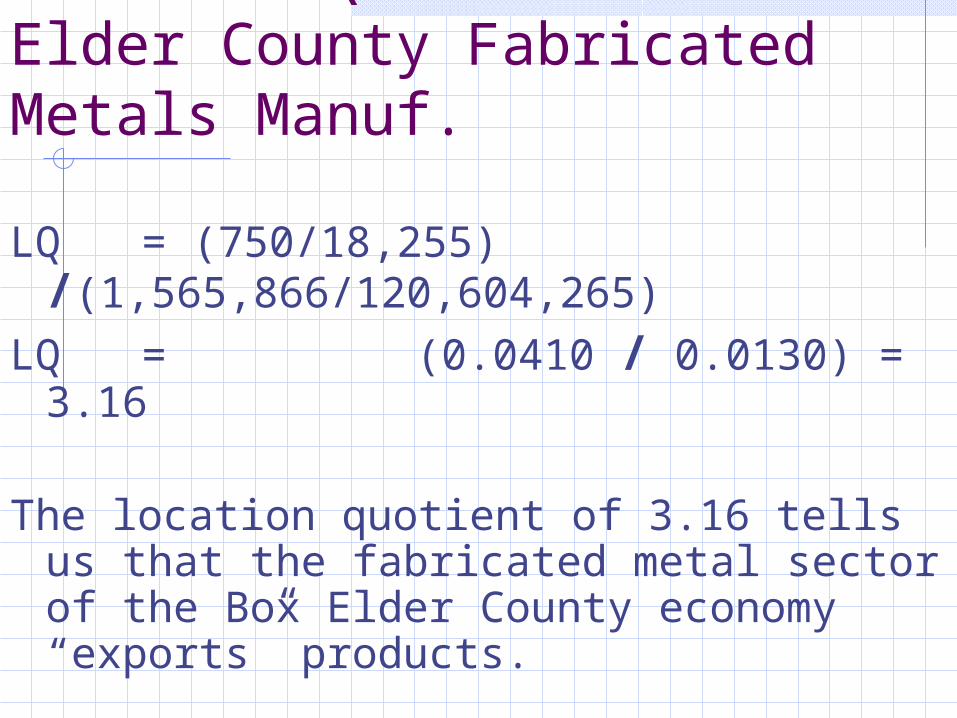
Location Quotient – Box Elder County Fabricated Metals Manuf.
LQ = (750/18,255) /(1,565,866/120,604,265)
LQ = (0.0410 / 0.0130) = 3.16
The location quotient of 3.16 tells us that the fabricated metal sector of the Box Elder County economy “exports” products.
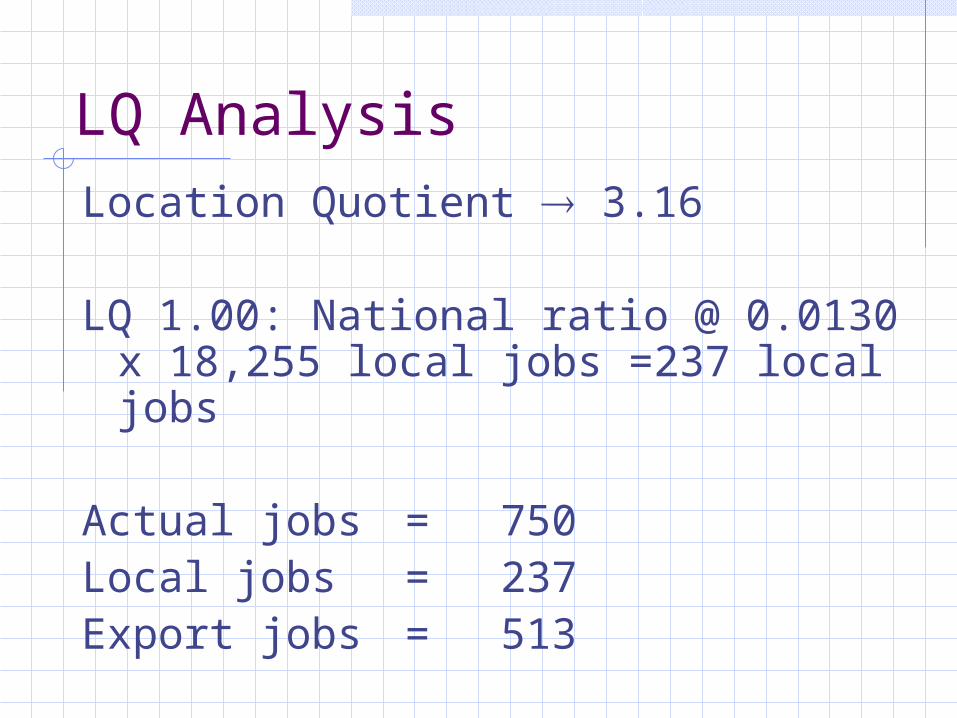
LQ AnalysisLocation Quotient 3.16
LQ 1.00: National ratio @ 0.0130 x 18,255 local jobs =237 local jobs
Actual jobs = 750Local jobs = 237Export jobs = 513
Sources
Hustedde, Ronald J., Ron Shaffer, and Glen Pulver. Community Economic Analysis: A How To Manual. North Central Regional Center for Rural Development. Ames, IA. November 2001.
Kathy Tweeten, North Dakota State University; Alan Barefield, Southern Rural Development Center; Randy Reynolds Piedmont Community College “Community Economic Analysis” nd.