Embed Size (px)
Citation preview
EqualityResearchSeries
Gen
der Im
pact of Tax
and
Ben
efi t Ch
anges: A
Microsim
ulation
An
alysis
2757077819089
ISBN 9781908275707
Gender Impact of Tax and Benefi t Changes
A Microsimulation ApproachClaire Keane, Tim Callan & John R. Walsh
The Equality Authority
Birchgrove HouseRoscrea Co. Tipperary Phone: (0505) 24126 Fax: (0505) 22388
Jervis HouseJervis StreetDublin 1Phone: (01) 417 3336 Fax: (01) 417 3331
Public Information CentreLo Call: 1890 245 545Email: [email protected]
www.equality.ie
The Economic and Social Research Institute
Whitaker Square Sir John Rogerson’s Quay Dublin 2
www.esri.ie
EA_131_A4_02.indd 9-10 17/09/2014 10:30

This report can be downloaded at: www.equality.ie/research and www.esri.ie
EA_131_A4_02.indd 11-12 17/09/2014 10:30
GENDER IMPACT OF TAX AND BENEFIT CHANGES: A MICROSIMULATION APPROACH
Claire Keane, Tim Callan and John R. Walsh
Claire Keane is a Research Officer, Tim Callan is a Research Professor, and John Walsh is a Senior Research Analyst at the Economic and Social Research Institute. The views expressed in this report are those of the authors and do not necessarily represent those of the Equality Authority or the Economic and Social Research Institute.
© Copyright Equality Authority and Economic and Social Research Institute, 2014
ISBN: 978-1-908275-70-7
Cover design by form
Produced in Ireland by Print Services
Gender Impact of Tax and Benefit Changes iii
CONTENTS
TABLES ...................................................................................................................... iv FOREWORD ................................................................................................................ v ACKNOWLEDGEMENTS............................................................................................ vi EXECUTIVE SUMMARY ............................................................................................ vii 1 GENDER IMPACT OF TAX AND BENEFIT CHANGES: A MICROSIMULATION APPROACH ............................................................................. 1 1.1 Introduction ............................................................................................................. 1
2 INCOMES – ANALYSING THE GENDER DIMENSION .......................................... 3 2.1 Introduction .................................................................................................. ..........3
2.2 Gender Impact Assessment ................................................................................... 3
2.3 Gender Budgeting .................................................................................................. 6
2.4 Irish Studies ........................................................................................................... 7
3 ASSESSING GENDER IMPACTS OF TAX AND WELFARE POLICY CHANGES: A MICROSIMULATION APPROACH .................................................... 11 3.1 Introduction .......................................................................................................... 11
3.2 Tax Benefit Models .............................................................................................. 11
3.3 Measuring Policy Impacts .................................................................................... 13
3.4 Intra-household resource allocation ..................................................................... 15
4 A PROFILE OF GENDER DIFFERENCES RELEVANT TO TAX AND WELFARE ................................................................................................................. 17 4.1 Introduction .......................................................................................................... 17
4.2 Gender Differences in Key Characteristics ........................................................... 17
5 GENDER IMPACTS OF TAX/TRANSFER POLICY CHANGES: BUDGETS 2009–2013 ................................................................................................................. 22 5.1 Introduction .......................................................................................................... 22
5.2 Policy Changes Budgets 2009-2013 .................................................................... 22
5.3 Tax Unit Level Results ......................................................................................... 25
5.4 Austerity Policies: Initial Year and Later Years ..................................................... 34
5.5 Comparative Evidence: Ireland and the UK .......................................................... 37
5.6 Conclusion ........................................................................................................... 38
6 GENDER IMPACT OF TAXES AND BENEFITS: POTENTIAL WITHIN-COUPLE EFFECTS ................................................................................................... 39 6.1 Introduction .......................................................................................................... 39
6.2 Individual Level Results ....................................................................................... 39
6.3 Conclusion ........................................................................................................... 45
7 CONCLUSIONS .................................................................................................... 46 BIBLIOGRAPHY ....................................................................................................... 48
iv Gender Impact of Tax and Benefit Changes
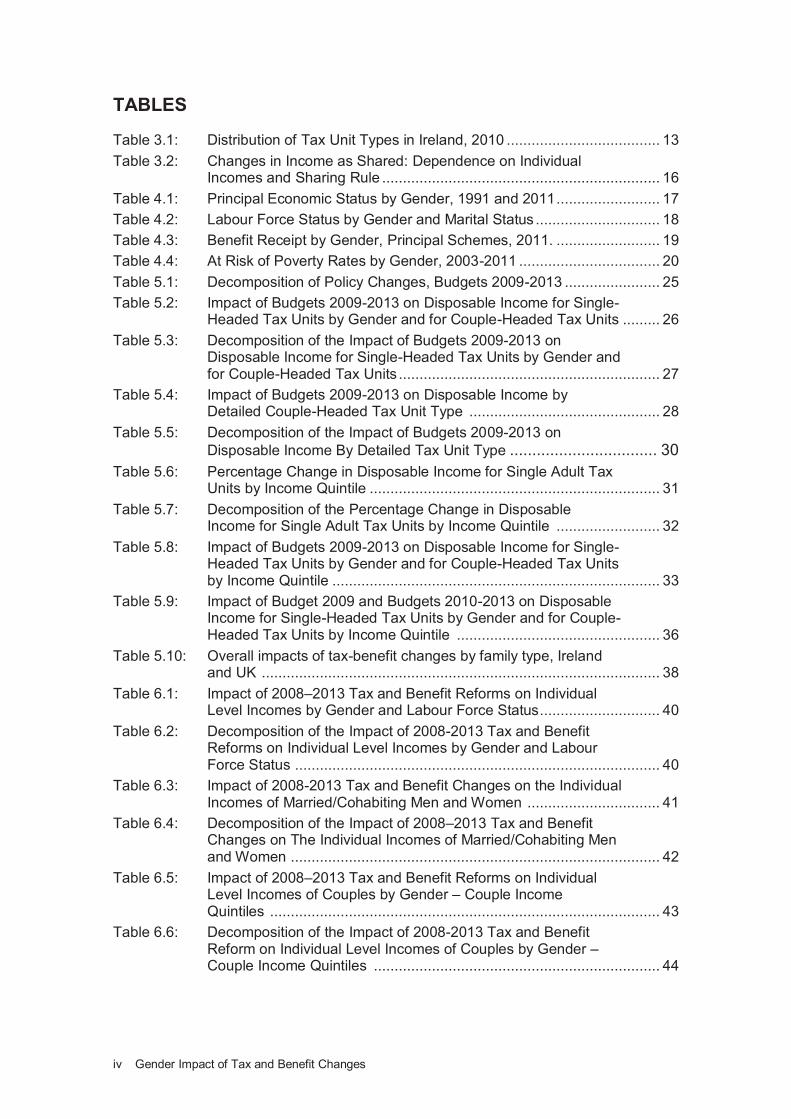
TABLES
Table 3.1: Distribution of Tax Unit Types in Ireland, 2010 ..................................... 13
Table 3.2: Changes in Income as Shared: Dependence on Individual Incomes and Sharing Rule ................................................................... 16
Table 4.1: Principal Economic Status by Gender, 1991 and 2011 ......................... 17
Table 4.2: Labour Force Status by Gender and Marital Status .............................. 18
Table 4.3: Benefit Receipt by Gender, Principal Schemes, 2011. ......................... 19
Table 4.4: At Risk of Poverty Rates by Gender, 2003-2011 .................................. 20
Table 5.1: Decomposition of Policy Changes, Budgets 2009-2013 ....................... 25
Table 5.2: Impact of Budgets 2009-2013 on Disposable Income for Single- Headed Tax Units by Gender and for Couple-Headed Tax Units ......... 26
Table 5.3: Decomposition of the Impact of Budgets 2009-2013 on Disposable Income for Single-Headed Tax Units by Gender and for Couple-Headed Tax Units ............................................................... 27
Table 5.4: Impact of Budgets 2009-2013 on Disposable Income by Detailed Couple-Headed Tax Unit Type .............................................. 28
Table 5.5: Decomposition of the Impact of Budgets 2009-2013 on
Disposable Income By Detailed Tax Unit Type ................................. 30
Table 5.6: Percentage Change in Disposable Income for Single Adult Tax Units by Income Quintile ...................................................................... 31
Table 5.7: Decomposition of the Percentage Change in Disposable Income for Single Adult Tax Units by Income Quintile ......................... 32
Table 5.8: Impact of Budgets 2009-2013 on Disposable Income for Single-Headed Tax Units by Gender and for Couple-Headed Tax Units by Income Quintile ............................................................................... 33
Table 5.9: Impact of Budget 2009 and Budgets 2010-2013 on Disposable Income for Single-Headed Tax Units by Gender and for Couple-Headed Tax Units by Income Quintile ................................................. 36
Table 5.10: Overall impacts of tax-benefit changes by family type, Ireland and UK ................................................................................................ 38
Table 6.1: Impact of 2008–2013 Tax and Benefit Reforms on Individual Level Incomes by Gender and Labour Force Status ............................. 40
Table 6.2: Decomposition of the Impact of 2008-2013 Tax and Benefit Reforms on Individual Level Incomes by Gender and Labour Force Status ........................................................................................ 40
Table 6.3: Impact of 2008-2013 Tax and Benefit Changes on the Individual Incomes of Married/Cohabiting Men and Women ................................ 41
Table 6.4: Decomposition of the Impact of 2008–2013 Tax and Benefit Changes on The Individual Incomes of Married/Cohabiting Men and Women ......................................................................................... 42
Table 6.5: Impact of 2008–2013 Tax and Benefit Reforms on Individual Level Incomes of Couples by Gender – Couple Income Quintiles .............................................................................................. 43
Table 6.6: Decomposition of the Impact of 2008-2013 Tax and Benefit Reform on Individual Level Incomes of Couples by Gender – Couple Income Quintiles ..................................................................... 44

Gender Impact of Tax and Benefit Changes v
FOREWORD
Equality between women and men is a fundamental principle of the European Union and each member state is required to designate a body for the promotion, analysis, monitoring and support of equal treatment of all persons on grounds of sex. The Equality Authority, established in 1999, is the designated gender equality body in Ireland and this role will continue to be fulfilled by the Irish Human Rights and Equality Commission (IHREC) which will be established later this year through the merger of the Equality Authority and the Irish Human Rights Commission.
To promote equality in practice between men and women we need to challenge assumptions of gender neutrality in public policy. In reality most economic and social policies have a gender impact and - if properly designed - can reduce gender inequalities. “Gender Budgeting” refers to a broad range of approaches with the common theme of identifying the differential impact of actual or proposed policies on women and men and using that information to design better policies that support the achievement of equality.
This research report ‘‘Gender Impact of Tax and Benefit Changes: A Microsimulation Approach” is an important addition to the Irish literature on gender budgeting. It uses the ESRI tax-benefit micro simulation model, SWITCH, which draws on nationally representative survey data on incomes, to conduct a systematic assessment of the gender impact of changes in tax and benefit policies and public pay over the period 2009 to 2013. It is particularly innovative in the approach it develops to exploring the impact on women and men in couples, where it shows that tax and benefit changes have reduced the individual income of women more than men, particularly among those on lower incomes. Whether this translates into divergence of living standards between women and men will depend on how the couple negotiates the sharing of income.
I would like to thank the authors - Claire Keane, Tim Callan and John R.Walsh - for their expert report. Their analysis confirms the need for the systematic gender proofing of budget policy. The microsimulation approach that they present also could - and should - be used by policymakers to examine the equality impact of tax and welfare changes across other grounds such as disability and age, and on socio-economic grounds generally.
Orlagh O’Farrell Acting Chairperson Irish Human Rights and Equality Commission (designate)

vi Gender Impact of Tax and Benefit Changes
ACKNOWLEDGEMENTS
This study was funded by the Equality Authority. We are grateful to the Authority for its support for this research, and to Laurence Bond who provided valuable comments on earlier drafts. Helpful comments were provided by an anonymous reviewer.
The study is based primarily on data from the Survey on Income and Living Conditions, 2010, conducted by the CSO. We are grateful to the SILC unit at CSO for providing access to the data.
Responsibility for the content of the report rests solely with the authors.
Gender Impact of Tax and Benefit Changes vii
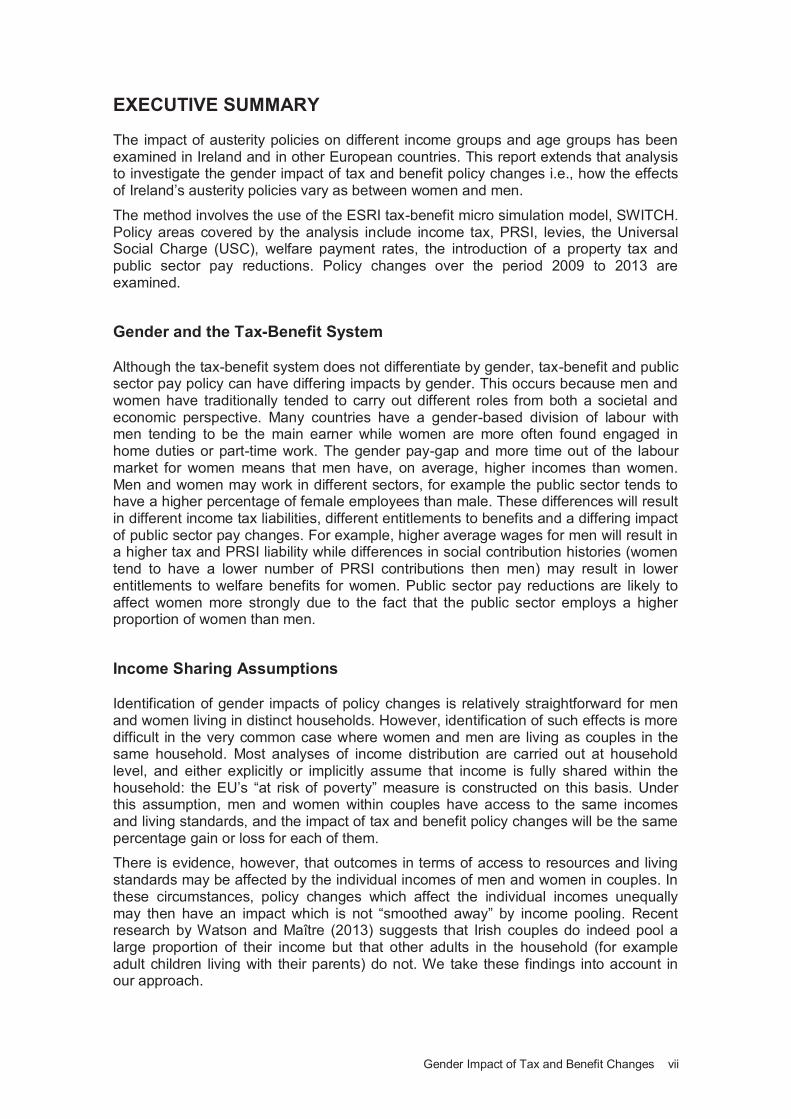
EXECUTIVE SUMMARY
The impact of austerity policies on different income groups and age groups has been examined in Ireland and in other European countries. This report extends that analysis to investigate the gender impact of tax and benefit policy changes i.e., how the effects of Ireland’s austerity policies vary as between women and men.
The method involves the use of the ESRI tax-benefit micro simulation model, SWITCH. Policy areas covered by the analysis include income tax, PRSI, levies, the Universal Social Charge (USC), welfare payment rates, the introduction of a property tax and public sector pay reductions. Policy changes over the period 2009 to 2013 are examined.
Gender and the Tax-Benefit System
Although the tax-benefit system does not differentiate by gender, tax-benefit and public sector pay policy can have differing impacts by gender. This occurs because men and women have traditionally tended to carry out different roles from both a societal and economic perspective. Many countries have a gender-based division of labour with men tending to be the main earner while women are more often found engaged in home duties or part-time work. The gender pay-gap and more time out of the labour market for women means that men have, on average, higher incomes than women. Men and women may work in different sectors, for example the public sector tends to have a higher percentage of female employees than male. These differences will result in different income tax liabilities, different entitlements to benefits and a differing impact of public sector pay changes. For example, higher average wages for men will result in a higher tax and PRSI liability while differences in social contribution histories (women tend to have a lower number of PRSI contributions then men) may result in lower entitlements to welfare benefits for women. Public sector pay reductions are likely to affect women more strongly due to the fact that the public sector employs a higher proportion of women than men.
Income Sharing Assumptions
Identification of gender impacts of policy changes is relatively straightforward for men and women living in distinct households. However, identification of such effects is more difficult in the very common case where women and men are living as couples in the same household. Most analyses of income distribution are carried out at household level, and either explicitly or implicitly assume that income is fully shared within the household: the EU’s “at risk of poverty” measure is constructed on this basis. Under this assumption, men and women within couples have access to the same incomes and living standards, and the impact of tax and benefit policy changes will be the same percentage gain or loss for each of them.
There is evidence, however, that outcomes in terms of access to resources and living standards may be affected by the individual incomes of men and women in couples. In these circumstances, policy changes which affect the individual incomes unequally may then have an impact which is not “smoothed away” by income pooling. Recent research by Watson and Maître (2013) suggests that Irish couples do indeed pool a large proportion of their income but that other adults in the household (for example adult children living with their parents) do not. We take these findings into account in our approach.
viii Gender Impact of Tax and Benefit Changes
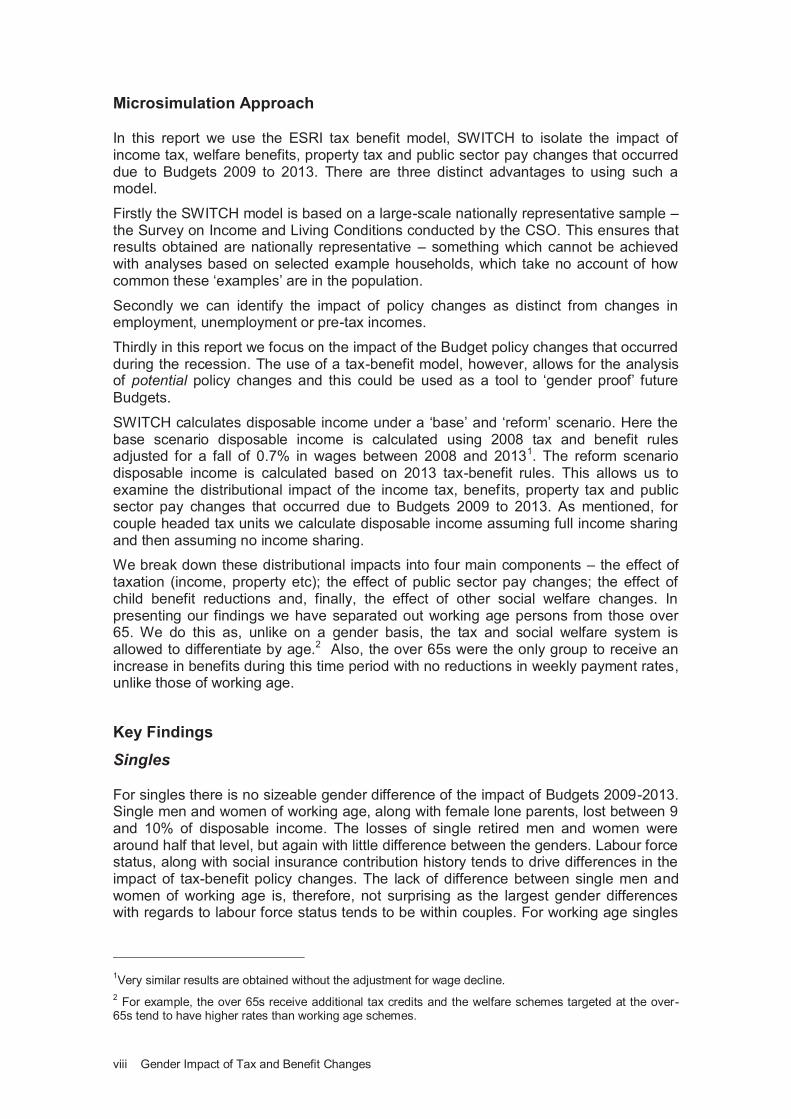
Microsimulation Approach
In this report we use the ESRI tax benefit model, SWITCH to isolate the impact of income tax, welfare benefits, property tax and public sector pay changes that occurred due to Budgets 2009 to 2013. There are three distinct advantages to using such a model.
Firstly the SWITCH model is based on a large-scale nationally representative sample – the Survey on Income and Living Conditions conducted by the CSO. This ensures that results obtained are nationally representative – something which cannot be achieved with analyses based on selected example households, which take no account of how common these ‘examples’ are in the population.
Secondly we can identify the impact of policy changes as distinct from changes in employment, unemployment or pre-tax incomes.
Thirdly in this report we focus on the impact of the Budget policy changes that occurred during the recession. The use of a tax-benefit model, however, allows for the analysis of potential policy changes and this could be used as a tool to ‘gender proof’ future
Budgets.
SWITCH calculates disposable income under a ‘base’ and ‘reform’ scenario. Here the base scenario disposable income is calculated using 2008 tax and benefit rules adjusted for a fall of 0.7% in wages between 2008 and 20131. The reform scenario disposable income is calculated based on 2013 tax-benefit rules. This allows us to examine the distributional impact of the income tax, benefits, property tax and public sector pay changes that occurred due to Budgets 2009 to 2013. As mentioned, for couple headed tax units we calculate disposable income assuming full income sharing and then assuming no income sharing.
We break down these distributional impacts into four main components – the effect of taxation (income, property etc); the effect of public sector pay changes; the effect of child benefit reductions and, finally, the effect of other social welfare changes. In presenting our findings we have separated out working age persons from those over 65. We do this as, unlike on a gender basis, the tax and social welfare system is allowed to differentiate by age.2 Also, the over 65s were the only group to receive an increase in benefits during this time period with no reductions in weekly payment rates, unlike those of working age.
Key Findings
Singles
For singles there is no sizeable gender difference of the impact of Budgets 2009-2013. Single men and women of working age, along with female lone parents, lost between 9 and 10% of disposable income. The losses of single retired men and women were around half that level, but again with little difference between the genders. Labour force status, along with social insurance contribution history tends to drive differences in the impact of tax-benefit policy changes. The lack of difference between single men and women of working age is, therefore, not surprising as the largest gender differences with regards to labour force status tends to be within couples. For working age singles
1Very similar results are obtained without the adjustment for wage decline.
2 For example, the over 65s receive additional tax credits and the welfare schemes targeted at the over-
65s tend to have higher rates than working age schemes.
Gender Impact of Tax and Benefit Changes ix
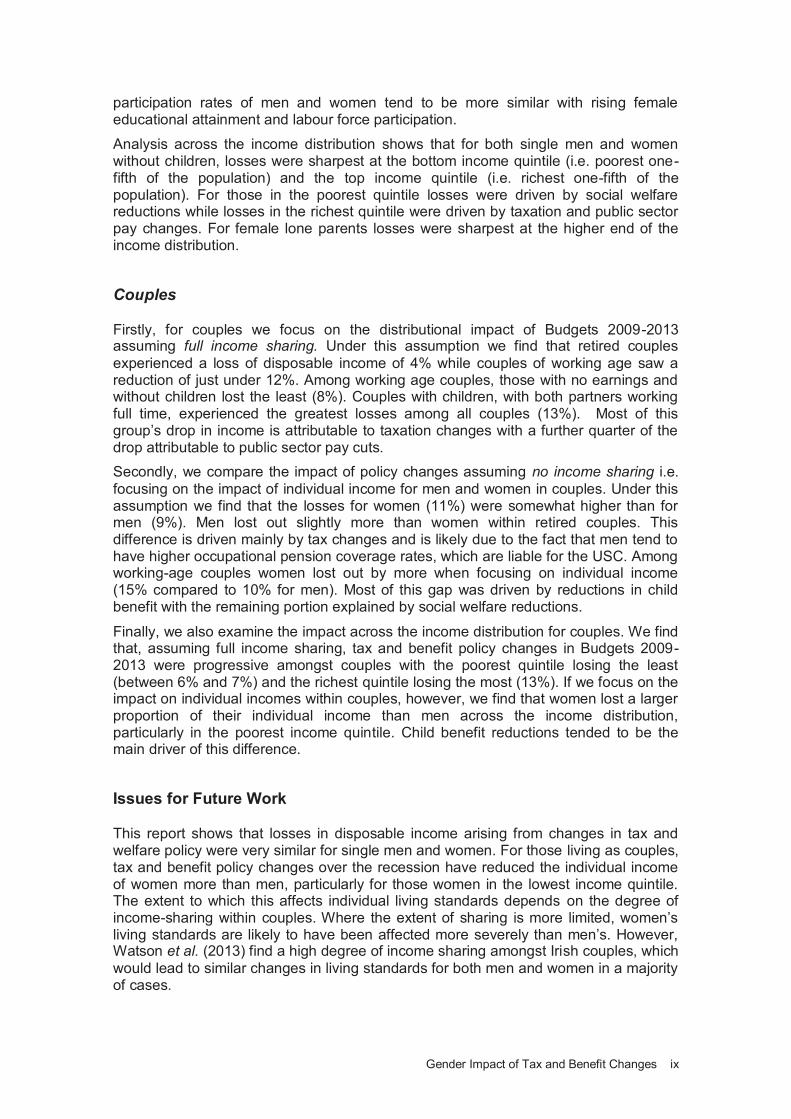
participation rates of men and women tend to be more similar with rising female educational attainment and labour force participation.
Analysis across the income distribution shows that for both single men and women without children, losses were sharpest at the bottom income quintile (i.e. poorest one-fifth of the population) and the top income quintile (i.e. richest one-fifth of the population). For those in the poorest quintile losses were driven by social welfare reductions while losses in the richest quintile were driven by taxation and public sector pay changes. For female lone parents losses were sharpest at the higher end of the income distribution.
Couples
Firstly, for couples we focus on the distributional impact of Budgets 2009-2013 assuming full income sharing. Under this assumption we find that retired couples
experienced a loss of disposable income of 4% while couples of working age saw a reduction of just under 12%. Among working age couples, those with no earnings and without children lost the least (8%). Couples with children, with both partners working full time, experienced the greatest losses among all couples (13%). Most of this group’s drop in income is attributable to taxation changes with a further quarter of the drop attributable to public sector pay cuts.
Secondly, we compare the impact of policy changes assuming no income sharing i.e.
focusing on the impact of individual income for men and women in couples. Under this assumption we find that the losses for women (11%) were somewhat higher than for men (9%). Men lost out slightly more than women within retired couples. This difference is driven mainly by tax changes and is likely due to the fact that men tend to have higher occupational pension coverage rates, which are liable for the USC. Among working-age couples women lost out by more when focusing on individual income (15% compared to 10% for men). Most of this gap was driven by reductions in child benefit with the remaining portion explained by social welfare reductions.
Finally, we also examine the impact across the income distribution for couples. We find that, assuming full income sharing, tax and benefit policy changes in Budgets 2009-2013 were progressive amongst couples with the poorest quintile losing the least (between 6% and 7%) and the richest quintile losing the most (13%). If we focus on the impact on individual incomes within couples, however, we find that women lost a larger proportion of their individual income than men across the income distribution, particularly in the poorest income quintile. Child benefit reductions tended to be the main driver of this difference.
Issues for Future Work
This report shows that losses in disposable income arising from changes in tax and welfare policy were very similar for single men and women. For those living as couples, tax and benefit policy changes over the recession have reduced the individual income of women more than men, particularly for those women in the lowest income quintile. The extent to which this affects individual living standards depends on the degree of income-sharing within couples. Where the extent of sharing is more limited, women’s living standards are likely to have been affected more severely than men’s. However, Watson et al. (2013) find a high degree of income sharing amongst Irish couples, which
would lead to similar changes in living standards for both men and women in a majority of cases.
x Gender Impact of Tax and Benefit Changes
The approach used here shows the potential for the use of a microsimulation model in assessing the gender impact of policy changes. Not only can past policy changes be examined with respect to their impact on income by gender but potential policy changes can also be examined ex-ante and would allow a gender impact assessment to be built in to the Budgetary process. The method used here could also be extended to analyse the impact of policy changes on the basis of other equality grounds such as disability or family status.
Gender Impact of Tax and Benefit Changes 1
1 GENDER IMPACT OF TAX AND BENEFIT CHANGES: A MICROSIMULATION APPROACH
1.1 Introduction
Tax and welfare policies have a major influence on individual and family incomes. The effects of tax and benefit policies on the overall distribution of income and the incidence of income poverty have been the subject of extensive analysis and discussion – both in Ireland and in the European Union. Of late, much effort has been devoted to establishing how the burden of austerity measures has been distributed across income groups (Callan et al., 2011 and Paulus et al., 2013). Far less is known, however, about the impact of tax and benefit policy changes on incomes by gender. This study breaks new ground in this area by conducting a systematic assessment of the gender impact of changes in tax and benefit policies. Our analysis examines how policy changes since the advent of Ireland’s Great Recession have affected the incomes of women and men.
It must be stressed that the focus in this report is on policy impacts not on the overall
impact of the Great Recession and associated policy responses.3 Initial analysis of overall impacts is contained in Callan et al. (2013). As well as tax and welfare measures, we include the impact of public sector pay changes, whether explicit (as in 2010 and 2013) or indirect (via the Pension Related Deduction in 2009). As a higher proportion of women are employed in the public sector it is important, from a gender perspective, to take changes in public sector pay into account over this unusual period.
We begin in Chapter 2 by reviewing the literature relevant to the assessment of gender impacts of tax and welfare policies. This includes a number of studies of gender impact, particularly those referring to taxes and benefits; and also some insights from the gender budgeting approach as well as a selection of relevant work from Ireland. We draw on this literature to develop the analytic framework used in this report, which is described in detail in Chapter 3.
Tax and benefit rules are required to be gender-neutral, in the sense that individuals who are identical except for their gender would receive exactly the same treatment. A gender-neutral system can, however, lead to differing impacts on women and men. This is because men and women differ in terms of many characteristics relevant to tax and welfare e.g., family status, income and hours of work. As a result, changes in policy, even if they are explicitly gender neutral, may have non-neutral impacts. In order to identify such differences, and to understand and interpret their import, it is necessary to have
a profile of the differences by gender in key characteristics relevant to the tax and welfare systems, based on a nationally representative sample of the population. This is provided in Chapter 4, as a backdrop to the empirical work which follows.
a tax-benefit model, which simulates the impact of policy changes on each family and individual (or “micro-unit”) within a nationally representative sample. We use SWITCH, the ESRI tax-benefit model, which is well suited to this purpose. The SWITCH model is based on data from CSO’s Survey on Income and Living Conditions (SILC 2010) and is used to analyse the impacts of tax and welfare
3 This is done by modelling the impact of policy changes on a representative sample of households using
the ESRI tax-benefit model, SWITCH – which allows a more accurate identification of policy affects than simply observing changes over time, which can be due to a range of factors.
2 Gender Impact of Tax and Benefit Changes
policies by gender. (The rationale behind the modelling approach is described in Chapter 3).
Chapter 5 looks at the impact of policy changes by gender over the full period of the “Great Recession”, specifically Budgets 2009 to 2013. This helps to identify whether austerity policies, in terms of tax and welfare, have had a greater impact on women or on men, or have been balanced. We examine first, the impact at tax unit level, distinguishing between single men and women, lone parents (predominantly but not exclusively women) and couples. In Chapter 6 we also draw out what the evidence can tell us about the impact of policy changes on the intra-household distribution of resources, using some analyses conducted at the level of individual incomes. The main findings and conclusions are drawn together in Chapter 7.
Gender Impact of Tax and Benefit Changes 3
2 INCOMES – ANALYSING THE GENDER DIMENSION
2.1 Introduction
Our main focus is on the implications of changes in tax and welfare policy for the disposable incomes of men and women. In order to establish a framework within which this topic can be analysed, we begin by considering the implications and interpretation of income differences between men and women, and between spouses and partners. We do not attempt here to review the literature on the growth of female participation in the Irish labour market, on gender differentials in the extent of part time working, gender differentials regarding the impact of the recession on employment rates or on gender differentials in hourly earnings. These issues are worthy of study in their own right, but are a “given” from the point of view of the current study. The backdrop of strong growth in women’s labour market participation is set out in an earlier Equality Research Series report (Russell et al., 2009); Russell, McGinnity and Kingston (2014) examine the impact of the recession on gender differences in employment; and the extent and sources of the gender wage gap in Ireland have been analysed by Callan et al. 2001 and McGuinness et al. 2009.
2.2 Gender Impact Assessment
The majority of analyses of income distribution are carried out at household level. The assumption in this approach – sometimes explicit, sometimes implicit - is that income is fully shared or “pooled” so that all household members enjoy the same standard of living. Sutherland (1997) points to two distinct reasons why this has been the dominant approach. First, she notes that “....in many circumstances it is the household that is the most appropriate unit to choose” as income pooling and shared decision making are
common within households. However, there is another reason: “the use of the household is also convenient, since the household budget surveys on which these
studies usually rely are organised at household level”. This combination may lead to an over-use of the household as a unit of analysis, and a neglect of the complex issues which arise in assessing the economic welfare of individuals.
While much of the analysis of intra-household incomes and income sharing is focused on couples, similar issues also arise in the context of adult children. Jones (1992) considers the “grey area between childhood dependence and adult independence” and her evidence from Scotland suggests that there is considerable variation in the nature of inter-generational income relationships.
Sutherland’s (1997) approach focuses “on income as it is received by individuals,
before any transfer, sharing or spending has taken place”. She notes that this is not to be taken as a measure of economic welfare, but maintains that cash income as received by individuals is of interest in its own right from two perspectives:
The distribution of cash income across household members can have a strong influence on the distribution of consumption
Differences in cash incomes “are likely to have implications for the economic autonomy of each individual as well as for the distribution of power and influence over decision-making within the household.”
A number of studies can be cited to confirm the first point. A seminal paper by Browning et al. (1994) developed a method of identifying how incomes affect outcomes given conventional family expenditure data. The basic assumption of this method was that household decision processes lead to efficient outcomes. They applied the method to a sample of Canadian couples with no children. They found that expenditure choices were influenced by the relative incomes of the partners, and by their relative ages. The
4 Gender Impact of Tax and Benefit Changes
level of lifetime wealth also played a role. Lundberg et al. (1997) looked at this issue from a different perspective. They found that there was a significant increase in expenditure on women’s and children’s clothing, relative to male clothing, when the UK changed from child tax allowances (typically received by fathers) to child benefit (usually received by mothers). This change should have had no effect on family expenditure according to the pooling hypothesis.
Analysis at the household level and assuming full income-sharing may, therefore, fail to accurately capture the impact tax and benefit changes may have on individual family members. Policy changes may be neutral at a household level but certain household members may lose while others may gain. The concept of income sharing assumes that welfare is the same regardless of which household member receives the income as income is pooled and expenditure determined in conjunction with other family members.
Bennett and Sutherland (2011) highlight the importance of access to independent income. They discuss the trend in the U.K. during the 1980s and 1990s of moving away from non-means tested social welfare (such as Jobseekers Benefit) and increased reliance on means-tested benefits. A move towards means-tested benefits affects both the level and intra-couple distribution of income: an individual’s entitlement may then be reduced because of the level of their partner’s income.
Research by the National Equality Panel (2010) in the UK, examined individual income receipt, following Sutherland’s approach. It highlighted the large differences in male and female employment income. They found that the median hourly wage for women was 21 per cent less than the median for men. Six out of ten men were in the top half of the hourly wage distribution as against four out of ten women. Due to differences in employment patterns by gender the median net income for women was less than two thirds of the male median. They point out the gender inequality masking effect that occurs once incomes are aggregated to household level.
Sutherland’s (1997) approach can be seen as the polar opposite of full income sharing. Essentially, in analysing individual incomes as they are received, it is an analysis with zero income-sharing - what Sutherland calls minimum income sharing. It is important to note that Sutherland states explicitly that this is not intended as a realistic measure of economic welfare:
“The minimum income sharing assumptions that have been employed in this analysis are not intended to be realistic: clearly, most households do share income to some extent. Our analysis itself provides evidence for this, since large numbers of women and some men would be living on resources at a level so low as to be unsustainable, were it not for sharing.”
The standard household approach pools all income received by members of the household, and divides by the number of “adult equivalents” – a scale designed to reflect the needs of households with different numbers of adults and children – to create income per adult equivalent, often termed equivalised income. The individual approach assigns income to the adult recipient of that income and assumes no income sharing occurs. Sutherland (1997) points out a major issue with regard to individual level analysis and the treatment of children. One approach is to treat children as individuals, like adults, in receipt of their own income. Doing this, however, would result in the lower end of the income distribution being dominated by children. A second option, used by Webb (1993) and Duncan, Giles and Webb (1994) allocate income (such as Child Benefit) which pertains to children while excluding them from the analysis. A third option, and the one used by Sutherland (1997), allocates income received by or on a child’s behalf to the person in the household assumed to be responsible for the child (the default is the mother or lone father) while adjusting this individual’s income by the number of children they are responsible for using the
Gender Impact of Tax and Benefit Changes 5
McClements equivalence scale. Attributing of children by default to their mother assumes no financial contribution by the father towards the costs associated with the child or children. This will serve to move more women to the lower end of the income distribution.
The differing methods of allocating child benefit used by these authors reflect a larger underlying problem. The extent and nature of sharing of income, and of allocation of responsibilities for expenditures is simply not observable in large scale representative datasets – and can be difficult to assess accurately even in small scale intensive studies. To take a simple example, a couple might adopt a rule which involved a particular level of income transfer from an earning partner to a non-earning partner, and a rule by which certain bills or expenses would be paid by each. Without knowing the nature of such an agreement, it is not possible to know which of the Child Benefit/child cost rules will best represent the situation – and it is possible that none of the three rules used by the different authors will do so.
This is not, however, a counsel of despair. There is another framework in which the Sutherland approach of individual incomes can be used and interpreted, and within which it will be possible to come to a more concrete assessment of the impact of policy. This framework involves viewing the household as made up of different decision makers so that outcomes are determined in a bargaining process. Much household level analysis follows the ‘unitary’ or ‘common preference’ model of family behaviour and assumes that members of the household pool their income. Expenditure may then be determined by consensus amongst family members (Samuelson 1956) or by a dominant family member (Becker 1981). Non-unitary models of family behaviour, which posit some form of bargaining or negotiation within the family, challenge this unitary approach. Tests of the underlying assumption of households behaving “as if” there were a single decision maker often reject that assumption. Lundberg et al. (1997) gives an overview of alternative approaches, such as models of cooperative bargaining, non-cooperative bargaining and the collective approach. Recent bargaining models are provided by Apps and Rees (2007) and Browning et al. (2010). As found by Lundberg (1997), it may be important to focus on who actually receives the income in order to
determine how income is spent and, therefore, what the welfare impact of policy changes that influence income may be. Even if the impact of income receipt is not currently an issue, it may have an influence later on, for example in terms of bargaining power in the event of marital breakdown.
In this context, the incomes as received by individual household members can be seen as a starting point. A common – but not universal – feature of bargaining models is that if an individual’s starting point is improved, his or her final bargained outcome is unlikely to disimprove, and may improve. If this is assumed, then we can analyse policy impacts in the following way. A policy which tends to equalise the incomes of spouses or partners would move them, if at all, towards a more equal outcome. A policy which tended to reinforce existing inequality in the incomes of spouses or partners would, by contrast, tend to lead to more unequal outcomes. In order to assess this, we must use the “zero income sharing” assumption to analyse incomes as received, both before and after the policy change of interest. We take this approach in Chapter 3.5.
Figari et al. (2011) address a similar question. They focus on the relative situation of co-resident husbands and wives, and ask: how much does the tax-benefit system contribute to the equalisation of the distribution of resources between husbands and wives? They analyse this issue for eight European countries, and find that the tax-benefit systems in Austria, Finland, the UK and France do most to equalise couple’s incomes.
Browne (2011) takes a different approach, which is also of interest. He does not attempt to attribute income to individuals. Rather the focus is on examining the
6 Gender Impact of Tax and Benefit Changes
distributional impact of budgets by gender for singles without children and for single parents and comparing gains or losses for these groups to households headed by a couple. Browne places ‘couple’ households into different categories (such as one and two earner) and looks at combinations of compositions such as male higher earner, female higher earner, female working part-time etc.). His analysis makes use of the IFS tax-benefit model, TAXBEN. The approach used by Browne (2011) gives some insights into gender differences in policy impact which do not depend on the sharing rules in operation by couples. The counterpart to this advantage is that his approach is mainly concerned with single persons (with or without children) and gives more limited insights into policy impact on couples.
Perceptions of Child Benefit as an independent income for women have been challenged on two grounds. The first is that while Child Benefit is paid, in general, to mothers, it is intended for the benefit of children. Thus, it is not intended to be a payment which is for women’s own needs. Second, it is given to women as the “main carer” and this labelling can have an impact. Daly and Rake (2003) argue that the fact that couples have to identify which one of them performs the “main carer” role may solidify the gendered division of labour and militate against a more equal sharing of care responsibilities between men and women.
2.3 Gender Budgeting
The term “Gender Budgeting” refers to a broad range of approaches with the common theme of identifying the differential impact of actual or proposed policies on women and men.4 Australia was the first country to carry out a gender budgeting exercise with the government publishing, in 1984, an audit of the impact of the federal budget on women. Many countries now carry out gender budgeting. Bellamy (2002) notes that there is wide diversity in the ways in which gender budgeting exercises are conducted, and in their scope. A broad definition can include three elements:
1. analysis – identifying the differential impact of policy 2. promotion of greater accountability for government’s commitments to gender
equality 3. achievement of greater gender equality through changes in policies
In this report, our focus is on the analytic component, drawing on insights from the gender budgeting approach. One key element in this is “strengthening the collection and analysis of gender-disaggregated data” (Bellamy, 2002) in order to enhance the ability to measure the real value of resources targeted towards men and women.
Klatzer (2008) notes that a common theme in gender budgeting is challenging the notion of the gender neutrality of budgets. Budgets are the result of political decisions about how much revenue is raised, the manner in which it is raised, and the way in which it is spent. Thus, Klatzer states, “the budget represents the power relations in a society”.
Some of the central components of gender budgeting are summarised by Bellamy: “Basically gender budgeting can involve analysing any form of public expenditure, or method of raising public money, from a gender perspective and identifying the implications and impacts for women and girls as compared to men and boys………
One key tool is gender impact assessment (GIA). GIA focuses analysis beyond the family or household level, looking at the individual, and extends beyond the public, paid economy to the more private, unpaid sphere in which women and their caring work
4 Differential impacts as between girls and boys are also within the scope of gender budgeting.
Gender Impact of Tax and Benefit Changes 7
predominate at present. Gender budgeting can be used in any phase of the budget cycle, from planning and identifying objectives and identifying the financial allocations to meet those objectives, to an evaluation of the extent to which these objectives have been met” (Bellamy, 2002, Section 1.4)
The present study can be characterised as a gender impact assessment of changes in direct tax and welfare policy, using disaggregated microdata which is gathered at individual and household level. The SWITCH model, however, has the scope to be used as a planning tool, analysing potential policy changes in advance of their implementation – or being used to inform debate and develop policy in an iterative fashion. Thus, the gender impact assessment conducted here opens up new possibilities for informing public debate and for the development of tax/transfer policy in a way which is sensitive to gender impacts.
Equality Budgeting Campaign (2012) argues for a similar approach to be adopted on a broader scale in Ireland, including “other equality categories, such as disability, age, or race” as well as gender. The approach taken in Scotland is broadly along these lines. The Scottish government publishes a draft budget, and an associated Equality Statement outlining the impact of the proposed budget for a number of equality categories including gender (Scottish Government, 2013). While there is much of interest in the Scottish approach, its relevance to the current study is greatly limited, as both tax and welfare are outside the remit of the Scottish parliament – policy on tax and on welfare are decided at Westminster. Thus, there is no assessment of tax or welfare changes in the Scottish draft budget equality statements, or in the Scottish government’s papers on how vulnerable groups are faring during the recession.
The approach adopted here could, however, be adapted to examine the impact of tax and welfare policy changes – proposed or actual – on a number of different dimensions, including disability, age and marital status.
2.4 Irish Studies
O’Connor and Murphy (2008) argue that the Irish social welfare system tends to be based on the male breadwinner/female caregiver model. Social welfare payments involve a ‘personal rate’ in respect of the person qualifying for the scheme, an increase for a qualified adult (IQA) (formerly known as an “adult dependant addition”) and a qualified child increase (QCI) in respect of dependent children. Increases for qualified adults are less than the personal rate and the payments (i.e. personal rate and increases for qualified adults/children) and are typically made to the principal claimant. O’Connor and Murphy (2008) discuss the impact the social welfare system has on women over their lifetime, in terms of their attachment to the labour market, access to independent income and the risk of living in poverty in old age. They highlight issues such as the limitation rule, whereby the social assistance payment received by two married or cohabiting adults, one entitled to a social assistance payment in their own right and one to either a social assistance or social insurance benefit, is capped at the rate payable to a couple where one person receives a personal rate of payment, and the other is a “qualified adult”. In practice this amounts to a payment which is about 15 per cent lower than two full personal rate payments. This takes account of economies of scale which are available to married and cohabiting couples; however O’Connor and Murphy point out that it reduces the financial incentive to access payments individually.
Cantillon and Nolan (2001) point out that feminist economics challenges the “income-pooling” implicit in most studies of household income distribution and poverty. This assumption neglects what goes on within families:
“This neglect is increasingly called into question by empirical studies rejecting the unitary approach to modelling household behaviour and by alternative theoretical
8 Gender Impact of Tax and Benefit Changes
approaches that model the behaviour of individuals within the household as, for example, cooperative or noncooperative bargaining games” (Cantillon and Nolan, 2001, p.5)
The key question here, as Cantillon and Nolan point out, is the degree to which income and resources are shared. A number of ways of investigating this issue have been pursued. Cantillon and Nolan used non-monetary indicators of deprivation, measured at individual level, to explore differences in living standards within households. Their study brought out the limitations of the traditionally used indicators of deprivation for this purpose, and pointed towards the need to develop alternative indicators which would be better designed to measure individual living standards.
Watson et al. (2013) provide new evidence on this matter, drawing on a module of the Survey on Income and Living Conditions which was specially designed to address these issues. They examine the arrangements through which couples (and multi-adult households) manage their finances from a number of different angles, using detailed data gathered in the special module of SILC. This module gathered information on the extent to which each partner “pooled” his or her income, allowing for 5 possible answers:
1. All of the individual’s personal income is pooled 2. More than half of the respondent’s personal income is pooled 3. About half of the individual’s income is pooled 4. Less than half of the individual’s income is pooled 5. None of the individual’s personal income is pooled.
The survey also gathered information on how a range of financial decisions were made – whether jointly, or more by one or other partner - in a wide range of areas including everyday shopping, children’s expenses, consumer durables and furniture, borrowing and saving.
This new and up-to-date dataset allows Watson et al. to derive unique insights into the nature and extent of income sharing within Irish households and couples, which have major implications for how the findings of our analyses of gender impacts of tax and welfare changes should be understood. It is worthwhile therefore, to summarise the features of the Watson et al. study which are of greatest importance in the present context. We focus in particular on results concerning couples within households, as 70 per cent of adults who live with other adults are living with a partner and it is within this group, rather than young adults, where the greatest potential arises for differential
gender impacts due to unequal sharing of incomes.5
The Watson et al. study6 indicates that a high share of both partners’ incomes was “pooled for common household expenses or savings or for other household member’s expenses or savings”. Overall some 86 per cent of men’s incomes were estimated as being pooled in this way, and some 77 per cent of women’s incomes. Typically the higher earner contributed a higher percentage, but the average male “contribution rate” for those with an income was within the range of 80 to 90 per cent. Thus, as Watson et al. point out “in couples where the female partner receives no income [...] male partners contribute an average of 90 per cent of their incomes for household use” (Watson et al., 2013, p.26).
There was also some variation in the male contribution rate along dimensions such as age, education, economic status and the work pattern of the couple. But again, on all of
5 Indeed, Watson et al.’s findings suggest that in broader multi-adult households there is considerably less
sharing or pooling of income by young adults, although there can be substantial within-household transfers from parents to adult children.
6 Watson et al. (2013), Table 3.6.
Gender Impact of Tax and Benefit Changes 9
these dimensions, the lower bound for the contribution rate was 80 per cent of men’s incomes, while the upper bound was 91 per cent. Typically for women, contribution rates were also high, in the region of 70 to 88 per cent.
The data gathered in the module did not permit a direct test of the extent to which couples agreed or disagreed on the reported levels of income pooling. However, there was a high degree of consistency between the answers of both partners regarding the making of financial decisions. Almost two-thirds of couples indicated that they shared responsibility for financial decisions. A further 20 per cent of couples were agreed that the female partner had high responsibility, with an additional 4 per cent agreeing that the male partner had higher responsibility. Thus, couples agreed on the characterisation of the level of responsibility for financial decisions in 88 per cent of cases.
Watson et al. also consider alternative perspectives, using data on the amounts of money retained under personal control rather than contributed to a common pool; data on spending patterns – including elements identified as for personal use; and indicators of individual living standards.
Looking first at “retained income”, Watson et al. find that after contributions to shared household expenses, male partners were left with an average of €82 per week, compared with a figure of €59 per week for women. Watson et al. point out that this does not take account of each individual’s access to income for personal use from the pooled income. Evidence on spending patterns suggests that amounts spent by men and women on “personal goods” (such as leisure, clothing, personal care, alcohol and tobacco) are very similar:
“Overall, [...] male and female partners spend similar amounts on themselves, on average (€35 per week), but women spend more on the children (€51 per week, on average, compared to €28 on average for men).” (Watson et al., 2013, p. 30). Note that spending on personal items and children can come from the total of retained income and the household pool of income.
Evidence based on deprivation indicators shows no evidence of a significant gender differential within couples. Watson et al. examine the extent to which male and female partners are doing without the following items, which can be attributed to individuals:7
doing without food
doing without heating
inability to afford a mobile telephone
inability to afford a morning/afternoon/evening out
not having money to spend on oneself.
They find that the gender differences in the incidence of deprivation on each of these items are small. This is also true when looking at the proportion of individuals who are deprived of at least one of the items.
Watson et al. conclude that there is no evidence that, on average, women experience higher levels of individual deprivation where they rely on the income and work of their partners. They find some evidence that men fare less well when they do not have an income or rely on the earnings of a female partner. As Watson et al point out, this may be influenced by the timing of the survey in 2010, coinciding with a major loss of employment particularly focused on male-dominated occupations and industries.
7 Many of the commonly used deprivation items can only be measured at household level and cannot
therefore differentiate between the experience of women and men. Watson et al. point out that this is a relatively small set of indicators, which could usefully be expanded in future.
10 Gender Impact of Tax and Benefit Changes
Overall, the findings from Watson et al.’s analysis of the special SILC module suggest that, for most couples, outcomes in terms of individual welfare lie a good deal closer to those which would be predicted by full income-sharing rather than outcomes strongly influenced by individual incomes. The opposite may hold for some couples, but the broad patterns found by Watson et al. suggest that such extremes are not widespread. Nevertheless, our analysis helps to identify the bounds on the gender impact of tax and welfare policy changes under the alternatives of full income sharing, and a bargain strongly influenced by individual incomes.
Finally, TASC (2011) used data from the anonymised microdata file (AMF) of the Survey of Income and Living Conditions as the basic source for analysis of budgetary impact. This basic approach has considerable merit, and is superior to the use of selected examples. There are, however, severe limitations in the TASC (2011) implementation. Some of these stem from the use of the anonymised data file which has a number of restrictions limiting its usefulness for this purpose. For example, the AMF has one variable for unemployment compensation, and cannot therefore identify Jobseeker’s Assistance and Jobseeker’s Benefit separately, nor can it identify public sector workers. These restrictions can be overcome by using the more detailed information in the Research Microdata File (RMF), which is the basis for the SWITCH model. The TASC analysis has further limitations in that it excludes self-employed persons, and focuses only on income from wages and from social transfers. Results presented in Chapter 5, based on the SWITCH model, are more comprehensive in these and in other respects.8 The inclusion of self employed persons is likely to affect the findings in the Irish case as the recession has had a particularly strong negative impact on the incomes of the self employed, of which the majority are male (according to the QNHS, at the end of 2012 of those in employment 24 per cent of males were self employed while just 7 per cent of females were). In addition to this the PRSI regime for the self-employed is different from that for employees.
8 For example, the SWITCH model takes account of both mortgage interest tax relief and the tax relief at
source on health insurance premia; neither is included in the TASC (2011) analysis.
Gender Impact of Tax and Benefit Changes 11
3 ASSESSING GENDER IMPACTS OF TAX AND WELFARE POLICY CHANGES: A MICROSIMULATION APPROACH
3.1 Introduction
The effects of policy changes are often examined using examples based on selected hypothetical families. For example, the budget is often examined in the context of its impact on single, childless individuals, lone parents, one-earner couples with two children etc. There are two main issues with this approach. Firstly, there is likely to be great diversity within these groups in terms of how they will be affected by tax and benefit changes, such as differing income levels, housing tenure status, age of children and other factors affecting their tax-benefit position. Secondly, this type of analysis takes no account of how common these groups are in society. Some tax unit types may be more strongly affected by policy changes but may only make up a small percentage of the population. Therefore, average losses/gains of policy changes may mask larger impacts for some groups over others. It is therefore important to consider not only how big the impact of policy changes are for certain groups but also how common these groups are.
The best practice approach, widely used internationally, is to start with detailed data on a nationally representative survey of households and to simulate the tax liabilities and benefit entitlements of those households under the alternative tax-benefit systems, existing, past or proposed. This “microsimulation” approach is described in Chapter 3.2, as applied in the Irish context. Chapter 3.3 then turns to an examination of the implications of some alternative mechanisms for the sharing of income and resources between husbands and wives, or cohabiting partners, when attempting to assess the gender impact of budgetary changes.
3.2 Tax Benefit Models
For these reasons the analysis will be carried out using the ESRI’s tax-benefit model, SWITCH (Simulating Welfare and Income Tax Changes). Tax-benefit models are based on large-scale nationally representative samples of households. This ensures that the models represent as fully as possible the great diversity of household circumstances relevant to tax and social welfare. SWITCH allows for the examination of the impact of budget changes on the self employed as well as employees. The model is currently based on the CSO’s Survey on Income and Living Conditions (SILC) for 2010. For the purpose of budgetary analysis, these data are adjusted and up-rated to represent the situation in the current budgetary year. The main use of the model will be the estimation of the pattern of gains and losses from the Budgets 2009-2013. The numbers of families (tax units) gaining and losing and the size of their gains and losses can be estimated, and the distribution of gains and losses across family types and income levels can be explored.
Keane et al. (2012) describe how the model dataset was constructed from the CSO’s Research Microdata File. The Survey on Income and Living Conditions contains a great deal of relevant information pertaining to the computation of taxes and benefits. The ESRI team prepares a special dataset based on SILC which contains key variables needed for the analysis, including:
age and gender for each individual
marital status
number and ages of children
housing tenure
employment status (including public/private sector)
12 Gender Impact of Tax and Benefit Changes
earnings from employment and self-employment
occupational pension income
receipt of social welfare benefit
mortgage payments
As mentioned, the data are uprated and weighted to be representative of the final year under analysis – in this case 2013. The SILC data does not contain information on expenditure or wealth, therefore changes in value added and capital gains taxes cannot be included in the analysis. The data does, however, contain information on property values so the impact of the property tax introduction is included in our analysis.
The calibration of the model includes the estimation of sample weights which ensure that the distribution of gross income for both PAYE taxpayers and the self-employed are closely aligned with results from Revenue Commissioners statistics. Validation checks also show good coverage of the main social welfare schemes. It is this adjusted data which is used for model-based analysis.
The measurement of policy impact requires that disposable income be simulated under the rules of actual policy, and under an alternative policy. Tax and social insurance liabilities (if any) are calculated for each individual in the nationally representative sample. Similarly, the model simulates any entitlement to contributory and non-contributory benefits, on the basis of detailed individual level information in the CSO’s Survey on Income and Living Conditions. These liabilities and entitlements are based on their current income receipt and labour market status as well as any other factors relevant in the calculation of taxes and benefits (such as age, marital status, number of children etc). Results are aggregated to, and generally presented at, tax unit or household level. Here we also make use of the individual level income information.
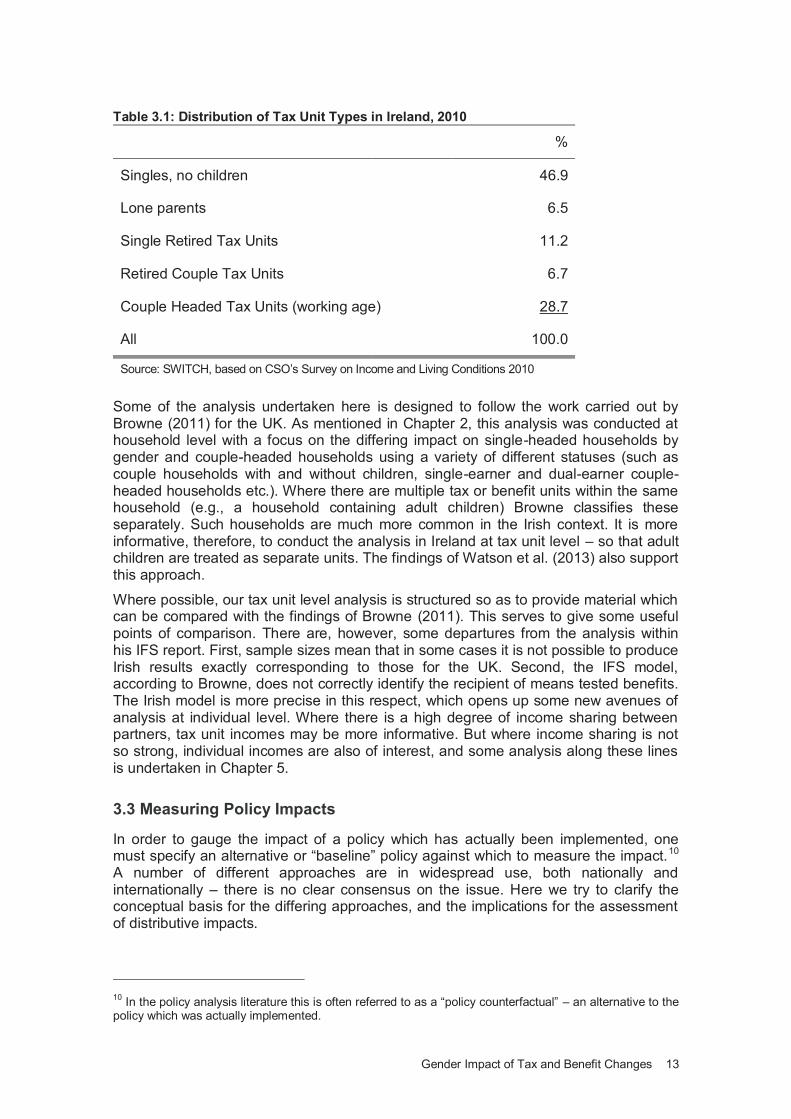
Table 3.1 shows the distribution of ‘tax unit’ categories, illustrating one dimension of the diversity referred to in Chapter 3.1 . A tax unit differs from a household in that it represents a married or cohabiting9 couple or single person, together with all of their children aged less than 18. For singles, who form about 65 per cent of all tax units, comparisons of the impact of policy changes on income are relatively straightforward. For couples (about 35 per cent of all tax units), the issues are a good deal more complex, as we shall see in the next Chapter. The most common type of tax unit is a single person, of working age, with no children – almost half of all tax units fall into that category.
9 Regarding individual/joint taxation SWITCH assumes that all married people opt to be taxed in the
manner that is most beneficial financially to them. Despite the fact that cohabiting partners are taxed separately, their income will be taken into account for social welfare means tests. They are therefore classified as being in the same ‘tax unit’. Adults living in the same household who are not in a relationship (e.g. house shares, adult children living with parents) are treated as separate tax units.
Gender Impact of Tax and Benefit Changes 13
Table 3.1: Distribution of Tax Unit Types in Ireland, 2010
%
Singles, no children 46.9
Lone parents 6.5
Single Retired Tax Units 11.2
Retired Couple Tax Units 6.7
Couple Headed Tax Units (working age) 28.7
All 100.0
Source: SWITCH, based on CSO’s Survey on Income and Living Conditions 2010
Some of the analysis undertaken here is designed to follow the work carried out by Browne (2011) for the UK. As mentioned in Chapter 2, this analysis was conducted at household level with a focus on the differing impact on single-headed households by gender and couple-headed households using a variety of different statuses (such as couple households with and without children, single-earner and dual-earner couple-headed households etc.). Where there are multiple tax or benefit units within the same household (e.g., a household containing adult children) Browne classifies these separately. Such households are much more common in the Irish context. It is more informative, therefore, to conduct the analysis in Ireland at tax unit level – so that adult children are treated as separate units. The findings of Watson et al. (2013) also support this approach.
Where possible, our tax unit level analysis is structured so as to provide material which can be compared with the findings of Browne (2011). This serves to give some useful points of comparison. There are, however, some departures from the analysis within his IFS report. First, sample sizes mean that in some cases it is not possible to produce Irish results exactly corresponding to those for the UK. Second, the IFS model, according to Browne, does not correctly identify the recipient of means tested benefits. The Irish model is more precise in this respect, which opens up some new avenues of analysis at individual level. Where there is a high degree of income sharing between partners, tax unit incomes may be more informative. But where income sharing is not so strong, individual incomes are also of interest, and some analysis along these lines is undertaken in Chapter 5.
3.3 Measuring Policy Impacts
In order to gauge the impact of a policy which has actually been implemented, one must specify an alternative or “baseline” policy against which to measure the impact.10 A number of different approaches are in widespread use, both nationally and internationally – there is no clear consensus on the issue. Here we try to clarify the conceptual basis for the differing approaches, and the implications for the assessment of distributive impacts.
10
In the policy analysis literature this is often referred to as a “policy counterfactual” – an alternative to the policy which was actually implemented.
14 Gender Impact of Tax and Benefit Changes
One common approach is to identify the “no policy change” scenario with the default or automatic policy rule. This is the broad approach taken by Avram et al. (2013) in a study of the impact of austerity policies. In the Irish case, this would mean that welfare payments would be frozen in nominal terms, and likewise income tax and PRSI parameters would remain unchanged in nominal money values. In other countries, the automatic policy rule could include automatic indexation of welfare payments and/or money value tax parameters (such as tax credits or allowances, and tax bands) in line with price indexation. In some countries the default rule would include automatic indexation of some welfare payments in line with wage growth e.g., in the UK, from 1975 to 1980, the basic state pension was indexed in line with the higher of national average earnings growth or price inflation (Bozio et al., 2010)
It is clear, therefore, that the default policy varies across countries, and can also vary over time. For example, until the 1970s, the default option for tax allowances in the UK was that they remained frozen in nominal terms. The Rooker-Wise amendment in 1977 responded to the fiscal drag which had been a feature of a period of rapid inflation by linking changes in tax allowances to price inflation. Thus, the use of a “policy-based” benchmark such as the “default policy option” means that measurement of policy impact is affected by changes in the default policy over time and by differences in the default policy across countries.
A further drawback of the use of a default policy as a benchmark for evaluating policy impact can be illustrated by a simple thought experiment. Suppose a new government came to power on a platform which involved making very deep cuts in welfare payments. It could, for example, set the default policy to be a 5 per cent cut in welfare payment rates in each year. Now if it simply implemented these pre-announced cuts, a measure of policy impact based on default policy would say that each budget had no
effect – because the policy change was in the default setting rather than announced on Budget day. This would occur despite the fact that such a policy would impose major income losses on welfare recipients. On the other hand, if it retained a simple default policy of keeping payments frozen in nominal terms, but implemented the same deep cuts over the same time period, policy impact would be measured (relative to default policy) as involving substantial losses for welfare recipients every year. This reductio ad absurdum helps to highlight the drawbacks of the “default policy” approach. In
practice, the range of actual default policies is rather narrower. The usual rules considered fall into three categories and range from freezing tax and welfare parameters in nominal terms, indexing them in line with price inflation, and indexing them in line with wage growth. The conceptual issues are similar, however: the use of default policy as a benchmark means that the measured impact of policy depends on how actual policy changes are split between default rules and discretionary policy changes.
In assessing the impact on the income distribution of the tax and welfare measures introduced in a particular budget, one therefore needs a benchmark against which to assess the policies the Minister actually announces. Callan et al. (2001 and 2006) and Bargain and Callan (2010) argue that the wage-indexed budget provides a better yardstick against which to measure the distributional impact of budgetary policy, and has a strong claim on our attention. For this reason our subsequent analyses use a benchmark policy that is indexed in line with wage inflation. This approach is in line with previous analyses of the distributional impact of Irish budgetary policies such as Callan et al. (2013) and Callan et al. (2012). It may be noted that analyses on the basis
of either a nominal freeze on tax and welfare parameters, a “price-indexed” policy, or a “wage-indexed” policy, would arrive at very similar results because the expected change in wages is a reduction of just 0.7 percent in the time period examined here.
Gender Impact of Tax and Benefit Changes 15
3.4 Intra-household Resource Allocation
Just over 1 in 3 of all tax units are headed by couples. Is it possible, with the data gathered by SILC, to assess the likely impact of tax and benefit policy changes on men and women in couples? Most of the analysis of income distribution tends to operate at the level of the household, using the disposable income of the household as an indicator of the living standard for all household members. Implicitly this assumes that there is perfect sharing of resources within the household - an assumption which may approximate the truth in some cases, but not in others. Some of the literature reviewed in Chapter 2 has tested this assumption, and found that it does not hold.
The information available to most household surveys, including SILC, does not identify the living standards of male and female members of couples. It does identify the incomes as they come into the household, in terms of who has an individual income, what source it comes from, and how much it is. We can analyse how these individual incomes are affected by changes in tax and benefit policy. But these individual incomes cannot be regarded as a clear guide to individual living standards: to use them as such would imply that there is no sharing of incomes within the couple. The evidence from Watson et al. (2013) points towards a substantial amount of income sharing within couples.
Identifying the degree of income sharing within couples is a very challenging task, and well outside the scope of the present study. There are many ways in which couples manage their finances, resulting in different outcomes in terms of command over resources. This includes mechanisms for the sharing of income (e.g., through the use of joint accounts) and - just as important - the allocation of expenditures (e.g., assigning the payment of childcare expenses to one partner, and of utility bills to the other).
While we cannot identify sharing rules in the present study, some simple characterisations of alternative sharing rules can help to inform our analysis how the impact of policy changes on individual incomes can be moderated in terms of eventual outcomes for individual command over resources.
One form of sharing rule is the following. Let each partner obtain a proportion (say , or the “income sharing factor”) of his or her partner’s earnings, and therefore retain a
proportion (1 - ) of his or her own earnings. Equal sharing would occur when is 0.5
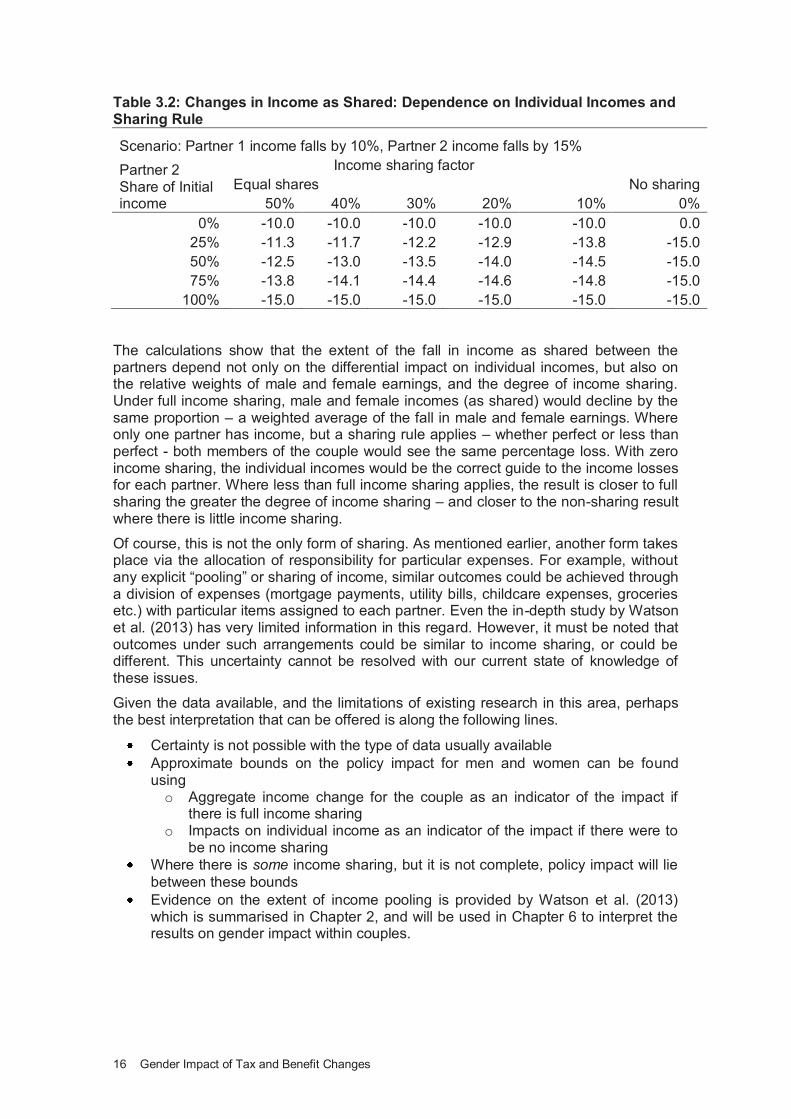
(50%). Zero income sharing would occur when is zero, in which case each partner simply retains his or her own earnings. Table 3.3 then illustrates a scenario in which tax and welfare policy leads to different reductions in income for each partner: 10 per cent for one, and 15 per cent for the other. The table investigates the impact on Partner 2’s income after the sharing rule applies – exploring the impact of full sharing to zero income sharing, and of the relative size of the partners’ earnings
16 Gender Impact of Tax and Benefit Changes
Table 3.2: Changes in Income as Shared: Dependence on Individual Incomes and Sharing Rule
Scenario: Partner 1 income falls by 10%, Partner 2 income falls by 15%
Partner 2 Share of Initial income
Income sharing factor
Equal shares
No sharing
50% 40% 30% 20% 10% 0%
0% -10.0 -10.0 -10.0 -10.0 -10.0 0.0
25% -11.3 -11.7 -12.2 -12.9 -13.8 -15.0
50% -12.5 -13.0 -13.5 -14.0 -14.5 -15.0
75% -13.8 -14.1 -14.4 -14.6 -14.8 -15.0
100% -15.0 -15.0 -15.0 -15.0 -15.0 -15.0
The calculations show that the extent of the fall in income as shared between the partners depend not only on the differential impact on individual incomes, but also on the relative weights of male and female earnings, and the degree of income sharing. Under full income sharing, male and female incomes (as shared) would decline by the same proportion – a weighted average of the fall in male and female earnings. Where only one partner has income, but a sharing rule applies – whether perfect or less than perfect - both members of the couple would see the same percentage loss. With zero income sharing, the individual incomes would be the correct guide to the income losses for each partner. Where less than full income sharing applies, the result is closer to full sharing the greater the degree of income sharing – and closer to the non-sharing result where there is little income sharing.
Of course, this is not the only form of sharing. As mentioned earlier, another form takes place via the allocation of responsibility for particular expenses. For example, without any explicit “pooling” or sharing of income, similar outcomes could be achieved through a division of expenses (mortgage payments, utility bills, childcare expenses, groceries etc.) with particular items assigned to each partner. Even the in-depth study by Watson et al. (2013) has very limited information in this regard. However, it must be noted that outcomes under such arrangements could be similar to income sharing, or could be different. This uncertainty cannot be resolved with our current state of knowledge of these issues.
Given the data available, and the limitations of existing research in this area, perhaps the best interpretation that can be offered is along the following lines.
Certainty is not possible with the type of data usually available
Approximate bounds on the policy impact for men and women can be found using o Aggregate income change for the couple as an indicator of the impact if
there is full income sharing o Impacts on individual income as an indicator of the impact if there were to
be no income sharing
Where there is some income sharing, but it is not complete, policy impact will lie
between these bounds
Evidence on the extent of income pooling is provided by Watson et al. (2013) which is summarised in Chapter 2, and will be used in Chapter 6 to interpret the results on gender impact within couples.
Gender Impact of Tax and Benefit Changes 17
4 A PROFILE OF GENDER DIFFERENCES RELEVANT TO TAX AND WELFARE
4.1 Introduction
The tax and welfare systems treat men and women equally from the point of view that gender does not come into play when deciding eligibility for tax credits and social welfare payments (excluding maternity benefit). Budget changes can affect men and women differently, however, due to the fact that men and women tend to carry out different roles from both a societal and economic perspective. For example, many countries have a division of labour by gender with men tending to be the main earner while women are more often found on home duties or engaged in part-time work. Therefore, policy changes that are explicitly gender neutral can have differing impacts by gender.
4.2 Gender Differences in Key Characteristics
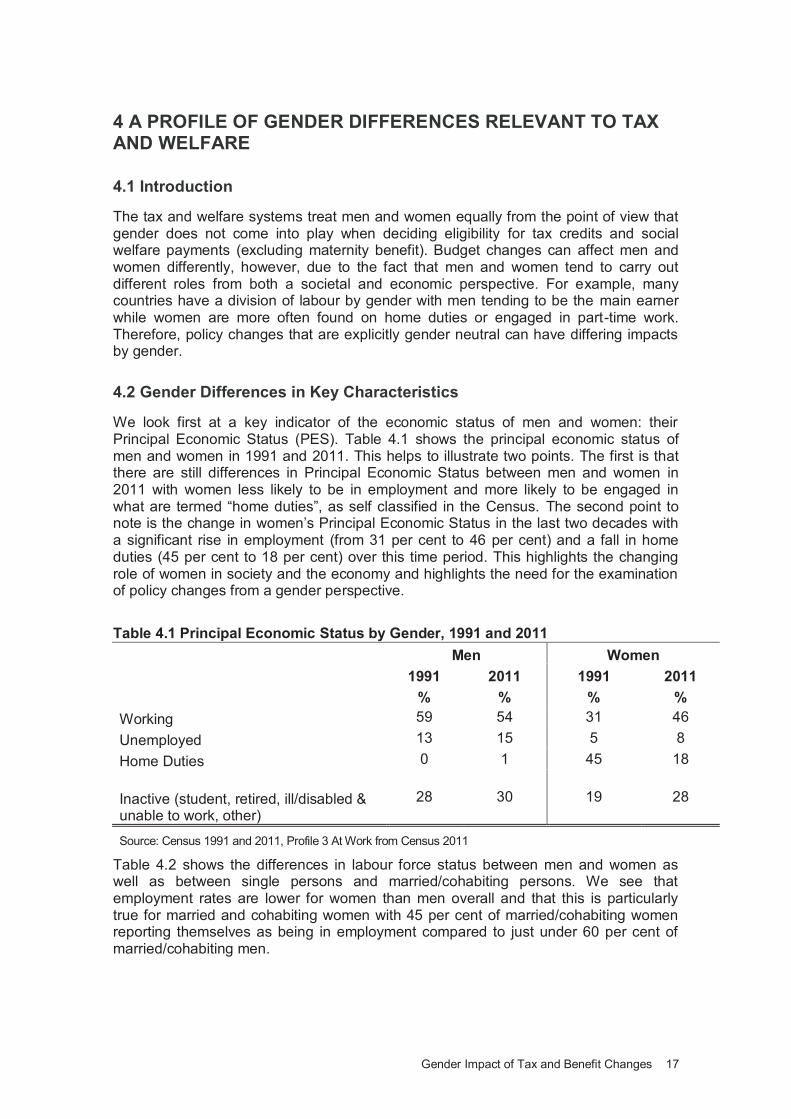
We look first at a key indicator of the economic status of men and women: their Principal Economic Status (PES). Table 4.1 shows the principal economic status of men and women in 1991 and 2011. This helps to illustrate two points. The first is that there are still differences in Principal Economic Status between men and women in 2011 with women less likely to be in employment and more likely to be engaged in what are termed “home duties”, as self classified in the Census. The second point to note is the change in women’s Principal Economic Status in the last two decades with a significant rise in employment (from 31 per cent to 46 per cent) and a fall in home duties (45 per cent to 18 per cent) over this time period. This highlights the changing role of women in society and the economy and highlights the need for the examination of policy changes from a gender perspective.
Table 4.1 Principal Economic Status by Gender, 1991 and 2011
Men Women
1991 2011 1991 2011
% % % %
Working 59 54 31 46
Unemployed 13 15 5 8
Home Duties 0 1 45 18
Inactive (student, retired, ill/disabled & unable to work, other)
28 30 19 28
Source: Census 1991 and 2011, Profile 3 At Work from Census 2011
Table 4.2 shows the differences in labour force status between men and women as well as between single persons and married/cohabiting persons. We see that employment rates are lower for women than men overall and that this is particularly true for married and cohabiting women with 45 per cent of married/cohabiting women reporting themselves as being in employment compared to just under 60 per cent of married/cohabiting men.
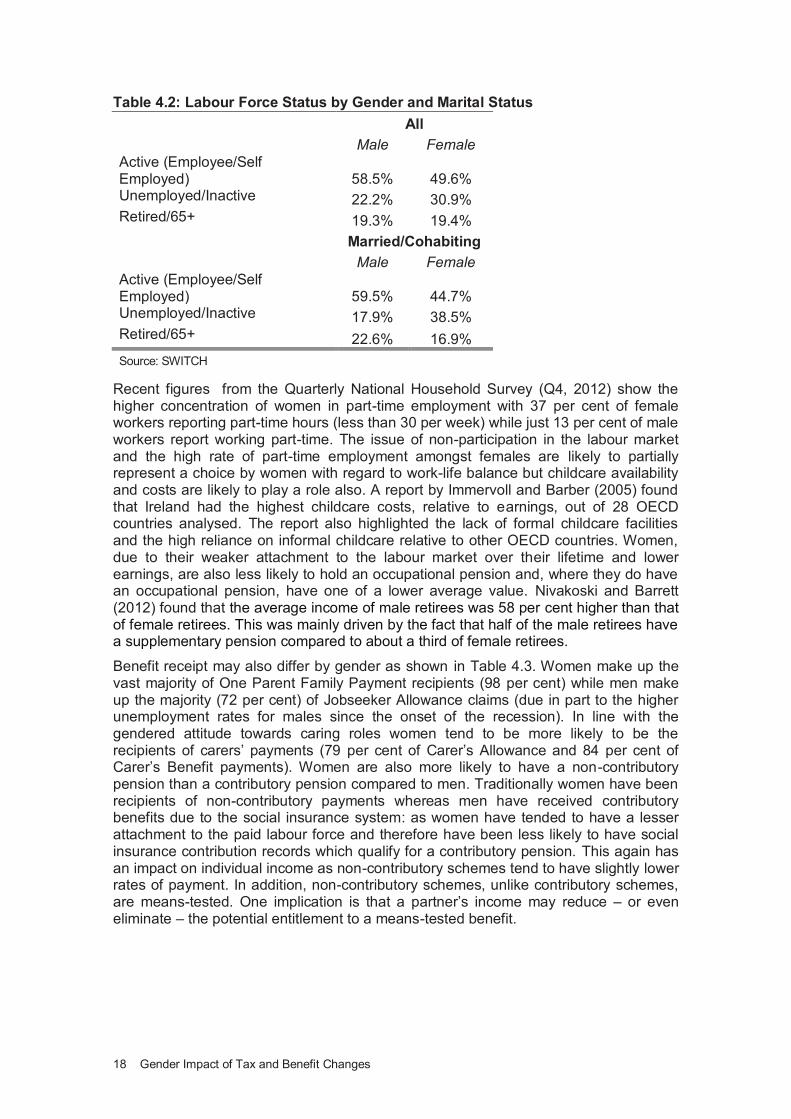
18 Gender Impact of Tax and Benefit Changes
Table 4.2: Labour Force Status by Gender and Marital Status
All
Male Female Active (Employee/Self Employed) 58.5% 49.6% Unemployed/Inactive 22.2% 30.9% Retired/65+ 19.3% 19.4%
Married/Cohabiting
Male Female Active (Employee/Self Employed) 59.5% 44.7% Unemployed/Inactive 17.9% 38.5% Retired/65+ 22.6% 16.9%
Source: SWITCH
Recent figures from the Quarterly National Household Survey (Q4, 2012) show the higher concentration of women in part-time employment with 37 per cent of female workers reporting part-time hours (less than 30 per week) while just 13 per cent of male workers report working part-time. The issue of non-participation in the labour market and the high rate of part-time employment amongst females are likely to partially represent a choice by women with regard to work-life balance but childcare availability and costs are likely to play a role also. A report by Immervoll and Barber (2005) found that Ireland had the highest childcare costs, relative to earnings, out of 28 OECD countries analysed. The report also highlighted the lack of formal childcare facilities and the high reliance on informal childcare relative to other OECD countries. Women, due to their weaker attachment to the labour market over their lifetime and lower earnings, are also less likely to hold an occupational pension and, where they do have an occupational pension, have one of a lower average value. Nivakoski and Barrett (2012) found that the average income of male retirees was 58 per cent higher than that of female retirees. This was mainly driven by the fact that half of the male retirees have a supplementary pension compared to about a third of female retirees.
Benefit receipt may also differ by gender as shown in Table 4.3. Women make up the vast majority of One Parent Family Payment recipients (98 per cent) while men make up the majority (72 per cent) of Jobseeker Allowance claims (due in part to the higher unemployment rates for males since the onset of the recession). In line with the gendered attitude towards caring roles women tend to be more likely to be the recipients of carers’ payments (79 per cent of Carer’s Allowance and 84 per cent of Carer’s Benefit payments). Women are also more likely to have a non-contributory pension than a contributory pension compared to men. Traditionally women have been recipients of non-contributory payments whereas men have received contributory benefits due to the social insurance system: as women have tended to have a lesser attachment to the paid labour force and therefore have been less likely to have social insurance contribution records which qualify for a contributory pension. This again has an impact on individual income as non-contributory schemes tend to have slightly lower rates of payment. In addition, non-contributory schemes, unlike contributory schemes, are means-tested. One implication is that a partner’s income may reduce – or even eliminate – the potential entitlement to a means-tested benefit.
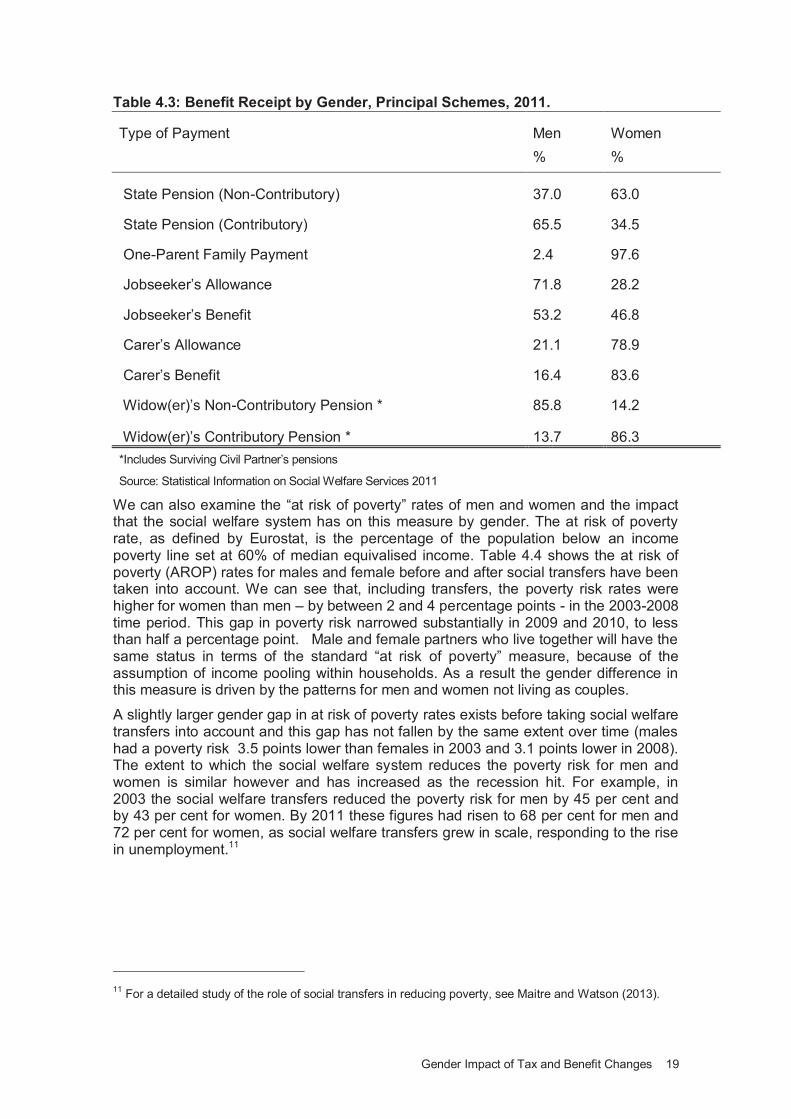
Gender Impact of Tax and Benefit Changes 19
Table 4.3: Benefit Receipt by Gender, Principal Schemes, 2011.
Type of Payment Men Women
% %
State Pension (Non-Contributory) 37.0 63.0
State Pension (Contributory) 65.5 34.5
One-Parent Family Payment 2.4 97.6
Jobseeker’s Allowance 71.8 28.2
Jobseeker’s Benefit 53.2 46.8
Carer’s Allowance 21.1 78.9
Carer’s Benefit 16.4 83.6
Widow(er)’s Non-Contributory Pension * 85.8 14.2
Widow(er)’s Contributory Pension * 13.7 86.3
*Includes Surviving Civil Partner’s pensions
Source: Statistical Information on Social Welfare Services 2011
We can also examine the “at risk of poverty” rates of men and women and the impact that the social welfare system has on this measure by gender. The at risk of poverty rate, as defined by Eurostat, is the percentage of the population below an income poverty line set at 60% of median equivalised income. Table 4.4 shows the at risk of poverty (AROP) rates for males and female before and after social transfers have been taken into account. We can see that, including transfers, the poverty risk rates were higher for women than men – by between 2 and 4 percentage points - in the 2003-2008 time period. This gap in poverty risk narrowed substantially in 2009 and 2010, to less than half a percentage point. Male and female partners who live together will have the same status in terms of the standard “at risk of poverty” measure, because of the assumption of income pooling within households. As a result the gender difference in this measure is driven by the patterns for men and women not living as couples.
A slightly larger gender gap in at risk of poverty rates exists before taking social welfare transfers into account and this gap has not fallen by the same extent over time (males had a poverty risk 3.5 points lower than females in 2003 and 3.1 points lower in 2008). The extent to which the social welfare system reduces the poverty risk for men and women is similar however and has increased as the recession hit. For example, in 2003 the social welfare transfers reduced the poverty risk for men by 45 per cent and by 43 per cent for women. By 2011 these figures had risen to 68 per cent for men and 72 per cent for women, as social welfare transfers grew in scale, responding to the rise in unemployment.11
11
For a detailed study of the role of social transfers in reducing poverty, see Maitre and Watson (2013).
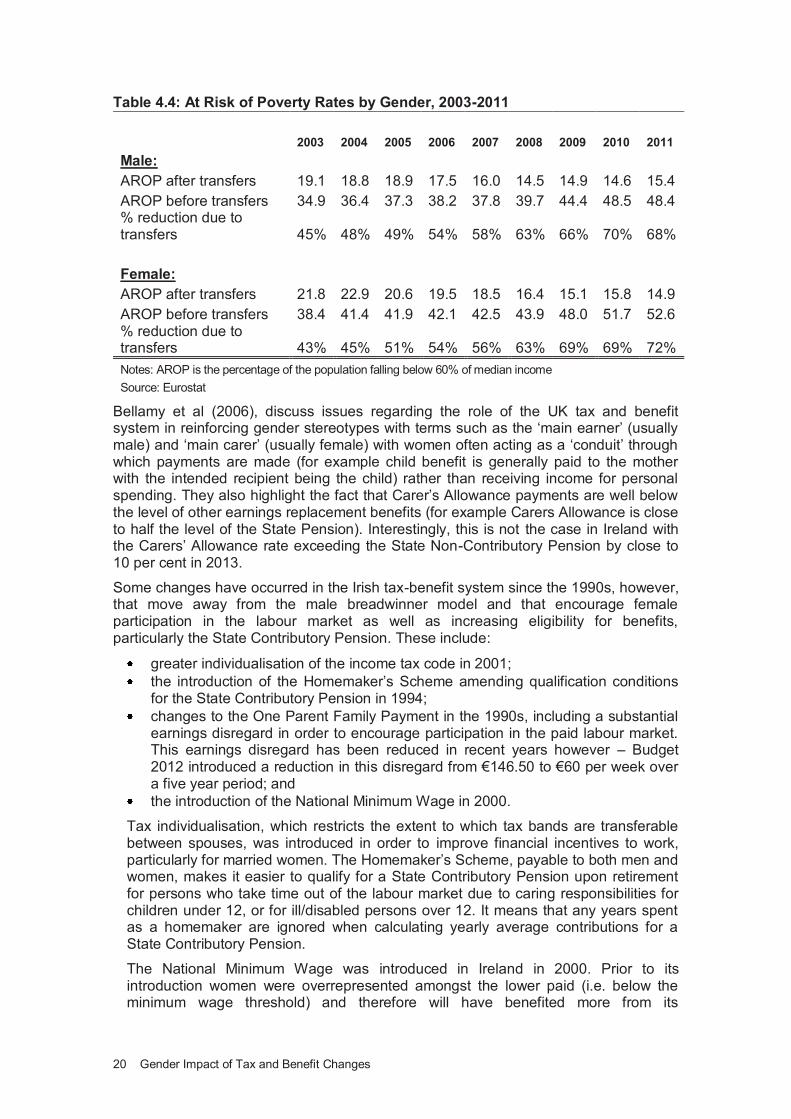
20 Gender Impact of Tax and Benefit Changes
Table 4.4: At Risk of Poverty Rates by Gender, 2003-2011
2003 2004 2005 2006 2007 2008 2009 2010 2011
Male:
AROP after transfers 19.1 18.8 18.9 17.5 16.0 14.5 14.9 14.6 15.4
AROP before transfers 34.9 36.4 37.3 38.2 37.8 39.7 44.4 48.5 48.4 % reduction due to transfers 45% 48% 49% 54% 58% 63% 66% 70% 68%
Female:
AROP after transfers 21.8 22.9 20.6 19.5 18.5 16.4 15.1 15.8 14.9
AROP before transfers 38.4 41.4 41.9 42.1 42.5 43.9 48.0 51.7 52.6 % reduction due to transfers 43% 45% 51% 54% 56% 63% 69% 69% 72%
Notes: AROP is the percentage of the population falling below 60% of median income Source: Eurostat
Bellamy et al (2006), discuss issues regarding the role of the UK tax and benefit system in reinforcing gender stereotypes with terms such as the ‘main earner’ (usually male) and ‘main carer’ (usually female) with women often acting as a ‘conduit’ through which payments are made (for example child benefit is generally paid to the mother with the intended recipient being the child) rather than receiving income for personal spending. They also highlight the fact that Carer’s Allowance payments are well below the level of other earnings replacement benefits (for example Carers Allowance is close to half the level of the State Pension). Interestingly, this is not the case in Ireland with the Carers’ Allowance rate exceeding the State Non-Contributory Pension by close to 10 per cent in 2013.
Some changes have occurred in the Irish tax-benefit system since the 1990s, however, that move away from the male breadwinner model and that encourage female participation in the labour market as well as increasing eligibility for benefits, particularly the State Contributory Pension. These include:
greater individualisation of the income tax code in 2001;
the introduction of the Homemaker’s Scheme amending qualification conditions for the State Contributory Pension in 1994;
changes to the One Parent Family Payment in the 1990s, including a substantial earnings disregard in order to encourage participation in the paid labour market. This earnings disregard has been reduced in recent years however – Budget 2012 introduced a reduction in this disregard from €146.50 to €60 per week over a five year period; and
the introduction of the National Minimum Wage in 2000.
Tax individualisation, which restricts the extent to which tax bands are transferable between spouses, was introduced in order to improve financial incentives to work, particularly for married women. The Homemaker’s Scheme, payable to both men and women, makes it easier to qualify for a State Contributory Pension upon retirement for persons who take time out of the labour market due to caring responsibilities for children under 12, or for ill/disabled persons over 12. It means that any years spent as a homemaker are ignored when calculating yearly average contributions for a State Contributory Pension.
The National Minimum Wage was introduced in Ireland in 2000. Prior to its introduction women were overrepresented amongst the lower paid (i.e. below the minimum wage threshold) and therefore will have benefited more from its
Gender Impact of Tax and Benefit Changes 21
introduction (see Nolan and McCormick, 1999; O’Neill et al, 2006) It is also likely to have played a part in the increase in female participation as employment became a more financially attractive option for those with a lower earnings potential.
Regarding social welfare payments, since 2002 pensioner couples have been able to choose to have the qualified adult portion of the pension paid direct to the spouse or partner. Direct payment of the qualified adult increase became mandatory for all new pension claims from September 2007. Couples may opt to receive a single payment but only where the qualified adult indicates that they do not wish to receive the payment directly.
These changes are coupled with factors such as rising female educational attainment and participation rates (female participation rates rose from 57 per cent to 67 per cent between 1998 and 2007; see Russell et al (2009) for more information). They are likely to have had an influence on the gender impact of the tax and benefit system as they will have increased access by women to independent income and eligibility for contributory benefits. Overall, in analysing the gender distributional impact of policy changes, it is important to bear in mind that policies which have a greater impact on the lower paid or certain types of benefit recipients (for example lone parents) will have a stronger effect on women than men due to their differing positions in society and the economy.
22 Gender Impact of Tax and Benefit Changes
5 GENDER IMPACTS OF TAX/ TRANSFER POLICY CHANGES: BUDGETS 2009-2013
5.1 Introduction
The broad framework for measurement of policy impact was discussed in Chapter 3.3. The issues involved in the selection of a “counterfactual” policy, against which to measure policy impact were examined. For reasons discussed there, we use the wage-indexed approach here. We now apply that framework, using SWITCH, the ESRI tax-benefit model, to assess the gender impact of tax and welfare policy changes in Budgets 2009-2013. The baseline scenario is therefore the set of tax-benefit rules in place in 2008, with a small downward adjustment (0.7 per cent) to tax and welfare parameters which are set in money terms. The reform or policy change scenario is the set of tax-benefit rules in place in 2013. As mentioned in Chapter 3.2 SILC data does not contain information on expenditure or wealth, therefore changes in value added and capital gains taxes cannot be examined. We can, however, examine a wide range of income tax, PRSI and social welfare changes over this time period as well as the introduction of a property tax and changes to public sector pay.
In this chapter we will examine the impact of these changes at tax unit level with a focus on gender and family type impacts12. The results will be broken down by the gender of the tax unit where possible i.e. for single headed tax units. In the next chapter we will examine the impact of these changes and how they differed by gender within couples.
The results will be examined for Budgets 2009-2013 as a whole. We also decompose the results into different types of policy changes, as discussed in Chapter 5.2. Finally, in Chapter 5.4 we examine the distributional impact of policy changes dividing the results into the impact of Budget 2009 only compared with the impact of Budgets 2010-2013 as a whole.
5.2 Policy Changes Budgets 2009-2013
The policy changes implemented by the Budgets 2009-2013 captured by SWITCH are summarised here. The changes which are covered by the model cover a high proportion of all changes in the areas of direct tax, levies, employee social insurance contributions, Universal Social Charge, and welfare payment rates (including Child Benefit).
In terms of tax and social insurance (PRSI) the SWITCH model covers the following policy changes:
The standard rate band (above which the higher tax rate of 41 per cent is payable) was reduced from €35,400 to €32,800 per annum.
Tax credits such as the PAYE, Personal, Lone Parent and Widowed credits fell by an average of 10 per cent.
The income exemption limit for those over 65 fell from €20,000 to €18,000.
The Age Tax Credit granted to the over-65’s fell from €325 to €254 a year.
Mortgages taken out since the end of 2012 no longer qualify for mortgage interest tax relief.
The Home Carer’s Tax Credit was reduced from €900 to €810.
12
Due to the issues discussed in Chapter 2.1 regarding income pooling an examination of the gender impact of policy changes is not completely separable from an examination of impacts by family type.
Gender Impact of Tax and Benefit Changes 23
The earnings limit above which no further tax relief for pension contributions is allowable fell from €275,239 to €115,000.
A charge of €200 per annum on second properties was introduced in 2009 with an owner-liable property tax introduced – on a half-year basis - in 201313.
PRSI for the self-employed rose from 3 per cent to 4 per cent.
PRSI allowances and income ceilings abolished.
An income levy was introduced in 2009 and subsequently combined with the Health Levy in 2011 in the form of the Universal Social Charge (USC), with rates ranging from 2 per cent-7 per cent depending on income.
Maternity Benefit became liable for tax in 2013.
PRSI relief on pension contributions was abolished.
On the social welfare side the SWITCH model covers the following policy changes:
Personal payment rates for most working-age schemes were reduced by 5 per cent (with an initial increase in 2009 more than offset by later reductions).
The State Pension was increased in 2009 and was not subsequently reduced in line with other schemes.
Payment rates for young people qualifying for Jobseeker’s Allowance were reduced sharply (for those aged 18 to 24).
Child Benefit rates were reduced substantially, and 18 year olds were no longer eligible for the payment.
Increases for qualified children, paid to claimants of social welfare payments, increased from €24 to €29.80 per week.
Maximum rent limits under the Rent Supplement scheme limits fell while the minimum monthly contribution from own resources rose to €30 for a single person and €35 for a couple.
The weekly income disregard for recipients of the One Parent Family payment fell from €146.50 to €110.
The income limits for Family Income Supplement rose between 3 and 11 per cent depending on the number of children in the household.
The Early Childcare Supplement scheme, worth €1,100 per annum for each child under 6, was abolished, while the Early Childhood Care and Education scheme was introduced, providing a free year of childcare/education to children between the ages of the 3 years 2 months and 4 years 7 months.
Public sector workers saw three additional reductions in disposable income which are taken into account in our analysis
Firstly, in 2009, a Pension Related Deduction was introduced, with an impact on pay ranging from 5 per cent to 10.5 per cent depending on income level.
Secondly explicit public sector pay cuts ranging from 5 per cent to 25 per cent (the extent of the cut rising with income) were implemented in 2010.
Thirdly further cuts to public sector pay and pensions set out in the Haddington Road Agreement. including reductions of 5.5 per cent on pay from €65,000 to €80,000, and greater reductions on higher pay.
Those in receipt of public sector pensions also saw reductions from 2011, ranging from 6-12 per cent for pensions under €100,000, up to 20 per cent on pensions above this level.
13
A deferral option for property tax exists for those on low incomes. However, indications to date suggest a low take-up of the deferral option. Even for those who do defer, it is important to recognise that this is a tax liability deferred (with interest) and not waived. For these reasons in our modelling we treat the tax as reducing in disposable income.
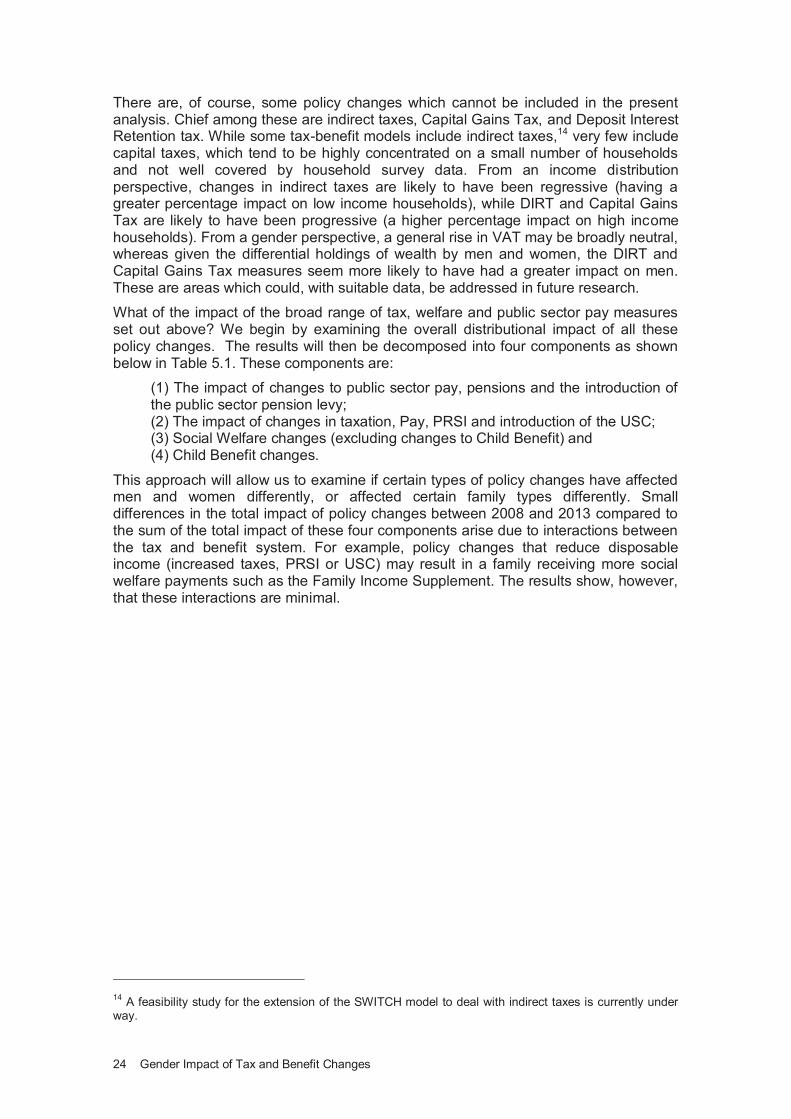
24 Gender Impact of Tax and Benefit Changes
There are, of course, some policy changes which cannot be included in the present analysis. Chief among these are indirect taxes, Capital Gains Tax, and Deposit Interest Retention tax. While some tax-benefit models include indirect taxes,14 very few include capital taxes, which tend to be highly concentrated on a small number of households and not well covered by household survey data. From an income distribution perspective, changes in indirect taxes are likely to have been regressive (having a greater percentage impact on low income households), while DIRT and Capital Gains Tax are likely to have been progressive (a higher percentage impact on high income households). From a gender perspective, a general rise in VAT may be broadly neutral, whereas given the differential holdings of wealth by men and women, the DIRT and Capital Gains Tax measures seem more likely to have had a greater impact on men. These are areas which could, with suitable data, be addressed in future research.
What of the impact of the broad range of tax, welfare and public sector pay measures set out above? We begin by examining the overall distributional impact of all these policy changes. The results will then be decomposed into four components as shown below in Table 5.1. These components are:
(1) The impact of changes to public sector pay, pensions and the introduction of the public sector pension levy; (2) The impact of changes in taxation, Pay, PRSI and introduction of the USC; (3) Social Welfare changes (excluding changes to Child Benefit) and (4) Child Benefit changes.
This approach will allow us to examine if certain types of policy changes have affected men and women differently, or affected certain family types differently. Small differences in the total impact of policy changes between 2008 and 2013 compared to the sum of the total impact of these four components arise due to interactions between the tax and benefit system. For example, policy changes that reduce disposable income (increased taxes, PRSI or USC) may result in a family receiving more social welfare payments such as the Family Income Supplement. The results show, however, that these interactions are minimal.
14
A feasibility study for the extension of the SWITCH model to deal with indirect taxes is currently under way.
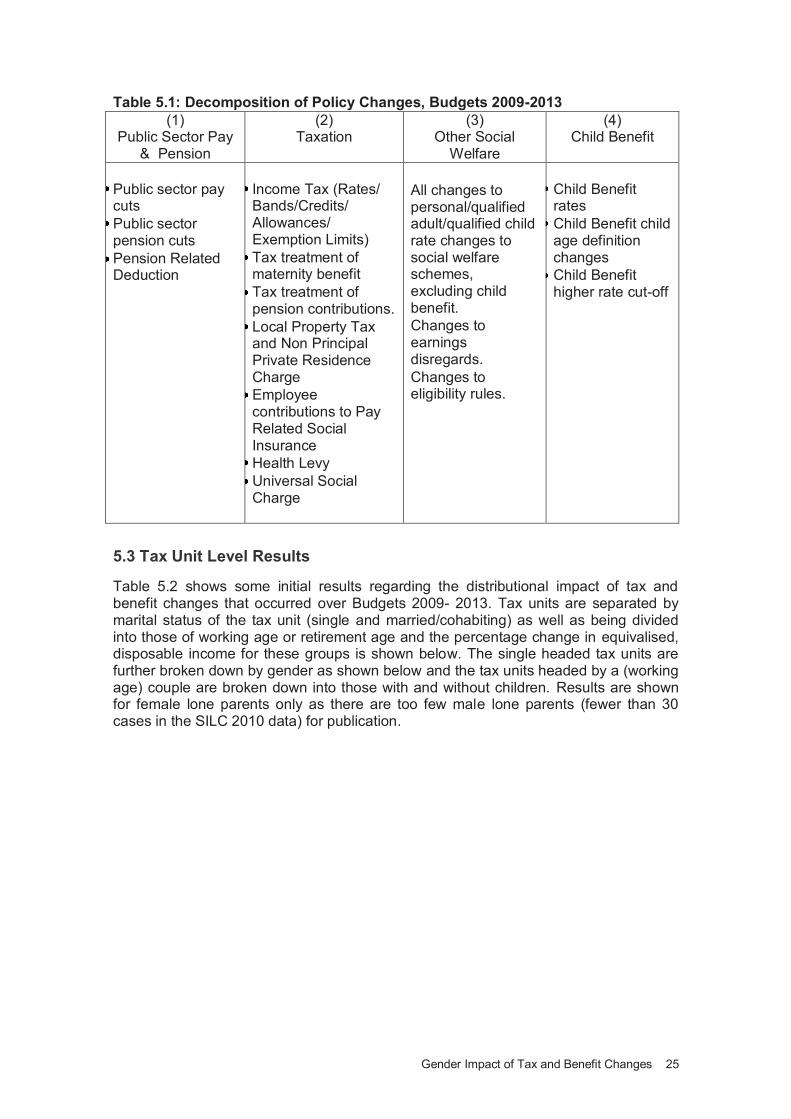
Gender Impact of Tax and Benefit Changes 25
Table 5.1: Decomposition of Policy Changes, Budgets 2009-2013
(1) Public Sector Pay
& Pension
(2) Taxation
(3) Other Social
Welfare
(4) Child Benefit
Public sector pay cuts
Public sector pension cuts
Pension Related Deduction
Income Tax (Rates/ Bands/Credits/ Allowances/ Exemption Limits)
Tax treatment of maternity benefit
Tax treatment of pension contributions.
Local Property Tax and Non Principal Private Residence Charge
Employee contributions to Pay Related Social Insurance
Health Levy
Universal Social Charge
All changes to personal/qualified adult/qualified child rate changes to social welfare schemes, excluding child benefit.
Changes to earnings disregards.
Changes to eligibility rules.
Child Benefit rates
Child Benefit child age definition changes
Child Benefit higher rate cut-off
5.3 Tax Unit Level Results
Table 5.2 shows some initial results regarding the distributional impact of tax and benefit changes that occurred over Budgets 2009- 2013. Tax units are separated by marital status of the tax unit (single and married/cohabiting) as well as being divided into those of working age or retirement age and the percentage change in equivalised, disposable income for these groups is shown below. The single headed tax units are further broken down by gender as shown below and the tax units headed by a (working age) couple are broken down into those with and without children. Results are shown for female lone parents only as there are too few male lone parents (fewer than 30 cases in the SILC 2010 data) for publication.

26 Gender Impact of Tax and Benefit Changes
Table 5.2: Impact of Budgets 2009-2013 on Disposable Income for Single-Headed Tax Units by Gender and for Couple-Headed Tax Units
Total % Change
% of Total Tax Units
Singles, no children -9.5 47
of which male -9.3 26
of which female -9.9 21
Lone Parents, female* -9.1 6
Single Retired Tax Units -4.5 11
of which male -4.5 4
of which female -4.5 7
Retired Couple Tax Units -4.1 7
Couple Headed Tax Units -11.8 29
without children -11.2 11
with children -12.2 18
All -9.6 100
* male lone parent sample size too small for publication
Source: SWITCH
The average percentage change in disposable income for all tax units is a fall of just over 9 per cent. A gender-based comparison is possible in this analysis for single tax units. As income developments over this period were rather different for those above and below pension age, we consider these groups separately. Single tax units of working age (both with and without children) have losses close to the average. Of the singles with no children, women lose slightly more than men but only marginally so (9.9 per cent loss compared to 9.3 per cent for males). The scale of losses for female lone parents is similar to that for other single tax units but a detailed gender comparison is not possible because of the low numbers of lone fathers in the sample. Amongst the single retired tax units male and female incomes fell at the same rate (4.5 per cent each).
The group losing the most in terms of disposable income are tax units headed by a working-age couple with a fall in disposable income of 11.8 per cent. Within this group couples with children faced a higher loss (12.2 per cent) than those without children (11.2 per cent).
The main divergences in policy impact revealed by these figures are not on the basis of gender; they are rather on the basis of age (above or below 65), partnership status (couples losing more than singles) as well as the presence of children. Those losing the least are single retired tax units while retired couple tax units also have losses in disposable income well below average. The below average decline in incomes for those over 65 is likely due to the fact that state pensions rose in 2009 and were the only benefits not to be subsequently reduced. This reflects the fact that, whereas tax and welfare policies are required to be gender neutral, the taxation and social welfare system are allowed to implement differential treatment on the basis of age. For
example the age tax credit is available for persons aged over 65 and the social welfare
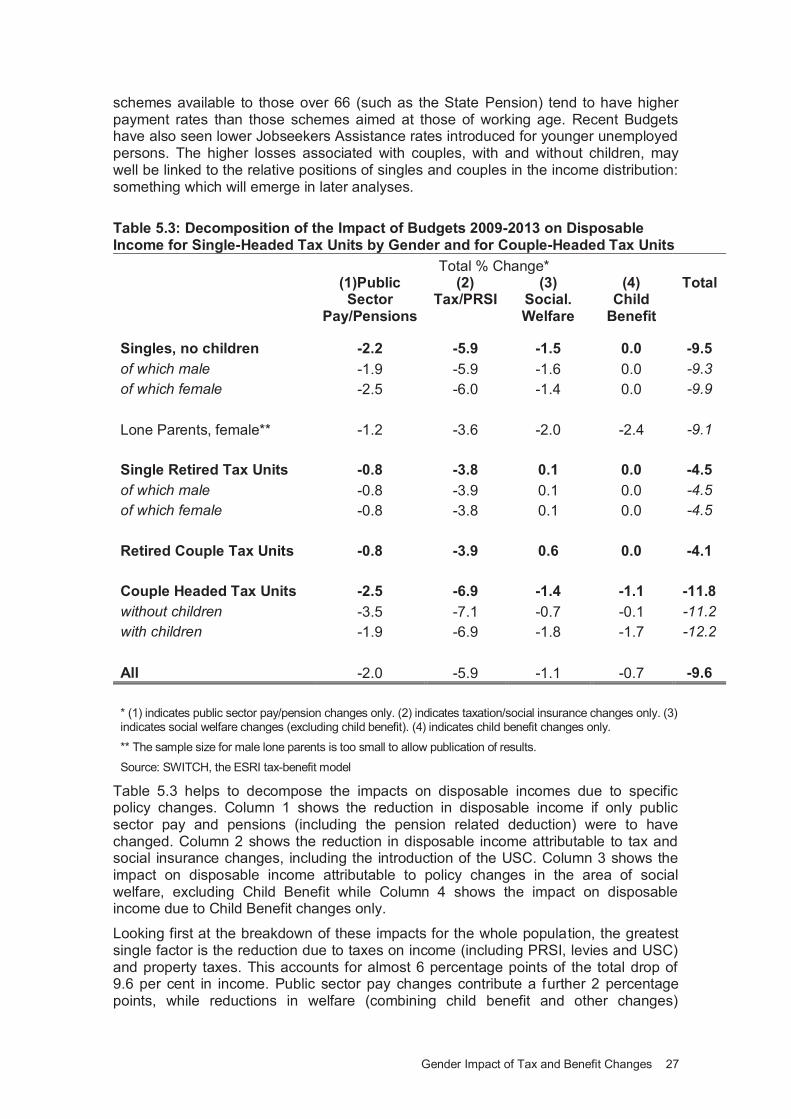
Gender Impact of Tax and Benefit Changes 27
schemes available to those over 66 (such as the State Pension) tend to have higher payment rates than those schemes aimed at those of working age. Recent Budgets have also seen lower Jobseekers Assistance rates introduced for younger unemployed persons. The higher losses associated with couples, with and without children, may well be linked to the relative positions of singles and couples in the income distribution: something which will emerge in later analyses.
Table 5.3: Decomposition of the Impact of Budgets 2009-2013 on Disposable Income for Single-Headed Tax Units by Gender and for Couple-Headed Tax Units
Total % Change*
(1)Public Sector
Pay/Pensions
(2) Tax/PRSI
(3) Social. Welfare
(4) Child
Benefit
Total
Singles, no children -2.2 -5.9 -1.5 0.0 -9.5
of which male -1.9 -5.9 -1.6 0.0 -9.3
of which female -2.5 -6.0 -1.4 0.0 -9.9
Lone Parents, female** -1.2 -3.6 -2.0 -2.4 -9.1
Single Retired Tax Units -0.8 -3.8 0.1 0.0 -4.5
of which male -0.8 -3.9 0.1 0.0 -4.5
of which female -0.8 -3.8 0.1 0.0 -4.5
Retired Couple Tax Units -0.8 -3.9 0.6 0.0 -4.1
Couple Headed Tax Units -2.5 -6.9 -1.4 -1.1 -11.8
without children -3.5 -7.1 -0.7 -0.1 -11.2
with children -1.9 -6.9 -1.8 -1.7 -12.2
All -2.0 -5.9 -1.1 -0.7 -9.6
* (1) indicates public sector pay/pension changes only. (2) indicates taxation/social insurance changes only. (3) indicates social welfare changes (excluding child benefit). (4) indicates child benefit changes only.
** The sample size for male lone parents is too small to allow publication of results.
Source: SWITCH, the ESRI tax-benefit model
Table 5.3 helps to decompose the impacts on disposable incomes due to specific policy changes. Column 1 shows the reduction in disposable income if only public sector pay and pensions (including the pension related deduction) were to have changed. Column 2 shows the reduction in disposable income attributable to tax and social insurance changes, including the introduction of the USC. Column 3 shows the impact on disposable income attributable to policy changes in the area of social welfare, excluding Child Benefit while Column 4 shows the impact on disposable income due to Child Benefit changes only.
Looking first at the breakdown of these impacts for the whole population, the greatest single factor is the reduction due to taxes on income (including PRSI, levies and USC) and property taxes. This accounts for almost 6 percentage points of the total drop of 9.6 per cent in income. Public sector pay changes contribute a further 2 percentage points, while reductions in welfare (combining child benefit and other changes)
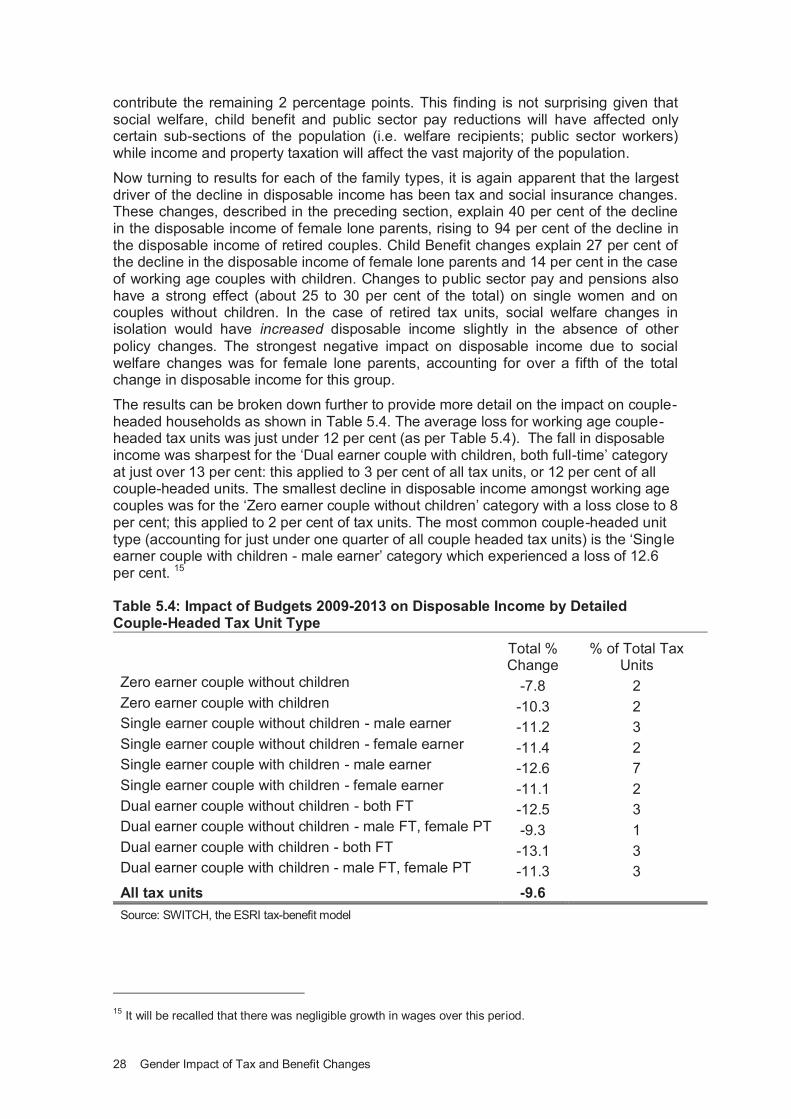
28 Gender Impact of Tax and Benefit Changes
contribute the remaining 2 percentage points. This finding is not surprising given that social welfare, child benefit and public sector pay reductions will have affected only certain sub-sections of the population (i.e. welfare recipients; public sector workers) while income and property taxation will affect the vast majority of the population.
Now turning to results for each of the family types, it is again apparent that the largest driver of the decline in disposable income has been tax and social insurance changes. These changes, described in the preceding section, explain 40 per cent of the decline in the disposable income of female lone parents, rising to 94 per cent of the decline in the disposable income of retired couples. Child Benefit changes explain 27 per cent of the decline in the disposable income of female lone parents and 14 per cent in the case of working age couples with children. Changes to public sector pay and pensions also have a strong effect (about 25 to 30 per cent of the total) on single women and on couples without children. In the case of retired tax units, social welfare changes in isolation would have increased disposable income slightly in the absence of other
policy changes. The strongest negative impact on disposable income due to social welfare changes was for female lone parents, accounting for over a fifth of the total change in disposable income for this group.
The results can be broken down further to provide more detail on the impact on couple-headed households as shown in Table 5.4. The average loss for working age couple-headed tax units was just under 12 per cent (as per Table 5.4). The fall in disposable income was sharpest for the ‘Dual earner couple with children, both full-time’ category at just over 13 per cent: this applied to 3 per cent of all tax units, or 12 per cent of all couple-headed units. The smallest decline in disposable income amongst working age couples was for the ‘Zero earner couple without children’ category with a loss close to 8 per cent; this applied to 2 per cent of tax units. The most common couple-headed unit type (accounting for just under one quarter of all couple headed tax units) is the ‘Sing le earner couple with children - male earner’ category which experienced a loss of 12.6 per cent. 15 Table 5.4: Impact of Budgets 2009-2013 on Disposable Income by Detailed Couple-Headed Tax Unit Type
Total % Change
% of Total Tax Units
Zero earner couple without children -7.8 2 Zero earner couple with children -10.3 2 Single earner couple without children - male earner -11.2 3 Single earner couple without children - female earner -11.4 2 Single earner couple with children - male earner -12.6 7 Single earner couple with children - female earner -11.1 2 Dual earner couple without children - both FT -12.5 3 Dual earner couple without children - male FT, female PT -9.3 1 Dual earner couple with children - both FT -13.1 3 Dual earner couple with children - male FT, female PT -11.3 3
All tax units -9.6 Source: SWITCH, the ESRI tax-benefit model
15
It will be recalled that there was negligible growth in wages over this period.
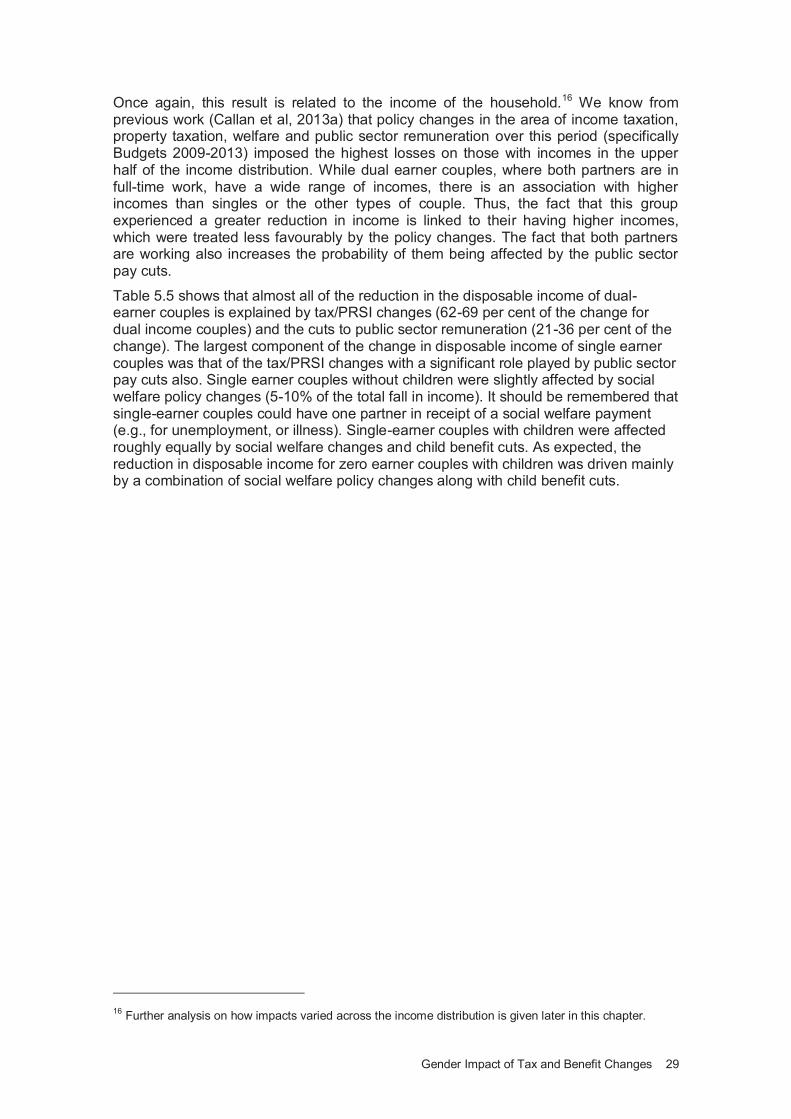
Gender Impact of Tax and Benefit Changes 29
Once again, this result is related to the income of the household.16 We know from previous work (Callan et al, 2013a) that policy changes in the area of income taxation, property taxation, welfare and public sector remuneration over this period (specifically Budgets 2009-2013) imposed the highest losses on those with incomes in the upper half of the income distribution. While dual earner couples, where both partners are in full-time work, have a wide range of incomes, there is an association with higher incomes than singles or the other types of couple. Thus, the fact that this group experienced a greater reduction in income is linked to their having higher incomes, which were treated less favourably by the policy changes. The fact that both partners are working also increases the probability of them being affected by the public sector pay cuts.
Table 5.5 shows that almost all of the reduction in the disposable income of dual-earner couples is explained by tax/PRSI changes (62-69 per cent of the change for dual income couples) and the cuts to public sector remuneration (21-36 per cent of the change). The largest component of the change in disposable income of single earner couples was that of the tax/PRSI changes with a significant role played by public sector pay cuts also. Single earner couples without children were slightly affected by social welfare policy changes (5-10% of the total fall in income). It should be remembered that single-earner couples could have one partner in receipt of a social welfare payment (e.g., for unemployment, or illness). Single-earner couples with children were affected roughly equally by social welfare changes and child benefit cuts. As expected, the reduction in disposable income for zero earner couples with children was driven mainly by a combination of social welfare policy changes along with child benefit cuts.
16
Further analysis on how impacts varied across the income distribution is given later in this chapter.
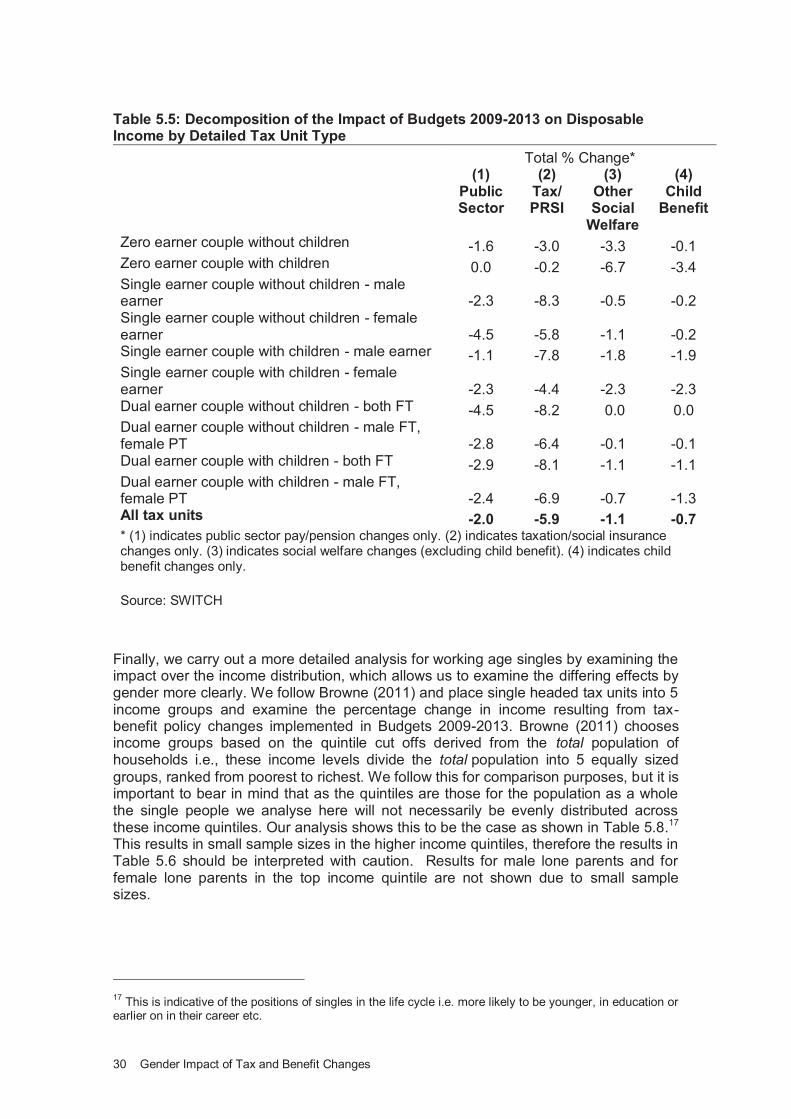
30 Gender Impact of Tax and Benefit Changes
Table 5.5: Decomposition of the Impact of Budgets 2009-2013 on Disposable Income by Detailed Tax Unit Type
Total % Change*
(1) Public Sector
(2) Tax/ PRSI
(3) Other Social
Welfare
(4) Child
Benefit
Zero earner couple without children -1.6 -3.0 -3.3 -0.1 Zero earner couple with children 0.0 -0.2 -6.7 -3.4 Single earner couple without children - male earner -2.3 -8.3 -0.5 -0.2 Single earner couple without children - female earner -4.5 -5.8 -1.1 -0.2 Single earner couple with children - male earner -1.1 -7.8 -1.8 -1.9 Single earner couple with children - female earner -2.3 -4.4 -2.3 -2.3 Dual earner couple without children - both FT -4.5 -8.2 0.0 0.0 Dual earner couple without children - male FT, female PT -2.8 -6.4 -0.1 -0.1 Dual earner couple with children - both FT -2.9 -8.1 -1.1 -1.1 Dual earner couple with children - male FT, female PT -2.4 -6.9 -0.7 -1.3 All tax units -2.0 -5.9 -1.1 -0.7 * (1) indicates public sector pay/pension changes only. (2) indicates taxation/social insurance changes only. (3) indicates social welfare changes (excluding child benefit). (4) indicates child benefit changes only.
Source: SWITCH
Finally, we carry out a more detailed analysis for working age singles by examining the impact over the income distribution, which allows us to examine the differing effects by gender more clearly. We follow Browne (2011) and place single headed tax units into 5 income groups and examine the percentage change in income resulting from tax-benefit policy changes implemented in Budgets 2009-2013. Browne (2011) chooses income groups based on the quintile cut offs derived from the total population of households i.e., these income levels divide the total population into 5 equally sized
groups, ranked from poorest to richest. We follow this for comparison purposes, but it is important to bear in mind that as the quintiles are those for the population as a whole the single people we analyse here will not necessarily be evenly distributed across these income quintiles. Our analysis shows this to be the case as shown in Table 5.8.17 This results in small sample sizes in the higher income quintiles, therefore the results in Table 5.6 should be interpreted with caution. Results for male lone parents and for female lone parents in the top income quintile are not shown due to small sample sizes.
17
This is indicative of the positions of singles in the life cycle i.e. more likely to be younger, in education or earlier on in their career etc.
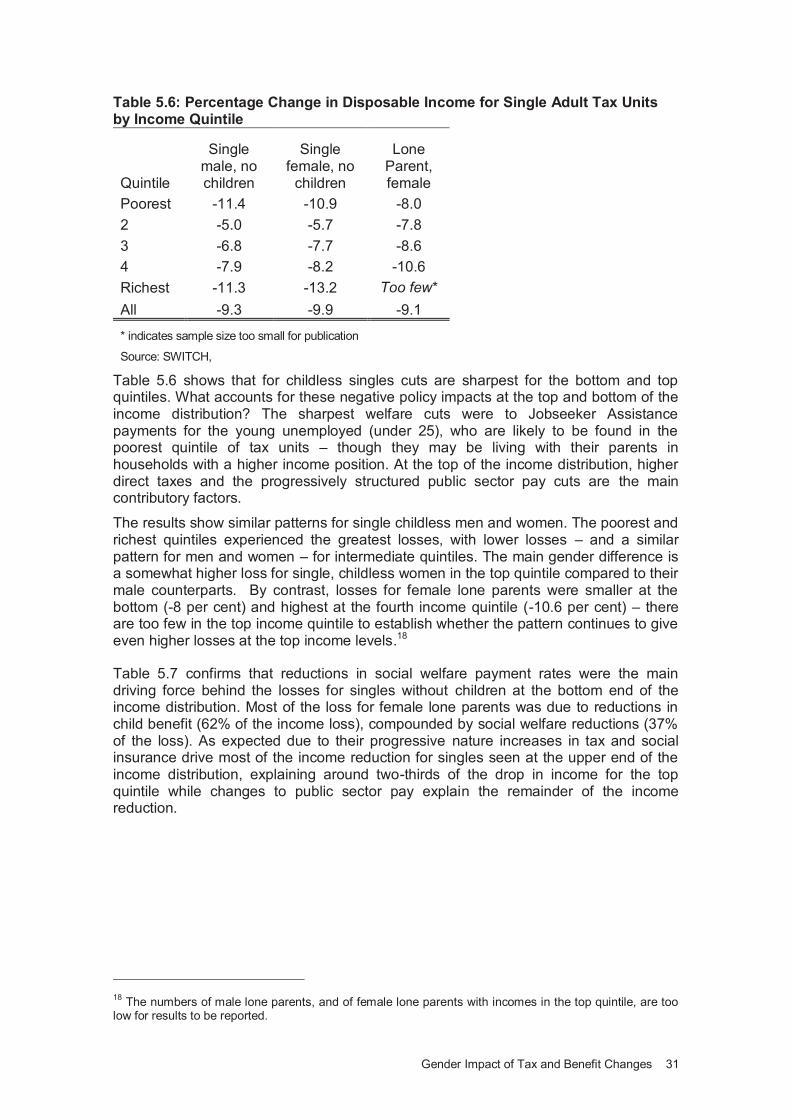
Gender Impact of Tax and Benefit Changes 31
Table 5.6: Percentage Change in Disposable Income for Single Adult Tax Units by Income Quintile
Quintile
Single male, no children
Single female, no
children
Lone Parent, female
Poorest -11.4 -10.9 -8.0
2 -5.0 -5.7 -7.8
3 -6.8 -7.7 -8.6
4 -7.9 -8.2 -10.6
Richest -11.3 -13.2 Too few*
All -9.3 -9.9 -9.1
* indicates sample size too small for publication
Source: SWITCH,
Table 5.6 shows that for childless singles cuts are sharpest for the bottom and top quintiles. What accounts for these negative policy impacts at the top and bottom of the income distribution? The sharpest welfare cuts were to Jobseeker Assistance payments for the young unemployed (under 25), who are likely to be found in the poorest quintile of tax units – though they may be living with their parents in households with a higher income position. At the top of the income distribution, higher direct taxes and the progressively structured public sector pay cuts are the main contributory factors.
The results show similar patterns for single childless men and women. The poorest and richest quintiles experienced the greatest losses, with lower losses – and a similar pattern for men and women – for intermediate quintiles. The main gender difference is a somewhat higher loss for single, childless women in the top quintile compared to their male counterparts. By contrast, losses for female lone parents were smaller at the bottom (-8 per cent) and highest at the fourth income quintile (-10.6 per cent) – there are too few in the top income quintile to establish whether the pattern continues to give even higher losses at the top income levels.18
Table 5.7 confirms that reductions in social welfare payment rates were the main driving force behind the losses for singles without children at the bottom end of the income distribution. Most of the loss for female lone parents was due to reductions in child benefit (62% of the income loss), compounded by social welfare reductions (37% of the loss). As expected due to their progressive nature increases in tax and social insurance drive most of the income reduction for singles seen at the upper end of the income distribution, explaining around two-thirds of the drop in income for the top quintile while changes to public sector pay explain the remainder of the income reduction.
18
The numbers of male lone parents, and of female lone parents with incomes in the top quintile, are too low for results to be reported.
32 Gender Impact of Tax and Benefit Changes
Table 5.7: Decomposition of the Percentage Change in Disposable Income for Single Adult Tax Units by Income Quintile*
(1) Public Sector Pay/Pensions (2) Tax/PRSI
Quintile
Single male, no children
Single female,
no children
Lone Parent, female
Single male, no children
Single female,
no children
Lone Parent, female
Poorest 0.0 -0.1 0.0 -0.6 -1.2 -0.1
2 0.0 -0.1 -0.1 -2.8 -3.0 -1.4
3 -0.2 -0.5 -0.8 -6.0 -5.8 -3.0
4 -1.4 -2.0 -2.7 -6.5 -6.0 -5.8
Richest -3.9 -5.1 Too few* -7.5 -8.2 Too few*
All -1.9 -2.5 -1.2 -5.9 -6.0 -3.6
(3) Social Welfare (4) Child Benefit
Quintile
Single male, no children
Single female,
no children
Lone Parent, female
Single male, no children
Single female,
no children
Lone Parent, female
Poorest -10.8 -9.6 -2.9 0.0 0.0 -4.9
2 -2.1 -2.3 -3.0 0.0 -0.3 -3.3
3 -0.6 -1.3 -2.8 0.0 0.0 -2.5
4 0.0 -0.1 -0.5 -0.1 0.0 -1.9
Richest -0.1 -0.1 Too few* 0.0 0.0 Too few*
All -1.6 -1.4 -2.0 0.0 0.0 -2.4
* (1) indicates public sector pay/pension changes only. (2) indicates taxation/social insurance changes only. (3) indicates social welfare changes (excluding child benefit). (4) indicates child benefit changes only.
** indicates sample size too small for publication
Source: SWITCH, the ESRI tax-benefit model
We expand this analysis in Table 5.8 by examining the distributional impact by quintile for a wider set of tax unit types. In order to do this each tax unit is classified into the population wide income quintiles. We then examine the percentage change in disposable income for each tax unit type classified by the income cut offs which define the population quintiles. As discussed previously, this means that each tax unit type will not be spread equally across the income quintiles. The top panel of Table 5.8 illustrates this issue and shows the percentage of the specific tax unit type found in each quintile. For example, 34 per cent of single, working-age males with no children are found in the bottom (total population) income quintile while 19 per cent of them are found in the top income quintile. Single retired (males and females) are found mainly in the second income quintile (29 per cent and 37 per cent respectively) and top income quintile (32 per cent for males, 27 per cent for females).
For retired tax units, both single and couples, those in the bottom two income quintiles have seen either a gain in disposable income between 2008 and 2013 or a very small loss of 0.1 per cent, lower than for any other group. This again goes back to the fact that social welfare payments to the over-65s were increased in 2009 and not reduced in 2010 as were all social welfare schemes targeted at those of working age. Couples of working age with children experienced a higher than average loss in each income
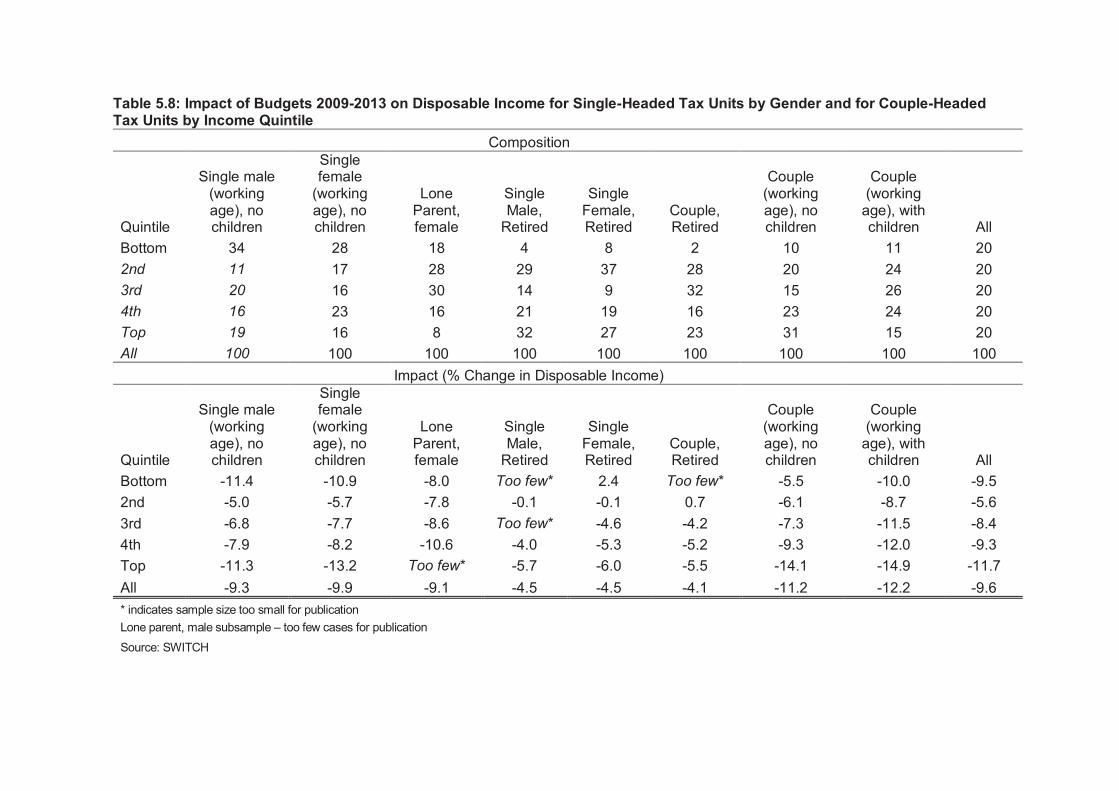
Table 5.8: Impact of Budgets 2009-2013 on Disposable Income for Single-Headed Tax Units by Gender and for Couple-Headed Tax Units by Income Quintile
Composition
Quintile
Single male (working age), no children
Single female
(working age), no children
Lone Parent, female
Single Male,
Retired
Single Female, Retired
Couple, Retired
Couple (working age), no children
Couple (working
age), with children All
Bottom 34 28 18 4 8 2 10 11 20
2nd 11 17 28 29 37 28 20 24 20
3rd 20 16 30 14 9 32 15 26 20
4th 16 23 16 21 19 16 23 24 20
Top 19 16 8 32 27 23 31 15 20
All 100 100 100 100 100 100 100 100 100
Impact (% Change in Disposable Income)
Quintile
Single male (working age), no children
Single female
(working age), no children
Lone Parent, female
Single Male,
Retired
Single Female, Retired
Couple, Retired
Couple (working age), no children
Couple (working
age), with children All
Bottom -11.4 -10.9 -8.0 Too few* 2.4 Too few* -5.5 -10.0 -9.5
2nd -5.0 -5.7 -7.8 -0.1 -0.1 0.7 -6.1 -8.7 -5.6
3rd -6.8 -7.7 -8.6 Too few* -4.6 -4.2 -7.3 -11.5 -8.4
4th -7.9 -8.2 -10.6 -4.0 -5.3 -5.2 -9.3 -12.0 -9.3
Top -11.3 -13.2 Too few* -5.7 -6.0 -5.5 -14.1 -14.9 -11.7
All -9.3 -9.9 -9.1 -4.5 -4.5 -4.1 -11.2 -12.2 -9.6
* indicates sample size too small for publication
Lone parent, male subsample – too few cases for publication
Source: SWITCH
34 Gender Impact of Tax and Benefit Changes
quintile, as reductions in Child Benefit affected all those with children, and added to losses arising from public sector pay cuts and taxation measures.
5.4 Austerity Policies: Initial Year and Later Years
As shown in Table 5.8 and in Callan et al. (2013a)19, the overall impact of the income taxation, welfare, property tax and public sector pay measures contained in Budgets 2009-2013 was one in which the greatest losses were experienced by households with the highest incomes, with the next highest losses for those at lowest incomes. Analysis (Callan et al, 2013a) shows a strong contrast between the distributive impact of Budget 2009 and the combined impact of later Budgets (2010-2013). We therefore repeat the analysis shown in Table 5.8, which examined the quintile impacts across a range of tax unit types (broken down by gender where possible), and report the impact for Budget 2009 compared to the cumulative impact of Budgets 2010-2013. We keep the population profile constant at its 2010 level, in order to isolate the impact of policy changes.
Budget 2009
The final column in Table 5.9 shows that, overall, Budget 2009 saw larger losses for those at the top of the income distribution. The second quintile actually saw a rise in income in this year. A key factor here is that in the year in question the majority of social welfare rates rose by around 3 per cent. The second quintile contains a higher proportion of over 65s than other quintiles. This helps to explain the gain in income for the second quintile. While other social welfare rates rose in this year also the Jobseekers Allowance rate for the under twenties was almost halved in this year. Younger, unemployed persons are concentrated in the bottom decile, which explains the overall loss for the bottom quintile. Budget 2009 also saw the introduction of two progressively structured measures - the public sector pension levy and the income levy – which explain why losses increase in percentage terms when moving up the income scale from quintiles 3 to 5.
From a gender and family type perspective single retired men and women experienced a similar distributional impact of Budget 200920 with gains predominating among the bottom four quintiles. The top quintiles for these groups experienced a reduction in income due mainly to policy changes on taxation and levies. A similar pattern emerges for retired couples. Lone parents in quintiles 1-3 also experienced gains in disposable income due to income tax and welfare changes in Budget 2009 – One-Parent Family payment rates increased while the reduction in Jobseekers Allowance payments were not implemented for those with child dependants. There were losses among lone parents in the fourth income quintile, where tax and levy measures had greater impact. Single males and females of working age experienced a broadly similar pattern of losses. These were, for the most part, progressively structured apart from a sharper loss for quintile 1 compared to quintiles 2 and 3 due to sharp cuts in payment rates for younger recipients of Jobseekers Allowance. For working-age couples with and without children losses were sharpest at the top. Losses at the bottom quintile were higher than for quintiles 2-4 due to these categories containing younger persons on Jobseekers Allowance.
19
Note that Callan et al (2013b) extended this analysis to include the impact of Budget 2014 along with estimates of the impact of VAT, Capital Gains Tax, DIRT, Pension contribution and Health Insurance tax relief changes and found that the sharpest losses in disposable income occurred at the top of the income decile, with a loss of close to 15.5%, with the next greatest loss occurring for the bottom decile, with a loss of close to 12.5%. The losses for the remaining deciles were relatively flat falling the region of 11-12%.
20 There are too few single, retired males in quintiles 1 and 3 for publication.
Gender Impact of Tax and Benefit Changes 35
Budgets 2010-2013
A different pattern emerges when analysing the impact of subsequent budgets (Budgets 2010-2013). Losses were sharpest at the bottom end of the income distribution (a fall of 11 per cent in disposable income for the bottom quintile) and relatively flat – close to 6 per cent – for other quintiles. Over these years working-age social welfare payments were reduced with a particularly sharp reduction occurring for Jobseekers Allowance recipients aged between 20 and 24. This time period also saw reductions in public sector pay and pensions, which were progressively structured, and the introduction of a property tax21 and a Universal Social Charge. These tax and welfare changes, in Budgets 2010-2013 gave rise to sharper losses for those at the bottom end of the income distribution than for those at the top.
From a gender perspective single men and women of working age were affected in very similar ways. Single retired people fared somewhat better than their working age counterparts, but again there were no major differences between single retired men and single retired women. Losses for lone parents, and for couples with children, were somewhat higher than those on similar incomes without children. This pattern arises due to cuts in rates of payment of child benefit over the period.
21
The property tax included an income related deferral option. As this was little used, and in any event, deferral implies that the tax simply accumulates with interest, we model this as a tax with no income related exemptions.
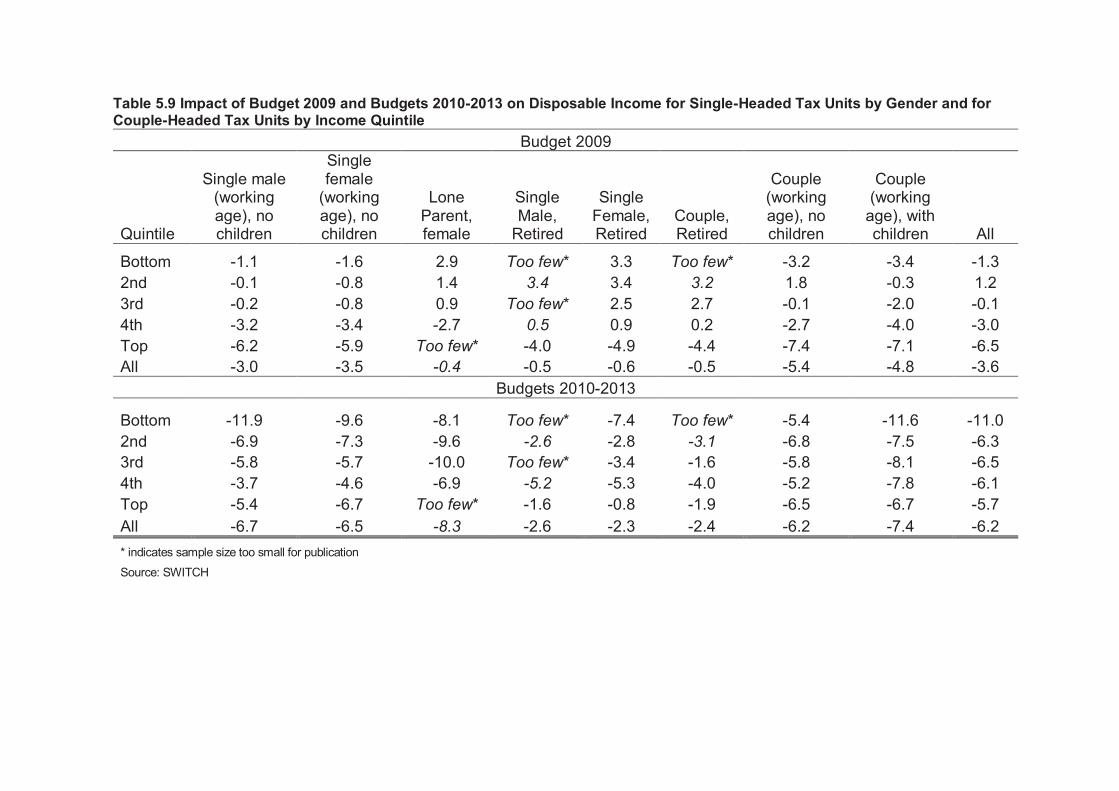
Table 5.9 Impact of Budget 2009 and Budgets 2010-2013 on Disposable Income for Single-Headed Tax Units by Gender and for Couple-Headed Tax Units by Income Quintile
Budget 2009
Quintile
Single male (working age), no children
Single female
(working age), no children
Lone Parent, female
Single Male,
Retired
Single Female, Retired
Couple, Retired
Couple (working age), no children
Couple (working
age), with children All
Bottom -1.1 -1.6 2.9 Too few* 3.3 Too few* -3.2 -3.4 -1.3
2nd -0.1 -0.8 1.4 3.4 3.4 3.2 1.8 -0.3 1.2
3rd -0.2 -0.8 0.9 Too few* 2.5 2.7 -0.1 -2.0 -0.1
4th -3.2 -3.4 -2.7 0.5 0.9 0.2 -2.7 -4.0 -3.0
Top -6.2 -5.9 Too few* -4.0 -4.9 -4.4 -7.4 -7.1 -6.5
All -3.0 -3.5 -0.4 -0.5 -0.6 -0.5 -5.4 -4.8 -3.6
Budgets 2010-2013
Bottom -11.9 -9.6 -8.1 Too few* -7.4 Too few* -5.4 -11.6 -11.0
2nd -6.9 -7.3 -9.6 -2.6 -2.8 -3.1 -6.8 -7.5 -6.3
3rd -5.8 -5.7 -10.0 Too few* -3.4 -1.6 -5.8 -8.1 -6.5
4th -3.7 -4.6 -6.9 -5.2 -5.3 -4.0 -5.2 -7.8 -6.1
Top -5.4 -6.7 Too few* -1.6 -0.8 -1.9 -6.5 -6.7 -5.7
All -6.7 -6.5 -8.3 -2.6 -2.3 -2.4 -6.2 -7.4 -6.2
* indicates sample size too small for publication
Source: SWITCH
Gender Impact of Tax and Benefit Changes 37
5.5 Comparative Evidence: Ireland and the UK
We now turn to a comparison of the impact of tax and welfare policy changes in Ireland over recent years, with an assessment by Browne (2011) of the likely impact of the UK’s fiscal adjustment – based on changes already implemented and announced plans for future changes. We conduct this comparison as Browne (2011) is, to our knowledge, the first to use a microsimulation approach to examine gender differences in policy impacts. In both cases the analyses cover a 5 year period – 2008-2013 for Ireland, and 2010-2015 for the UK. Results are reported in Table 5.10 which shows the percentage reduction in disposable income for a variety of family types. The overall reduction in household income due to tax/welfare policy changes is more than 9 per cent in Ireland, compared with less than 4 per cent in the UK. This reflects the greater scale of the fiscal adjustment required in Ireland.
Despite this, there is one family type for whom the reduction in income is greater in the UK than in Ireland. For non-earner couples without children, the fall in income in Ireland is 4.6 per cent, while the corresponding figure for the UK is 6.5 per cent. For non-earning couples with children, the losses are slightly higher in Ireland (10.2 per cent compared to 9 per cent in the UK). This suggests that the UK’s welfare cuts are expected to be sharper than those in Ireland, particularly as the average reduction in disposable income is much higher in Ireland (-9.6%) than in the UK (-3.6%). For all other family types, the losses imposed by the UK’s adjustment are substantially lower than those for Ireland. For example, a two-earner couple without children, both working full time, is expected to lose about 2 per cent in the UK, as against over 12 per cent in Ireland; if the couple had children, the gap is between a 5 per cent loss in the UK and a 13 per cent loss in Ireland.
We noted earlier that for Ireland gender differentials were less important than those based on age and relationship status. How does this compare with the UK? Again the differences are relatively modest, with gaps of less than one percentage point between single earner couples with male or female earners, and single men and women. The largest gap is in the Irish case, where a single earner couple in which the woman is the earner loses 11.1 per cent from the policy changes, as against 12.6 per cent if the earner is a man. Again, this is likely to be influenced by the fact that women’s earnings are lower on average, and the tax measures introduced bear more heavily on higher incomes.
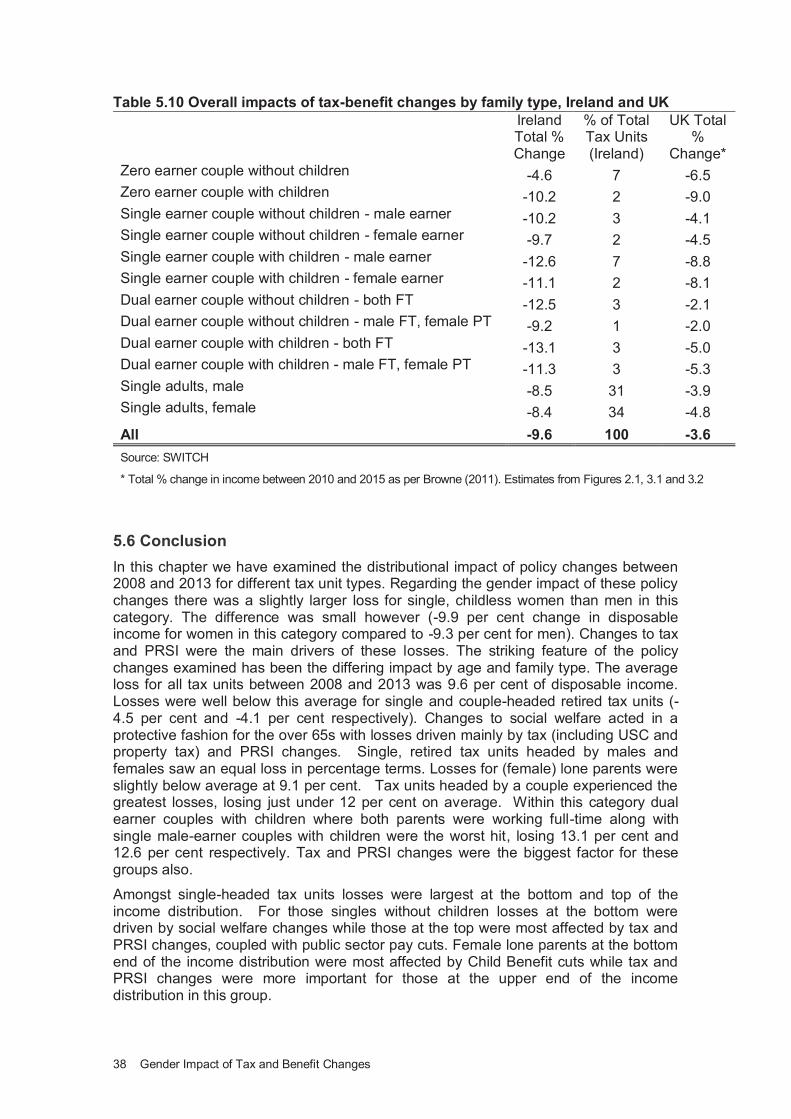
38 Gender Impact of Tax and Benefit Changes
Table 5.10 Overall impacts of tax-benefit changes by family type, Ireland and UK
IrelandTotal % Change
% of Total Tax Units (Ireland)
UK Total %
Change* Zero earner couple without children -4.6 7 -6.5 Zero earner couple with children -10.2 2 -9.0 Single earner couple without children - male earner -10.2 3 -4.1 Single earner couple without children - female earner -9.7 2 -4.5 Single earner couple with children - male earner -12.6 7 -8.8 Single earner couple with children - female earner -11.1 2 -8.1 Dual earner couple without children - both FT -12.5 3 -2.1 Dual earner couple without children - male FT, female PT -9.2 1 -2.0 Dual earner couple with children - both FT -13.1 3 -5.0 Dual earner couple with children - male FT, female PT -11.3 3 -5.3 Single adults, male -8.5 31 -3.9 Single adults, female -8.4 34 -4.8
All -9.6 100 -3.6
Source: SWITCH
* Total % change in income between 2010 and 2015 as per Browne (2011). Estimates from Figures 2.1, 3.1 and 3.2
5.6 Conclusion
In this chapter we have examined the distributional impact of policy changes between 2008 and 2013 for different tax unit types. Regarding the gender impact of these policy changes there was a slightly larger loss for single, childless women than men in this category. The difference was small however (-9.9 per cent change in disposable income for women in this category compared to -9.3 per cent for men). Changes to tax and PRSI were the main drivers of these losses. The striking feature of the policy changes examined has been the differing impact by age and family type. The average loss for all tax units between 2008 and 2013 was 9.6 per cent of disposable income. Losses were well below this average for single and couple-headed retired tax units (-4.5 per cent and -4.1 per cent respectively). Changes to social welfare acted in a protective fashion for the over 65s with losses driven mainly by tax (including USC and property tax) and PRSI changes. Single, retired tax units headed by males and females saw an equal loss in percentage terms. Losses for (female) lone parents were slightly below average at 9.1 per cent. Tax units headed by a couple experienced the greatest losses, losing just under 12 per cent on average. Within this category dual earner couples with children where both parents were working full-time along with single male-earner couples with children were the worst hit, losing 13.1 per cent and 12.6 per cent respectively. Tax and PRSI changes were the biggest factor for these groups also.
Amongst single-headed tax units losses were largest at the bottom and top of the income distribution. For those singles without children losses at the bottom were driven by social welfare changes while those at the top were most affected by tax and PRSI changes, coupled with public sector pay cuts. Female lone parents at the bottom end of the income distribution were most affected by Child Benefit cuts while tax and PRSI changes were more important for those at the upper end of the income distribution in this group.
Gender Impact of Tax and Benefit Changes 39
6 GENDER IMPACT OF TAX AND BENEFITS: POTENTIAL WITHIN-COUPLE EFFECTS
6.1 Introduction
Up to this point in our analysis we have not attempted to examine gender impacts of the policy changes between 2008 and 2013 for those persons within couples. Instead we have focussed on tax unit level results and examined the gender impacts for tax units where possible (i.e. for single headed tax units) while treating a couple as one unit. In this chapter we begin by examining the distributional impact of the 2008-2013 tax-benefit and public sector pay policy changes at the individual level. We focus on the impact on men and women separately, ignoring marital status. We then go on to provide the ‘upper’ and ‘lower’ bounds of policy impact on disposable income as described in Chapter 3.4. We do this by providing results assuming full income sharing and an alternative of zero income sharing.
6.2 Individual Level Results
We turn now to results at the level of individual incomes, tracking income as it comes to individuals from wages, self-employment, private pensions and social welfare. We follow Duncan, Giles and Webb (1994) in that we allocate child benefit to the usual recipient (mother or lone father) but analyse the incomes of adult individuals only, excluding children from the analysis. These results must be considered in the light of the discussion in Chapter 3, which concluded that the best interpretation of policy impact results for couples is as follows:
Certainty is not possible with the type of data usually available
Approximate bounds on the policy impact for men and women can be found using o Aggregate income change for the couple as an indicator of the impact if
there is full income sharing o Impacts on individual income as an indicator of the impact if there were to
be no income sharing
Where there is some income sharing, but it is not complete, policy impact will lie
between these bounds. Table 6.1 shows the distributional impact by gender and labour force status for all adult individuals. Women in the ‘active’ (i.e. employed or self employed) category lost an average of 11.6 per cent of individual disposable income between 2008 and 2013 with men in this category losing 10 per cent of individual disposable income. As shown in Table 6.2 this was driven mainly by tax/PRSI changes coupled with public sector pay cuts. Men in this category were more affected by tax/PRSI increases22 (explaining 78% of the income cut for men and 56% for women) while women were more affected by public sector pay cuts (29% of the fall in female income compared to 21% for men).
Women who were unemployed or not employed saw a loss of almost 15 per cent in individual disposable income, 6.5 percentage points more than the losses experienced by their male counterparts. This gender gap is attributable to reductions in child benefit (which is generally paid to the mother) as the impact of other aspects of the social welfare system is close between the genders. Finally losses in individual income for women over 65 were slightly lower than those for men, and losses for this age group were much smaller than for those aged under 65. Again, social welfare changes in
22
As male earnings tend to be higher on average this is as expected with a progressive tax system.
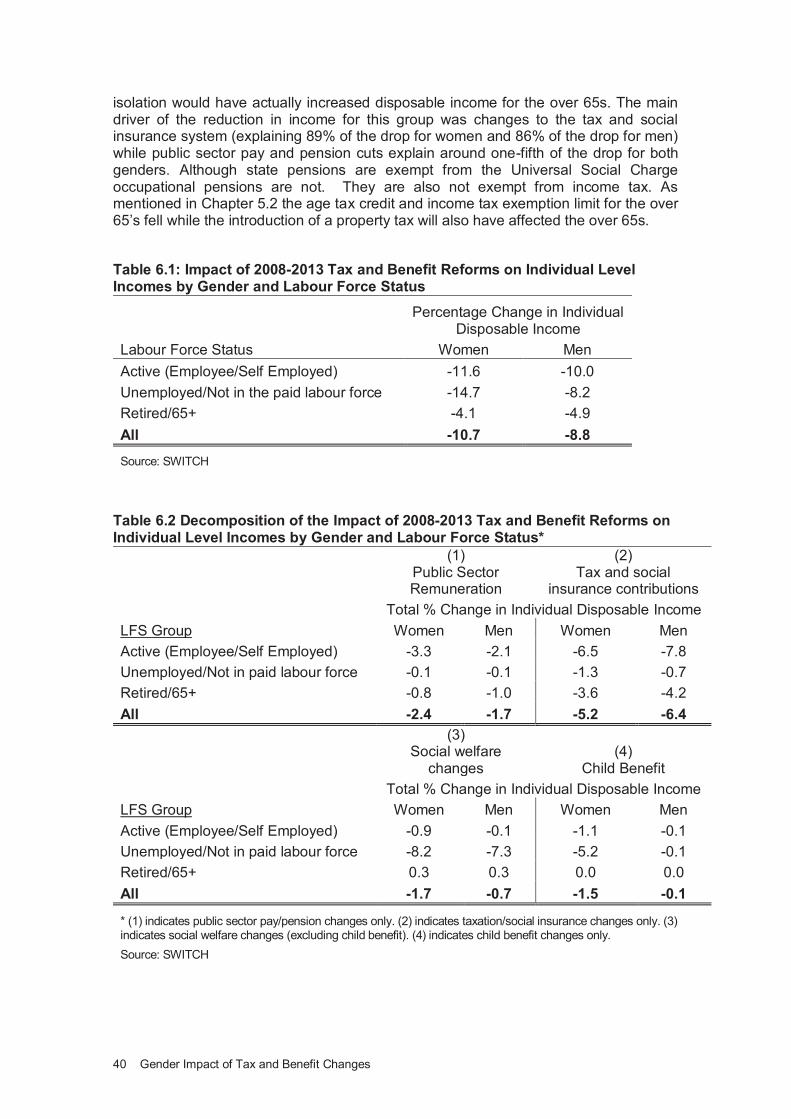
40 Gender Impact of Tax and Benefit Changes
isolation would have actually increased disposable income for the over 65s. The main driver of the reduction in income for this group was changes to the tax and social insurance system (explaining 89% of the drop for women and 86% of the drop for men) while public sector pay and pension cuts explain around one-fifth of the drop for both genders. Although state pensions are exempt from the Universal Social Charge occupational pensions are not. They are also not exempt from income tax. As mentioned in Chapter 5.2 the age tax credit and income tax exemption limit for the over 65’s fell while the introduction of a property tax will also have affected the over 65s.
Table 6.1: Impact of 2008-2013 Tax and Benefit Reforms on Individual Level Incomes by Gender and Labour Force Status
Percentage Change in Individual
Disposable Income
Labour Force Status Women Men
Active (Employee/Self Employed) -11.6 -10.0
Unemployed/Not in the paid labour force -14.7 -8.2
Retired/65+ -4.1 -4.9
All -10.7 -8.8
Source: SWITCH
Table 6.2 Decomposition of the Impact of 2008-2013 Tax and Benefit Reforms on
Individual Level Incomes by Gender and Labour Force Status*
(1) Public Sector Remuneration
(2) Tax and social
insurance contributions
Total % Change in Individual Disposable Income
LFS Group Women Men Women Men
Active (Employee/Self Employed) -3.3 -2.1 -6.5 -7.8
Unemployed/Not in paid labour force -0.1 -0.1 -1.3 -0.7
Retired/65+ -0.8 -1.0 -3.6 -4.2
All -2.4 -1.7 -5.2 -6.4
(3) Social welfare
changes (4)
Child Benefit
Total % Change in Individual Disposable Income
LFS Group Women Men Women Men
Active (Employee/Self Employed) -0.9 -0.1 -1.1 -0.1
Unemployed/Not in paid labour force -8.2 -7.3 -5.2 -0.1
Retired/65+ 0.3 0.3 0.0 0.0
All -1.7 -0.7 -1.5 -0.1
* (1) indicates public sector pay/pension changes only. (2) indicates taxation/social insurance changes only. (3) indicates social welfare changes (excluding child benefit). (4) indicates child benefit changes only.
Source: SWITCH
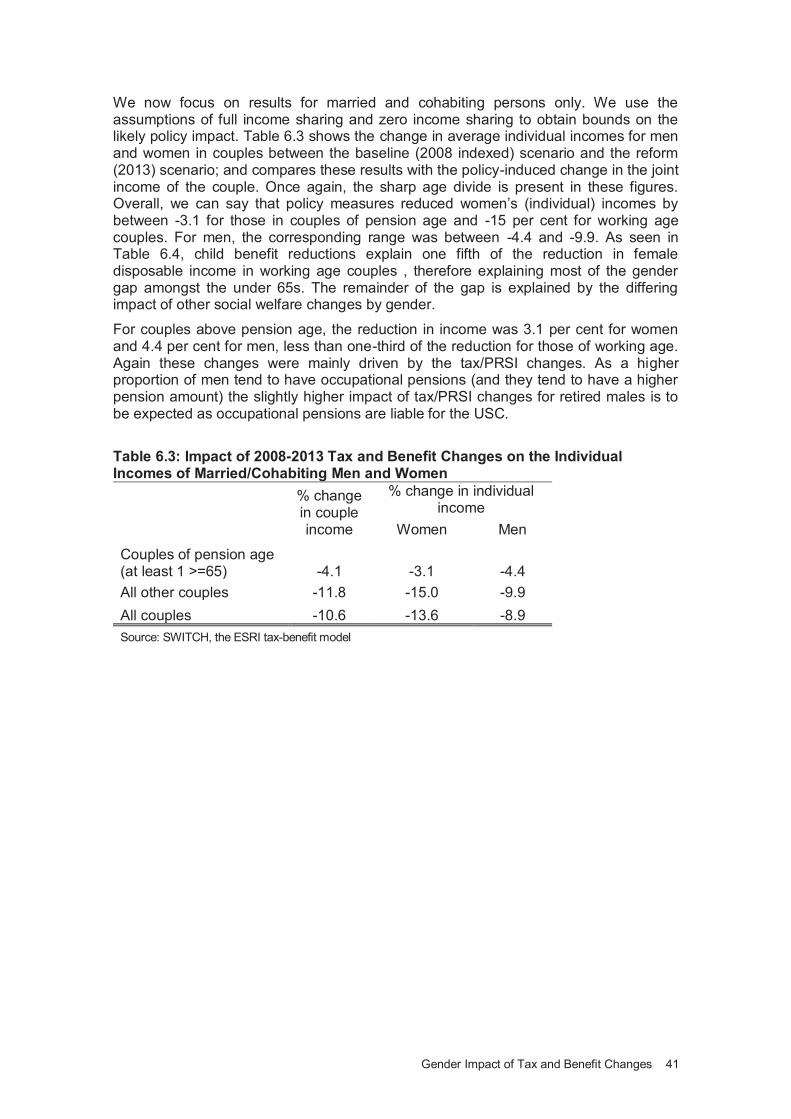
Gender Impact of Tax and Benefit Changes 41
We now focus on results for married and cohabiting persons only. We use the assumptions of full income sharing and zero income sharing to obtain bounds on the likely policy impact. Table 6.3 shows the change in average individual incomes for men and women in couples between the baseline (2008 indexed) scenario and the reform (2013) scenario; and compares these results with the policy-induced change in the joint income of the couple. Once again, the sharp age divide is present in these figures. Overall, we can say that policy measures reduced women’s (individual) incomes by between -3.1 for those in couples of pension age and -15 per cent for working age couples. For men, the corresponding range was between -4.4 and -9.9. As seen in Table 6.4, child benefit reductions explain one fifth of the reduction in female disposable income in working age couples , therefore explaining most of the gender gap amongst the under 65s. The remainder of the gap is explained by the differing impact of other social welfare changes by gender.
For couples above pension age, the reduction in income was 3.1 per cent for women and 4.4 per cent for men, less than one-third of the reduction for those of working age. Again these changes were mainly driven by the tax/PRSI changes. As a higher proportion of men tend to have occupational pensions (and they tend to have a higher pension amount) the slightly higher impact of tax/PRSI changes for retired males is to be expected as occupational pensions are liable for the USC.
Table 6.3: Impact of 2008-2013 Tax and Benefit Changes on the Individual Incomes of Married/Cohabiting Men and Women
% change in couple income
% change in individual income
Women Men
Couples of pension age (at least 1 >=65) -4.1 -3.1 -4.4
All other couples -11.8 -15.0 -9.9
All couples -10.6 -13.6 -8.9
Source: SWITCH, the ESRI tax-benefit model

42 Gender Impact of Tax and Benefit Changes
Table 6.4: Decomposition of the Impact of 2008-2013 Tax and Benefit Changes on the Individual Incomes of Married/Cohabiting Men and Women*
(1)
Public Sector Remuneration (2)
Tax/PRSI
%
change in
couple income
% change in individual income %
change in couple income
% change in individual income
Women Men Women Men Couples of pension age (at least 1>=65) -0.8 -1.1 -0.8 -3.9 -3.1 -4.1
All other couples -2.5 -3.4 -1.9 -6.9 -5.9 -7.6
All couples -2.2 -3.2 -1.7 -6.4 -5.6 -6.9
(3)
Social Welfare (4)
Child Benefit
%
change in
couple income
% change in individual income
% change
in couple income
% change in individual income
Women Men Women Men Couples of pension age (at least 1>=65) 0.6 0.9 0.5 0.0 -0.1 0.0
All other couples -1.4 -2.8 -0.6 -1.1 -3.0 0.0
All couples -1.1 -2.4 -0.4 -1.0 -2.7 0.0
* (1) indicates public sector pay/pension changes only. (2) indicates taxation/social insurance changes only. (3) indicates social welfare changes (excluding child benefit). (4) indicates child benefit changes only.
Source: SWITCH
Table 6.5 examines the impact of the 2008-2013 Budgets on the individual incomes of men and women who are living as couples. We classify both men and women according to the income quintile of the couple: in this way, when reading results for men and women, we can be sure that male and female partners are classified in the same income group, and that one-fifth of the couples are in each quintile. Women’s individual incomes have been reduced by more than men’s incomes for each income group. This contrast is starkest for the lowest income couples, where men’s incomes fall by 3 per cent, but women’s incomes fall by almost 15 per cent. For other income groups, women’s individual incomes have been reduced, on average, by 4.5 to 5.5 percentage points more than their male counterparts.
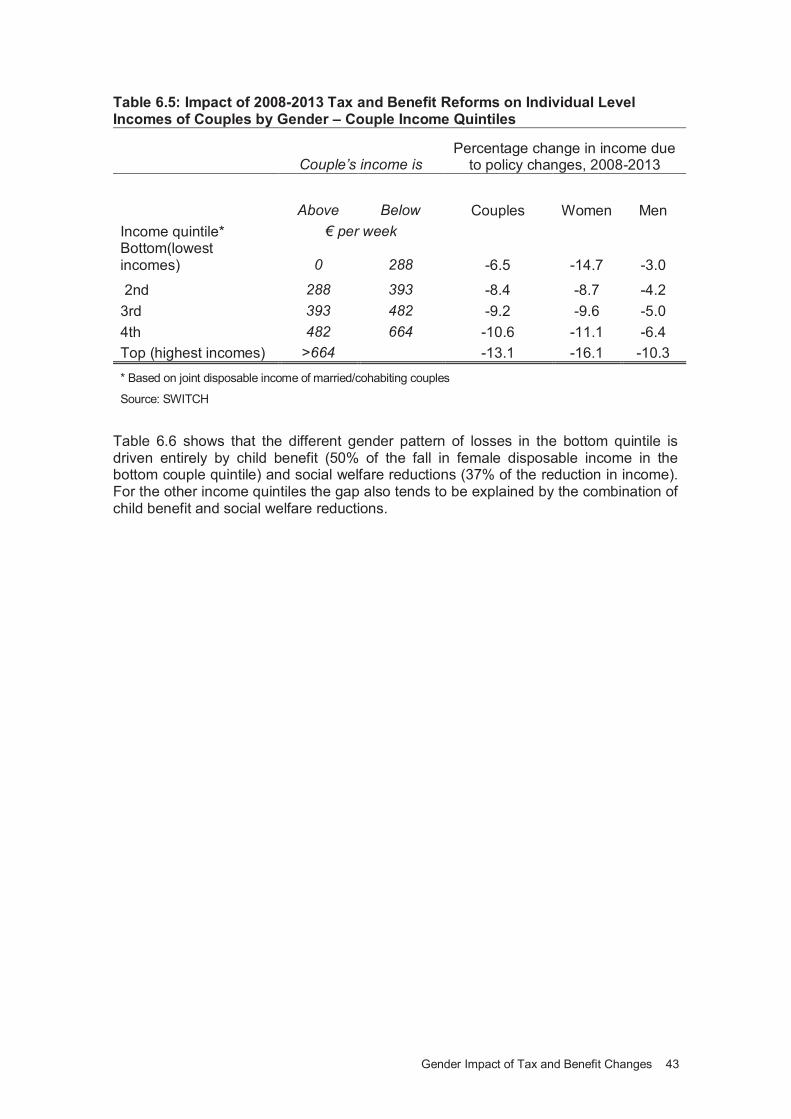
Gender Impact of Tax and Benefit Changes 43
Table 6.5: Impact of 2008-2013 Tax and Benefit Reforms on Individual Level Incomes of Couples by Gender – Couple Income Quintiles
Couple’s income is
Percentage change in income due to policy changes, 2008-2013
Above Below Couples Women Men
Income quintile* € per week Bottom(lowest incomes) 0 288 -6.5 -14.7 -3.0
2nd 288 393 -8.4 -8.7 -4.2
3rd 393 482 -9.2 -9.6 -5.0
4th 482 664 -10.6 -11.1 -6.4
Top (highest incomes) >664 -13.1 -16.1 -10.3
* Based on joint disposable income of married/cohabiting couples
Source: SWITCH
Table 6.6 shows that the different gender pattern of losses in the bottom quintile is driven entirely by child benefit (50% of the fall in female disposable income in the bottom couple quintile) and social welfare reductions (37% of the reduction in income). For the other income quintiles the gap also tends to be explained by the combination of child benefit and social welfare reductions.
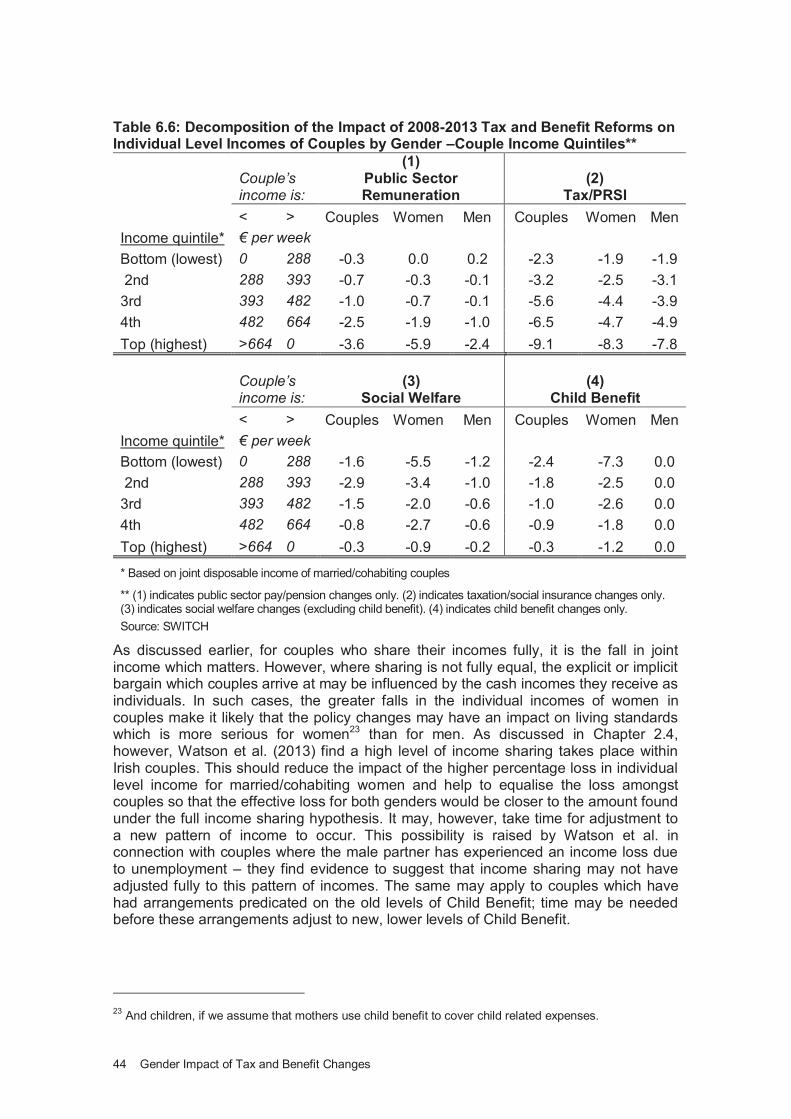
44 Gender Impact of Tax and Benefit Changes
Table 6.6: Decomposition of the Impact of 2008-2013 Tax and Benefit Reforms on Individual Level Incomes of Couples by Gender –Couple Income Quintiles**
Couple’s income is:
(1) Public Sector Remuneration
(2) Tax/PRSI
< > Couples Women Men Couples Women Men
Income quintile* € per week Bottom (lowest) 0 288 -0.3 0.0 0.2 -2.3 -1.9 -1.9
2nd 288 393 -0.7 -0.3 -0.1 -3.2 -2.5 -3.1
3rd 393 482 -1.0 -0.7 -0.1 -5.6 -4.4 -3.9
4th 482 664 -2.5 -1.9 -1.0 -6.5 -4.7 -4.9
Top (highest) >664 0 -3.6 -5.9 -2.4 -9.1 -8.3 -7.8
Couple’s income is:
(3) Social Welfare
(4) Child Benefit
< > Couples Women Men Couples Women Men
Income quintile* € per week Bottom (lowest) 0 288 -1.6 -5.5 -1.2 -2.4 -7.3 0.0
2nd 288 393 -2.9 -3.4 -1.0 -1.8 -2.5 0.0
3rd 393 482 -1.5 -2.0 -0.6 -1.0 -2.6 0.0
4th 482 664 -0.8 -2.7 -0.6 -0.9 -1.8 0.0
Top (highest) >664 0 -0.3 -0.9 -0.2 -0.3 -1.2 0.0
* Based on joint disposable income of married/cohabiting couples
** (1) indicates public sector pay/pension changes only. (2) indicates taxation/social insurance changes only. (3) indicates social welfare changes (excluding child benefit). (4) indicates child benefit changes only.
Source: SWITCH
As discussed earlier, for couples who share their incomes fully, it is the fall in joint income which matters. However, where sharing is not fully equal, the explicit or implicit bargain which couples arrive at may be influenced by the cash incomes they receive as individuals. In such cases, the greater falls in the individual incomes of women in couples make it likely that the policy changes may have an impact on living standards which is more serious for women23 than for men. As discussed in Chapter 2.4, however, Watson et al. (2013) find a high level of income sharing takes place within Irish couples. This should reduce the impact of the higher percentage loss in individual level income for married/cohabiting women and help to equalise the loss amongst couples so that the effective loss for both genders would be closer to the amount found under the full income sharing hypothesis. It may, however, take time for adjustment to a new pattern of income to occur. This possibility is raised by Watson et al. in connection with couples where the male partner has experienced an income loss due to unemployment – they find evidence to suggest that income sharing may not have adjusted fully to this pattern of incomes. The same may apply to couples which have had arrangements predicated on the old levels of Child Benefit; time may be needed before these arrangements adjust to new, lower levels of Child Benefit.
23
And children, if we assume that mothers use child benefit to cover child related expenses.
Gender Impact of Tax and Benefit Changes 45
6.3 Conclusion
This chapter examined the impact of Budgets 2008-2013, focussing on the impact on men and women in couples. We again saw the lower than average losses for those over 65 with women in this category losing by slightly less than men, but only marginally so. At an individual income level, females at work saw a larger fall in their disposable income relative to males in this category. Unemployed and inactive females saw a substantially larger drop in disposable income than males. These differences in impact by gender were driven mainly by child benefit reductions.
Focussing on those in couples only, disposable income losses were higher for women at each income level, taking a zero income sharing approach. For the bottom quintile women lost close to 15 per cent of their individual income relative to 3 per cent for men. This gap was driven by child benefit and social welfare changes. Further up the income distribution the gap ranged from 4.5 to 5.8 percentage points, with this gap again being explained by child benefit and social welfare changes.
46 Gender Impact of Tax and Benefit Changes
7 CONCLUSIONS
This report provides new evidence on the gender impact of budgetary policies. The study is based firmly on the nationally representative sample provided by the CSO’s Survey on Income and Living Conditions. Policy impacts are explored using SWITCH, the ESRI tax-benefit model, which allows most of the key changes to tax, social insurance and welfare payments to be examined. Among the key changes analysed are:
cuts to Child Benefit payment rates
cuts in welfare payment rates for working age schemes
increases in State Contributory and Non-Contributory Pensions
One-Parent Family Payment changes – to earnings disregard, and to age limits
increases in income tax
introduction of a Universal Social Charge
abolition of the PRSI ceiling and of the PRSI allowance
The policy changes examined in the analysis extend beyond the usual tax and welfare parameters to include the new property tax and the reductions in public sector pay through explicit cuts (2010 and 2013) and the “pension-related deduction” (perhaps better known as the public sector pension levy). These latter elements are of particular importance in a study of gender impacts because of the fact that women form a higher share of public sector employment than of private sector employment.
Given the numerous and complex ways in which policy changes acted on incomes, outcomes for the gender dimension cannot be predicted without careful empirical analysis. End results for couples depend also on the mechanisms used to manage their finances, share incomes and/or allocate responsibilities for particular expenditures as discussed in Chapter 3.
There are, of course, limitations to the analysis, which should also be borne in mind. One of the main limitations is that the analysis does not take into account the differential impact of cuts in publicly-provided services on men and women. Nevertheless, income-related taxes and welfare benefits form an important component of the overall budgetary impact. Another limitation is the impact of changes in indirect taxation is not modelled here. This is due to the fact that the data upon which SWITCH is based, SILC, does not contain information on expenditure. Work is currently underway to examine the feasibility of modelling indirect taxes in SWITCH using expenditure data from the Household Budget Survey.
We discussed the issues surrounding income sharing assumptions and carried out the analysis at two levels – tax--unit level (assuming full income sharing) and individual level (assuming zero income sharing). Neither option is likely to be correct one, in that the precise sharing rule amongst couples is not measured – and in practical terms, may be very hard to pin down. However, using these two approaches in a complementary fashion can help to put approximate bounds on the impact of policy, as argued in Chapter 3.
At the tax unit level the average loss in disposable income was just over 9 per cent over the time period analysed. The largest shock to disposable income was amongst working-age, couple-headed households, particularly dual-earner couples with both working full-time and single earner couples with a male earner. Retired tax units (both single and couple-headed) experienced the lowest decreases in disposable income between 2008 and 2013. Couples with no earners (both with and without children) also saw lower than average income losses. Single male-headed, working age tax units with no children saw slightly smaller losses than their female counterparts but only marginally so. The opposite is true in the case of single headed retired tax units, with
Gender Impact of Tax and Benefit Changes 47
women losing marginally less than men. Similar quintile impacts were found for single, childless male and female tax units with large losses at the top and bottom quintiles.
At an individual income level females suffered a higher average loss in disposable income. The impact of this differential on command over resources depends crucially on the extent of sharing of income within the couple, as well as on the relative incomes of the partners. Watson et al. (2013) finds a high level of income sharing amongst Irish couples. The greatest individual income losses in percentage terms were the individual incomes of women in low-income couples with married/cohabiting women in the bottom income quintile losing 5 times more than men. A substantial portion of this gap was due to the reductions in Child Benefit24 with over one third due to other social welfare reductions. Losses for high income couples were also high, and again there was a gap with women’s individual incomes falling by more than men’s. This gap is seen throughout the income distribution. At the upper end of the income distribution (upper quintile) Child Benefit reductions do little to explain this gap which is driven mainly by the differing impact of public sector pay changes by gender.
Comparison with Browne’s UK analysis shows that over a 5 year austerity period (2008-2013 for Ireland, 2010-2015 for the UK) Ireland’s austerity measures reduced household incomes by about 9 per cent, while UK measures are set to cut incomes by less than 4 per cent. A key feature, nonetheless, is that UK measure will, by 2015, have reduced the incomes of zero earner couples by more than the Irish approach. For single adults, the UK measures lead to slightly greater percentage reductions in women’s incomes, whereas the reverse is true for Ireland.
Finally, this report illustrates the potential for the use of microsimulation models in the analysis of tax and benefit policy changes form a gender perspective. It has dealt with one of the main issues involved when conducting gender-based analysis – namely how to deal with couples. By examining the impact of policy changes under a zero income sharing and full income sharing assumption, appropriate ‘bounds’ were put on potential losses which can be used to inform policymakers. The approach adopted could also be adapted to examine the impact of tax and welfare policy changes – proposed or actual – on a number of different dimensions, including disability, age and marital status.
24
Some of the reductions seen in child benefit in recent years have been offset for social welfare recipients by increases in the additional amount paid for qualified children, This may have resulted in transferring income from the mother to the father, however, if he is the social welfare recipient within the couple whereas Child Benefit is generally paid to the mother.
48 Gender Impact of Tax and Benefit Changes
BIBLIOGRAPHY
Apps, P. and Rees, R. (2007). "Cooperative Household Models," IZA Discussion Papers 3127, Institute for the Study of Labor (IZA). Avram, S., Figari, F., Leventi, C., Levy, H., Navicke, J., Matsaganis, M., Militaru, E., Paulus, A., Rastringina, O. and Sutherland , H. (2013). “The Distributional Effects of Fiscal Consolidation in Nine Countries”, EUROMOD Working Paper No. EM 2/13. Bargain, O. and Callan, T. (2010). “Analysing the effects of tax-benefit reforms on income distribution: a decomposition approach” Journal of Economic Inequality, 2008, Published Online 23 September 2008, http://dx.doi.org/10.1007/s10888-008-9101-4 Becker, G. (1981). A Treatise on the Family. Cambridge: Harvard University Press. Bellamy, K. (2002). “Gender Budgeting: A Background Paper for the Council of Europe’s Informal Network of Experts on Gender Budgeting”, November.
Bellamy, K., Bennett, F. and Millar, J. (2006). “Who Benefits? A Gender Analysis of the UK Benefits and Tax Credits System”, Fawcett Society.
Bennett, F., (2008). “Gender, Tax Policies and Tax Reform in Comparative Perspective”, GeNet Working Paper No. 30.
Bennett, F. and Sutherland, H. (2011). “The Importance of Independent Income: Understanding the Role of Non-Means-Tested Earnings Replacement Benefits,” ISER Working Paper Series 2011-09, Institute for Social and Economic Research. Bozio, A., Crawford, R. and Tetlow, G. (2010) “The history of state pensions in the UK: 1948 to 2010”. IFS Briefing Note BN105, Institute for Fiscal Studies.
Browne, J. (2011). “The Impact of Tax And Benefit Reforms by Sex: Some Simple Analysis”, IFS Briefing Notes,. Institute for Fiscal Studies Browning, M., Bourguignon, F., Chiappori, P.-A. and Lechene, V. (1994). "Income andOutcomes: A Structural Model of Intrahousehold Allocation," Journal of PoliticalEconomy, University of Chicago Press, Vol. 102(6), pp. 1067-96. December.
Browning, M., Chiappori, P-A. and Lechene, V. (2010). "Distributional Effects inHousehold Models: Separate Spheres and Income Pooling," Economic Journal Royal Economic Society, Vol. 120(545), pp. 786-799, 06. Budlender, D., Sharp, R. and Allen, K. (1999). How to do Gender Sensitive Budget Analysis: Contemporary Research and Practice, Australia: Commonwealth Secretariat. Callan, T. (2006). “Gender and Income Tax in Ireland: A Tale of Three Systems”,paper presented at Levy Economics Institute conference on Gender, Tax Policies and Tax Reform in Comparative Perspective, http://www.levyinstitute.org/pubs/CP/May2006_symposium_papers/paper_Callan.pdf
Callan, T. (2013). “Distributional impact of Budgets 2009 to 2013: An Update”, available online at: http://www.esri.ie/__uuid/3a60f7b2-1701-41f9-bf29-a92621f4f4f/SWITCH-September-2013-update-revised_CK.pdf Callan, T., Coleman, K. and Walsh, J.R. (2006). "Assessing the Impact of Tax/Transfer Policy Changes on Poverty: Methodological Issues and Some European Evidence", Research in Labor Economics, Vol. 25.
Gender Impact of Tax and Benefit Changes 49
Callan, T., Keane, C.,Savage, M. and Walsh, J.R. (2013). “Distributional Impact of Tax, Welfare and Public Service Pay Policies: Budget 2014 and Budgets 2009-2014”. Special Article in Quarterly Economic Commentary, Winter 2013.
Callan, T., Keane, C., Savage, M. and Walsh, J.R. (2012). “Distributional Impact of Tax, Welfare and Public Service Pay Policies: 2009-2012”. Special Article in Quarterly Economic Commentary, Winter 2011.
Callan, T., Keeney, M., Nolan, B. and Walsh, J. (2001). Reforming Tax and Welfare, Policy Research Series Paper No. 42, Dublin: The Economic and Social Research Institute.
Callan, T., Keeney, Mary J. and Walsh, J.R. (2001). "Income Tax and Welfare Policies: Some Current Issues", Callan, T. & McCoy, D. (eds.), Budget Perspectives, Dublin: The Economic and Social Research Institute
Callan, T., Nolan, B. and Walsh, J. (1999). “Income Tax and Social Welfare Policies” in T. Callan (ed.), Budget Perspectives 1999, Dublin: The Economic and Social Research Institute.
Callan, T., Nolan, B., Walsh J. and Nestor, R. (2000). “Income Tax and Social WelfarePolicies” in C. Kearney (ed.), Budget Perspectives 2000, Dublin: The Economic and Social Research Institute. Callan, T. and Walsh, J. (2006). “Assessing the impact of tax/transfer policy changes on poverty: methodological issues and some European evidence,” EUROMOD Working Papers EM1/06, EUROMOD at the Institute for Social and Economic Research.
Cantillon, S. (2011). 'Making Equality Count'. Administration, 59 (2).
Cantillon, S. and Nolan, B. (2001). “Poverty within households: Measuring gender differences using nonmonetary indicators”. Feminist Economics, Vol. 7 (1), pp. 5-23. Cantillon, S. and O'Shea, E. (2001). “Social Expenditure, Redistribution and Participation”. in Cantillon S, Corrigan, Kirby P. And O’Flynn J. (eds) : Rich and Poor: Perspectives in Tackling Inequality in Ireland Dublin: Oak Tree Press.in association with Combat Poverty Agency
Chen, Z. and Woolley, F. (2001). “Cournot-Nash Model of Family Decision Making”, Economic Journal, Royal Economic Society, Vol. 111(474), pp. 722-48. October.
Daly, M. and Rake, K. (2003): Gender and the Welfare State. Care, Work and Welfare in Europe and the USA. Cambridge: Polity Press. Duncan, A., Giles, C.and Webb, S. (1994). Social Security Reform and Women’s Independent Incomes, Research Discussion Series no. 6, Manchester: Equal Opportunities Commission.
Equality Budgeting Campaign, (2012). Equality Budgeting in Ireland: An Information Booklet.
Figari, F., Immervoll, H., Levy, H. and Sutherland, H. (2007). “Inequalities Within Couples: Market Income and the Role of Taxes and Benefits in Europe”, Eastern Economic Journal, 2011, 37, pp. 344–366.
Immervoll, H. and Barber, D. (2005). “Can Parents Afford to Work?: Childcare Costs, Tax-Benefit Policies and Work Incentives,” OECD Social, Employment and Migration Working Papers 31, OECD Publishing. Jones, G. (1992). ‘Short-term reciprocity in parent–child economic exchanges’, in C. Marsh and S. Arber (eds), Household and Family: Divisions and Change, London: Macmillan. Keane, C., Callan, T., Savage, M., Walsh, J.R. and Timoney, K. (2012). “Identifying Policy Impacts in the Crisis: Microsimulation Evidence on Tax and Welfare”. Paper presented at the Statistical and Social Inquiry Society of Ireland, October 2012.
50 Gender Impact of Tax and Benefit Changes
Klatzer, E. (2012). “With Gender Budgeting to more Gender Equality in Europa - Framework Conditions and Transformation Processes”, presentation to conference on Gender Budgeting in the ESF: Opportunities, Examples and Limits, Berlin, 27 September 2012.
Lundberg S., Pollak, R. and Wales, J. (1997) “Do Husbands and Wives Pool Their Resources? Evidence from the United Kingdom Child Benefit,” Journal of Human Resources, University of Wisconsin Press, Vol. 32(3), pp. 463-480.
Lynch K., Baker, J. and Cantillon, S. (2001). Equality: Frameworks for Change, Report prepared for the National Economic and Social Forum, Dublin: Equality Studies Centre.
Madden, D. (1999). “The Kids are Alright? An Analysis of Child Benefit Using Irish Data,” Working Papers 1999/26, School Of Economics, University College Dublin. McGuinness, S., Kelly, E., O'Connell, P.J. and Callan, T. (2009). "Assessing the Impact of Wage Bargaining and Worker Preferences on the Gender Pay Gap in Ireland Using the National Employment Survey 2003," WP317, Economic and Social Research Institute. Murphy, M. (2003). A Woman’s Model of Social Welfare Reform, Dublin: National Women’s Council of Ireland Murphy, M. and Hegarty, M. (2011). “Gender and Crisis Irish Thematic National Report”, submitted to EU as contract for Irish national expert 2010 (European Network of Experts on Gender and Social Inclusion (EGGSI)
Murphy, M. and Hegarty, M. (2010). “Active Ageing and Gender Equality Policies Irish National Report” Submitted to EU as contract for Irish national expert 2010 (European Network of Experts on Gender and Social Inclusion (EGGSI).
Murphy, M. and McCashin, T. (2008). Irish pension reform: A gender and anti-poverty perspective, Dublin: National Women’s Council of Ireland
National Equality Panel (2010). An Anatomy of Economic Inequality in the UK, Report of the National Equality Panel, CASEReport 60, London: Government Equalities Office and Centre for Analysis of Social Exclusion, London School of Economics.
Nivakoski, S. and Barrett, A. (2012). “Supplementary Pensions and the Income of Ireland’s Retirees”, Dublin: TILDA - Irish Longitudinal Study on Ageing.
Nolan, B. and McCormick, B. (1999). “The Numbers Affected by the Minimum Wage”, Final Report on the Inter-Departmental Group on the Implementation of a National Minimum Wage, Dublin: The Stationery Office.
O'Neill, D., Nolan, B. and Williams, J. (2006). “Evaluating the Impact of a National Minimum Wage: Evidence from a New Survey of Firms,” Labour: Review of Labour Economics and Industrial Relations, Vol. 20, No. 1, pp. 63-90. March.
O’Connor, O. and Murphy, M. (2008). “Women and Social Welfare” in U.Barry (Ed.) Where Are We Now; New Feminist Perspectives on Women in Contemporary Ireland. TASC, Dublin: New Island Press.
Paulus, A., Figari, F., Matsaganis, M. and Sutherland, H. (2013) “The Design and Distributional Effects of Fiscal Consolidation Measures in the European Union”
Russell, H., McGinnity, F., Callan, T. and Keane, C. (2009). A Woman’s Place: Female Participation in the Irish Labour Market, Dublin: Equality Authority. and the Economic and Social Research Institute.
Gender Impact of Tax and Benefit Changes 51
Russell, H., McGinnity, F. and Kingston, G. (2014), Gender and the Quality of Work: From Boom to Recession, Dublin: Equality Authority and the Economic and Social Research Institute.
Samuelson, P. (1956). “Social Indifference Curves,” Quarterly Journal of Economics Vol. 70, pp. 1-22.
Scottish Government (2012a) The Position of Scotland’s Equality Groups: Revisiting Resilience in 2011, Edinburgh: Scottish Government, available at www.scotland.gov.uk Scottish Government (2012b) Equality Statement: Scottish Draft Budget 2013-14, Edinburgh: Scottish Government, available at www.scotland.gov.uk Sutherland, H. (1997). “Women, Men and the Redistribution of Income,” Fiscal Studies, Vol. 18(1), pp. 1-22. February. TASC (2011). Winners and Losers? Equality Lessons for Budget 2012, Dublin: TASC.
Watson, D., Maitre, B. and Cantillon, S. (2013). Implications of Income Pooling and Household Decision-making for Poverty and Deprivation: An Analysis of the SILC 2010 Special Module for Ireland, Social Inclusion Technical Paper No. 4, Dublin: Department of Social Protection.
Webb, S. (1993). ‘Women’s Incomes: Past, Present and Prospects’, Fiscal Studies, Vol. 14, no. 4, pp. 14-36.

This report can be downloaded at: www.equality.ie/research and www.esri.ie
EA_131_A4_02.indd 11-12 17/09/2014 10:30
EqualityResearchSeries
Gen
der Im
pact of Tax
and
Ben
efi t Ch
anges: A
Microsim
ulation
An
alysis
2757077819089
ISBN 9781908275707
Gender Impact of Tax and Benefi t Changes
A Microsimulation Analysis
Claire Keane, Tim Callan & John R. Walsh
The Equality Authority
Birchgrove HouseRoscrea Co. Tipperary Phone: (0505) 24126 Fax: (0505) 22388
Jervis HouseJervis StreetDublin 1Phone: (01) 417 3336 Fax: (01) 417 3331
Public Information CentreLo Call: 1890 245 545Email: [email protected]
www.equality.ie
The Economic and Social Research Institute
Whitaker Square Sir John Rogerson’s Quay Dublin 2
www.esri.ie
EA_131_A4_02.indd 9-10 17/09/2014 10:30


![Callan Book 2 [Stage 3]](https://img.pdfslide.us/doc/110x75/55cf8f7c550346703b9ce040/callan-book-2-stage-3-564765e022b75.jpg)