Embed Size (px)
Citation preview
Multinational Firms and Export
(Life-Cycle) Dynamics
Anna Gumpert1 Andreas Moxnes 2
Natalia Ramondo 3 Felix Tintelnot 4
1U. of Munich and CESifo 2U. of Oslo and NBER3UC-San Diego and NBER 4U. of Chicago and NBER
RIETI
August 4, 2016
Gumpert, Moxnes, Ramondo, Tintelnot Multinational Firms and Export Dynamics 07/02/2016 1 / 25
Motivation
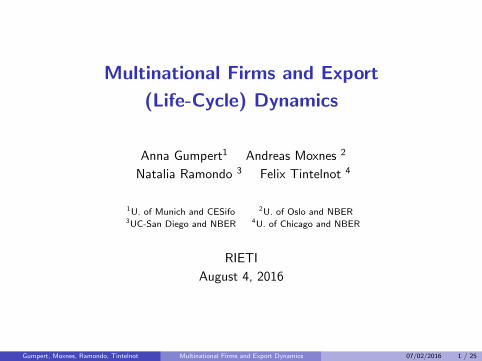
Multinational firms (MNEs) are important group of firms
I Larger than exporters or domestic firms.
I Disproportionate share of aggregate employment.
I Drivers of R&D and innovation
e.g. France: MNE affiliates account for
2.0% of manufacturing enterprises
31.8% of manufacturing sales
26.2% of manufacturing employment
27.4% of R&D spending in manufacturing sector(Antras & Yeaple, 2014, Table 2.1; figures for 2007.)
Gumpert, Moxnes, Ramondo, Tintelnot Multinational Firms and Export Dynamics 07/02/2016 2 / 25
How are Multinational Enterprises (MNEs) born?
I Role of the transition from exporting to MNE
I Role of sunk costs of MNE entry (vs export entry)
I Role of learning
Gumpert, Moxnes, Ramondo, Tintelnot Multinational Firms and Export Dynamics 07/02/2016 3 / 25
This paper
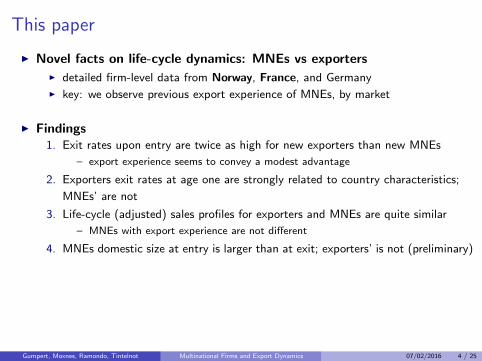
I Novel facts on life-cycle dynamics: MNEs vs exportersI detailed firm-level data from Norway, France, and GermanyI key: we observe previous export experience of MNEs, by market
I Findings1. Exit rates upon entry are twice as high for new exporters than new MNEs
– export experience seems to convey a modest advantage
2. Exporters exit rates at age one are strongly related to country characteristics;
MNEs’ are not
3. Life-cycle (adjusted) sales profiles for exporters and MNEs are quite similar
– MNEs with export experience are not different
4. MNEs domestic size at entry is larger than at exit; exporters’ is not (preliminary)
I Theory & calibration (preliminary)I simple dynamic extension of Helpman, Melitz, & Yeaple (04)I MNE sunk costs suffice to match dataI Is there room for learning? Over what?
Gumpert, Moxnes, Ramondo, Tintelnot Multinational Firms and Export Dynamics 07/02/2016 4 / 25
This paper
I Novel facts on life-cycle dynamics: MNEs vs exportersI detailed firm-level data from Norway, France, and GermanyI key: we observe previous export experience of MNEs, by market
I Findings1. Exit rates upon entry are twice as high for new exporters than new MNEs
– export experience seems to convey a modest advantage
2. Exporters exit rates at age one are strongly related to country characteristics;
MNEs’ are not
3. Life-cycle (adjusted) sales profiles for exporters and MNEs are quite similar
– MNEs with export experience are not different
4. MNEs domestic size at entry is larger than at exit; exporters’ is not (preliminary)
I Theory & calibration (preliminary)I simple dynamic extension of Helpman, Melitz, & Yeaple (04)I MNE sunk costs suffice to match dataI Is there room for learning? Over what?
Gumpert, Moxnes, Ramondo, Tintelnot Multinational Firms and Export Dynamics 07/02/2016 4 / 25
Literature
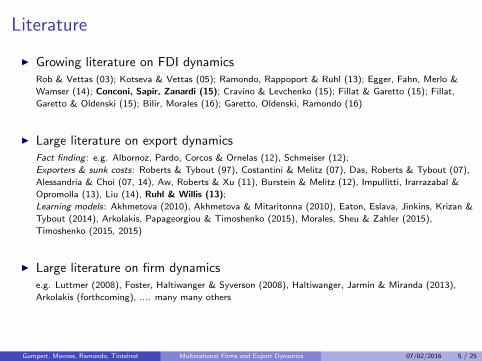
I Growing literature on FDI dynamicsRob & Vettas (03); Kotseva & Vettas (05); Ramondo, Rappoport & Ruhl (13); Egger, Fahn, Merlo &
Wamser (14); Conconi, Sapir, Zanardi (15); Cravino & Levchenko (15); Fillat & Garetto (15); Fillat,
Garetto & Oldenski (15); Bilir, Morales (16); Garetto, Oldenski, Ramondo (16)
I Large literature on export dynamicsFact finding : e.g. Albornoz, Pardo, Corcos & Ornelas (12), Schmeiser (12);
Exporters & sunk costs: Roberts & Tybout (97), Costantini & Melitz (07), Das, Roberts & Tybout (07),
Alessandria & Choi (07, 14), Aw, Roberts & Xu (11), Burstein & Melitz (12), Impullitti, Irarrazabal &
Opromolla (13), Liu (14), Ruhl & Willis (13);
Learning models: Akhmetova (2010), Akhmetova & Mitaritonna (2010), Eaton, Eslava, Jinkins, Krizan &
Tybout (2014), Arkolakis, Papageorgiou & Timoshenko (2015), Morales, Sheu & Zahler (2015),
Timoshenko (2015, 2015)
I Large literature on firm dynamicse.g. Luttmer (2008), Foster, Haltiwanger & Syverson (2008), Haltiwanger, Jarmin & Miranda (2013),
Arkolakis (forthcoming), .... many many others
Gumpert, Moxnes, Ramondo, Tintelnot Multinational Firms and Export Dynamics 07/02/2016 5 / 25
Data
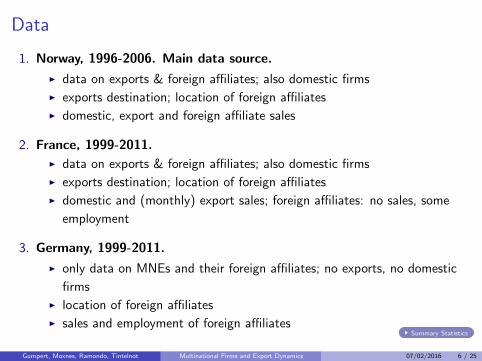
1. Norway, 1996-2006. Main data source.
I data on exports & foreign affiliates; also domestic firmsI exports destination; location of foreign affiliatesI domestic, export and foreign affiliate sales
2. France, 1999-2011.I data on exports & foreign affiliates; also domestic firmsI exports destination; location of foreign affiliatesI domestic and (monthly) export sales; foreign affiliates: no sales, some
employment
3. Germany, 1999-2011.
I only data on MNEs and their foreign affiliates; no exports, no domestic
firmsI location of foreign affiliatesI sales and employment of foreign affiliates
Summary Statistics
Gumpert, Moxnes, Ramondo, Tintelnot Multinational Firms and Export Dynamics 07/02/2016 6 / 25
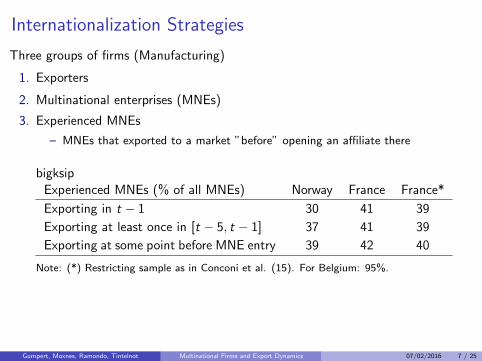
Internationalization Strategies
Three groups of firms (Manufacturing)
1. Exporters
2. Multinational enterprises (MNEs)
3. Experienced MNEs
– MNEs that exported to a market ”before” opening an affiliate there
bigksipExperienced MNEs (% of all MNEs) Norway France France*
Exporting in t − 1 30 41 39
Exporting at least once in [t − 5, t − 1] 37 41 39
Exporting at some point before MNE entry 39 42 40
Note: (*) Restricting sample as in Conconi et al. (15). For Belgium: 95%.
Gumpert, Moxnes, Ramondo, Tintelnot Multinational Firms and Export Dynamics 07/02/2016 7 / 25
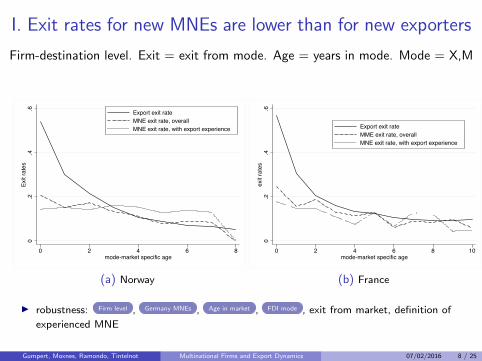
I. Exit rates for new MNEs are lower than for new exporters
Firm-destination level. Exit = exit from mode. Age = years in mode. Mode = X,M
0.2
.4.6
Exit
rate
s
0 2 4 6 8mode-market specific age
Export exit rateMNE exit rate, overallMNE exit rate, with export experience
(a) Norway
0.2
.4.6
exit
rate
s0 2 4 6 8 10
mode-market specific age
Export exit rateMME exit rate, overallMNE exit rate, with export experience
(b) France
I robustness: Firm level , Germany MNEs , Age in market , FDI mode , exit from market, definition of
experienced MNE
Gumpert, Moxnes, Ramondo, Tintelnot Multinational Firms and Export Dynamics 07/02/2016 8 / 25
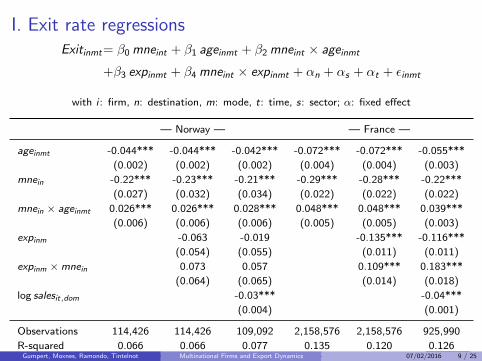
I. Exit rate regressionsExitinmt= β0 mneint + β1 ageinmt + β2 mneint × ageinmt
+β3 expinmt + β4 mneint × expinmt + αn + αs + αt + εinmt
with i : firm, n: destination, m: mode, t: time, s: sector; α: fixed effect
— Norway — — France —
ageinmt -0.044*** -0.044*** -0.042*** -0.072*** -0.072*** -0.055***
(0.002) (0.002) (0.002) (0.004) (0.004) (0.003)
mnein -0.22*** -0.23*** -0.21*** -0.29*** -0.28*** -0.22***
(0.027) (0.032) (0.034) (0.022) (0.022) (0.022)
mnein × ageinmt 0.026*** 0.026*** 0.028*** 0.048*** 0.048*** 0.039***
(0.006) (0.006) (0.006) (0.005) (0.005) (0.003)
expinm -0.063 -0.019 -0.135*** -0.116***
(0.054) (0.055) (0.011) (0.011)
expinm ×mnein 0.073 0.057 0.109*** 0.183***
(0.064) (0.065) (0.014) (0.018)
log salesit,dom -0.03*** -0.04***
(0.004) (0.001)
Observations 114,426 114,426 109,092 2,158,576 2,158,576 925,990
R-squared 0.066 0.066 0.077 0.135 0.120 0.126Age dummiesGumpert, Moxnes, Ramondo, Tintelnot Multinational Firms and Export Dynamics 07/02/2016 9 / 25
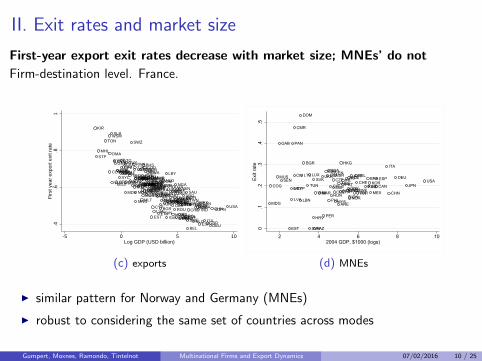
II. Exit rates and market size
First-year export exit rates decrease with market size; MNEs’ do not
Firm-destination level. France.
AFGAGO
ALB
AREARG
ARM
ATG
AUS
AUT
AZE
BDI
BEL
BENBFA
BGD
BGR
BHR
BHS
BIH
BLR
BLZ
BOL
BRA
BRB
BRNBTN BWACAF
CAN
CHE
CHL
CHN
CIVCMR
COD
COG
COL
COMCPV
CRI
CYP
CZE
DEU
DJI
DMA
DNK
DOMDZA
ECU
EGY
ERI
ESP
EST
ETH
FIN
FJI
GAB
GBR
GEO GHA
GIN
GMB
GNB
GNQ
GRC
GRD
GTM
GUY
HKG
HND
HRV
HTI
HUN
IDN
INDIRL
IRN
IRQISL
ISR
ITA
JAM
JOR
JPN
KAZ
KENKGZKHM
KIR
KNA
KOR
KWT
LAO
LBN
LBRLBYLCA
LKA
LSO
LTULVA
MAR
MDA
MDG
MDV
MEX
MHL
MKD
MLI
MLT
MMR
MNG
MOZMRT
MUS
MWI
MYS
NAMNER
NGANIC
NLD
NOR
NPL
NZL
OMNPAK
PAN
PERPHL
PNG
POLPRT
PRYQAT
ROURUS
RWA
SAU
SDNSEN
SGP
SLB
SLE
SLV
STP
SUR
SVKSVN
SWE
SWZ
SYC
SYR
TCDTGO
THA
TJK
TKM
TON
TTO
TUN TURTWN
TZAUGA
UKR
URY
USA
UZB
VCT
VEN
VNM
VUT
WSM
YEM
ZAF
ZMBZWE
.4.6
.81
Firs
t yea
r ex
port
exi
t rat
e
-5 0 5 10Log GDP (USD billion)
(c) exports
ARE
ARG
AUTBEL
BGR
BRA
CANCHE
CHL
CHN
CIV
CMR
COGCOL
CYP
CZE DEU
DNK
DOM
DZAEGY
ESP
EST
FIN
GAB
GRC
HKG
HRV
HUN IDN
INDIRL
ISR
ITA
JPN
KAZ
KOR
LBN
LTULUX
LVAMAR
MDG
MEX
MUS
MYS
NGA
NOR
PAN
PER
PHL
POL
PRT RUSSAU
SEN
SGP
SVK
SVN
SWETHATUN
TURTWN
UKR
URY
USA
VEN
VNM
ZAF
0.1
.2.3
.4.5
Exi
t rat
e
2 4 6 8 102004 GDP, $1000 (logs)
(d) MNEs
I similar pattern for Norway and Germany (MNEs)
I robust to considering the same set of countries across modes
Gumpert, Moxnes, Ramondo, Tintelnot Multinational Firms and Export Dynamics 07/02/2016 10 / 25
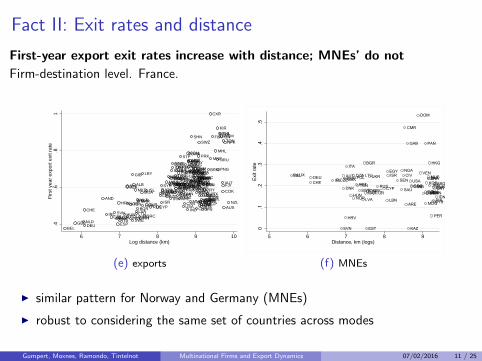
Fact II: Exit rates and distance
First-year export exit rates increase with distance; MNEs’ do not
Firm-destination level. France.
ABW
AFGAGO
AIA
ALB
AND
ANT
AREARG
ARM
ATG
AUS
AUT
AZE
BDI
BEL
BENBFA
BGD
BGR
BHR
BHS
BIH
BLR
BLZBMU
BOL
BRA
BRB
BRNBTNBWACAF
CAN
CHE
CHL
CHN
CIVCMRCOGCOK
COL
COMCPV
CRI
CUB
CXR
CYM
CYP
CZE
DEU
DJI
DMA
DNK
DOMDZA
ECU
EGY
ERI
ESP
EST
ETH
FIN
FJI
FLK
GAB
GBR
GEO GHA
GIBGIN
GMB
GNB
GNQ
GRC
GRD
GTM
GUY
HND
HRV
HTI
HUN
IDN
INDIRL
IRN
IRQISL
ISR
ITA
JAM
JOR
JPN
KAZ
KENKGZ KHM
KIR
KNA
KOR
KWT
LAO
LBN
LBRLBY LCA
LKA
LSO
LTULVA
MAC
MAR
MDA
MDG
MDV
MEX
MHL
MKD
MLI
MLT
MMR
MNG
MNP
MOZMRT
MSR
MUS
MWI
MYS
NAMNER
NFK
NGANIC
NLD
NOR
NPL
NRU
NZL
OMNPAK
PAN
PCN
PERPHL
PNG
POL
PRK
PRT
PRYQAT
RUS
RWA
SAU
SDNSEN
SGP
SHNSLB
SLE
SLV
SOMSTP
SUR
SVKSVN
SWE
SWZ
SYC
SYR
TCA
TCDTGO
THA
TJK
TKL
TKM
TON
TTO
TUN TURTWN
TZAUGA
UKR
URY
USA
UZB
VCT
VEN
VGB
VNM
VUT
WSM
YEM
ZAF
ZMBZWE
.4.6
.81
Firs
t yea
r ex
port
exi
t rat
e
6 7 8 9 10Log distance (km)
(e) exports
ARE
ARG
AUTBEL
BGR
BRA
CANCHE
CHL
CHN
CIV
CMR
COGCOL
CYP
CZEDEU
DNK
DOM
DZAEGY
ESP
EST
FIN
GAB
GRC
HKG
HRV
HUN IDN
INDIRL
ISR
ITA
JPN
KAZ
KOR
LBN
LTULUX
LVAMAR
MDG
MEX
MUS
MYS
NGA
NOR
PAN
PER
PHL
POL
PRT RUSSAU
SEN
SGP
SVK
SVN
SWE THATUN
TUR TWN
UKR
URY
USA
VEN
VNM
ZAF
0.1
.2.3
.4.5
Exi
t rat
e
5 6 7 8 9Distance, km (logs)
(f) MNEs
I similar pattern for Norway and Germany (MNEs)
I robust to considering the same set of countries across modes
Gumpert, Moxnes, Ramondo, Tintelnot Multinational Firms and Export Dynamics 07/02/2016 11 / 25
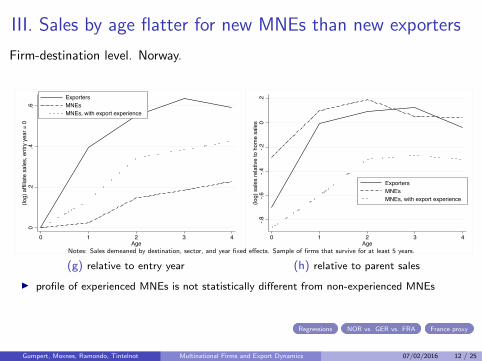
III. Sales by age flatter for new MNEs than new exporters
Firm-destination level. Norway.
0.2
.4.6
(log)
affi
liate
sal
es, e
ntry
yea
r = 0
0 1 2 3 4Age
ExportersMNEsMNEs, with export experience
(g) relative to entry year-.8
-.6-.4
-.20
.2(lo
g) s
ales
rela
tive
to h
ome
sale
s
0 1 2 3 4Age
ExportersMNEsMNEs, with export experience
(h) relative to parent sales
Notes: Sales demeaned by destination, sector, and year fixed effects. Sample of firms that survive for at least 5 years.
I profile of experienced MNEs is not statistically different from non-experienced MNEs
Regressions NOR vs. GER vs. FRA France proxy
Gumpert, Moxnes, Ramondo, Tintelnot Multinational Firms and Export Dynamics 07/02/2016 12 / 25
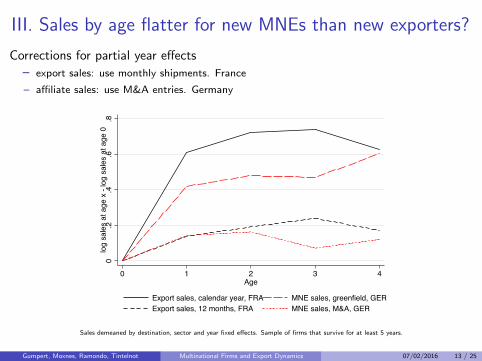
III. Sales by age flatter for new MNEs than new exporters?
Corrections for partial year effects
– export sales: use monthly shipments. France
– affiliate sales: use M&A entries. Germany
0.2
.4.6
.8lo
g sa
les
at a
ge x
- lo
g sa
les
at a
ge 0
0 1 2 3 4Age
Export sales, calendar year, FRAExport sales, 12 months, FRA
MNE sales, greenfield, GERMNE sales, M&A, GER
Sales demeaned by destination, sector and year fixed effects. Sample of firms that survive for at least 5 years.
Gumpert, Moxnes, Ramondo, Tintelnot Multinational Firms and Export Dynamics 07/02/2016 13 / 25
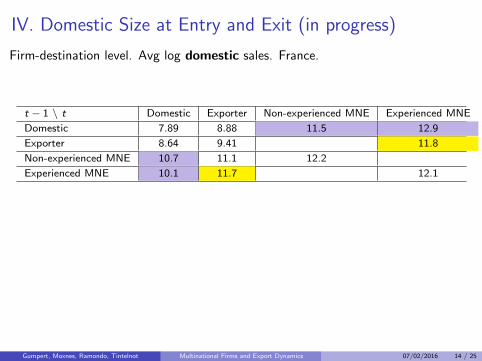
IV. Domestic Size at Entry and Exit (in progress)
Firm-destination level. Avg log domestic sales. France.
t − 1 \ t Domestic Exporter Non-experienced MNE Experienced MNE
Domestic 7.89 8.88 11.5 12.9
Exporter 8.64 9.41 11.8
Non-experienced MNE 10.7 11.1 12.2
Experienced MNE 10.1 11.7 12.1
Gumpert, Moxnes, Ramondo, Tintelnot Multinational Firms and Export Dynamics 07/02/2016 14 / 25
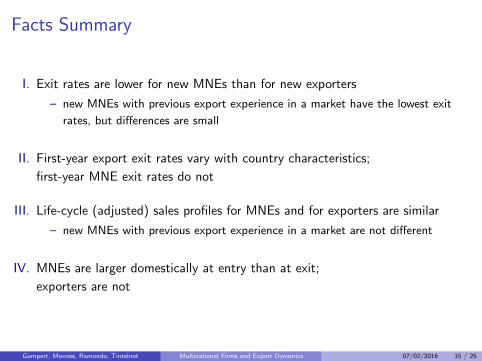
Facts Summary
I. Exit rates are lower for new MNEs than for new exporters
– new MNEs with previous export experience in a market have the lowest exit
rates, but differences are small
II. First-year export exit rates vary with country characteristics;
first-year MNE exit rates do not
III. Life-cycle (adjusted) sales profiles for MNEs and for exporters are similar
– new MNEs with previous export experience in a market are not different
IV. MNEs are larger domestically at entry than at exit;
exporters are not
Gumpert, Moxnes, Ramondo, Tintelnot Multinational Firms and Export Dynamics 07/02/2016 15 / 25
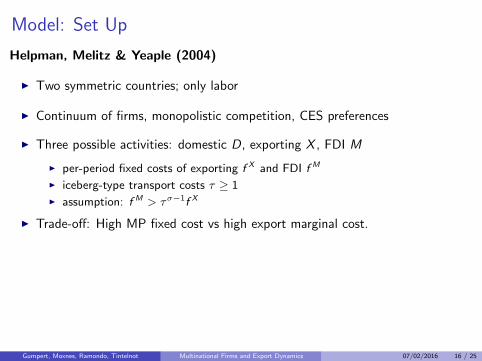
Model: Set Up
Helpman, Melitz & Yeaple (2004)
I Two symmetric countries; only labor
I Continuum of firms, monopolistic competition, CES preferences
I Three possible activities: domestic D, exporting X , FDI M
I per-period fixed costs of exporting f X and FDI f M
I iceberg-type transport costs τ ≥ 1I assumption: f M > τσ−1f X
I Trade-off: High MP fixed cost vs high export marginal cost.
Gumpert, Moxnes, Ramondo, Tintelnot Multinational Firms and Export Dynamics 07/02/2016 16 / 25
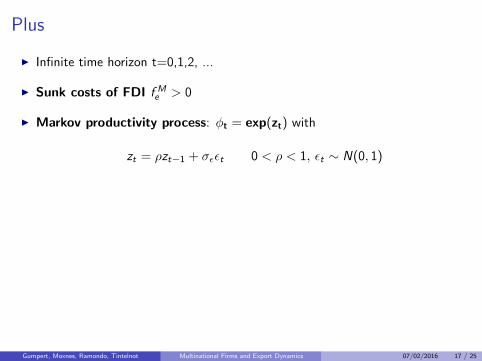
Plus
I Infinite time horizon t=0,1,2, ...
I Sunk costs of FDI f Me > 0
I Markov productivity process: φt = exp(zt) with
zt = ρzt−1 + σεεt 0 < ρ < 1, εt ∼ N(0, 1)
Gumpert, Moxnes, Ramondo, Tintelnot Multinational Firms and Export Dynamics 07/02/2016 17 / 25
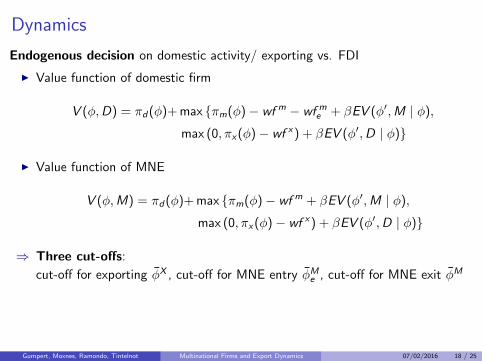
Dynamics
Endogenous decision on domestic activity/ exporting vs. FDI
I Value function of domestic firm
V (φ,D) = πd(φ)+ max {πm(φ)− wf m − wf me + βEV (φ′,M | φ),
max (0, πx(φ)− wf x) + βEV (φ′,D | φ)}
I Value function of MNE
V (φ,M) = πd(φ)+ max {πm(φ)− wf m + βEV (φ′,M | φ),
max (0, πx(φ)− wf x) + βEV (φ′,D | φ)}
⇒ Three cut-offs:
cut-off for exporting φX , cut-off for MNE entry φMe , cut-off for MNE exit φM
Gumpert, Moxnes, Ramondo, Tintelnot Multinational Firms and Export Dynamics 07/02/2016 18 / 25
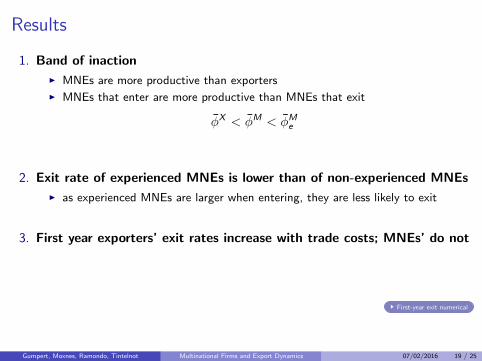
Results
1. Band of inaction
I MNEs are more productive than exportersI MNEs that enter are more productive than MNEs that exit
φX < φM < φMe
2. Exit rate of experienced MNEs is lower than of non-experienced MNEs
I as experienced MNEs are larger when entering, they are less likely to exit
3. First year exporters’ exit rates increase with trade costs; MNEs’ do not
First-year exit numerical
Gumpert, Moxnes, Ramondo, Tintelnot Multinational Firms and Export Dynamics 07/02/2016 19 / 25
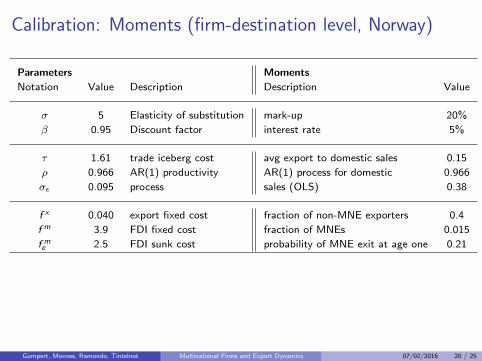
Calibration: Moments (firm-destination level, Norway)
Parameters Moments
Notation Value Description Description Value
σ 5 Elasticity of substitution mark-up 20%
β 0.95 Discount factor interest rate 5%
τ 1.61 trade iceberg cost avg export to domestic sales 0.15
ρ 0.966 AR(1) productivity AR(1) process for domestic 0.966
σε 0.095 process sales (OLS) 0.38
f x 0.040 export fixed cost fraction of non-MNE exporters 0.4
f m 3.9 FDI fixed cost fraction of MNEs 0.015
f me 2.5 FDI sunk cost probability of MNE exit at age one 0.21
Gumpert, Moxnes, Ramondo, Tintelnot Multinational Firms and Export Dynamics 07/02/2016 20 / 25
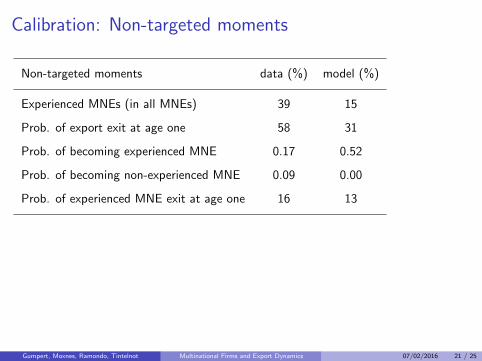
Calibration: Non-targeted moments
Non-targeted moments data (%) model (%)
Experienced MNEs (in all MNEs) 39 15
Prob. of export exit at age one 58 31
Prob. of becoming experienced MNE 0.17 0.52
Prob. of becoming non-experienced MNE 0.09 0.00
Prob. of experienced MNE exit at age one 16 13
Gumpert, Moxnes, Ramondo, Tintelnot Multinational Firms and Export Dynamics 07/02/2016 21 / 25
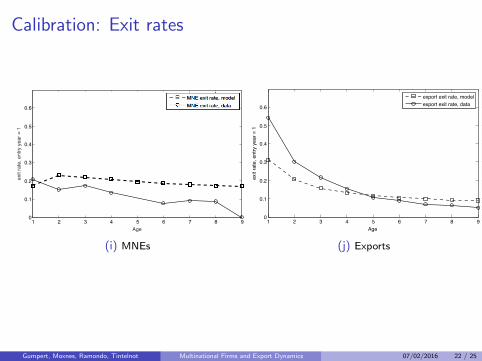
Calibration: Exit rates
1 2 3 4 5 6 7 8 90
0.1
0.2
0.3
0.4
0.5
0.6
Age
exit
rate
, ent
ry y
ear =
1
(i) MNEs
1 2 3 4 5 6 7 8 90
0.1
0.2
0.3
0.4
0.5
0.6
Age
exit
rate
, ent
ry y
ear =
1
export exit rate, modelexport exit rate, data
(j) Exports
Gumpert, Moxnes, Ramondo, Tintelnot Multinational Firms and Export Dynamics 07/02/2016 22 / 25
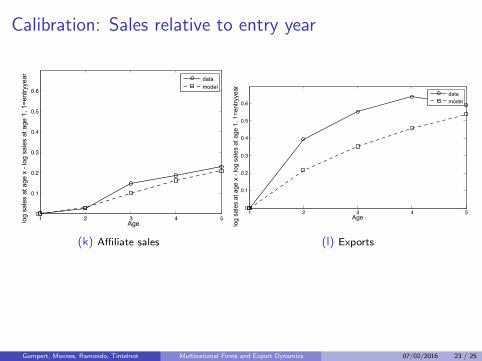
Calibration: Sales relative to entry year
1 2 3 4 50
0.1
0.2
0.3
0.4
0.5
0.6
datamodel
Agelog
sale
s at
age
x -
log
sale
s at
age
1, 1
=ent
ryye
ar
(k) Affiliate sales
1 2 3 4 50
0.1
0.2
0.3
0.4
0.5
0.6
datamodel
Age
log
sale
s at
age
x -
log
sale
s at
age
1, 1
=ent
ryye
ar(l) Exports
Gumpert, Moxnes, Ramondo, Tintelnot Multinational Firms and Export Dynamics 07/02/2016 23 / 25
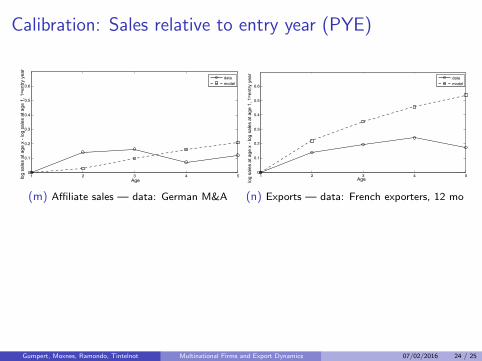
Calibration: Sales relative to entry year (PYE)
1 2 3 4 50
0.1
0.2
0.3
0.4
0.5
0.6
datamodel
Agelog
sale
s at
age
x -
log
sale
s at
age
1, 1
=ent
ry y
ear
(m) Affiliate sales — data: German M&A
1 2 3 4 50
0.1
0.2
0.3
0.4
0.5
0.6
datamodel
Agelog
sale
s at
age
x -
log
sale
s at
age
1, 1
=ent
ry y
ear
(n) Exports — data: French exporters, 12 mo
Gumpert, Moxnes, Ramondo, Tintelnot Multinational Firms and Export Dynamics 07/02/2016 24 / 25
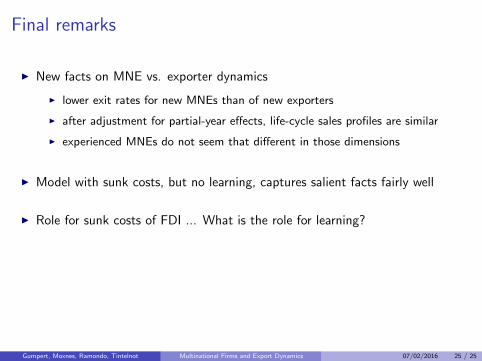
Final remarks
I New facts on MNE vs. exporter dynamics
I lower exit rates for new MNEs than of new exporters
I after adjustment for partial-year effects, life-cycle sales profiles are similar
I experienced MNEs do not seem that different in those dimensions
I Model with sunk costs, but no learning, captures salient facts fairly well
I Role for sunk costs of FDI ... What is the role for learning?
Gumpert, Moxnes, Ramondo, Tintelnot Multinational Firms and Export Dynamics 07/02/2016 25 / 25
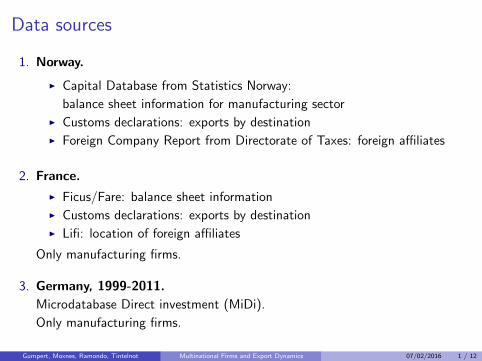
Data sources
1. Norway.
I Capital Database from Statistics Norway:
balance sheet information for manufacturing sectorI Customs declarations: exports by destinationI Foreign Company Report from Directorate of Taxes: foreign affiliates
2. France.
I Ficus/Fare: balance sheet informationI Customs declarations: exports by destinationI Lifi: location of foreign affiliates
Only manufacturing firms.
3. Germany, 1999-2011.
Microdatabase Direct investment (MiDi).
Only manufacturing firms.
Gumpert, Moxnes, Ramondo, Tintelnot Multinational Firms and Export Dynamics 07/02/2016 1 / 12
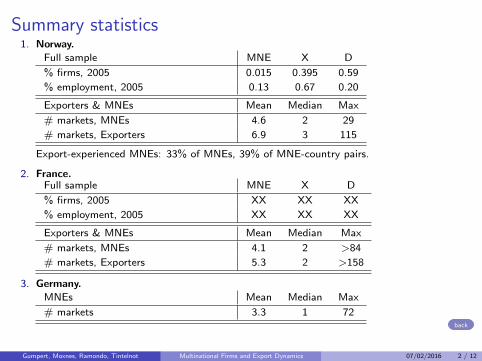
Summary statistics1. Norway.
Full sample MNE X D
% firms, 2005 0.015 0.395 0.59
% employment, 2005 0.13 0.67 0.20
Exporters & MNEs Mean Median Max
# markets, MNEs 4.6 2 29
# markets, Exporters 6.9 3 115
Export-experienced MNEs: 33% of MNEs, 39% of MNE-country pairs.
2. France.Full sample MNE X D
% firms, 2005 XX XX XX
% employment, 2005 XX XX XX
Exporters & MNEs Mean Median Max
# markets, MNEs 4.1 2 >84
# markets, Exporters 5.3 2 >158
3. Germany.MNEs Mean Median Max
# markets 3.3 1 72back
Gumpert, Moxnes, Ramondo, Tintelnot Multinational Firms and Export Dynamics 07/02/2016 2 / 12
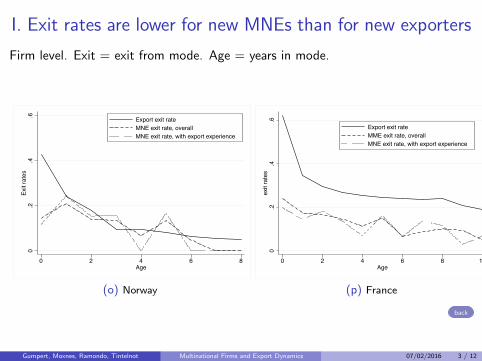
I. Exit rates are lower for new MNEs than for new exporters
Firm level. Exit = exit from mode. Age = years in mode.
0.2
.4.6
Exit
rate
s
0 2 4 6 8Age
Export exit rateMNE exit rate, overallMNE exit rate, with export experience
(o) Norway
0.2
.4.6
exit
rate
s0 2 4 6 8 10
Age
Export exit rateMME exit rate, overallMNE exit rate, with export experience
(p) France
back
Gumpert, Moxnes, Ramondo, Tintelnot Multinational Firms and Export Dynamics 07/02/2016 3 / 12
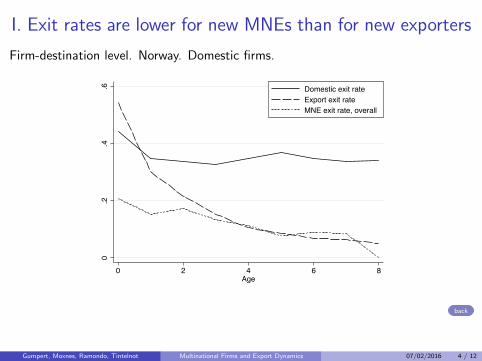
I. Exit rates are lower for new MNEs than for new exporters
Firm-destination level. Norway. Domestic firms.
0.2
.4.6
0 2 4 6 8Age
Domestic exit rateExport exit rateMNE exit rate, overall
back
Gumpert, Moxnes, Ramondo, Tintelnot Multinational Firms and Export Dynamics 07/02/2016 4 / 12
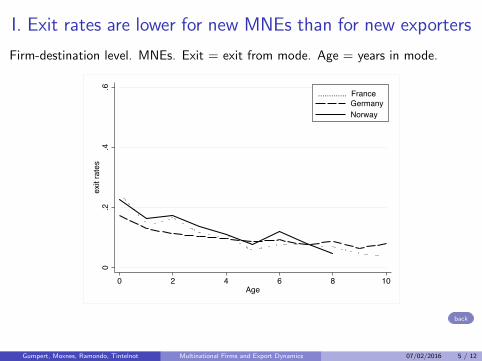
I. Exit rates are lower for new MNEs than for new exporters
Firm-destination level. MNEs. Exit = exit from mode. Age = years in mode.
0.2
.4.6
exit
rate
s
0 2 4 6 8 10Age
GermanyNorway
............. France
back
Gumpert, Moxnes, Ramondo, Tintelnot Multinational Firms and Export Dynamics 07/02/2016 5 / 12
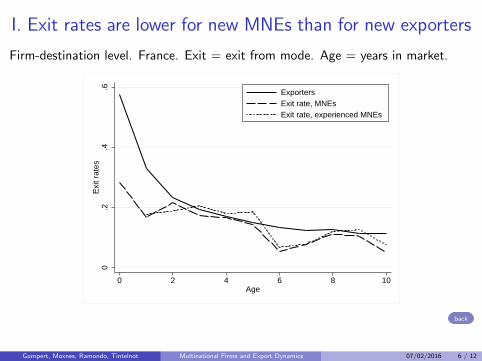
I. Exit rates are lower for new MNEs than for new exporters
Firm-destination level. France. Exit = exit from mode. Age = years in market.
0.2
.4.6
Exi
t rat
es
0 2 4 6 8 10Age
ExportersExit rate, MNEsExit rate, experienced MNEs
back
Gumpert, Moxnes, Ramondo, Tintelnot Multinational Firms and Export Dynamics 07/02/2016 6 / 12
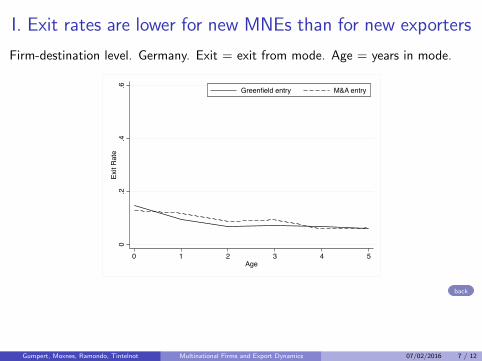
I. Exit rates are lower for new MNEs than for new exporters
Firm-destination level. Germany. Exit = exit from mode. Age = years in mode.
0.2
.4.6
Exit
Rat
e
0 1 2 3 4 5Age
Greenfield entry M&A entry
back
Gumpert, Moxnes, Ramondo, Tintelnot Multinational Firms and Export Dynamics 07/02/2016 7 / 12
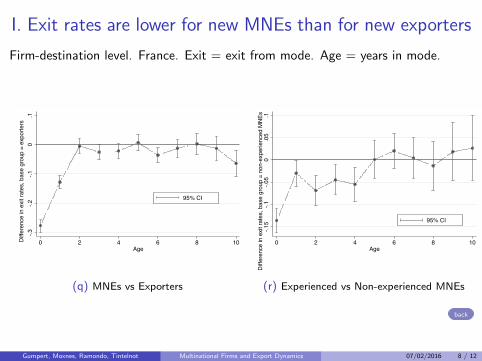
I. Exit rates are lower for new MNEs than for new exporters
Firm-destination level. France. Exit = exit from mode. Age = years in mode.
-.3-.2
-.10
.1D
iffer
ence
in e
xit r
ates
, bas
e gr
oup
= ex
porte
rs
0 2 4 6 8 10Age
95% CI
(q) MNEs vs Exporters
-.15
-.1-.0
50
.05
.1D
iffer
ence
in e
xit r
ates
, bas
e gr
oup
= no
n-ex
perie
nced
MN
Es
0 2 4 6 8 10Age
95% CI
(r) Experienced vs Non-experienced MNEs
back
Gumpert, Moxnes, Ramondo, Tintelnot Multinational Firms and Export Dynamics 07/02/2016 8 / 12
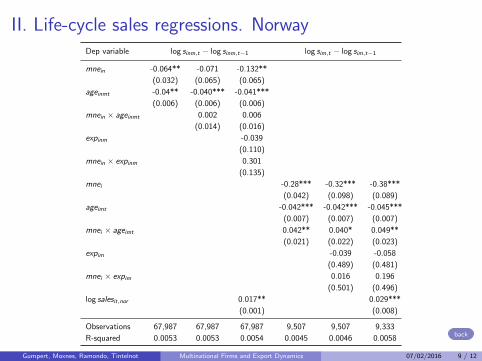
II. Life-cycle sales regressions. NorwayDep variable log sinm,t − log sinm,t−1 log sim,t − log sim,t−1
mnein -0.064** -0.071 -0.132**
(0.032) (0.065) (0.065)
ageinmt -0.04** -0.040*** -0.041***
(0.006) (0.006) (0.006)
mnein × ageinmt 0.002 0.006
(0.014) (0.016)
expinm -0.039
(0.110)
mnein × expinm 0.301
(0.135)
mnei -0.28*** -0.32*** -0.38***
(0.042) (0.098) (0.089)
ageimt -0.042*** -0.042*** -0.045***
(0.007) (0.007) (0.007)
mnei × ageimt 0.042** 0.040* 0.049**
(0.021) (0.022) (0.023)
expim -0.039 -0.058
(0.489) (0.481)
mnei × expim 0.016 0.196
(0.501) (0.496)
log salesit,nor 0.017** 0.029***
(0.001) (0.008)
Observations 67,987 67,987 67,987 9,507 9,507 9,333
R-squared 0.0053 0.0053 0.0054 0.0045 0.0046 0.0058back
Gumpert, Moxnes, Ramondo, Tintelnot Multinational Firms and Export Dynamics 07/02/2016 9 / 12
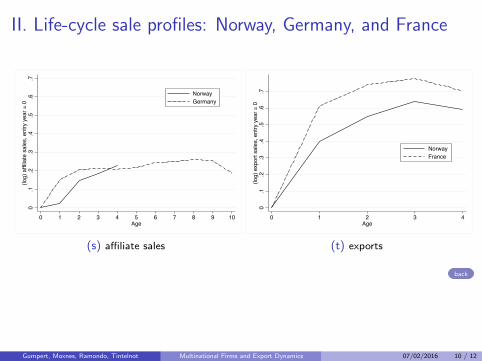
II. Life-cycle sale profiles: Norway, Germany, and France0
.1.2
.3.4
.5.6
.7(lo
g) a
ffilia
te s
ales
, ent
ry y
ear =
0
0 1 2 3 4 5 6 7 8 9 10Age
NorwayGermany
(s) affiliate sales0
.1.2
.3.4
.5.6
.7(lo
g) e
xpor
t sal
es, e
ntry
yea
r = 0
0 1 2 3 4Age
NorwayFrance
(t) exports
back
Gumpert, Moxnes, Ramondo, Tintelnot Multinational Firms and Export Dynamics 07/02/2016 10 / 12
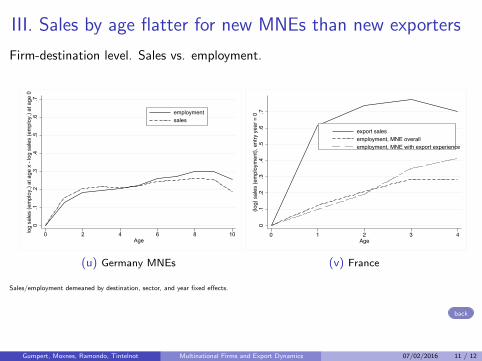
III. Sales by age flatter for new MNEs than new exporters
Firm-destination level. Sales vs. employment.
0.1
.2.3
.4.5
.6.7
log
sale
s (e
mpl
oy.)
at a
ge x
- lo
g sa
les
(em
ploy
.) at
age
0
0 2 4 6 8 10Age
employmentsales
(u) Germany MNEs0
.1.2
.3.4
.5.6
.7(lo
g) s
ales
(em
ploy
men
t), e
ntry
yea
r = 0
0 1 2 3 4Age
export salesemployment, MNE overallemployment, MNE with export experience
(v) France
Sales/employment demeaned by destination, sector, and year fixed effects.
back
Gumpert, Moxnes, Ramondo, Tintelnot Multinational Firms and Export Dynamics 07/02/2016 11 / 12
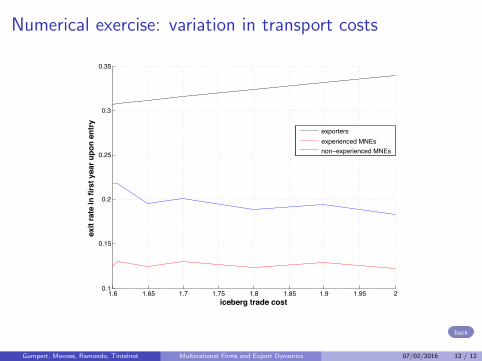
Numerical exercise: variation in transport costs
1.6 1.65 1.7 1.75 1.8 1.85 1.9 1.95 20.1
0.15
0.2
0.25
0.3
0.35
iceberg trade cost
exit
rate
in fi
rst y
ear u
pon
entr
y
exportersexperienced MNEsnon−experienced MNEs
back
Gumpert, Moxnes, Ramondo, Tintelnot Multinational Firms and Export Dynamics 07/02/2016 12 / 12