Embed Size (px)
Citation preview
Immunity
Resource
Multilineage Priming of Enhancer RepertoiresPrecedes Commitment to the B and Myeloid CellLineages in Hematopoietic ProgenitorsElinore M. Mercer,1,6 Yin C. Lin,1,6 Christopher Benner,2 Suchit Jhunjhunwala,1 Janusz Dutkowski,2,3,4 Martha Flores,1
Mikael Sigvardsson,5 Trey Ideker,2,3,4 Christopher K. Glass,2 and Cornelis Murre1,*1Department of Molecular Biology2Department of Cellular and Molecular Medicine3Department of Bioengineering4The Institute for Genomic Medicine
University of California, San Diego, La Jolla, CA 92093, USA5Department for Clinical and Experimental Sciences, Linkoping University, Linkoping 58183, Sweden6These authors contributed equally to this work
*Correspondence: [email protected]
DOI 10.1016/j.immuni.2011.06.013
SUMMARY
Recent studies have documented genome-widebinding patterns of transcriptional regulators andtheir associated epigenetic marks in hematopoieticcell lineages. In order to determine how epigeneticmarks are established and maintained during devel-opmental progression, we have generated long-termcultures of hematopoietic progenitors by enforcingthe expression of the E-protein antagonist Id2. Hema-topoietic progenitors that express Id2 aremultipotentand readily differentiate upon withdrawal of Id2 ex-pression into committed B lineage cells, thus indi-cating a causative role for E2A (Tcf3) in promotingthe B cell fate. Genome-wide analyses revealed thata substantial fraction of lymphoid and myeloid en-hancers are premarked by the poised or active en-hancer mark H3K4me1 in multipotent progenitors.Thus, inhematopoieticprogenitors,multilineageprim-ing of enhancer elements precedes commitment tothe lymphoid or myeloid cell lineages.
INTRODUCTION
In the adult bone marrow, long-term hematopoietic stem cells
(LT-HSCs) have the ability to both self-renew and reconstitute
the entire immune system for the life of the organism (Spangrude
et al., 1988). LT-HSCs have the ability to differentiate into short-
termHSCs (ST-HSCs), which give rise tomultipotent progenitors
(MPPs) and then differentiate into the lymphoid-primed multipo-
tent progenitors (LMPPs) (Adolfsson et al., 2005). LMPPs differ-
entiate into common lymphoid progenitors (CLPs) or granulo-
cyte-macrophage progenitors (GMPs) that give rise to either
a lymphoid- or myeloid-restricted pathway, respectively (Inlay
et al., 2009; Kondo et al., 1997).
During the past decade, transcription factors have been iden-
tified that play critical roles in early B cell development. These
Im
include the E2A proteins, EBF1, FOXO1, and PAX5 (Bain et al.,
1994; Zhuang et al., 1994; Urbanek et al., 1994; Lin and Gros-
schedl, 1995; Dengler et al., 2008; Amin and Schlissel, 2008;
Treiber et al., 2010). The E2A proteins are members of the
E-protein transcription factor family that also include HEB,
E2-2, and E2A. The E-protein transcription factors are character-
ized by the presence of a helix-loop-helix (HLH) dimerization
domain and a DNA binding region. The E2A locus encodes for
two proteins, E12 and E47, which arise from differential splicing
of exons that encode for their DNA binding and dimerization
domains. E2A proteins were originally identified based on their
abilities to bind the immunoglobulin kappa chain enhancer and
have since been implicated at multiple stages of lymphoid and
B cell development (Bain et al., 1994; Beck et al., 2009; Dias
et al., 2008; Murre et al., 1989; Semerad et al., 2009; Zhuang
et al., 2004). E-proteins are antagonized by the Id proteins, which
contain an HLH motif but lack a DNA binding region (Benezra
et al., 1990). In mice deficient for E2A, B cell development is
blocked at the CLP cell stage (Bain et al., 1994, 1997; Zhuang
et al., 1994). A similar block in B cell development is observed
in EBF-, FOXO1-, and PAX5-deficient mice (Dengler et al.,
2008; Lin and Grosschedl, 1995; Nutt et al., 1997).
When cultured in B cell-supportive conditions in vitro, E2A-
deficient bonemarrow cells self-renew indefinitely without losing
multipotent differentiation potential (Ikawa et al., 2004). B cell
differentiation in E2A-deficient cells can be rescued by forced
EBF expression, suggesting that the E2A proteins act upstream
of EBF in B cell development (Hagman and Lukin, 2006; Laz-
orchak et al., 2005;Seet et al., 2004). Recent studies havedirectly
linked these and other transcriptional regulators into a common
framework (Ghisletti et al., 2010; Heinz et al., 2010; Treiber
et al., 2010; Lin et al., 2010; Natoli, 2010). E2A initiates a program
of B-lineage-specific gene expression by inducing the expres-
sion of Ebf1, Bcl11a, Irf4, Irf8, and Foxo1 (Lin et al., 2010). E2A,
EBF1, FOXO1, IRF4, and IRF8 act in concert to activate the ex-
pression of the Pax5 locus (Decker et al., 2009; Lin et al., 2010).
E2A, EBF1, and Foxo1 as well as Pax5 then act to induce the
expression of a large subset of genes including signaling compo-
nents, survival factors, and regulators that modulate cell cycle
progression (Lin et al., 2010; McManus et al., 2011).
munity 35, 413–425, September 23, 2011 ª2011 Elsevier Inc. 413

Immunity
Multilineage Priming of Enhancer Repertoires
Here, we have generated a cytokine-dependent cell line,
named Id2-HPC, which allowed for the expansion of a progenitor
cell line that maintains multipotency both in vivo and in vitro. We
then harnessed the differentiation potential of these cells to
monitor how enhancer repertoires are established at the very
earliest stages of B and myeloid cell development. We found
that a subset of poised enhancer elements are marked at the
uncommitted progenitor cell stage. However, H3K4me1 marks
at a subset of enhancers were elevated during developmental
progression, resulting in evolving active enhancer repertoires
that we propose orchestrate the myeloid and B cell fates.
RESULTS
Self-Renewal Activity in Hematopoietic ProgenitorsPrevious experiments demonstrated that multipotent progenitor
cells can self-renew in vitro in the absence of E2A and retain
pluripotency in vivo (Ikawa et al., 2004). To determine whether
overexpression of Id proteins would effectively inhibit E2A and
thus allow in vitro expansion of multipotent progenitor cells, we
created lentiviral vectors utilizing a Tet-Off promoter that ex-
presses human ID2 (hId2) andGFP in the absence of doxycycline
(see Figure S1A available online).
Lineage-depleted bone marrow from CD45.1 congenic
C57BL/6 mice was infected with lentivirus carrying Id2
(TetOff_hId2) or empty vector control (TetOff_Empty). The trans-
duced cells were cultured in the presence of cytokines IL-3, IL-6,
WEHI supernatant, and SCF. Initially, both the control (C-HPCs)
and hId2-infected (Id2-HPCs) cells rapidly expanded. However,
upon culture for 4 weeks, C-HPCs had ceased growing whereas
the Id2-HPCs continued to divide (data not shown). Id2-HPCs
were then cultured in IL-7, Flt3L, and SCF on subconfluent S17
feeder cells. In these conditions, the cells continued to expand
over time. The Id2-HPC cells overexpressed hId2 mRNA, which
could be robustly turned off with the addition of doxycycline to
the culture media (Figure 1A).
Id2-HPCs did not express markers characteristic for T cell and
NK cell lineages and expressed intermediate amounts of B220
and high abundance of CD43 and were Ly6D, IgM, and IgD
negative (Figure 1B). A small percentage of the cells (1%–5%)
expressed CD11b, CD19, or CD25, but the majority of cells
remained lineage negative even after being cultured in vitro for
relatively long periods of time. Id2-HPCs carried DHJH joints,
but lacked VH-DHJH rearrangements, suggesting that they repre-
sent cells arrested at the CLP or pre-pro-B cell stage (Figure 1C;
Busslinger, 2004).
To further characterize Id2-HPCs, we performed microarray
analysis with RNA derived from freshly isolated LT-HSCs, ST-
HSCs, CLPs, LMPPs, pre-B cells, pro-B cells, as well as cultured
E2A-deficient cells, EBF-deficient cells, and Id2-HPCs. Nine
expression patterns were identified from the 11,367 changed
genes (Figure 1D). Genes encoding for proteins required for B
cell development such as Foxo1,Pou2af1, IgL, Ly6d, and Vpreb1
showed equivalent expression in the Id2-HPCs relative to HSCs
and LMPPs but lower expression as compared to pro- and pre-B
cells. In contrast, genes that are expressed in pluripotent
progenitors such asCd34, Kit, Tie1, Slamf1, and Tal1were upre-
gulated in HSCs and CLPs when compared to Id2-HPCs.
Vertical clustering of expression patterns showed that Id2-HPCs
414 Immunity 35, 413–425, September 23, 2011 ª2011 Elsevier Inc.
resemble the transcription signatures of Tcf3(E2A)�/� and
Ebf1�/� cells (Figure 1E). Taken together, these data indicate
that forced Id2 expression in hematopoietic progenitors
promotes the self-renewal of cells with a similar phenotype as
observed in Tcf3�/� and Ebf1�/� pre-pro-B cells.
Id2-HPCs Are MultipotentTo determine whether Id2-HPCs maintain pluripotency and re-
populating ability in vivo, cells were injected into irradiated
CD45.2 recipients in a competitive repopulating assay. In the
absence of E2A, B cells do not develop beyond the pre-pro-B
cell stage and alternate lineage development is perturbed, so
we administered doxycycline via food pellets to recipient
animals to turn off Id2 expression and thus allow restoration of
E-protein activity (Bain et al., 1994). The mice received doxycy-
cline food pellets 24 hr before injection and throughout the
remainder of the study. Recipient mice were lethally irradiated
24 hr before tail vein injection of Id2-HPCs (CD45.1) mixed
(1:1) with freshly harvested CD45.2 bone marrow cells. At
6 week posttransplantation, Id2-HPCs had successfully recon-
stituted the bonemarrow, thymus, and spleen of irradiated recip-
ients to varying degrees, albeit at reduced ability compared to
wild-type bone marrow (Figure 2; Figure S1). The large majority
of the CD45.1 cells were GFP negative, showing the robust
sensitivity of the tetracycline transactivator to doxycycline in vivo
(Figure 2).
In the bonemarrow, Id2-HPCs reconstituted theBandmyeloid
compartments successfully (Figure 2A). There were increased
numbers of CD45.1 B220+ cells and decreased numbers of
CD45.1 CD11b+ cells relative to their CD45.2 counterparts, sug-
gesting a propensity for Id2-HPCs to commit to the B cell lineage
(Figure 2A). The Id2-HPCs also successfully migrated to the
peripheral lymphoid organs (Figures 2B and 2C). IgM expression
was readily detectable on approximately 20%of CD45.1 spleno-
cytes, demonstrating that Id2-HPCs have the ability to success-
fully progress beyond the pre-pro-B cell stage (data not shown).
Id2-HPCs also reconstituted the T cell and myeloid com-
partments in the spleen (Figure 2B). In the thymus, Id2-HPCs
reconstituted the double-negative, double-positive, and single-
positive populations (Figure 2C). Thus, Id2-HPCs can be grown
long term in culture and have the ability to reconstitute multiple
hematopoietic cell lineages in vivo.
In Vitro Differentiation of Id2-HPCs into Myeloid and BCell LineagesThe transplantation experiments revealed that Id2-HPCs pos-
sessed multilineage potential. To exclude the possibility that
the multipotency of Id2-HPCs was caused by a heterogeneous
populations of lineage-restricted cells, single-cell cultures were
initiated to determine the clonal properties of Id2-HPCs. Indi-
vidual cells from the highest 4%, lowest 4%, or intermediate
10% of GFP mean fluorescence were sorted onto preseeded
S17 cells in 96-well plates and cultured as described above.
Clones from each of the conditions (L, low GFP; I, intermediate
GFP; H, high GFP) were expanded, and one clone from each
group was chosen for further analysis (Figure S2A). To examine
their myeloid lineage potential, three Id2-HPC monoclonal cell
lines (L1, I2, and H1) were cultured in the presence of IL3,
Flt3-L, GM-CSF, and M-CSF. Within 48 hr after initiation of the

A
B
0 hr
24 hr
72 hr
120 hr
DH - JH
BM S17 Id2
HPC
DJ3
DJ2
DJ1
V7183 - DJH
VDJ3
VDJ2
VDJ1
BM S17 BM S17
V558 - DJH
VDJ3
VDJ2
VDJ1
BM S17
VDJ3
VDJ2
VDJ1
VQ52 - DJH
ATM
BM S17
C
CLP
D E
Id2 HPC
Id2 HPC
Id2 HPC Id2
HPC
-3.7 -1.9 0 2.1 4.0
TetOff _hId2
Whole bone
marrow
IgD
IgM
CD43 CD25 HSA
B22
0
Ly6D
GFP
BP.
1
CD
19
NK1.1 Gr1
Mac
1
CD
3
Time
Rel
ativ
e Fo
ld
Exp
ress
ion
Human ID2 Expression
0 4 6 12 24 120 (hr)
0.0
0.5
1.0
LT-H
SC
LMP
P
ST-
HS
C
E2
A K
O
EB
F K
O
Id2_
HP
C
preB
pr
oB
GFP
Rel
ativ
e N
o.
Figure 1. Establishment of a Long-Term Culture of Multipotent Hematopoietic Progenitors
(A) Rapid and robust downregulation of GFP and human ID2 after doxycycline addition in vitro. FACS plots of GFP (left) at 0, 24, 72, and 120 hr after doxycycline
addition are shown. Real-time PCR analysis of human ID2 expression at 0, 4, 6, 12, 24, and 120 hr after doxycycline addition. Error bars refer to standard
deviation.
(B) Phenotypic analysis of Id2-HPC cells. TetOff_hId2-infected cells were cultured on S17 feeder cells with IL-7, SCF, and Flt3L. Cells were analyzed by FACS for
the expression of B220, Ly6D, CD43, CD25, CD19, Mac1, Gr1, CD3, and NK1.1 after 3 months in culture. The upper panel shows staining from wild-type bone
marrow as controls and the lower panel shows staining from expanded Id2-HPCs in the absence of doxycycline.
(C) IgH gene rearrangement analysis of Id2-HPCs. DNA was isolated from wild-type bone marrow, S17 feeder cells, and TetOff_hId2 cells and analyzed by
Southern blot for the presence of IgH DJ and V-DJ rearrangements. ATM was used as a loading control.
(D) Microarray analysis of LT-HSCs, ST-HSCs, LMPPs, CLPs, pre-B cells, pro-B cells, Tcf3�/� cell line, Ebf1�/� cell line, and Id2-HPC cell line. Duplicate genes
have been removed. The color scale is shown below the diagram.
(E) Vertical clustering of cell types from microarray experiment in Figure 1D.
Immunity
Multilineage Priming of Enhancer Repertoires
myeloid culture, Id2-HPCs expressed significant levels of CD11b
(Figure 3A; Figures S2B and S2C). Interestingly, the mean fluo-
rescence intensity of B220 was increased in themyeloid cultures
in all three clones, similar to that seen in other studies (Xie et al.,
2004). Additionally, Id2 expression was higher in the myeloid
Im
cultures than in progenitor cells prior to differentiating conditions
(Figure 3D). Id2-HPCs possess similar myeloid potential as the
Tcf3�/� cell line (Figure S1B). These data indicate that cells ex-
pressing high amounts of Id2 are favored to commit to the
myeloid cell lineage.
munity 35, 413–425, September 23, 2011 ª2011 Elsevier Inc. 415

45.1
SS
C
GFP B220 CD11b
45.1
SS
C
45.1
SS
C
GFP CD4
GFP B220 CD11b CD3
CD
8
Bone marrow
Spleen
Thymus
A
B
C
92.90 1.16
90.26 69.57 22.21
97.00 21.21 49.34
51.56 94.76 5.53 3.90
88.83 8.46
99.92 53.48 47.26 10.56
98.78 3.91
91.23 6.14
98.78
74.38
10.07 11.63
4.97 80.98
2.91 11.16
Figure 2. Id2-HPCs Reconstitute Multiple Lineages In Vivo and In Vitro
Id2-HPCs can reconstitutemultiple lineages in irradiated recipients. A competitive reconstitution assay was used to assess the ability of Id2-HPCs to reconstitute
irradiated recipients. 1,000,000 Id2-HPCs and 1,000,000 freshly isolated wild-type bone marrow cells were injected into lethally irradiated recipients receiving
doxycycline feed. Reconstitution was analyzed 6 weeks later. The data are representative of two experiments.
(A) Id2-HPCs successfully reconstitute the bone marrow of recipients. Bone marrow cells were analyzed by FACS analysis for expression of GFP, B220, and
CD11b.
(B) Id2-HPCs successfully reconstitute the spleen of recipients. Splenic cells were analyzed by FACS analysis for expression of GFP, B220, CD11b, and CD3.
(C) Id2-HPCs successfully reconstitute the thymus of recipients. Thymic cells were analyzed by FACS analysis for expression of GFP, CD4, and CD8.
Immunity
Multilineage Priming of Enhancer Repertoires
To promote differentiation of Id2-HPCs into the B cell lineage,
cells were cultured in the presence of S17 cells, IL-7, and SCF
either with or without doxycycline. Id2-HPCs that were cultured
in the absence of doxycycline continued to divide butmaintained
the pre-pro-B cell phenotype. Id2-HPCs that were grown in
the presence of doxycycline rapidly downregulated GFP and
showed a transient upregulation of the recently defined marker
for B cell lineage-primed progenitors, LY6D (Inlay et al., 2009;
Mansson et al., 2008). This was followed by a robust increase
in the levels of CD19 expression (Figure 3B; Figures S2B and
S2C). Differentiation into committed B cell lineage progenitors
416 Immunity 35, 413–425, September 23, 2011 ª2011 Elsevier Inc.
was also supported by the presence of substantial levels of
VH-DHJH joints (Figure 3C). Quantitative PCR analysis confirmed
upregulation of the myeloid-specific genes, including Itgam and
Csfr1, upon culture conditions that favor myeloid differentiation,
and the upregulation of B cell-specific genes, including Ebf1 and
Foxo1, in conditions that favor B cell differentiation (Figure 3D).
We note, however, that cultured Id2-HPCs do not retain their B
cell developmental potential indefinitely. Taken together, these
observations indicate that forced expression of Id2 in hemato-
poietic progenitors permits the establishment of a long-term,
but not indefinite, culture of multipotent progenitors.

B
A
GFP CD11b
0 hr
48 hr
C
DH - JH
Spleen Id2 HPC + Dox
DJ3 DJ2 DJ1
Id2 HPC
V7183 - DJH
VDJ3 VDJ2 VDJ1
V558- DJH
VDJ3 VDJ2 VDJ1
VQ52- DJH
VDJ3 VDJ2 VDJ1
0 hr 48 hr 96 hr
120 hr
GFP CD19 Ly6D
D Ebf1
TetOff_HPCs CD19+ CD11b+
Foxo1
Itgam Id2 Csfr1
Spleen Id2 HPC + Dox
Id2 HPC
Spleen Id2 HPC + Dox
Id2 HPC
Spleen Id2 HPC + Dox
Id2 HPC
Spleen Id2 HPC + Dox
Id2 HPC
TetOff_HPCs CD19+ CD11b+
TetOff_HPCs CD19+ CD11b+ TetOff_HPCs CD19+ CD11b+ TetOff_HPCs CD19+ CD11b+
ATM
Figure 3. In Vitro Differentiation Potential of Id2-HPCs
(A) In vitro differentiation of Id2-HPCs into myeloid cells. Cells were cultured in IL-3, Flt3L, GMCSF, and MCSF in the presence or absence of doxycycline for
2 days in vitro and analyzed by FACS at day 0 and day 2 for CD11b.
(B) In vitro differentiation of Id2-HPCs to pro-B cells. Cells were cultured in IL-7, SCF in the presence or absence of doxycycline for 6 days in vitro and analyzed at
day 0, day 2, day 4, and day 5 for GFP, CD19, and Ly6D expression.
(C) IgH gene rearrangement in differentiated Id2-HPCs. DNAwas isolated fromwild-type bonemarrow, day 0 Id2-HPCs and day 8 plus doxycycline Id2-HPCs and
analyzed by Southern blotting for IgH DJ and V-DJ rearrangements. ATM was used as a loading control.
(D) Gene expression analysis of lineage-specific transcripts in undifferentiated Id2-HPCs and CD19+ or CD11b+ differentiated Id2-HPCs. RNA was isolated from
monoclonal Id2-HPCs at the undifferentiated state or the CD19+ or CD11b+ differentiated state, and transcript levels were analyzed by real-time PCR analysis.
Immunity
Multilineage Priming of Enhancer Repertoires
Gene Expression Signatures in B and Myeloid CellsDerived from Multipotent ProgenitorsTo compare the expression signatures from differentiated B and
myeloid cells derived from hematopoietic progenitors that ex-
press Id2, Id2-HPCs were differentiated into either CD19+ B cells
or CD11b+myeloid cells. RNAwas isolated from the cultures and
Im
analyzed by microarray gene expression analysis. We hierarchi-
cally clustered the expression of genes with a 2-fold or more
change in absolute expression levels between any two groups
(Figure 4A). Several patterns emerged: genes whose transcripts
became elevated in differentiated B cells, genes whose tran-
scripts declined in differentiated myeloid cells, genes whose
munity 35, 413–425, September 23, 2011 ª2011 Elsevier Inc. 417
Rel
ativ
e ex
pres
sion
(log
2)
B –
0h
N.C. B > 0h 0h > B
Rel
ativ
e ex
pres
sion
(log
2)
M –
0h
N.C. M > 0h 0h > M
Rel
ativ
e ex
pres
sion
(log
2)
B -
M
*** p<.0001
*** p<.0001
* p=.025
N.C. B > M M > B
C *** p<.0001
* p=.046
*** p<.0001
*** p<.0001
*** p<.0001
** p=.014
N.C. B > 0h 0h > B
Rel
ativ
e ex
pres
sion
(log
2)
B –
0h
N.C. M > 0h 0h > M
Rel
ativ
e ex
pres
sion
(log
2)
M –
0h
*** p<.0001
*** p<.0001
*** p<.0001
N.C. B > M M > B
Rel
ativ
e ex
pres
sion
(log
2)
B -
M
B NS p=.3940
NS p=.1443
*** p<.0001
*** p<.0001
NS p=.5747
*** p<.0001
H3K4me1 H3K4me1 H3K4me1
H3K4me3 H3K4me3 H3K4me3
Hoxa5, 7, 9
Meis1
Bcl2, 6, 9l
Cd68
Cd86
Cd96
Id2
Irf1, 5, 7, 9
Gfi1
Hbb-b1
Hist1h Cluster Myb
Bcl11a
Ebf1
Fos
Foxo1
Jun
Ly6d
Myc
Vpreb1, 2, 3
Cd7
Csf1r
Tlr1
M B_1 B_2 0h_1 0h_2 A
1
2
3
4
5
6
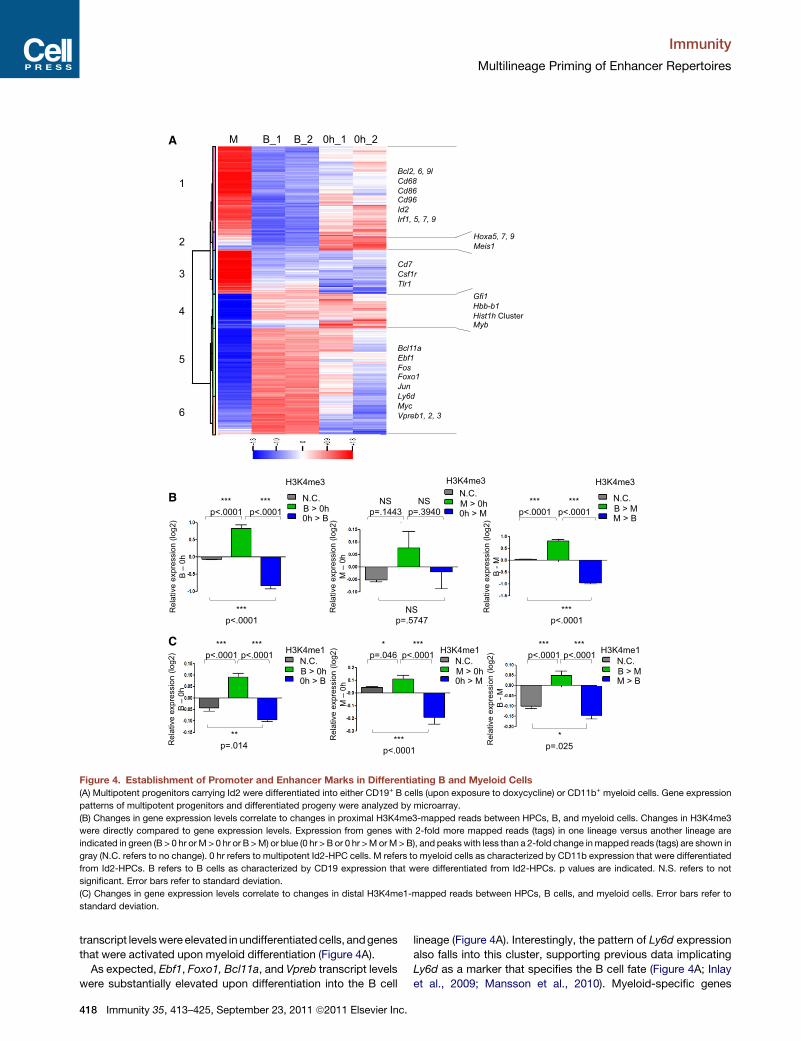
Figure 4. Establishment of Promoter and Enhancer Marks in Differentiating B and Myeloid Cells
(A) Multipotent progenitors carrying Id2 were differentiated into either CD19+ B cells (upon exposure to doxycycline) or CD11b+ myeloid cells. Gene expression
patterns of multipotent progenitors and differentiated progeny were analyzed by microarray.
(B) Changes in gene expression levels correlate to changes in proximal H3K4me3-mapped reads between HPCs, B, and myeloid cells. Changes in H3K4me3
were directly compared to gene expression levels. Expression from genes with 2-fold more mapped reads (tags) in one lineage versus another lineage are
indicated in green (B > 0 hr orM > 0 hr or B >M) or blue (0 hr > B or 0 hr >MorM>B), and peakswith less than a 2-fold change inmapped reads (tags) are shown in
gray (N.C. refers to no change). 0 hr refers to multipotent Id2-HPC cells. M refers to myeloid cells as characterized by CD11b expression that were differentiated
from Id2-HPCs. B refers to B cells as characterized by CD19 expression that were differentiated from Id2-HPCs. p values are indicated. N.S. refers to not
significant. Error bars refer to standard deviation.
(C) Changes in gene expression levels correlate to changes in distal H3K4me1-mapped reads between HPCs, B cells, and myeloid cells. Error bars refer to
standard deviation.
Immunity
Multilineage Priming of Enhancer Repertoires
transcript levelswereelevated inundifferentiatedcells, andgenes
that were activated upon myeloid differentiation (Figure 4A).
As expected, Ebf1, Foxo1, Bcl11a, and Vpreb transcript levels
were substantially elevated upon differentiation into the B cell
418 Immunity 35, 413–425, September 23, 2011 ª2011 Elsevier Inc.
lineage (Figure 4A). Interestingly, the pattern of Ly6d expression
also falls into this cluster, supporting previous data implicating
Ly6d as a marker that specifies the B cell fate (Figure 4A; Inlay
et al., 2009; Mansson et al., 2010). Myeloid-specific genes

Immunity
Multilineage Priming of Enhancer Repertoires
includingCd68 andCsf1rwere readily activated in culture condi-
tions that favor myeloid development (clusters 1 and 3). A group
of genes was also identified whose transcript levels declined
upon differentiating into either the B or the myeloid cell lineage
(Figure 4A, clusters 2 and 4). Interestingly, cluster 2 includes
genes that are characteristic of the hematopoietic stem cell
signature, including Meis1 as well as several members of the
Hoxa family (Figure 4A). Collectively, these data indicate that
Id2-HPCs in differentiating conditions activate lineage-specific
programs of gene expression and repress transcription of genes
associated with the HSC fate as well as alternate differentiated
cell lineages.
Establishment of Promoter and Enhancer Marksin Differentiating B and Myeloid CellsThe gene expression patterns uncovered by microarray analysis
in differentiating multipotent progenitors (Id2-HPCs) indicate
genome-wide changes in transcriptional activity. We next asked
when and how these changes are initiated and established.
Recent studies have demonstrated a tight correlation between
transcriptionally active promoters and H3K4 trimethylation,
whereas H3K4 monomethylation has been associated with
enhancer activity (Pokholok et al., 2005; Heintzman et al.,
2007). To determine whether the changes in gene expression
patterns upon differentiation correlate with the presence of
H3K4me3 as well as H3K4me1, cell lysates were derived from
Id2-HPCs and differentiated into CD11b+ and CD19+ cells.
Lysates were immunoprecipitated with antibodies directed
against H3K4me1 and H3K4me3 and analyzed by ChIP se-
quencing (Barski et al., 2007). More than 15,000 regions were
identified that showed H3K4me3 in all three cell types (Fig-
ure S3A). The number of H3K4me1 islands varied between
the cell types (Figure S3A). As expected, the majority of the
H3K4me3 peaks were promoter proximal, whereas most of
the H3K4me1 peaks were promoter distal (Figure S3B). ChIP-
Seq analyses for H3K4me1 were performed in duplicate with
biological replicates. We note that the patterns of H3K4me1
were very similar between the duplicates (Figures S3, S4,
and S6).
To determine how the presence of epigenetic marks relates
to lineage-specific programs of gene expression, changes in
the abundance of H3K4me3 and H3K4me1 were directly com-
pared to relative levels of gene expression (Figure 4B). As
a threshold we used a 2-fold change in the number of nor-
malized reads mapped to promoter regions associated with
one lineage versus another. We observed a tight correlation
between changes in H3K4me3 and gene expression levels
upon comparing multipotent progenitors (Id2-HPCs) to differ-
entiated CD19+ B cells (Figure 4B, left). Surprisingly, there
was no substantial distinction between Id2-HPCs and myeloid
cells (Figure 4B; middle). Changes in the levels of H3K4me1 in
regions adjacent to genes correlated very well with the dyn-
amics of gene expression abundance for both myeloid and B
lineage cells when compared to multipotent progenitors (Fig-
ure 4C; left and middle). Thus, during the transition from the
multipotent progenitor to the differentiated cell stage, changes
in H3K4 monomethylation are tightly associated with the activa-
tion of either a B cell or myeloid cell-specific program of gene
expression.
Im
Islands of H3K4me1 Mark Lineage-Specific Enhancersin Multipotent ProgenitorsTo explore the possibility that enhancer regions are primed
in Id2-HPCs prior to differentiation, we examined H3K4me1
enrichment for a subset of cell-type-specific genes including
the B cell lineage-specific genes Foxo1, Ebf1, and Vpreb3.
We also analyzed myeloid cell-specific loci such as Csfr1 and
Cepba, and we examined the patterns of H3K4me1 in genes
that are repressed upon specification into either the B or
myeloid cell lineages, such as Thy1 (Figure 5). We note that
the patterns were normalized to a total number of 10,000,000
tags. H3K4me1 islands are already present in Id2-HPCs prior
to differentiation but are markedly elevated in CD19-positive
cells at the Foxo1, Ebf1, and Vpreb3 loci, whose expression
is activated upon commitment to the B cell lineage but not
upon commitment to the myeloid cell lineage (Figure 5). Simi-
larly, the relative abundance of H3K4 monomethylation is
elevated in loci Cebpa and Csfr1, whose expression increases
in myeloid cells but declines upon differentiating into the B
cell lineage (Figure 5). Correspondingly, abundance of H3K4
monomethylation at the T cell-specific Thy1 locus decreases
upon differentiation into either the B or myeloid cell lineage (Fig-
ure 5). Potential enhancer elements in the Foxo1, Ebf1, Thy1,
and Csfr1 loci were cloned by PCR and inserted upstream of
a basal promoter in a modified pGL3 vector and transfected,
with control renilla luciferase, into the pro-B cell line 22D6,
the double-positive T cell line 166, and the T cell line A12. Lucif-
erase activity was quantitated after 24 hr. As expected, regions
in the Foxo1 and Ebf1 loci that gained H3K4 monomethylation
upon differentiation to the B cell state had greater luciferase
activity in the B cell line as opposed to the T cell lines (Fig-
ure S5). This is consistent with previous observations (Lin
et al., 2010) In contrast, sites in the Thy1 locus that lose
H3K4 monomethylation upon differentiation into B cells showed
slightly higher levels of enhancer activity in the T cell lines (Fig-
ure S5). Taken together, these findings indicate that in multipo-
tent progenitors (Id2-HPCs), H3K4 monomethylation patterns
mark a wide spectrum of enhancers associated with lineage-
restricted genes that become further activated or repressed in
a lineage-restricted manner.
Establishment of Lineage-Specific EnhancerRepertoiresThe data described above raise the question as to whether
changes in the levels of H3K4 monomethylation in the B versus
myeloid cell lineages correlate with the presence of distinct
cis-regulatory codes. To address this question, we examined
H3K4me1-associated sites for enriched DNA sequences. First,
we created scatter plots comparing the abundance of
H3K4me1 in multipotent (Id2-HPCs) and differentiated cells
(Figure 6). Next, H3K4me1 regions specifically associated with
multipotent progenitors and differentiated cells were examined
for the presence of enriched cis-regulatory elements via a
de novo motif finder algorithm, HOMER (Heinz et al., 2010).
The ranking of such associated sequences was based on
their enrichment as compared to background genomic DNA
sequences.
Ebf, Ets, Runx, and E2A were ranked among the top-scoring
motifs associated with putative enhancers in cells with at least
munity 35, 413–425, September 23, 2011 ª2011 Elsevier Inc. 419

Figure 5. The Enhancer Repertoires of
Multipotent Progenitors Are Primed for
Activation
Multipotent progenitors (Id2-HPC) and differentiated
progeny (BandM)wereanalyzed foractiveenhancer
repertoires. Distributions of H3K4me1 in multipotent
progenitors as well as differentiated progeny are
shown across Foxo1 (chr3: 52,356,303-52,540,000),
Ebf1 (chr11:44,460,539-44,849,952),Vpreb3 (chr10:
75,390,000-75,394,700), Cebpa (chr7: 34,825,439-
34,833,310), Csf1r (chr18: 61,229,941-61,257,506),
and Thy1 (chr9: 43,793,835-43,800,231) geno-
mic regions. Patterns were normalized against
10,000,000 tags. The transcript on top of each graph
is shownas in theUCSCBrowser. Numbers indicate
the number of normalized mapped reads (tags)
observed. Black bars on top of transcripts indicate
regions cloned for luciferase studies.
Immunity
Multilineage Priming of Enhancer Repertoires
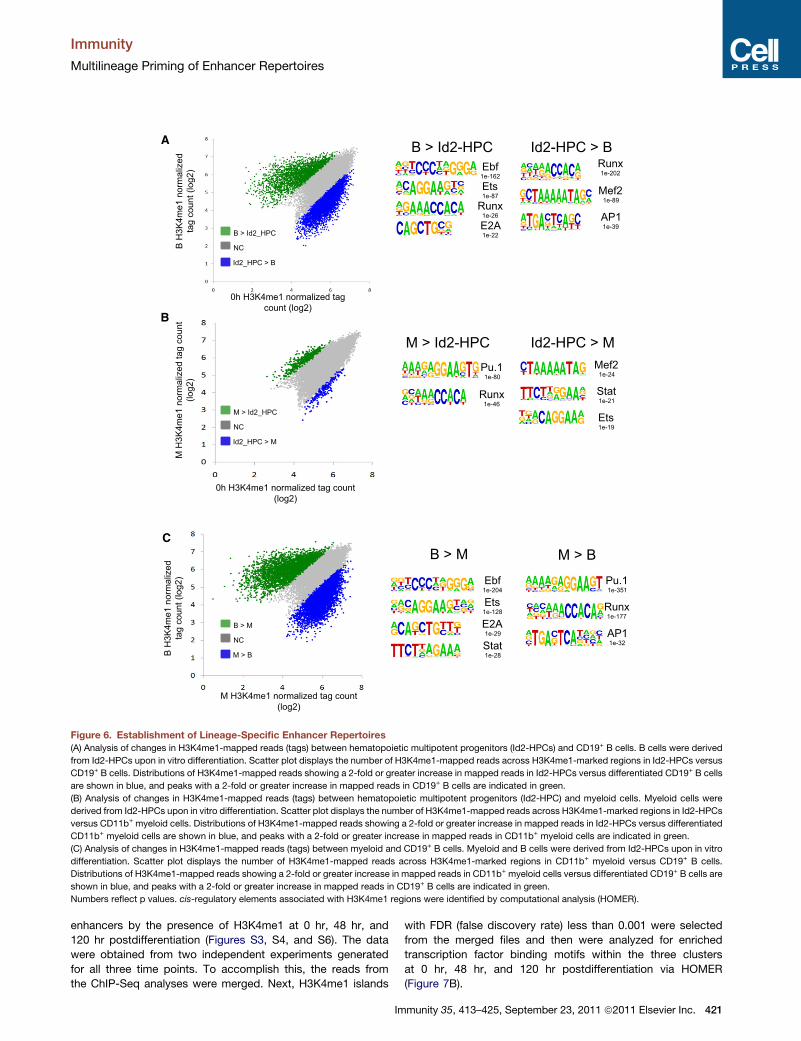
a 2-fold increase in H3K4me1-mapped reads in B cells as
compared to multipotent progenitors (Id2-HPCs) (Figure 6A).
In multipotent progenitors (Id2-HPCs) compared to B cells,
H3K4me1-marked regions were enriched for Runx, Mef2, and
AP-1 consensus binding sites (Figure 6A). When comparing
myeloid cells to Id2-HPCs and B cells, H3K4me1 peaks asso-
ciated with the myeloid lineage were significantly enriched for
the Pu.1, Runx, and AP-1 consensus binding sites (Figures
6B and 6C). Alternatively, Mef2, Stat, and Ets consensus
binding sites were primarily enriched in Id2-HPCs compared
to myeloid cells, whereas B cell-specific H3K4me1 sites were
strongly enriched for Ebf, Ets, and E2A consensus binding sites
(Figure 6C). Thus, lineage-specific enhancer repertoires, as
characterized by H3K4me1, are established upon developing
from multipotent progenitors into committed differentiated B
and myeloid cells.
420 Immunity 35, 413–425, September 23, 2011 ª2011 Elsevier Inc.
Evolving Global EnhancerRepertoires in Developing B CellsThe development of a cell line that gives
rise to differentiated progeny allows for
the analysis of intermediate steps, not
just the endpoints. We therefore used
the Id2-HPCs cells to analyze interme-
diate changes in transcript levels from
the multipotent HPC to the committed
pro-B stage. To this end, Id2-HPCs were
differentiated into CD19+ pro-B cells at
different time points. We then analyzed
patterns of gene expression by microar-
ray analysis and performed hierarchical
clustering of genes that had a 2-fold
or greater change in expression at any
given time point. From this analysis we
observed three main patterns: transcript
levels that were increased (cluster I),
transcript levels that were transiently
elevated (cluster II), and transcript levels
that declined (cluster III) upon develop-
mental progression (Figure 7A). Genes
associated with elevated transcript abundance include Ebf1,
Foxo1, and Rag1.Genes linked with a decline in transcript levels
include those involved with alternate cell lineage programs of
gene expression, such as Hbb-b1, Tox, and Tcra, as well as
loci potentially involved in the maintenance of the HSC pheno-
type, including members of the Hoxa family (Figure 7A; Table
S1). Interestingly, a group of genes associated with cell growth,
including Jun, Fos, and Xbp1, showed a transient pattern of
expression, possibly reflecting a stage in B cell develop-
ment linked to cellular expansion (Figure 7A). Taken together,
these data identify clusters of genes whose expression patterns
are coordinately activated or silenced during developmental
progression.
The data described above show that the very early stages
of B cell development are associated with a dynamic pattern
of gene expression signatures. Specifically, we identified
A
B
Ebf 1e-162
Ets 1e-87
Runx 1e-26
E2A 1e-22
B > Id2-HPC
0h H3K4me1 normalized tag count (log2)
B > Id2_HPC
NC
Id2_HPC > B
0h H3K4me1 normalized tag count (log2)
M H
3K4m
e1 n
orm
aliz
ed ta
g co
unt
(log2
) B
H3K
4me1
nor
mal
ized
ta
g co
unt (
log2
)
C
M > Id2-HPC Id2-HPC > M
M > B
Id2-HPC > B Runx 1e-202
Mef2 1e-89
AP1 1e-39
M > Id2_HPC
NC
Id2_HPC > M
B > M
NC
M > B
Mef2 1e-24
Stat 1e-21
Ets 1e-19
Pu.1 1e-80
Runx 1e-46
B > M
Ebf 1e-204
Ets 1e-128
E2A 1e-29
Stat 1e-28
Pu.1 1e-351
Runx 1e-177
AP1 1e-32
B H
3K4m
e1 n
orm
aliz
ed
tag
coun
t (lo
g2)
M H3K4me1 normalized tag count (log2)
Figure 6. Establishment of Lineage-Specific Enhancer Repertoires
(A) Analysis of changes in H3K4me1-mapped reads (tags) between hematopoietic multipotent progenitors (Id2-HPCs) and CD19+ B cells. B cells were derived
from Id2-HPCs upon in vitro differentiation. Scatter plot displays the number of H3K4me1-mapped reads across H3K4me1-marked regions in Id2-HPCs versus
CD19+ B cells. Distributions of H3K4me1-mapped reads showing a 2-fold or greater increase in mapped reads in Id2-HPCs versus differentiated CD19+ B cells
are shown in blue, and peaks with a 2-fold or greater increase in mapped reads in CD19+ B cells are indicated in green.
(B) Analysis of changes in H3K4me1-mapped reads (tags) between hematopoietic multipotent progenitors (Id2-HPC) and myeloid cells. Myeloid cells were
derived from Id2-HPCs upon in vitro differentiation. Scatter plot displays the number of H3K4me1-mapped reads across H3K4me1-marked regions in Id2-HPCs
versus CD11b+ myeloid cells. Distributions of H3K4me1-mapped reads showing a 2-fold or greater increase in mapped reads in Id2-HPCs versus differentiated
CD11b+ myeloid cells are shown in blue, and peaks with a 2-fold or greater increase in mapped reads in CD11b+ myeloid cells are indicated in green.
(C) Analysis of changes in H3K4me1-mapped reads (tags) between myeloid and CD19+ B cells. Myeloid and B cells were derived from Id2-HPCs upon in vitro
differentiation. Scatter plot displays the number of H3K4me1-mapped reads across H3K4me1-marked regions in CD11b+ myeloid versus CD19+ B cells.
Distributions of H3K4me1-mapped reads showing a 2-fold or greater increase in mapped reads in CD11b+ myeloid cells versus differentiated CD19+ B cells are
shown in blue, and peaks with a 2-fold or greater increase in mapped reads in CD19+ B cells are indicated in green.
Numbers reflect p values. cis-regulatory elements associated with H3K4me1 regions were identified by computational analysis (HOMER).
Immunity
Multilineage Priming of Enhancer Repertoires
enhancers by the presence of H3K4me1 at 0 hr, 48 hr, and
120 hr postdifferentiation (Figures S3, S4, and S6). The data
were obtained from two independent experiments generated
for all three time points. To accomplish this, the reads from
the ChIP-Seq analyses were merged. Next, H3K4me1 islands
Im
with FDR (false discovery rate) less than 0.001 were selected
from the merged files and then were analyzed for enriched
transcription factor binding motifs within the three clusters
at 0 hr, 48 hr, and 120 hr postdifferentiation via HOMER
(Figure 7B).
munity 35, 413–425, September 23, 2011 ª2011 Elsevier Inc. 421

A
B
-3.0 -1.5 1.5 3.0 0
Ebf1
Bcl11a
Foxo1
Cd19
Rag1
Ets1
Bcl2l1
Ly6d
Xbp1
Fos, Fosb, Jun
Hoxa5/7
Hbb-b1
Id2
Mpo
Tox
Tcra
Thy1
I
II
III
0 hr Pu.1
-7.7e+01 Runx
-5.1e+01 Runx
-5.1e+01 Ets(Erg) -3.5e+01
Runx -3.2e+01
- -3.2e+01
Ets -1.1e+02
Runx -5.9e+01
- -4.7e+01
- -4.3e+01
- -3.9e+01
- -3.7e+01
E2A -4.0e+01
Ets(Erg) -5.4e+01
Pu.1 -4.9e+01
- -4.8e+01
Ets -4.1e+01
Ebf -2.9e+01
Ebf -2.9e+01
E2A -3.7e+01
CI
48 hr 120 hr
CII
CIII
Ets -7.8e+01
- -4.6e+01
Runx -4.0e+01
E2A -4.0e+01
- -3.4e+01
E2A -2.9e+01
Fli1 -3.7e+01
Ets -1.1e+02
Runx -7.8e+01
Runx -7.3e+01
E2A -5.9e+01
- -5.2e+01
- -3.6e+01
Fli1 -5.8e+01
Ets -4.8e+01
Ets -4.7e+01
Runx -3.2e+01
Runx -7.7e+01
Ets -7.6e+01
Runx -5.1e+01
- -4.1e+01
- -3.0e+01
Sp1 -2.9e+01
- -3.4e+01
- -3.2e+01
Pu.1 -3.2e+01
Ets -5.5e+01
Ebf -3.9e+01
- -3.2e+01
- -2.9e+01
- -2.8e+01
Ets -2.8e+01
6 hr
:0 h
r12
hr:0
hr
24 h
r:0 h
r48
hr:0
hr
72 h
r:0 h
r12
0 hr
:0 h
r Figure 7. Evolving Enhancer Repertoires in
Developing Multipotent Progenitors
(A) Multipotent progenitors (Id2-HPCs) were
differentiated into pro-B cells over a 5-day time
course, and RNA was taken at 7 time points for
microarray analysis. Expressionwas normalized to
day 0. Cluster I refers to genes activated 120 hr
postdifferentiation. Cluster II refers to genes acti-
vated 48 hr postdifferentiation. Cluster III refers to
genes repressed 120 hr postdifferentiation.
(B) Enriched regulatory motifs at distal H3K4me1
sites during early B cell differentiation. ChIP-Seq
was performed on multipotent progenitors (Id2-
HPC) at 0, 48, and 120 hr after induction of B cell
differentiation. De novo motif finding was per-
formed to determine transcription factor binding
motifs associated with active enhancers of genes
that are upregulated (CI), intermediately upregu-
lated (C2), and downregulated (C3). The known
motif names are indicated to the left of the de novo
motifs. Log p values of the de novo motifs are
indicated below of the names of the motifs.
Hyphen refers to unknown motif.
Immunity
Multilineage Priming of Enhancer Repertoires
As aforementioned, cluster I represents loci whose expression
is activated during the developmental progression from the mul-
tipotent (0 hr) to the committed (120 hr) B cell stage. At the multi-
potent HPC stage, putative enhancers modulating the expres-
422 Immunity 35, 413–425, September 23, 2011 ª2011 Elsevier Inc.
sion of cluster I loci frequently contain
binding motifs for Pu.1, Runx, and a
potential participant named Erg. Upon
developmental progression to the com-
mitted B cell stage, initially E2A and ulti-
mately Ebf binding sites were frequently
associated with active enhancers, con-
sistent with the induction of a B cell
lineage program of gene expression (Fig-
ure 7B, cluster I at 120 hr).
Cluster II represents loci whose tran-
script levels are transiently elevated but
decline prior to the commitment cell stage
(Figure 7, cluster II). The cistromic ele-
ments associated with this subset of
genes were distinct from that of cluster I.
Analysis of this cluster showed a substan-
tial enrichment for Runx and Ets binding
sites (Figure7B,CII). Twodaysafter induc-
tionofdifferentiation,enhancer repertories
were identified that included E2A and a
potential cis-regulatory element, Fli-1 (Fig-
ure 7B, CII at 48 hr). Five days postdiffer-
entiation, the enhancer repertoire again
was altered as characterized by the sin-
gular presence of Pu.1 binding sites (Fig-
ure 7B, CII at 48 hr).
Cluster III represents loci whose tran-
script levels decline upon developmental
maturation from the multipotent HPC to
the committed B cell (Figure 7B, CIII).
They include genes whose expression is
associated with alternate lineages and HSC cell identity,
including Hoxa5, Hoxa7, Hbb-b1, Ptcra, and Thy1. Interestingly,
upon developing into committed B cells, H3K4me1 islands in
these loci were substantially enriched for E2A and Fli binding
Immunity
Multilineage Priming of Enhancer Repertoires
sites (Figure 7B, CIII at 120 hr). Five days postinduction, the
enhancer repertoires were changed as demonstrated by the
lack of E2A and Fli1 binding sites and the presence of Ebf
consensus cis-regulatory elements (Figure 7B, CIII at 120 hr).
Thus, it appears that these combinations of regulatory elements
suppress rather than activate the expression of genes associ-
ated with alternate cell lineages in committed B cells. In sum,
we describe the differentiation of multipotent HPCs into com-
mitted B lineage cells in terms of evolving enhancer repertoires
that involve both known regulators such as E2A, EBF, and
PU.1 as well as potential participants such as Erg and Fli1.
DISCUSSION
Recent genome-wide studies have provided insight into how
transcriptional regulators act in concert to specify a develop-
mental stage (Ghisletti et al., 2010; Heinz et al., 2010; Treiber
et al., 2010; Lin et al., 2010; Natoli, 2010). We are now faced
with the fundamental question as to how such networks are
established during the developmental progression from the
multipotent HPC to a committed lymphoid or myeloid cell stage.
Here we describe experimental and computational strategies to
address this question.
Previous studies have demonstrated that long-term cultures of
E2A-deficient progenitors remain pluripotent both in vitro and
in vivo (Ikawa et al., 2004). A limitation of these cells is that
E2A-deficient cells cannot be differentiated into committed B
cells because the E2A proteins are required for the initiation of
the B cell pathway. Additionally, forced E47 expression has, until
now, not permitted rescue of the developmental block observed
in E2A-deficient pre-pro-B cells. Here we have developed
a strategy that overcomes this obstacle. In brief, we have gener-
ated a long-term culture of HPCs by enforcing the expression of
the E-protein inhibitor Id2 (Rivera and Murre, 2001). Id2-HPCs
are multipotent both in vitro and in vivo (Ikawa et al., 2004).
However, unlike E2A-deficient progenitors, Id2-HPCs have the
ability to differentiate into the B cell lineage upon downregulation
of Id2. These studies indicate that it is the activity of E2A that
plays a causative role in B cell specification. It is the accumula-
tion of E2A activity in multipotent progenitors that permits B cells
to begin their developmental journey.
A tight correlation between enhancers associated with tran-
scriptionally activegenesandH3K4monomethylationhas recently
been established (Heintzman et al., 2007). We demonstrate that
multipotentHPC lineage-restrictedenhancer elements are already
primed as demonstrated by the presence of H3K4 methylation
prior to differentiation. As expected, upon commitment to the B
or myeloid cell lineage, we observed an increase in H3K4 mono-
and trimethylation across genomic regions associated with a B
cell or myeloid cell lineage programs of gene expression, respec-
tively. In addition, the degree of H3K4methylation declined across
genomic regions linked with the alternate programs of gene
expression. Taken together, these data confirmed the previous
notion that H3K4me1 regions are associatedwith transcriptionally
poisedor active regions. Thesefindingsare in linewith theconcept
of multilineage priming, previously proposed to be involved in the
maintenance of multipotency in HSCs (Hu et al., 1997).
The simplest explanation of multilineage priming is that a low
level of expression of several lineage-determining transcription
Im
factors at the precursor stage ‘‘primes’’ genomic regions charac-
teristic of different hematopoietic lineages. Therefore, it is likely
that, in progenitor cells, these premarked enhancers are already
associated, possibly at low levels, with the very same transcrip-
tion factors that will bind these regions in fully differentiated cells.
It is very well possible that prelineage priming involves E2A. E2A
proteins are expressed in HSCs and act to maintain the HSC
pool (Dias et al., 2008; Semerad et al., 2009; Yang et al., 2008).
Thus, it may be that E2A functions in progenitor population to
premark lymphoid enhancer repertoires. This raises the question
as to why this premarking generates a low degree of H3K4
monomethylation in multipotent progenitors relative to lineage-
committed cells. The level of E2A at these developmental stages
is similar to that of pro-B cells. Thus, it does not seem likely that
the expression of E2A in HSCs versus pro-B cells generates
differences in the degree of H3K4 monomethylation. Although
still to be proven, it is conceivable that E2A associates with
different partners including SCL/TAL1 in HSCs. The SCL
proteins are well known to heterodimerize with E2A. Thus, we
suggest that the E2A proteins could function in HSCs to promote
the premarking of a lymphoid-specific enhancer repertoire,
whereas in committed B cells, they act as homodimers to elevate
H3K4me1 abundance across poised enhancer regions and thus
induce a B cell lineage program of gene expression.
The establishment of committed lymphoid cells from mulitpo-
tent HPCs involves multiple intermediate stages. How are
such intermediate stages established? Developmental stages
can be characterized in terms of gene expression signatures.
Gene expression signatures are in turn primarily established by
enhancer repertoires. Here, we have used genome-wide and
computational approaches to describe the evolving enhancer
repertoires that underpin early B cell development. These reper-
toires include E2A, Ebf, Ets, Runx, and Pu.1, as well as Erg and
Fli1 consensus binding sites. Erg and Fli1 are particularly
intriguing because they have previously been suggested, based
on their expression patterns, to play critical roles in early B cell
development (Rivera et al., 1993).
In sum, we have generated long-term cultures of HPCs that
are multipotent and self-renew indefinitely in vitro. Remarkably,
the distribution of motifs across enhancer repertoires does not
change dramatically during developmental progression. How-
ever, we note that a fraction of the enhancer repertoires has
changed upon becoming committed to the B cell lineage. This
is particularly apparent by the increased frequency of Ebf motifs
at 120 hr relative to 0 hr. Finally, by using directed differentiation,
gene expression microarrays, and identification of enhancer
repertoires by H3K4me1, we describe the early stages of B cell
development in terms of evolving global enhancer and silencer
repertoires. In principle, this analysis can be applied to any
developmental setting including b-selection, positive selection,
receptor editing, and beyond.
EXPERIMENTAL PROCEDURES
Viral Vectors and Virus Production
Human ID2 was amplified from 293T cDNA with the addition of BamH1
sites at both 30 and 50 ends and then cloned into pRRL.sin-
18.PPT.PGK.MCS.IRES.GFP.pre, kindly provided by I. Weissman (Stanford
University). The hId2_IRES-GFP expression cassette was excised with AgeI
and BsrG1, replacing the eGFP gene in pBob_TA1_R2_corrected120803,
munity 35, 413–425, September 23, 2011 ª2011 Elsevier Inc. 423
Immunity
Multilineage Priming of Enhancer Repertoires
kindly provided by I. Verma (Salk Institute). hId2 was then cut out of the result-
ing vector to create an empty vector control. These vectors were named
TetOff_hId2 and TetOff_Empty, respectively.
Transduction and Cell Culture
CD45.1 congenic animals (8–12weeks of age) were injected with 250mg/kg of
5-fluorouracil 4 days before bone marrow was harvested and lineage depleted
by auto-MACS. Purified lineage-negative cells were cultured overnight in
expansion media (DMEM + 15% FBS in the presence of 10 ng/mL IL-3,
10 ng/ml IL-6, 1:200 SCF, and 1:20 WEHI). After 12–18 hr in culture, cells
were pelleted and resuspended in fresh expansion media plus TetOff_hId2
or TetOff_Empty lentivirus in the presence of 4 mg/mL polybrene and the above
cytokines. Cells were spin infected twice for 1.5 hr at 2500 rpm, 30�C, with
a 12–18 hr rest in between spin infections. After the second spin, cells were
resuspended in fresh expansion media and cultured for 4–5 weeks. Cells
were then cultured in IMDM + 10% FCS, 2% PSG, and 2 ml b-me on subcon-
fluent S17 feeder cells in the presence of 1:100 IL-7, 1:100 Flt3L, and 1:200
SCF. S17 feeder cells were maintained in a-MEM + 10% FBS and 2% PSG.
Animal studies were approved by the Institutional Animal Care and Use
Committee of the University of California, San Diego.
In Vitro Differentiation
TetOff_hId2 expanded cells were depleted of small (<1%–5%) numbers of
CD19-, CD25-, and CD11b-positive cells by auto-MACS. For myeloid differen-
tiation, cells were cultured for up to 6 days in IMDM+10%FCS and b-me in the
presence of IL3, Flt3L, GMCSF, and MCSF and in the presence or absence of
1 mg/mL doxycycline. To promote B cell differentiation, cells were cultured for
up to 10 days in IMDM + 10% FCS and b-me on S17 feeder cells in the pres-
ence of 1:100 IL-7 and 1:200 SCF in the presence or absence of 1 mg/mL doxy-
cycline, or alternatively, in a-MEM in the presence of cytokines and the Tst-4
stromal cell line (kind gift from T. Ikawa). Fresh doxcycline and cytokines
were added every 2 days. E2A�/� cells were cultured as previously described
(Ikawa et al., 2004).
Microarray Profiling
All RNA was prepared with RNeasy Columns (QIAGEN). Gene expression
profiling depicted in Figure 1 was performed by hybridization to the Affymetrix
MOE430 2.0 gene expression array according to the manufacturer’s instruc-
tions. Gene expression profiling depicted in Figures 1, 4, and 7 was performed
by amplification and hybridization to the Illumina Mouse WG-6 v1.1 and v2
gene expression arrays according to the manufacturer’s instructions. Differ-
entially expressed genes were determined with the Limma package from
BioConductor. A Benjamini-Hochberg-adjusted p value cut-off of 0.05 and
a fold-change threshold of 2 were utilized. Hierarchical clustering was per-
formed on this set of genes. The distance metric used was (1� Pearson corre-
lation coefficient), and the ‘‘average’’ (unweighted pair-group averagemethod,
UPGMA) method was used for agglomeration. Clusters were obtained by
empirically cutting the tree.
ChIP-Sequencing
The chromatin immunoprecipitation (ChIP) protocol was essentially the same
as previously described (Agata et al., 2007; Lin et al., 2010). Anti-H3K4me1
(ab8895) and anti-H3K4me3 (07-473) were purchased from Abcam and Milli-
pore, respectively. Anti-H3K4me1 ChIP-Seq was performed in duplicate.
Peaks form duplicate experiments were merged to identify putative peaks.
Those peak positions and each of the individual experiments were used to
score the peak and to ensure significance relative to the input. The R package
‘‘edgeR’’ was used to perform the significance calculations.
Data Analysis
Clusters of tags across the analyzed genomes were identified based on the
significantly enrichment of tags relative to background as well as local tag
counts. Data were analyzed with HOMER software (http://biowhat.ucsd.edu/
homer/). Bound sites were identified with HOMER. ChIP-Seq tag counts
were normalized between experiments to a total of 107 mapped tags. The
peak region was required to show 4-fold more tags (as compared to total
tag count) than controls. Additionally, DNA bound elements were required to
exhibit at least 2-fold more tags within a 1 kb region versus flanking 10 kbp
424 Immunity 35, 413–425, September 23, 2011 ª2011 Elsevier Inc.
DNA regions. The threshold for the number of tags generating an interacting
site was determined for a false discovery rate of 0.001. Furthermore, peaks
were required to exhibit at least 4-fold more tags (normalized versus total
number) versus input control samples. To avoid identifying DNA elements
that contain genomic duplications or nonlocalized occupancy, a 4-fold in-
crease in the number of tags relative to tags located within immediate genomic
proximity was chosen as a threshold. The detailed description of the heat map
generation was found in http://biowhat.ucsd.edu/homer/. In brief, a peak file of
the first biological replicate of the top 5000 high confidence peaks that had at
least 4-fold more tags within a 1 kb region versus flanking 10 kbp DNA regions.
Then, the sequences within 3000 bp upstream and downstream of the peak
centers of each replicate were clustered by the average linkage method with
Cluster 3.0. The heat map was visualized by Java Tree View.
Replicates for ChIP-Seq of H3K4me1 in Id2-HPCs, Id2-HPCs induced to
differentiate toward the B cell lineage for 2 and 5 days, and myeloid cells
were merged into one file each in a single ‘‘META’’-experiment. EdgeR was
used to calculate the false discovery rates to determine the difference between
the merged files and input. Motifs associated with transcription factor occu-
pancies were identified with HOMER software (C.B., unpublished data; Heinz
et al., 2010). To analyze H3K4me1 islands for enrichedmotifs, DNA sequences
(plus or minus 500 bp centered across H3K4me1 peaks) were compared to
50,000 randomly identified genomic fragments of similar size and matched
for the proportion of GC content.
ACCESSION NUMBERS
The microarray and ChIP_Seq data are available in the Gene Expression
Omnibus (GEO) database (http://www.ncbi.nlm.nih.gov/gds) under the acces-
sion number GSE30859.
SUPPLEMENTAL INFORMATION
Supplemental Information includes six figures and one table and can be found
with this article online at doi:10.1016/j.immuni.2011.06.013.
ACKNOWLEDGMENTS
We thankG. Hardiman, C. Ludka, J. Sprague,M. Harabaglia, and Z. Ye for help
with Solexa DNA Sequencing. We are grateful to J. Sprague for microarray
analysis. We thank the members of the C.M. laboratory for comments on
the manuscript. E.M.M. was supported by a training grant from the NIH.
Y.C.L. was supported by the Ruth L. Kirschstein Research Service Award
(1F32CA130276). The studies were supported by grants from the NSF (NSF
IIS-0803937) to T.I. and from the NIH to C.B. (P01DK074868), C.K.G.
(CA52599), and C.M. (CA054198-20) and BIOGEMDK063491 to the University
of California, San Diego Core Facility.
Received: January 3, 2011
Revised: May 25, 2011
Accepted: June 22, 2011
Published online: September 8, 2011
REFERENCES
Adolfsson, J., Mansson, R., Buza-Vidas, N., Hultquist, A., Liuba, K., Jensen,
C.T., Bryder, D., Yang, L., Borge, O.-J., Thoren, L.A.M., et al. (2005).
Identification of Flt3+ lympho-myeloid stem cells lacking erythro-megakaryo-
cytic potential a revised road map for adult blood lineage commitment. Cell
121, 295–306.
Agata, Y., Tamaki, N., Sakamoto, S., Ikawa, T., Masuda, K., Kawamoto, H.,
and Murre, C. (2007). Regulation of T cell receptor beta gene rearrangements
and allelic exclusion by the helix-loop-helix protein, E47. Immunity 27,
871–884.
Amin, R.H., and Schlissel, M.S. (2008). Foxo1 directly regulates the transcrip-
tion of recombination-activating genes during B cell development. Nat.
Immunol. 9, 613–622.

Immunity
Multilineage Priming of Enhancer Repertoires
Bain, G., Maandag, E.C.R., Izon, D.J., Amsen, D., Kruisbeek, A.M., Weintraub,
B.C., Krop, I., Schlissel, M.S., Feeney, A.J., van Roon, M., et al. (1994). E2A
proteins are required for proper B cell development and initiation of immuno-
globulin gene rearrangements. Cell 79, 885–892.
Bain, G., Engel, I., Robanus Maandag, E.C., te Riele, H.P., Voland, J.R., Sharp,
L.L., Chun, J., Huey, B., Pinkel, D., and Murre, C. (1997). E2A deficiency leads
to abnormalities in alphabeta T-cell development and to rapid development of
T-cell lymphomas. Mol. Cell. Biol. 17, 4782–4791.
Barski, A., Cuddapah, S., Cui, K., Roh, T.-Y., Schones, D.E., Wang, Z., Wei, G.,
Chepelev, I., and Zhao, K. (2007). High-resolution profiling of histone
methylations in the human genome. Cell 129, 823–837.
Beck, K., Peak,M.M., Ota, T., Nemazee, D., andMurre, C. (2009). Distinct roles
for E12 and E47 in B cell specification and the sequential rearrangement of
immunoglobulin light chain loci. J. Exp. Med. 206, 2271–2284.
Benezra, R., Davis, R.L., Lockshon, D., Turner, D.L., and Weintraub, H. (1990).
The protein Id: A negative regulator of helix-loop-helix DNA binding proteins.
Cell 61, 49–59.
Busslinger, M. (2004). Transcriptional control of early B cell development.
Annu. Rev. Immunol. 22, 55–79.
Decker, T., Pasca di Magliano, M., McManus, S., Sun, Q., Bonifer, C., Tagoh,
H., and Busslinger, M. (2009). Stepwise activation of enhancer and promoter
regions of the B cell commitment gene Pax5 in early lymphopoiesis.
Immunity 30, 508–520.
Dengler, H.S., Baracho, G.V., Omori, S.A., Bruckner, S., Arden, K.C.,
Castrillon, D.H., DePinho, R.A., and Rickert, R.C. (2008). Distinct functions
for the transcription factor Foxo1 at various stages of B cell differentiation.
Nat. Immunol. 9, 1388–1398.
Dias, S., Mansson, R., Gurbuxani, S., Sigvardsson, M., and Kee, B.L. (2008).
E2A proteins promote development of lymphoid-primed multipotent progeni-
tors. Immunity 29, 217–227.
Ghisletti, S., Barozzi, I., Mietton, F., Polletti, S., De Santa, F., Venturini, E.,
Gregory, L., Lonie, L., Chew, A., Wei, C.-L., et al. (2010). Identification and
characterization of enhancers controlling the inflammatory gene expression
program in macrophages. Immunity 32, 317–328.
Hagman, J., and Lukin, K. (2006). Transcription factors drive B cell develop-
ment. Curr. Opin. Immunol. 18, 127–134.
Heinz, S., Benner, C., Spann, N., Bertolino, E., Lin, Y.C., Laslo, P., Cheng, J.X.,
Murre, C., Singh, H., and Glass, C.K. (2010). Simple combinations of lineage-
determining transcription factors prime cis-regulatory elements required for
macrophage and B cell identities. Mol. Cell 38, 576–589.
Heintzman, N.D., Stuart, R.K., Hon, G., Fu, Y., Ching, C.W., Hawkins, R.D.,
Barrera, L.O., Van Calcar, S., Qu, C., Ching, K.A., et al. (2007). Distinct and
predictive chromatin signatures of transcriptional promoters and enhancers
in the human genome. Nat. Genet. 39, 311–318.
Hu, M., Krause, D., Greaves, M., Sharkis, S., Dexter, M., Heyworth, C., and
Enver, T. (1997). Multilineage gene expression precedes commitment in the
hemopoietic system. Genes Dev. 11, 774–785.
Ikawa, T., Kawamoto, H., Wright, L.Y.T., and Murre, C. (2004). Long-term
cultured E2A-deficient hematopoietic progenitor cells are pluripotent.
Immunity 20, 349–360.
Inlay, M.A., Bhattacharya, D., Sahoo, D., Serwold, T., Seita, J., Karsunky, H.,
Plevritis, S.K., Dill, D.L., and Weissman, I.L. (2009). Ly6d marks the earliest
stage of B-cell specification and identifies the branchpoint between B-cell
and T-cell development. Genes Dev. 23, 2376–2381.
Kondo, M., Weissman, I.L., and Akashi, K. (1997). Identification of clonogenic
common lymphoid progenitors in mouse bone marrow. Cell 91, 661–672.
Lazorchak, A., Jones, M.E., and Zhuang, Y. (2005). New insights into E-protein
function in lymphocyte development. Trends Immunol. 26, 334–338.
Lin, H.H., and Grosschedl, R. (1995). Failure of B-cell differentiation in mice
lacking the transcription factor EBF. Nature 376, 263–267.
Im
Lin, Y.C., Jhunjhunwala, S., Benner, C., Heinz, S., Welinder, E., Mansson, R.,
Sigvardsson, M., Hagman, J., Espinoza, C.A., Dutkowski, J., et al. (2010). A
global network of transcription factors, involving E2A, EBF1 and Foxo1, that
orchestrates B cell fate. Nat. Immunol. 11, 635–643.
Mansson, R., Zandi, S., Anderson, K., Martensson, I.-L., Jacobsen, S.E.W.,
Bryder, D., and Sigvardsson, M. (2008). B-lineage commitment prior to surface
expression of B220 and CD19 on hematopoietic progenitor cells. Blood 112,
1048–1055.
Mansson, R., Zandi, S., Welinder, E., Tsapogas, P., Sakaguchi, N., Bryder, D.,
and Sigvardsson, M. (2010). Single-cell analysis of the common lymphoid
progenitor compartment reveals functional and molecular heterogeneity.
Blood 115, 2601–2609.
McManus, S., Ebert, A., Salvagiotto, G., Medvedovic, J., Sun, Q., Tamir, I.,
Jaritz, M., Tagoh, H., and Busslinger, M. (2011). The transcription factor
Pax5 regulates its target genes by recruiting chromatin-modifying proteins in
committed B cells. EMBO J. 30, 2388–2404.
Murre, C., McCaw, P.S., and Baltimore, D. (1989). A new DNA binding and
dimerization motif in immunoglobulin enhancer binding, daughterless,
MyoD, and myc proteins. Cell 56, 777–783.
Natoli, G. (2010). Maintaining cell identity through global control of genomic
organization. Immunity 33, 12–24.
Nutt, S.L., Urbanek, P., Rolink, A., and Busslinger, M. (1997). Essential
functions of Pax5 (BSAP) in pro-B cell development: Difference between fetal
and adult B lymphopoiesis and reduced V-to-DJ recombination at the IgH
locus. Genes Dev. 11, 476–491.
Pokholok, D.K., Harbison, C.T., Levine, S., Cole, M., Hannett, N.M., Lee, T.I.,
Bell, G.W., Walker, K., Rolfe, P.A., Herbolsheimer, E., et al. (2005). Genome-
wide map of nucleosome acetylation and methylation in yeast. Cell 122,
517–527.
Rivera, R., and Murre, C. (2001). The regulation and function of the Id proteins
in lymphocyte development. Oncogene 20, 8308–8316.
Rivera, R.R., Stuiver, M.H., Steenbergen, R., and Murre, C. (1993). Ets pro-
teins: New factors that regulate immunoglobulin heavy-chain gene expression.
Mol. Cell. Biol. 13, 7163–7169.
Seet, C.S., Brumbaugh, R.L., and Kee, B.L. (2004). Early B cell factor promotes
B lymphopoiesis with reduced interleukin 7 responsiveness in the absence of
E2A. J. Exp. Med. 199, 1689–1700.
Semerad, C.L., Mercer, E.M., Inlay, M.A., Weissman, I.L., andMurre, C. (2009).
E2A proteinsmaintain the hematopoietic stem cell pool and promote thematu-
ration of myelolymphoid and myeloerythroid progenitors. Proc. Natl. Acad.
Sci. USA 106, 1930–1935.
Spangrude, G.J., Heimfeld, S., and Weissman, I.L. (1988). Purification and
characterization of mouse hematopoietic stem cells. Science 241, 58–62.
Treiber, T., Mandel, E.M., Pott, S., Gyory, I., Firner, S., Liu, E.T., and
Grosschedl, R. (2010). Early B cell factor 1 regulates B cell gene networks
by activation, repression, and transcription- independent poising of chromatin.
Immunity 32, 714–725.
Urbanek, P., Wang, Z.-Q., Fetka, I., Wagner, E.F., and Busslinger, M. (1994).
Complete block of early B cell differentiation and altered patterning of the
posterior midbrain in mice lacking Pax5/BSAP. Cell 79, 901–912.
Xie, H., Ye, M., Feng, R., and Graf, T. (2004). Stepwise reprogramming of B
cells into macrophages. Cell 117, 663–676.
Yang, Q., Kardava, L., St Leger, A., Martincic, K., Varnum-Finney, B.,
Bernstein, I.D., Milcarek, C., and Borghesi, L. (2008). E47 controls the develop-
mental integrity and cell cycle quiescence of multipotential hematopoietic
progenitors. J. Immunol. 181, 5885–5894.
Zhuang, Y., Soriano, P., and Weintraub, H. (1994). The helix-loop-helix gene
E2A is required for B cell formation. Cell 79, 875–884.
Zhuang, Y., Jackson, A., Pan, L., Shen, K., and Dai, M. (2004). Regulation of
E2A gene expression in B-lymphocyte development. Mol. Immunol. 40,
1165–1177.
munity 35, 413–425, September 23, 2011 ª2011 Elsevier Inc. 425


![REVIEW Open Access The relationship between high density ... · and preb 1-HDL) and preb 2-HDL [2,3]. Epidemiological studies have shown that individual HDL subclasses are not equally](https://img.pdfslide.us/doc/110x75/5fdc4d5903b7875ee20c3acc/review-open-access-the-relationship-between-high-density-and-preb-1-hdl-and.jpg)