Embed Size (px)
Citation preview
AQUATIC MICROBIAL ECOLOGYAquat Microb Ecol
Vol. 61: 57–72, 2010doi: 10.3354/ame01439
Published online September 9
INTRODUCTION
The Río de la Plata estuary, situated betweenArgentina and Uruguay, covers an area of approxi-mately 38 800 km2 and drains the second largest basinof South America. This system entails a highly produc-tive area, sustaining valuable fisheries of Uruguay,Argentina, and international fleets (Bisbal 1995, Mar-tinez & Retta 2001, Acha et al. 2008). The Río de laPlata also constitutes the main point source of freshwa-
ter in the South Atlantic (Boltovskoy et al. 1999). Thisarea is particularly relevant for the global carbon bud-get, acting as a CO2 sink, especially during spring andsummer (Feely et al. 2001, Bianchi et al. 2005).
In spite of its key significance, there is still very lim-ited understanding of basic ecological aspects of thedifferent plankton components of the Río de la Plata,and previous studies have been focused mainly on thephytoplankton assemblage (Carreto et al. 2003, Cal-liari et al. 2009). The complex dynamic nature of estu-
© Inter-Research 2010 · www.int-res.com*Email: [email protected]
Multilevel analysis of the bacterial diversityalong the environmental gradient
Río de la Plata–South Atlantic Ocean
Cecilia Alonso1,*, Paola Gómez-Pereira2, Alban Ramette2, Leonardo Ortega3, Bernhard M. Fuchs2, Rudolf Amann2
1Instituto de Investigaciones Biológicas Clemente Estable, Av. Italia 3318, CP 11600, Montevideo, Uruguay2Max Planck Institute for Marine Microbiology, Celsiusstr. 1, 28359 Bremen, Germany
3Dirección Nacional de Recursos Acuáticos, Constituyente 1497, CP 11200, Montevideo, Uruguay
ABSTRACT: The Río de la Plata is the world’s largest estuary, draining the second largest basin ofSouth America. In spite of its key significance at the local and global scale, this is the first attemptmade so far to characterize the bacterial diversity of this system. We employed a suite of molecularmethods to analyze the bacterial diversity at different phylogenetic levels, both in terms of richnessand evenness, and we related these findings to physicochemical parameters. A clear environmentalgradient was observed with 3 distinctive zones (riverine, frontal, and marine). In turn, the bacterialcommunities appeared highly diverse and strongly structured by the environment. A high number(324) of different operational taxonomic units (OTUs) were identified by automated ribosomal inter-genic spacer analysis (ARISA). The ARISA results suggested that the composition of bacterioplank-ton communities was strongly related to physicochemical water characteristics, and that the bacterio-plankton had little overlap with the bacterial assemblage of the sediments. Catalyzed reporterdeposition-fluorescence in situ hybridization (CARD-FISH) indicated that Betaproteobacteria andActinobacteria were more abundant in the riverine zone, whereas Gammaproteobacteria and Planc-tomycetes preferred the marine waters. The relative abundance of Bacteroidetes peaked in thefrontal zone, and Alphaproteobacteria were numerically dominant throughout the estuary. Theanalysis of about 300 almost full-length 16S rRNA gene sequences pointed to the existence of ubiq-uitous phylotypes, but also suggested habitat preferences among certain groups. This first look intothe bacterial community of the Río de la Plata demonstrated marked diversity patterns, providing fur-ther insights into the ecology of globally distributed groups of aquatic bacteria.
KEY WORDS: Estuary · Bacteria · Río de la Plata · Diversity · FISH · ARISA · Cloning
Resale or republication not permitted without written consent of the publisher
Aquat Microb Ecol 61: 57–72, 2010
arine systems represents a challenge for the study ofplanktonic communities, but at the same time providesa unique scenario to analyze microbial populationsexperiencing very different environmental conditions,in a relatively small area.
A number of authors have analyzed the changes inbacterial community composition (BCC) in transitionalaquatic environments employing molecular tech-niques. In their pioneer work Crump et al. (1999) used16S rRNA gene clone libraries to characterize micro-bial communities from freshwater and marine portionsof the Columbia River estuary. Since then, severalresearchers have employed fingerprinting methods,predominantly denaturing gradient gel electrophore-sis (DGGE), to obtain patterns of BCC in different estu-arine systems (e.g. Murray et al. 1996, Hollibaugh et al.2000, Troussellier et al. 2002, Crump et al. 2004). Morerecently, Hewson & Fuhrman (2004) used automatedribosomal intergenic spacer analysis (ARISA) to studythe diversity of the microbial communities at MoretonBay, Australia. Fluorescence in situ hybridization(FISH) has also been employed to determine the abun-dance of major bacterial groups in a number of estuar-ies (Bouvier & del Giorgio 2002, Cottrell & Kirchman2003, Zhang et al. 2006).
Although these studies have provided clear insightsinto the microbial ecology of transitional environments,there is still an obvious need for data on subtropical sys-tems; so far only 2 such systems have been targeted(Hewson & Fuhrman 2004, Zhang et al. 2006). In addi-tion, there are very few examples of studies in aquaticmicrobial ecology combining the 3 methodological ap-proaches mentioned above (Anton et al. 2000, Watan-abe et al. 2000, Simek et al. 2001, Alonso-Sáez et al.2007). This strategy is desirable: there is still a need toaddress variations in BCC at different phylogenetic lev-els and to link this information with appropriate envi-ronmental parameters, in order to gain deeper under-standing of the ecology of aquatic bacteria.
Although a few eco-physiological aspectsappear to be well established (e.g. negativecorrelation of natural abundances ofBetaproteobacteria and salinity) (Glöckneret al. 1999, Bouvier & del Giorgio 2002),there is still considerable lack of informa-tion about the factors controlling the distrib-ution of bacterial populations. Even themost recent meta-analysis of 16S genesequences,which disentangled the effect ofsalinity on BCC into salt composition andsalt concentration influence, stressed thelack of contextual data and the strong sam-pling bias towards northern temperateregions as serious limitations for bio-geo-graphical studies (Barberán & Casamayor
2010). Furthermore, the major phylogenetic groupsencompass members with quite different ecologicalstrategies (Alonso & Pernthaler 2006, Alonso-Saez &Gasol 2007), particularly in habitats characterized bysharp environmental transitions (Alonso et al. 2009).
The aim of the present study was to employ a suite ofmolecular methods to analyze the bacterial diversityalong a transect in a subtropical estuary, and to relatediversity and community composition patterns to envi-ronmental data.
MATERIALS AND METHODS
Study area. The Río de la Plata is a large-scale estu-ary characterized by a salt-wedge regime, a low tidalamplitude (<1 m), a broad and permanent connectionto the sea, and high susceptibility to atmospheric forc-ing due to its large extension and shallow water depth(Acha et al. 2008 and references therein). The positionof the turbidity maximum is highly variable accordingto tide, river discharge, and wind (Framiñan & Brown1996). The resulting outflow is on average 22 000 m3 s–1
(Framiñan & Brown 1996), showing seasonal variabil-ity with maxima in March–June and September–Octo-ber, and a minimum in December–March (Guerrero etal. 1997, Nagy et al. 2002).
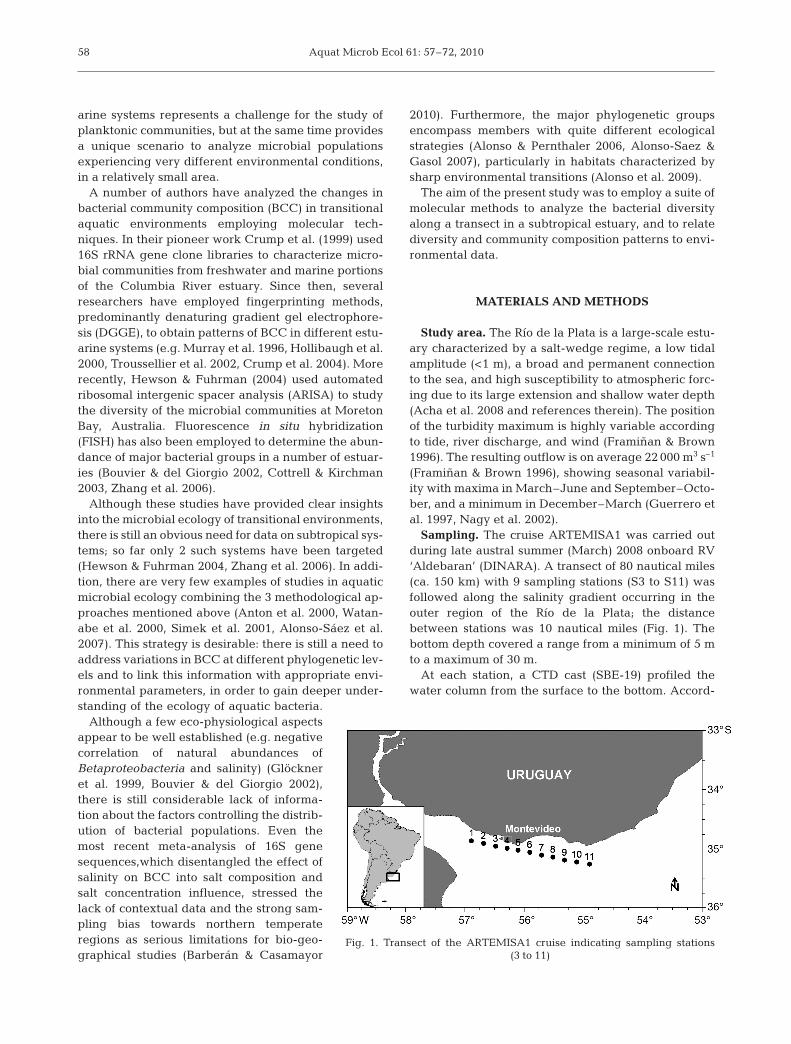
Sampling. The cruise ARTEMISA1 was carried outduring late austral summer (March) 2008 onboard RV‘Aldebaran’ (DINARA). A transect of 80 nautical miles(ca. 150 km) with 9 sampling stations (S3 to S11) wasfollowed along the salinity gradient occurring in theouter region of the Río de la Plata; the distancebetween stations was 10 nautical miles (Fig. 1). Thebottom depth covered a range from a minimum of 5 mto a maximum of 30 m.
At each station, a CTD cast (SBE-19) profiled thewater column from the surface to the bottom. Accord-
58
Fig. 1. Transect of the ARTEMISA1 cruise indicating sampling stations(3 to 11)
Alonso et al.: Bacterial diversity of Río de la Plata
ing to the CTD data, 6 stations were chosen for sam-pling bacterial communities. Surface water sampleswere taken using a bucket; sub-surface water sampleswere taken with Niskin bottles. All sampling deviceswere acid-washed and seawater-rinsed prior to use. ASmith-McIntyre bottom grab sampler was used forsampling sediment.
Physicochemical characterization. Water sampleswere filtered through glass fiber filters (WhatmanGF/F, 47 mm) to assess total chlorophyll a (chl a) andsuspended particulate matter. Filters were stored driedand frozen for subsequent analysis in the laboratory.Chlorophyll was extracted with 90% acetone and ana-lyzed with a Shimadzu UV–2101 PC, UV-VIS scanningspectrophotometer. Chl a concentration was calculatedaccording to Jeffrey & Humphrey (1975) with correc-tion for phaeopigments (Lorenzen 1967). Suspendedparticulate matter was estimated by the gravimetricmethod of the particulate material (Strickland & Par-sons 1972).
Water samples for dissolved nutrient analysis werefiltered through a Whatman GF/C glass fiber filter.Inorganic nutrient concentrations measured at eachstation included total nitrogen (TN) and total phospho-rus (TP) (Valderrama 1981), and dissolved fractions ofnitrite (Strickland & Parsons 1972), nitrate (Eaton et al.2005), ammonium (Koroleff 1976), and soluble reactivephosphorus (SRP) (Murphy & Riley 1962). Nutrientconcentrations were determined colorimetricallyemploying a Shimadzu UV–2101 PC, UV-VIS scanningspectrophotometer.
Sample collection for determination of in situ abun-dance of different bacterial populations. Water sam-ples were fixed with freshly prepared bufferedparaformaldehyde solution (PFA) at a final concentra-tion of 1% for 24 h. Portions of 10 ml were then filteredthrough polycarbonate filters (type GTTP, 0.2 µm poresize, 47 mm diameter; Millipore). The filters wererinsed twice with sterile phosphate buffered saline(PBS) and stored at –20°C until further analysis.
DNA collection and extraction. Ten liters of thewater sample from each station were pre-filteredthrough 50 µm and 10 µm and then filtered onto cellu-lose acetate filters (142 mm diameter, 0.2 µm pore size;Sartorius). Filters were stored at –20°C until furtherprocessing. For sediment samples, the first centimeterlayer was collected using a sterile Petri dish, and theDNA extraction was performed from a 10 g sub-sam-ple. DNA was extracted following the protocol by Zhouet al. (1996).
Genetic fingerprinting of bacterial communities.The standard ARISA protocol by Ramette (2009) wasapplied. For the amplification of the intergenic spacerthe forward universal primer ITSF and the eubacterialITSReub reverse primer were employed (Cardinale et
al. 2004). The reverse primer was labeled with thephosphoramidite dye HEX. PCR conditions, purifica-tion, and sample preparation prior to submitting tocapillary electrophoresis were done as described pre-viously (Ramette 2009). The electropherograms ob-tained from fragment analysis were examined withGeneMapper software v. 3.7 (Applied Biosystems).The output tables from GeneMapper were analyzedusing custom R binning scripts (Ramette 2009). Tripli-cates samples were analyzed for replicated fragments.Further analysis was based on the fragments thatappeared in at least 2 of the replicates, generating anaverage profile for each sample.
Cluster analysis was performed using relative fluo-rescence intensity (RFI) data. The similarity matrixbetween samples was calculated with the Bray-Curtiscoefficient and the group average was used as the link-age algorithm. Significance of the grouping in the clus-ter analysis was tested using similarity profile permu-tation test (SIMPROF) at 99% significance level.SIMPROF tests for statistically significant evidence ofgenuine clusters in an a priori unstructured set ofsamples (Clarke et al. 2008). Analysis was performedwith the software Primer v. 6 (version 6.1.5, Primer-E)(Clarke & Gorley 2006).
Construction of clone libraries. Almost completebacterial 16S rRNA genes were amplified via PCRusing the primers 27f-YM (Frank et al. 2008) and 1492-GM4R (Muyzer et al. 1995). PCR products were puri-fied using the QIAquick PCR purification kit (Qiagen)and cloned using the pGEM®-T easy system (Invitro-gen). Competent Escherichia coli cells (house-made)were transformed and plated on Luria-Bertani (LB)agar plates containing 50 µg ml–1 of ampicillin. Singlecolonies were transferred into microtiter plates (MTP)containing ampicillin-amended LB medium (50 µgml–1) and cultivated overnight at 37°C. Glycerol (12%final concentration) was added to each well, and theMTPs were stored at –20°C until further processing.
Sequencing. Plasmids were isolated from cloneswith Montage plasmid MiniPrep96 kit (Millipore), and50 to 100 ng of template was used per sequencingreaction. Sequencing reactions were performed usingABI BigDye® chemistry and an ABI 3100 genetic ana-lyzer (Applied Biosystems) according to the manu-facturer’s instructions. M13F and M13R primers wereused to obtain 298 gene sequences of 16S rRNA. Par-tial sequences were assembled and manually cor-rected using the software Sequencher (Gene Codes).Chimeric sequences were identified using the Mallardand Pintail programs (Ashelford et al. 2006) and 5sequences were thus removed. The 16S rRNA genesequences produced during the present study weredeposited in GenBank under accession numbersGU230187 to GU230468.
59
Aquat Microb Ecol 61: 57–72, 2010
Phylogenetic reconstructions. Phylogenetic analy-ses were performed using the ARB software package(Ludwig et al. 2004). The sequences were automati-cally pre-aligned using the SILVA tool Aligner(www.arb-silva.de) (Pruesse et al. 2007). Alignmentswere subsequently improved manually consideringthe secondary structure of the rRNA molecule. Treereconstruction was done with the maximum likelihoodalgorithm RaxML (Stamatakis 2006) on various subsetsof the complete data set.
Population analysis by CARD-FISH. The percent-ages of different microbial taxa in the water sampleswere determined by FISH with horseradish peroxidase-labeled oligonucleotide probes and catalyzed reporterdeposition (CARD-FISH) (Pernthaler et al. 2002). Thefollowing probes were used to characterize the micro-bial community: EUB338 I-III (most Bacteria) (Daims etal. 1999), ALF968 (most Alphaproteobacteria) (Neef1997), BET42a (most Betaproteobacteria) (Manz et al.1992), GAM42a (most Gammaproteobacteria) (Manz etal. 1992), CF319a (many groups of Bacteroidetes)(Manz et al. 1996), HGC69a (most Actinobacteria)(Roller et al. 1994), PLA46 most Planctomycetes (Neefet al. 1998), SAR11-441 (members of the alphapro-teobacterial SAR11 clade) (Morris et al. 2002), ROS537(members of the alphaproteobacterial Roseobacter-Sulfitobacter-Silicibacter clade) (Eilers et al. 2001),NOR5-730 (members of the gammaproteobacterialNOR5/OM60 clade) (Eilers et al. 2001), SAR86-1245(members of the gammaproteobacterial SAR86 clade)(Eilers et al. 2000), POL740 (members of the genus Po-laribacter of Bacteroidetes) (Malmstrom et al. 2007),CF6-1267 (members of DE cluster 2 of the Flavobacteriaclass of the phylum Bacteroidetes) (Kirchman et al.2003), and VIS1-575 (uncultured marine VIS1 clade ofthe Flavobacteria class of the phylum Bacteroidetes)(Gomez-Pereira et al. 2010).
All probes were purchased from Biomers.net. Signalamplification was performed with fluorescein isothio-cyanate (FITC)-labeled tyramides (Molecular Probes).CARD-FISH preparations were counterstained withDAPI at a final concentration of 1 µg ml–1. DAPI- andCARD-FISH-stained cells were counted manually,achieving a minimum of 1000 cells filter–1.
Statistical analyses. ARISA profiles and CARD-FISHabundance data sets were Hellinger-transformed priorto applying linear multivariate methods (Legendre &Gallagher 2001, Ramette 2007). To relate variation inmicrobial data to variation in spatial and environmen-tal parameters, redundancy analyses (RDA) were per-formed on quantitative variables that were standard-ized to unit variance and zero mean. Spatial co-ordinates (latitude and longitude) were converted toCartesian spatial coordinates (x, y) using the R pack-age gmt. A forward selection procedure was per-
formed to retain only the environmental variables thatsignificantly explained variation in bacterial data(Legendre & Legendre 1998). Following this proce-dure, the selected terms were then analyzed in concertwith the other contextual parameters using the R pack-age vegan (http://cc.oulu.fi/~jarioksa/softhelp/vegan.html).
RESULTS
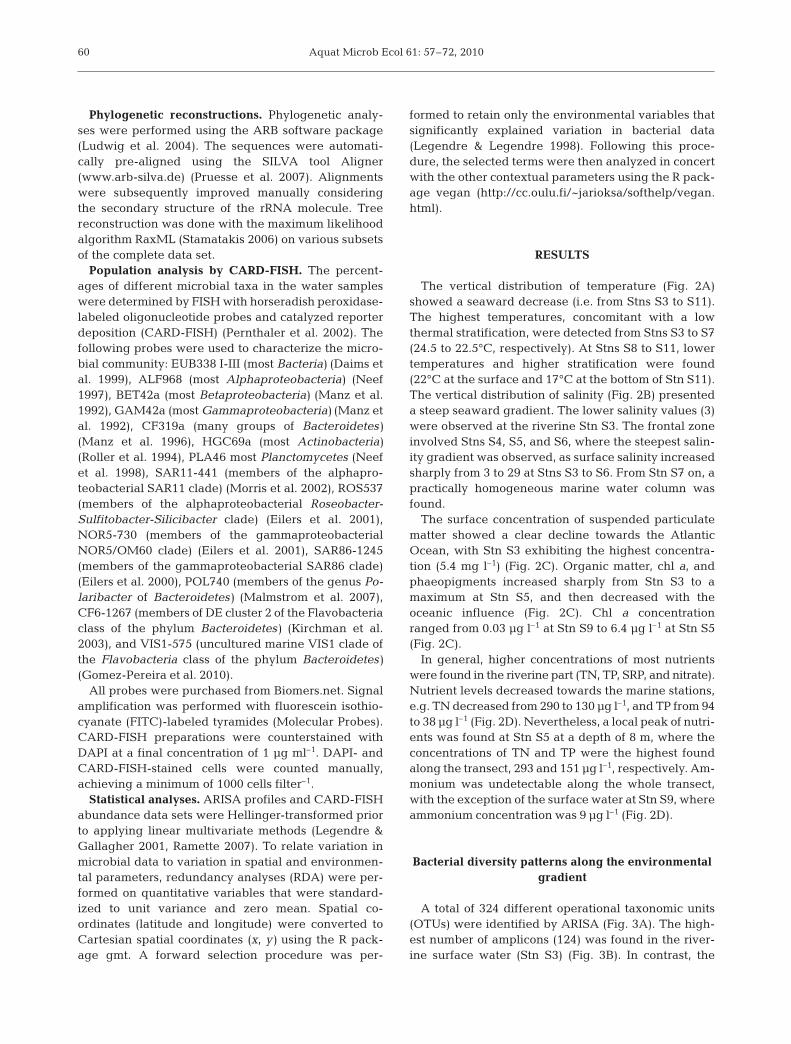
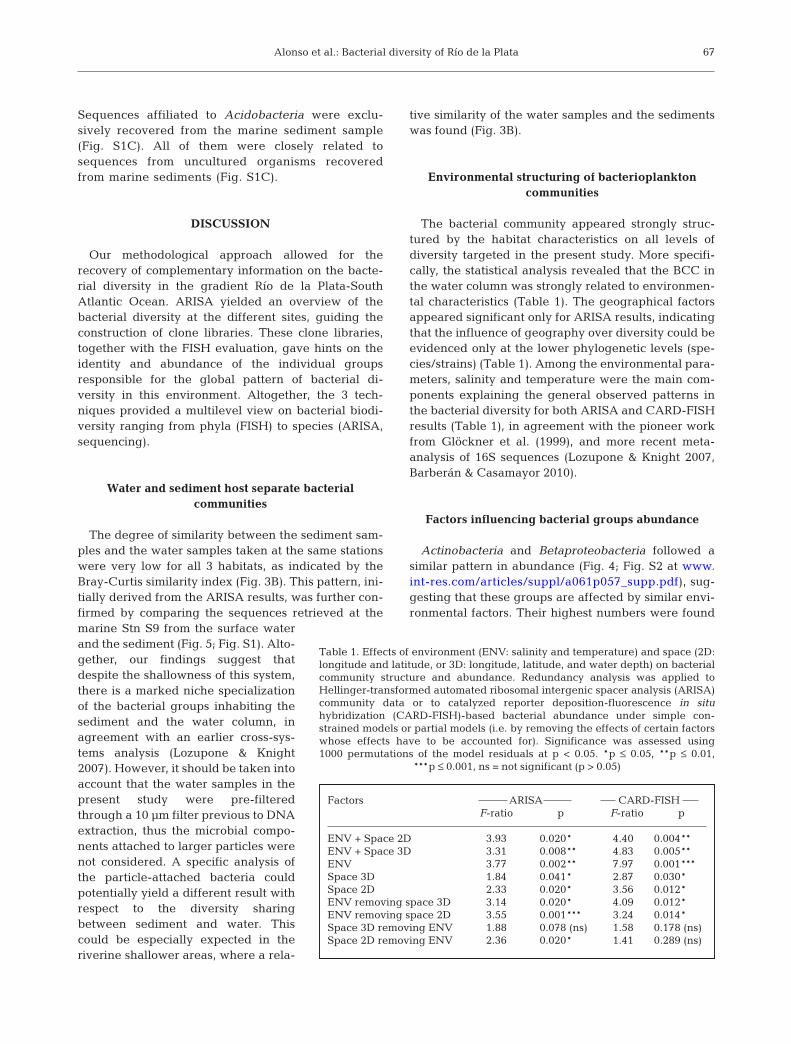
The vertical distribution of temperature (Fig. 2A)showed a seaward decrease (i.e. from Stns S3 to S11).The highest temperatures, concomitant with a lowthermal stratification, were detected from Stns S3 to S7(24.5 to 22.5°C, respectively). At Stns S8 to S11, lowertemperatures and higher stratification were found(22°C at the surface and 17°C at the bottom of Stn S11).The vertical distribution of salinity (Fig. 2B) presenteda steep seaward gradient. The lower salinity values (3)were observed at the riverine Stn S3. The frontal zoneinvolved Stns S4, S5, and S6, where the steepest salin-ity gradient was observed, as surface salinity increasedsharply from 3 to 29 at Stns S3 to S6. From Stn S7 on, apractically homogeneous marine water column wasfound.
The surface concentration of suspended particulatematter showed a clear decline towards the AtlanticOcean, with Stn S3 exhibiting the highest concentra-tion (5.4 mg l–1) (Fig. 2C). Organic matter, chl a, andphaeopigments increased sharply from Stn S3 to amaximum at Stn S5, and then decreased with theoceanic influence (Fig. 2C). Chl a concentrationranged from 0.03 µg l–1 at Stn S9 to 6.4 µg l–1 at Stn S5(Fig. 2C).
In general, higher concentrations of most nutrientswere found in the riverine part (TN, TP, SRP, and nitrate).Nutrient levels decreased towards the marine stations,e.g. TN decreased from 290 to 130 µg l–1, and TP from 94to 38 µg l–1 (Fig. 2D). Nevertheless, a local peak of nutri-ents was found at Stn S5 at a depth of 8 m, where theconcentrations of TN and TP were the highest foundalong the transect, 293 and 151 µg l–1, respectively. Am-monium was undetectable along the whole transect,with the exception of the surface water at Stn S9, whereammonium concentration was 9 µg l–1 (Fig. 2D).
Bacterial diversity patterns along the environmentalgradient
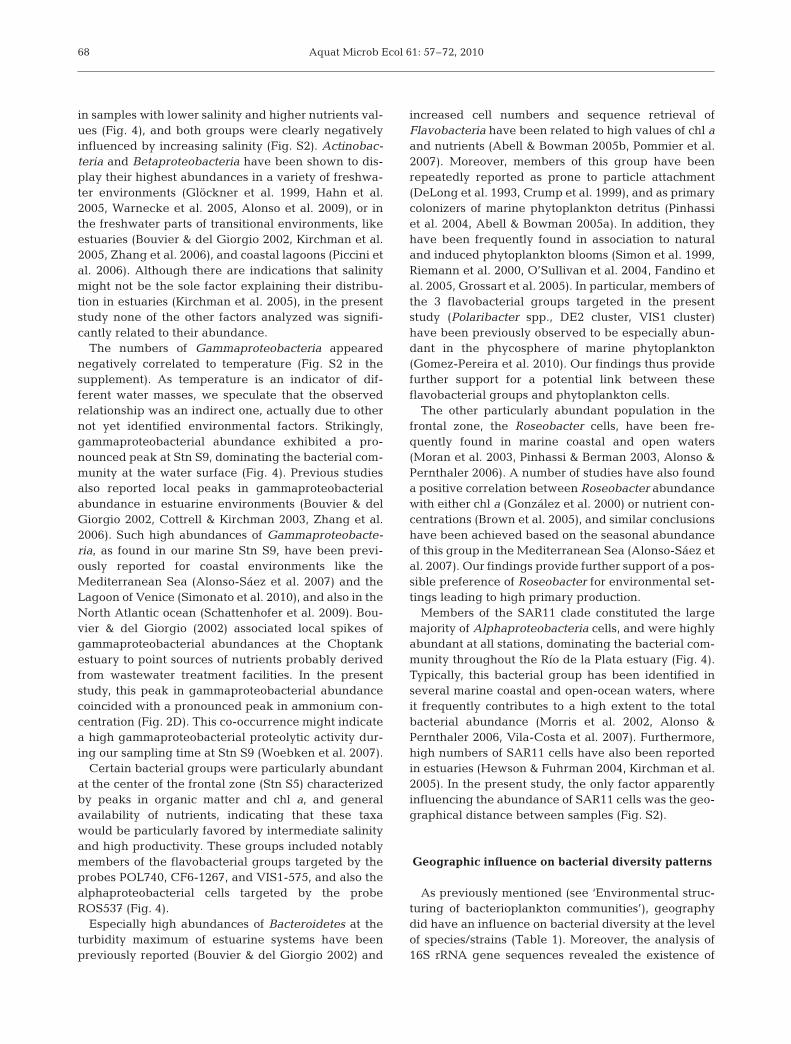
A total of 324 different operational taxonomic units(OTUs) were identified by ARISA (Fig. 3A). The high-est number of amplicons (124) was found in the river-ine surface water (Stn S3) (Fig. 3B). In contrast, the
60
Alonso et al.: Bacterial diversity of Río de la Plata 61
A C8
Con
cent
ratio
nC
once
ntra
tions
(µg
l–1)
7
6
SPM (mg l–1)
TN (µg N-NO3 l–1)
TP (µg P-PO4 l–1)
SRP (µg P-PO4 l–1)
Nitrite (µg N-NO2 l–1)
Nitrate (µg N-NO3 l–1)
Ammonium (µg N-NH4 l–1)
OM (mg l–1)Chl a (µg l–1)Phaeopig. (µg l–1)
5
4
3
2
1
0
S3 su
rf
S3 su
rf
S4 su
rf
S5 su
rf
S6 su
rf
S9 su
rf
S11 su
rf
S5 4
m
S9 5
m
S9 15
m
S5 8
m
S4 su
rf
S5 su
rf
S6 su
rf
S7 su
rf
S8 su
rf
350
300
250
200
150
100
50
0
D
Dep
th (m
)
Distance (nautical miles)
Water sample
Dep
th (m
)
Stations
B
Fig. 2. Distribution of (A) temperature, (B) salinity, (C) suspended particulate matter (SPM), organic matter (OM), chlorophyll a(Chl a), and pheopigments (Phaeopig.), and (D) total nitrogen (TN), total phosphorus (TP), nitrite, nitrate, ammonium, and solublereactive phosphorus (SRP) along the sampling transect. S3 = Stn 3, S5 = Stn 5, etc.; 4 m = 4 m depth, 5 m = 5 m depth, etc.
Riverine(186)
Frontal Zone(239)
Marine(188)
19
71
46
58
64
28
38Average RFI
2
34
5S5 surf
S5 4 m
S5 8 m
S6 surf
S9 15 m
S11 surf
S9 surf
S9 5 m
S3 surf
S3 4 m
S9 sed
S3 sed
S5 sed
Wate
r sam
ple
100806040200
Similarity
SedimentRiver
MarineFrontal Zone
A BTotal (324)
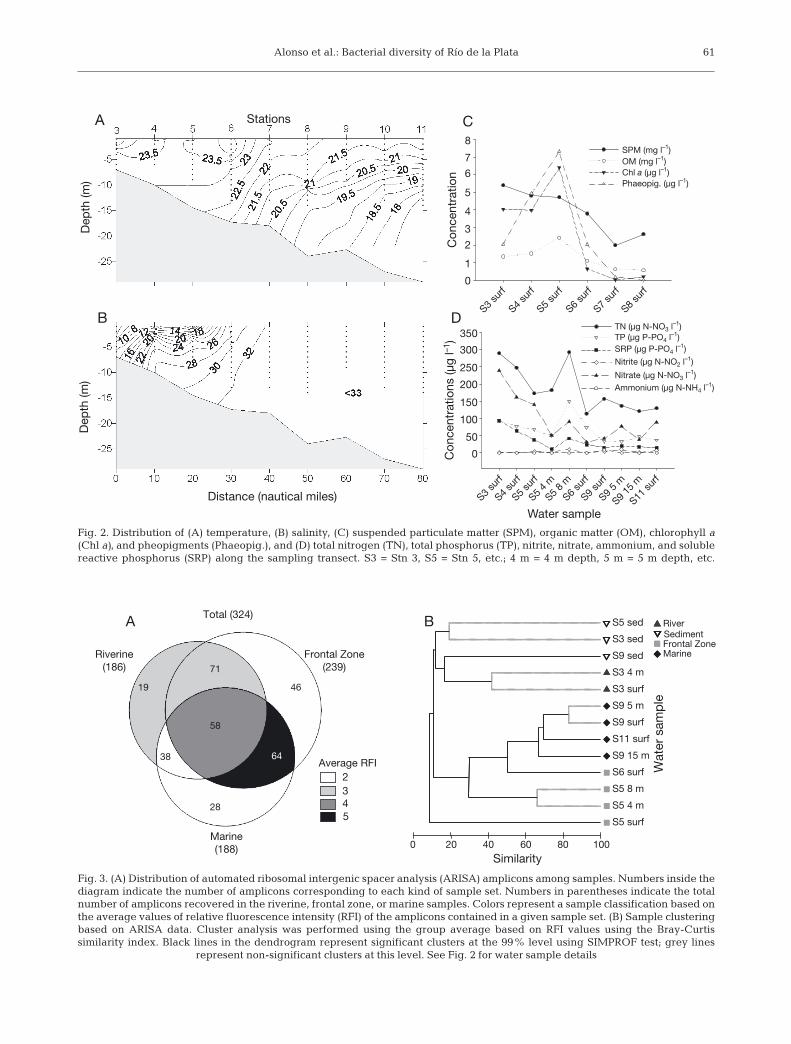
Fig. 3. (A) Distribution of automated ribosomal intergenic spacer analysis (ARISA) amplicons among samples. Numbers inside thediagram indicate the number of amplicons corresponding to each kind of sample set. Numbers in parentheses indicate the totalnumber of amplicons recovered in the riverine, frontal zone, or marine samples. Colors represent a sample classification based onthe average values of relative fluorescence intensity (RFI) of the amplicons contained in a given sample set. (B) Sample clusteringbased on ARISA data. Cluster analysis was performed using the group average based on RFI values using the Bray-Curtissimilarity index. Black lines in the dendrogram represent significant clusters at the 99% level using SIMPROF test; grey lines
represent non-significant clusters at this level. See Fig. 2 for water sample details
Aquat Microb Ecol 61: 57–72, 2010
lowest number of amplicons (54) occurred in the sedi-ment sample of the same station (Fig. 3B). Around 50%of the obtained OTUs were present in 2 of the 3 zonesof the gradient (riverine, frontal, and marine), whereas58 OTUs were present in all 3 zones (Fig. 3A). Thehighest number of OTUs (239) was retrieved from thefrontal zone stations; most of these amplicons werealso obtained either from the riverine and/or themarine samples (Fig. 3A). Several OTUs were distinctto habitats: the number of unique OTUs per habitatwas 19 (riverine), 46 (frontal zone), and 28 (marine)(Fig. 3A). The OTU with the highest RFI value in thefrontal zone (an amplicon of a length of approximately300 bp) was also present in the marine zone (data notshown). In the marine and riverine samples, fragmentswith highest RFIs had amplicon lengths of 334 and218 bp, respectively, and none of them was habitat-exclusive (data not shown).
Although each sample displayed a unique commu-nity fingerprint, a series of diversity patterns wasrevealed, both in the longitudinal and in the depthdimensions. The sediment samples were more similarto each other than to the water samples of the corre-sponding stations (Fig. 3B). The sediment communitiesappeared relatively similar to the water column assem-blage from the riverine Stn S3 (Fig. 3B). Althoughwater samples from the surface and 4 m depth ofStn S3 clustered together, they exhibited lower similar-ity indexes than comparable samples taken at themarine stations (Fig. 3B). All water samples from fullymarine stations (S9 to S11) clustered closely together,and depth was not a decisive factor for the clustering(Fig. 3B). For example, the water sample from Stn S9taken at 15 m depth had a similarity Bray-Curtis indexof 0.74 with the surface water from Stn S11 (Fig. 3B).The marine stations shared more OTUs between them,at any depth, than with any other sample (Fig. 3B). Incontrast, in the frontal zone samples clustered accord-ing to depth rather than to station, i.e. water samplesfrom Stn S5 at 4 and 8 m depth were more closelyrelated to the marine samples than with the surfacewater at the same station (Fig. 3B). Interestingly, thesurface sample of the center of the frontal zone wasclearly distinct from all other samples (Fig. 3B).
BCC as revealed by FISH and clone libraries
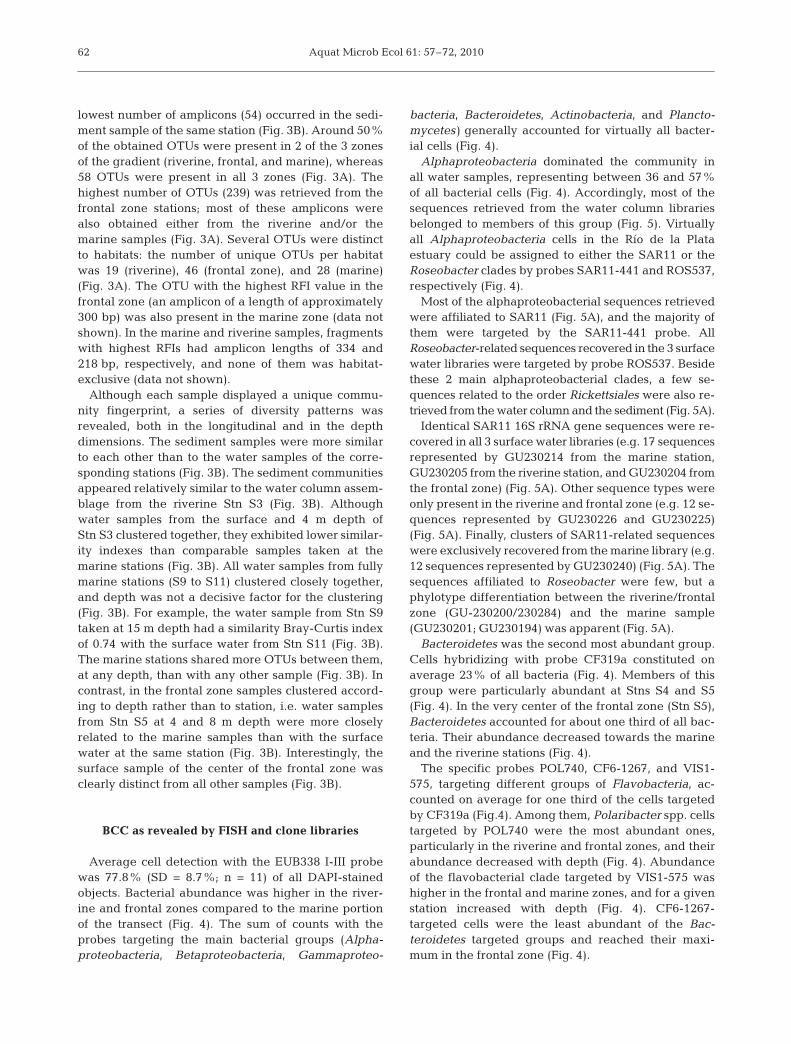
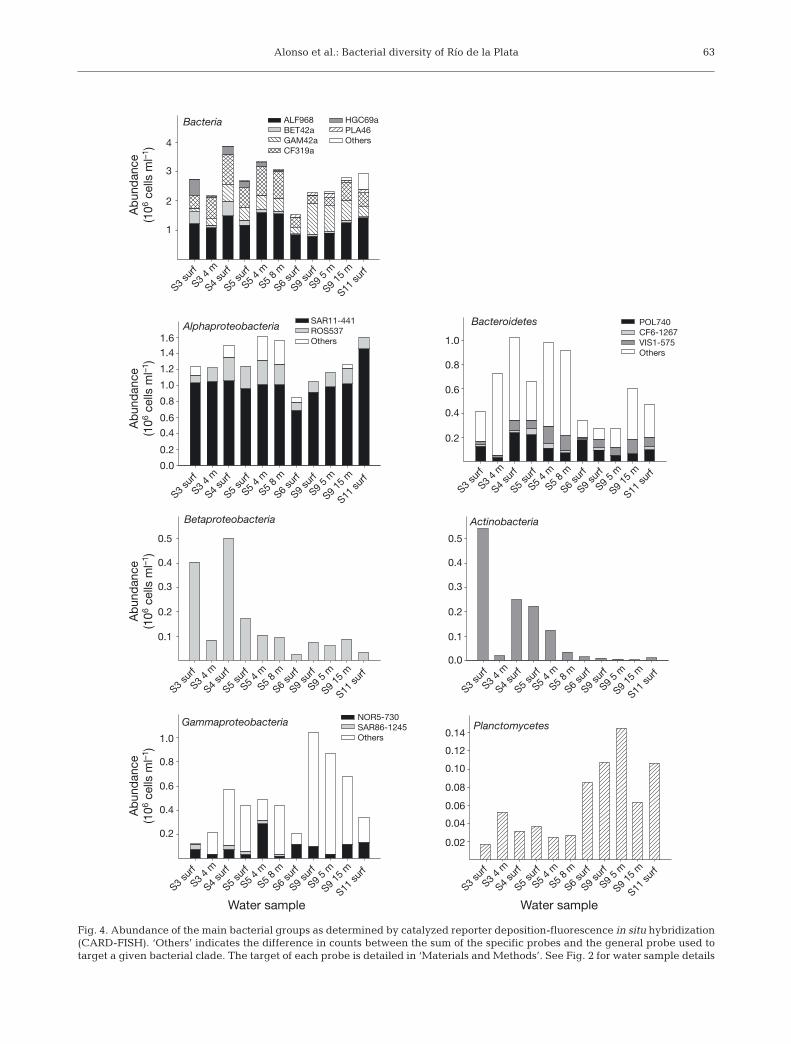
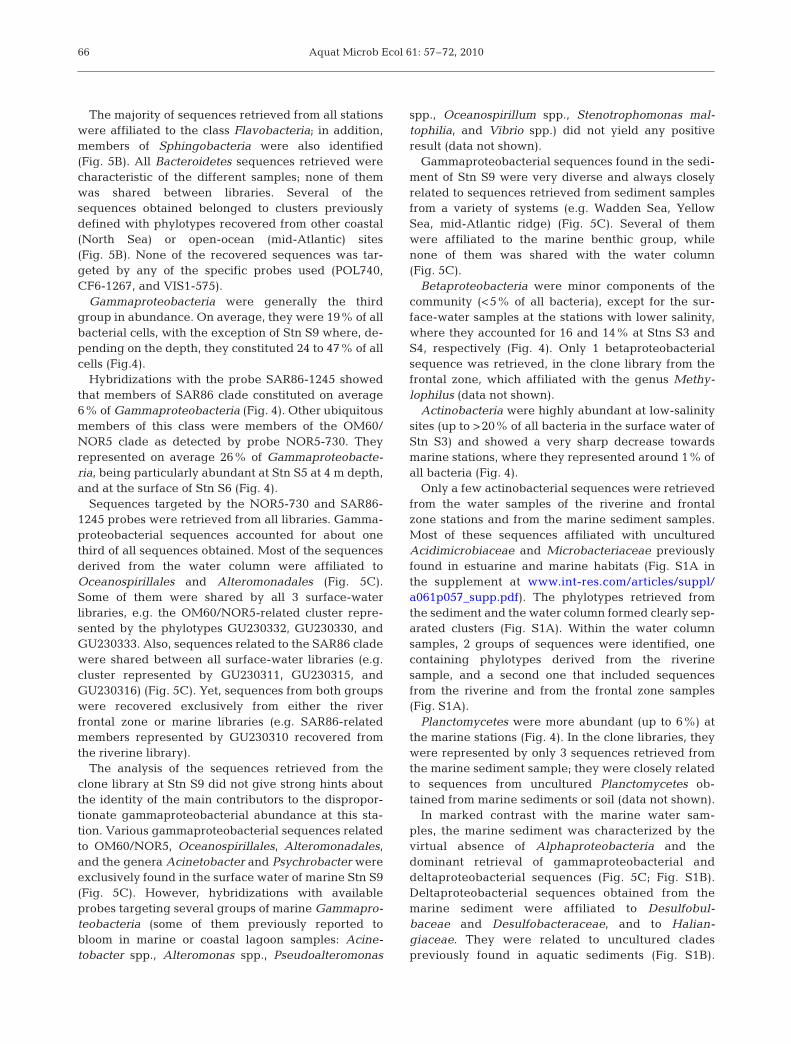
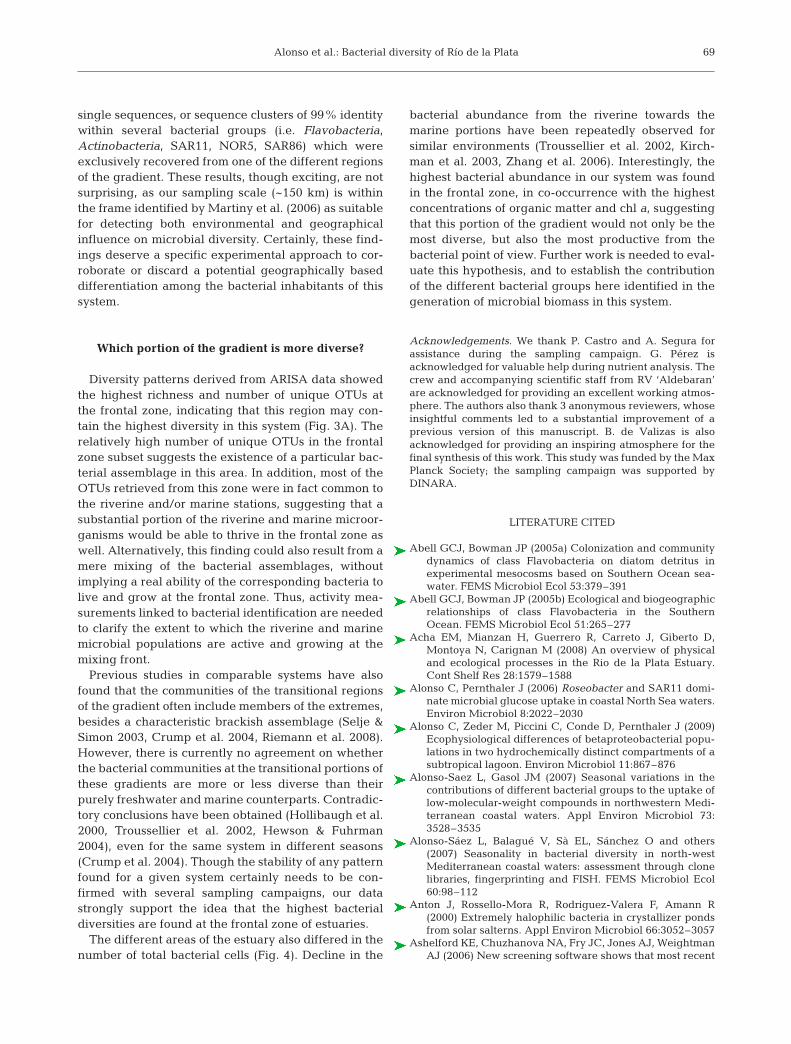
Average cell detection with the EUB338 I-III probewas 77.8% (SD = 8.7%; n = 11) of all DAPI-stainedobjects. Bacterial abundance was higher in the river-ine and frontal zones compared to the marine portionof the transect (Fig. 4). The sum of counts with theprobes targeting the main bacterial groups (Alpha-proteobacteria, Betaproteobacteria, Gammaproteo-
bacteria, Bacteroidetes, Actinobacteria, and Plancto-mycetes) generally accounted for virtually all bacter-ial cells (Fig. 4).
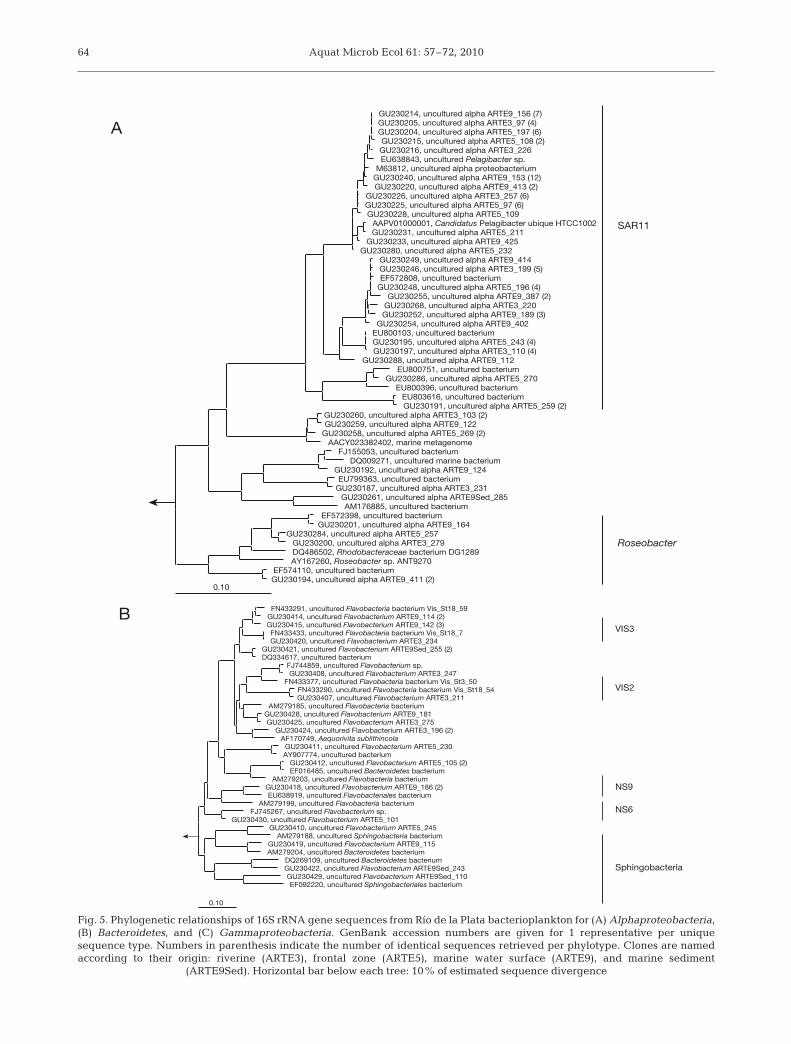
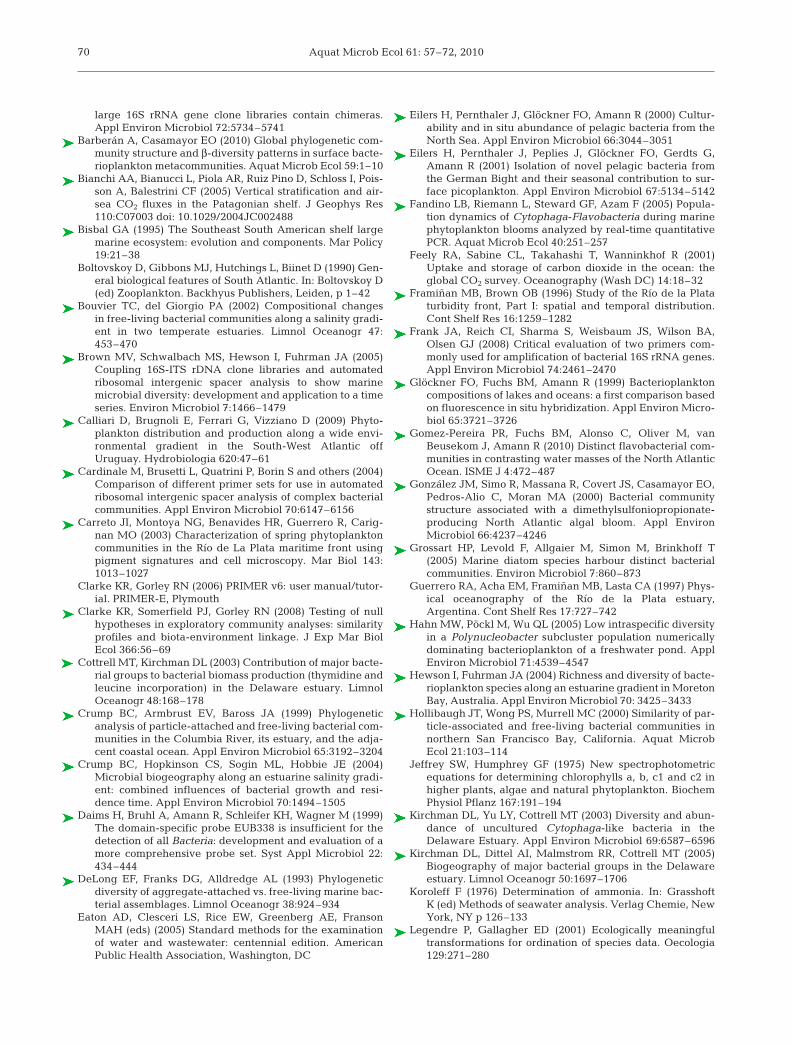
Alphaproteobacteria dominated the community inall water samples, representing between 36 and 57%of all bacterial cells (Fig. 4). Accordingly, most of thesequences retrieved from the water column librariesbelonged to members of this group (Fig. 5). Virtuallyall Alphaproteobacteria cells in the Río de la Plataestuary could be assigned to either the SAR11 or theRoseobacter clades by probes SAR11-441 and ROS537,respectively (Fig. 4).
Most of the alphaproteobacterial sequences retrievedwere affiliated to SAR11 (Fig. 5A), and the majority ofthem were targeted by the SAR11-441 probe. AllRoseobacter-related sequences recovered in the 3 surfacewater libraries were targeted by probe ROS537. Besidethese 2 main alphaproteobacterial clades, a few se-quences related to the order Rickettsiales were also re-trieved from the water column and the sediment (Fig. 5A).
Identical SAR11 16S rRNA gene sequences were re-covered in all 3 surface water libraries (e.g. 17 sequencesrepresented by GU230214 from the marine station,GU230205 from the riverine station, and GU230204 fromthe frontal zone) (Fig. 5A). Other sequence types wereonly present in the riverine and frontal zone (e.g. 12 se-quences represented by GU230226 and GU230225)(Fig. 5A). Finally, clusters of SAR11-related sequenceswere exclusively recovered from the marine library (e.g.12 sequences represented by GU230240) (Fig. 5A). Thesequences affiliated to Roseobacter were few, but aphylotype differentiation between the riverine/frontalzone (GU-230200/230284) and the marine sample(GU230201; GU230194) was apparent (Fig. 5A).
Bacteroidetes was the second most abundant group.Cells hybridizing with probe CF319a constituted onaverage 23% of all bacteria (Fig. 4). Members of thisgroup were particularly abundant at Stns S4 and S5(Fig. 4). In the very center of the frontal zone (Stn S5),Bacteroidetes accounted for about one third of all bac-teria. Their abundance decreased towards the marineand the riverine stations (Fig. 4).
The specific probes POL740, CF6-1267, and VIS1-575, targeting different groups of Flavobacteria, ac-counted on average for one third of the cells targetedby CF319a (Fig.4). Among them, Polaribacter spp. cellstargeted by POL740 were the most abundant ones,particularly in the riverine and frontal zones, and theirabundance decreased with depth (Fig. 4). Abundanceof the flavobacterial clade targeted by VIS1-575 washigher in the frontal and marine zones, and for a givenstation increased with depth (Fig. 4). CF6-1267-targeted cells were the least abundant of the Bac-teroidetes targeted groups and reached their maxi-mum in the frontal zone (Fig. 4).
62
Alonso et al.: Bacterial diversity of Río de la Plata 63
Alphaproteobacteria
Bacteria
Bacteroidetes
Betaproteobacteria Actinobacteria
Gammaproteobacteria
Water sample Water sample
1.0
0.5
1.6
4
3
2
1
1.4
1.2
1.0
1.0
0.8
0.6
0.4
0.2
0.8
0.6
0.4
0.2
0.0
0.4
0.3
0.2
0.1
0.5
0.4
0.3
0.2
0.1
0.0
0.14
NOR5-730SAR86-1245Others
POL740CF6-1267VIS1-575Others
SAR11-441ROS537Others
ALF968BET42aGAM42aCF319a
HGC69aPLA46Others
0.12
0.10
0.08
0.06
0.04
0.02
Ab
und
ance
(10
6 c
ells
ml–
1)
Ab
und
ance
(10
6 c
ells
ml–
1)
Ab
und
ance
(10
6 c
ells
ml–
1)
Ab
und
ance
(10
6 c
ells
ml–
1)
0.8
0.6
0.4
0.2
Planctomycetes
S3 su
rf
S4 su
rf
S5 su
rf
S6 su
rf
S9 su
rf
S9 5
m
S9 15
m
S11 sur
f
S5 4
m
S5 8
m
S3 4
m
S3 su
rf
S4 su
rf
S5 su
rf
S6 su
rf
S9 su
rf
S9 5
m
S9 15
m
S11 sur
f
S5 4
m
S5 8
m
S3 4
m
S3 su
rf
S4 su
rf
S5 su
rf
S6 su
rf
S9 su
rf
S9 5
m
S9 15
m
S11 sur
f
S5 4
m
S5 8
m
S3 4
m
S3 su
rf
S4 su
rf
S5 su
rf
S6 su
rf
S9 su
rf
S9 5
m
S9 15
m
S11 sur
f
S5 4
m
S5 8
m
S3 4
m
S3 su
rf
S4 su
rf
S5 su
rf
S6 su
rf
S9 su
rf
S9 5
m
S9 15
m
S11 sur
f
S5 4
m
S5 8
m
S3 4
m
S3 su
rf
S4 su
rf
S5 su
rf
S6 su
rf
S9 su
rf
S9 5
m
S9 15
m
S11 sur
f
S5 4
m
S5 8
m
S3 4
m
S3 su
rf
S4 su
rf
S5 su
rf
S6 su
rf
S9 su
rf
S9 5
m
S9 15
m
S11 sur
f
S5 4
m
S5 8
m
S3 4
m
Fig. 4. Abundance of the main bacterial groups as determined by catalyzed reporter deposition-fluorescence in situ hybridization(CARD-FISH). ‘Others’ indicates the difference in counts between the sum of the specific probes and the general probe used totarget a given bacterial clade. The target of each probe is detailed in ‘Materials and Methods’. See Fig. 2 for water sample details
Aquat Microb Ecol 61: 57–72, 201064
SAR11
Roseobacter
GU230214, uncultured alpha ARTE9_156 (7)GU230205, uncultured alpha ARTE3_97 (4)GU230204, uncultured alpha ARTE5_197 (6)GU230215, uncultured alpha ARTE5_108 (2)GU230216, uncultured alpha ARTE3_226EU638843, uncultured Pelagibacter sp.
M63812, uncultured alpha proteobacteriumGU230240, uncultured alpha ARTE9_153 (12)GU230220, uncultured alpha ARTE9_413 (2)
GU230226, uncultured alpha ARTE3_257 (6)GU230225, uncultured alpha ARTE5_97 (6)GU230228, uncultured alpha ARTE5_109
AAPV01000001, Candidatus Pelagibacter ubique HTCC1002GU230231, uncultured alpha ARTE5_211
GU230233, uncultured alpha ARTE9_425 GU230280, uncultured alpha ARTE5_232
GU230249, uncultured alpha ARTE9_414 GU230246, uncultured alpha ARTE3_199 (5)EF572808, uncultured bacterium
GU230248, uncultured alpha ARTE5_196 (4)GU230255, uncultured alpha ARTE9_387 (2)
GU230268, uncultured alpha ARTE3_220GU230252, uncultured alpha ARTE9_189 (3)
GU230254, uncultured alpha ARTE9_402EU800103, uncultured bacteriumGU230195, uncultured alpha ARTE5_243 (4)GU230197, uncultured alpha ARTE3_110 (4)
GU230288, uncultured alpha ARTE9_112EU800751, uncultured bacterium
GU230286, uncultured alpha ARTE5_270EU800396, uncultured bacterium
EU803616, uncultured bacteriumGU230191, uncultured alpha ARTE5_259 (2)
GU230260, uncultured alpha ARTE3_103 (2)GU230259, uncultured alpha ARTE9_122
GU230258, uncultured alpha ARTE5_269 (2)AACY023382402, marine metagenome
FJ155053, uncultured bacteriumDQ009271, uncultured marine bacterium
GU230192, uncultured alpha ARTE9_124EU799363, uncultured bacterium
GU230187, uncultured alpha ARTE3_231GU230261, uncultured alpha ARTE9Sed_285AM176885, uncultured bacterium
EF572398, uncultured bacteriumGU230201, uncultured alpha ARTE9_164
GU230284, uncultured alpha ARTE5_257GU230200, uncultured alpha ARTE3_279DQ486502, Rhodobacteraceae bacterium DG1289AY167260, Roseobacter sp. ANT9270
EF574110, uncultured bacteriumGU230194, uncultured alpha ARTE9_411 (2)
0.10
FN433291, uncultured Flavobacteria bacterium Vis_St18_59GU230414, uncultured Flavobacterium ARTE9_114 (2)GU230415, uncultured Flavobacterium ARTE9_142 (3)FN433433, uncultured Flavobacteria bacterium Vis_St18_7GU230420, uncultured Flavobacterium ARTE3_234
GU230421, uncultured Flavobacterium ARTE9Sed_255 (2)DQ334617, uncultured bacterium
FJ744859, uncultured Flavobacterium sp.GU230408, uncultured Flavobacterium ARTE3_247
FN433377, uncultured Flavobacteria bacterium Vis_St3_50FN433290, uncultured Flavobacteria bacterium Vis_St18_54GU230407, uncultured Flavobacterium ARTE3_211
AM279185, uncultured Flavobacteria bacteriumGU230428, uncultured Flavobacterium ARTE9_181GU230425, uncultured Flavobacterium ARTE3_275
GU230424, uncultured Flavobacterium ARTE3_196 (2)AF170749, Aequorivita sublithincola
GU230411, uncultured Flavobacterium ARTE5_230AY907774, uncultured bacterium
GU230412, uncultured Flavobacterium ARTE5_105 (2)EF016485, uncultured Bacteroidetes bacterium
AM279203, uncultured Flavobacteria bacteriumGU230418, uncultured Flavobacterium ARTE9_186 (2)EU638919, uncultured Flavobacteriales bacterium
AM279199, uncultured Flavobacteria bacteriumFJ745267, uncultured Flavobacterium sp.
GU230430, uncultured Flavobacterium ARTE5_101GU230410, uncultured Flavobacterium ARTE5_245
AM279188, uncultured Sphingobacteria bacteriumGU230419, uncultured Flavobacterium ARTE9_115AM279204, uncultured Bacteroidetes bacterium
DQ269109, uncultured Bacteroidetes bacteriumGU230422, uncultured Flavobacterium ARTE9Sed_243GU230429, uncultured Flavobacterium ARTE9Sed_110EF092220, uncultured Sphingobacteriales bacterium
0.10
Sphingobacteria
NS6
NS9
VIS2
VIS3
A
B
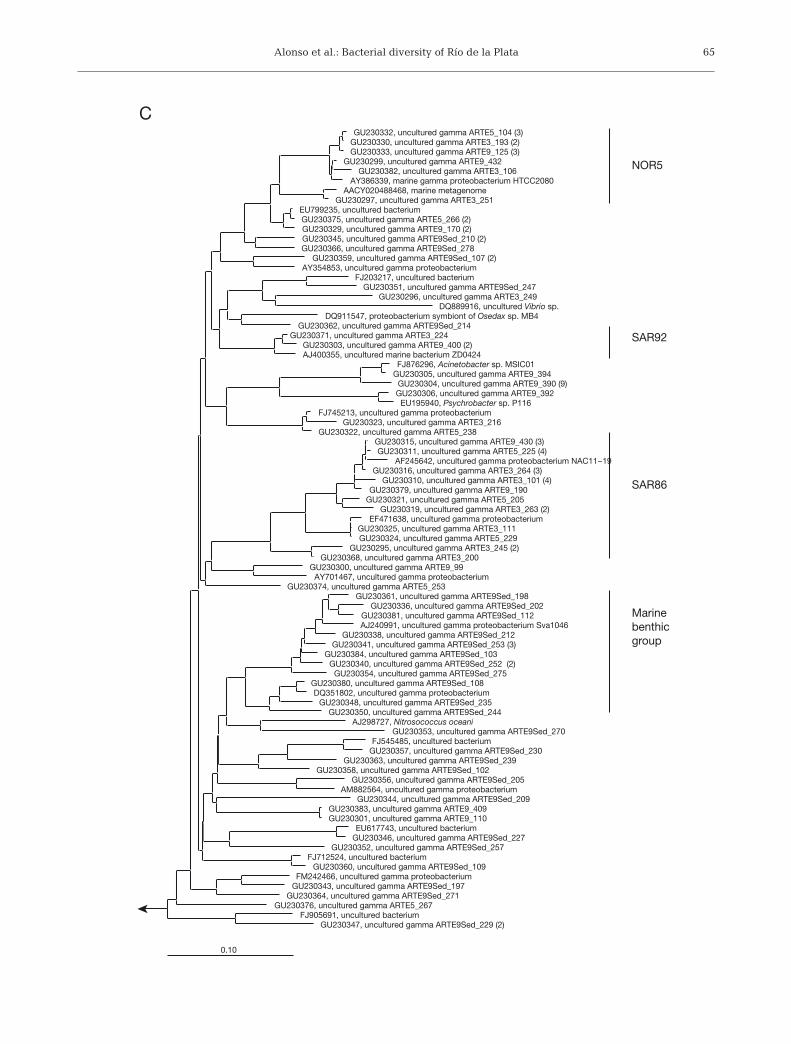
Fig. 5. Phylogenetic relationships of 16S rRNA gene sequences from Río de la Plata bacterioplankton for (A) Alphaproteobacteria,(B) Bacteroidetes, and (C) Gammaproteobacteria. GenBank accession numbers are given for 1 representative per uniquesequence type. Numbers in parenthesis indicate the number of identical sequences retrieved per phylotype. Clones are namedaccording to their origin: riverine (ARTE3), frontal zone (ARTE5), marine water surface (ARTE9), and marine sediment
(ARTE9Sed). Horizontal bar below each tree: 10% of estimated sequence divergence
Alonso et al.: Bacterial diversity of Río de la Plata 65
CGU230332, uncultured gamma ARTE5_104 (3)
GU230330, uncultured gamma ARTE3_193 (2)GU230333, uncultured gamma ARTE9_125 (3)
GU230299, uncultured gamma ARTE9_432GU230382, uncultured gamma ARTE3_106
AY386339, marine gamma proteobacterium HTCC2080AACY020488468, marine metagenome
GU230297, uncultured gamma ARTE3_251EU799235, uncultured bacteriumGU230375, uncultured gamma ARTE5_266 (2)GU230329, uncultured gamma ARTE9_170 (2)GU230345, uncultured gamma ARTE9Sed_210 (2)GU230366, uncultured gamma ARTE9Sed_278
GU230359, uncultured gamma ARTE9Sed_107 (2)AY354853, uncultured gamma proteobacterium
FJ203217, uncultured bacteriumGU230351, uncultured gamma ARTE9Sed_247
GU230296, uncultured gamma ARTE3_249DQ889916, uncultured Vibrio sp.
DQ911547, proteobacterium symbiont of Osedax sp. MB4GU230362, uncultured gamma ARTE9Sed_214
GU230371, uncultured gamma ARTE3_224GU230303, uncultured gamma ARTE9_400 (2)AJ400355, uncultured marine bacterium ZD0424
FJ876296, Acinetobacter sp. MSIC01GU230305, uncultured gamma ARTE9_394
GU230304, uncultured gamma ARTE9_390 (9)GU230306, uncultured gamma ARTE9_392
EU195940, Psychrobacter sp. P116FJ745213, uncultured gamma proteobacterium
GU230323, uncultured gamma ARTE3_216GU230322, uncultured gamma ARTE5_238
GU230315, uncultured gamma ARTE9_430 (3)GU230311, uncultured gamma ARTE5_225 (4)
AF245642, uncultured gamma proteobacterium NAC11−19GU230316, uncultured gamma ARTE3_264 (3)
GU230310, uncultured gamma ARTE3_101 (4)GU230379, uncultured gamma ARTE9_190
GU230321, uncultured gamma ARTE5_205GU230319, uncultured gamma ARTE3_263 (2)
EF471638, uncultured gamma proteobacteriumGU230325, uncultured gamma ARTE3_111GU230324, uncultured gamma ARTE5_229
GU230295, uncultured gamma ARTE3_245 (2)GU230368, uncultured gamma ARTE3_200
GU230300, uncultured gamma ARTE9_99AY701467, uncultured gamma proteobacterium
GU230374, uncultured gamma ARTE5_253GU230361, uncultured gamma ARTE9Sed_198
GU230336, uncultured gamma ARTE9Sed_202GU230381, uncultured gamma ARTE9Sed_112AJ240991, uncultured gamma proteobacterium Sva1046
GU230338, uncultured gamma ARTE9Sed_212GU230341, uncultured gamma ARTE9Sed_253 (3)
GU230384, uncultured gamma ARTE9Sed_103GU230340, uncultured gamma ARTE9Sed_252 (2)
GU230354, uncultured gamma ARTE9Sed_275 GU230380, uncultured gamma ARTE9Sed_108DQ351802, uncultured gamma proteobacterium
GU230348, uncultured gamma ARTE9Sed_235GU230350, uncultured gamma ARTE9Sed_244
AJ298727, Nitrosococcus oceaniGU230353, uncultured gamma ARTE9Sed_270
FJ545485, uncultured bacteriumGU230357, uncultured gamma ARTE9Sed_230
GU230363, uncultured gamma ARTE9Sed_239GU230358, uncultured gamma ARTE9Sed_102
GU230356, uncultured gamma ARTE9Sed_205AM882564, uncultured gamma proteobacterium
GU230344, uncultured gamma ARTE9Sed_209GU230383, uncultured gamma ARTE9_409GU230301, uncultured gamma ARTE9_110
EU617743, uncultured bacteriumGU230346, uncultured gamma ARTE9Sed_227
GU230352, uncultured gamma ARTE9Sed_257FJ712524, uncultured bacterium
GU230360, uncultured gamma ARTE9Sed_109FM242466, uncultured gamma proteobacterium
GU230343, uncultured gamma ARTE9Sed_197GU230364, uncultured gamma ARTE9Sed_271
GU230376, uncultured gamma ARTE5_267FJ905691, uncultured bacterium
GU230347, uncultured gamma ARTE9Sed_229 (2)
0.10
NOR5
SAR92
SAR86
Marinebenthic group
Aquat Microb Ecol 61: 57–72, 2010
The majority of sequences retrieved from all stationswere affiliated to the class Flavobacteria; in addition,members of Sphingobacteria were also identified(Fig. 5B). All Bacteroidetes sequences retrieved werecharacteristic of the different samples; none of themwas shared between libraries. Several of thesequences obtained belonged to clusters previouslydefined with phylotypes recovered from other coastal(North Sea) or open-ocean (mid-Atlantic) sites(Fig. 5B). None of the recovered sequences was tar-geted by any of the specific probes used (POL740,CF6-1267, and VIS1-575).
Gammaproteobacteria were generally the thirdgroup in abundance. On average, they were 19% of allbacterial cells, with the exception of Stn S9 where, de-pending on the depth, they constituted 24 to 47% of allcells (Fig.4).
Hybridizations with the probe SAR86-1245 showedthat members of SAR86 clade constituted on average6% of Gammaproteobacteria (Fig. 4). Other ubiquitousmembers of this class were members of the OM60/NOR5 clade as detected by probe NOR5-730. Theyrepresented on average 26% of Gammaproteobacte-ria, being particularly abundant at Stn S5 at 4 m depth,and at the surface of Stn S6 (Fig. 4).
Sequences targeted by the NOR5-730 and SAR86-1245 probes were retrieved from all libraries. Gamma-proteobacterial sequences accounted for about onethird of all sequences obtained. Most of the sequencesderived from the water column were affiliated toOceanospirillales and Alteromonadales (Fig. 5C).Some of them were shared by all 3 surface-waterlibraries, e.g. the OM60/NOR5-related cluster repre-sented by the phylotypes GU230332, GU230330, andGU230333. Also, sequences related to the SAR86 cladewere shared between all surface-water libraries (e.g.cluster represented by GU230311, GU230315, andGU230316) (Fig. 5C). Yet, sequences from both groupswere recovered exclusively from either the riverfrontal zone or marine libraries (e.g. SAR86-relatedmembers represented by GU230310 recovered fromthe riverine library).
The analysis of the sequences retrieved from theclone library at Stn S9 did not give strong hints aboutthe identity of the main contributors to the dispropor-tionate gammaproteobacterial abundance at this sta-tion. Various gammaproteobacterial sequences relatedto OM60/NOR5, Oceanospirillales, Alteromonadales,and the genera Acinetobacter and Psychrobacter wereexclusively found in the surface water of marine Stn S9(Fig. 5C). However, hybridizations with availableprobes targeting several groups of marine Gammapro-teobacteria (some of them previously reported tobloom in marine or coastal lagoon samples: Acine-tobacter spp., Alteromonas spp., Pseudoalteromonas
spp., Oceanospirillum spp., Stenotrophomonas mal-tophilia, and Vibrio spp.) did not yield any positiveresult (data not shown).
Gammaproteobacterial sequences found in the sedi-ment of Stn S9 were very diverse and always closelyrelated to sequences retrieved from sediment samplesfrom a variety of systems (e.g. Wadden Sea, YellowSea, mid-Atlantic ridge) (Fig. 5C). Several of themwere affiliated to the marine benthic group, whilenone of them was shared with the water column(Fig. 5C).
Betaproteobacteria were minor components of thecommunity (<5% of all bacteria), except for the sur-face-water samples at the stations with lower salinity,where they accounted for 16 and 14% at Stns S3 andS4, respectively (Fig. 4). Only 1 betaproteobacterialsequence was retrieved, in the clone library from thefrontal zone, which affiliated with the genus Methy-lophilus (data not shown).
Actinobacteria were highly abundant at low-salinitysites (up to >20% of all bacteria in the surface water ofStn S3) and showed a very sharp decrease towardsmarine stations, where they represented around 1% ofall bacteria (Fig. 4).
Only a few actinobacterial sequences were retrievedfrom the water samples of the riverine and frontalzone stations and from the marine sediment samples.Most of these sequences affiliated with unculturedAcidimicrobiaceae and Microbacteriaceae previouslyfound in estuarine and marine habitats (Fig. S1A inthe supplement at www.int-res.com/articles/suppl/a061p057_supp.pdf). The phylotypes retrieved fromthe sediment and the water column formed clearly sep-arated clusters (Fig. S1A). Within the water columnsamples, 2 groups of sequences were identified, onecontaining phylotypes derived from the riverinesample, and a second one that included sequencesfrom the riverine and from the frontal zone samples(Fig. S1A).
Planctomycetes were more abundant (up to 6%) atthe marine stations (Fig. 4). In the clone libraries, theywere represented by only 3 sequences retrieved fromthe marine sediment sample; they were closely relatedto sequences from uncultured Planctomycetes ob-tained from marine sediments or soil (data not shown).
In marked contrast with the marine water sam-ples, the marine sediment was characterized by thevirtual absence of Alphaproteobacteria and thedominant retrieval of gammaproteobacterial anddeltaproteobacterial sequences (Fig. 5C; Fig. S1B).Deltaproteobacterial sequences obtained from themarine sediment were affiliated to Desulfobul-baceae and Desulfobacteraceae, and to Halian-giaceae. They were related to uncultured cladespreviously found in aquatic sediments (Fig. S1B).
66
Alonso et al.: Bacterial diversity of Río de la Plata
Sequences affiliated to Acidobacteria were exclu-sively recovered from the marine sediment sample(Fig. S1C). All of them were closely related tosequences from uncultured organisms recoveredfrom marine sediments (Fig. S1C).
DISCUSSION
Our methodological approach allowed for therecovery of complementary information on the bacte-rial diversity in the gradient Río de la Plata-SouthAtlantic Ocean. ARISA yielded an overview of thebacterial diversity at the different sites, guiding theconstruction of clone libraries. These clone libraries,together with the FISH evaluation, gave hints on theidentity and abundance of the individual groupsresponsible for the global pattern of bacterial di-versity in this environment. Altogether, the 3 tech-niques provided a multilevel view on bacterial biodi-versity ranging from phyla (FISH) to species (ARISA,sequencing).
Water and sediment host separate bacterialcommunities
The degree of similarity between the sediment sam-ples and the water samples taken at the same stationswere very low for all 3 habitats, as indicated by theBray-Curtis similarity index (Fig. 3B). This pattern, ini-tially derived from the ARISA results, was further con-firmed by comparing the sequences retrieved at themarine Stn S9 from the surface waterand the sediment (Fig. 5; Fig. S1). Alto-gether, our findings suggest thatdespite the shallowness of this system,there is a marked niche specializationof the bacterial groups inhabiting thesediment and the water column, inagreement with an earlier cross-sys-tems analysis (Lozupone & Knight2007). However, it should be taken intoaccount that the water samples in thepresent study were pre-filteredthrough a 10 µm filter previous to DNAextraction, thus the microbial compo-nents attached to larger particles werenot considered. A specific analysis ofthe particle-attached bacteria couldpotentially yield a different result withrespect to the diversity sharingbetween sediment and water. Thiscould be especially expected in theriverine shallower areas, where a rela-
tive similarity of the water samples and the sedimentswas found (Fig. 3B).
Environmental structuring of bacterioplanktoncommunities
The bacterial community appeared strongly struc-tured by the habitat characteristics on all levels ofdiversity targeted in the present study. More specifi-cally, the statistical analysis revealed that the BCC inthe water column was strongly related to environmen-tal characteristics (Table 1). The geographical factorsappeared significant only for ARISA results, indicatingthat the influence of geography over diversity could beevidenced only at the lower phylogenetic levels (spe-cies/strains) (Table 1). Among the environmental para-meters, salinity and temperature were the main com-ponents explaining the general observed patterns inthe bacterial diversity for both ARISA and CARD-FISHresults (Table 1), in agreement with the pioneer workfrom Glöckner et al. (1999), and more recent meta-analysis of 16S sequences (Lozupone & Knight 2007,Barberán & Casamayor 2010).
Factors influencing bacterial groups abundance
Actinobacteria and Betaproteobacteria followed asimilar pattern in abundance (Fig. 4; Fig. S2 at www.int-res.com/articles/suppl/a061p057_supp.pdf), sug-gesting that these groups are affected by similar envi-ronmental factors. Their highest numbers were found
67
Factors ARISA CARD-FISHF-ratio p F-ratio p
ENV + Space 2D 3.93 0.020* 4.40 0.004**ENV + Space 3D 3.31 0.008** 4.83 0.005**ENV 3.77 0.002** 7.97 0.001***Space 3D 1.84 0.041* 2.87 0.030*Space 2D 2.33 0.020* 3.56 0.012*ENV removing space 3D 3.14 0.020* 4.09 0.012*ENV removing space 2D 3.55 0.001*** 3.24 0.014*Space 3D removing ENV 1.88 0.078 (ns) 1.58 0.178 (ns)Space 2D removing ENV 2.36 0.020* 1.41 0.289 (ns)
Table 1. Effects of environment (ENV: salinity and temperature) and space (2D:longitude and latitude, or 3D: longitude, latitude, and water depth) on bacterialcommunity structure and abundance. Redundancy analysis was applied toHellinger-transformed automated ribosomal intergenic spacer analysis (ARISA)community data or to catalyzed reporter deposition-fluorescence in situhybridization (CARD-FISH)-based bacterial abundance under simple con-strained models or partial models (i.e. by removing the effects of certain factorswhose effects have to be accounted for). Significance was assessed using1000 permutations of the model residuals at p < 0.05. *p ≤ 0.05, **p ≤ 0.01,
***p ≤ 0.001, ns = not significant (p > 0.05)
Aquat Microb Ecol 61: 57–72, 2010
in samples with lower salinity and higher nutrients val-ues (Fig. 4), and both groups were clearly negativelyinfluenced by increasing salinity (Fig. S2). Actinobac-teria and Betaproteobacteria have been shown to dis-play their highest abundances in a variety of freshwa-ter environments (Glöckner et al. 1999, Hahn et al.2005, Warnecke et al. 2005, Alonso et al. 2009), or inthe freshwater parts of transitional environments, likeestuaries (Bouvier & del Giorgio 2002, Kirchman et al.2005, Zhang et al. 2006), and coastal lagoons (Piccini etal. 2006). Although there are indications that salinitymight not be the sole factor explaining their distribu-tion in estuaries (Kirchman et al. 2005), in the presentstudy none of the other factors analyzed was signifi-cantly related to their abundance.
The numbers of Gammaproteobacteria appearednegatively correlated to temperature (Fig. S2 in thesupplement). As temperature is an indicator of dif-ferent water masses, we speculate that the observedrelationship was an indirect one, actually due to othernot yet identified environmental factors. Strikingly,gammaproteobacterial abundance exhibited a pro-nounced peak at Stn S9, dominating the bacterial com-munity at the water surface (Fig. 4). Previous studiesalso reported local peaks in gammaproteobacterialabundance in estuarine environments (Bouvier & delGiorgio 2002, Cottrell & Kirchman 2003, Zhang et al.2006). Such high abundances of Gammaproteobacte-ria, as found in our marine Stn S9, have been previ-ously reported for coastal environments like theMediterranean Sea (Alonso-Sáez et al. 2007) and theLagoon of Venice (Simonato et al. 2010), and also in theNorth Atlantic ocean (Schattenhofer et al. 2009). Bou-vier & del Giorgio (2002) associated local spikes ofgammaproteobacterial abundances at the Choptankestuary to point sources of nutrients probably derivedfrom wastewater treatment facilities. In the presentstudy, this peak in gammaproteobacterial abundancecoincided with a pronounced peak in ammonium con-centration (Fig. 2D). This co-occurrence might indicatea high gammaproteobacterial proteolytic activity dur-ing our sampling time at Stn S9 (Woebken et al. 2007).
Certain bacterial groups were particularly abundantat the center of the frontal zone (Stn S5) characterizedby peaks in organic matter and chl a, and generalavailability of nutrients, indicating that these taxawould be particularly favored by intermediate salinityand high productivity. These groups included notablymembers of the flavobacterial groups targeted by theprobes POL740, CF6-1267, and VIS1-575, and also thealphaproteobacterial cells targeted by the probeROS537 (Fig. 4).
Especially high abundances of Bacteroidetes at theturbidity maximum of estuarine systems have beenpreviously reported (Bouvier & del Giorgio 2002) and
increased cell numbers and sequence retrieval ofFlavobacteria have been related to high values of chl aand nutrients (Abell & Bowman 2005b, Pommier et al.2007). Moreover, members of this group have beenrepeatedly reported as prone to particle attachment(DeLong et al. 1993, Crump et al. 1999), and as primarycolonizers of marine phytoplankton detritus (Pinhassiet al. 2004, Abell & Bowman 2005a). In addition, theyhave been frequently found in association to naturaland induced phytoplankton blooms (Simon et al. 1999,Riemann et al. 2000, O’Sullivan et al. 2004, Fandino etal. 2005, Grossart et al. 2005). In particular, members ofthe 3 flavobacterial groups targeted in the presentstudy (Polaribacter spp., DE2 cluster, VIS1 cluster)have been previously observed to be especially abun-dant in the phycosphere of marine phytoplankton(Gomez-Pereira et al. 2010). Our findings thus providefurther support for a potential link between theseflavobacterial groups and phytoplankton cells.
The other particularly abundant population in thefrontal zone, the Roseobacter cells, have been fre-quently found in marine coastal and open waters(Moran et al. 2003, Pinhassi & Berman 2003, Alonso &Pernthaler 2006). A number of studies have also founda positive correlation between Roseobacter abundancewith either chl a (González et al. 2000) or nutrient con-centrations (Brown et al. 2005), and similar conclusionshave been achieved based on the seasonal abundanceof this group in the Mediterranean Sea (Alonso-Sáez etal. 2007). Our findings provide further support of a pos-sible preference of Roseobacter for environmental set-tings leading to high primary production.
Members of the SAR11 clade constituted the largemajority of Alphaproteobacteria cells, and were highlyabundant at all stations, dominating the bacterial com-munity throughout the Río de la Plata estuary (Fig. 4).Typically, this bacterial group has been identified inseveral marine coastal and open-ocean waters, whereit frequently contributes to a high extent to the totalbacterial abundance (Morris et al. 2002, Alonso &Pernthaler 2006, Vila-Costa et al. 2007). Furthermore,high numbers of SAR11 cells have also been reportedin estuaries (Hewson & Fuhrman 2004, Kirchman et al.2005). In the present study, the only factor apparentlyinfluencing the abundance of SAR11 cells was the geo-graphical distance between samples (Fig. S2).
Geographic influence on bacterial diversity patterns
As previously mentioned (see ‘Environmental struc-turing of bacterioplankton communities’), geographydid have an influence on bacterial diversity at the levelof species/strains (Table 1). Moreover, the analysis of16S rRNA gene sequences revealed the existence of
68
Alonso et al.: Bacterial diversity of Río de la Plata
single sequences, or sequence clusters of 99% identitywithin several bacterial groups (i.e. Flavobacteria,Actinobacteria, SAR11, NOR5, SAR86) which wereexclusively recovered from one of the different regionsof the gradient. These results, though exciting, are notsurprising, as our sampling scale (~150 km) is withinthe frame identified by Martiny et al. (2006) as suitablefor detecting both environmental and geographicalinfluence on microbial diversity. Certainly, these find-ings deserve a specific experimental approach to cor-roborate or discard a potential geographically baseddifferentiation among the bacterial inhabitants of thissystem.
Which portion of the gradient is more diverse?
Diversity patterns derived from ARISA data showedthe highest richness and number of unique OTUs atthe frontal zone, indicating that this region may con-tain the highest diversity in this system (Fig. 3A). Therelatively high number of unique OTUs in the frontalzone subset suggests the existence of a particular bac-terial assemblage in this area. In addition, most of theOTUs retrieved from this zone were in fact common tothe riverine and/or marine stations, suggesting that asubstantial portion of the riverine and marine microor-ganisms would be able to thrive in the frontal zone aswell. Alternatively, this finding could also result from amere mixing of the bacterial assemblages, withoutimplying a real ability of the corresponding bacteria tolive and grow at the frontal zone. Thus, activity mea-surements linked to bacterial identification are neededto clarify the extent to which the riverine and marinemicrobial populations are active and growing at themixing front.
Previous studies in comparable systems have alsofound that the communities of the transitional regionsof the gradient often include members of the extremes,besides a characteristic brackish assemblage (Selje &Simon 2003, Crump et al. 2004, Riemann et al. 2008).However, there is currently no agreement on whetherthe bacterial communities at the transitional portions ofthese gradients are more or less diverse than theirpurely freshwater and marine counterparts. Contradic-tory conclusions have been obtained (Hollibaugh et al.2000, Troussellier et al. 2002, Hewson & Fuhrman2004), even for the same system in different seasons(Crump et al. 2004). Though the stability of any patternfound for a given system certainly needs to be con-firmed with several sampling campaigns, our datastrongly support the idea that the highest bacterialdiversities are found at the frontal zone of estuaries.
The different areas of the estuary also differed in thenumber of total bacterial cells (Fig. 4). Decline in the
bacterial abundance from the riverine towards themarine portions have been repeatedly observed forsimilar environments (Troussellier et al. 2002, Kirch-man et al. 2003, Zhang et al. 2006). Interestingly, thehighest bacterial abundance in our system was foundin the frontal zone, in co-occurrence with the highestconcentrations of organic matter and chl a, suggestingthat this portion of the gradient would not only be themost diverse, but also the most productive from thebacterial point of view. Further work is needed to eval-uate this hypothesis, and to establish the contributionof the different bacterial groups here identified in thegeneration of microbial biomass in this system.
Acknowledgements. We thank P. Castro and A. Segura forassistance during the sampling campaign. G. Pérez isacknowledged for valuable help during nutrient analysis. Thecrew and accompanying scientific staff from RV ‘Aldebaran’are acknowledged for providing an excellent working atmos-phere. The authors also thank 3 anonymous reviewers, whoseinsightful comments led to a substantial improvement of aprevious version of this manuscript. B. de Valizas is alsoacknowledged for providing an inspiring atmosphere for thefinal synthesis of this work. This study was funded by the MaxPlanck Society; the sampling campaign was supported byDINARA.
LITERATURE CITED
Abell GCJ, Bowman JP (2005a) Colonization and communitydynamics of class Flavobacteria on diatom detritus inexperimental mesocosms based on Southern Ocean sea-water. FEMS Microbiol Ecol 53:379–391
Abell GCJ, Bowman JP (2005b) Ecological and biogeographicrelationships of class Flavobacteria in the SouthernOcean. FEMS Microbiol Ecol 51:265–277
Acha EM, Mianzan H, Guerrero R, Carreto J, Giberto D,Montoya N, Carignan M (2008) An overview of physicaland ecological processes in the Rio de la Plata Estuary.Cont Shelf Res 28:1579–1588
Alonso C, Pernthaler J (2006) Roseobacter and SAR11 domi-nate microbial glucose uptake in coastal North Sea waters.Environ Microbiol 8:2022–2030
Alonso C, Zeder M, Piccini C, Conde D, Pernthaler J (2009)Ecophysiological differences of betaproteobacterial popu-lations in two hydrochemically distinct compartments of asubtropical lagoon. Environ Microbiol 11:867–876
Alonso-Saez L, Gasol JM (2007) Seasonal variations in thecontributions of different bacterial groups to the uptake oflow-molecular-weight compounds in northwestern Medi-terranean coastal waters. Appl Environ Microbiol 73:3528–3535
Alonso-Sáez L, Balagué V, Sà EL, Sánchez O and others(2007) Seasonality in bacterial diversity in north-westMediterranean coastal waters: assessment through clonelibraries, fingerprinting and FISH. FEMS Microbiol Ecol60:98–112
Anton J, Rossello-Mora R, Rodriguez-Valera F, Amann R(2000) Extremely halophilic bacteria in crystallizer pondsfrom solar salterns. Appl Environ Microbiol 66:3052–3057
Ashelford KE, Chuzhanova NA, Fry JC, Jones AJ, WeightmanAJ (2006) New screening software shows that most recent
69
Aquat Microb Ecol 61: 57–72, 2010
large 16S rRNA gene clone libraries contain chimeras.Appl Environ Microbiol 72:5734–5741
Barberán A, Casamayor EO (2010) Global phylogenetic com-munity structure and β-diversity patterns in surface bacte-rioplankton metacommunities. Aquat Microb Ecol 59:1–10
Bianchi AA, Bianucci L, Piola AR, Ruiz Pino D, Schloss I, Pois-son A, Balestrini CF (2005) Vertical stratification and air-sea CO2 fluxes in the Patagonian shelf. J Geophys Res110:C07003 doi: 10.1029/2004JC002488
Bisbal GA (1995) The Southeast South American shelf largemarine ecosystem: evolution and components. Mar Policy19:21–38
Boltovskoy D, Gibbons MJ, Hutchings L, Biinet D (1990) Gen-eral biological features of South Atlantic. In: Boltovskoy D(ed) Zooplankton. Backhyus Publishers, Leiden, p 1–42
Bouvier TC, del Giorgio PA (2002) Compositional changesin free-living bacterial communities along a salinity gradi-ent in two temperate estuaries. Limnol Oceanogr 47:453–470
Brown MV, Schwalbach MS, Hewson I, Fuhrman JA (2005)Coupling 16S-ITS rDNA clone libraries and automatedribosomal intergenic spacer analysis to show marinemicrobial diversity: development and application to a timeseries. Environ Microbiol 7:1466–1479
Calliari D, Brugnoli E, Ferrari G, Vizziano D (2009) Phyto-plankton distribution and production along a wide envi-ronmental gradient in the South-West Atlantic offUruguay. Hydrobiologia 620:47–61
Cardinale M, Brusetti L, Quatrini P, Borin S and others (2004)Comparison of different primer sets for use in automatedribosomal intergenic spacer analysis of complex bacterialcommunities. Appl Environ Microbiol 70:6147–6156
Carreto JI, Montoya NG, Benavides HR, Guerrero R, Carig-nan MO (2003) Characterization of spring phytoplanktoncommunities in the Río de La Plata maritime front usingpigment signatures and cell microscopy. Mar Biol 143:1013–1027
Clarke KR, Gorley RN (2006) PRIMER v6: user manual/tutor-ial. PRIMER-E, Plymouth
Clarke KR, Somerfield PJ, Gorley RN (2008) Testing of nullhypotheses in exploratory community analyses: similarityprofiles and biota-environment linkage. J Exp Mar BiolEcol 366:56–69
Cottrell MT, Kirchman DL (2003) Contribution of major bacte-rial groups to bacterial biomass production (thymidine andleucine incorporation) in the Delaware estuary. LimnolOceanogr 48:168–178
Crump BC, Armbrust EV, Baross JA (1999) Phylogeneticanalysis of particle-attached and free-living bacterial com-munities in the Columbia River, its estuary, and the adja-cent coastal ocean. Appl Environ Microbiol 65:3192–3204
Crump BC, Hopkinson CS, Sogin ML, Hobbie JE (2004)Microbial biogeography along an estuarine salinity gradi-ent: combined influences of bacterial growth and resi-dence time. Appl Environ Microbiol 70:1494–1505
Daims H, Bruhl A, Amann R, Schleifer KH, Wagner M (1999)The domain-specific probe EUB338 is insufficient for thedetection of all Bacteria: development and evaluation of amore comprehensive probe set. Syst Appl Microbiol 22:434–444
DeLong EF, Franks DG, Alldredge AL (1993) Phylogeneticdiversity of aggregate-attached vs. free-living marine bac-terial assemblages. Limnol Oceanogr 38:924–934
Eaton AD, Clesceri LS, Rice EW, Greenberg AE, FransonMAH (eds) (2005) Standard methods for the examinationof water and wastewater: centennial edition. AmericanPublic Health Association, Washington, DC
Eilers H, Pernthaler J, Glöckner FO, Amann R (2000) Cultur-ability and in situ abundance of pelagic bacteria from theNorth Sea. Appl Environ Microbiol 66:3044–3051
Eilers H, Pernthaler J, Peplies J, Glöckner FO, Gerdts G,Amann R (2001) Isolation of novel pelagic bacteria fromthe German Bight and their seasonal contribution to sur-face picoplankton. Appl Environ Microbiol 67:5134–5142
Fandino LB, Riemann L, Steward GF, Azam F (2005) Popula-tion dynamics of Cytophaga-Flavobacteria during marinephytoplankton blooms analyzed by real-time quantitativePCR. Aquat Microb Ecol 40:251–257
Feely RA, Sabine CL, Takahashi T, Wanninkhof R (2001)Uptake and storage of carbon dioxide in the ocean: theglobal CO2 survey. Oceanography (Wash DC) 14:18–32
Framiñan MB, Brown OB (1996) Study of the Río de la Plataturbidity front, Part I: spatial and temporal distribution.Cont Shelf Res 16:1259–1282
Frank JA, Reich CI, Sharma S, Weisbaum JS, Wilson BA,Olsen GJ (2008) Critical evaluation of two primers com-monly used for amplification of bacterial 16S rRNA genes.Appl Environ Microbiol 74:2461–2470
Glöckner FO, Fuchs BM, Amann R (1999) Bacterioplanktoncompositions of lakes and oceans: a first comparison basedon fluorescence in situ hybridization. Appl Environ Micro-biol 65:3721–3726
Gomez-Pereira PR, Fuchs BM, Alonso C, Oliver M, vanBeusekom J, Amann R (2010) Distinct flavobacterial com-munities in contrasting water masses of the North AtlanticOcean. ISME J 4:472–487
González JM, Simo R, Massana R, Covert JS, Casamayor EO,Pedros-Alio C, Moran MA (2000) Bacterial communitystructure associated with a dimethylsulfoniopropionate-producing North Atlantic algal bloom. Appl EnvironMicrobiol 66:4237–4246
Grossart HP, Levold F, Allgaier M, Simon M, Brinkhoff T(2005) Marine diatom species harbour distinct bacterialcommunities. Environ Microbiol 7:860–873
Guerrero RA, Acha EM, Framiñan MB, Lasta CA (1997) Phys-ical oceanography of the Río de la Plata estuary,Argentina. Cont Shelf Res 17:727–742
Hahn MW, Pöckl M, Wu QL (2005) Low intraspecific diversityin a Polynucleobacter subcluster population numericallydominating bacterioplankton of a freshwater pond. ApplEnviron Microbiol 71:4539–4547
Hewson I, Fuhrman JA (2004) Richness and diversity of bacte-rioplankton species along an estuarine gradient in MoretonBay, Australia. Appl Environ Microbiol 70: 3425–3433
Hollibaugh JT, Wong PS, Murrell MC (2000) Similarity of par-ticle-associated and free-living bacterial communities innorthern San Francisco Bay, California. Aquat MicrobEcol 21:103–114
Jeffrey SW, Humphrey GF (1975) New spectrophotometricequations for determining chlorophylls a, b, c1 and c2 inhigher plants, algae and natural phytoplankton. BiochemPhysiol Pflanz 167:191–194
Kirchman DL, Yu LY, Cottrell MT (2003) Diversity and abun-dance of uncultured Cytophaga-like bacteria in theDelaware Estuary. Appl Environ Microbiol 69:6587–6596
Kirchman DL, Dittel AI, Malmstrom RR, Cottrell MT (2005)Biogeography of major bacterial groups in the Delawareestuary. Limnol Oceanogr 50:1697–1706
Koroleff F (1976) Determination of ammonia. In: GrasshoftK (ed) Methods of seawater analysis. Verlag Chemie, NewYork, NY p 126–133
Legendre P, Gallagher ED (2001) Ecologically meaningfultransformations for ordination of species data. Oecologia129:271–280
70
Alonso et al.: Bacterial diversity of Río de la Plata
Legendre P, Legendre L (1998) Numerical ecology, 2nd Eng-lish edn. Elsevier Science, Amsterdam
Lorenzen CJ (1967) Determination of chlorophyll andpheopigments: spectrophotometric equations. LimnolOceanogr 12:343–346
Lozupone CA, Knight R (2007) Global patterns in bacterialdiversity. Proc Natl Acad Sci USA 104:11436–11440
Ludwig W, Strunk O, Westram R, Richter L and others (2004)ARB: a software environment for sequence data. NucleicAcids Res 32:1363–1371
Malmstrom RR, Straza TRA, Cottrell MT, Kirchman DL (2007)Diversity, abundance, and biomass production of bacterialgroups in the western Arctic Ocean. Aquat Microb Ecol47:45–55
Manz W, Amann R, Ludwig W, Wagner M, Schleifer KH(1992) Phylogenetic oligodeoxynucleotide probes for themajor subclasses of Proteobacteria: problems and solu-tions. Syst Appl Microbiol 15:593–600
Manz W, Amann R, Ludwig W, Vancanneyt M, Schleifer KH(1996) Application of a suite of 16S rRNA-specific oligonu-cleotide probes designed to investigate bacteria of thephylum Cytophaga-Flavobacter-Bacteroides in the nat-ural environment. Microbiology 142:1097–1106
Martinez CM, Retta S (2001) Caracterizacion de las areas decria de la corvina (Micropogonias furnieri) en la zonacostera uruguaya. In: Vizziano D, Puig P, Mesones C,Nagy G (eds) El Rio de la Plata. Investigacion para la ges-tion del Ambiente, los recursos pesqueros y la pesqueriaen el frente salino. Programa Ecoplata, Montevideo, p141–148
Martiny JBH, Bohannan BJM, Brown JH, Colwell RK and oth-ers (2006) Microbial biogeography: putting microorgan-isms on the map. Nat Rev Microbiol 4:102–112
Moran MA, González JM, Kiene RP (2003) Linking a bacterialtaxon to sulfur cycling in the sea: studies of the marineRoseobacter group. Geomicrobiol J 20:375–388
Morris RM, Rappe MS, Connon SA, Vergin KL, Siebold WA,Carlson CA, Giovannoni SJ (2002) SAR11 clade dominatesocean surface bacterioplankton communities. Nature 420:806–810
Murphy J, Riley JP (1962) A modified single solution methodfor the determination of phosphate in natural waters. AnalChim Acta 27:31–36
Murray AE, Hollibaugh JT, Orrego C (1996) Phylogeneticcompositions of bacterioplankton from two Californiaestuaries compared by denaturing gradient gel elec-trophoresis of 16S rDNA fragments. Appl Environ Micro-biol 62:2676–2680
Muyzer G, Teske A, Wirsen CO, Jannasch HW (1995) Phylo-genetic relationship of Thiomicrospira species and theiridentification in deep-sea hydrothermal vent samples bydenaturing gradient gel electrophoresis of 16S rDNA frag-ments. Arch Microbiol 164:165–172
Nagy G, Gómez M, López C, Perdomo A (2002) Distributionpatterns of nutrients and symptoms of eutrophication inthe Río de la Plata Estuary System. Hydrobiologia 475–476:125–139
Neef A (1997) Anwendung der in situ-Einzelzell-Identi-fizierung von Bakterien zur Populationsanalyse in kom-plexen mikrobiellen Biozönosen. PhD thesis, TechnicalUniversity Munich
Neef A, Amann R, Schlesner H, Schleifer KH (1998) Monitor-ing a widespread bacterial group: in situ detection ofplanctomycetes with 16S rRNA-targeted probes. Micro-biology 144:3257–3266
O’Sullivan LA, Fuller KE, Thomas EM, Turley CM, Fry JC,Weightman AJ (2004) Distribution and culturability of the
uncultivated ‘AGG58 cluster’ of Bacteroidetes phylum inaquatic environments. FEMS Microbiol Ecol 47:359–370
Pernthaler A, Pernthaler J, Amann R (2002) Fluorescence insitu hybridization and catalyzed reporter deposition forthe identification of marine bacteria. Appl Environ Micro-biol 68:3094–3101
Piccini C, Conde D, Alonso C, Sommaruga R, Pernthaler J(2006) Blooms of single bacterial species in a coastallagoon of the Southwestern Atlantic Ocean. Appl EnvironMicrobiol 72:6560–6568
Pinhassi J, Berman T (2003) Differential growth response ofcolony-forming alpha- and gamma-proteobacteria in dilu-tion culture and nutrient addition experiments from LakeKinneret (Israel), the eastern Mediterranean Sea, and theGulf of Eilat. Appl Environ Microbiol 69:199–211
Pinhassi J, Sala MM, Havskum H, Peters F, Guadayol O, Mal-its A, Marrase CL (2004) Changes in bacterioplanktoncomposition under different phytoplankton regimens.Appl Environ Microbiol 70:6753–6766
Pommier T, Canbäck B, Riemann L, Boström KH, Simu K,Lundberg P, Tunlid A, Hagström Å (2007) Global patternsof diversity and community structure in marine bacterio-plankton. Mol Ecol 16:867–880
Pruesse E, Quast C, Knittel K, Fuchs BM, Ludwig W, PepliesJ, Glockner FO (2007) SILVA: a comprehensive onlineresource for quality checked and aligned ribosomal RNAsequence data compatible with ARB. Nucleic Acids Res35:7188–7196
Ramette A (2007) Multivariate analyses in microbial ecology.FEMS Microbiol Ecol 62:142–160
Ramette A (2009) Quantitative community fingerprintingmethods for estimating the abundance of operational tax-onomic units in natural microbial communities. Appl Env-iron Microbiol 75:2495–2505
Riemann L, Steward GF, Azam F (2000) Dynamics of bacterialcommunity composition and activity during a mesocosmdiatom bloom. Appl Environ Microbiol 66:578–587
Riemann L, Leitet C, Pommier T, Simu K, Holmfeldt K, Lars-son U, Hagstrom A (2008) The native bacterioplanktoncommunity in the central Baltic Sea is influenced by fresh-water bacterial species. Appl Environ Microbiol 74:503–515
Roller C, Wagner M, Amann R, Ludwig W, Schleifer KH(1994) In situ probing of Gram-positive bacteria with highDNA G+C content using 23S rRNA-targeted oligonu-cleotides. Microbiology 140:2849–2858
Schattenhofer M, Fuchs BM, Amann R, Zubkov MV, TarranGA, Pernthaler J (2009) Latitudinal distribution ofprokaryotic picoplankton populations in the AtlanticOcean. Environ Microbiol 11:2078–2093
Selje N, Simon M (2003) Composition and dynamics of parti-cle-associated and free-living bacterial communities inthe Weser estuary, Germany. Aquat Microb Ecol 30:221–237
Simek K, Pernthaler J, Weinbauer M, Hornak K and others(2001) Changes in bacterial community composition,dynamics and viral mortality rates associated withenhanced flagellate grazing in a mesoeutrophic reservoir.Appl Environ Microbiol 67:2723–2733
Simon M, Glöckner FO, Amann R (1999) Different communitystructure and temperature optima of heterotrophicpicoplankton in various regions of the Southern Ocean.Aquat Microb Ecol 18:275–284
Simonato F, Gómez-Pereira PR, Fuchs BM, Amann R (2010)Bacterioplankton diversity and community composition inthe Southern Lagoon of Venice. Syst Appl Microbiol 33:128–138
71
Aquat Microb Ecol 61: 57–72, 2010
Stamatakis A (2006) RAxML-VI-HPC: maximum likelihood-based phylogenetic analyses with thousands of taxa andmixed models. Bioinformatics 22:2688–2690
Strickland JDH, Parsons TR (1972) A practical handbook ofsea water analysis. Fish Res Board Can Bull 167:207–211
Troussellier M, Schafer H, Batailler N, Bernard L and others(2002) Bacterial activity and genetic richness along anestuarine gradient (Rhone River plume, France). AquatMicrob Ecol 28:13–24
Valderrama JC (1981) The simultaneous analysis of totalnitrogen and total phosphorus in natural waters. MarChem 10:109–122
Vila-Costa M, Pinhassi J, Alonso C, Pernthaler J, Simo R (2007)An annual cycle of dimethylsulfoniopropionate-sulfur andleucine assimilating bacterioplankton in the coastal NWMediterranean. Environ Microbiol 9: 2451–2463
Warnecke F, Sommaruga R, Hofer JS, Pernthaler J (2005)Abundances, identity and growth state of Actinobacteria
in mountain lakes of different transparency. Appl EnvironMicrobiol 71:5551–5559
Watanabe K, Watanabe K, Kodama Y, Syutsubo K, HarayamaS (2000) Molecular characterization of bacterial popula-tions in petroleum-contaminated groundwater dischargedfrom underground crude oil storage cavities. Appl EnvironMicrobiol 66:4803–4809
Woebken D, Fuchs BM, Kuypers MMM, Amann R (2007)Potential interactions of particle-associated anammox bac-teria with bacterial and archaeal partners in the Namibianupwelling system. Appl Environ Microbiol 73:4648–4657
Zhang Y, Jiao N, Cottrell MT, Kirchman DL (2006) Contribu-tion of major bacterial groups to bacterial biomass produc-tion along a salinity gradient in the South China Sea.Aquat Microb Ecol 43:233–241
Zhou J, Bruns MA, Tiedje JM (1996) DNA recovery from soilsof diverse composition. Appl Environ Microbiol 62:316–322
72
Editorial responsibility: Jed Fuhrman,Los Angeles, California, USA
Submitted: November 30, 2009; Accepted: July 12, 2010Proofs received from author(s): August 26, 2010