Embed Size (px)
Citation preview
MULTILEVEL ANALYSIS OF DELAMINATION
INITIATED NEAR THE EDGES OF COMPOSITE
STRUCTURES
N. Carrere
1, T. Vandellos
1, E. Martin
2
1ONERA, 29 av. de la Division Leclerc, 92320 Châtillon, France
2LCTS, 3 Allée de la Boétie, Domaine Universitaire, 33600 Pessac, France
[email protected], [email protected], [email protected]
SUMMARY
The present study is aimed at developing a method to describe delamination initiated
near the edges on composite structures. In this study, two aspects are under
investigation : (i) the modeling of the singular stress fields near the edges and (ii) two
complementary methods to predict the onset of delamination.
Keywords: edge effects, cohesive zone models, fracture mechanics, delamination,
multilevel strategy
INTRODUCTION
Due to their high mechanical properties, composite materials are more and more
employed in many aerospace applications. However, the present simulation tools used
during design and conception of new structures do not take into account the complexity
of damage/rupture mechanisms and the multiscale nature of composites. Moreover,
some key problems remain very sensitive. The first one concerns the prediction of the
strength of high stress gradient parts of the structures. The second one concerns the
modeling of delamination which could not be, contrary to in-ply damage, described by a
continuous damage model. Obviously, these two problems arise in laminate composites
due to a mismatch in elastic properties between plies. In such a case, singular
interlaminar stresses are indeed created leading to interply debonding. The aim of this
paper is to propose a robust methodology to analyze the delamination (onset threshold
and if necessary propagation) initiated near the edges and the possible interaction with
damage inside the plies. This paper is devided in x sections. The first one is devoted to
the strategy developed to predict the delamination initiation near the edges. In this
section, the FE method to calculate the singular stress field near the edges is presented.
Two complementary approaches are developed to predict the onset of delamination. The
second section is devoted to the identification and the comparison with experimental
results. Finally, the last section is devoted to discussion and conclusion.
STRATEGY FOR THE PREDICTION OF DELAMINATION INITIATED
NEAR THE EDGES
Calculation of singular stress field near edges
Due to elastic mismatch between the plies, stress field near the edges are singular.
Various approaches have been proposed in the literature in order to investigate the stress
field near the edges of a composite laminate based on linear assumptions [ 1]. However,
the aim of this paper is to propose a methodology that could be applied to predict the
onset of inter-ply damage (i.e. delamination) and intra-ply damage (matrix cracking).
This is the reason why, the elastic assumption is no more valid. A Finite Element
modeling is thus necessary to calculate the stress fields. In order to capture the
singularities, it is necessary to use very fine meshes leading to high computational cost.
Two approaches are developed:
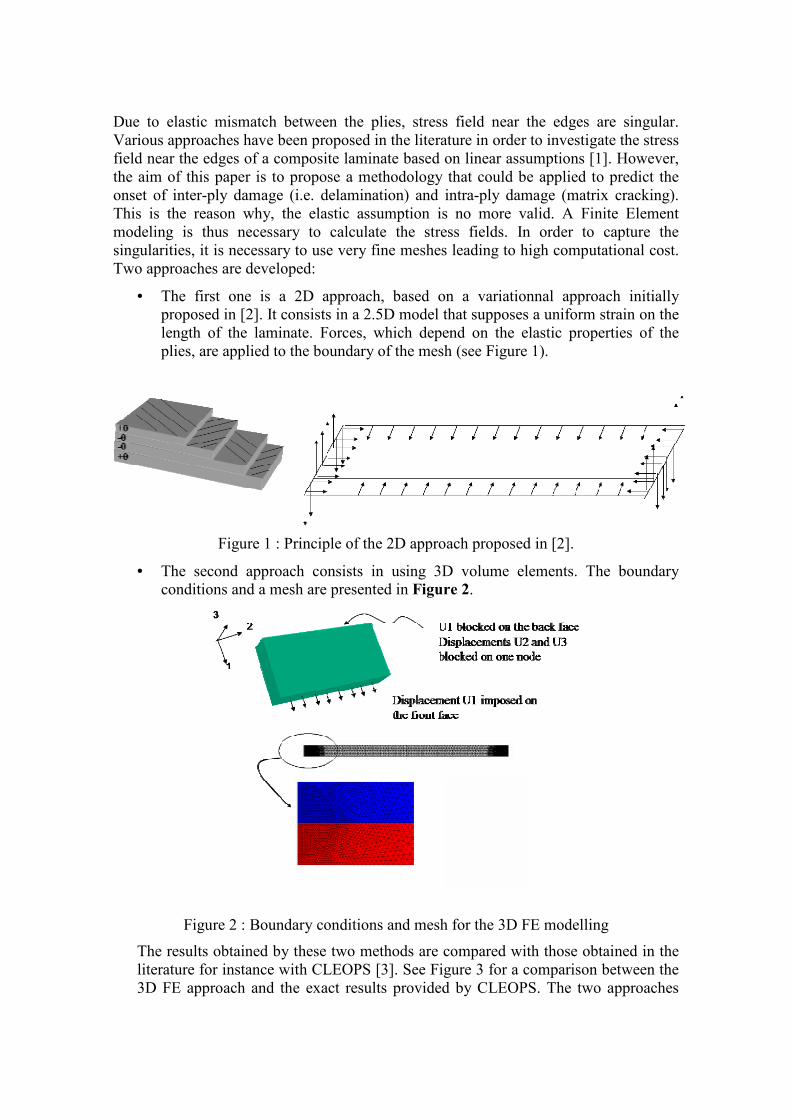
• The first one is a 2D approach, based on a variationnal approach initially
proposed in [ 2]. It consists in a 2.5D model that supposes a uniform strain on the
length of the laminate. Forces, which depend on the elastic properties of the
plies, are applied to the boundary of the mesh (see Figure 1).
Figure 1 : Principle of the 2D approach proposed in [ 2].
• The second approach consists in using 3D volume elements. The boundary
conditions and a mesh are presented in Figure 2.
Figure 2 : Boundary conditions and mesh for the 3D FE modelling
The results obtained by these two methods are compared with those obtained in the
literature for instance with CLEOPS [ 3]. See Figure 3 for a comparison between the
3D FE approach and the exact results provided by CLEOPS. The two approaches

presented in this paper lead to very similar results. However, the computational cost
of the 2D approach is very low as compared with the 3D one. On the other hand, the
3D approach is more general and could be applied to every geometry (for instance
edges of a hole) and loadings while the 2D model is restricted to plane plates
subjected to in-plane loadings.
SzzSyzSxz
0 1 2 3 4 5 6 7 8 9 10-0.05
0.00
0.05
0.10
0.15
0.20
0.25
0.30
Y (length)
(a)
SzzSyzSxz
0 1 2 3 4 5 6 7 8 9 10-0.1
0.0
0.1
0.2
0.3
0.4
0.5
0.6
0.7
Y (length)
(b)
Figure 3 : Comparison between a 3D FE model (dot in the figure) and the exact soltuin
provided by CLEOPS [ 3] for (a) [+/-10°]s (b) [+/-30°]s laminates.
Prediction of the onset of delamination
The stress fields being singular near the edges it is not possible to apply a simple stress
or strain based criterion. Different methods could be found in the literature to overcome
this problem for instance by averaging, over a length L, the shear stress at the interface
[3]. However, this approach requires to identify the parameter L which has no physical
sense. This is the reason why, in the present study, two complementary approaches are
proposed: the first one is based on a mixed stress and energy criterion and the second
one involves cohesive zone models.
Mixed criterion to describe the onset of damage
The mixed criterion is based on an energetic condition and a stress criterion.
The energetic criterion compared the change of the potential energy W∆ and the
material toughness cG . W∆ is expressed as a variation between the final state (with a
crack of length d) and the initial state (without a crack). This energetic condition is
given by the following equation:
c2inc GRE)d,l(Ad
)d(W)0(W)d(G ≥ε=−= (1)
where W is the potential energy for a constant external loading ε , cG is the interfacial
toughness. )d,l(A is a dimensionless parameter which depends only on the geometry
( l ) and of the length crack (d). R is the thickness of the plies. This relation involves an

incremental energy release rate )d(G inc since the classical infinitesimal increment of
crack is replaced here by a finite increment of crack.
In the present study, the stress criterion is a simple maximum criterion. It implies that,
prior to the rupture, a state of stress σ greater than the strength of the interface cσ takes
place on a distance at least equal to the length of the initiated crack:
cE)y,l(k)y,l( σ≥ε≥σ (2)
where )y,l(k is a dimensionless parameter which depends only on the geometry ( l ) and
of the coordinates along the interface (y). The procedure to calculate the dimensionless
parameters could be found in [ 4].
Characteristic evolutions of the energy release rate (represented by )d,l(A , see eq 1)
and the stress intensity factor ( )y,l(k ) in the case of a delamination initiated from the
edge are given in Figure 4a and b.
0 0.5 1 1.5 2 2.50
2
4
6
8x 10
-3
d
A
dmax
(a)
0 1 2 3 4
0.02
0.04
0.06
0.08
0.1
0.12
0.14
y
k(l,y)
(b)
Figure 4 : )d,l(A as a function of the crack length (a) and )y,l(k as a function of the y
abscissa (b).
Figure 4a shows an increase of the energy release rate as a function of the crack length
d. )d,l(A is maximal for a crack length noted dmax. For a monotonic loading, the energy
criterion is satisfied for
c2
max GRE)d,l(A =ε (3)
The initiation of the crack with a length dmax is possible if :
c
max E)d,l(k σ=ε (4)
(3) and (4) lead to
max
max
2
max
c
cc L
)d,l(k
)d,l(AR
EGL =≥
σ= (5)
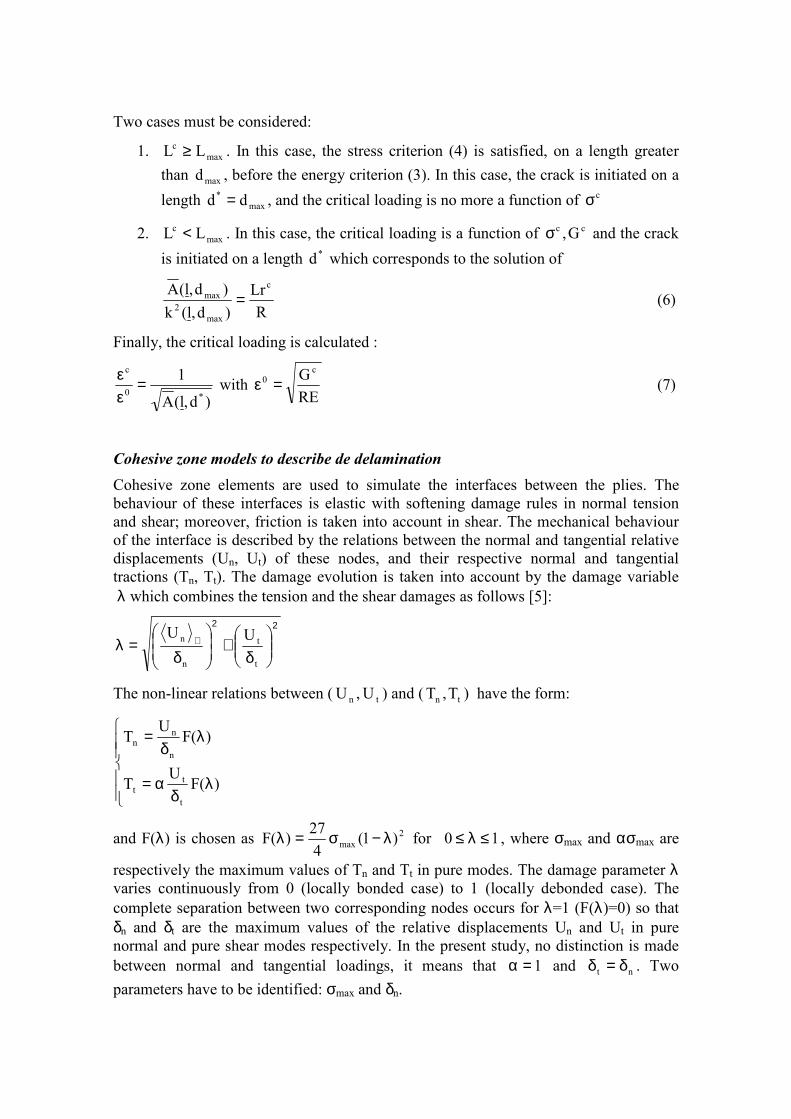
Two cases must be considered:
1. max
c LL ≥ . In this case, the stress criterion (4) is satisfied, on a length greater
than maxd , before the energy criterion (3). In this case, the crack is initiated on a
length max
* dd = , and the critical loading is no more a function of cσ
2. max
c LL < . In this case, the critical loading is a function of cc G,σ and the crack
is initiated on a length *d which corresponds to the solution of
R
Lr
)d,l(k
)d,l(A c
max
2
max = (6)
Finally, the critical loading is calculated :
)d,l(A
1
*0
c
=εε
with RE
G c0 =ε (7)
Cohesive zone models to describe de delamination
Cohesive zone elements are used to simulate the interfaces between the plies. The
behaviour of these interfaces is elastic with softening damage rules in normal tension
and shear; moreover, friction is taken into account in shear. The mechanical behaviour
of the interface is described by the relations between the normal and tangential relative
displacements (Un, Ut) of these nodes, and their respective normal and tangential
tractions (Tn, Tt). The damage evolution is taken into account by the damage variable
λ which combines the tension and the shear damages as follows [ 5]:
UU
t
t
n
n
22
δ+
δ=λ +
The non-linear relations between ( tn U,U ) and ( tn T,T ) have the form:
λδ
α=
λδ
=
)(FU
T
)(FU
T
t
tt
n
nn
and F(λ) is chosen as 2
max )1(4
27)(F λ−σ=λ for 10 ≤λ≤ , where σmax and ασmax are
respectively the maximum values of Tn and Tt in pure modes. The damage parameter λ varies continuously from 0 (locally bonded case) to 1 (locally debonded case). The
complete separation between two corresponding nodes occurs for λ=1 (F(λ)=0) so that δn and δt are the maximum values of the relative displacements Un and Ut in pure
normal and pure shear modes respectively. In the present study, no distinction is made
between normal and tangential loadings, it means that 1=α and nt δ=δ . Two
parameters have to be identified: σmax and δn.
A very important point concerns the definition of the initiation of the crack and of its
length. In the present paper, it has been supposed that a crack is created as soon as the
damage variable λ is equal to 1 in (at least) one Gauss Point, the crack tip is located at the last damage Gauss Point.
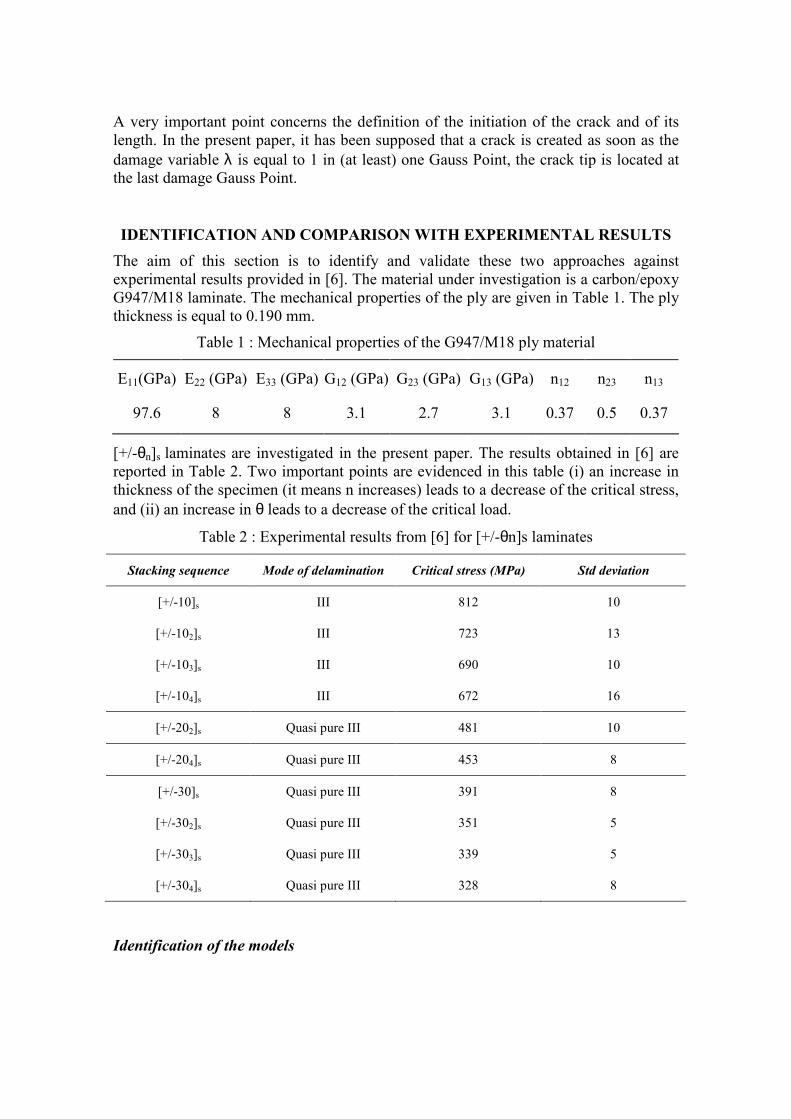
IDENTIFICATION AND COMPARISON WITH EXPERIMENTAL RESULTS
The aim of this section is to identify and validate these two approaches against
experimental results provided in [ 6]. The material under investigation is a carbon/epoxy
G947/M18 laminate. The mechanical properties of the ply are given in Table 1. The ply
thickness is equal to 0.190 mm.
Table 1 : Mechanical properties of the G947/M18 ply material
E11(GPa) E22 (GPa) E33 (GPa) G12 (GPa) G23 (GPa) G13 (GPa) n12 n23 n13
97.6 8 8 3.1 2.7 3.1 0.37 0.5 0.37
[+/-θn]s laminates are investigated in the present paper. The results obtained in [ 6] are
reported in Table 2. Two important points are evidenced in this table (i) an increase in
thickness of the specimen (it means n increases) leads to a decrease of the critical stress,
and (ii) an increase in θ leads to a decrease of the critical load.
Table 2 : Experimental results from [ 6] for [+/-θn]s laminates
Stacking sequence Mode of delamination Critical stress (MPa) Std deviation
[+/-10]s III 812 10
[+/-102]s III 723 13
[+/-103]s III 690 10
[+/-104]s III 672 16
[+/-202]s Quasi pure III 481 10
[+/-204]s Quasi pure III 453 8
[+/-30]s Quasi pure III 391 8
[+/-302]s Quasi pure III 351 5
[+/-303]s Quasi pure III 339 5
[+/-304]s Quasi pure III 328 8
Identification of the models

The identification of the mixed criterion model necessitates, first of all, to perform FE
calculations to calculate )d,l(A and )y,l(k . In order to identify the couples (Gc,σc
) that
correspond to the experimental critical load εc leading to the initiation of the delamination, G
c (and then ε0 ) is fixed in order to calculate *d (see eq. 5 and 6).
Finally, Lc (σc
) is calculated using eq. 7. It is worth mentioning that only a few elastic
FE calculations are necessary to calculate )d,l(A and )y,l(k . Using these two
parameters, the identification of all the couples (Gc,σc
) leading to the correct
experimental critical load, involved only some analytical treatments. Table 3 shows the
identification for the [+/-10n]s and the [+/-20n]s laminates.
Table 3: Identification of the best couples (Gc,σc
) for the [+/-10n]s and the [+/-20n]s
laminates
Stacking sequence ± 10 ± 20
σc (MPa) 344 406
Gc (Jm
-2) 86.5 60.7
Error between experimental and
numerical critical load (%)
1.18 3.44
a*(µm) 1-2 0.5-1.5
The identification of the cohesive zone models, involving non-linear FE calculations, is
more complex. Indeed, (Gc,σc
) couples are iteratively chosen thanks to an optimization
algorithm. A finite element calculation is performed until the onset of damage. The
critical numerical load is compared to the experimental one. The iterative process is
performed until the convergence between the numerical and the experimental load. This
approach could lead to a high computational time and provides only one couple (Gc,σc
)
leading to the experimental critical load. In the present paper, a strategy, based on the
use of a surrogate model (also called response surface), is used. A surrogate model
consists in building an analytical relation (most generally polynomial) between some
inputs (in the present case Gc,σc
) and the outputs (in the present case the critical load)
using a limited number of runs of the reference modelling (see Figure 5). Finally, this
analytical approximation is used to determine the values of the outputs as a function of
the variation of the inputs. In this study, the approximation is performed thanks to a
sparse polynomial expansion. It is worth mentioning that the analytical model is just an
approximation and some tools have been developed in order to increase the confidence
in this approximation [ 7].
0 100 200 300 400
0
200
4000
200
400
600
800
1000
sigmac
Gc
Critical stress
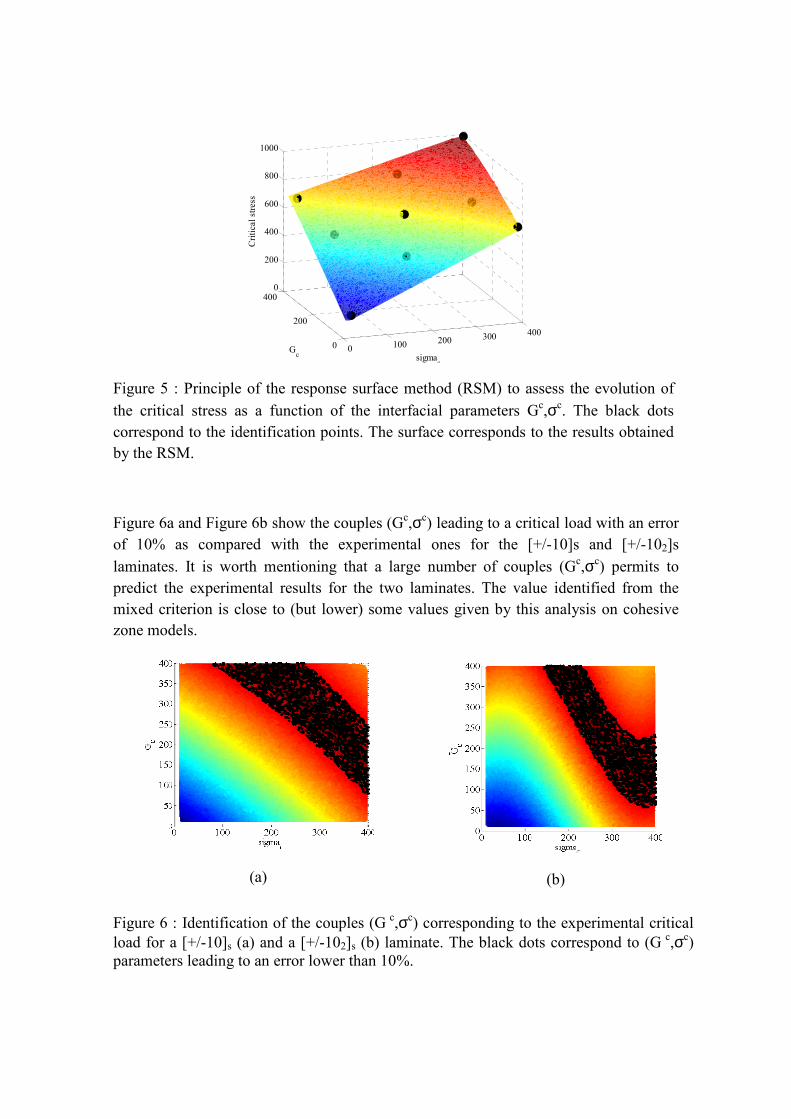
Figure 5 : Principle of the response surface method (RSM) to assess the evolution of
the critical stress as a function of the interfacial parameters Gc,σc
. The black dots
correspond to the identification points. The surface corresponds to the results obtained
by the RSM.
Figure 6a and Figure 6b show the couples (Gc,σc
) leading to a critical load with an error
of 10% as compared with the experimental ones for the [+/-10]s and [+/-102]s
laminates. It is worth mentioning that a large number of couples (Gc,σc
) permits to
predict the experimental results for the two laminates. The value identified from the
mixed criterion is close to (but lower) some values given by this analysis on cohesive
zone models.
(a)
(b)
Figure 6 : Identification of the couples (G c,σc
) corresponding to the experimental critical
load for a [+/-10]s (a) and a [+/-102]s (b) laminate. The black dots correspond to (G c,σc
)
parameters leading to an error lower than 10%.
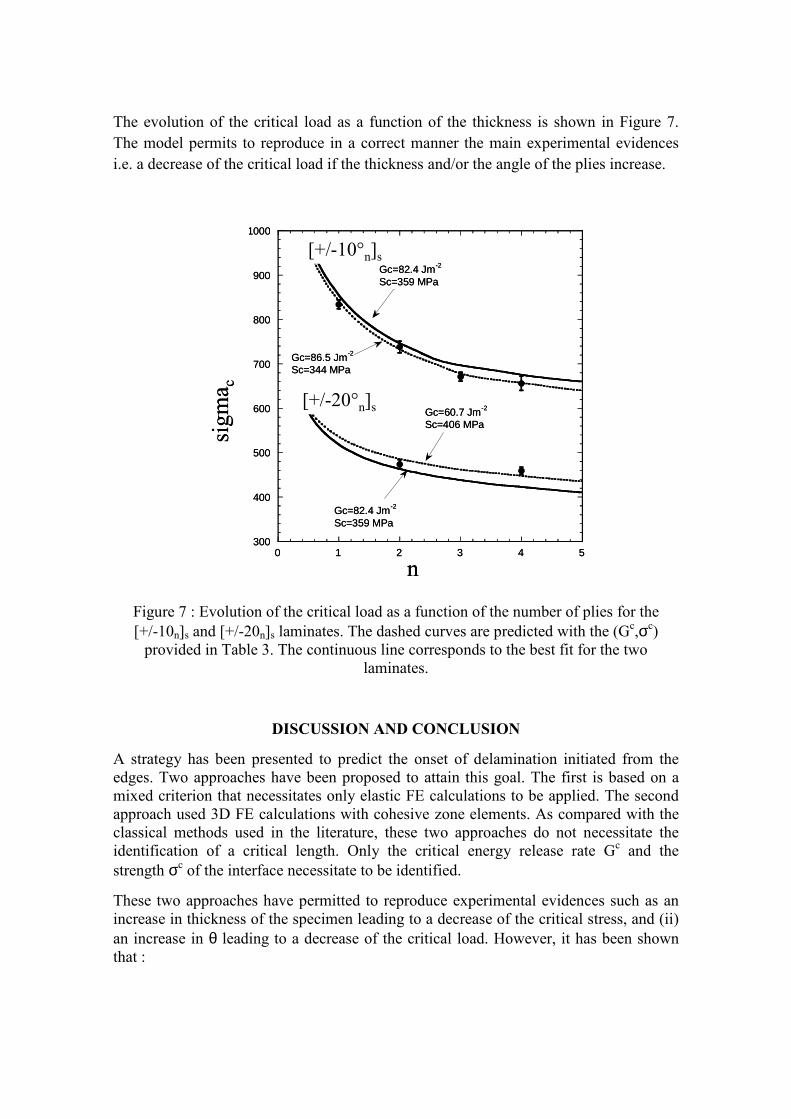
The evolution of the critical load as a function of the thickness is shown in Figure 7.
The model permits to reproduce in a correct manner the main experimental evidences
i.e. a decrease of the critical load if the thickness and/or the angle of the plies increase.
300
400
500
600
700
800
900
1000
0 1 2 3 4 5
PM10
PM20
Gc=82.4 Jm-2
Sc=359 MPa
Gc=82.4 Jm-2
Sc=359 MPa
Gc=86.5 Jm-2
Sc=344 MPa
Gc=60.7 Jm-2
Sc=406 MPa
sigma c
n
[+/-10°n]s
[+/-20°n]s
300
400
500
600
700
800
900
1000
0 1 2 3 4 5
PM10
PM20
Gc=82.4 Jm-2
Sc=359 MPa
Gc=82.4 Jm-2
Sc=359 MPa
Gc=86.5 Jm-2
Sc=344 MPa
Gc=60.7 Jm-2
Sc=406 MPa
sigma c
n
[+/-10°n]s
[+/-20°n]s
Figure 7 : Evolution of the critical load as a function of the number of plies for the
[+/-10n]s and [+/-20n]s laminates. The dashed curves are predicted with the (Gc,σc
)
provided in Table 3. The continuous line corresponds to the best fit for the two
laminates.
DISCUSSION AND CONCLUSION
A strategy has been presented to predict the onset of delamination initiated from the
edges. Two approaches have been proposed to attain this goal. The first is based on a
mixed criterion that necessitates only elastic FE calculations to be applied. The second
approach used 3D FE calculations with cohesive zone elements. As compared with the
classical methods used in the literature, these two approaches do not necessitate the
identification of a critical length. Only the critical energy release rate Gc and the
strength σc of the interface necessitate to be identified.
These two approaches have permitted to reproduce experimental evidences such as an
increase in thickness of the specimen leading to a decrease of the critical stress, and (ii)
an increase in θ leading to a decrease of the critical load. However, it has been shown that :

• In order to use these methods, very fine meshes are needed. Indeed, the crack
length is very small (from 0.5 to 2 µm). This is the reason why, in order to apply
this approach to a complex structure, a computational strategy is needed (for
instance a global->local approach). A 2D FE approach has also been presented
in order to reduce drastically the computational cost.
• The mixed criterion approach and the cohesive zone models are complementary.
Indeed, the mixed criterion dimensionless parameters are only a function of the
elastic properties and of the geometry. These parameters are calculated using
simple elastic modelings. Thanks to these parameters, analytical equations
permit to assess the effect of (Gc,σc
) on the critical loading leading to the onset
of delamination. On the other hand, cohesive zone models necessitate expensive
non-linear FE calculations which are a function of the elastic properties, the
geometry and the interfacial parameters (Gc,σc
). In order to assess the effect of
the interfacial parameters, a strategy based on surrogate model is necessary.
However, contrary to the mixed criterion, cohesive zone models permit to take
into account all the non-linearities (viscosity, in-plane damage in the plies) and
the coupling between intra-ply damage and delamination.
• In order to reproduce the experimental results, is necessary to identify the
interfacial parameters of each stacking sequence. This problem is probably due
to the evolution of the mixed-mode delamination (see Table 2). Indeed, it is well
known that the critical energy release rate is a function of this mixed-mode
delamination, and this point must be introduced in the present analysis for both
the energy release rate and the critical strength of the interface.
References
1. Mittelstedt C. and Becker W.,” Free-edge effects in composite laminates”,
Applied Mechanics Reviews, Vol. 60, pp 217-245, 2007.
2. Pipes R.B. and Pagano N.J., “Interlaminar stresses in composite laminates under
uniform axial extension”, Journal of Composite Materials 4. 538–548,1970.
3. Medysys, “Cleops reference manual”, 2008.
4. Martin E., Peters P.W.M., Leuillon D., Quenisset J.M., “Conditions for matrix
crack deflection at an interface in ceramic matrix composites”, Mater. Sci. Eng.
A., 250, pp. 291-302, 1998.
5. Tvergaard V., "Effect of fibre debonding in a whisker-reinforced metal",
Materials Science and Engineering, 203-213, 1990.
6. Lorriot T., Marion G., Harry R., Wargnier H., “Onset of free-edge delamination
in composite laminates under tensile loading”, Composites: Part B 34, 459–471,
2003.
7. Carrere N., Rollet Y., Leory F.-H., Maire J.-F, “Efficient structural computations
with parameters uncertainty for composite application”, accepted for publication
in Composite Science and Technology, Available on line 4 October 2008.