Embed Size (px)
Citation preview

Multilateral Trade Bargaining:A First Look at the
GATT Bargaining Records∗
Kyle Bagwell† Robert W. Staiger‡ Ali Yurukoglu§
July 2017
Abstract
This paper empirically examines recently declassified data from the GATT/WTO ontariff bargaining. Focusing on the Torquay Round (1950-51), we document six stylizedfacts about these interconnected high-stakes international negotiations. Several of thesestylized facts lend support to two features that are seen by GATT practitioners and legalscholars as hallmarks of the tariff bargaining that occurred in the early GATT rounds,namely, a surprising lack of strategic behavior among the participating governments andan important multilateral element to the bilateral bargains. We suggest that these featurescan be understood as emerging from a tariff bargaining forum that emphasizes the GATTpillars of MFN and multilateral reciprocity, and we offer evidence that the relaxationof strict bilateral reciprocity facilitated by the GATT multilateral bargaining forum wasimportant to the success of the GATT approach.
∗We thank the NSF (Grant SES-1326940) and SEED for financial support, and Sushan Demirjian, DiwakarDixit, Anwarul Hoda, Lee Ann Jackson, Amelia Porges, William Powers and Suja Rishikesh for very helpfuldiscussions related to various aspects of this project. We are especially grateful to Ambassador Julio LacarteMuró for patiently answering our many questions about the mechanics of the early GATT rounds. We alsothank Jakub Kastl, Nuno Limao, Marcelo Olarreaga, Marzena Rostek, Michele Ruta and seminar participantsat Berkeley, Dartmouth, Georgetown, Indiana, Maryland, Princeton, Stanford, UBC, Yale and The World Bankas well as participants at the Dartmouth-SNU conference on International Trade Policy and Institutions, theNBER 2015 ITI Summer Institute and the Villars Research Workshop on the Economics of International TradeAgreements for very helpful comments. Patricia Abbott, Ayako Obashi, Woan Foong Wong and Junhui Zengprovided outstanding research assistance, as did Joanna Yeo, Zhufei Shi, and especially Elizabeth Stone onearlier phases of the data processing portion of this project. Bagwell thanks CASBS at Stanford for supportand hospitality.†Department of Economics, Stanford University; and NBER.‡Department of Economics, Dartmouth College; and NBER.§Graduate School of Business, Stanford University and NBER

1. Introduction
The World Trade Organization (WTO) and its predecessor the General Agreement on Tariffs
and Trade (GATT)1 have presided over the largest and most sustained negotiated trade liber-
alization in history. Yet challenges remain, as evidenced by the now-suspended Doha Round of
multilateral trade negotiations. This paper introduces and empirically analyzes detailed nego-
tiation data, recently declassified by the WTO, to understand the nature of tariff bargaining
in the world trading system. Improving our understanding of these negotiations is important
for addressing the challenges facing modern trade agreements. At the same time, analyzing
these detailed offer data in high stakes international negotiations contributes to economists’
understanding of bargaining more generally.
GATT/WTO tariff negotiations display several notable features. The negotiations are a
form of barter, whereby governments accept commitments on their own import tariffs in ex-
change for the reciprocal tariff commitments of their principal trading partners. For each round
a specific bargaining protocol is adopted, with explicit rules for the timing of events, the kinds
of interactions expected and the exchange of information among participants. And though it is
a multilateral institution, for the most part the GATT/WTO has adopted a bilateral approach
to multilateral tariff bargaining according to which reciprocal “request-offer”negotiations oc-
cur on a voluntary basis between pairs of countries at the tariff-line level, with the results of
these bilateral negotiations then “multilateralized”to the full GATT/WTO membership by a
non-discrimination requirement that tariffs abide by the most-favored nation (MFN) principle.
In this paper we focus on the Torquay Round (1950-51), where over a 10 month period
298 separate bilateral negotiations among the 37 participating countries covering thousands of
tariff-line products took place. We document a series of stylized facts about these negotiations.
The numbers of back-and-forth offers and counteroffers in any bilateral bargain were relatively
small. Once the initial proposals were on the table, the focus of bargaining narrowed to each
country’s own-tariff-cut offers, and countries responded to imbalances in the outstanding offers
by adjusting their own offers rather than by adjusting their requests of others. Adjustments
in offers typically took a simple and striking form: offers for given import products were rarely
deepened over the course of the negotiations; instead, adjustments typically involved a country
1The GATT was created in 1947, and it sponsored a total of eight multilateral negotiating rounds through1994. With the conclusion of the eighth (Uruguay) round, the WTO came into existence on January 1, 1995,and it includes the GATT and a set of additional agreements that extend GATT principles to new areas.
1

“shopping around” its initial tariff-cut offers and ultimately reducing as necessary the depth
of its overall (multilateral) offer. And when a country chose to reduce the depth of its offers,
it did so with adjustments on the “extensive margin” (i.e., by removing products from its
offers), not on the “intensive margin”(i.e., by raising the level of the tariff cut offered). Initial
offers sometimes sat dormant for long periods only to be finalized with a single modification
at the time that other bargains were concluded. The set of requests a country entertained
seemed to conform with principal supplier considerations, but the set of requests made by a
country seemed to diverge from what would be expected solely on the basis of principal supplier
considerations. Substantial numbers of offers were made that were not requested by the country
to which the offer was extended, and some offers were made that were not requested by any
country at all. And there was substantial two-way bargaining within narrow product categories,
and significant numbers of these two-way bargains occurred within a single bilateral.
Several of these stylized facts lend support to two features that are emphasized by GATT
practitioners and legal scholars as hallmarks of the tariff bargaining that occurred in the early
GATT rounds. A first feature is the surprising lack of strategic behaviors such as “lowball”
initial offers among the participating governments, as emphasized for example by Curzon (1966);
this feature is supported by our findings that offers of tariff cuts for given import products
were rarely deepened as the round progressed, and that once the initial proposals were on
the table the focus of bargaining narrowed to each country’s own-tariff-cut offers rather than
the requests it had made of its bargaining partners. A second feature is the presence of an
important multilateral element to the bilateral bargains, as emphasized for example in the
early GATT report issued as ICITO (1949); this feature is suggested by our finding that, while
the numbers of back-and-forth offers and counteroffers in any bilateral bargain are small, for
some bargains the initial offers sit dormant for long periods of time before being finalized with
a single modification at the time that other bargains are concluded.
We suggest that these features can be understood as emerging from a tariffbargaining forum
that emphasizes the GATT pillars of MFN and multilateral reciprocity. To support this claim,
we present a theoretical and institutional framework, adopting the perspective of the terms-of-
trade theory of trade agreements (see Bagwell and Staiger, 2010a, for a recent review of the
central features of this theory). On top of the basic theory, we layer the institutional features
of reciprocity and MFN.2 MFN requires that any concession granted in a bilateral negotiation
2As we discuss further in Section 2, the theoretical foundations for our analysis of multilateral trade bar-
2

be extended unconditionally to the other members of GATT. Reciprocity, applied either at the
bilateral or the multilateral level, requires that equilibrium agreements increase export volume
for a given country by the same amount as the increase in its import volume, and prevents
terms-of-trade changes as a result of the agreement.
We provide an interpretation of the features emphasized above through the lens of our the-
oretical and institutional framework: according to this interpretation, a country would propose
for a given import product the tariff that generated its preferred trade volume for a fixed terms
of trade, with the expectation that any subsequent “rebalancing”of offers necessary for mul-
tilateral reciprocity would arise later in the round after all offers had been recorded and that
this might lead to a reduction in the depth of its overall (multilateral) offer. We argue that
this bargaining behavior is broadly consistent with that expected according to our framework,
if governments made dominant-strategy proposals under the strict institutional constraints of
MFN and multilateral reciprocity. We also discuss and explore empirically the extent to which
the UK and its Commonwealth partners, who maintained tariff preferences on selected prod-
ucts and hence represented an important exception to MFN at Torquay, and the newcomers
to GATT who were negotiating their accession in the Torquay Round, exhibited bargaining
behaviors consistent with our interpretation that MFN and multilateral reciprocity played an
important role in shaping the bargaining behavior we observe at Torquay.
Finally, we explore further the importance of multilateral elements in the bargains, and offer
evidence that the relaxation of strict bilateral reciprocity facilitated by the GATT multilateral
bargaining forum was important to the success of the GATT approach, a view that was em-
phasized in the GATT report ICITO (1949). For this purpose, we focus on the breakdown of
the bilaterals between the US on the one hand, and the UK and its Commonwealth partners
Australia and New Zealand on the other, that occurred midway through the round. We test
whether, after this breakdown, the offers on the table in the remaining bilaterals between each
of these four countries and third parties were adjusted to compensate for the disappearance
of the indirect benefits from the US-UK, US-Australia and US-New Zealand bilaterals that
third parties might have expected if bilateral bargains exhibited multilateral but not bilateral
reciprocity. Our findings support this view. Specifically, the nature of the adjustments in offers
subsequent to these breakdowns that we document are consistent with the kind of rebalancing
that would be required to reestablish multilateral reciprocity after such a breakdown, in that
gaining under MFN and reciprocity are formally established in Bagwell and Staiger (2016a).
3

these four countries re-oriented their offers toward the rest of the participants at Torquay at
the same time that the rest of the participants at Torquay were re-orienting their offers away
from these four countries.
Can lessons learned from a 65-year-old GATT round have relevance for the modern era? We
believe so, for at least two reasons. First, the participants at Torquay were facing a set of trade
bargaining challenges that have clear counterparts today: approaching the potential bargaining
externalities associated with MFN, addressing the existence of preferential tariffs, and dealing
with asymmetries in the tariff levels across countries at different stages of development and
with different negotiating histories. And second, the basic features of the bargaining protocol
adopted at Torquay are still very much in use; for example, a similar protocol was adopted in
the Doha Round for market access negotiations in the critical area of trade in services.3
Our paper is related to several literatures. Recent papers in international trade have asked
whether there is empirical support for the terms-of-trade theory of trade agreements (e.g.,
Broda, Limao andWeinstein, 2008, Bagwell and Staiger, 2011, Ludema and Mayda, 2013, Bown
and Crowley, 2013), whether reciprocity is a feature of tariff bargaining outcomes (e.g., Limao,
2006, 2007, Karacaovali and Limao, 2008), and whether MFN creates a free-rider problem for
trade negotiations (e.g., Ludema andMayda, 2009, 2013). And economic historians and political
scientists have long debated what made GATT special as an institution for promoting trade
liberalization (e.g., Irwin, 1995, and Gowa and Kim, 2005). Our paper provides evidence on each
of these questions, but for the first time from the perspective of actual tariff bargaining data.
In the context of the empirical bargaining literature, a handful of papers empirically examine
bilateral bargaining with not just outcome data, but detailed offer and counter-offer data. These
include Keniston (2013) and Larsen (2014). In these settings, bilateral negotiations do not affect
payoffs of parties not involved in the bargain. In parallel, there is an emergent literature in
industrial organization empirically examining bilateral bargaining with externalities using data
on only outcomes as in Crawford and Yurukoglu (2012). Our paper is unique in looking at
detailed offer and counter-offer data in a setting of bilateral bargaining with externalities.
The remainder of the paper proceeds as follows. In section 2 we present a basic modeling
framework for interpreting tariff negotiations. We describe the GATT bargaining protocols in
section 3, and in section 4 we discuss the broad features of the GATT bargaining data. In
3The Doha protocol for market access negotiations over trade in services shares the same bilateral request-offer format as the Torquay protocol, though the Doha rules for the exchange of information across bilateralsappear to have evolved somewhat. See, for example, Feketekuty (2008).
4

section 5 we present summary statistics relating to the Torquay bilaterals and describe stylized
facts about multilateral tariff bargaining that are suggested by these bargaining records. In
section 6 we introduce institutional detail into our basic modeling framework to provide further
interpretation of tariffbargaining at Torquay. In section 7 we present our empirical investigation
into multilateral versus bilateral reciprocity. Section 8 concludes.
2. A Basic Framework for Interpreting TariffNegotiations
It is not self-evident how one can make sense of even the most basic features of tariffbargaining.
Why do trade negotiators view own-tariff cuts as “concessions” to be granted only in return
for foreign tariff cuts for their exporters? What do governments have to gain from bargaining
over tariffs anyway? And how can one account for the narrow focus of negotiations on tariff
bargaining, when it is clear that trade flows can be impacted by a wide range of government
policies? If a modeling framework is to serve as a foundation for interpreting the GATT tariff
bargaining data, it should be capable of providing answers to at least these most basic questions.
In this section we sketch a basic modeling framework that highlights the terms-of-trade ex-
ternality associated with unilateral tariff choices, and that yields answers to the questions posed
above. More specifically, below we review the textbook two-good general-equilibrium model of
trade between two countries, add to this a general family of government preferences, and use
the resulting framework to answer these questions. We then briefly extend the framework to
a multicountry setting in order to examine how interdependence across countries is shaped by
the MFN principle. For these purposes we paraphrase the treatment in Bagwell and Staiger
(2010a), and refer readers there for details. In later sections, after the stylized facts of the
GATT bargaining data have been presented, we will augment the basic framework developed
here with additional institutional structure, and from the perspective of the resulting model
predictions will then offer an interpretation of some of the hallmarks of GATT tariff bargaining
as documented by these stylized facts.
A Model Two-Country World Economy Two countries, domestic (no *) and foreign
(*), trade two goods which are normal in consumption and produced in perfectly competitive
markets under conditions of increasing opportunity costs. We let x (y) denote the natural
import good of the domestic (foreign) country. The local relative price facing domestic (foreign)
producers and consumers is defined as p ≡ px/py (p∗ ≡ p∗x/p∗y). Tariffs are non-prohibitive, and
5

the domestic (foreign) ad valorem import tariff is t (t∗). Letting τ ≡ (1 + t) and τ ∗ ≡ (1 + t∗),we then have that p = τpw ≡ p(τ , pw) and p∗ = pw/τ ∗ ≡ p∗(τ ∗, pw), where pw ≡ p∗x/py is
the “world”(i.e., untaxed) relative price. The foreign terms of trade is given by pw, and the
domestic terms of trade is 1/pw. We interpret τ > 1 as an import tax and similarly for τ ∗.
In each country, production levels for x and y are determined by the local relative price:
Qi = Qi(p) and Q∗i = Q∗i (p∗) for i = {x, y}. Consumption is also influenced by the local
relative price, which defines the trade-off faced by consumers and determines the level and
distribution of factor income. Consumption depends as well on tariff revenue R (R∗), which
is measured in units of the local export good at local prices and is distributed lump-sum to
domestic (foreign) consumers. Domestic and foreign consumption thus may be represented as
Di = Di(p,R) and D∗i = D∗i (p∗, R∗) for i = {x, y}. But tariff revenue is implicitly defined by
R = [Dx(p,R)−Qx(p)][p−pw] or R = R(p, pw) for the domestic country, and similarly we have
that R∗ = [D∗y(p∗, R∗) − Q∗y(p∗)][1/p∗ − 1/pw] or R∗ = R∗(p∗, pw) for the foreign country; and
each country’s tariff revenue increases with its terms of trade, given our assumption of normal
goods. Hence, we may express national consumption as a function of local and world prices:
Ci(p, pw) ≡ Di(p,R(p, p
w)) and C∗i (p∗, pw) ≡ D∗i (p
∗, R∗(p∗, pw)) for i = {x, y}.Imports of x and exports of y for the domestic country are respectively defined byM(p, pw) ≡
Cx(p, pw)−Qx(p) and E(p, pw) ≡ Qy(p)−Cy(p, pw). Likewise, for the foreign country, we have
M∗(p∗, pw) and E∗(p∗, pw), respectively. For any prices, domestic and foreign budget constraints
are represented by the trade-balance equations:
pwM(p, pw) = E(p, pw), and M∗(p∗, pw) = pwE∗(p∗, pw). (2.1)
The equilibrium world price, p̃w(τ , τ ∗), is determined by market clearing for good y:
E(p(τ , p̃w), p̃w) =M∗(p∗(τ ∗, p̃w), p̃w), (2.2)
where we make explicit in (2.2) the functional dependencies for local prices. Market clearing
for good x is then guaranteed by (2.1) and (2.2).
We assume dp/dτ > 0 > dp∗/dτ ∗ and ∂p̃w/∂τ < 0 < ∂p̃w/∂τ ∗, thereby ruling out the
Metzler and Lerner paradoxes, and with the final two inequalities indicating that each country
is “large”(i.e., each country can improve its terms of trade by increasing its tariff).
Government Preferences The traditional approach to representing government preferences
is to impose the assumption that governments maximize national income; by contrast, in the
6

political-economy approach, governments are motivated by distributional concerns. Here, we
follow Bagwell and Staiger (1999, 2002) and adopt a general approach to modeling government
preferences, representing the objectives of the domestic and foreign governments with the gen-
eral functions W (p, p̃w) and W ∗(p∗, p̃w), respectively. We thus represent welfare in terms of
the prices that the tariffs induce rather than directly in terms of the tariffs themselves. This
approach enables us to disentangle the separate roles played by the terms-of-trade externality
and political motivations in explaining what governments have to gain from bargaining over
tariffs.
We place no restrictions on government preferences over local prices. With the level and dis-
tribution of factor incomes determined by local prices, we therefore accommodate a wide range
of political motivations. We assume only that, holding its local price fixed, each government is
pleased when its terms of trade improve:
Wp̃w < 0 and W ∗p̃w > 0. (2.3)
The meaning of (2.3) in terms of the underlying tariff changes is that a government values the
international income transfer that is implied by an increase in its own tariff and a decrease in
the tariff of its trading partner that together leave its local price unaltered. As Bagwell and
Staiger (1999, 2002) discuss, governments maximize welfare functions of this form in both the
traditional approach and in the leading political-economy approaches to trade policy.
Unilateral Policies To analyze optimal unilateral (non-cooperative) policies, we suppose
that each government sets its tariff policy to maximize its welfare, for any given tariff choice of
its trading partner. The associated tariff reaction curves are defined implicitly by
Wp + λWp̃w = 0, and (2.4)
W ∗p∗ + λ∗W ∗
p̃w = 0, (2.5)
where λ ≡ [∂p̃w/∂τ ]/[dp/dτ ] < 0 and λ∗ ≡ [∂p̃w/∂τ ∗]/[dp∗/dτ ∗] < 0. As these expressions
highlight, the best-response tariff of each government strikes a balance between the effects on
its welfare of the local- and world-price movements induced by its tariff choice.4
The welfare implications of the local-price movement in the first term of (2.4) are domestic
in nature: they reflect the trade-off for the domestic government between the costs of the4We assume throughout that the second-order conditions associated with any maximization problem hold
globally.
7

induced economic distortions and the benefits of any induced political support. By contrast, the
welfare implications of the world-price movement in the second term of (2.4) are international
in nature: they reflect the benefits to the domestic government of shifting some of the costs of
its policy choice onto the foreign government. Cost shifting occurs, since any improvement in
the domestic country’s terms of trade is a deterioration in the foreign country’s terms of trade.
We may similarly interpret (2.5) for the foreign government.
In a Nash equilibrium, both governments are on their reaction curves, and a Nash equilib-
rium tariff pair (τN , τ ∗N) thus satisfies (2.4) and (2.5). We take this equilibrium to represent
the trade-policy decisions that governments would make if there were no trade agreement.
From the perspective of (2.4) and (2.5), we may now return to the first question posed
above and observe that it is natural within this modeling framework that trade negotiators
would view own-tariff cuts as “concessions”to be granted only in return for foreign tariff cuts
for their exporters. First, beginning from (2.4) and (2.5), any own-tariff change would be
viewed as a concession, given that governments begin from their best-response tariffs. And
second, (2.4) impliesWp < 0 when the home government selects its best-response tariff. Hence,
if the home government were to request a small foreign tariff cut for its exporters and offered
as a concession a small tariff cut of its own that prevented the terms of trade p̃w from changing,
the proposed tariff changes would reduce p while leaving p̃w unchanged and therefore deliver
−Wp > 0, increasing the welfare of the home government. As (2.5) implies W ∗p∗ > 0 when
the foreign government selects its best-response tariff, an analogous observation applies for the
foreign government.
Trade Agreement Governments value a trade agreement if it leads to changes in trade
policies that generate Pareto improvements for governments relative to their welfare in the
Nash equilibrium. Thus, a trade agreement is potentially valuable if and only if the Nash
equilibrium is ineffi cient, when effi ciency is measured relative to government preferences.
Three observations can be stated.5 First, Nash tariffs are indeed ineffi cient. Second, both
governments can gain relative to Nash only if each agrees to set its tariff below its Nash level.
The first observation means that a mutually beneficial trade agreement is possible, while the
second observation implies that reciprocal trade liberalization is necessary for mutual gains.
Intuitively, when a government contemplates an increase in its unilateral tariff, it foresees an
5Formal proofs of these observations can be found in Bagwell and Staiger (1999, 2002).
8
improvement in its terms of trade; thus, it is in part motivated by the prospect of shifting some
of the costs of the tariff hike onto its trading partner. The incentive to shift costs naturally
leads governments to set tariffs that are higher than is effi cient.
To see if the terms-of-trade externality is the only reason for the ineffi ciency of Nash tariffs,
consider a hypothetical world in which governments are not motivated by the terms-of-trade
implications of their unilateral trade-policy choices, that is, a hypothetical non-cooperative
setting in which Wp̃w ≡ 0 and W ∗p̃w ≡ 0. Next define the “domestic politically optimal reaction
curve” by Wp = 0, the “foreign politically optimal reaction curve” by W ∗p∗ = 0, and the
politically optimal tariffs as any tariff pair (τPO, τ ∗PO) that satisfies the first-order conditions
Wp = 0 and W ∗p∗ = 0. The third observation is that politically optimal tariffs are effi cient
(when evaluated with actual government preferences): the terms-of-trade externality is the sole
rationale for a trade agreement in this (“terms-of-trade theory”) modeling framework. Put
differently, according to this modeling framework and in answer to the second question posed
above, the gains from tariff bargaining come from the ability to eliminate the ineffi cient terms-
of-trade driven motives from unilateral tariff choices.
The politically optimal tariffs are not the only effi cient tariffs. In the special case where
governments maximize national welfare, effi cient tariffs satisfy τ = 1/τ ∗ (as Mayer, 1981 shows)
and politically optimal tariffs correspond to reciprocal free trade (i.e., τ = τ ∗ = 1), a point on
the Mayer locus. A trade agreement enables governments to move from the ineffi cient Nash
tariffs to some point on the contract curve, where the contract curve is that portion of the
effi ciency frontier on which neither government receives below-Nash welfare. The politically
optimal tariffs lie on the contract curve, provided that the countries are not too asymmetric.
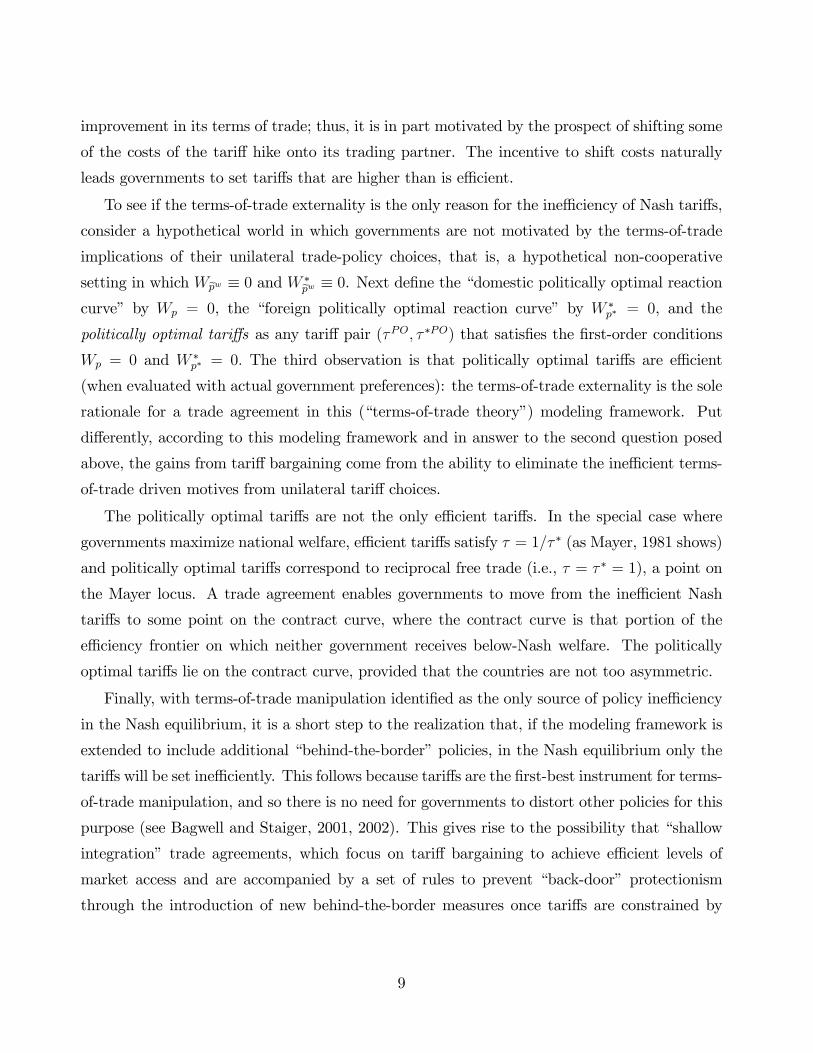
Finally, with terms-of-trade manipulation identified as the only source of policy ineffi ciency
in the Nash equilibrium, it is a short step to the realization that, if the modeling framework is
extended to include additional “behind-the-border”policies, in the Nash equilibrium only the
tariffs will be set ineffi ciently. This follows because tariffs are the first-best instrument for terms-
of-trade manipulation, and so there is no need for governments to distort other policies for this
purpose (see Bagwell and Staiger, 2001, 2002). This gives rise to the possibility that “shallow
integration” trade agreements, which focus on tariff bargaining to achieve effi cient levels of
market access and are accompanied by a set of rules to prevent “back-door” protectionism
through the introduction of new behind-the-border measures once tariffs are constrained by
9

negotiation, can lead governments to the effi ciency frontier.6 Hence our modeling framework
provides an answer to the third question posed above.
Interdependence in a Multilateral World We next consider briefly the interdependence
across pairs of countries that arises in a multilateral world, and how the MFN principle shapes
this interdependence. For this purpose we extend the modeling framework introduced above
to a three-country setting, and once again paraphrase the treatment in Bagwell and Staiger
(2010a), referring readers there for details.
The domestic country now exports good y to two foreign countries, denoted by the su-
perscripts ‘∗1’and ‘∗2,’and imports good x from each of these countries (who do not trade
with each other). Each foreign country can impose a tariff on its imports of good y from the
domestic country (we denote the tariff of foreign-country i by τ ∗i), while the domestic country
can set tariffs on its imports of good x from the two foreign countries. If the domestic country
applies the tariff τ 1 to imports from foreign-country 1 and the discriminatory tariff τ 2 6= τ 1 to
imports from foreign-country 2, then separate world prices pw1 and pw2 apply to its trade with
foreign-countries 1 and 2 respectively. This follows because there can only be one local price
in the domestic economy, and the pricing relationships p = τ 1pw1 and p = τ 2pw2 then imply
pw1 6= pw2 whenever τ 1 6= τ 2.
The MFN rule imposes a very simple requirement: the domestic country must apply a
common tariff level τ 1 = τ 2 ≡ τ to the imports of x, regardless of whether these imports
originate from foreign-country 1 or 2. An important implication of the MFN rule is then that
a single equilibrium world price, p̃w(τ , τ ∗1, τ ∗2), must prevail; consequently, we may continue
to express government preferences with the simple representation W (p, p̃w), W ∗1(p∗1, p̃w) and
W ∗2(p∗2, p̃w), where p = τpw ≡ p(τ , pw) and p∗i = pw/τ ∗i ≡ p∗i(τ ∗i, pw), i = 1, 2.
In a multilateral world, the MFN principle therefore ensures that the international exter-
nality at the root of the problem to be solved by a trade agreement continues to exhibit the
same structure as in the simpler 2-country setting. At the same time, as the equilibrium world
price function p̃w(τ , τ ∗1, τ ∗2) indicates, in general each county’s welfare will be impacted by
the tariff choices of the remaining two countries if these tariff choices impact the world price.
Bilateral MFN tariff bargains will therefore in general impose externalities on third countries,
6For a recent review of the trade agreements literature, including the logic of shallow integration when viewedfrom the perspective of the terms-of-trade theory, see Bagwell, Bown and Staiger (2016).
10

pointing to a potentially important multilateral dimension associated with such bargains.7 Put
differently, according to our modeling framework a collection of bilateral MFN tariff bargains
would represent a setting of bilateral bargaining with externalities, which is well-known to be
in general a complex bargaining environment.8
3. The GATT Bargaining Protocols
Armed with a basic framework for interpreting tariff negotiations, we now describe the GATT
bargaining protocols. The first five GATT rounds adopted the approach of selective product-
by-product MFN tariff negotiations on a bilateral request-offer basis, as did to varying degrees
the eighth GATT (Uruguay) round and the currently suspended WTO (Doha) round. As Hoda
(2001) explains, the protocols for the first five rounds were broadly similar:
Each round began with the adoption of a decision convening a tariff conference on a
fixed future date. The decision required the contracting parties to exchange request lists
and furnish the latest edition of their customs tariffs and their foreign trade statistics for
a recent period well in advance of the first day of the conference and the offers had to be
made on the first day. The negotiations were concluded generally over a period of six to
seven months after the offers had been made...These negotiations were essentially bilateral
between pairs of delegations. (pp. 44-45)
As a general matter, the initial request lists of tariffcuts were common knowledge (circulated
among all the participating governments) in each of the first five rounds, while the back-and-
forth offers and counteroffers that transpired within each bilateral were known only to the
participating governments in that bilateral, until the GATT Secretariat was informed that an
outcome for that bilateral (success or failure) had been achieved, at which point the details
of successful bilaterals became common knowledge. Tariffs agreed in a bilateral would apply
on a non-discriminatory basis to exports from any GATT-member country through the MFN
principle.
7In the absence of MFN, there would also be potentially important multilateral dimensions associated withany bilateral (discriminatory) tariff bargain, but the spillovers would be different (see, for example, Bagwell andStaiger, 2005).
8On the complexity of bilateral bargaining with externalities, see Cremer and Riordan (1987), Horn andWolinsky (1988), McAfee and Schwartz (1994) and Hart and Tirole (1990), and see Bagwell, Staiger andYurukoglu (2017) in the context of bilateral tariff bargaining under weaker rules than those considered here.
11
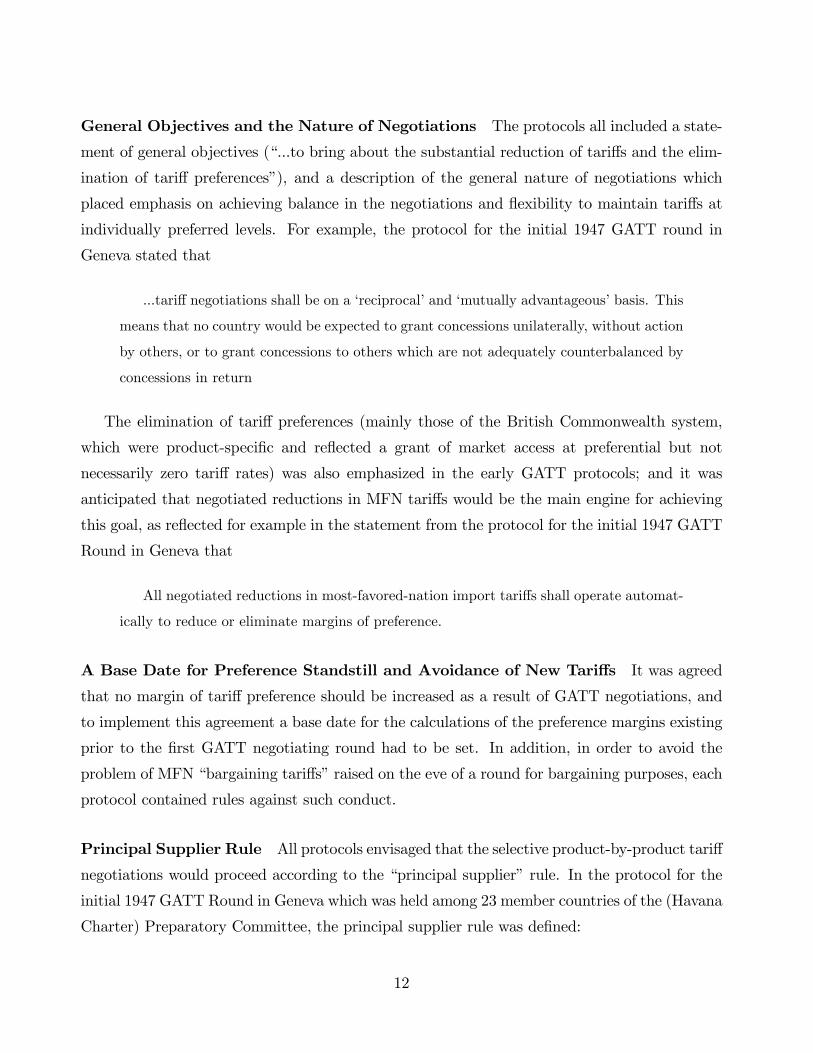
General Objectives and the Nature of Negotiations The protocols all included a state-
ment of general objectives (“...to bring about the substantial reduction of tariffs and the elim-
ination of tariff preferences”), and a description of the general nature of negotiations which
placed emphasis on achieving balance in the negotiations and flexibility to maintain tariffs at
individually preferred levels. For example, the protocol for the initial 1947 GATT round in
Geneva stated that
...tariff negotiations shall be on a ‘reciprocal’and ‘mutually advantageous’basis. This
means that no country would be expected to grant concessions unilaterally, without action
by others, or to grant concessions to others which are not adequately counterbalanced by
concessions in return
The elimination of tariff preferences (mainly those of the British Commonwealth system,
which were product-specific and reflected a grant of market access at preferential but not
necessarily zero tariff rates) was also emphasized in the early GATT protocols; and it was
anticipated that negotiated reductions in MFN tariffs would be the main engine for achieving
this goal, as reflected for example in the statement from the protocol for the initial 1947 GATT
Round in Geneva that
All negotiated reductions in most-favored-nation import tariffs shall operate automat-
ically to reduce or eliminate margins of preference.
A Base Date for Preference Standstill and Avoidance of New Tariffs It was agreed
that no margin of tariff preference should be increased as a result of GATT negotiations, and
to implement this agreement a base date for the calculations of the preference margins existing
prior to the first GATT negotiating round had to be set. In addition, in order to avoid the
problem of MFN “bargaining tariffs”raised on the eve of a round for bargaining purposes, each
protocol contained rules against such conduct.
Principal Supplier Rule All protocols envisaged that the selective product-by-product tariff
negotiations would proceed according to the “principal supplier”rule. In the protocol for the
initial 1947 GATT Round in Geneva which was held among 23 member countries of the (Havana
Charter) Preparatory Committee, the principal supplier rule was defined:
12

It is generally agreed that the negotiations should proceed on the basis of the ‘principal
supplier’ rule, as defined in this paragraph. This means that each country would be
expected to consider the granting of tariff or preference concessions only on products of
which the other members of the Preparatory Committee, are, or are likely to be, principal
suppliers... In other words, if a principal part of total imports of a particular product into
the territory of a particular member is supplied by the other members of the Preparatory
Committee taken together, then the importing member should, as a general rule, be willing
to include that product in the negotiations, even though no single other member of the
Committee, taken by itself, supplies a principal part of the total imports of the product.
Extensive Form of Negotiations The protocols described procedures for conducting ne-
gotiations which amounted to a four stage process. At a broad level, these procedures were
described in greatest detail in the protocol for the initial 1947 GATT Round in Geneva, though
as we explain further below there was some evolution in particular features of these procedures
across rounds. The protocol for the 1947 round stipulated the following timing:
1. Prior to the opening of talks, each participating country transmits lists of requests of
product-level concessions it seeks from each other participating country.
2. At the opening of talks, each country submits lists of product-level concessions it would
offer to each other participating country given the requests it has made of them.
3. Pairs of countries negotiate directly over concessions of primary concern between those
two countries. This is effectively simultaneous interconnected bargaining.
4. As bilateral agreements are reached, third-party countries can examine the agreements,
and potentially modify their own agreements in response.
Later rounds evolved along several specific dimensions. In particular, the rules on sharing
information among participants about initial offers (the second stage of the 1947 protocol)
evolved somewhat from round to round. For example, the protocol for the 1949 Annecy Round
states:
...On 11 April, 1949, — that is, on the first day of the meeting..., each government
will make known to all participating governments the concessions which it is prepared to
13

offer to each government from which a request for concessions was received...When the
concessions offered by all participating governments have been exchanged and distributed,
negotiations between pairs of delegations will begin.
Here it seems clear that the initial offers, like the initial requests, were to be common knowledge.
But by the 1950-51 Torquay Round, the emphasis on sharing initial (second stage) offers among
participants seems to have disappeared. The Torquay protocol states:
On September 28, 1950 —that is, on the first day of the meeting in Torquay —each
government should be ready to make known the concessions it is prepared to offer to each
government from which a request for concessions is received...When the offers have been
exchanged, negotiations between pairs of delegations will begin.
4. The GATT Bargaining Records
The GATT bargaining records make it possible to recover the complete history of offers and
counteroffers in a given round. For the Torquay Round, we illustrate in Figure 1 with a sample
of the bargaining record from the US-France bilateral negotiation from that round.
Figure 1: Excerpt of US-France Negotiation Record
14
This particular bilateral began on February 6 1951 with an exchange of offers (not shown in
Figure 1) between France and the US describing the tariff cuts to which each would agree if the
other met its earlier (and publicly) announced requests. The excerpted bargaining record in
Figure 1 describes a portion of the request by the US on February 24 that France supplement
its February-6 offer. France did supplement its offer on March 31 1951, and on that day the US
and France announced publicly the agreement resulting from their bilateral (which amounted
to the US tariff cuts offered to France on February 6 and the supplemented France tariff cuts
offered to the US on March 31). By following in this way the timing and sequence of the
request-offer records, we can construct the full sequence of offers and counteroffers that led to
agreement or disagreement for each of the bilaterals in the Torquay Round.
To illustrate further how the GATT bargaining records can be used to illuminate the multi-
lateral bargaining behavior of participants in the round, we highlight in Figure 2 the bargaining
behavior of the US with regard to one particular 6-digit product, HS 843319 (Mowers for lawns,
other than powered and with a horizontal rotating cutter). Specifically, Figure 2 depicts the
complete request-offer sequence involving the tariffs on such lawn mowers between the US and
each of the five countries whose bilateral bargains with the US involved a request and/or offer
on this product. We denote by the symbol R a request, by O an offer, by OW a withdrawn
offer and by A an agreement. These symbols are positioned at the height of the tariff request
or offer, so that a horizontal line between any two symbols indicates that the tariff level across
those two actions is the same, while an upward sloping (downward sloping) line between any
two symbols indicates that the tariff level across those two actions increased (decreased).
As reflected in Figure 2, between June 1 and July 1, 1950, the US made requests of all five
of these countries (Canada, New Zealand, Peru, Sweden and the UK) to reduce their import
tariffs on such lawn mowers, and the US received requests to reduce its own tariff on these lawn
mowers from two of the countries (Canada and the UK). In the months that followed, Peru and
Sweden each made offers to the US at a level which met the US request, while New Zealand,
Canada and the UK each made offers to the US at a level which did not go all the way to meet
the US request and New Zealand and the UK subsequently withdrew their offers; and for its
part, the US did not respond to the Canadian request but did make an offer to the UK to cut
its tariff on this product, an offer that the US subsequently withdrew. The final commitments
on HS 843319 tariffs emerging from these five bilaterals were three: a commitment by Canada
negotiated with the US to reduce the Canadian tariff on lawn mowers; a commitment by Peru
15

negotiated with the US to reduce the Peruvian tariff on lawn mowers; and a commitment by
Sweden negotiated with the US to reduce the Swedish tariff on lawn mowers.
date
6/1/50
6/15
/50
6/30
/50
7/1/50
10/6/50
10/10/50
10/19/50
11/17/50
12/1/50
3/15
/51
US‐UK
US‐Canada
US‐New
Zealand
US‐Sw
eden US request/
Sweden offer
Sweden request/US offer
US request/New Zealand offer
US request/Canada offer
US request/UK offer
New Zealand request/US offer
Canada request/US offer
UK request/US offer
R
O
0
0
0
0
0
0
0
0
R
R
R
O
O
A
HS 843319
A
ORLevel unspecified
3/31
/51
OW
US‐Peru
0
0Peru request/US offer
US request/Peru offer
R
R
O A
OW
O2/17
/51
OW
Figure 2: Requests and Offers on Lawn Mowers in US Torquay Bilaterals.Notes: This Figure depicts the complete request-offer sequence between the US and each of the five countries
whose bilateral bargains with the US involved a request and/or offer on lawn mowers (HS 843319). The symbol
R denotes a request, O an offer, OW a withdrawn offer and A an agreement. These symbols are positioned at
the height of the tariff request or offer, so that a horizontal (upward/downward sloping) line between any two
symbols indicates that the tariff level across those two actions is the same (increased/decreased).
An important question is the degree to which the GATT bargaining records provide a
complete catalog of every offer and counteroffer that was tendered in a round. It is clear that
these records represent a complete list of the initial offers that each country made to every
other country, and a complete list as well of the final agreed tariff commitments that came out
of each bilateral. Hence, at a minimum the GATT bargaining records provide an accurate view
of where each bilateral bargain started, where it ended up, and the elapsed time from start
to finish. What is less clear is whether the offi cial record provides a complete catalog of the
back-and-forth counteroffers that occurred between the initial offers and the final outcome.
16

While it would be implausible to suppose that there was no communication outside of the
offi cial counteroffers included in the GATT bargaining records, at least for the earlier rounds
there are two reasons to believe that the records offer a fairly complete catalog of the tendered
counteroffers. First, in older rounds such as the Torquay Round that predated the ready use of
electronic records and portable computing devices, a written record of the detailed product-level
bilateral tariff cutting proposals —proposals which typically included dozens if not hundreds of
product-level tariff cuts to be considered —was the only way that a proposal or counter-proposal
could be offered and assessed.9 Second, the final bargaining outcomes in the GATT bargaining
records predominantly emerge in a continuous fashion from the recorded requests, offers and
counteroffers, rather than appearing in the final agreement as a new and never-before-recorded
proposal —for example, 95% of the exact tariff bindings to which the US ultimately agreed in
the Torquay Round first appear in the US-Torquay bargaining records as either requests by
US bargaining partners or as earlier US offers to some bargaining partner —which is at least
consistent with the lack of important informal proposals being tendered outside of the recorded
counteroffers.10
There are a number of significant challenges that must be overcome before the GATT
bargaining data can be used for research. The Online Data Appendix covers these issues
in detail. The most challenging issue concerned creating product level concordances across
negotiations. Our solution was to concord product level descriptions into HS 1988 6-digit
codes. We henceforth refer to an HS6 code as a product.
5. Stylized Facts of GATT Tariff Bargaining
We now present data from the Torquay Round tariff bargaining records to develop a number of
stylized facts relating to GATT tariff bargaining. We start with an overview of the number of
parties and the timing and frequency of their actions. We then describe a set of stylized facts.
9We thank Sushan Demirjian, Deputy Assistant USTR for Market Access and Industrial Competitiveness,for pointing this out to us.10More specifically, only 64 out of the 1,260 HS6 tariffbindings to which the US agreed in its Torquay bilaterals
do not appear as either requests or earlier offers in some US bilateral; and this count reflects an upper bound,because the numbers are calculated at the HS6 level and a lack of match could reflect changes in the 10 digitproduct mix in any given HS6 product category over the course of the bargain rather than the appearance of atariff binding in the final agreement that did not appear somewhere in the US bilateral bargaining records atan earlier date (see also note 23).
17

5.1. Overview
We begin with a helicopter view of the Torquay negotiations. There were 39 participating
countries in the Torquay Round, accounting for well over 80 percent of world trade as of 1949
(see, for example, US Department of State, 1951, p. 1).11 However, the Benelux customs union
(consisting of Belgium, Luxembourg and the Netherlands) negotiated its common external
tariffs as a single entity, reducing the total number of parties negotiating at Torquay to 37.
Of the 666 possible bilaterals, 298 were initiated, and of these, 148 bilaterals were successfully
concluded (i.e., led to agreed tariff commitments). Our dataset includes 292 of the bilaterals
initiated at Torquay.12
Figure 3 provides a snapshot of who did what with whom in the Torquay Round. It is
natural to expect that larger countries would have been more active in the round, while it
is often said that GATT was “a rich man’s club.”13 The three panels on the left of Figure
3 display the relationship between the bilateral bargaining activity of a country and its real
GDP in 1950, while the three panels on the right of Figure 3 display the relationship between
bilateral bargaining activity and real 1950 per-capita income. The top panels refer to requests
or modifications of requests, the middle panels refer to offers or modifications of offers, and the
bottom panels refer to agreements or modifications of agreements. In each panel, the vertical
axis records the “proposer”country (that is, the country making the request, or the offer, or
agreeing to the tariff cut) ordered from bottom to top by descending GDP level (left panel)
or GDP per-capita level (right panel), and the horizontal axis records the “target” country
for that proposal ordered from left to right by descending GDP level (left panel) or GDP per-
11We count as participating any country that made a formal request or offer to or received a formal requestor offer from at least one country in the context of the Torquay Round. The participating countries wereAustralia, Austria, Benelux Countries (Belgium, Luxembourg, Netherlands), Brazil, Burma, Canada, Ceylon,Chile, Cuba, Czechoslovakia, Denmark, Dominican Republic, Finland, France, Germany, Greece, Guatemala,Haiti, India, Indonesia, Italy, Korea, Liberia, New Zealand, Nicaragua, Norway, Pakistan, Peru, Philippines,Southern Rhodesia, Sweden, Syria-Lebanon, Turkey, South Africa, United Kingdom, United States and Uruguay.Of these, six were negotiating for accession at Torquay: Austria, Germany, Korea, Peru, Philippines and Turkey.12Of the 298 bilaterals initiated at Torquay, 6 involved Burma (Myanmar) and these GATT bargaining records
currently remain restricted so they are excluded from our dataset (these bilaterals did not progress past therequest stage, and amounted to requests of Burma made by Canada, Czechoslovakia, Denmark, France, Norwayand Sweden), bringing the total number of initiated bilaterals in our dataset to 292.13For instance, if it is accepted that larger countries have greater market power (i.e., have greater ability to
impact foreign exporter prices with their unilateral tariff choices —see Broda, Limao and Weinstein, 2008), thenthe terms-of-trade theory of trade agreements described in section 2 would lead to the expectation that largercountries would be more active participants in tariff negotiations. On the view that GATT was “a rich man’sclub,”see for example the discussion in Chapter 2 of Eckes (2000).
18
R/RM
USANZL
AUSCAN
DNKGBR
SWE
BEL,NLD
,LUX
NORFRA
URYFIN
DEUAUT
CHL
CZE,SVK IT
AZAF
SYR,LBN
PERGTM
CUBGRC
BRATUR NIC
LKA
PHLLB
RHTI
DOMKOR
IDNZW
EPAK IN
D
IND
PAK
ZWE
IDN
KOR
DOM
HTI
LBR
PHL
LKA
NIC
TUR
BRA
GRC
CUB
GTM
PER
SYR,LBN
ZAF
ITA
CZE,SVK
CHL
AUT
DEU
FIN
URY
FRA
NOR
BEL,NLD,LUX
SWE
GBR
DNK
CAN
AUS
NZL
USA
O/OM
USANZL
AUSCAN
DNKGBR
SWE
BEL,NLD
,LUX
NORFRA
URYFIN
DEUAUT
CHL
CZE,SVK IT
AZAF
SYR,LBN
PERGTM
CUBGRC
BRATUR NIC
LKA
PHLLB
RHTI
DOMKOR
IDNZW
EPAK IN
D
IND
PAK
ZWE
IDN
KOR
DOM
HTI
LBR
PHL
LKA
NIC
TUR
BRA
GRC
CUB
GTM
PER
SYR,LBN
ZAF
ITA
CZE,SVK
CHL
AUT
DEU
FIN
URY
FRA
NOR
BEL,NLD,LUX
SWE
GBR
DNK
CAN
AUS
NZL
USA
A/AM
USANZL
AUSCAN
DNKGBR
SWE
BEL,NLD
,LUX
NORFRA
URYFIN
DEUAUT
CHL
CZE,SVK IT
AZAF
SYR,LBN
PERGTM
CUBGRC
BRATUR NIC
LKA
PHLLB
RHTI
DOMKOR
IDNZW
EPAK IN
D
IND
PAK
ZWE
IDN
KOR
DOM
HTI
LBR
PHL
LKA
NIC
TUR
BRA
GRC
CUB
GTM
PER
SYR,LBN
ZAF
ITA
CZE,SVK
CHL
AUT
DEU
FIN
URY
FRA
NOR
BEL,NLD,LUX
SWE
GBR
DNK
CAN
AUS
NZL
USA
R/RM
USAGBR
DEUIN
DFRA
ITA
BEL,NLD
,LUX
CANBRA
IDNAUS
SWE
CZE,SVK
ZAFTUR
DNKAUT
PAKPHL
CHLKOR
NORPER FIN
NZLGRC
CUB
SYR,LBN
URYLK
AGTM
HTI
DOMZW
ENIC
LBR
LBR
NIC
ZWE
DOM
HTI
GTM
LKA
URY
SYR,LBN
CUB
GRC
NZL
FIN
PER
NOR
KOR
CHL
PHL
PAK
AUT
DNK
TUR
ZAF
CZE,SVK
SWE
AUS
IDN
BRA
CAN
BEL,NLD,LUX
ITA
FRA
IND
DEU
GBR
USA
O/OM
USAGBR
DEUIN
DFRA
ITA
BEL,NLD
,LUX
CANBRA
IDNAUS
SWE
CZE,SVK
ZAFTUR
DNKAUT
PAKPHL
CHLKOR
NORPER FIN
NZLGRC
CUB
SYR,LBN
URYLK
AGTM
HTI
DOMZW
ENIC
LBR
LBR
NIC
ZWE
DOM
HTI
GTM
LKA
URY
SYR,LBN
CUB
GRC
NZL
FIN
PER
NOR
KOR
CHL
PHL
PAK
AUT
DNK
TUR
ZAF
CZE,SVK
SWE
AUS
IDN
BRA
CAN
BEL,NLD,LUX
ITA
FRA
IND
DEU
GBR
USA
A/AM
USAGBR
DEUIN
DFRA
ITA
BEL,NLD
,LUX
CANBRA
IDNAUS
SWE
CZE,SVK
ZAFTUR
DNKAUT
PAKPHL
CHLKOR
NORPER FIN
NZLGRC
CUB
SYR,LBN
URYLK
AGTM
HTI
DOMZW
ENIC
LBR
LBR
NIC
ZWE
DOM
HTI
GTM
LKA
URY
SYR,LBN
CUB
GRC
NZL
FIN
PER
NOR
KOR
CHL
PHL
PAK
AUT
DNK
TUR
ZAF
CZE,SVK
SWE
AUS
IDN
BRA
CAN
BEL,NLD,LUX
ITA
FRA
IND
DEU
GBR
USA
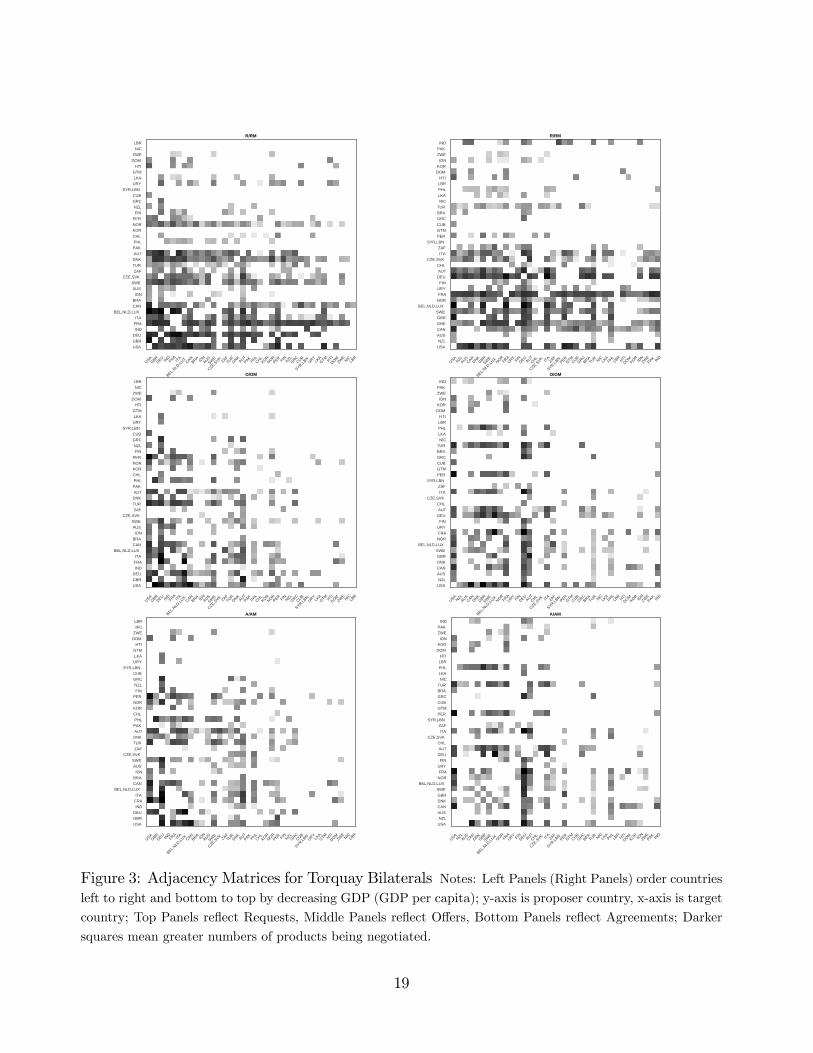
Figure 3: Adjacency Matrices for Torquay Bilaterals Notes: Left Panels (Right Panels) order countriesleft to right and bottom to top by decreasing GDP (GDP per capita); y-axis is proposer country, x-axis is target
country; Top Panels reflect Requests, Middle Panels reflect Offers, Bottom Panels reflect Agreements; Darker
squares mean greater numbers of products being negotiated.
19

capita level (right panel). Darker squares mean greater numbers of products being negotiated
in the associated bilateral. There is an area of high-density activity in the south west of each
panel of Figure 3, reflecting the bargaining activity of bilaterals between large/rich countries.
But the panels reveal a number of other patterns as well. From the top panels of Figure 3, it
is clear that mostly the large/rich countries made market access requests, and their requests
were spread widely across most of the countries at Torquay. The middle panels of Figure 3
reveal that market access offers were made by most of the countries at Torquay, but they were
made to mostly the large/rich countries. And the bottom panel of Figure 3 reveals that most
countries agreed to cut their tariffs as a result of the Torquay Round, but that their agreements
to do so were mostly as a result of bargains with large/rich countries. Figure 4 documents
that the number of products over which country pairs bargained at Torquay (vertical axis) falls
with distance between country pairs (horizontal axis); the slope coeffi cients on the associated
regressions are each negative and strongly significant.
0 0.5 1 1.5 2Distance
ij #104
0
500
1000
1500
#HS
6
R/RMO/OMA/AM
Figure 4: Distance between Country Pairs and Their Bargaining Activity.Notes: This Figure documents the impact of distance between country pairs (horizontal axis, in kilometers) on
the number of HS6 products over which the pair bargained at Torquay (vertical axis). R (RM) denotes request
(modified request), O (OM) denotes offer (modified offer), A (AM) denotes agreement (modified agreement).
In Figure 5 we represent a game tree for the Torquay Round, beginning from the “opening
of talks”when countries first began to exchange initial offers (that is, we exclude from the game
20

O
(150,40,0.85
)
A
(21,9,0.86)
O
(132,45,0.78
)RM
(1,20,0.22
)Ø
(17,40,0.85)
A
(12,9,0.78)
Ø
(9,9,0.86)
OM
(8,40,0.83
)
RM
(1,15,1)
A
(73,36,0.85)
Ø
(30,45,0.78)
(20,,)
Ø
(1,20,0.22
)RM
(1,18,0.45
)
A
(14,35,0.82)
(2,,)
(12,,)
(8,,)
AM
(1,4,0.89)
OM
(1,5,0.65)
Ø
(7,40,0.83
)
Ø
(1,15,1)
A
(69,32,0.77)
Ø
(4,36,0.85
)
OM
(6,8,0.84)
RM
(7,114,0.63)
A
(17,47,0.91)
O
(1,4,0.7)
O
(1,340,)
A
(7,21,0.75
)Ø
(7,35,0.82
)
Ø
(1,4,0.89)
A
(1,78,0.9)
OM
(2,131,0.82)
A
(3,32,0.6)
(2,,)
A
(1,36,0.87
)(63,,)
AM
(2,14,1)
Ø
(4,32,0.77
)
(3,,)
AM
(1,19,0.91
)
A
(3,388,0.88)
Ø
(3,8,0.84)
OM
(1,39,0.85
)A
(5,201,0.88)
(1,,)
(8,,)
A
(8,30,0.78
)Ø
(1,47,0.91
)
Ø
(1,4,0.7)
A
(1,162,0.9)
(5,,)
AM
(1,1,0.94)
Ø
(1,21,0.75
)(7,,)
(1,,)
A
(1,32,0.69
)
Ø
(2,131,0.82)
A
(3,37,0.69
)
Ø
(1,36,0.87
)
Ø
(2,14,1)
AM
(4,22,0.74
)
A
(1,36,0.7)
A
(2,330,0.65)
Ø
(1,388,0.88)
A
(3,15,0.81
)
Ø
(1,39,0.85
)
A
(4,229,0.77)
Ø
(1,201,0.88)
Ø
(8,30,0.78
)
AM
(1,130,0.56)
A
(1,5,0.91)
Ø
(1,162,0.9)
Ø
(1,1,0.94)
AM
(1,7,0.64)
Ø
(1,32,0.69
)
OM
(1,84,0.94
)(1,,)
(2,,)
AM
(1,12,0.58
)(1,,)
(2,,)
(4,,)
(1,,)
(2,,)
AM
(1,14,0.86
)
A
(3,8,0.85)
OM
(1,157,0.8)
(4,,)
(1,,)
(8,,)
(1,,)
A
(1,72,)
(1,,)
(1,,)
(1,,)
AM
(1,1,0.9)
Ø
(1,84,0.94
)
Ø
(1,12,0.58
)
A
(1,473,0.63)
Ø
(3,8,0.85)
Ø
(1,157,0.8)
Ø
(1,72,)
(1,,)
A
(1,138,0.96)
(1,,)
Ø
(1,473,0.63)
(3,,)
OM
(1,174,0.82)
(1,,)
A
(1,236,0.73)
AM
(1,2,0.5)
Ø
(1,174,0.82)
AM
(1,3,0.83)
(1,,)
A
(1,917,0.78)
AM
(1,2,0.5)
A
(1,7,)
Ø
(1,2,0.5)
(1,,)
AM
(1,20,0.71
)
(1,,)
1
22
11
11
1
22
22
N
22
2N
YY
2
11
11
11
11
11
11
1
22
2N
2Y
22
Y2
22
22
NY
22
22
Y2
2Y
Y
11
11
11
11
11
11
11
11
11
1
22
NY
2Y
YY
YY
22
2Y
YY
Y2
YY
Y
11
11
11
1
Y2
Y2
Y2
Y
11
1
2Y
2
11
2Y
1 Y
Figure5:SummaryGameTree.
Notes:ThissummaryGameTreeexcludestheRequestStagepriortoopeningoftalks,andcollapsesthe
292simultaneousbilateralsatTorquayintoasinglerepresentativebilateral;seetextforfurtherexplanation.
21

tree the “request”stage prior to the opening of talks). The game tree in Figure 5 abstracts from
the multilateral aspects of negotiations by collapsing the 292 simultaneous bilaterals at Torquay
into a single representative bilateral, with representative countries 1 and 2 having alternating
opportunities to take an action, where the action may be an offer to cut one’s tariffs (O), a
modification of an offer (OM), a modification of a previous request that the bargaining partner
cut its tariffs (RM), an agreement to cut one’s tariffs (A), a modification of an agreement (AM),
or the possibility of taking no action at that time (φ). On each branch of the tree we record
the number of bilaterals along that branch (the first number in parentheses), the mean number
of products in play per bilateral along that branch (the second number in parentheses), and
the mean of the proposed tariff divided by the pre-existing tariff along that branch (the third
number in parentheses). Finally, a terminal node labeled “Y”indicates that this branch of the
game tree ends in a set of final agreed tariff commitments, while a terminal node labeled “N”
indicates that this branch of the game tree ends in no agreement.14
Beginning from the top of Figure 5, the initial left branch of the game tree depicts immediate
agreement that occurred (subsequent to requests, not shown) for a number of the countries that
were negotiating for accession during the Torquay Round; the main initial branch of the game
tree is the right branch, which depicts a sequence of offers (O) and counteroffers (OM, RM) that
led either to failed bilaterals (terminal node N) or to agreements (A, AM) and ultimate success
(terminal node Y). As the branches of the game tree in Figure 5 reveal, the majority of offers
and counteroffers are concluded in a small number of alternating steps, and most terminal nodes
are reached in a small number of steps after that. But there are also some longer branches that
reflect more extensive sequences of offers and counteroffers and/or modifications of agreements.
The mean proposed tariffs vary somewhat across the branches of the game tree, and the same
is true proceeding down a given branch, but there is no obvious pattern in the proposed tariffs
across branches of the game tree and the within-branch changes are often non-monotonic.
Finally, we zoom in on the US to provide a view of the Torquay Round from the perspective
of an individual country and the various bilaterals in which it is directly involved. The US was
engaged in bilateral negotiations with 24 of its 36 potential negotiating partners.15 It reached
14Entries in parentheses just prior to an agreement or a terminal node are omitted in Figure 5 when they areunchanged from the entry in the preceding action. The one exception is with respect to the Benelux-Turkeybilateral: in Turkey’s final concessions made to Benelux, no pre-existing tariffs were listed, and hence the entryfor the mean proposed tariff divided by the pre-existing tariff is omitted for this node of the game tree due tomissing data.15The countries present at Torquay with which the US did not negotiate were Burma, Ceylon, Chile, Finland,
22

final agreement with 15 of these countries. In Figure 6 we display an overview of the timing
and actions —request (R), modification of request (RM), offer (O), modification of offer (OM),
withdrawal of offer (OW), agreement (A) and modification of agreement (AM) —for each of the
24 bilateral negotiations involving the US at Torquay. The dates of each action are recorded
on the horizontal axis. For each US negotiating partner listed on the vertical axis, the bottom
(blue) line displays the actions relating to the US tariff —the offers by the US and the requests
coming from its negotiating partners —while the top (red) line displays the actions relating to
the foreign negotiating partner’s tariff—the requests by the US and the offers of its negotiating
partners. Figure 6 displays 57 dates across the 10 month period of the Torquay Round on
which the US and/or at least one of its negotiating partners took an action in their bilateral.
As Figure 6 illustrates, most of the dates involve multiple actions across a number of bilaterals.
5.2. Stylized Facts
We now record and document six stylized facts relating to GATT bargaining patterns.
Stylized Fact 1: The numbers of back-and-forth offers and counteroffers in any bilateral
bargain are relatively small, and for some bargains the initial offers sit dormant on the table
for long periods of time and are then finalized with a single modification at the time that other
bargains are concluded.
We noted above in the context of Figure 6 that the US and/or its negotiating partners
took actions on 57 separate dates before reaching a conclusion to the round; but Figure 6 also
reveals that the amount of “back-and-forth” within any US bilateral is much more limited,
often consisting of only a couple of actions by each party over the course of the round and never
more than a handful by either. In Table 1 we present evidence from all the Torquay bilaterals
on the amount of back-and-forth offers and counteroffers during negotiations, and confirm that
this is a general feature of the round. As Table 1 reveals, on products for which a country
made at least one offer in the bilateral, the average number of offers it made in a bilateral on
that product is 1.4 and the maximum is 5; for requests the analogous numbers are 1 and 3.16
Conditional on a final agreement reached on that product in that bilateral, the average number
of offers a country made on that product is 1.5 and the maximum is again 5; and for requests
Greece, Liberia, Nicaragua, Pakistan, Philippines, Southern Rhodesia, Syria-Lebanon and Uruguay.16For example, a product might be included in an initial offer, and then also be in the set of products that
is included in a modified offer, and then later the offer on this product might be withdrawn, in which case wewould record that a total of 3 offers were made on this product.
23

26-May-1950
02-Jun-1950
09-Jun-1950
16-Jun-1950
23-Jun-1950
30-Jun-1950
07-Jul-1950
14-Jul-1950
21-Jul-1950
28-Jul-1950
04-Aug-1950
11-Aug-1950
18-Aug-1950
25-Aug-1950
01-Sep-1950
08-Sep-1950
15-Sep-1950
22-Sep-1950
29-Sep-1950
06-Oct-1950
13-Oct-1950
20-Oct-1950
27-Oct-1950
03-Nov-1950
10-Nov-1950
17-Nov-1950
24-Nov-1950
01-Dec-1950
08-Dec-1950
15-Dec-1950
22-Dec-1950
29-Dec-1950
05-Jan-1951
12-Jan-1951
19-Jan-1951
26-Jan-1951
02-Feb-1951
09-Feb-1951
16-Feb-1951
23-Feb-1951
02-Mar-1951
09-Mar-1951
16-Mar-1951
23-Mar-1951
30-Mar-1951
06-Apr-1951
Aus
tral
ia
Aus
tria
Ben
elux
Bra
zil
Can
ada
Cub
a
Cze
chos
lova
kia
Den
mar
k
Dom
inic
an R
epub
lic
Fra
nce
Ger
man
y
Gua
tem
ala
Hai
ti
Indi
a
Indo
nesi
a
Italy
New
Zea
land
Nor
way
Per
u
Sou
th A
fric
a
Sou
th K
orea
Sw
eden
Tur
key
Uni
ted
Kin
gdom
RO
WO
WR
OA
MA
MAA
RO
AR
RM
OM
OA
AM
AM
RO
MO
OM
OM
AA
MRR
RM
OR
AOM
RM
OA
RR
M
OM
OAAM
ROO
AAM
RR
M
RO
WR
OW
R
RO
AAAM
AM
OA
RR
M
OA
RO
AR
RM
OA
RR
RM
OA
OAA
AM
AM
RR
MOO
AR
RM
R
R
OW
OW
R
OM
RO
AR
OA
OM
OO
MAA
MR
RM
OA
R
OW
RO
WR
OM
OM
RO
AA
MO
OM
AR
RM
OO
MAR
OA
R
R
OA
OA
R
OOA
AM
RO
AR
RM
OA
RA
RO
OW
RO
OM
WR
RM
Figure6:TimingofActionsintheUSTorquayBilaterals.Notes:Timeisonthehorizontalaxis.ForeachUSnegotiatingpartner
listedontheverticalaxis,thebottom(blue)linedisplaystheactionsrelatingtotheUStariffwhilethetop(red)linedisplaystheactionsrelating
totheforeignnegotiatingpartner’stariff.Rindicatesrequest.Oindicatesoffer.Aindicatesagreement.Mindicatesmodification.Windicates
withdrawal
24

the analogous numbers are still 1 and 3. Table 1 also reports the data on the simple counts of
offers and counteroffers for a country pair (regardless of which products were contained in the
offer). For bilaterals where a country made at least one offer, the average number of offers it
made per bilateral is 1.8, with a maximum number of 6, and conditional on a final agreement
reached between the two countries in that bilateral the analogous numbers are 2 and 6. And
the analogous numbers of requests for a country pair are an average of 1.1 (and 1.2 conditional
on a final agreement reached) and a maximum of 3. Some standard models of strategic delay
in bargaining (e.g., Admati and Perry, 1987, and Cramton, 1992) predict small numbers of
offers and counteroffers, though these models cannot be applied directly to settings of bilateral
bargaining with externalities.
Figure 6 also indicates that some US bilateral bargains sit dormant for long periods of time
and yet ultimately end in agreement. For example, as Figure 6 records, the US and Denmark
exchanged initial offers on 11/8/1950, made no modifications to their requests of or offers to each
other after that date, and reached a final agreement on 3/31/1951. Table 1 confirms that this is
also a prominent feature of Torquay bilaterals more generally: as reported there, conditional on
a final agreement being reached, on average 11.8 weeks elapse between the last offer or modified
offer made in a bilateral and the announcement of an agreement. A possible interpretation is
that the current proposals (as embodied in the latest offers on the table) contained the elements
of a final agreement, but the details of the final agreement hinged on details of other bilaterals
that had yet to be concluded. Relatedly, as Figure 6 illustrates for the US bilaterals, a number
of the initial offers were not tabled until midway through the round, possibly reflecting issues
of sequencing across bilaterals. These features suggest multilateral linkages across the bilateral
bargains. Indeed, the importance of such linkages for understanding the pattern of bargaining
at Torquay was emphasized in various accounts at the time.17
Finally, as Figure 6 illustrates for the US bilaterals and as Table 1 confirms for the Torquay
bilaterals generally, there are a number of agreements that are themselves modified late in the
round (AM): Table 1 reports that for the average agreement, modifications will apply to 3.5%
of the total number of products on which initial agreement was reached.18 One interpretation of
17For example, in its October 2 coverage of the opening of the Torquay Round negotiations, The New YorkTimes (1950a) observed: “There is always a tendency in these meetings for delegations to delay negotiationsuntil they get some inkling as to how bigger ones are going...”18Because modifications of agreements can include both the withdrawal of previously agreed tariff cuts and
the addition of new tariff cuts, the fraction of goods for which agreement was later modified can rise to morethan 100% of the goods in the original agreement.
25

these modifications is that they reflect the kinds of adjustments that stage-4 of the Torquay Pro-
tocol anticipated might be necessary as information became available about other agreements
that were concluded in the round. Again this points to important multilateral dimensions of
the bargaining, whereby large numbers of separate bilateral bargains, each with small numbers
of moves, were linked together into an interrelated fabric.
Stylized Fact 2: Once the initial proposals were on the table, the focus of bargaining narrowed
to each country’s own-tariff-cut offers, and countries responded to imbalances in the outstanding
offers primarily by adjusting their own offers rather than by adjusting the requests they had made
of their bargaining partners.
Figure 6 depicts an additional interesting pattern reflected in the US bilaterals: once initial
requests and offers (and hence the initial proposals) have been exchanged between the US
and its bargaining partners and the bilateral bargaining stage of the Torquay Round begins,
virtually all the back-and-forth occurs on offers rather than requests. That is, the US and its
bargaining partners chose overwhelmingly (in fact, with only one exception) to make counter-
proposals by modifying their own-tariff-cut offers rather than by reissuing or modifying the
tariff-cut requests they made of their bargaining partners. This, too, is a general feature of the
bilaterals at Torquay: when a country made a counter-proposal at Torquay, 82% of the time
it did so by modifying its own-tariff-cut offers, not by modifying the tariff-cut requests it was
asking of its bargaining partner.
Stylized Fact 3: While the tariff requests that a country receives and the offers it makes on
a given product as a seller of market access seem to conform with what might be expected on
the basis of the principal supplier rule, the tariff requests that a country makes and the offers
it receives on a given product as a buyer of market access appear to be more narrowly focused
than principal supplier considerations alone would warrant.
Table 2 details the number of products covered in negotiations for a country’s own tariff
cuts (that is, where the country is a “seller”of market access, recorded as “Sales” in the top
panel of Table 2) and the tariff cuts of its bargaining partner (that is, where the country is a
“buyer”of market access, recorded as “Purchases”in the bottom panel of Table 2). The first
column reports statistics on the unique number of products sold and purchased at Torquay
(for example, a unique sale corresponds to a selling-country-and-product identifier, while a
unique purchase corresponds to a buying-country-and-product identifier), the second column
26

reports statistics on the total number of product-negotiating-partner-pairs (corresponding to a
selling-country-and-buying—country-and-product identifier), and the third column reports the
ratio “Total/Unique,”which provides a measure of the average number of bargaining partners
per product.19 The fourth through seventh columns of Table 2 report summary statistics by
negotiating partner on the number of products over which they bargained.20
Focusing on the third column of Table 2, we may conclude from the first and third rows of
the top panel that on average the own-tariff requests received by an importing country selling
market access at Torquay and the own-tariff offers made by that country reflect a high degree of
concentration across the exporting countries (i.e., the buyers) with which it bargains, with on
average 1.25 to 1.3 exporting countries bargaining with an importing country to purchase the
importing country’s tariff cut on a given product. Under the assumption that the larger export
suppliers of a product into a market are the suppliers usually involved in the bargaining over
access to the market for that product, this in turn implies that typically it is the largest 1 or
2 export suppliers into a market on a given product that are engaged in negotiations with the
importing country over the tariff in that market, consistent with the sellers of market access at
Torquay operating on the basis of the principal supplier rule.21 But the bottom panel of Table
2 seems to tell a different story when it comes to the behavior of buyers of market access. In
particular, it would be natural to expect that if an exporting country is a principal supplier of
a product to one importing country, it is likely to be a principal supplier of that product to
many importing countries. And yet, the first and third rows of the bottom panel in Table 3
indicate that on average an exporting country buying market access at Torquay bargains with
19Two of the Table 2 entries for “Total/Unique” are less than one, namely the Sales entries correspondingto offers and final concessions with requests. A value less than one for these entries is possible, because for“Unique”these entries represent the number of offers (or final concessions) to any country with a request fromany country, whereas for “Total”these entries represent the number of offers (or final concessions) to a countrythat responded to a request from that country, hence it is possible that the former will be greater than the later.20Across the Sales and Purchases numbers reported in Table 2, only the “Unique” and “Total/Unique”
columns differ. A Unique sale occurs each time some country sells an HS6 tariff cut to at least one buyer,while a Unique purchase occurs each time some country buys an HS6 tariff cut from at least one seller. TheUnique number for Sales will therefore differ from the Unique number for Purchases if sellers sell the same HS6product-level tariff cut to multiple buyers and/or if buyers purchase the same HS6 product-level tariff cut frommultiple sellers. All other columns in Table 2 have identical entries between Sales and Purchases because Table2 includes all participating countries at Torquay and all sales are also purchases. We will later present data forsub-sets of countries where Sales and Purchases numbers generally differ across all columns, so for consistencyacross tables we include all columns even when some are redundant.21As noted in section 3, detailed trade statistics were exchanged among the participating countries at Torquay,
and we are assembling the relevant documents in electronic form. Once assembled and concorded, this datacan be used to assess principal supplier status, but this is a major undertaking that is beyond the scope of thecurrent paper.
27

just 1.5 to 2 importing countries over tariff cuts for its exporters of a given product. It therefore
appears unlikely that buyers of market access exploit the full range of their principal supplier
status across markets, and therefore likely that something beyond principal supplier status is
limiting the cross-country scope of tariff bargaining efforts at Torquay.
Table 3 provides further evidence on this point. This table shows that, for both Sales (i.e.,
for requests and offers that refer to a country’s own tariffs) and Purchases (i.e., for requests
and offers that refer to the tariffs of the country’s bargaining partners), the modal product was
under negotiation with only one partner. At the same time, Table 3 indicates that a significant
number of products were at play with multiple numbers of negotiating partners, indicating
important direct linkages across negotiations. The left panel indicates that, of the products
on which an importing country selling market access received a request, it received a request
from only one exporting country on 76% of these products but received requests from more
than three exporting countries on only 2% of these products. Similarly, of the products on
which the importing country made an offer, it made the offer to only one exporting country
on 79% of these products but made the offer to more than three exporting countries on only
1% of these products, with the corresponding percentages for successful offers being 84% and
0.2% respectively. Turning to the right panel of Table 3 we see that, of the products on which
an exporting country buying market access made a request, it made its request of only one
importing country on 56% of these products and made requests of more than three importing
countries on 12% of these products. Similarly, of the products on which the exporting country
received an offer, it received the offer from only one importing country on 69% of these products
and received an offer from more than three importing countries on 5% of these products, with
the corresponding percentages for successful offers being 73% and 4% respectively.
What we have described just above is a rightward shift of the distribution depicted in Table
3 between the left (Sales, own-tariff) and right (Purchases, partner-tariff) panels, as would be
expected if a principal supplier of a product in one foreign market is a principal supplier of
that product in many foreign markets. But what is surprising is how small this rightward shift
is, again indicating that something beyond principal supplier status seems to be limiting the
cross-country scope of tariff bargaining efforts at Torquay.
Stylized Fact 4: Substantial numbers of offers are made that were not requested by the country
to which the offer is extended. In significant numbers of cases, these offers are made without a
request from any bargaining partner.
28

Returning to Table 2, we see from the top panel that sellers of market access entertained
requests for tariff cuts on 29, 421 unique products at Torquay and offered tariff cuts on 15, 703
unique products, 11, 080 of which correspond to products that were requested by some bar-
gaining partner, and 4, 623 of which correspond to products that were not requested by any
bargaining partner. And from the bottom panel of Table 2, we see that buyers of market access
requested tariff cuts from their bargaining partners on 18, 899 unique products and received of-
fers on 12, 785 products, 9, 231 of which corresponded to products that they had requested, and
3, 554 of which corresponded to products that they had not requested. Moreover, of the 19, 584
total initial product-level offers that countries made across their bargaining partners, 10, 453
of these were made to bargaining partners on products which those bargaining partners had
requested, while the remaining 9, 131 of these were made to bargaining partners on products
which those bargaining partners had not requested.
In the end, as Table 2 reveals, in their role as sellers of market access, countries successfully
sold at Torquay 11, 129 of the 15, 703 unique product-level tariff cuts that they had offered,
while in their role as buyers of market access countries requested 18, 899 unique product-level
tariff cuts and successfully purchased 9, 074 (with the difference between successful sales and
successful purchases of unique product-level tariff cuts reflecting the extent of sales of the same
product-level tariff cut to multiple buyers and the extent of purchases of the same product-level
tariff cut from multiple sellers). Most, but not all, products that reached a final agreement
were initially requested by some buyer: 28.5% of the unique product level agreed tariff cuts
that were sold at Torquay were not requested by any buyer, while 20.5% of the unique product
level agreed tariff cuts bought at Torquay were not requested of any seller.
Stylized Fact 5: (a) Offers for given import products were rarely deepened over the course of
the negotiations; instead, adjustments typically involved a country “shopping around”its initial
tariff-cut offers and ultimately reducing as necessary the depth of its overall (multilateral) offer.
(b) In addition, when a country chose to reduce the depth of its offers, it did so with adjustments
on the “extensive margin” (i.e., by removing products from its offers), not on the “intensive
margin”(i.e., by raising the level of the tariff cut offered).
Table 4 describes the magnitude of the tariff concessions requested and offered at Torquay
for Sales (i.e., for requests and offers that refer to a country’s own tariffs) and Purchases (i.e., for
requests and offers that refer to the tariffs of one’s bargaining partners). The top three rows of
Table 4 report statistics by product-negotiating partner pairs (and hence, with all participating
29

Torquay countries represented in Table 4 the Sales and Purchases numbers are identical), and
describe the evolution of tariff concessions from initial requests to finalized agreed concession,
all normalized relative to the pre-existing tariff. As the top three rows reveal, the average tariff
cuts initially requested of a country by its bargaining partners would have reduced the tariffs
on which requests were made to 55.1% of their existing levels, the average tariff cuts initially
offered by the country to its bargaining partners would have reduced the tariffs on which offers
were made to 82.2% of their existing levels, and the final tariff concessions agreed to by the
country on average reduced these tariffs to 80.9% of their existing levels. A striking feature
implied by these last two numbers is the apparent lack of significant deepening of offers within
a product-negotiating partner pair between the initial tariff cut offered and the final tariff cut
agreed (a downward movement of less than 2%, not two percentage points).
The bottom three rows of Table 4 report analogous statistics, but focus only on the sellers of
market access and do not condition on the country making the request of or receiving the offer
from the seller. These rows describe the evolution of tariff concessions from initial requests
to the last offer made (regardless of whether the tariff offer made it into a finalized agreed
concession), again all normalized relative to the pre-existing tariff.22 The bottom two rows of
the table confirm that sellers of market access at Torquay engaged in very little deepening of
their product level tariff offers between the earliest offer they made on that product (to any
bargaining partner) and the last offer they made on that product (to any bargaining partner)
prior to the round’s conclusion.23
22The drop in the numbers of final offers over existing tariffs as compared to initial offers over existingtariffs in the bottom two rows of Table 4 reflects missing data for existing tariffs associated with some finaloffers. Inferring existing tariffs from the existing tariffs recorded in previous offers is imperfect due to tariff-lineaggregation issues, but filling in the missing data in this way does not change the numbers reported in Table 4(or the analogous Tables 7 or 8) in any substantial way.23The standard deviations in Table 4 are fairly substantial, but we believe that this is largely driven by outliers
associated with the maximum values listed in the table, which are themselves explained by our aggregation tothe HS6 level. As one illustrative example, in the US-German bilateral, the initial US offer made on 10/16/1950for “Nail, barbers’ and animal clippers, and blades: valued at more than $1.75 per dozen,” which falls intoHS6 851020, was to bind its tariff at a 10% ad valorem level, and this same tariff level was included in its finaloffer dated 3/21/1951. But the US subsequently modified its final offer to Germany on 3/31/51, and in thatmodification it (a) maintained its offer of a 10% ad valorem tariff on “Nail, barbers’and animal clippers, andblades: valued at more than $1.75 per dozen,”but also added (b) an offer to bind its tariff on “Nail, barbers’and animal clippers: valued not over 50 cents per dozen”at the level of 1.75% ad valorem and (c) an offer tobind its tariff on “Nail, barbers’and animal clippers: valued over 50 cents but not over $1.75 per dozen” atthe level of 7.5% ad valorem, and both of these product categories also fall into HS6 851020. Hence, in thiscase our HS6 measure would indicate substantial intensive margin movement of the HS6 851020 tariff betweenthe initial US offer and the (modified) final US tariff, when in fact at the 10 digit product level only extensivemargin movements occurred.
30

Finally, we return to Table 2 and now focus on the fourth row of the Sales and Purchases
panels, which describe the degree of adjustments to offers at the extensive margin over the
course of the Torquay Round.24 After the initial offer and prior to a final agreement, sellers
of market access modified 1, 292 of their 15, 703 unique product-level offers (or roughly 8% of
the products on which an initial offer was made), while buyers of market access modified 1, 313
of their 12, 785 unique product-level offers (or roughly 10% of the products on which an initial
offer was made).
Together these tables indicate that the most important dimension for negotiations was on
the extensive margin, that is dropping and/or adding products from the negotiation, whereas
there was minimal adjustment taking place on the intensive margin, that is, in the size of
the tariff cuts being offered on any particular product. And as Table 2 records, roughly 71%
of the unique product-level offers made it into final concessions at Torquay, indicating that
these extensive margin adjustments appear to represent the “shopping around”of a fixed set
of offers across bargaining partners which ultimately led to an extensive-margin adjustment in
the overall depth of successful offers through the removal of products.25
Figure 7 illustrates the extensive margin movement in one detailed example, the US-Italy
bilateral. Each colored line corresponds to one product. The x-axis represents time. As time
goes by, the US modifies its offer by adding and removing products. Similarly, Italy’s final offer
to the US removes many products from its initial offer, while adding a handful. Revisiting the
detailed example (the US bilaterals on lawn mowers) contained in Figure 2 illustrates the lack
of intensive margin adjustment there, as embodied in the horizontal lines that connect each
offer (O) that ends in agreement (A).
Stylized Fact 6: There is substantial two-way bargaining within narrow product categories,
and significant numbers of these two-way bargains occur within a single bilateral.
In Table 5 we present information on the degree of “two-way” exchanges of tariff cuts
for similar products. The countries participating at Torquay were both fielding and seeking
24As the second rows of the top and bottom panels of Table 2 indicate, after the initial request and prior tofinal agreement, sellers of market access faced modified requests on approximately 7% of the unique products onwhich they received initial requests, and buyers of market access modified their requests on approximately 11%of the products for which they made initial requests. But virtually all of these request modifications occurredprior to the exchange of initial offers and the beginning of bilateral bargaining, which is why we do not emphasizethe extensive margin adjustment of requests in the text.25The 71% “success rate”of offers reflects both extensive-margin adjustments to proposals that were made
over the course of the bargaining and that are documented in Table 2 and the implications of failed bargains.
31

25-Oct-1950 01-Jan-1951 15-Mar-1951 30-Mar-1951O AO AO AO AO AO AO AO AO AO AO AO AO AO AO AO AO OWO OWO OWO OWO OWO OWO OWO OWO OWO OWO OWO OWO OW
O AO AO AO AO AO AO A
AAAAA
O OM OM A
US Offers
28-Oct-1950 30-Mar-1951O AO AO AO AO AO AO AO AO OWO OWO OWO OWO OWO OWO OWO OWO OWO OWO OWO OWO OWO OWO OWO OWO OWO OWO OWO OWO OWO OWO OWO OWO OWO OWO OWO OWO OWO OWO OWO OWO OW
AAAAAA
O A
Italy Offers
Figure 7: Extensive margin adjustments in US negotiations with Italy.Notes: Each colored line corresponds to one product. The horizontal axis represents time. O indicates offer. A
indicates agreement. M indicates modification. W indicates withdrawal.
requests for tariff cuts on the same product category for 6, 688 products, they made offers on
4, 534 products for which they had also made a request, and they received offers on 4, 745
products on which they had also received a request, with 2, 391 of these two-way exchanges
occurring within the same bilateral. Hence, for roughly a quarter of the products on which the
participating countries at Torquay received requests or made offers, they were simultaneously
making requests of their trading partners and receiving offers on those same products, and a
third of these involved two-way exchanges within the same bilateral.
6. Interpreting Tariff Bargaining at Torquay
Our examination of the Torquay Round bargaining records yields a set of stylized facts that
can help guide modeling efforts aimed at settings characterized by bilateral bargaining with
externalities. Here we emphasize a number of these stylized facts that lend support to two
features that are seen by GATT practitioners and legal scholars as hallmarks of the tariff
bargaining that occurred in the early GATT rounds. A first feature is the surprising lack of
strategic behaviors such as lowball initial offers among the participating governments. A second
feature is the presence of an important multilateral element to the bilateral bargains.
32

Surveying the bargaining techniques used by countries over the first 5 GATT rounds of
request-offer tariff negotiations, Curzon (1966) comments on the lack of strategic behavior
among GATT contracting parties:
...Their requests cannot be higher than their offers and negotiations start from this
maximum position: if all requests are granted all the offers will be fulfilled. Similarly all
other contracting parties are likely to make offers which match the requests they have
made. As some of the requests are rejected, some of the offers are withdrawn. This
procedure has been raised to a Gatt principle and is not laid down by any rule. It is a
convention but one which creates a much better negotiating climate than the opposite
trend which was a feature of the classical bilateral negotiations. Then, everyone put
forward very low offers with the intention of increasing gradually if the bargaining proved
profitable. A country never knew, however, when it had reached the maximum its partner
was willing to concede. (p. 74)
The lack of strategic behavior described by Curzon is supported by our findings that offers of
tariff cuts for given import products were rarely deepened over the course of the negotiations
(Stylized Fact 5a), and that once the initial proposals were on the table the focus of bargaining
narrowed to each country’s own-tariff-cut offers, with countries “shopping around”their initial
tariff-cut offers and responding to imbalances in the outstanding offers by adjusting their own
offers rather than reissuing or modifying the tariff-cut requests they were making of their
bargaining partners (Stylized Fact 2).
And while GATT tariff negotiations occurred bilaterally, GATT practitioners place great
emphasis on the role that GATT played in allowing countries to relax their need for strict
bilateral reciprocity (“balance”) in negotiations and focus instead on achieving reciprocity on
a multilateral basis. As one early GATT report put it (see also Curzon, 1966, pp. 75-77):
Multilateral tariff bargaining, as devised at the London Session of the Preparatory
Committee in October 1946 and as worked out in practice at Geneva and Annecy, is
one of the most remarkable developments in economic relations between nations that has
occurred in our time. It has produced a technique whereby governments, in determining
the concessions they are prepared to offer, are able to take into account the indirect
benefits they may expect to gain as a result of simultaneous negotiations between other
33

countries, and whereby world tariffs may be scaled down within a remarkably short time.
... The multilateral character of the Agreement enabled the negotiators to offer more
extensive concessions than they might have been prepared to grant if the concessions
were to be incorporated in separate bilateral agreements. Before the Geneva negotiations
a country would have aimed at striking a balance between the concessions granted to
another country and the direct concessions obtained from it without taking into account
indirect benefits which might accrue from other prospective trade agreements; it might
even have been unwilling to grant an important concession if it had been obliged to extend
that concession to third countries without compensation. (ICITO, 1949, p. 10)
In effect, the ICITO report claims that GATT rounds made it possible for governments to
exchange externalities across bilaterals in a balanced way that allowed them to maintain multi-
lateral reciprocity. An important multilateral element to the bilateral bargains is suggested by
our finding that, while the numbers of back-and-forth offers in any bilateral bargain are small,
for some bargains the initial offers sit dormant for long periods of time and are then finalized
with a single modification at the time that other bargains are concluded (Stylized Fact 1).
In this section we augment the basic framework developed in section 2 with additional
institutional structure, and through this lens we suggest an interpretation of the core bargain-
ing features emphasized above. In particular, we argue that these core features are broadly
consistent with what would be expected according to our framework, if governments make
dominant-strategy proposals that adhere strictly to the twin institutional constraints of MFN
and multilateral reciprocity.26
6.1. Tariff Bargaining under Reciprocity and MFN
Reciprocity and MFN are widely viewed as pillars of the GATT/WTO architecture. Here we
focus on the implications of reciprocity and MFN for tariff bargaining and thus the GATT
bargaining data, and we show that these institutional constraints can dramatically simplify the
tariff bargaining problem. First, building on the two-country model in section 2, we describe
how strict adherence to reciprocity simplifies strategic considerations and results in a dominant
bargaining strategy. Second, building on the multi-country version of the model in section 2, we
confirm as well that strict adherence to reciprocity and MFN neutralizes third-party externali-
ties. But we also point out a potential cost: if GATT bargaining partners are asymmetric in a26Bagwell and Staiger (2016a) develop the formal foundations for this view.
34

sense described below, then strict adherence to reciprocity and MFN also prevents governments
from reaching the effi ciency frontier. Finally, we examine the relationship between bilateral and
multilateral reciprocity when MFN is satisfied.
Reciprocity We start with a review of the basic properties of reciprocity. For this purpose
we again paraphrase the treatment in Bagwell and Staiger (2010a), and refer readers there for
details. The GATT/WTO principle of reciprocity refers to the ideal of mutual changes in trade
policy which bring about changes in the volume of each country’s imports that are equal in
magnitude to the changes in the volume of its exports. The notion of reciprocity arises in two
places in GATT. First, as we noted in section 3, governments seek a “balance of concessions”
as a norm of negotiations, so that there is a rough equivalence between the market access value
of the tariff cuts offered by one government and the concessions won from its trading partners.
Second, when a government seeks to renegotiate, modify or withdraw a previous concession
as an original action, GATT Article XXVIII permits affected trading partners to withdraw
“substantially equivalent concessions,”and thereby to retaliate in a reciprocal manner. Hence,
GATT’s reciprocity principle describes a fixed terms-of-exchange rule (applied to increases and
decreases) for negotiated market access, and fixes the terms of exchange at one-for-one.27
Continuing with the two-country model developed in section 2, we now state a formal
definition of reciprocity. Suppose that, beginning from an initial pair of tariffs, (τ 0, τ ∗0), a tariff
negotiation results in a change to a new pair of tariffs, (τ 1, τ ∗1). Denoting the initial world and
domestic local prices as p̃w0 ≡ p̃w(τ 0, τ ∗0) and p0 ≡ p(τ 0, p̃w0), and the new world and domestic
local prices as p̃w1 ≡ p̃w(τ 1, τ ∗1) and p1 ≡ p(τ 1, p̃w1), we say that the tariff changes conform to
the principle of reciprocity provided that
p̃w0[M(p1, p̃w1)−M(p0, p̃w0)] = [E(p1, p̃w1)− E(p0, p̃w0)], (6.1)
where changes in trade volumes are valued at the existing world price. We next use the domestic
balanced trade condition in (2.1) to establish that (6.1) may be rewritten as
[p̃w1 − p̃w0]M(p1, p̃w1) = 0. (6.2)27The adding-up constraint imposed by market clearing makes a one-for-one terms of exchange inevitable
as long as governments are committed to adopting a common terms of exchange for market access applieduniformly across all governments. See Bagwell and Staiger (2016b) for elaboration on this point. We note alsothat the application of GATT’s reciprocity principle in circumstances where a government modifies or withdrawsa previous concession extends beyond Article XXVIII to include the case of temporary safeguard measures underGATT Article XIX and responses to nullification or impairment under GATT Article XXIII. For shorthand wecontinue to refer only to GATT Article XXVIII in the text.
35

According to (6.2), reciprocity can be given a simple and striking characterization: mutual
changes in trade policy conform to the principle of reciprocity if and only if they leave the world
price unchanged. With this characterization in hand, we next consider how strict adherence to
reciprocity simplifies the complexity of the bargaining problem.
We examine an illustrative model. Let us take the pre-negotiation tariff pair as exogenous,
with the Nash tariffs being the natural candidate. The initial tariff pair fixes a particular
iso-world-price line, where as we illustrate below any such line is upward sloping in a graph
with tariffs on the axes. Following Bagwell and Staiger (1999), governments simultaneously
make tariff proposals, where any such proposal conforms to reciprocity and thus specifies a
tariff pair (τ , τ ∗) that lies along the fixed iso-world-price line. If the proposals agree, then
the common proposal is implemented; otherwise, the proposal with the higher tariff pair (i.e.,
the lowest trade volume) is implemented. This model clearly captures the reciprocal nature of
tariff liberalization negotiations in GATT; in addition, the structure of the game captures in
a short-hand way the potential for renegotiation under GATT Article XXVIII, since neither
government can be forced to import a volume greater than implied by its proposal.28
As established by Bagwell and Staiger (1999), strict adherence to reciprocity ensures that
it is a dominant strategy for each government to propose the tariff pair that if implemented
would deliver its preferred trade volume along the given iso-world-price line. Indeed, once the
iso-world-price line is fixed, this conclusion holds whether or not a government has private
information about its preferred local price. In this sense, strict adherence to reciprocity can
induce governments to truthfully reveal their “politically optimal reaction curves”(as defined in
section 2). The key features of the argument are illustrated in Figure 8 (which is an adaptation
of Figure 4 in Bagwell and Staiger, 1999).
In the symmetric case, defined as when the Nash trade war leaves countries facing the same
terms of trade as would prevail at their politically optimal tariffs, strict adherence to reciprocity
leads to an effi cient outcome. To develop this point, we refer to Figure 8, which depicts τ on
28Under GATT Article XXVIII, if a negotiated tariff pair induces more trade volume than one governmentdesires given the world price, then that government could raise its tariff, knowing that the other governmentwould respond in reciprocal fashion. Our model captures this possibility in a short-hand way, by assuming thatthe proposal with the highest tariff pair is ultimately implemented. For more on the trade-effects interpretationof reciprocity in GATT/WTO practice in line with our discussion above, see Hoda (2001) and the AppellateBody Opinion in WTO (2004). Limao (2006, 2007) and Karacaovali and Limao (2008) provide empiricalevidence that actual tariff bargaining outcomes in the GATT/WTO conform to a reciprocity norm. See also USInternational Chamber of Commerce (1955) for particular evidence on the importance of the reciprocity normfor the results of the Torquay Round.
36

the vertical axis and τ ∗ on the horizontal axis.
W *
W
PO
E
E
W
B
B'
)(Bpw
N
)(Apw
N
W *
Wp*
* 0
Wp 0
A
A'
*
)(AN
)(CN
)(BN
''A
W
w
PO
w
N pCp )(
Figure 8: Reciprocity and Politically Optimal Reaction Curves
The symmetric case is illustrated by the Nash point labeled N(C), which lies on the same iso-
world-price locus as does the politically optimal point, which is labeled PO and lies below N(C).
In Figure 8 we label as pwN(C) = pwPO the iso-world-price locus passing through both N(C) and
PO. As reciprocity fixes the world price, the two governments bargain along the iso-world-price
locus pwN(C) = pwPO. The only dimension on which the governments negotiate is the volume
of trade to be exchanged at the fixed world price (and trade volume is increasing as we move
downward along the locus pwN(C) = pwPO). At this fixed world price, the domestic government’s
desired trade volume is determined where its politically optimal reaction curve (labeled asWp =
0) intersects the iso-world-price locus pwN(C) = pwPO; and similarly the foreign government’s
desired trade volume is determined where its politically optimal reaction curve (labeled as
W ∗p∗ = 0) intersects the iso-world-price locus p
wN(C) = pwPO. In the symmetric case, these two
points of intersection correspond to the single point which defines the political optimum (the
37

point PO). Hence, according to Figure 8, the governments would agree on the desired volume of
trade. Since it is a dominant strategy for each government in our game to propose the tariffpair
that delivers its desired trade volume (i.e., to truthfully reveal its politically optimal reaction
curve), the outcome of the bargaining game is the politically optimal tariff pair. Thus, in the
symmetric case, strict adherence to reciprocity ensures that the bargaining outcome yields an
effi cient outcome corresponding to the political optimum.
Now consider an asymmetric environment. Let us begin with point N(A). As in the symmet-
ric case, the fact that reciprocity fixes the world price implies that the two governments bargain
along the iso-world-price locus passing through N(A), which we label pwN(A). At this fixed world
price, the domestic government’s desired trade volume is determined where its politically opti-
mal reaction curve Wp = 0 intersects the iso-world-price locus pwN(A); and similarly the foreign
government’s desired trade volume is determined where its politically optimal reaction curve
W ∗p∗ = 0 intersects the iso-world-price locus p
wN(A). But the two governments no longer agree
on the desired volume of trade; the foreign government’s desired trade volume (labeled as A′)
is less than the desired trade volume of the domestic government (labeled A′′). In practice, this
is where Article XXVIII comes in: any bargain that leaves the governments on a point along
the iso-world-price locus pwN(A) and which is below A′will be renegotiated at the request of the
foreign government up to the point A′. In terms of our game, it is a dominant strategy for each
government to propose the tariff pair that delivers its desired trade volume (i.e., to truthfully
reveal its politically optimal reaction curve), and so the outcome of the bargaining process is
the point A′. If GATT bargaining partners are asymmetric in the sense that we have described
above, then the strict adherence to reciprocity that is necessary for this result will itself prevent
governments from reaching the effi ciency frontier (labeled EE in Figure 8).29
Reciprocity with MFN We next consider MFN, and describe how reciprocity and MFN
together can neutralize bargaining externalities across bargaining pairs. To develop this point,
we build on the three-country version of the model in section 2. For this purpose we once again
paraphrase the treatment in Bagwell and Staiger (2010a), and refer readers there for details.
29Indeed, as the discussion in US International Chamber of Commerce (1955, p. 33) well illustrates, the issueof asymmetries between “high-tariff”and “low-tariff”countries was increasingly emphasized as an impedimentto further negotiations with each passing GATT round. If governments have private information about theirpolitical preferences, then similar conclusions hold with respect to the ex post effi ciency of bargaining outcomes,where the symmetric case then corresponds to the situation in which the pre-negotiation tariff pair lies alongthe same iso-welfare-price line as the ex post politically optimal tariffs.
38

Consider the case where foreign-country 2 is not involved in the negotiations and keeps
its tariff unaltered. In the presence of MFN, the domestic government and the government
of foreign-country 1 can still negotiate a reciprocal reduction in their tariffs τ and τ ∗1 which
leaves the terms of trade p̃w(τ , τ ∗1, τ ∗2) unaltered but reduces p while raising p∗1, and which
therefore provides these two countries with greater trade volume. But recall now that in foreign-
country 2 we have the relationship p∗2 = pw/τ ∗2. It follows that, with τ ∗2 held fixed, if the
negotiation between the domestic country and foreign-country 1 abides by MFN (so that a
single equilibrium world price p̃w prevails) and reciprocity (so that p̃w is unaltered) then p∗2 and
thereforeW ∗2(p∗2, p̃w) and foreign-country 2’s trade volume are unaltered by these negotiations
as well. In abiding by the principles of MFN and reciprocity, the domestic government and
the government of foreign-country 1 have thus engineered a bilateral tariff bargain without
third-country spillovers.30
Intuitively, the reciprocity principle balances two opposing third-party externalities that
are present in bilateral MFN tariff bargaining: a negative externality on third parties arises
when foreign-country 1 cuts its tariff on imports of good y in a bilateral bargain with the home
country, and the externality is transmitted to competing importers of good y (foreign-country
2); at the same time, a positive third-party externality arises when the home country cuts its
tariff on imports of good x in a bilateral bargain with foreign-country 1 and is transmitted to
competing exporters of good x (foreign-country 2). If the home country and foreign-country 1
engage in a bilateral MFN tariffbargain that cuts the tariff of foreign-country 1 and the tariff of
the home country in a way that just balances these two opposing third-party externalities, they
can then neutralize the third-party externality of their bilateral tariff bargain. This balance is
precisely what GATT’s principle of reciprocity achieves in a multi-country MFN world.
In this general manner, reciprocity and MFN together can neutralize bargaining external-
ities across bargaining pairs, while at the same time eliminating strategic considerations and
generating dominant strategy selections for governments, thereby converting a strategically
complex multilateral bargaining problem into a comparatively straightforward collection of bi-
lateral bargains, where each bilateral bargain is reminiscent of the situation depicted in Figure
8. In the presence of these institutional constraints, a country would offer for a given import
good the tariff that generated its preferred trade volume for a fixed terms of trade (say, for the
home country an offer of the level of τ associated with the point A′′in Figure 8), and would
30These and related points are developed in Bagwell and Staiger (2005, 2010b).
39

match this offer with a request that its bargaining partner reciprocate (a request that the for-
eign country set τ ∗ at the level associated with the point A′′in Figure 8), with the expectation
that an unfilled request (if, say, the foreign country offered a level of τ ∗ and requested a level of
τ associated with the point A′in Figure 8) would lead to a reduction in the depth of its offer
(and a final agreement at the tariffs corresponding to the point A′in Figure 8).
Through the lens of the terms-of-trade theory therefore, MFN and reciprocity can be inter-
preted as the key GATT institutional features that made the convention described in the Curzon
quote above a dominant bargaining strategy for the participating countries at Torquay. Still,
as we have pointed out, if GATT bargaining partners are asymmetric, then the strict adherence
to reciprocity and MFN that is necessary for these results will itself prevent governments from
reaching the effi ciency frontier. From this perspective, the twin pillars of reciprocity and MFN
may be seen as providing governments with a pragmatic solution to what might otherwise have
been an insurmountably complicated bargaining problem.31
Multilateral Reciprocity We now illustrate and examine the distinction between bilateral
and multilateral reciprocity. As we noted above and describe further in section 7, this distinc-
tion was emphasized in GATT writings at the time of the early rounds. After defining and
illustrating multilateral reciprocity, we specify a multilateral bargaining setting and argue that
each country again proposes for itself a tariffthat corresponds to its politically-optimal-reaction-
curve tariff when countries use dominant strategies, provided that tariff proposals satisfy MFN
as well as multilateral - but not necessarily bilateral - reciprocity.32
We begin by illustrating how bilateral reciprocity could fail and yet multilateral reciprocity
could hold. For this purpose we consider a four-country extension —the domestic country and
three foreign trading partners ∗1, ∗2 and ∗3 —of the model described in section 2. In line withour earlier discussion, we assume that the equilibrium world price is decreasing in the domestic-
country tariff and increasing in each of the foreign-country tariffs: p̃w ≡ p̃w((−)τ ,
(+)
τ ∗1,(+)
τ ∗2,(+)
τ ∗3).
Suppose that the domestic country were to engage in a bilateral bargain with foreign-country 1
31We have described these results in a simple 2-good model, and it remains to demonstrate that they extendto a many-good setting of the kind that would more accurately describe the GATT bargaining environment.An added benefit of the many-good extension is that it would allow an investigation into whether StylizedFact 5b could be understood from this perspective. We believe that the key features can be extended tosuch environments along the lines of Bagwell and Staiger (2002, Appendix B), but this extension remains animportant task for future research.32As we discuss below, our discussion here draws on formal analysis found in Bagwell and Staiger (2016a).
40

and foreign-country 2 but not with foreign-country 3, and suppose further that in combination
the agreed changes to τ , τ ∗1 and τ ∗2 preserve the world price at its initial level. Then foreign-
country 3 would be unaffected by these two bilaterals taken together —and thus together these
bilaterals do not give rise to a free-rider problem with respect to foreign-country 3 —whether
the domestic country “splits”its tariff cut across the two bilaterals in a way that matches their
tariff cuts and maintains bilateral reciprocity in each bilateral bargain, or rather allocates its
tariff cut unevenly across the two bilaterals in a way that violates bilateral reciprocity with
each bargaining partner but nevertheless satisfies multilateral reciprocity and hence preserves
the world price once all of the agreed tariff changes in the two bilaterals are viewed in combina-
tion.33 Either way, both foreign-country 1 and foreign-country 2 experience an equal increase
in the volume of their exports and imports once each takes account of the indirect trade effects
associated with the tariff changes negotiated in the other bilateral.
Bagwell and Staiger (2016a) provide a formal analysis of dominant-strategy arguments in
the multi-country setting. For a three-country general equilibrium model (with one domestic
country and two foreign countries), they consider a game in which the three countries take as
given the initial tariff vector and the accompanying world price, and then make simultaneous
tariff proposals. A strategy for each country is a proposal concerning its own tariff and that
of its trading partner(s), where a proposal must satisfy MFN and multilateral reciprocity (i.e.,
if accepted, the proposed tariffs would maintain the initial world price). Since the foreign
countries do not trade with one another, a proposal from a foreign country leaves the tariff of
the other foreign country at its initial value. As in the two-country model above, each country’s
proposal is associated with an “implied import volume” for itself. Bagwell and Staiger then
construct a simple mechanism that takes the three proposals and assigns a vector of tariffs.
The tariff vector comprised of each country’s own-tariff proposal is assigned if the proposals
agree.34 If the proposals do not agree, the constructed mechanism assigns a vector of tariffs
that maximizes the value of trade volume subject to maintaining the initial world price and not
forcing any country to import a volume in excess of its implied import volume.35
33As Beckett (1941, p. 23) describes, a so-called “split concession”procedure analogous to what we describein the text was often utilized by the US in order to maintain bilateral reciprocity in its sequential bilateral tariffbargains under the Reciprocal Trade Agreements Act that predated GATT.34Specifically, agreement occurs when the tariff vector constructed from each country’s proposal for its own
tariff maintains the initial world price. Each country would then regard this “agreement tariff”as equivalent toits proposed tariff vector.35This requirement delivers a unique tariff vector assignment when the value of the domestic country’s implied
import volume weakly exceeds the aggregate value of the foreign countries’ implied import volumes. If the
41

For the constructed mechanism, if countries use dominant strategies, Bagwell and Staiger
(2016a) show that each country’s proposal must specify a tariff for itself that delivers its pre-
ferred trade volume, given the initial world price. As the four-country illustration above sug-
gests, a novel feature of the multi-country setting is that the domestic country now has a set of
dominant strategies. This set is defined by proposals under which the domestic country proposes
for itself the tariff that delivers its preferred trade volume given the world price and proposes
for the foreign countries any tariffs that when combined with the domestic tariff maintain the
world price and thus ensure multilateral reciprocity. Importantly, the set of dominant strategies
for the domestic country allows that its proposed tariff for itself may violate bilateral reciprocity
when paired with its proposed tariff for an individual foreign country. Finally, and as with two
countries, once the world price is fixed, dominant strategy proposals are similarly characterized
even when governments have private information about their respective preferences.
The basic arguments apply as well in a four-country setting, where foreign-country 3 does
not participate in the negotiations. Here, when negotiations must satisfy MFN and multilateral
reciprocity, (i) if the domestic country and foreign-countries 1 and 2 use dominant strategies,
then each makes a proposal that specifies its politically-optimal-reaction-curve tariff for itself,
and (ii) foreign-country 3 will be unaffected by the bilaterals (and there can be no free rider
problems as a result). As before, under dominant strategy proposals, the implemented tariff
vector is effi cient if and only if the initial world price is set at the politically optimal level.
Hence, as with bilateral reciprocity, when negotiations must satisfy MFN and multilateral
reciprocity, non-participants will be unaffected by the negotiations and it is a dominant strategy
for each participating government to propose for a given import product the tariffthat generated
its preferred trade volume for a fixed terms of trade. Under MFN and multilateral reciprocity,
a government anticipates that any subsequent “rebalancing”of offers necessary for multilateral
reciprocity would arise later in the round after all offers had been recorded and that this might
lead to a reduction in the depth of its overall (multilateral) offer.36
domestic country is on the “short”side, rationing occurs, and this requirement does not result in a unique tariffvector assignment. For this case, Bagwell and Staiger (2016a) construct the mechanism so that it randomlyselects one foreign country to have first priority. The constructed mechanism assigns tariffs such that theprioritized foreign country imports a volume equal to the minimum of its implied import volume and thevalue of the domestic country’s implied import volume, while the other foreign country imports a volumeequal to the difference between the value of the domestic country’s implied import volume and the prioritizedforeign country’s implied import volume (if that difference is positive). Similar results would obtain underother prioritization rules, including rules that give priority to a principal supplier, provided that priority is notinfluenced by foreign proposals (conditional on being in the case where the domestic country is short).36While we do not attempt structural estimation of a bargaining model in this paper, it is nevertheless
42

6.2. The UK and its Commonwealth Partners
We have shown above how MFN and reciprocity together can neutralize bargaining externalities
across bargaining pairs, and we have argued that these institutional constraints can help account
for core features of the Torquay bargaining records. And most of the tariff bargains in the
Torquay Round conformed to the MFN principle. But there were exceptions. In particular, the
UK and its Commonwealth partner countries negotiating at Torquay granted tariff preferences
to each other on a range of selected products, and hence represent an important deviation
from MFN; yet as a group these countries exhibited bargaining behaviors at Torquay which
were not atypical with respect to the stylized facts we have described.37 Here we argue that
the positive (though not the normative) features of our dominant-strategy arguments above
extend to the case where some countries grant tariff preferences to other countries, provided
that those preference margins are preserved by any proposals made in the bilateral MFN tariff
negotiations. We then present evidence that Commonwealth countries did indeed propose to
reduce their preferential tariff rates whenever they proposed to reduce their MFN tariff rates
at Torquay in a way that essentially preserved the preference margins they granted to their
Commonwealth partner countries.
We first note that this behavior was explicitly permitted (though not required) at Torquay,
as described in the following excerpt from Torquay bargaining protocol (see Hoda, 2001, pp
191-192):
...(c) In negotiations relating to any specific product with respect to which a preference
applies: (i) when a reduction is negotiated only in the most-favoured-nation rate, such
reduction shall operate automatically to reduce or eliminate the margin of preference
applicable to that product; (ii) when a reduction is negotiated only in the preferential
rate, the most-favoured-nation rate shall automatically be reduced to the extent of such
reduction; (iii) when it is agreed that reductions will be negotiated in both the most-
useful to point out that the mechanism characterized by Bagwell and Staiger (2016a) can generate outcomesconsistent with no offer modification (when countries are symmetric) or one offer modification (when countriesare asymmetric). If the framework were extended to allow for shocks (e.g., a given bilateral randomly fails), thenthe corresponding outcomes would be consistent with two or more offer modifications that require countries toswitch to other strategies within their sets of dominant strategies.37The Benelux countries were also members of a preferential trade agreement. But unlike the Commonwealth
countries, theirs was a customs union, and following arguments similar to those in Bagwell and Staiger (1999,2001) it can be shown that the dominant strategy arguments we describe above go through without modificationin the presence of a customs union.
43

favoured-nation rate and the preferential rate, the reduction in each shall be that agreed
by the parties to the negotiations; and (iv) no margin of preference shall be increased.
As the Torquay protocol specifies, proposals of MFN tariff cuts accompanied by preferential
tariff cuts that preserve the margin of preference would be covered by (ii), and by (iii) and (iv),
in the excerpted passage above.
We next return to our three-country model and suppose that the domestic country initially
imposes an MFN tariff tMFN0 on imports from foreign-country 1 and a preferential tariff tPREF0 <
tMFN0 on imports from foreign-country 2, implying an initial MFN world price p̃wMFN
0 for trade
between the domestic country and foreign-country 1 and a preferential world price p̃wPREF0 for
trade between the domestic country and foreign-country 2. The key point is that, as long as
tMFN and tPREF are non-prohibitive, we have p = τMFN p̃wMFN = τPREF p̃wPREF and hence
p̃wPREF =τMFN
τPREFp̃wMFN (6.3)
where τPREF = (1 + tPREF ) and τMFN = (1 + tMFN), implying that the relationship between
p̃wMFN and p̃wPREF is pinned down by the margin of preference [1− τPREF
τMFN ].38
Consider now the following bilateral tariff agreement between the domestic country and
foreign-country 1. Suppose that the domestic country agrees to cut its MFN tariff from tMFN0
to tMFN1 < tMFN
0 but also to cut its preferential tariff from tPREF0 to tPREF1 according toτPREF1
τPREF0=
τMFN1
τMFN0
. This would leave the margin of preference between the domestic country and
foreign-country 2, [1− τPREF1
τMFN1
] , unchanged at its initial level [1− τPREF0
τMFN0
]. If in addition foreign-
country 1 agrees to a reciprocal tariff cut of its own that holds p̃wMFN fixed, then by (6.3)
p̃wPREF would also be held fixed, and the bargaining externality on foreign-country 2 —the
preferential trade partner of the domestic country —would be neutralized, just as in the case of
a bilateral tariffbargain that satisfies reciprocity in a world where all countries conform to MFN.
From here, it is a short step to see that the positive features of our dominant-strategy arguments
above extend to the case where the domestic country has preferential trading relationships as
long as the domestic country ensures an unchanged margin of preference for its preferential
trading partner(s) under any proposals made in its reciprocal MFN tariff bargains.39
38In the case of specific tariffs tMFN and tPREF , the margin of preference is defined as [tMFN − tPREF ].39The normative features of our arguments above, namely, that bilateral bargaining subject to reciprocity
will deliver effi cient tariff outcomes in the symmetric case, are not preserved in the absence of MFN even ifpreference margins are preserved by the bargain, because the political optimum is not effi cient in the absenceof MFN (see Bagwell and Staiger, 2002).
44

Table 6 presents evidence that Commonwealth countries did indeed offer to reduce their
preferential tariff rates whenever they offered to reduce their MFN tariff rates at Torquay
in a way that essentially preserved the preference margins they offered their Commonwealth
partner countries. Each row of Table 6 corresponds to a Commonwealth country who, in its
bilateral tariff bargains at Torquay, offered MFN tariff cuts on products for which it granted
preferential tariff access to its Commonwealth partners. There were three such countries: the
UK, Australia and New Zealand. The first column of Table 6 records the existing ad valorem
and specific preference margins (averaged over the products on which a tariff preference exists),
the second column records the proposed ad valorem and specific preference margin implied by
the proposed MFN and preferential tariff offers, and the third column records the proposed
change in ad valorem and specific preference margins. As Table 6 reveals, the proposals at
Torquay were constructed in a way that essentially preserved the existing margins of tariff
preferences for Commonwealth countries, in line with what would be needed for our dominant-
strategy arguments to extend to this environment. Focusing for example on the ad valorem
preference margins, Table 6 (which reports 1 plus the ad valorem margin) indicates that, going
into Torquay, the average preference margin offered by the UK to its Commonwealth partners
on goods for which it offered a preferences was 9.1%, and its Torquay offers would have resulted
in an average preference margin of 7.7%. Similarly, the average preference margin offered by
Australia to its Commonwealth partners going into Torquay was 20.0%, and its Torquay offers
would have resulted in an average preference margin of 18.0%. And for New Zealand, the
analogous numbers are 18.8% and 17.2%.
6.3. Newcomers to GATT
As we have earlier observed, the Torquay Round was the third GATT round of tariff negotia-
tions, following on the heels of the Geneva (1947) and Annecy (1949) rounds. And as an early
GATT report describes (ICITO, 1949, p. 10), the bargaining at Torquay proceeded according
to a “new technique”that had been “devised at the London Session of the Preparatory Com-
mittee in October 1946”and “worked out in practice at Geneva and Annecy.”But six of the 37
parties negotiating at Torquay were newcomers to GATT and were negotiating their accession
there, raising the possibility that, owing to their lack of experience with the GATT bargaining
forum, these countries may have adopted different bargaining techniques when they arrived at
Torquay than those countries that had been present in Geneva and/or Annecy. Curzon (1966)
45

describes the negotiating experience of several GATT newcomers this way:
Several newcomers to GATT unaware of this new technique and starting with low
offers found that in the course of negotiations they were unable to reach the level of
requests they aimed for. Their initially low offers were taken as proof of their intentions
and they either had to go home with a tariff higher than expected or had to increase
their offers in the course of the negotiations. Others who arrived with inadequate offers or
too high a tariff found that these were not accepted and then either had to reduce tariffs
unilaterally or to wait until the next round. (p. 74)
Did the newcomers at Torquay conform to the broader GATT convention of non-strategic
behavior that our earlier quote from Curzon describes, and that is supported by Stylized Fact
5a (offers of tariff cuts for given import products were rarely deepened over the course of
the negotiations) and Stylized Fact 2 (once the initial proposals were on the table countries
responded to imbalances in the outstanding offers by adjusting their own offers rather than by
adjusting their requests)? Or did the newcomers instead arrive at Torquay prepared to behave
in a more traditionally strategic manner, as the Curzon quote just above suggests?
Tables 7 and 8 provide evidence on this question from the perspective of Stylized Fact
5a, by reporting the statistics in Table 4 split into two sub-samples. Table 7 presents data
for the subsample of the countries acceding to GATT at Torquay (Austria, Germany, Korea,
Peru, Philippines and Turkey), while Table 8 presents data for the subsample of non-acceding
countries (i.e., existing GATT member) at Torquay. As with Table 4, the top three rows of
Tables 7 and 8 report Sales (own tariff) and Purchases (bargaining partner tariff) statistics by
product-negotiating partner pairs, and describe the evolution of tariff concessions from initial
requests to finalized agreed concession, all normalized relative to the pre-existing tariff. And the
bottom three rows report analogous own-tariff statistics, but as with Table 4 these rows focus
only on the sellers of market access and do not condition on the country making the request
of or receiving the offer from the seller. These rows describe the evolution of tariff concessions
from initial requests to the last offer made (regardless of whether the tariff offer made it into a
finalized agreed concession), again all normalized relative to the pre-existing tariff.
As a comparison of the first three (Sales) columns of the second and third rows across Tables
7 and 8 reveals, for newcomers (Table 7 —acceding countries) there is substantial deepening
of own-tariff offers within a product-negotiating partner pair between the initially offered tariff
46

cut and the final agreed tariff cut, while for existing GATT members (Table 8 —non-acceding
countries) there is essentially no movement. A similar conclusion emerges from a comparison of
the fifth and sixth rows across Tables 7 and 8: for newcomers, there is substantial deepening of
their product level own-tariff offers between the earliest offer they made on that product (to any
bargaining partner) and the last offer they made on that product (to any bargaining partner)
prior to the round’s conclusion, while for existing GATT members there is no such movement.
For each of the three columns, the behavior of the newcomers along this dimension as displayed
in Table 8 is statistically different from that of the existing GATT members as displayed in
Table 7 at any standard level of significance. Finally, the movements in bargaining partner
tariffs between the second and third rows of the last three (Purchases) columns are broadly
similar across Tables 7 and 8 and relatively small, as expected given the similar sets of partners
with which acceding countries and existing GATT members negotiated and the importance of
existing GATT members in those sets. From the perspective of Stylized Fact 5a, it therefore
appears that newcomers to GATT behaved in a more traditionally strategic manner at Torquay
than did those countries with more negotiating experience in the GATT bargaining forum.
The evidence regarding Stylized Fact 2 paints a similar picture. As an example, consider
Figure 9, which like Figure 6 for the US, displays an overview of the timing and actions —
request (R), modification of request (RM), offer (O), modification of offer (OM), withdrawal of
offer (OW), agreement (A) and modification of agreement (AM) —for each of the 24 bilateral
negotiations involving Germany at Torquay. The relative frequency of RMs that occur after
Os in the timeline of Germany’s bilaterals in Figure 9 as compared to the timeline of the
US bilaterals in Figure 6 illustrates the point: once the initial proposals were on the table,
newcomers such as Germany appear to have been more open than existing GATT members to
respond to imbalances in the outstanding offers by adjusting their requests rather than their
offers. Taken as a group, newcomers at Torquay were almost twice as likely as existing GATT
members (32% versus 18%) to make counter-proposals by modifying the tariff-cut requests they
were asking of their bargaining partners rather than modifying their own-tariff-cut offers.
7. Multilateral versus Bilateral Reciprocity
As we have noted, GATT practitioners place great emphasis on the role that GATT played in
allowing countries to seek multilateral as opposed to bilateral reciprocity in their tariffbargains.
Was the relaxation of strict bilateral reciprocity afforded by the multilateral nature of the GATT
47

01-Jun-1950
08-Jun-1950
15-Jun-1950
22-Jun-1950
29-Jun-1950
06-Jul-1950
13-Jul-1950
20-Jul-1950
27-Jul-1950
03-Aug-1950
10-Aug-1950
17-Aug-1950
24-Aug-1950
31-Aug-1950
07-Sep-1950
14-Sep-1950
21-Sep-1950
28-Sep-1950
05-Oct-1950
12-Oct-1950
19-Oct-1950
26-Oct-1950
02-Nov-1950
09-Nov-1950
16-Nov-1950
23-Nov-1950
30-Nov-1950
07-Dec-1950
14-Dec-1950
21-Dec-1950
28-Dec-1950
04-Jan-1951
11-Jan-1951
18-Jan-1951
25-Jan-1951
01-Feb-1951
08-Feb-1951
15-Feb-1951
22-Feb-1951
01-Mar-1951
08-Mar-1951
15-Mar-1951
22-Mar-1951
29-Mar-1951
Aus
tral
ia
Aus
tria
Ben
elux
Bra
zil
Can
ada
Den
mar
k
Fra
nce
Indi
a
Indo
nesi
a
Italy
New
Zea
land
Nor
way
Sou
th A
fric
a
Sw
eden
Tur
key
Uni
ted
Kin
gdom
Uni
ted
Sta
tes
Cey
lon
Chi
le
Fin
land
Gre
ece
Pak
ista
n
Phi
lippi
nes
Uru
guay
OA
RO
RM
AR
RM
RR
OM
OR
MA
RO
AR
RM
ROO
RR
M
OR
MA
RO
AR
RM
OA
AM
RO
AR
RM
OA
RO
MO
RM
OM
AO
MR
RM
OA
RO
AR
RM
AO
AM
RA
OR
OR
MA
RR
MR
MO
AR
RM
OA
RO
AR
OA
AM
RO
AR
RM
RR
RM
OA
AM
RO
AR
RM
OA
RA
RR
MO
OA
RO
AR
RM
OOA
RR
MO
AAA
MA
MR
RM
OA
RO
AR
RM
AO
RR
O
OA
AM
RA
RR
MO
OA
AM
RO
AR
RM
AR
RM
OA
OR
A
OR
AO
RR
MA
Figure9:TimingofActionsinGermanyTorquayBilaterals.Notes:Timeisonthehorizontalaxis.ForeachGermannegotiating
partnerlistedontheverticalaxis,thebottom(blue)linedisplaystheactionsrelatingtotheGermantariffwhilethetop(red)linedisplays
theactionsrelatingtotheforeignnegotiatingpartner’stariff.Rindicatesrequest.Oindicatesoffer.Aindicatesagreement.Mindicates
modification.Windicateswithdrawal
48

bargaining forum a key to GATT’s success? One approach to assessing this claim would be
to attempt direct measures of the degree to which the Torquay bargaining outcomes violated
bilateral reciprocity but conformed with multilateral reciprocity. A diffi culty with this approach
is that, in addition to requiring detailed trade data from the period (see note 21), it also requires
knowledge of the detailed trade elasticities that would apply.
Here we pursue an alternative approach to assessing this claim. In particular, if countries
were counting on indirect trade benefits from the MFN tariff cuts negotiated between third
parties to achieve multilateral reciprocity in the Torquay Round, then we would expect to see
reactions in the bilateral bargaining records of some countries when an unanticipated event
occurs in the bilateral negotiations of other countries, whereas according to the theory sketched
out in section 6.1 no such reaction would be expected if strictly bilateral reciprocity had been
demanded and achieved all along. Indeed, a report issued by the GATT Secretariat in the
aftermath of the failure of the UK and a number of its Commonwealth partners to reach
agreement with the US in the Torquay Round suggests that such reactions to unanticipated
third-party events were thought to be an important feature of the round:
The fact that certain of the more important negotiations initiated between existing
contracting parties did not result in agreements inevitably had some reactions on other
negotiations. If, for example, the other countries engaged in tariff negotiations at Torquay
had been sure that substantial concessions were going to be exchanged between the United
Kingdom, Australia and New Zealand on the one hand, and the United States on the other,
they might have been prepared, in the light of the benefits which they would have enjoyed
from the automatic extension of these concessions to them, to go somewhat further in
reducing their own tariffs. (ICITO, 1952, p. 9)
This discussion suggests an indirect way to evaluate the contribution to the success of GATT
tariff bargaining of the relaxation of strict bilateral reciprocity. If the collapse of the bilateral
bargains between the US on the one hand and the UK, Australia and New Zealand on the
other triggered significant changes in the remaining bilaterals that these countries negotiated
with third countries at Torquay, then this would be evidence that strict bilateral reciprocity
was not a feature of the bargains that were anticipated to prevail on the eve of this collapse,
and evidence therefore consistent with the view that the relaxation of strict bilateral reciprocity
facilitated by the GATT multilateral bargaining forum was indeed important to the success of
49
the GATT approach.40 On the other hand, if little or no change in the remaining bilaterals
of these countries is observed in response to this collapse, this would suggest that bilateral
reciprocity between the US and each of these bargaining partners was in fact built into the
bargains all along, and that the relaxation of the need for strict bilateral reciprocity facilitated
by the GATT multilateral forum was then not likely to be a central reason for GATT’s success.
We follow this logic with two tests. First, we check at the country level whether the break-
down in the US-UK, US-Australia and US-New Zealand bilaterals led to a retrenchment of
offers by third parties to these four countries, as the passage quoted above from the GATT
report suggests. Second, we test at the product level whether products which were under ne-
gotiation in these three bilaterals prior to their breakdown were more likely to be re-offered by
these countries to third parties after the breakdown, thereby at least partially converting into
direct benefits for these third parties what would have been anticipated as indirect benefits
from successful bilaterals between the US and the UK, Australia and New Zealand.41
To implement these tests, we must identify when the news of the breakdown of the US
bilaterals with these Commonwealth countries occurred. This news was offi cially announced at
the GATT Secretariat on March 31, 1951, but The New York Times (1951a) broke the news
with a dateline March 30 special press report, and it seems unlikely that even the March 30
40To further relate this interpretation to the theoretical framework described in section 6.1, we make twoadditional observations. First, and focusing for illustration on the US proposals, if the failure of the US-Commonwealth bargains are regarded as random and exogenous, then under multilateral reciprocity any result-ing changes in US proposals might be broadly interpreted as the utilization of an alternative dominant strategyfor the US (and similarly for each of the changed proposals of the Commonwealth countries). Second, we notethat the simple theory sketched out in section 6.1 does not explain why the relaxation of bilateral reciprocity infavor of multilateral reciprocity would matter to the success of tariff bargaining. Alternative models, however,may provide potential explanations. For example, in a 3-good, 3-country model of triangular trade, wherecountry A exports good a to country B, country B exports good b to country C, and country C exports goodc to country A, negotiations over import tariffs can generate potential gains under multilateral reciprocity butnot under bilateral reciprocity. More generally, empirical evidence of a beneficial role for multilateral reciprocitymay motivate interesting and new theoretical analyses.41It would be interesting to consider the impact of news about third-party bilaterals more generally on the
pattern of offers at Torquay. But given the emphasis placed by offi cial ICITO (1952) report on the importanceof the breakdowns in the US-UK, US-Australia and US-New Zealand bilaterals for the wider outcomes of theTorquay Round, our focus on these breakdowns seems the natural place to start. It is also interesting to notehow the ICITO report describes the reasons for the breakdowns: “... Substantial cuts in the tariffs of theseCommonwealth countries, however, would inevitably have involved substantial reductions in some of the marginsof preference which they accord to one another and the Commonwealth negotiators were not prepared to agreeto major tariff concessions of this kind at the price which the United States negotiators were prepared to offer inreturn.”(p. 9). The evidence that we present in Table 6 is consistent with the view stated by the ICITO that,in their bilaterals with the US, the Commonwealth countries were not willing to offer significant reductions intheir preference margins given the price that the US was offering in exchange.
50

announcement would have come as a complete surprise to the other negotiating countries at
Torquay. Below we will report results that set the “news”date at February 18, because that was
the day after the last action in the US-UK bilateral —the UK’s modification of its offer to the
US on 2/17/1951 —and it seems plausible that general news of the disappointing UK response
to the US request that it substantially reduce the margins of preference which it accorded to its
Commonwealth partners would have become known to other negotiators soon after (and there
were no actions in the US-Australia or US-New Zealand bilaterals past this date). But we also
experiment with alternative news dates between March 1 and March 30.
We begin with the question of retrenchment: Were the bargaining partners of the US,
the UK, Australia and New Zealand less willing to make offers in their bilaterals with these
four countries once it became known that these US-Commonwealth bilaterals had failed? To
answer this question, we focus on the change in the share of product-level offers that the other
participating countries at Torquay made to these four countries after they learned about the
breakdown in these bilaterals, and ask whether these shares changed in a way that suggests
a reorientation of offers away from these four countries. To this end, we define T as the set
of participating countries at Torquay, and we define F as the subset of countries consisting
of the US, the UK, Australia and New Zealand. And we denote by #OX→Y the number of
product-level tariff-cut offers that countries in the set X made to countries in the set Y and by#OT \F→f the number of product-level offers that countries in the set T \F made to a countryf ∈ F . With this we also have #OT \F→F =
∑f∈F #OT \F→f . We then define the share of
product-level offers that countries in the set T \F made to a country f ∈ F and to any countriesin F , respectively, by
SHARET \F→f ≡#OT \F→f#OT \F→T \F
and SHARET \F→F ≡#OT \F→F#OT \F→T \F
.
Fixing 2/18/1951 as the date at which negotiators at Torquay learned of the breakdown
of these US-Commonwealth bilaterals, we find that on 2/18/1951, SHARET \F→F = 0.345 (with
individual components SHARET \F→US = 0.231, SHARET \F→UK = 0.105, SHARET \F→AUS =
0.006 and SHARET \F→NZ = 0.003), indicating that on the eve of the breakdown the other
participating countries at Torquay were making roughly 35% of their product-level offers to the
US, the UK, Australia and New Zealand. We then recalculate these shares based on the offers
outstanding at the end of the round, and find that SHARET \F→F = 0.391 (with individual
components SHARET \F→US = 0.304, SHARET \F→UK = 0.076, SHARET \F→AUS = 0.008
51

and SHARET \F→NZ = 0.002), indicating that subsequent to the breakdown the other partici-
pating countries at Torquay were making roughly 39% of their product-level offers to these four
countries. Clearly, while there is some variation across countries, with the shares of product-
level offers to the US and Australia rising and the shares of product-level offers to the UK
and New Zealand falling, these two sets of numbers do not suggest that overall there was a
diminished willingness on the part of US, UK, Australia and New Zealand bargaining part-
ners to make offers in their bilaterals with these countries after they had learned that the
US-Commonwealth bilaterals would end in failure. Performing this same calculation with the
“news”date fixed at either 3/1/1951, 3/15/1951 or 3/30/1951 yields similar results.
However, on closer examination this simple difference is driven strongly by a suite of offers
from France after the US-Commonwealth breakdowns. While these offers from France may have
been influenced by the US-Commonwealth breakdowns, the narrative from the time suggests
that other factors unique to the France bargaining strategy were probably more decisive.42 Elim-
inating France from the calculations above, we find that on 2/18/1951 SHARET \F→F = 0.400
(with individual components SHARET \F→US = 0.266, SHARET \F→UK = 0.125, SHARET \F→AUS =
0.006 and SHARET \F→NZ = 0.003) while based on the offers outstanding at the end of the
round we have SHARET \F→F = 0.374 (with individual components SHARET \F→US = 0.278,
SHARET \F→UK = 0.083, SHARET \F→AUS = 0.010 and SHARET \F→NZ = 0.003). These
numbers suggest modest retrenchment, as they indicate a drop in the overall share of product-
level offers that the other participating countries at Torquay made to these four countries from
40% to roughly 37% after they learned of the breakdown in these bilaterals. This is in turn
consistent with the position that countries had expected indirect trade benefits from the MFN
42In particular, as Curzun (1966, p. 110) describes, France was alone in following a strategy at Torquaythat relied heavily on threats of renegotiating the existing tariff concessions it had agreed to in prior GATTrounds (under the GATT renegotiation provisions contained in Article XXVIII that we described in section6.1). Curzun notes that most countries renegotiated less than ten items, whereas France was the exceptionand “renegotiated some 200 items, only to find later, to quote one of her negotiators, ‘that it had neither beennecessary nor worthwhile.”’This discussion raises the possibility that France abandoned this strategy late inthe round, which may account for the large number of offers it made to the US subsequent to 2/17/1951. Thatpossibility seems to be supported by news coverage at the time: a November 8 1950 article in The New YorkTimes (1950b) ran with the headline “French Now Seek New Tariff Duties: Torquay Trade Body Amazed asParis Negates Efforts to Relax Import Curbs”; while an article published by the Times (1951b) on March 111951 stated that “France, which was frightening all participants in November with the number of items onwhich she wanted to raise duties (mostly items on which the French granted reductions in the earlier meetingsat Geneva and Annecy) has mollified most of her trading partners. The French have withdrawn some of theirdemands for revision and given quoted compensation in other cases in the form of reductions on some otheritems, all after prolonged and sometimes acrimonious bargaining in dozens of hotel rooms.”
52

tariff cuts negotiated between the US and its Commonwealth bargaining partners, and pulled
back on their offers to these countries in an attempt to reestablish (multilateral) reciprocity
once they realized that these indirect benefits would not be forthcoming.43
We next turn to the question of re-offering: Were products which were under negotiation
in the US-UK, US-Australia and/or US-New Zealand bilaterals more likely to be re-offered by
these countries to third parties after the breakdown of these bilaterals, thereby converting into
direct benefits for these third parties what would have been anticipated as indirect benefits from
successful US-UK, US-Australia and US-New Zealand bilaterals? To answer this question, we
define C as the set of country pairs consisting of US-UK, US-Australia and US-New Zealand.Recalling that F is the set of countries consisting of the US, the UK, Australia and New Zealandand that T is the set of participating countries at Torquay, we estimate the following regressionon the sample of products for which any country in the set F made an offer:
OfferPostg,fm = αHS1 + γfm + βOfferPreg,f + εg,fm (7.1)
where g indexes products, f is a country index referring to an element of F ,m is a country index
referring to an element of T \F , αHS1 is an HS1 fixed effect and γfm is a country-partner fixedeffect (we also report results when only a country fixed effect γf is included).
44 The dependent
variable OfferPostg,fm is an indicator variable that takes a value of 1 if country f made a new
post-breakdown offer to country m on product g, and 0 otherwise. The independent variable
OfferPreg,f is an indicator variable that takes a value of 1 if country f made a pre-breakdown
offer on product g in a bilateral in the set C, and 0 otherwise. The focus of equation (7.1) isthe coeffi cient β which, if positive, indicates that a product was more likely to be offered by a
country in the set F to a country in the set T \F after the breakdown of the US-Commonwealthbilaterals if it was part of the outstanding set of offers in the US bilaterals with the UK, Australia
and New Zealand prior to the breakdown of these bilaterals.
Table 9 provides the regression evidence (Probit and OLS), with the news date fixed at
2/18/1951. The coeffi cient on OfferPostg,fm is positive and significant in all specifications,
as would be expected if the failure of the three US-Commonwealth bilaterals led these four
countries to extend their offers to countries directly on products where those countries had an-
ticipated indirect market access benefits through the US-Commonwealth bilaterals. Using news43Again, performing this same calculation with the “news” date fixed at either 3/1/1951, 3/15/1951 or
3/30/1951 yields similar results.44We experimented with both HS1 and HS section fixed effects, finding that it made no material difference
to our results, so we report results with HS1 fixed effects.
53
dates of 3/1/1951 and 3/15/1951 yields similar results, while the offi cial 3/30/1951 dateline of
The New York Times press release generates results that are still significant in the Probit, but
overall the relationship is weaker. The results are robust to excluding offers to France.
Overall, these results provide indirect evidence that news of the breakdown in the US-
Commonwealth bilaterals caused 3rd countries to rebalance their bilaterals with these coun-
tries, and hence evidence that bilateral reciprocity was not a feature of the bargains that were
anticipated to prevail on the eve of this collapse, consistent with the view that the relaxation
of bilateral reciprocity which was facilitated by the GATT multilateral bargaining forum was
important for the success of the GATT approach.45 Our results also provide some specific
support for the view expressed in the report by the GATT Secretariat quoted above, that this
rebalancing took the form at least partially of a general retrenchment of offers to the US, the
UK, Australia and New Zealand, but only if the negotiating behavior of France is treated as
unique, as described above. If one treats France as the same as others, our results suggest that
this rebalancing still occurred, but that it was achieved not by an overall retrenchment of of-
fers but rather by reorienting offers from the failed US-UK, US-Australia and US-New Zealand
bilaterals directly to 3rd countries who would have gained indirectly from those bilaterals.
8. Conclusion
In this paper we have provided a first look at the newly declassified bargaining records of the
GATT Torquay Round (1950-51), where over a 10 month period 298 separate bilateral nego-
tiations among the 37 participating countries covering thousands of tariff-line products took
45To be clear, our results reject the null hypothesis that the Torquay bilaterals satisfied the restriction ofbilateral reciprocity, because under this null the breakdown of the US-UK, US-Australia and US-New Zealandbilaterals would not have triggered adjustments in the remaining bilaterals of these four countries with thirdparties. Moreover, the nature of the adjustments that we document are consistent with the kind of rebalancingthat would be required to reestablish multilateral reciprocity after such a breakdown, in that these four countrieswere reorienting their offers toward the rest of the participants at Torquay at the same time that the rest of theparticipants at Torquay were reorienting their offers away from these four countries. And in further support ofthis interpretation we note that in US State Department (1951, p. 6) the US provided a preliminary estimate(based on trade coverage) of “the indirect benefits, which will accrue to the United States as the result ofconcessions exchanged by other participants in the Torquay Conference in approximately 130 negotiationsbetween pairs of countries,” and concluded that these indirect benefits amounted to about 10 percent of thetrade benefits accruing directly from its own negotiations at Torquay (a later accounting by the US InternationalChamber of Commerce, 1955 p. 24, put the number closer to 20 percent). Still, we can’t rule out the possibilitythat (i) there was a general lack even of multilateral reciprocity before the US-UK, US-Australia and US-NewZealand breakdowns, and (ii) as a consequence there were externalities across bilateral bargains which wereimpacted by these breakdowns and led to further adjustments in the remaining bilaterals.
54

place. Our examination of these records has shown that GATT multilateral tariff bargaining
displays an array of interesting stylized facts. The numbers of back-and-forth offers and coun-
teroffers in any bilateral bargain were relatively small. Once the initial proposals were on the
table, the focus of bargaining narrowed to each country’s own-tariff-cut offers rather than their
requests of others. Offers for given import products were rarely deepened over the course of
the negotiations; instead, adjustments typically involved a country “shopping around”its initial
tariff-cut offers and ultimately reducing as necessary the depth of its overall (multilateral) offer.
And when a country chose to reduce the depth of its offers, it did so by removing products
from its offers, not by raising the level of the tariff cut offered. Initial offers sometimes sat
dormant for long periods only to be finalized with a single modification at the time that other
bargains were concluded. The set of requests a country entertained seemed to conform with
principal supplier considerations, but when it came to deciding which bargaining partners to
make requests of on a given product there appears to have been a more narrow focus than
principal supplier considerations would warrant. Substantial numbers of offers were made that
were not requested by the country to which the offer was extended, and some offers were made
that were not requested by any country at all. And there was substantial two-way bargaining
within narrow product categories, and significant numbers of these two-way bargains occurred
within a single bilateral.
Several of these stylized facts lend support to two features that are seen by GATT practi-
tioners and legal scholars as hallmarks of the tariff bargaining that occurred in the early GATT
rounds, namely, a surprising lack of strategic behaviors such as lowball initial offers among
the participating governments and an important multilateral element to the bilateral bargains.
We have suggested that, when viewed through the lens of the terms-of-trade theory of trade
agreements, these features can be understood as emerging from a tariff bargaining forum that
emphasizes the GATT pillars of MFN and multilateral reciprocity. And we have offered the
first evidence for the claim that the relaxation of strict bilateral reciprocity facilitated by the
GATT multilateral bargaining forum was important to the success of the GATT approach.
To interpret the GATT bargaining data we have relied on strong institutional assumptions
that have allowed us to make contact with a number of important features of GATT tariff
bargaining and the stylized facts that seem to reflect these features. But the set of stylized
facts that we have identified point to additional features of the tariff bargaining at Torquay
that our theoretical framework does not currently and perhaps cannot speak to, pointing to the
55

importance of more general theoretical structures and additional theoretical work to guide the
analysis of tariffbargaining and interpret the results. All of these features would be unknowable
without the detailed bargaining data that the WTO has begun to make publicly available. In
this light, as more and more of this data becomes accessible to researchers, we view our initial
look at the GATT bargaining data as providing a promising view for the road ahead.
References
Admati, Anat R. and Motty Perry (1987), “Strategic Delay in Bargaining,”Review of Economic
Studies, LIV, 345-364
Bagwell, Kyle, Bown, Chad P. and Robert W. Staiger (2016), “Is the WTO Passé?” Journal of
Economic Literature 54(4): 1125-1231
Bagwell, Kyle and Robert W. Staiger (1999), “An Economic Theory of GATT,”American Economic
Review 89(1): 215-48
Bagwell, Kyle and Robert W. Staiger (2001), “Reciprocity, Non-discrimination and Preferential
Agreements in the Multilateral Trading System,”European Journal of Political Economy, June
Bagwell, Kyle and Robert W. Staiger (2002), The Economics of the World Trading System, Cam-
bridge, MA: The MIT Press
Bagwell, Kyle and Robert W. Staiger (2005), “Multilateral Trade Negotiations, Bilateral Oppor-
tunism and the Rules of GATT/WTO,”Journal of International Economics 67(2): 268-94
Bagwell, Kyle and Robert W. Staiger (2010a), “The WTO: Theory and Practice,”Annual Review of
Economics, 2: 223-56
Bagwell, Kyle and Robert W. Staiger (2010b), “Backward Stealing and Forward Manipulation in the
WTO,”Journal of International Economics, 82(1): 49-62
Bagwell, Kyle and Robert W. Staiger (2011), “What do trade negotiators negotiate about? Empirical
evidence from the World Trade Organization,”American Economic Review 101(4): 1238-73
Bagwell, Kyle and Robert W. Staiger (2016a), “Multilateral Trade Bargaining and Dominant Strate-
gies,”NBER Working Paper No. 22842.
56

Bagwell, Kyle and Robert W. Staiger (2016b), “The Design of Trade Agreements,”in Kyle Bagwell
and Robert W. Staiger (eds) Handbook of Commercial Policy. Elsevier, Amsterdam.
Bagwell, Kyle, Staiger, Robert W. and Ali Yurukoglu (2017), “ ‘Nash-in-Nash’TariffBargaining with
and without MFN,”mimeo, July 2017
Beckett G (1941), The Reciprocal Trade Agreements Program. New York: Columbia Univ. Press
Bown, Chad P. and Meredith A. Crowley (2013), “Self-Enforcing Trade Agreements: Evidence from
Time-Varying Trade Policy,”American Economic Review 103(2): 1071-1090
Broda, Christian, Nuno Limao, and David E. Weinstein (2008), “Optimal Tariffs and Market Power:
The Evidence,”American Economic Review, 98(5): 2032-65
Cramton, Peter (1992), “Strategic Delay in Bargaining with Two-Sided Uncertainty,” Review of
Economic Studies, 59(1): 205—225
Crawford, Gregory S., and Ali Yurukoglu (2012), “The Welfare Effects of Bundling in Multichannel
Television Markets,”American Economic Review, 102(2): 643-85
Cremer, J. and M. H. Riordan (1987), “On Governing Multilateral Transactions with Bilateral Con-
tracts,”RAND Journal of Economics, 18, 436-51
Curzon, Gerard (1966), Multilateral Commercial Diplomacy: The General Agreement on Tariffs and
Trade and its Impact on National Commercial Policies and Techniques, Praeger: New York
Eckes, Alfred E. (2000), Revisiting U.S. Trade Policy: Decisions in Perspective, Alfred E. Eckes (ed),
Ohio University Press.
Feketekuty, Geza (2008), “A Guide to Services Negotiations,” in Aadita Mattoo, Robert M. Stern
and Giani Zanini (eds) A Handbook of International Trade in Services, The World Bank, Oxford
University Press, pp. 542-592
Gowa, Joanne and Soo Yeon Kim (2005), “An Exclusive Country Club: The Effects of the GATT
on Trade, 1950-94,”World Politics, 57(4): 453-478
Hart, Oliver and Jean Tirole (1990), “Vertical Integration and Market Foreclosure,”Brookings Papers
on Economic Activity, Microeconomics, 205-76
57

Hoda, Anwarul (2001), Tariff Negotiations and Renegotiations under the GATT and the WTO:
Procedures and Practices, WTO and Cambridge University Press
Horn, Henrik and Asher Wolinsky (1988), “Bilateral Monopolies and Incentives for Merger,”RAND
Journal of Economics 19(3): 408-419
Irwin, Douglas A. (1995), “The GATT in Historical Perspective,”American Economic Review Papers
and Proceedings 85 May: 323-328
Interim Commission for the ITO (1949), The Attack on Trade Barriers: A Progress Report on the
Operation of the General Agreement on Tariffs and Trade. Geneva, August
Interim Commission for the ITO (1952), GATT in Action: Third Report on the Operation of the
General Agreement on Tariffs and Trade. Geneva, January
Karacaovali Baybars and Nuno Limao (2008), “The Clash of Liberalizations: Preferential vs. Multi-
lateral Trade Liberalization in the European Union,”Journal of International Economics 74(2):
299-327
Keniston, Daniel (2013), “Bargaining and Welfare : A Dynamic Structural Analysis of the Autorick-
shaw Market,”Working Paper
Larsen, Bradley (2013), “The Effi ciency of Dynamic, Post-Auction Bargaining: Evidence fromWhole-
sale Used-Auto Auctions,”Working Paper
Limao, Nuno (2006), “Preferential Trade Agreements as Stumbling Blocks for Multilateral Trade
Liberalization: Evidence for the U.S.,”American Economic Review 96(3): 896-914
Limao, Nuno (2007), “Are Preferential Trade Agreements with Non-trade Objectives a Stumbling
Block for Multilateral Liberalization?”Review of Economic Studies 74(3): 821-55
Ludema, Rodney D. and Anna Maria Mayda (2009), “Do Countries Free Ride on MFN?,”Journal
of International Economics 77(2): 137-50
Ludema, Rodney and Anna Maria Mayda (2013), “Do Terms-of-Trade Effects Matter for Trade
Agreements? Theory and Evidence from WTO countries,” Quarterly Journal of Economics
128(4)
58

Mayer Wolfgang (1981), “Theoretical Considerations on Negotiated Tariff Adjustments,” Oxford
Economic Papers 33(1): 135-53
McAfee, R. Preston and Marius Schwartz (1994), “Opportunism in Multilateral Vertical Contracting:
Nondiscrimination, Exclusivity, and Uniformity,”American Economic Review, 84, 210-30
New York Times (1950a), “Tariff Parley Off To A Good Start: 20 or 30 Negotiations to Open at
Torquay This Week—U.S. in a Position to Bargain,”Special to The New York Times by Michael
L. Hoffman, dateline October 1; published October 2
New York Times (1950b), “French Now Seek New Tariff Duties: Torquay Trade Body Amazed as
Paris Negates Efforts to Relax Import Curbs,”Special to The New York Times by Michael L.
Hoffman, dateline November 8; published November 10
New York Times (1951a), “U.S.-British Trade Talks Fail: Imperial Preference Blamed,”Special Press
Report to The New York Times by Michael L. Hoffman, dateline March 30; published March 31
New York Times (1951b), “Big Tariff Parley Nearing Its Close: 1,000 Experts at Torquay See New
Convention Ready for Signatures by April 20,”Special to The New York Times by Michael L.
Hoffman, dateline March 11; published March 12
United Nations (1952), Treaties and International Agreements Registered or Filed and Recorded with
the Secretariat of the United Nations, Vol 144 No 814 (VIII)
United States Council of the International Chamber of Commerce (1955), G.A.T.T.: An analysis
and appraisal of the General Agreement on Tariffs and Trade. Prepared by the William L.
Clayton Center for International Economic Affairs of the Fletcher School of Law and Diplomacy,
February.
United States Department of State (1951), Preliminary Analysis of Torquay Protocol of Accession,
Schedules, and Related Documents: General Agreement on Tariffs and Trade. US Government
Printing Offi ce, Washington, DC.
WTO Appellate Body (2004), United States-Anti-Dumping Act of 1916– Recourse to arbitration by
the United States under 22.6 of the DSU. WT/DS136/ARB, 24 February
59

9. Tables
Mean SD Min Max NNumber of offers per good-country 1.363 0.516 1 5 19584Number of offers per country 1.790 0.658 1 6 324Number of requests per good-country 1.021 0.148 1 3 38678Number of requests per country 1.129 0.368 1 3 442
Conditional on Final agreementNumber of offers per good-country 1.531 0.546 1 5 13054Number of offers per country 1.969 0.595 1 6 260Number of requests per good-country 1.047 0.214 1 3 6991Number of requests per country 1.194 0.446 1 3 242Number of weeks from the last offer (O or OM) to the first agreement (A) 11.771 7.405 0.143 26.286 124Fraction of goods for which agreement was later modified 0.035 0.197 0 2 145
Table 1: Back-and-Forth Offers and Counteroffers in the Torquay Round: This table presents statistics on the amount of back and forth on goods and with negotiating partners over concessions negotiated by all particpating countries in the Torquay Round. Offer statistics reflect averages conditional on at least one offer; Request statistics reflect averages conditional on at least one request.
60

Unique Total Total/Unique Mean SD Min MaxSales
Number of HS6 requests 29421 38678 1.315 66.229 134.459 0 1259Number of HS6 request modifications 2202 2302 1.045 3.942 21.518 0 267Number of HS6 offers 15703 19584 1.247 33.534 97.745 0 1111Number of HS6 offer modifications 1292 1330 1.029 2.277 20.804 0 337Number of HS6 offers with requests 11080 10453 0.943 17.899 57.135 0 589Fraction of HS6 offers with requests 70.56% 30.66% 0.369 0 1Fraction of HS6 offers meeting request 0.75% 0.61% 0.078 0 1Number of HS6 offers without request 4623 9131 1.975 15.635 49.121 0 554Fraction of HS6 offers without request 29.44% 24.82% 0.332 0 1Number of HS6 final concessions 11129 13054 1.173 22.353 76.706 0 917Number of HS6 final concessions with requests 7962 6991 0.878 11.971 46.238 0 555Fraction of final concession with request 71.54% 24.06% 0.350 0 1Number of HS6 final concession without request 3167 6063 1.914 10.382 38.485 0 464Fraction of final concessions without request 28.46% 20.46% 0.320 0 1
PurchasesNumber of HS6 requests 18899 38678 2.047 66.229 134.459 0 1259Number of HS6 request modifications 2050 2302 1.123 3.942 21.518 0 267Number of HS6 offers 12785 19584 1.532 33.534 97.745 0 1111Number of HS6 offer modifications 1313 1330 1.013 2.277 20.804 0 337Number of HS6 offers with requests 9231 10453 1.132 17.899 57.135 0 589Fraction of HS6 offers with requests 58.78% 30.66% 0.369 0 1Fraction of HS6 offers meeting request 4.92% 0.61% 0.078 0 1Number of HS6 offers without request 3554 9131 2.569 15.635 49.121 0 554Fraction of HS6 offers without request 22.63% 24.82% 0.332 0 1Number of HS6 final concessions 9074 13054 1.439 22.353 76.706 0 917Number of HS6 final concessions with requests 6794 6991 1.029 11.971 46.238 0 555Fraction of final concession with request 61.05% 24.06% 0.350 0 1Number of HS6 final concession without request 2280 6063 2.659 10.382 38.485 0 464Fraction of final concessions without request 20.49% 20.46% 0.320 0 1
Table 2: Sales and Purchases by all participating countries in the Torquay Round. "Sales" records requests, offers and concessions that refer to own tariffs. "Purchases" records requests, offers and concessions that refer to the tariffs of the bargaining partner. "Unique" refers to the number of unique HS6 products across all bargaining partners. "Total" refers to the number of HS6 product-country pairs.
By Negotiating Partner
61

N countries N products Fraction products N countries N products Fraction products
1 22462 76.35% 1 10528 55.71%2 5233 17.79% 2 3969 21.00%3 1298 4.41% 3 1982 10.49%4 337 1.15% 4 928 4.91%5 58 0.20% 5 569 3.01%6 22 0.07% 6 324 1.71%7 6 0.02% 7 168 0.89%8 2 0.01% 8 126 0.67%9 2 0.01% 9 65 0.34%
10 1 0.00% 10 73 0.39%11 0 0.00% 11 46 0.24%12 0 0.00% 12 45 0.24%
>12 0 0.00% >12 76 0.40%
1 12483 79.49% 1 8845 69.18%2 2700 17.19% 2 2417 18.90%3 398 2.53% 3 845 6.61%4 109 0.69% 4 345 2.70%5 10 0.06% 5 174 1.36%6 1 0.01% 6 77 0.60%7 1 0.01% 7 42 0.33%8 1 0.01% 8 17 0.13%9 0 0.00% 9 13 0.10%
>9 0 0.00% >9 10 0.08%
1 9369 84.19% 1 6618 72.93%2 1614 14.50% 2 1557 17.16%3 127 1.14% 3 554 6.11%4 19 0.17% 4 197 2.17%5 0 0.00% 5 76 0.84%
>5 0 0.00% >5 72 0.79%
Sales Purchases
Final concession Final concession
Table 3: DIstribution of Sales and Purchases by all participating countries in the Torquay Round. This table presents the number of negotiating partners associated with a product conditional on the product having any request, any offer, or a final concession. "Sales" records requests, offers and final concessions that refer to own tariffs. "Purchases" records requests, offers and final concessions that refer to the tariffs of the bargaining partner.
Any request Any request
Any offer Any offer
62

Ad Val Specific All Ad Val Specific All
Mean 0.529 0.589 0.551 0.529 0.589 0.551SD 0.250 0.315 0.277 0.250 0.315 0.277Min 0 0 0 0 0 0Max 1 1 1 1 1 1N 21987 12667 34654 21987 12667 34654Mean 0.808 0.843 0.822 0.808 0.843 0.822SD 0.202 0.220 0.210 0.202 0.220 0.210Min 0 0 0 0 0 0Max 1 1 1 1 1 1N 10185 7022 17207 10185 7022 17207Mean 0.789 0.836 0.809 0.789 0.836 0.809SD 0.199 0.238 0.218 0.199 0.238 0.218Min 0 0 0 0 0 0Max 1 1 1 1 1 1N 6271 4665 10936 6271 4665 10936
Mean 0.532 0.593 0.555SD 0.250 0.318 0.280Min 0 0 0Max 1 1 1N 17043 10875 27918Mean 0.815 0.849 0.829SD 0.204 0.219 0.211Min 0 0 0Max 1 1 1N 8336 6033 14369Mean 0.799 0.829 0.812SD 0.208 0.240 0.222Min 0 0 0Max 1 1 1N 7847 5785 13632
Sales Purchases
Table 4: Initial requests, initial offers and final offers and concessions over existing tariffs for all participating countries in the Torquay Round. "Sales" refer to requests of and offers on own tariffs. "Purchases" refer to requests of and offers on the tariffs of the bargaining partner. Country-Specific numbers refer to a given Seller-Purchaser-HS6, and describe the evolution of tariff concessions from initial requests to finalized agreed concession. Some goods appear in both the ad valorem and specific columns. Cross-Country numbers refer to a given Seller-HS6, and describe the evolution of tariff concessions from initial requests to the last offer made.
Initial offer over existing tariff
Initial request over existing
tariff
Initial offer over existing tariff
Initial request over existing
tariff
Cross-Country
Country-Specific
Final offer over existing tariff
Final agreed concession over
existing tariff
63

Number of HS6 for which request made and request received 6688Number of HS6 for which request made and offer made 4534Number of HS6 for which request received and offer received 4745Number of HS6 for which request received/offer made and request made/offer received (same country) 2391Number of HS6 for which a final concession was granted and received (same country) 374Fraction of two-way HS6 bargains that resulted in two-way exhange of a final concession (same country) 15.64%
Table 5: Two-way Sales and Purchases by all participating countries in the Torquay Round. This table records the numbers of goods for which participants at Torquay were both offering tariff reductions, and seeking tariff reductions, sometimes with the same negotiating partner.
Ad Valorem Specific Ad Valorem Specific Ad Valorem SpecificUNITED KINGDOM 1.091 0.009 1.077 0.007 -0.012 -0.002AUSTRALIA 1.200 27.078 1.180 26.670 -0.017 -0.409NEW ZEALAND 1.188 1.000 1.172 0.000 -0.013 -1.000
CountryExisting Preference Margin Proposed Preference Margin Preference Margin Change
Table 6: Changes in tariff preference margins at Torquay. Each row corresponds to a Commonwealth country who, in its bilateral tariff bargains at Torquay, offered MFN tariff cuts on HS6 products for which it granted preferential tariff access to its Commonwealth partners. See text for definition of preference margins; ad valorem entries are 1 plus the preference margin, ad valorem preference margin change is the ratio of proposed over existing minus 1.
64

Ad Val Specific All Ad Val Specific All
Mean 0.471 0.611 0.544 0.571 0.617 0.585SD 0.294 0.327 0.319 0.223 0.290 0.246Min 0 0 0 0 0 0Max 1 1 1 1 1 1N 4306 4696 9002 6366 2756 9122Mean 0.827 0.870 0.855 0.829 0.840 0.833SD 0.229 0.203 0.213 0.179 0.225 0.197Min 0 0 0 0 0 0Max 1 1 1 1 1 1N 1798 3445 5243 3607 2014 5621Mean 0.725 0.846 0.819 0.807 0.849 0.820SD 0.179 0.241 0.234 0.183 0.232 0.201Min 0 0 0 0 0 0Max 1 1 1 1 1 1N 668 2271 2939 2887 1324 4211
Mean 0.476 0.625 0.559SD 0.301 0.332 0.327Min 0 0 0Max 1 1 1N 2904 3703 6607Mean 0.836 0.876 0.862SD 0.233 0.199 0.212Min 0 0 0Max 1 1 1N 1491 2807 4298Mean 0.791 0.844 0.829SD 0.239 0.237 0.239Min 0 0 0Max 1 1 1N 1034 2568 3602
Table 7: Initial requests, initial offers and final offers and concessions over existing tariffs for all acceding countries in the Torquay Round. "Sales" refer to requests of and offers on own tariffs. "Purchases" refer to requests of and offers on the tariffs of the bargaining partner. Country-Specific numbers refer to a given Seller-Purchaser-HS6, and describe the evolution of tariff concessions from initial requests to finalized agreed concession. Some goods appear in both the ad valorem and specific columns. Cross-Country numbers refer to a given Seller-HS6, and describe the evolution of tariff concessions from initial requests to the last offer made.
Initial offer over existing tariff
Cross-Country
Initial request over existing
tariff
Initial offer over existing tariff
Final agreed concession over
existing tariff
Final offer over existing tariff
Initial request over existing
tariff
Sales Purchases
Country-Specific
65

Ad Val Specific All Ad Val Specific All
Mean 0.543 0.577 0.554 0.512 0.582 0.539SD 0.235 0.306 0.260 0.257 0.321 0.286Min 0 0 0 0 0 0Max 1 1 1 1 1 1N 17681 7971 25652 15621 9911 25532Mean 0.804 0.817 0.808 0.796 0.845 0.817SD 0.195 0.233 0.208 0.213 0.218 0.216Min 0 0 0 0 0 0Max 1 1 1 1 1 1N 8387 3577 11964 6578 5008 11586Mean 0.797 0.827 0.806 0.773 0.831 0.802SD 0.200 0.235 0.212 0.211 0.240 0.228Min 0 0 0 0 0 0Max 1 1 1 1 1 1N 5603 2394 7997 3384 3341 6725
Mean 0.543 0.576 0.554SD 0.237 0.308 0.264Min 0 0 0Max 1 1 1N 14139 7172 21311Mean 0.810 0.825 0.815SD 0.197 0.233 0.209Min 0 0 0Max 1 1 1N 6845 3226 10071Mean 0.801 0.816 0.806SD 0.202 0.241 0.216Min 0 0 0Max 1 1 1N 6813 3217 10030
Table 8: Initial requests, initial offers and final offers and concessions over existing tariffs for all non-acceding countries (existing GATT members) in the Torquay Round. "Sales" refer to requests of and offers on own tariffs. "Purchases" refer to requests of and offers on the tariffs of the bargaining partner. Country-Specific numbers refer to a given Seller-Purchaser-HS6, and describe the evolution of tariff concessions from initial requests to finalized agreed concession. Some goods appear in both the ad valorem and specific columns. Cross-Country numbers refer to a given Seller-HS6, and describe the evolution of tariff concessions from initial requests to the last offer made.
Initial offer over existing tariff
Cross-Country
Initial request over existing
tariff
Initial offer over existing tariff
Final agreed concession over
existing tariff
Final offer over existing tariff
Initial request over existing
tariff
Sales Purchases
Country-Specific
66

(1) (2) (3) (4)VARIABLES PROBIT PROBIT OLS OLS
OfferPre 0.292* 0.581*** 0.0653* 0.0954***(0.152) (0.154) (0.0326) (0.0316)
Observations 3,055 2,641 3,055 3,055R-squared 0.166 0.533Country FE Yes No Yes NoCountry-pair FE No Yes No YesHS1 FE No Yes No YesCluster SE Yes Yes Yes Yes
Table 9: Regression of whether an HS6 product - country pairing offered by the US, the UK, Australia or New Zealand to countries outside this set was added after 2/18/1951 (after the breakdown of the US-UK, US-Australia and US-New Zealand bilaterals) on whether the product in question had been offered by that country in one of these bilaterals prior to their breakdown. A positive coefficient implies that a product is more likely to be offered by one of these countries to countries outside this set following the breakdown of the US-UK, US-Australia and US-New Zealand bilaterals if that country was offereing a concession on this product in one of these bilaterals prior to their breakdown. SEs clustered by negotiating partner. *, **, and *** denote significance at the 90%, 95%, and 99% confidence levels, respectively.
67