Embed Size (px)
Citation preview
1
Trade unions, bargaining coverage and low pay: a multilevel test of institutional effects
on low-pay risk in Germany
Work, Employment and Society
Pre-proof accepted version, January 2021
Chiara Benassi and Tim Vlandas
Abstract
Employment relations scholars argue that industrial relations institutions reduce low pay
among the workforce, while the insider-outsider literature claims that unions contribute to
increase the low-pay risk among non-union members. This article tests these expectations by
distinguishing, respectively, between the individual effect of being a union member or covered
by collective agreements and the sectoral effect of strong trade unions or encompassing
collective agreements. Findings from multilevel logistic regression analyses of the German
Socio-Economic Panel reveal that unions and bargaining coverage have distinct effects at
individual and sectoral level. The analysis of their cross-level interactions provides partial
support to both the insider-outsider approach, since non-union members are more exposed to
the risk of low pay in highly unionised sectors, and to the power resource perspectives, since
the probability of being in low pay in sectors with encompassing collective agreements
decreases also for those workers who are not covered by them.
Keyword: collective bargaining, dualization, Germany, insider-outsider, low pay, unions.

2
Introduction
With an average incidence of 16% of the workforce in OECD countries, low pay has been at
the centre of political and academic debates on inequality and in-work poverty. While global
macro-economic trends including automation, global competition and tertiarization have
certainly contributed to the increase of low pay (Neckerman and Torche, 2007), there is broad
consensus that policies and institutions such as social protection systems and industrial
relations (IR) institutions including unions and collective bargaining have played a crucial role
(Emmenegger et al., 2012; Gautiè and Schmitt, 2010).
The effect of IR institutions on low pay and, more generally, on labour market segmentation is
controversial in sociological debates. On one side of the debate, research in sociology of work
and employment relations, mainly based on cross-country case studies, suggests that strong
unions and collective bargaining protect the whole workforce from the risk of low pay and
deliver homogenous labour market outcomes (Dex et al., 1999; Gautiè and Schmitt, 2010;
Grimshaw, 2011). On the other side of the debate, the insider-outsider (I-O) literature contends
that unions and collective bargaining only benefit ‘labour market insiders’, contributing to
wage segmentation (Lindbeck and Snower, 2002; Saint-Paul, 2002). Because unions are
mainly composed of workers on safe contracts and fairly high wages (Becher and Pontusson,
2011), they are argued to follow a logic of representation and to focus on improving the wages
of insiders at the expense of outsiders.
This article contributes primarily to this debate by showing that the contradictory claims from
both literature strands are due to conflating different effects of IR institutions – trade union
density versus bargaining coverage - on low pay and the different levels at which they operate
– individual versus sectoral level. Indeed, sectoral wage agreements and trade unions are often
implicitly treated as the same institution, even though their effects are likely to be distinct in
3
most continental European systems of IR, including in Germany, the country we focus on.
Furthermore, the empirical approaches do not distinguish between the individual and sectoral
level of IR institutions.
This article develops hypotheses for both individual inclusiveness of IR, measured through
union membership and individual bargaining coverage, and sectoral strength of IR, measured
through union density and sectoral bargaining coverage. It also theorises the effect of their
cross-level interactions on low-pay risk, particularly the contingent effect of individual
inclusion of IR institutions on their sectoral strength. Hypotheses are tested through a
multilevel random intercept logistic regression analysis of the German Socio-Economic Panel
(wave 2015). Individual union membership and individual and sectoral bargaining coverage
have distinct and significant effects on the probability of low pay, whereas the effect of sectoral
union density is not statistically significant. The analysis of the cross-level interaction between
individual union membership and sectoral union density supports the claims of the I-O
approach, as non-union members are more exposed to the risk of low pay in highly unionised
sectors. In contrast, the probability of being in low pay decreases also for those workers who
are not covered by collective agreements - even though to a lower extent than those who are
covered - with the increase of sectoral bargaining coverage, in line with the expectations of the
employment relations literature adopting a power resource (PR) approach.
Thus, these findings confirm the value of our multi-level fine-grained approach to the analysis
of low pay, strengthening a mounting body of multi-level research on labour market
segmentation across countries and sectors (e.g. Baccaro et al., 2016; Bol and Weeden 2015).
More specifically, this article advances the debate on the relationship between IR institutions
and low pay by partly reconciling the different positions of the two dominant theoretical
approaches. Its contribution consists in the conceptualisation of the effects of union
membership and collective bargaining at individual and sectoral level as distinct as well as in
4
its analysis of their cross-level interaction. By so doing, this article shows that the I-O literature
correctly predicts that non-union members are at greater disadvantage in highly unionised
sectors whereas the PR approach is correct in expecting sectoral collective bargaining to benefit
the whole workforce.
The next section illustrates the debate on IR institutions and low pay and the second section
develops the hypotheses. Two subsequent sections describe the empirical approach and present
the results. The theoretical implications of the findings are discussed in the final section.
Industrial Relations and Low Pay
The debate: Low pay in advanced political economies
While low pay has been increasing almost everywhere, the extent to which it has done so varies
substantially across most advanced political economies (McKnight et al. 2016). To explain this
phenomenon, scholars have analysed the role of IR institutions and have attributed this rise to
declining collective bargaining coverage and union density (Gautiè and Schmitt 2010;
Grimshaw 2011; Palier and Thelen 2010). Despite a consensus around the crucial role that
these institutions play in wage setting, previous studies have provided drastically different
interpretations of the link between IR institutions and low pay.
Employment relations scholars argue that the erosion of IR institutions impairs the
redistribution of income from capital to labour. Where unions are strong, whether in terms of
membership and of institutionalised collective bargaining rights, they use their power to
redistribute from capital to labour, to the benefit of the whole workforce (Gautiè and Schmitt
2010; Kristal 2010). Indeed, studies in the private and public sector in Europe and the US find
5
that strong unions contribute to better and more homogenous labour market outcomes, reducing
the diffusion of low pay (Gautiè and Schmitt, 2010, Grimshaw et al. 2015). There is also good
evidence that unions are increasing their bargaining efforts to protect the income of low-skilled,
marginal and vulnerable workers, even when they are not their members (Durazzi et al. 2018;
Doellgast et al. 2018; Pulignano et al. 2015).
In contrast, the dualization literature argues that unions act exclusively to protect the interests
of their members, neglecting the needs of marginal workers, who are often not unionised
(Emmenegger et al. 2012; Palier and Thelen, 2010). As unions become less powerful and cover
increasingly limited segments of the workforce, their attempt to bargain benefits for their
members might go at the expenses of peripheral workers, who are pushed into low-pay
precarious job positions. These dynamics have for instance been observed in South Korean
large enterprises (Yang, 2006) and German manufacturing (Hassel, 2014). In this view, IR
institutions only benefit large segments of the workforce when union density remains high
because this incentivises unions to represent a broad range of workers even in the context of
increasing liberalization (Thelen, 2014; Author B).
The conflicting expectations and contradictory findings of these two literatures concerning the
effect of IR institutions on low pay raise the following question: Do IR institutions only benefit
those who are covered, possibly even at the disadvantage of those workers who are not, or do
they benefit the workforce as a whole regardless of membership or individual coverage? This
article contends that these two different positions can be partly reconciled by distinguishing
between two IR institutions - collective bargaining and unions - and two levels of analysis -
individual versus sectoral.
Indeed, the dualization literature suggests that only individual inclusion in the representation
and bargaining domain of the union protect workers from low pay; IR institutions are
6
considered to be detrimental to those workers who are not covered. By contrast, the
employment relations literature points at the diffused effect of strong IR institutions on the
incidence of low pay even beyond the domain of collective representation.
The significance of the German case for the low pay debate
A critical case for the academic debate illustrated above is the German labour market. Germany
has been at the centre of recent debates on labour market segmentation because the low pay
sector has been growing to unexpected levels – it was around 18% of the workforce in 2017
according to the OECD (2019) -, considering that the country used to be considered a model
of ‘social capitalism’ (Albert 1993). Furthermore, the role of IR in the transformation of the
German labour market is particularly controversial. While some scholars have argued that
insider-focused unions have contributed to labour market segmentation (e.g. Hassel, 2014;
Palier and Thelen, 2010), others have claimed that IR institutions have been actually preventing
the further expansion of low pay, which is rather imputable to their erosion (e.g. Author A et
al., 2016). Indeed, sectoral collective bargaining and union density have dropped from 73% of
employees’ coverage to 56% and from 26% to 17%, respectively, between 1998 and 2017
(OECD, 2019).
In response to the increase of low pay, the German government introduced an hourly minimum
wage in 2015, whose level however corresponds to 48% of the median wage while the low pay
threshold, as defined by the OECD, is 67% of the median wage (Schulten and Luebker 2019).
Thus, despite overall erosion of IR institutions, collective bargaining is still the major
institutional instrument of wage setting in Germany which can affect the incidence of low pay
(Fitzenberger et al., 2013).
7
Germany has one major trade union confederation, with eight sectoral trade unions as members.
Those unions bargain with the sectoral employer association on behalf of the whole workforce
in one sector, independently of occupations and skill levels; the salary level set by sectoral
agreements are broadly similar across Federal States even though they are adjusted to the local
price levels and labour market conditions. Companies belonging to the employer association
are required to, with some exceptions, apply the collective agreement, which covers all workers
in the company, unionised or not. While sectoral agreements are the main negotiated wage-
setting mechanism, companies can also have company-level agreements, which most often just
integrate the sectoral agreements e.g. through variable pay. Yet, only a minority of workers are
covered exclusively by company-level agreements. In the SOEP survey data (wave 2015),
52.5% workers were covered by no agreement, 36.5% by a sectoral agreement, and only 11%
by a firm level agreement.
Being a union member in Germany therefore does not necessarily imply being covered by
collective agreements, and conversely, non-union members might be covered by collective
agreements. While this is similar to most continental European countries such as Austria,
France, Italy and Sweden, this contrasts markedly from Anglo-Saxon systems, where union
membership and collective bargaining agreements are more intimately linked, even though
with some exceptions e.g. the British academic sector (Barry and Wilkinson 2011). Crucially,
at the sectoral level, collective bargaining coverage does not only depend on union density but
also on the density of the employer association, as the collective agreement gets extended to
all member companies– except for those companies which requested an exemption.
Furthermore, the government can extend the collective agreement to the whole sector if one of
the social partners requests it and collective bargaining agreements cover 50% of the employees
in that sector, even though this practice has become rarer over time (Bispinck et al., 2010).
8
Thus, the characteristics of the German systems, which are shared with many other so called
‘coordinated’ and mixed market economies (Hancké et al. 2007), require distinguishing
between bargaining coverage and unionisation at both individual and sectoral level. The
substantial variation in sectoral bargaining coverage and union density across sectors
(Eichhorst et al., 2013) also makes it possible to explore the effect of IR institutions while
keeping other factors constant, which might vary across countries and impact the low pay
sector, including for example government partisanship, culture and the fiscal system.
Individual and sectoral effects of IR institutions on low pay
The two theories on the role of IR institutions for low pay discussed above - the I-O approach
and the PR approach - rely on two fundamentally different starting theoretical positions and
they focus on different mechanisms operating at distinct levels.
The I-O approach was originally developed by the economics literature even though it is now
used in sociology and political economy as well, as part of a wider dualization literature.
Unions are not only argued to benefit their members, the so called ‘insiders’, more than
outsiders, but also expected to do so at the expense of the latter: when unions push for excessive
wage demands for insiders, this results in lower labour demand and hence higher
unemployment for outsiders (Lindbeck and Snower, 2002; Saint-Paul, 2002). This ultimately
leads to a higher probability of low pay for workers who are not covered by IR institutions.
Higher unemployment negatively affects wages as employees are more likely to accept lower
wages when it is difficult to find another job (Carneiro and Portugal, 2008). In addition,
employers may need to hire outsiders on low pay contracts to reduce labour costs if unions
raise the salary level for their members (Lindbeck and Snower, 2002: 11).
9
These detrimental effects of IR institutions are contested by the PR approach, which was
developed by the sociologist Walter Korpi (1983) and is now typically used by employment
relations and sociology scholars. This approach suggests that wage inequality mainly depends
on whether unions have sufficient power to bargain for the benefit of the weakest members of
the workforce, as unions are assumed to act in the interest of the whole working class. Strong
unions, in terms of institutionalised collective bargaining rights and/or mobilisation potential,
are therefore expected to redistribute income from capital to workers, even when they are not
their members (Kristal 2010; Rueda and Pontusson 2000). Through the negotiation of wage
agreements, the union acts therefore as a provider of collective goods (Olson 1965), a role that
is in contrast with the role assigned to unions by the I-O approach but rather central to research
on low pay in the fields of sociology and employment relations.
The two approaches therefore focus on different levels of analysis. Whereas the PR approach
points to the crucial positive impact of (strong) unions within their bargaining domain, which
could be the workplace, the sector and sometimes even the country (Gallie 2007; Pulignano et
al. 2015; Doellgast et al. 2018), the I-O approach focuses on the effects of unions on
individuals, who are ‘in’ or ‘out of’ the union (Lindbeck and Snower 2002; Saint-Paul 2002;
Palier and Thelen 2010). To derive clear testable hypotheses it is important to distinguish
analytically between mechanisms linking the probability of low pay to being individually
covered by IR institutions on the one hand, and to the sectoral strength of IR institutions on the
other hand. Given the specificities of the systems of IR in Germany explained above, it is
necessary to further distinguish between collective bargaining coverage and union membership
to avoid conflating the effects of different IR institutions.
Low pay and IR coverage at the individual level
10
While the I-O approach suggests that collective agreements defend the particularistic interests
of union members (Lindbeck and Snower 2002), employment relations scholars follow the PR
approach in arguing that collective agreements are typically associated with wage compression
because unions want to promote solidarity and implement ‘equal pay for equal work’. In this
latter view, unions try to standardise wages across establishments, at least within one sector,
and to flatten the wage differences across skill groups (Card et al., 2004; Freeman and Medoff,
1984). Despite these differences, scholars belonging to both streams agree that collective
agreements provide a wage premium to those covered by them, depending on the organisation,
industry and market (Blanchflower and Bryson, 2004; Budd and Na, 2000). Thus, hypothesis
1a is as follows:
Hypothesis 1a: Individual coverage by collective agreement is associated with a lower
probability of being low paid.
In countries with a collective bargaining system similar to the German system, unions cannot
bargain individual wage premia for union members (Fitzenberger et al. 2013: 171) because
they cannot exclude non-members from collective agreements. Yet, union members may,
everything else being equal, earn more than non-members (Becher and Pontusson, 2011).
Union members may develop higher productivity through better access to training or they may
have greater individual bargaining power in their negotiations with employers, who then
discriminate against non-members (Budd and Na, 2000: 784). Thus, hypothesis 1b is as
follows:
Hypothesis 1b: Union membership is associated with a lower probability of being low
paid.
11
Low pay and IR coverage at the sectoral level
ER scholars consider that a fundamental power resource for labour is the existence of
institutional mechanisms for extending collective agreements beyond their membership. These
extensions are typical of the German system and other continental European systems where
sectoral bargaining is the main union bargaining domain (see previous section and Schulten
2016 for an overview of these mechanisms in Europe). Thanks to these institutional
mechanisms, unions act as a provider of collective goods because the agreements cover larger
segments of the workforce within the sector (Gautiè and Schmitt 2010; Grimshaw 2011;
Doellgast et al. 2018).
Sectoral collective bargaining systems also affect unions’ bargaining strategies: unions
bargaining primarily at sectoral level are less likely to engage in ‘aggressive’ rent-seeking for
their members than unions in decentralised systems like in Anglo-Saxon countries (Hartog et
al. 2002). In addition, sectoral agreements are more likely to compress wages in a way which
benefit low-skill workers, who are at higher risk of low pay (Magda et al. 2012). However, the
effect of collective agreements can be even wider than their coverage because collective
agreements can set standards even for firms which do not officially apply them. Indeed,
encompassing collective agreements were found to have spillover effects also on uncovered
employers by introducing wage rigidities in local labour markets, protecting employees from
pay fluctuations (Elliot and Hemmings 1991). For instance, in Germany, non-covered
companies were found to pay lower wages compared to covered companies, but to orient their
wage scales towards collectively agreed standards, thus reducing low pay (Addison et al. 2016).
Thus, hypothesis 2a is as follows:
Hypothesis 2a: Sectoral bargaining coverage is negatively associated with the
probability of being low paid for workers in that sector.
12
Union density can also have an independent effect from sectoral bargaining coverage.
Consistent with the PR approach (Korpi 1983), high union density might have a ‘threat effect’
on employers. Where strong, unions can redistribute in favour of the workers, whether they are
members or not, because employers fear mobilization or further unionization and therefore pay
higher wages to all workers, regardless of membership (Fitzenberger et al. 2013; Rosen, 1969).
Furthermore, PR scholars argue that high unionisation contributes to lower wage inequality
because unions institutionalise norms of equity in the wider society (Western and Rosenfeld
2011; Mosimann and Pontusson 2017). Hypothesis 2b is as follows:
Hypothesis 2b: Sectoral union density is negatively associated with the probability of
being low paid for workers in that sector.
Low pay and the cross-level interplay between IR institutions
While the previous discussion considered individual-level and sectoral-level IR institutions
separately, the effect of individual-level inclusion by IR institutions (i.e. being a union member
and/or being covered by an agreement) is likely to depend on the sectoral strength of IR
institutions (i.e. the level of union density and of bargaining coverage). Yet, as illustrated
below, the I-O approach and the PR approach have different expectations regarding the effect
of e.g. strong IR institutions on the incidence of low pay for covered vs. uncovered workers.
ER scholars who understand collective bargaining coverage as a measure of labour power in
the sector (e.g. Mishel, 1986) expect that, as the sectoral collective bargaining coverage rises,
the low-pay risk of both covered and non-covered individuals decreases. As mentioned above,
collective agreements were found to affect the wage-setting strategies even of those companies
which are not covered by introducing wage rigidities in the labour market (Elliot and
Hemmings 1991). In contrast, when the collective bargaining coverage is low, such a diffused
13
effect of collective agreements cannot be expected; in those sectors, only covered workers
would benefit of the protection of collective agreements against low pay. Hence, the overall
expectation is that the gap in the probability of low-pay risk between individuals who are
covered and not covered falls as the sectoral bargaining coverage increases. The following
hypothesis can be formulated:
Hypothesis 3a: High sectoral bargaining coverage is associated with a lower gap in
the probability of being low paid than low sectoral bargaining coverage.
On the other hand, the I-O approach would expect workers that are not covered to be at higher
risk of low pay in those sectors characterised by high coverage (Lindbeck and Snower, 2002).
This expectation is consistent with two plausible mechanisms: the uncovered sector could be
‘overcrowded’ due to the lower employment resulting from high wages in a large covered
sector (Fitzenberger et al., 2013) and/or employers may choose to keep labour costs low in the
uncovered sector to be able to pay the covered workers according to the collective agreement
(Lindbeck and Snower, 2002). In contrast, collective agreements with a low coverage should
have less ‘disruptive’ effects on the labour market and therefore non-covered workers should
be less disadvantaged than in high-coverage sectors. Thus, hypothesis 3b is as follows:
Hypothesis 3b: High sectoral bargaining coverage is associated with a higher gap in
the probability of being low paid than low sectoral bargaining coverage.
Both the PR approach and the I-O approach agree on the protective effects of individual union
membership when unions are strong. The stronger the union, as captured by sectoral union
density, the greater the protective effect of being a union member. By contrast, similarly to the
previous set of hypotheses, these approaches have different expectations when it comes to non-
members, and particularly how the low-pay risk of non-members relative to that of union
members.
14
The PR approach would expect the ‘mobilisation threat’ of strong unions to force employers
to raise overall wage standards or to enforce existing standards, reducing the low-pay risk for
both union and non-union members (Rosen 1969; Corneo and Lucifora 1997). When union
density is low, however, the threat of mobilisation helps to protect, if at all, only union
members, who are supposed to be already protected from low pay because of additional training
or greater individual bargaining power (see hypothesis 1b above). In contrast, those workers
who are not union members are more exposed to low-pay risk in sectors characterised by weak
unions (Gautiè and Schmitt 2010). Hence, the following hypothesis 4a can be formulated:
Hypothesis 4a: The gap in the probability of being low paid is lower in sectors with
strong unions than in sectors with weak unions.
In contrast, the I-O approach would expect strong unions to drive wages up for their members
while non-members remain on low-pay contracts or even suffer from salary deterioration
because of union rent-seeking behaviour (Lindbeck and Snower 2002). As a result, if union
density is low, they should be less able to appropriate rents and therefore allow for a ‘fairer’
income distribution between insiders and outsiders. Thus, these scholars would expect the
following hypothesis 4b:
Hypothesis 4b: The gap in the probability of being low-paid is higher in sectors with
strong unions than in sectors with weak unions.
15
Empirical approach
The analysis relies on the 2015 wave of the German Socio-Economic Panel. The sample is
restricted to respondents aged 15 to 65 resulting in between 11,500 and 13,000 respondents
depending on the independent variables. Detailed descriptive and summary statistics can be
found in the online appendix.
The dependent variable is created using the hourly wage. It is calculated as follows: the annual
salary from the respondent’s main job is divided by the number of weekly hours actually
workedmultiplied by 52, i.e. the average number of weeks in a year. If the resulting hourly pay
is lower than 8.5€, which is 67% of the median hourly wage, it can be categorized as low pay
and is therefore coded 1. If not, the low pay dummy is coded 0. About 25% of the sample is
coded as low pay.
The key independent variables at the individual level are union membership and being covered
by a sectoral wage bargaining agreement. Two dichotomous variables are created: ‘union
member’ is coded 1 if the respondent is a current union member, and 0 otherwise; and ‘covered
by agreement’ is coded 1 if the respondent is covered by sectoral agreement, and 0 otherwise.
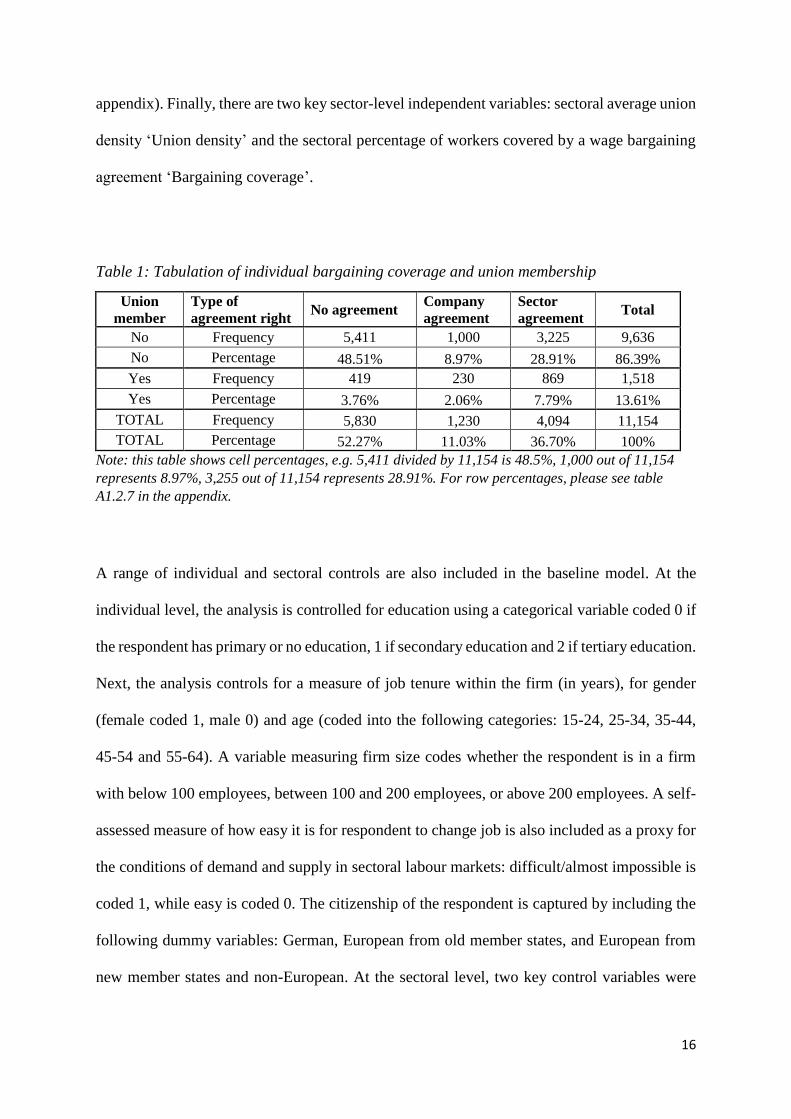
These two individual characteristics are neither theoretically equivalent nor overlap strongly
empirically (see table 1). About 48.5% of respondents in the sample are neither in unions nor
covered by a sectoral bargaining agreement. Almost 3.8% are union members but not covered
by an agreement, while almost 8% are members and covered by an agreement. Slightly under
29% are not union members but covered by an agreement.
While almost 37% of respondents are covered by a sectoral agreement and 52% are not covered
by an agreement, it is noteworthy that 11% are covered by a company but not a sectoral
agreement. In the baseline model these are coded as 0, but as a robustness check the analysis
was rerun when both sectoral and firm level agreement are coded as 1 (section A2.5 in
16
appendix). Finally, there are two key sector-level independent variables: sectoral average union
density ‘Union density’ and the sectoral percentage of workers covered by a wage bargaining
agreement ‘Bargaining coverage’.
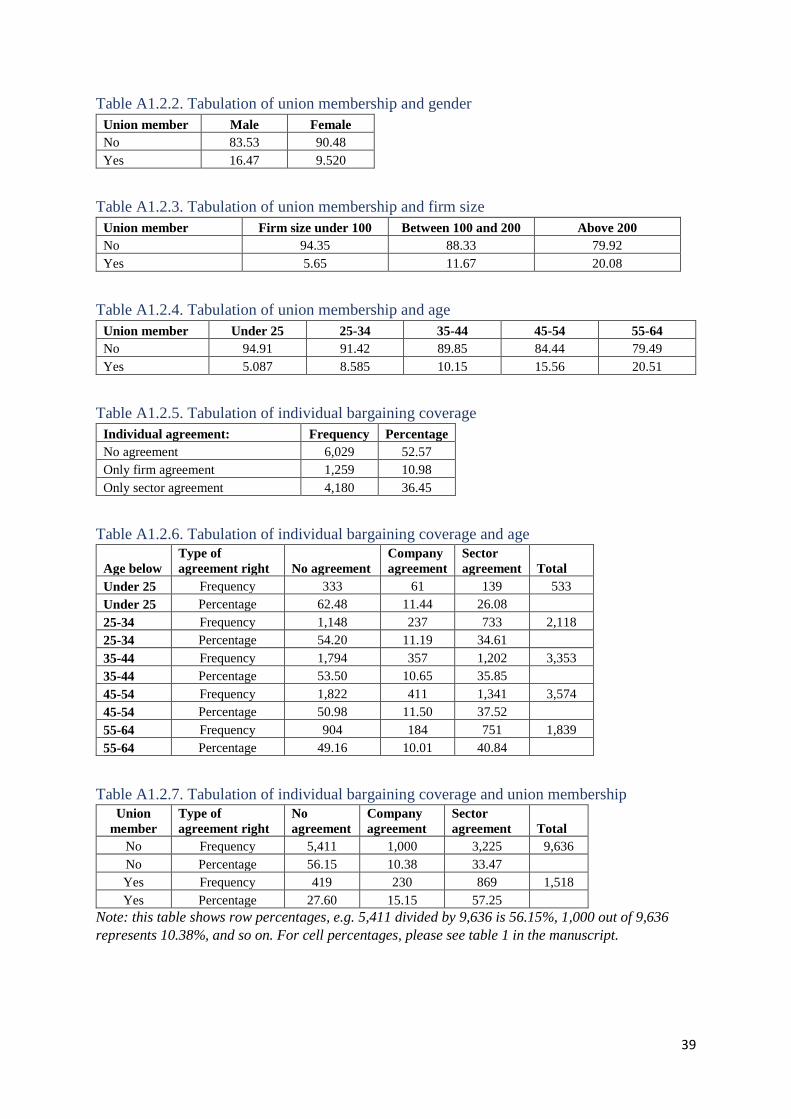
Table 1: Tabulation of individual bargaining coverage and union membership
Union
member
Type of
agreement right No agreement
Company
agreement
Sector
agreement Total
No Frequency 5,411 1,000 3,225 9,636
No Percentage 48.51% 8.97% 28.91% 86.39%
Yes Frequency 419 230 869 1,518
Yes Percentage 3.76% 2.06% 7.79% 13.61%
TOTAL Frequency 5,830 1,230 4,094 11,154
TOTAL Percentage 52.27% 11.03% 36.70% 100%
Note: this table shows cell percentages, e.g. 5,411 divided by 11,154 is 48.5%, 1,000 out of 11,154
represents 8.97%, 3,255 out of 11,154 represents 28.91%. For row percentages, please see table
A1.2.7 in the appendix.
A range of individual and sectoral controls are also included in the baseline model. At the
individual level, the analysis is controlled for education using a categorical variable coded 0 if
the respondent has primary or no education, 1 if secondary education and 2 if tertiary education.
Next, the analysis controls for a measure of job tenure within the firm (in years), for gender
(female coded 1, male 0) and age (coded into the following categories: 15-24, 25-34, 35-44,
45-54 and 55-64). A variable measuring firm size codes whether the respondent is in a firm
with below 100 employees, between 100 and 200 employees, or above 200 employees. A self-
assessed measure of how easy it is for respondent to change job is also included as a proxy for
the conditions of demand and supply in sectoral labour markets: difficult/almost impossible is
coded 1, while easy is coded 0. The citizenship of the respondent is captured by including the
following dummy variables: German, European from old member states, and European from
new member states and non-European. At the sectoral level, two key control variables were
17
included in the baseline model: the average measure of job change and the share of female
respondents.
The analysis relies on a series of multilevel logistic regressions. This method allows testing the
effect of both individual and sectoral level variables on individual-level outcomes - both their
direct effect and their effect in interaction with individual-level variables (Mathieu et al., 2012).
In a first step, the null model is estimated to assess whether the data structure is nested and
requires multilevel modelling. The ICC value is equal to .17426, which indicates that 17.4%
of the variance takes place at sectoral level. As a further confirmation, a series of sector-specific
logistic regression on union membership and being covered by collective bargaining revealed
wide variation in the size and significance of being a union member and being covered by an
agreement on the probability of being in a low-pay job across sectors (see Figure A1 in
Appendix). Therefore, ignoring the clustering of data by using a single-level (i.e. pooled) model
would lead to biased results (Mathieu et al. 2012).
Hence, in a second step, the multilevel logistic regression including all variables was run and,
as a third step, cross-level interaction terms were fitted to test the conditioning effect of
sectoral-level variables. Stata15 is used to run the analysis through the command melogit.
Following the guidelines of Stata (2017), the coefficients of the interaction terms are not
interpreted from the regression table but analysed using the commands margins and
marginsplot in order to illustrate the marginal effects.
A multilevel approach is widely seen as superior to ignoring the hierarchical structure of the
data and reporting robust clustered standard error (Gelman 2006: 434; DiPrete and Forristal
1994: 348). That being said, the analysis was also rerun using multilevel mixed effects linear
models, with and without robust standard errors clustered at the sectoral level, and normal OLS
regressions with sector fixed effects (see online appendix).
18
Results
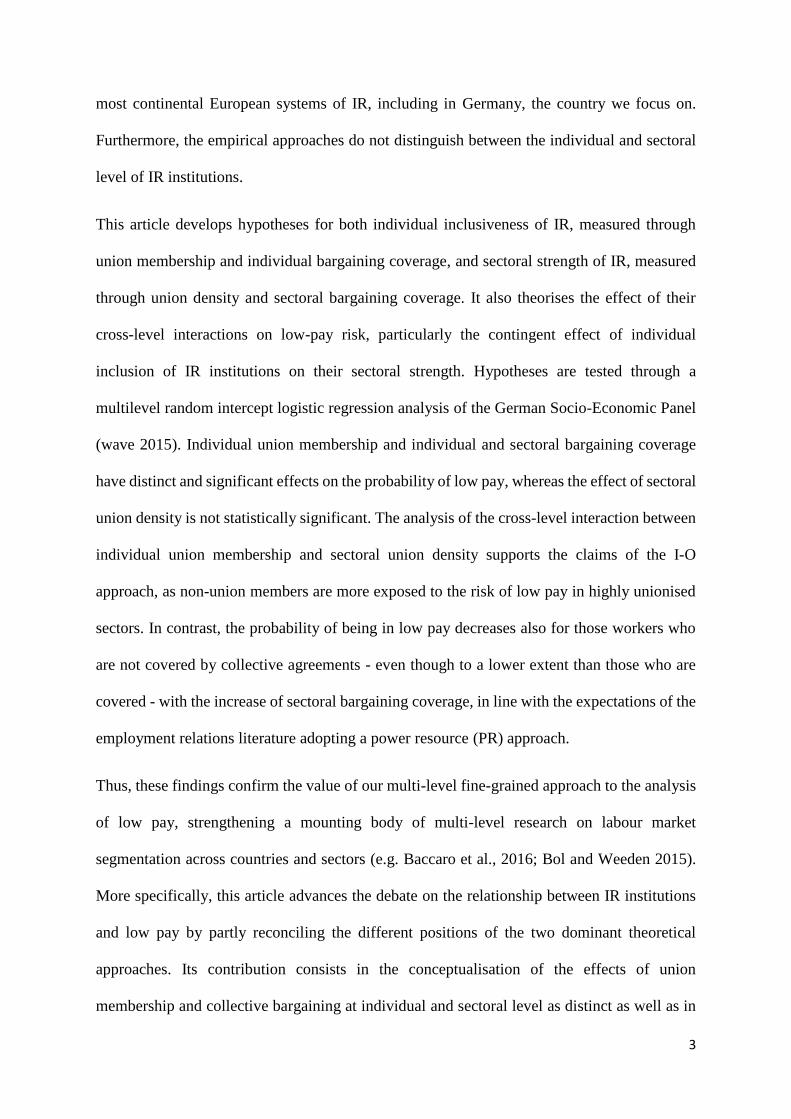
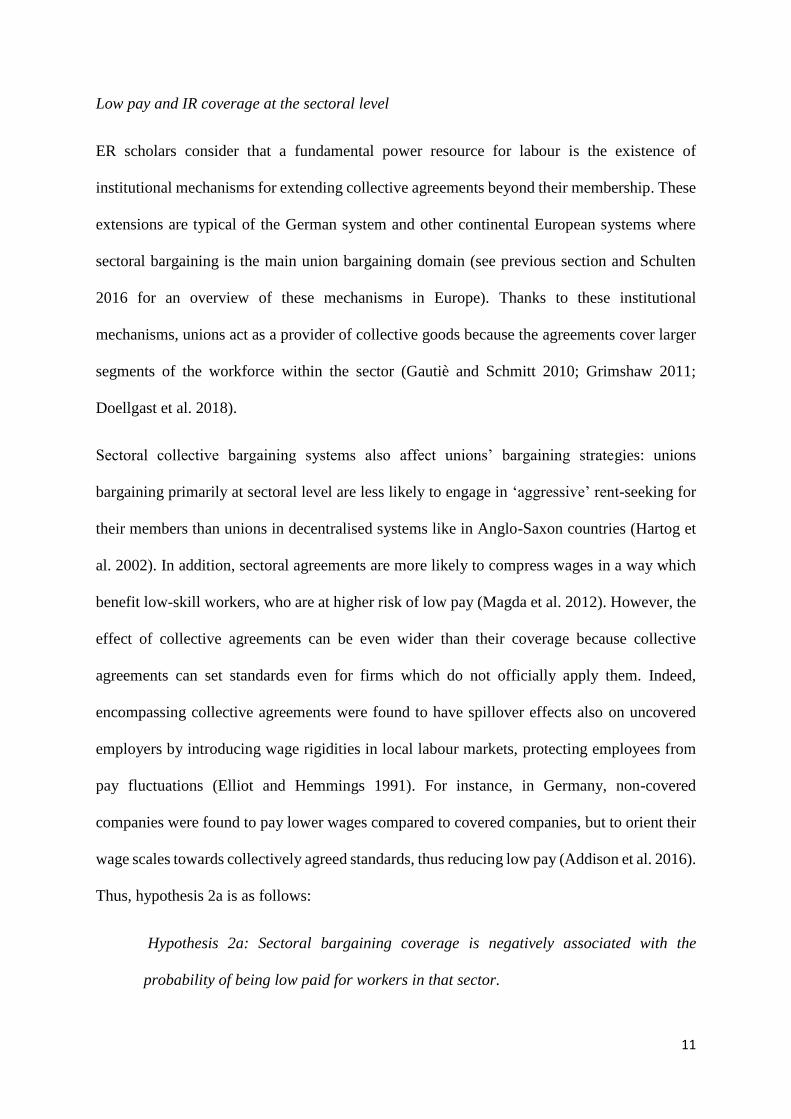
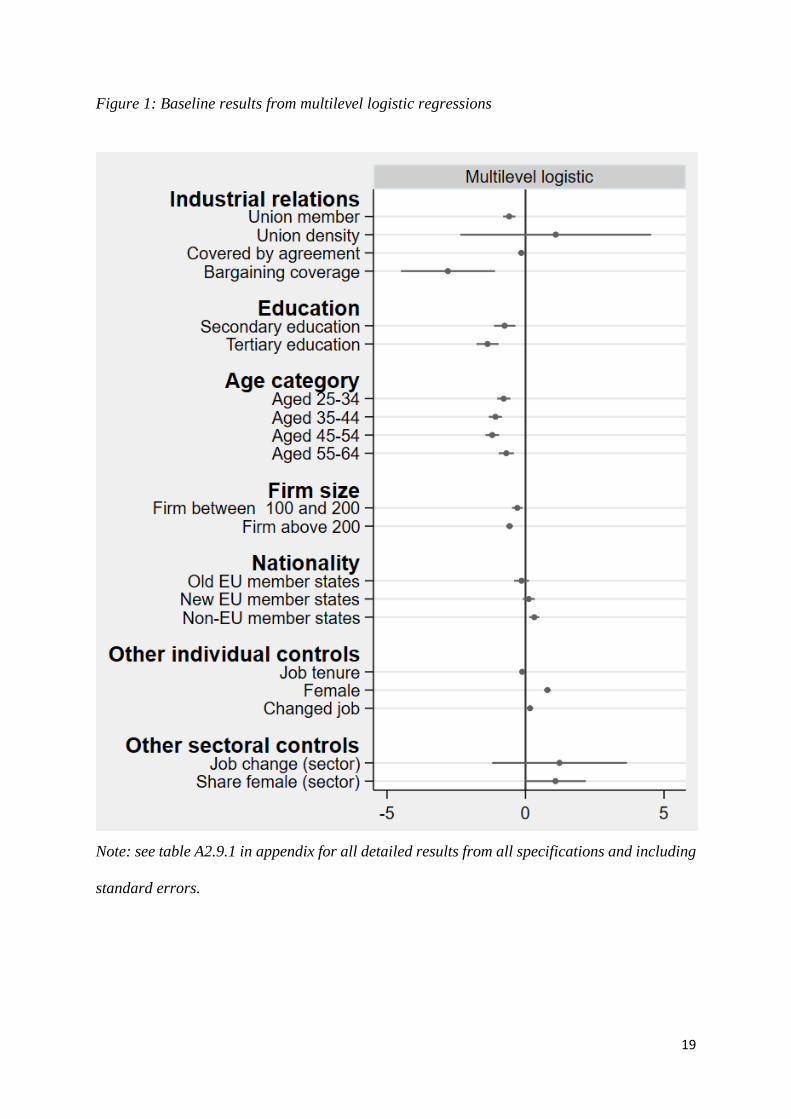
Figure 1 reports the coefficients plotted as small circles of the model with only key controls.
The bars around the point estimate indicate the 90% confidence interval and the full results for
all specifications can be found in Table A2.8.1 in the appendix. Education has the expected
effect: those with secondary and tertiary education are less likely to be in low-pay jobs than
those without (the reference category). Middle-aged respondents are less likely to be in low
pay than respondents above 55 years old, who are themselves less likely to be in low-pay jobs
than those under 25 years (the reference category). Female respondents are more likely to be
in low-pay jobs. Respondents in larger firms are less likely to be in low-pay jobs, while those
from non-EU member states are more likely to be in such a job than Germans, although it is
noteworthy that there is no effect for other EU member states (old or new). The coefficients
for job tenure and likelihood of changing job are also statistically significant.
The first two sets of hypotheses are partly supported. At the individual level, union membership
and being covered by a sectoral agreement are negatively associated with probability of being
on a low pay contract. However, at the sectoral level, while collective bargaining is negative
and statistically significant, this is not the case for union density, whose effect is not significant.
To test the other hypotheses, the same multilevel logistic random intercept models were rerun
including the relevant interaction terms. The results are shown in Figures 2 and 3 which plot
the predicted probabilities for different values of the relevant constituent terms of two
interactions: Figure 2 for sectoral bargaining coverage and being covered by sector agreement
and Figure 3 for union density interacted with union membership. In each case, the bottom
panel also shows the marginal effect of individual-level variable conditional on different values
of the sectoral level variable.
19
Figure 1: Baseline results from multilevel logistic regressions
Note: see table A2.9.1 in appendix for all detailed results from all specifications and including
standard errors.
20
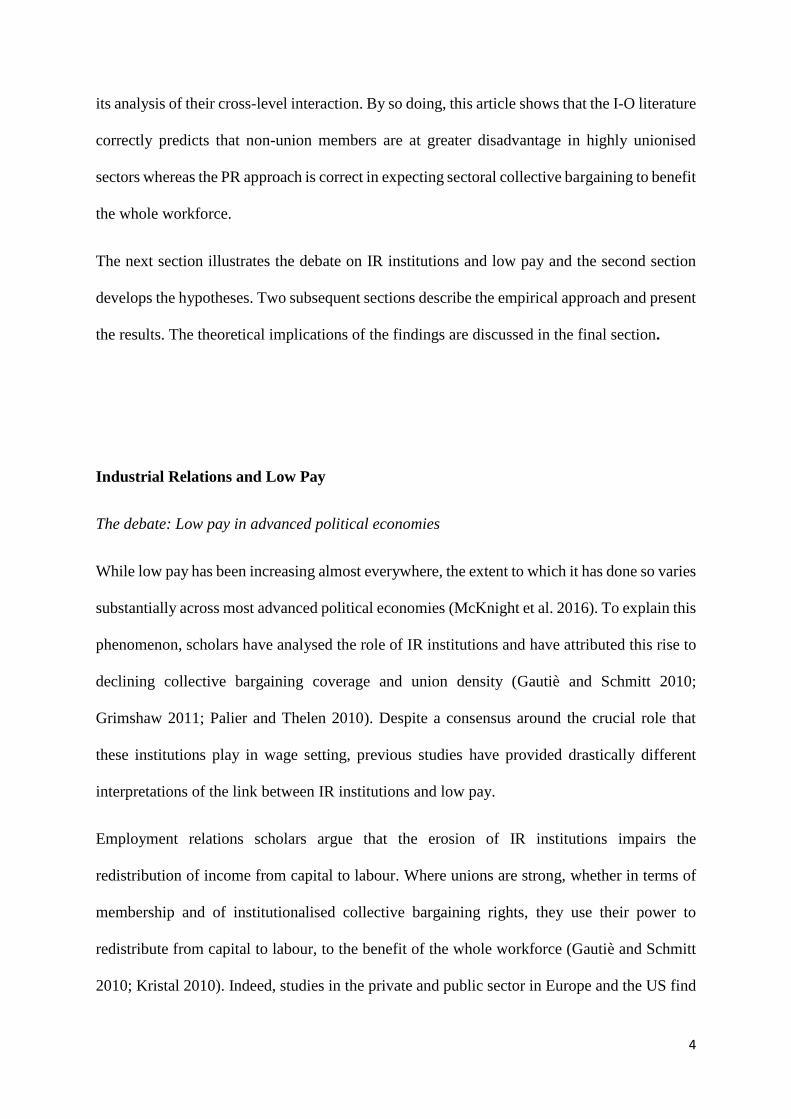
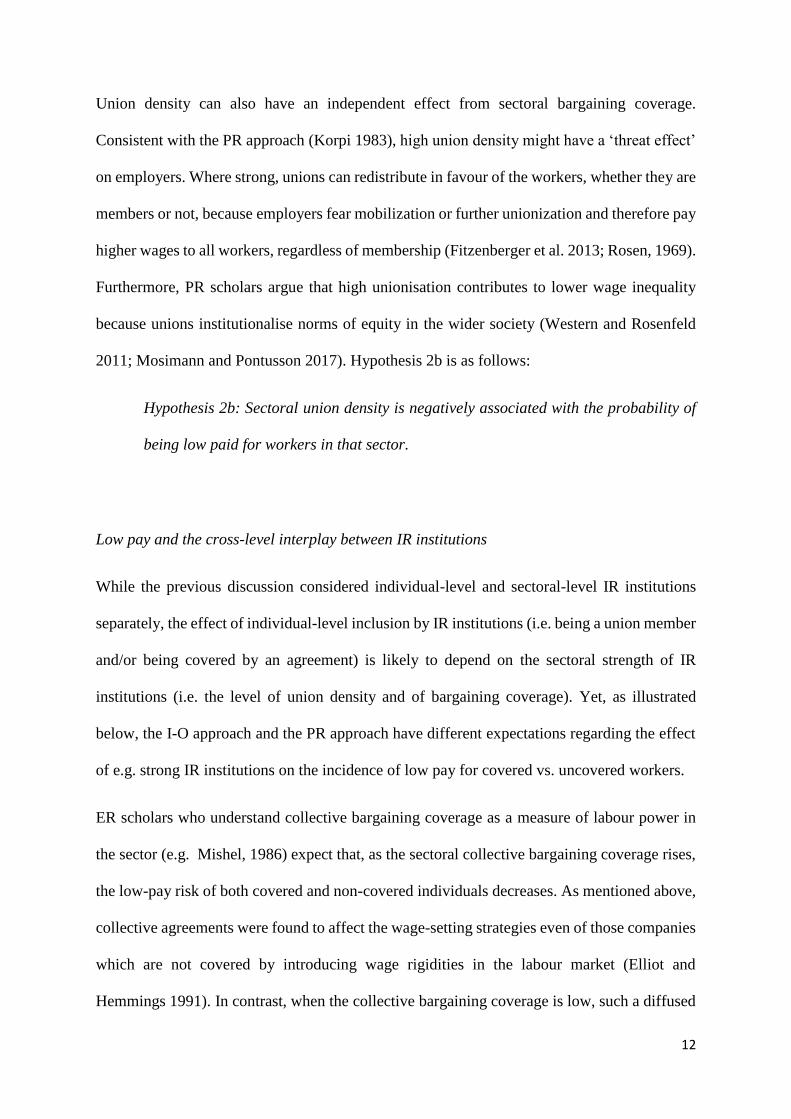
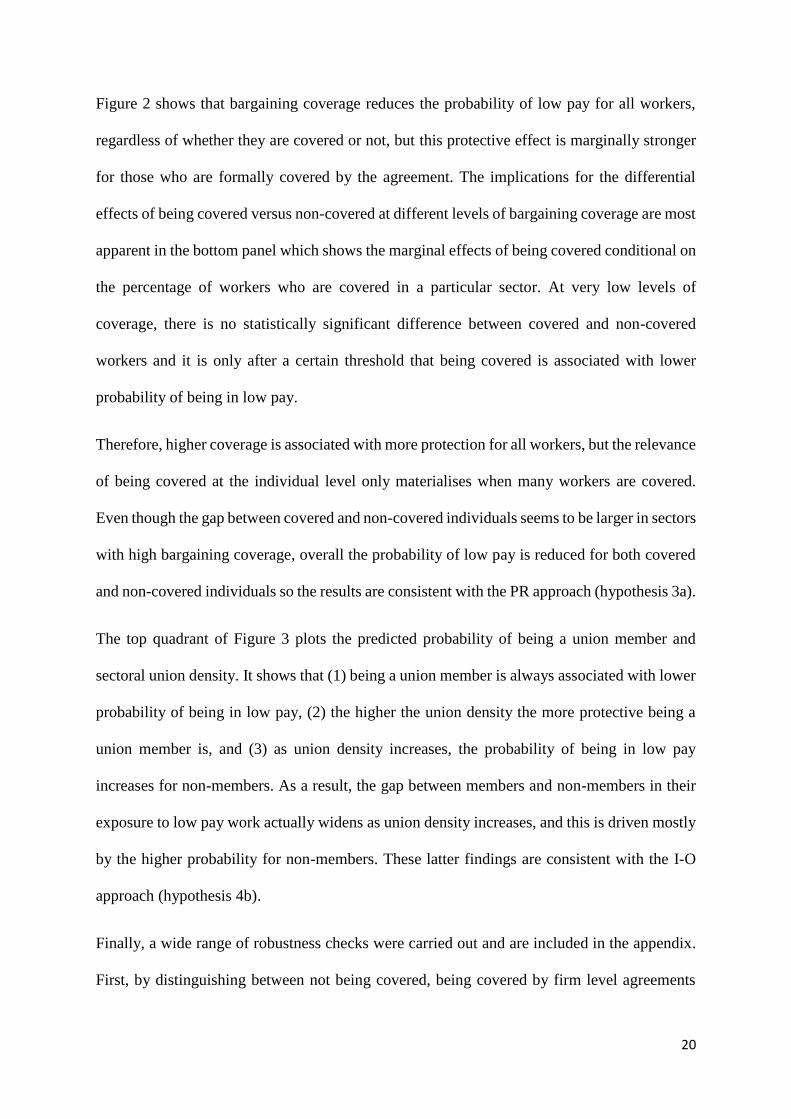
Figure 2 shows that bargaining coverage reduces the probability of low pay for all workers,
regardless of whether they are covered or not, but this protective effect is marginally stronger
for those who are formally covered by the agreement. The implications for the differential
effects of being covered versus non-covered at different levels of bargaining coverage are most
apparent in the bottom panel which shows the marginal effects of being covered conditional on
the percentage of workers who are covered in a particular sector. At very low levels of
coverage, there is no statistically significant difference between covered and non-covered
workers and it is only after a certain threshold that being covered is associated with lower
probability of being in low pay.
Therefore, higher coverage is associated with more protection for all workers, but the relevance
of being covered at the individual level only materialises when many workers are covered.
Even though the gap between covered and non-covered individuals seems to be larger in sectors
with high bargaining coverage, overall the probability of low pay is reduced for both covered
and non-covered individuals so the results are consistent with the PR approach (hypothesis 3a).
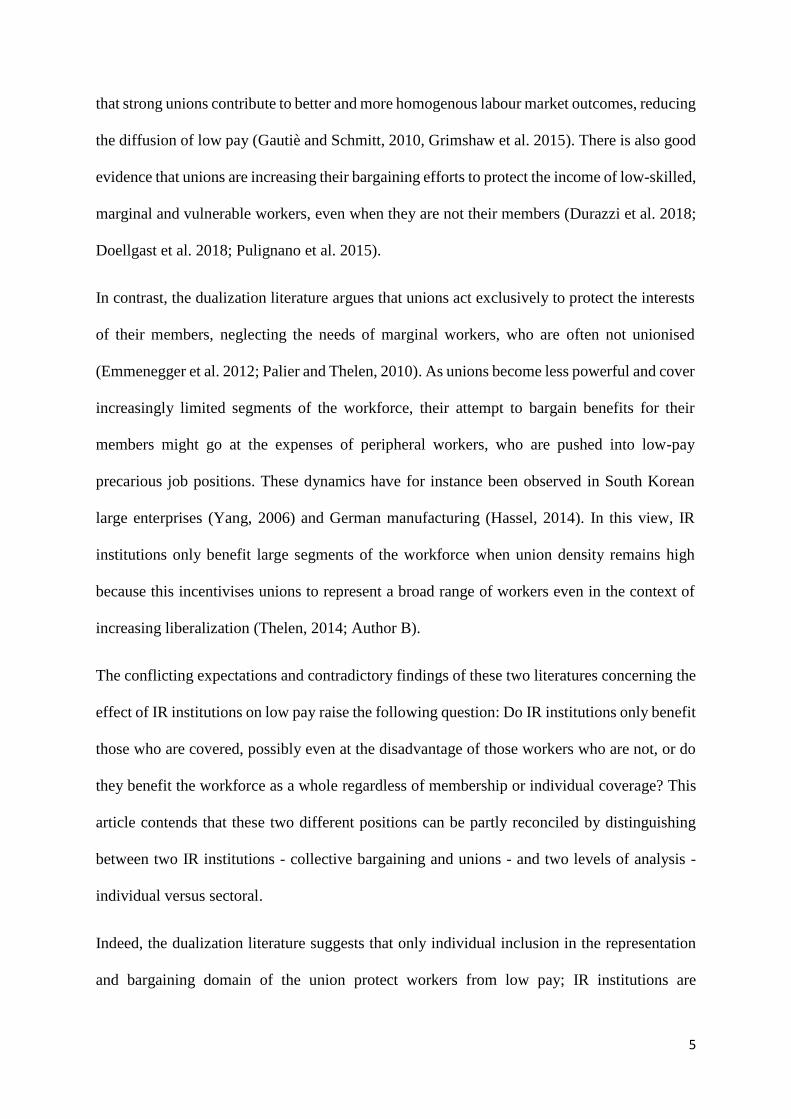
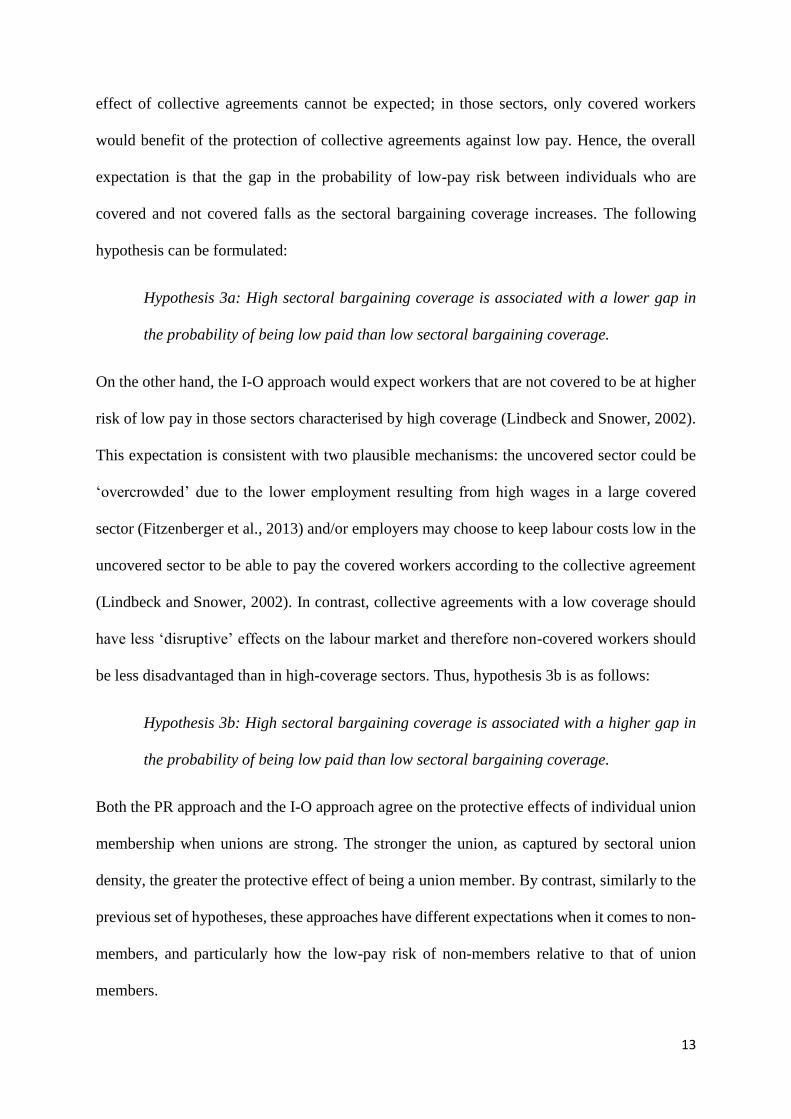
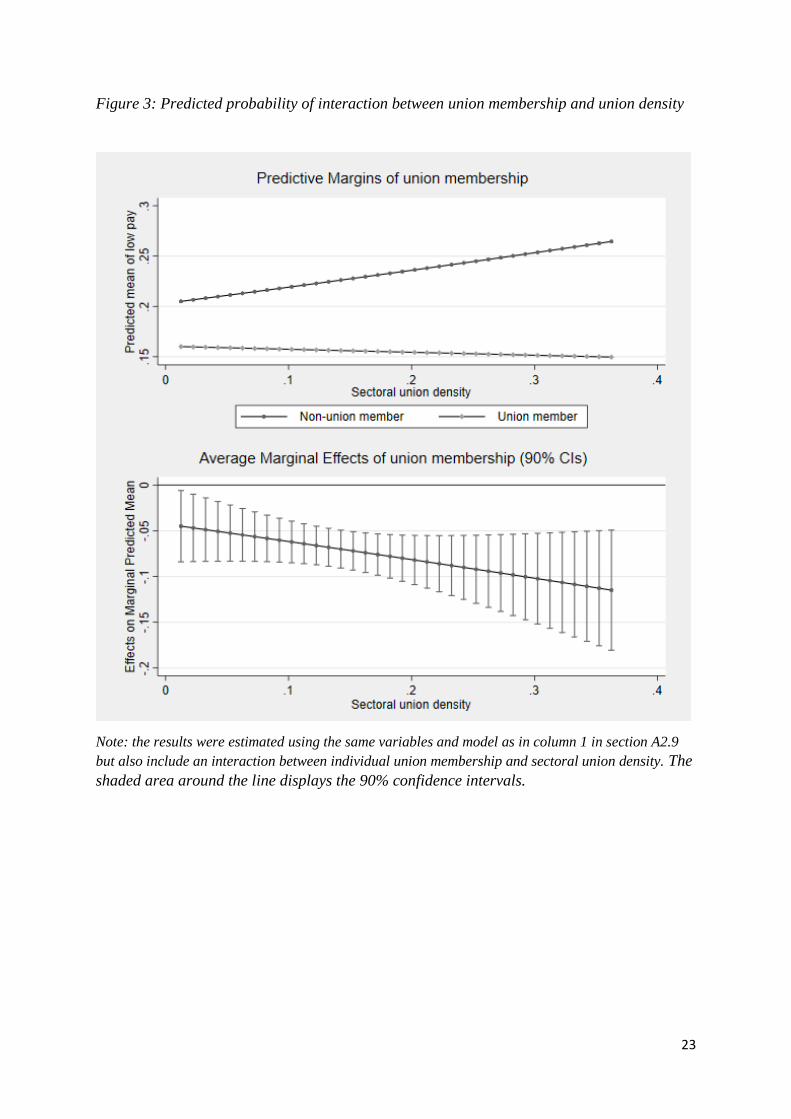
The top quadrant of Figure 3 plots the predicted probability of being a union member and
sectoral union density. It shows that (1) being a union member is always associated with lower
probability of being in low pay, (2) the higher the union density the more protective being a
union member is, and (3) as union density increases, the probability of being in low pay
increases for non-members. As a result, the gap between members and non-members in their
exposure to low pay work actually widens as union density increases, and this is driven mostly
by the higher probability for non-members. These latter findings are consistent with the I-O
approach (hypothesis 4b).
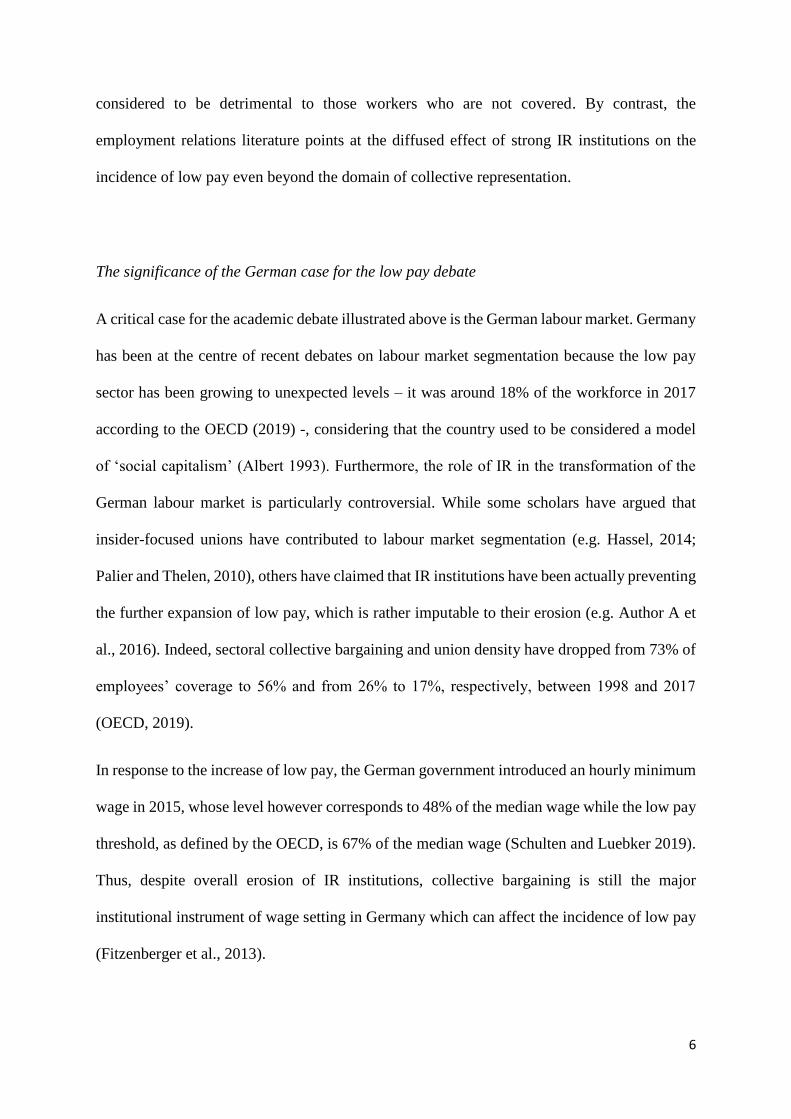
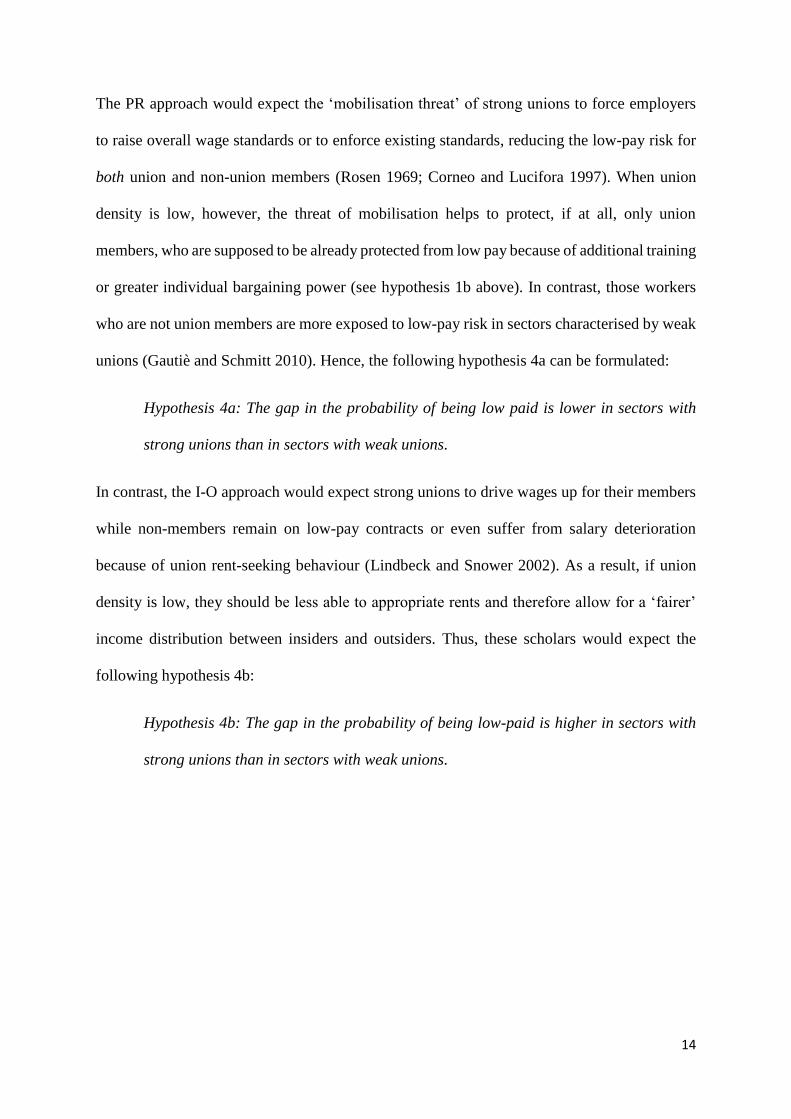
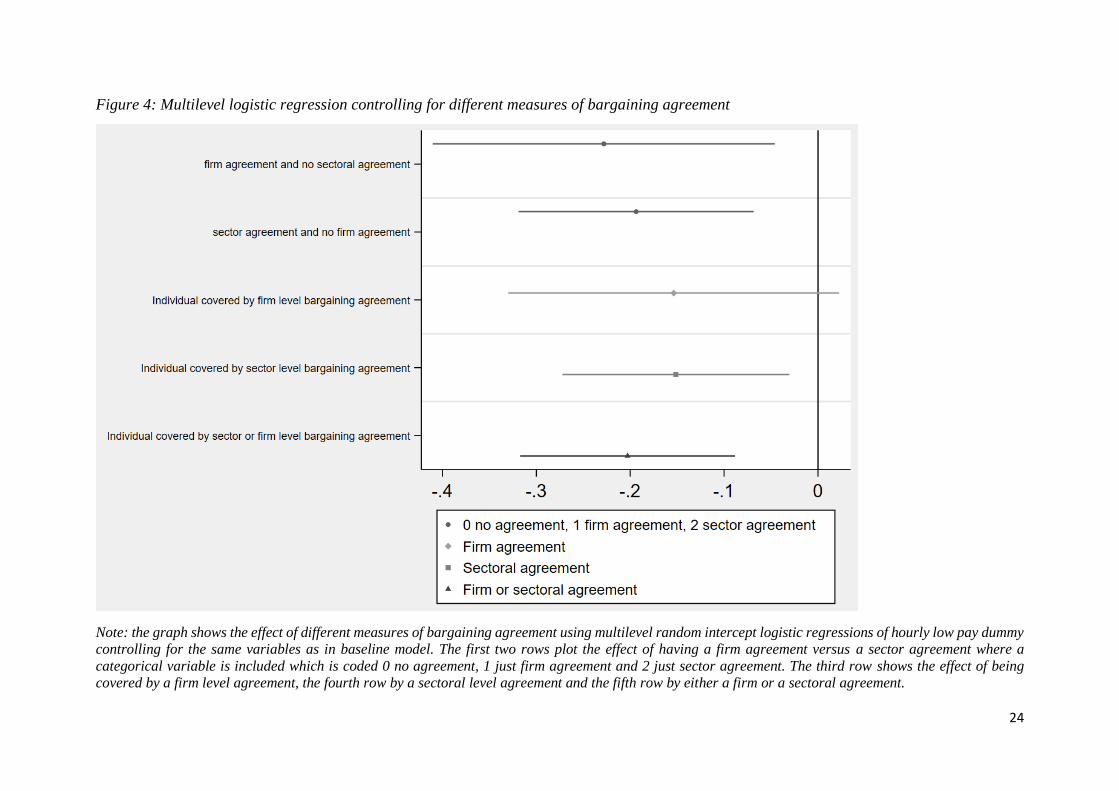
Finally, a wide range of robustness checks were carried out and are included in the appendix.
First, by distinguishing between not being covered, being covered by firm level agreements
21
and being covered by sector-level agreements, the analysis shows that both types of agreements
are negatively associated with low pay probability (see figure 4). Furthermore, by including
firm-level agreements in the sector-level bargaining agreement coverage measure, the negative
correlation between being covered and low pay probability remains statistically significant at
the 10% level. Equally, when replacing the sector-level bargaining coverage agreement by a
variable capturing the percentage of workers covered by either sectoral or company level
agreements the coefficient remains similar (-2.445951, p-value 0.003 for the former compared
to -2.022002, p-value 0.013, for the latter). Next, creating the following three dichotomous
variables confirmed the effect of union membership and being covered: being a union member
not covered, being covered but not a union member, and being both a union member and
covered by agreement. The results suggest that all three variables are negatively related to low
pay and significant, but the effects are larger for having both protections, followed by just
having union membership (without being covered) and by just being covered without being a
member (see figure A2.5.2).
Second, we reproduce our analysis using mixed effects linear regression, reporting robust
clustered standard errors are included (figure A2.2.1), and including sector specific fixed
effects are also the same (figure A2.2.2). Third, including bonuses in the dependent variable
does not change the findings (see table A2.8.1) and controlling for part-time workers (figure
A2.1.2) or public sector workers (figure A2.6.1) does not change our key results. Fourth, our
results are robust to the inclusion of ISCO88 1-digit occupational controls (see sections A2.8)
and to including a dummy for Eastern German states or including state specific fixed effects
(section A2.3). Fifth, controlling for two proxies of sectoral productivity does not change our
results (see section A2.4).
22
Figure 2: Predicted probability of interaction between individual coverage and sectoral
collective bargaining
Note: the results were estimated using the same variables and model as in column 1 in section A2.9
but also include an interaction between sectoral bargaining agreement and sectoral bargaining
coverage. The shaded area around the line displays the 90% confidence intervals.
23
Figure 3: Predicted probability of interaction between union membership and union density
Note: the results were estimated using the same variables and model as in column 1 in section A2.9
but also include an interaction between individual union membership and sectoral union density. The
shaded area around the line displays the 90% confidence intervals.
24
Figure 4: Multilevel logistic regression controlling for different measures of bargaining agreement
Note: the graph shows the effect of different measures of bargaining agreement using multilevel random intercept logistic regressions of hourly low pay dummy
controlling for the same variables as in baseline model. The first two rows plot the effect of having a firm agreement versus a sector agreement where a
categorical variable is included which is coded 0 no agreement, 1 just firm agreement and 2 just sector agreement. The third row shows the effect of being
covered by a firm level agreement, the fourth row by a sectoral level agreement and the fifth row by either a firm or a sectoral agreement.
25
Discussion and conclusion
This article contributes to sociological debates on the relationship between IR institutions and
low pay. On one side of the debate, the central claim of the I-O approach is that unions protect
their members at the expense of so called outsiders and therefore increase the risk of low pay
for the latter group (Hassel, 2014; Lindbeck and Snower, 2002; Palier and Thelen, 2010; Saint-
Paul, 2002 ). On the other side, scholars in the field of employment relations and sociology of
work argue that unions and collective agreements benefit large segments of the workforce
beyond their membership, reducing the overall risk of low pay (Doellgast et al., 2018; Gautiè
and Schmitt, 2010).
In an attempt to critically analyse and systematise the debate as well as to reconcile these
contradicting claims, this article theorised several hypotheses that distinguished between the
effect on individual low-pay risk of union membership and collective agreements at sectoral
and individual level, respectively, and modelled the effect of the interplay between these
factors. The empirical analysis of the German Socio-Economic Panel (wave 2015)
demonstrated the value of a fine-grained multi-level analysis of the relationship between IR
institutions and low pay and yielded several empirical and theoretical contributions.
In line with the individual-level hypotheses, union membership and collective bargaining at
individual level were found to have distinct negative effects. Thus, both forms of individual
‘institutional inclusion’ matter to reduce low-pay risk even though the effect of union
membership is stronger. In addition to greater access to training or negotiating power (Budd
and Na, 2000: 784), this result might also capture the ability of union members to better enforce
the individual or collective terms of their contract (Hogan, 2001). By contrast, workers who
are not in the union, even if covered by a collective agreement, might be unable to enforce its
correct application. The evidence for the effect of institutional strength at the sectoral level was
26
more mixed: while bargaining coverage had a protective effect against low pay, the effect of
union density was not statistically significant.
The analysis of the interaction between sectoral strength of institutions and individual inclusion
also reveals a mixed picture. In regard to the cross-level interaction between sectoral collective
bargaining coverage and individual bargaining coverage, results suggested that the probability
of being on a low-pay contract decreases also for those workers who are not covered by
collective agreements - although to a lower extent than those who are covered - as sectoral
bargaining coverage increases, which is consistent with the expectations of the PR approach.
In contrast, the I-O expectations are confirmed by the analysis of the cross-level interaction
between sectoral union density and individual union membership, as non-union members
appear more exposed to the risk of low pay in highly unionised sectors.
These findings support our original claims that, first, different IR institutions have distinct
effects on low pay risk. Second, their effect at the individual level should be distinguished from
their effect at the sectoral level; indeed, sectoral IR institutions mediate the relationship
between individual coverage and low-pay risk, as strong IR institutions can have a positive or
negative impact on the low-pay risk of individuals who are not covered. Thanks to its original
multi-level fine-grained approach, this article therefore uniquely contributes to advance the
debate on the relationship between IR institutions and low pay by reconciling the claims of
scholars in the field of employment relations, who mostly take a PR approach, and of the I-O
literature. In particular, this article suggests that employment relations scholars have better
theorised the distinct effects of collective agreements while the I-O approach seems to have
more accurately conceptualised the effect of unions.
The findings also have policy implications because they show that sectoral collective
bargaining coverage has a stronger negative effect on the individual probability of low pay than
27
union density and that encompassing sectoral agreements are beneficial also to those workers
who are not directly covered. Hence, they support recent calls for strengthening institutional
mechanisms for extending collective bargaining coverage independently from the level of
unionisation, which seem to be particularly crucial in times of union decline (Schulten 2016).
Further studies should replicate this single-country analysis in other IR contexts: results can be
expected to hold particularly well in those countries characterised by a system of sectoral
collective bargaining with mechanisms of collective agreement extension (e.g. Austria, Italy
and France), but they could differ in liberal market economies with decentralised bargaining
systems (e.g. US and UK).
28
References
Addison JT, Teixeira P, Evers K and Bellmann L (2016) Is the erosion thesis overblown?
Alignment from without in Germany. Industrial Relations: A Journal of Economy and
Society 55(3): 415-443.
Albert M (1993) Capitalism against Capitalism. London: Whurr.
Baccaro L, Koçer RG, Galindo J and Pulignano V (2016) Determinants of Indefinite Contracts
in Europe: The Role of Unemployment. Comparative Sociology 15(6): 794-838.
Barry M and Wilkinson A (Eds) (2011) Research handbook of comparative employment
relations. Cheltenham: Edward Elgar Publishing.
Becher M and Pontusson J (2011) Whose interests do unions represent? Unionization by
income in Western Europe. Research in the Sociology of Work 22(2):181-211.
Bispinck R, Dribbusch H and Schulten T (2010) German Collective Bargaining in a European
Perspective: Continuous Erosion or Re-Stabilisation of Multi-Employer Agreements? WSI
Discussion Papers 171, Duesseldorf.
Blanchflower DG and Bryson A (2004) What effect do unions have on wages now and would
Freeman and Medoff be surprised? Journal of Labor Research 25(3): 383-414.
Bol T and Weeden KA (2015) Occupational closure and wage inequality in Germany and the
United Kingdom. European Sociological Review 31(3): 354-369.
Budd JW and Na IG (2000) The union membership wage premium for employees covered by
collective bargaining agreements. Journal of Labor Economics 18(4): 783-807.
Card D, Lemieux T and Riddell WC (2004) Unions and wage inequality. Journal of Labor
Research 25(4): 519-559.
Carneiro A and Portugal P (2008) Market power, dismissal threat, and rent sharing - The role
of insider and outsider forces in wage bargaining. International Journal of Manpower 29(1):
30-47.
Corneo G and Lucifora C (1997) Wage formation under union threat effects: Theory and
empirical evidence. Labour Economics, 4(3), 265-292.
Dex S, Robson P and Wilkinson F (1999) The Characteristics of the Low Paid: a Cross-national
Comparison. Work, Employment and Society 13(3): 503-524.
DiPrete TA and Forristal JD (1994) Multilevel models: methods and substance. Annual Review
of Sociology 20(1): 331-357.
29
Doellgast V, Lillie N and Pulignano V (2018). Reconstructing solidarity: Labour unions,
precarious work, and the politics of institutional change in Europe. Oxford: Oxford
University Press.
Durazzi N, Fleckenstein T and Lee SC (2018) Social solidarity for all? Trade union strategies,
labor market dualization, and the welfare state in Italy and South
Korea. Politics&Society 46(2): 205-233.
Eichhorst W, Marx P and Tobsch V (2013) Non-Standard Employment across Occupations in
Germany: The Role of Replaceability and Labour Market Flexibility. IZA Discussion Paper
7662. Bonn.
Elliott RF and Hemmings PJ (1991) Are National Agreements a Source of Nominal Wage
Rigidity in the Depressed Regions of Britain? Regional Studies 25(1): 63-69.
Emmenegger P, Hausermann S, Palier B and Seelaib-Kaiser M (2012) The Age of Dualization:
The Changing Face of Inequality in Deindustrialising Societies. Oxford: Oxford University
Press.
Fitzenberger B, Kohn K and Lembcke AC (2013) Union density and varieties of coverage: The
anatomy of union wage effects in Germany. ILR Review 66(1): 169-197.
Freeman R and Medoff J (1984) What Do Unions Do? New York: Basic Books.
Gallie D (2007) Production Regimes and the Quality of Employment in Europe. Annual Review
of Sociology 33: 85-104.
Gautiè J and Schmitt J (2010) Low-Wage Work in the Wealthy World. New York: Russell Sage
Foundation.
Gelman A. (2006) Multilevel (hierarchical) modeling: what it can and cannot
do. Technometrics, 48(3): 432-435.
Grimshaw D (2011) What do we know about low wage work and low wage workers?:
Analysing the definitions, patterns, causes and consequences in international perspective,
Conditions of Work and Employment Series n. 28, International Labour Office, Geneva.
Grimshaw D, Rubery J, Anxo D, M. Bacache-Beauvallet, Neumann L and Weinkopf C (2015)
Outsourcing of public services in Europe and segmentation effects: The influence of labour
market factors. European Journal of Industrial Relations 21(4): 295-313.
Hancké B, Rhodes M and Thatcher M (Eds) (2009) Debating Varieties of Capitalism: A
Reader. Oxford University Press: Oxford.
Hartog J, Leuven E and Teulings C (2002) Wages and the bargaining regime in a corporatist
setting: the Netherlands. European Journal of Political Economy, 18(2): 317-331.
30
Hassel A (2014) The Paradox of Liberalization - Understanding Dualism and the Recovery of
the German Political Economy. British Journal of Industrial Relations 52(1): 57-81.
Korpi, W (1983) The Democratic Class Struggle. London: Routledge and Kegan Paul.
Kristal T (2010) Good Times, Bad Times: Postwar Labor’s Share of National Income in
Capitalist Democracies. American Sociological Review, 75(5), 729–763.
Hogan C (2001) Enforcement of Implicit Employment Contracts through
Unionization. Journal of Labor Economics, 19(1), 171-195.
Lindbeck A and Snower D (2002). The Insider-Outsider Theory: A Survey. Bonn:Institute for
the Study of Labour.
Mathieu JE, Aguinis H, Culpepper SA and Chen G (2012) Understanding and estimating the
power to detect cross-level interaction effects in multilevel modeling. Journal of Applied
Psychology 97(5): 951.
McKnight A, Stewart K, Himmelweit SM, Palillo M (2016) Low pay and in-work poverty:
preventative measures and preventative approaches. European Commission. Brussels:
European Commission.
Magda, I., Marsden, D., & Moriconi, S. (2012). Collective Agreements, Wages, and Firms’
Cohorts: Evidence from Central Europe. ILR Review, 65(3), 607–629.
Mishel L (1986) The Structural Determinants of Union Bargaining Power. ILR Review 40(1):
90-104.
Mosimann, N and Pontusson J (2017) Solidaristic Unionism and Support for Redistribution in
Contemporary Europe. World Politics 69(3): 448-492.
Neckerman KM and Torche F (2007) Inequality: Causes and Consequences. Annual Review of
Sociology 33(1): 335-357.
OECD (2019) OECD Statistics. Available at:
https://stats.oecd.org/Index.aspx?DataSetCode=TUD# (10.07.2019).
Olson M (1965). The Logic of Collective Action. Public Goods and the Theory of Groups.
London, Oxford University Press.
Palier B and Thelen K (2010) Institutionalizing Dualism: Complementarities and Change in
France and Germany. Politics & Society 38(1): 119-148.
Pulignano V, Meardi G and Doerflinger N (2015) Trade unions and labour market dualisation:
a comparison of policies and attitudes towards agency and migrant workers in Germany and
Belgium. Work, Employment and Society 29(5): 808-825.
Rosen S (1969) Trade union power, threat effects and the extent of organization. The Review
of Economic Studies 36(2): 185-196.
31
Rueda D and Pontusson J (2000) Wage Inequality and Varieties of Capitalism. World Politics
52(3): 350–383.
Saint-Paul G (2002) The Political Economy of Employment Protection. Journal of Political
Economy 110(3): 672-704.
Schulten T (2016) The meaning of extension for the stability of collective bargaining in Europe.
ETUI Policy Brief 4/2016. European Trade Union Institute: Brussels.
Schulten T and Luebker M (2019) WSI Minimum Wage Report 2019. WSI-Report No. 46.
Düsseldorf: Hans-Böckler-Stiftung.
Stata. (2017) Manual 13: Marginsplot. Available at:
http://www.stata.com/manuals13/rmarginsplot.pdf (19.07.2017).
Thelen K (2014) Varieties of Liberalization and the New Politics of Social Solidarity.
Cambridge, Cambridge University Press.
Western B and Rosenfeld J (2011) Unions, Norms, and the Rise in U.S. Wage Inequality.
American Sociological Review 76(4): 513-537.
Yang J-J (2006) Corporate Unionism and Labor Market Flexibility in South Korea. Journal of
East Asian Studies 6(2): 205-231.
32
Appendix
Trade unions, bargaining coverage and low pay: a multilevel test of
institutional effects on low-pay risk in Germany
Contents A1. Variable creation and description .................................................................................................................. 34
A1.1. Dependent variable ................................................................................................................................. 34
Figure A1.1.1: Histogram wages (salary from main job)............................................................................. 34
Figure A1.1.2: Histogram weekly actual working time ............................................................................... 34
Table A1.1.1: Tabulation low pay dummy .................................................................................................. 34
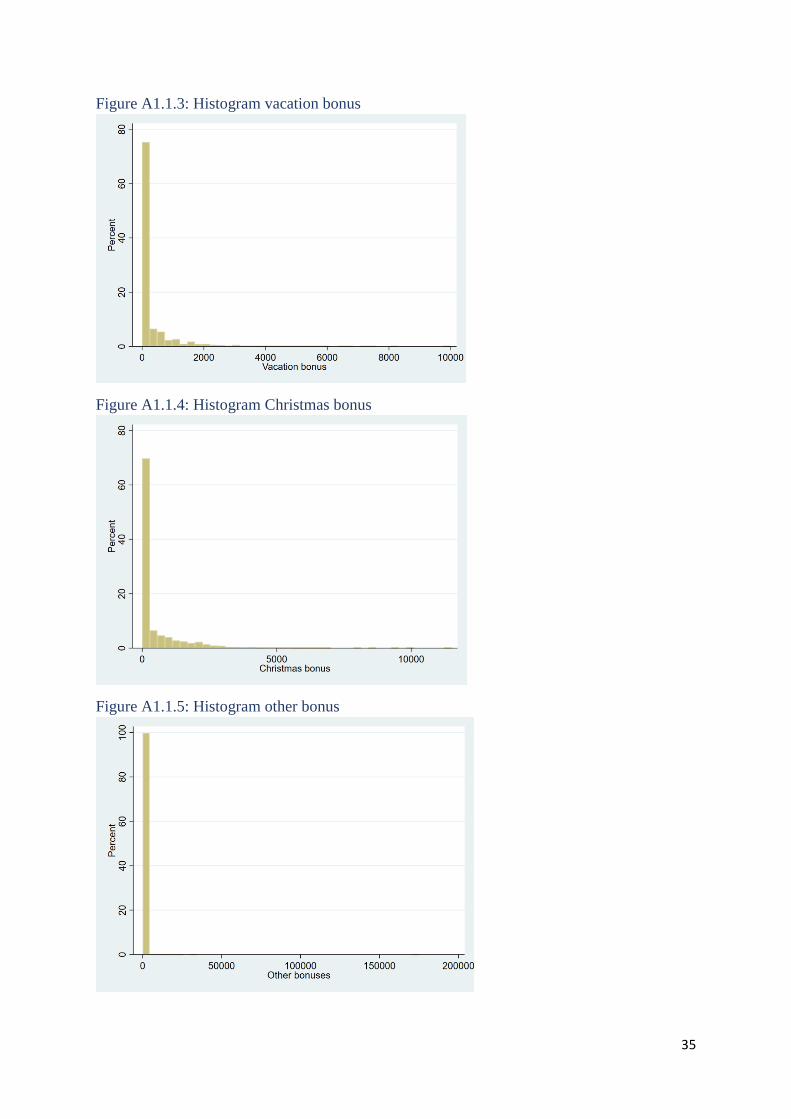
Figure A1.1.3: Histogram vacation bonus ................................................................................................... 35
Figure A1.1.4: Histogram Christmas bonus ................................................................................................. 35
Figure A1.1.5: Histogram other bonus ......................................................................................................... 35
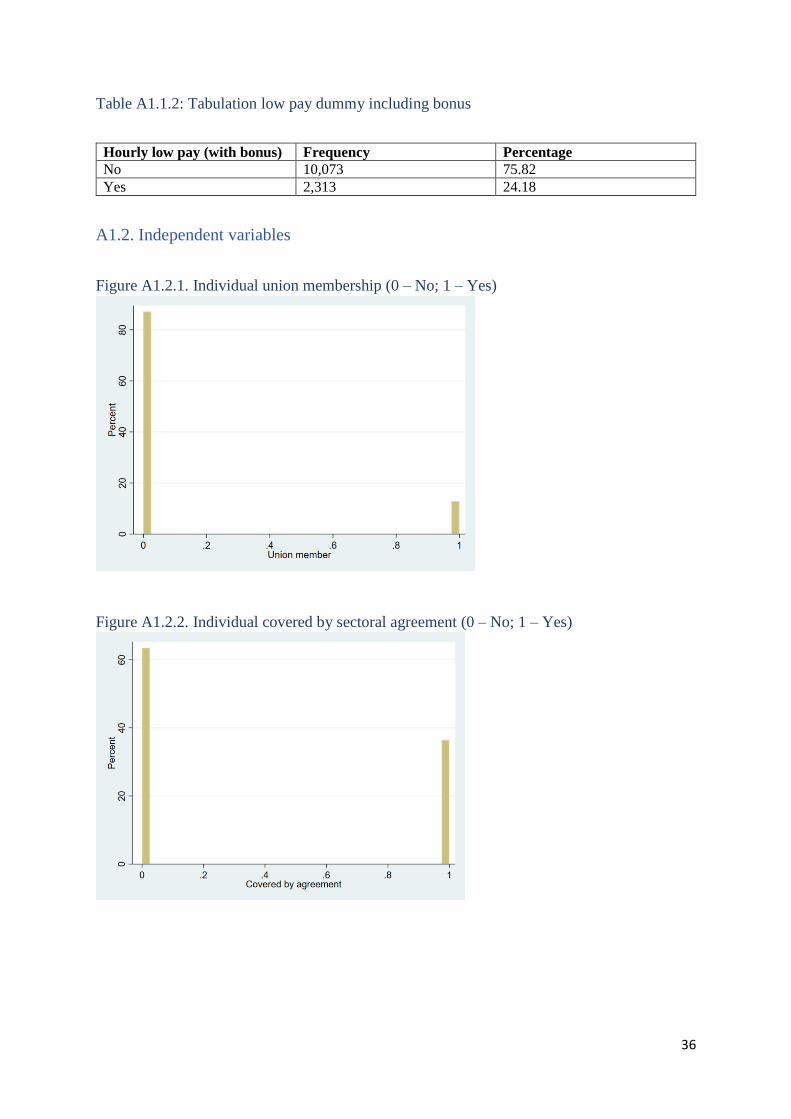
Table A1.1.2: Tabulation low pay dummy including bonus ........................................................................ 36
A1.2. Independent variables ............................................................................................................................. 36
Figure A1.2.1. Individual union membership (0 – No; 1 – Yes) ................................................................. 36
Figure A1.2.2. Individual covered by sectoral agreement (0 – No; 1 – Yes) ............................................... 36
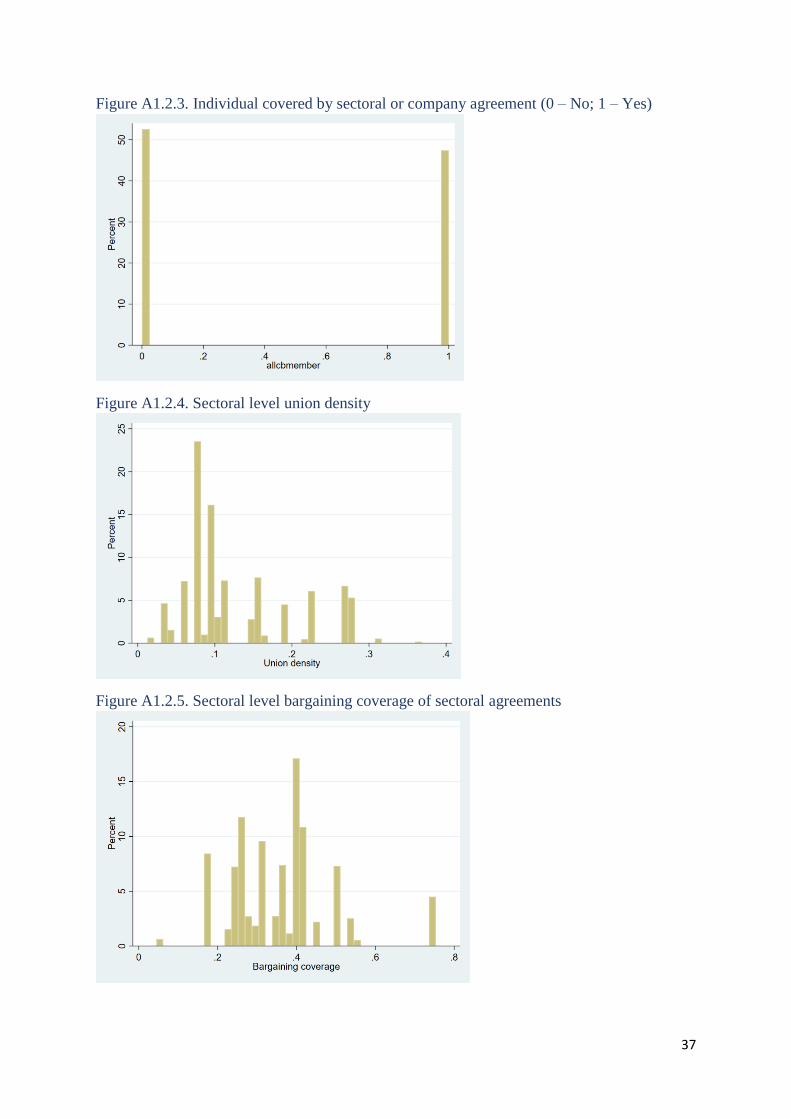
Figure A1.2.3. Individual covered by sectoral or company agreement (0 – No; 1 – Yes) ........................... 37
Figure A1.2.4. Sectoral level union density ................................................................................................. 37
Figure A1.2.5. Sectoral level bargaining coverage of sectoral agreements ................................................. 37
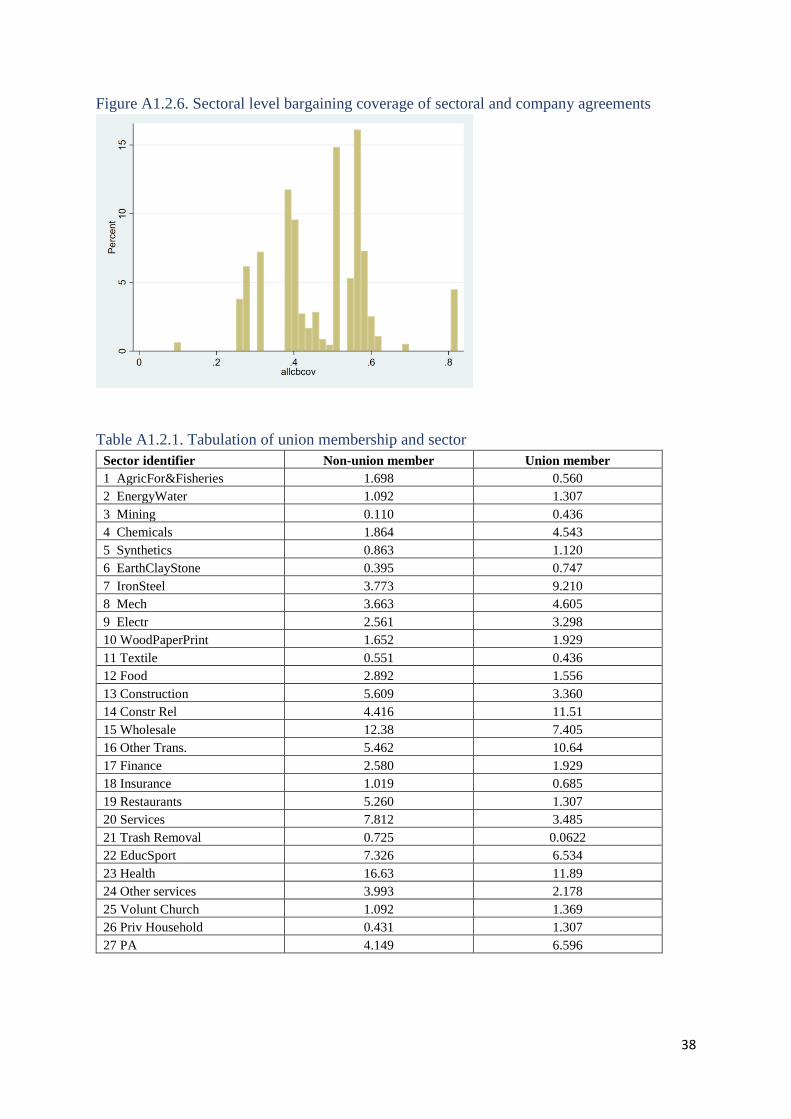
Figure A1.2.6. Sectoral level bargaining coverage of sectoral and company agreements ........................... 38
Table A1.2.1. Tabulation of union membership and sector ......................................................................... 38
Table A1.2.2. Tabulation of union membership and gender ........................................................................ 39
Table A1.2.3. Tabulation of union membership and firm size ..................................................................... 39
Table A1.2.4. Tabulation of union membership and age ............................................................................. 39
Table A1.2.5. Tabulation of individual bargaining coverage ....................................................................... 39
Table A1.2.6. Tabulation of individual bargaining coverage and age ......................................................... 39
Table A1.2.7. Tabulation of individual bargaining coverage and union membership ................................. 16
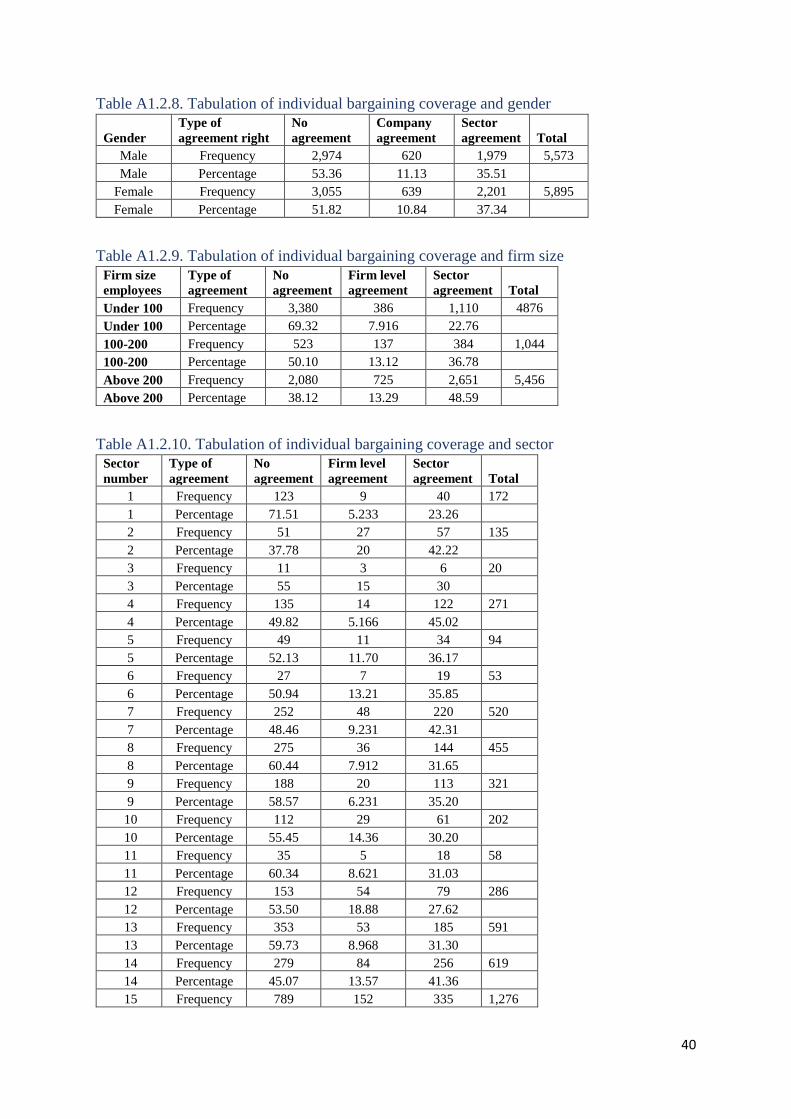
Table A1.2.8. Tabulation of individual bargaining coverage and gender .................................................... 40
Table A1.2.9. Tabulation of individual bargaining coverage and firm size ................................................. 40
Table A1.2.10. Tabulation of individual bargaining coverage and sector ................................................... 40
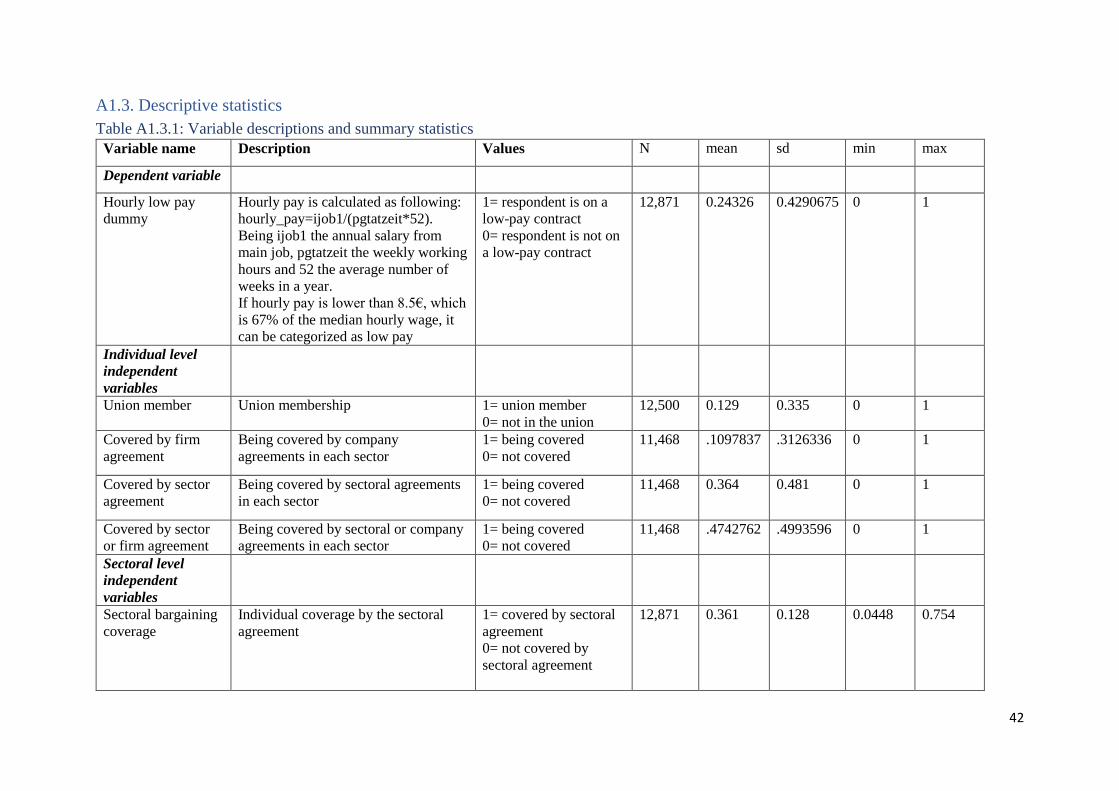
A1.3. Descriptive statistics ............................................................................................................................... 42
Table A1.3.1: Variable descriptions and summary statistics ....................................................................... 42
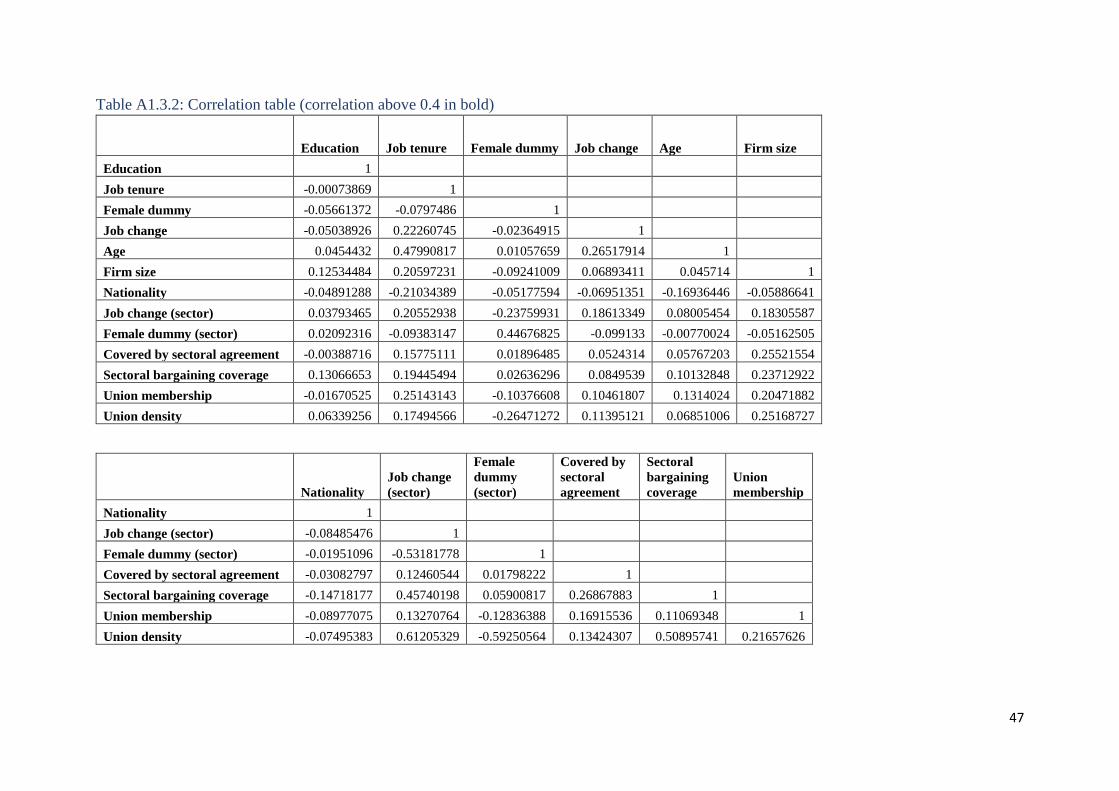
Table A1.3.2: Correlation table (correlation above 0.4 in bold) .................................................................. 47
Table A1.3.3: Collinearity Diagnostic ......................................................................................................... 48
A1.4. Sector specific logistic regressions ......................................................................................................... 49
Figure A1.4.1: Effect of being covered by agreement and union membership on low pay probability in
series of sector specific logistic regressions ................................................................................................. 49
33
A2. Regression results – direct effects .................................................................................................................. 50
A2.1. Figures showing results from multilevel logistic regressions ................................................................. 50
Figure A2.1.1: Multilevel logistic regression .............................................................................................. 50
Figure A2.1.2: Multilevel logistic regressions with part time work control ................................................ 51
A2.2. Figures showing results from multilevel linear regressions ................................................................... 52
Figure A2.2.1: Comparing normal standard errors with robust clustered SE .............................................. 52
Figure A2.2.2: Logistic regression with sector fixed effects ....................................................................... 53
A2.3. Controlling for East Germany as dummy and for States ........................................................................ 54
Table A2.3.1: Tabulation of States .............................................................................................................. 54
Table A2.3.2: Tabulation of Eastern Germany ............................................................................................ 54
Figure A2.3.1: Multilevel logistic regression when controlling for States .................................................. 55
A2.4. Controlling for productivity ................................................................................................................... 56
Figure A2.4.1: Histogram average hourly pay ............................................................................................. 56
Table A2.4.1: Tabulation of education ........................................................................................................ 56
Figure A2.4.2: histogram sectoral average education .................................................................................. 57
Figure A2.4.2: scatterplot of average hourly pay and education .................................................................. 57
Table A2.4.2: Correlation sectoral average hourly wage and sectoral education ........................................ 57
Figure A2.4.3: Multilevel logistic regression controlling for sectoral average hourly pay and sectoral
average education ........................................................................................................................................ 58
A2.5. Different operationalisation of bargaining coverage and union membership ......................................... 59
Figure A2.5.1: Multilevel logistic regression controlling for different measures of bargaining agreement 24
Figure A2.5.2: Multilevel logistic regression changing two variables “individual union membership and
individual wage bargaining coverage” into three variables ......................................................................... 60
A2.6. Excluding public sector workers ............................................................................................................ 61
Figure A2.6.1 Multilevel logistic regression - Results when excluding public sector ................................. 61
A2.7. Controlling for occupations .................................................................................................................... 62
Figure A2.7.1. Histogram ............................................................................................................................ 62
Figure A2.7.2. Results from multilevel logistic regression .......................................................................... 63
A2.8. Results from multilevel logistic regressions in table format .................................................................. 64
Table A2.8.1. Reporting results from section A2 in table format ................................................................ 64
Table A2.8.2. Stepwise insertion of variables in multilevel logistic regressions ......................................... 73
A3. Regression results – indirect effects .............................................................................................................. 75
Figure A3.1: Results from multilevel logistic regression, with interaction between union membership and
union density ................................................................................................................................................ 75
Figure A3.2: Results from multilevel logistic regression, with interaction between sectoral bargaining
agreement and sectoral bargaining coverage ............................................................................................... 76
34
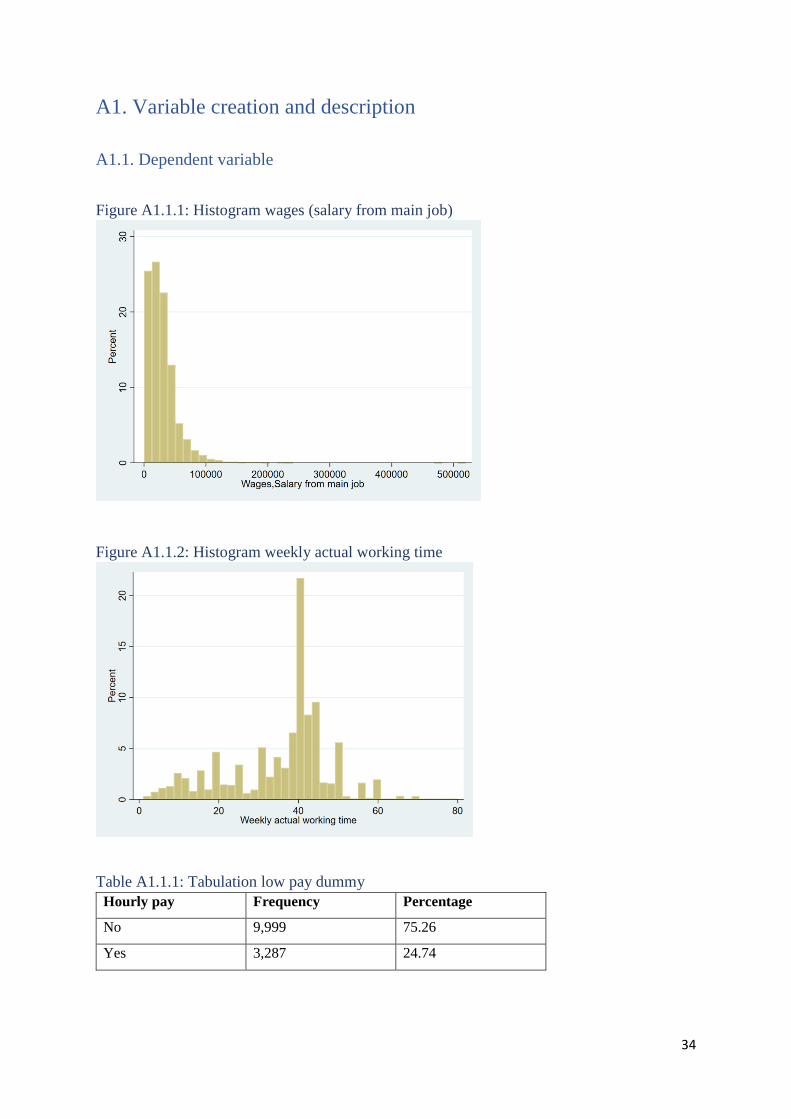
A1. Variable creation and description
A1.1. Dependent variable
Figure A1.1.1: Histogram wages (salary from main job)
Figure A1.1.2: Histogram weekly actual working time
Table A1.1.1: Tabulation low pay dummy
Hourly pay Frequency Percentage
No 9,999 75.26
Yes 3,287 24.74
35
Figure A1.1.3: Histogram vacation bonus
Figure A1.1.4: Histogram Christmas bonus
Figure A1.1.5: Histogram other bonus
36
Table A1.1.2: Tabulation low pay dummy including bonus
Hourly low pay (with bonus) Frequency Percentage
No 10,073 75.82
Yes 2,313 24.18
A1.2. Independent variables
Figure A1.2.1. Individual union membership (0 – No; 1 – Yes)
Figure A1.2.2. Individual covered by sectoral agreement (0 – No; 1 – Yes)
37
Figure A1.2.3. Individual covered by sectoral or company agreement (0 – No; 1 – Yes)
Figure A1.2.4. Sectoral level union density
Figure A1.2.5. Sectoral level bargaining coverage of sectoral agreements
38
Figure A1.2.6. Sectoral level bargaining coverage of sectoral and company agreements
Table A1.2.1. Tabulation of union membership and sector
Sector identifier Non-union member Union member
1 AgricFor&Fisheries 1.698 0.560
2 EnergyWater 1.092 1.307
3 Mining 0.110 0.436
4 Chemicals 1.864 4.543
5 Synthetics 0.863 1.120
6 EarthClayStone 0.395 0.747
7 IronSteel 3.773 9.210
8 Mech 3.663 4.605
9 Electr 2.561 3.298
10 WoodPaperPrint 1.652 1.929
11 Textile 0.551 0.436
12 Food 2.892 1.556
13 Construction 5.609 3.360
14 Constr Rel 4.416 11.51
15 Wholesale 12.38 7.405
16 Other Trans. 5.462 10.64
17 Finance 2.580 1.929
18 Insurance 1.019 0.685
19 Restaurants 5.260 1.307
20 Services 7.812 3.485
21 Trash Removal 0.725 0.0622
22 EducSport 7.326 6.534
23 Health 16.63 11.89
24 Other services 3.993 2.178
25 Volunt Church 1.092 1.369
26 Priv Household 0.431 1.307
27 PA 4.149 6.596
39
Table A1.2.2. Tabulation of union membership and gender
Union member Male Female
No 83.53 90.48
Yes 16.47 9.520
Table A1.2.3. Tabulation of union membership and firm size
Union member Firm size under 100 Between 100 and 200 Above 200
No 94.35 88.33 79.92
Yes 5.65 11.67 20.08
Table A1.2.4. Tabulation of union membership and age
Union member Under 25 25-34 35-44 45-54 55-64
No 94.91 91.42 89.85 84.44 79.49
Yes 5.087 8.585 10.15 15.56 20.51
Table A1.2.5. Tabulation of individual bargaining coverage
Individual agreement: Frequency Percentage
No agreement 6,029 52.57
Only firm agreement 1,259 10.98
Only sector agreement 4,180 36.45
Table A1.2.6. Tabulation of individual bargaining coverage and age
Age below
Type of
agreement right No agreement
Company
agreement
Sector
agreement Total
Under 25 Frequency 333 61 139 533
Under 25 Percentage 62.48 11.44 26.08
25-34 Frequency 1,148 237 733 2,118
25-34 Percentage 54.20 11.19 34.61
35-44 Frequency 1,794 357 1,202 3,353
35-44 Percentage 53.50 10.65 35.85
45-54 Frequency 1,822 411 1,341 3,574
45-54 Percentage 50.98 11.50 37.52
55-64 Frequency 904 184 751 1,839
55-64 Percentage 49.16 10.01 40.84
Table A1.2.7. Tabulation of individual bargaining coverage and union membership
Union
member
Type of
agreement right
No
agreement
Company
agreement
Sector
agreement Total
No Frequency 5,411 1,000 3,225 9,636
No Percentage 56.15 10.38 33.47
Yes Frequency 419 230 869 1,518
Yes Percentage 27.60 15.15 57.25
Note: this table shows row percentages, e.g. 5,411 divided by 9,636 is 56.15%, 1,000 out of 9,636
represents 10.38%, and so on. For cell percentages, please see table 1 in the manuscript.
40
Table A1.2.8. Tabulation of individual bargaining coverage and gender
Gender
Type of
agreement right
No
agreement
Company
agreement
Sector
agreement Total
Male Frequency 2,974 620 1,979 5,573
Male Percentage 53.36 11.13 35.51
Female Frequency 3,055 639 2,201 5,895
Female Percentage 51.82 10.84 37.34
Table A1.2.9. Tabulation of individual bargaining coverage and firm size
Firm size
employees
Type of
agreement
No
agreement
Firm level
agreement
Sector
agreement Total
Under 100 Frequency 3,380 386 1,110 4876
Under 100 Percentage 69.32 7.916 22.76
100-200 Frequency 523 137 384 1,044
100-200 Percentage 50.10 13.12 36.78
Above 200 Frequency 2,080 725 2,651 5,456
Above 200 Percentage 38.12 13.29 48.59
Table A1.2.10. Tabulation of individual bargaining coverage and sector
Sector
number
Type of
agreement
No
agreement
Firm level
agreement
Sector
agreement Total
1 Frequency 123 9 40 172
1 Percentage 71.51 5.233 23.26 2 Frequency 51 27 57 135
2 Percentage 37.78 20 42.22 3 Frequency 11 3 6 20
3 Percentage 55 15 30 4 Frequency 135 14 122 271
4 Percentage 49.82 5.166 45.02 5 Frequency 49 11 34 94
5 Percentage 52.13 11.70 36.17 6 Frequency 27 7 19 53
6 Percentage 50.94 13.21 35.85 7 Frequency 252 48 220 520
7 Percentage 48.46 9.231 42.31 8 Frequency 275 36 144 455
8 Percentage 60.44 7.912 31.65 9 Frequency 188 20 113 321
9 Percentage 58.57 6.231 35.20 10 Frequency 112 29 61 202
10 Percentage 55.45 14.36 30.20 11 Frequency 35 5 18 58
11 Percentage 60.34 8.621 31.03 12 Frequency 153 54 79 286
12 Percentage 53.50 18.88 27.62 13 Frequency 353 53 185 591
13 Percentage 59.73 8.968 31.30 14 Frequency 279 84 256 619
14 Percentage 45.07 13.57 41.36 15 Frequency 789 152 335 1,276
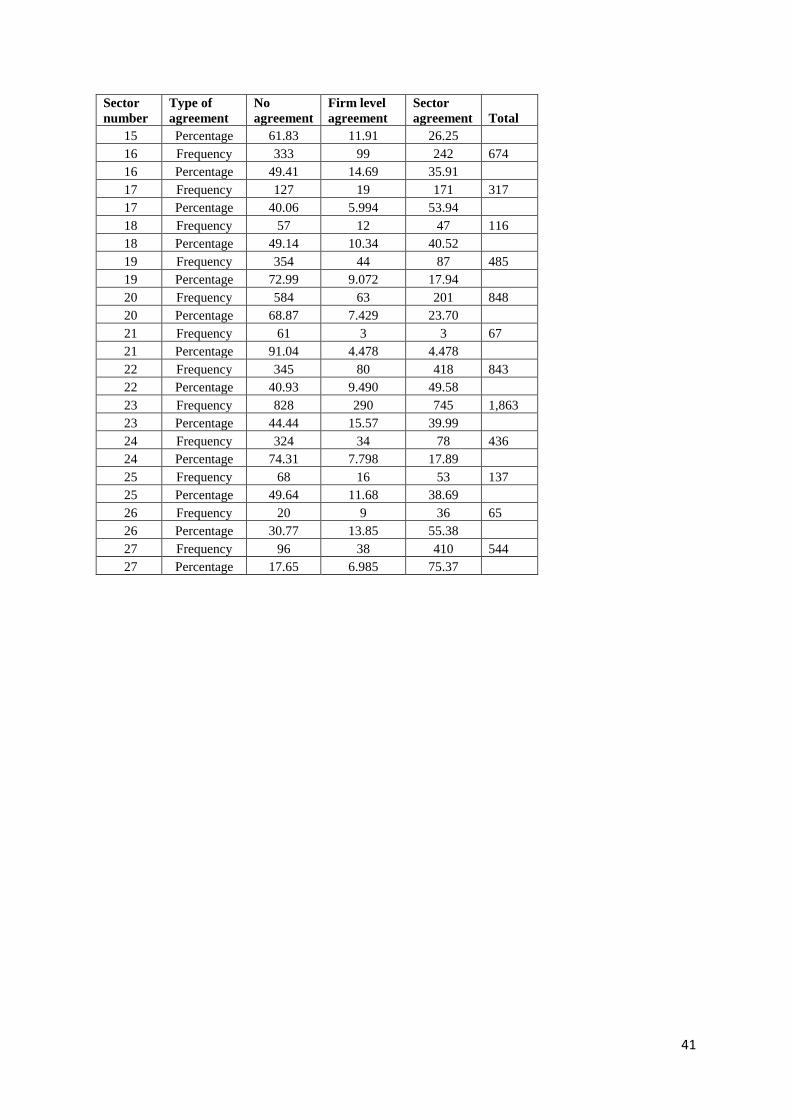
41
Sector
number
Type of
agreement
No
agreement
Firm level
agreement
Sector
agreement Total
15 Percentage 61.83 11.91 26.25 16 Frequency 333 99 242 674
16 Percentage 49.41 14.69 35.91 17 Frequency 127 19 171 317
17 Percentage 40.06 5.994 53.94 18 Frequency 57 12 47 116
18 Percentage 49.14 10.34 40.52 19 Frequency 354 44 87 485
19 Percentage 72.99 9.072 17.94 20 Frequency 584 63 201 848
20 Percentage 68.87 7.429 23.70 21 Frequency 61 3 3 67
21 Percentage 91.04 4.478 4.478 22 Frequency 345 80 418 843
22 Percentage 40.93 9.490 49.58 23 Frequency 828 290 745 1,863
23 Percentage 44.44 15.57 39.99 24 Frequency 324 34 78 436
24 Percentage 74.31 7.798 17.89 25 Frequency 68 16 53 137
25 Percentage 49.64 11.68 38.69 26 Frequency 20 9 36 65
26 Percentage 30.77 13.85 55.38 27 Frequency 96 38 410 544
27 Percentage 17.65 6.985 75.37
42
A1.3. Descriptive statistics
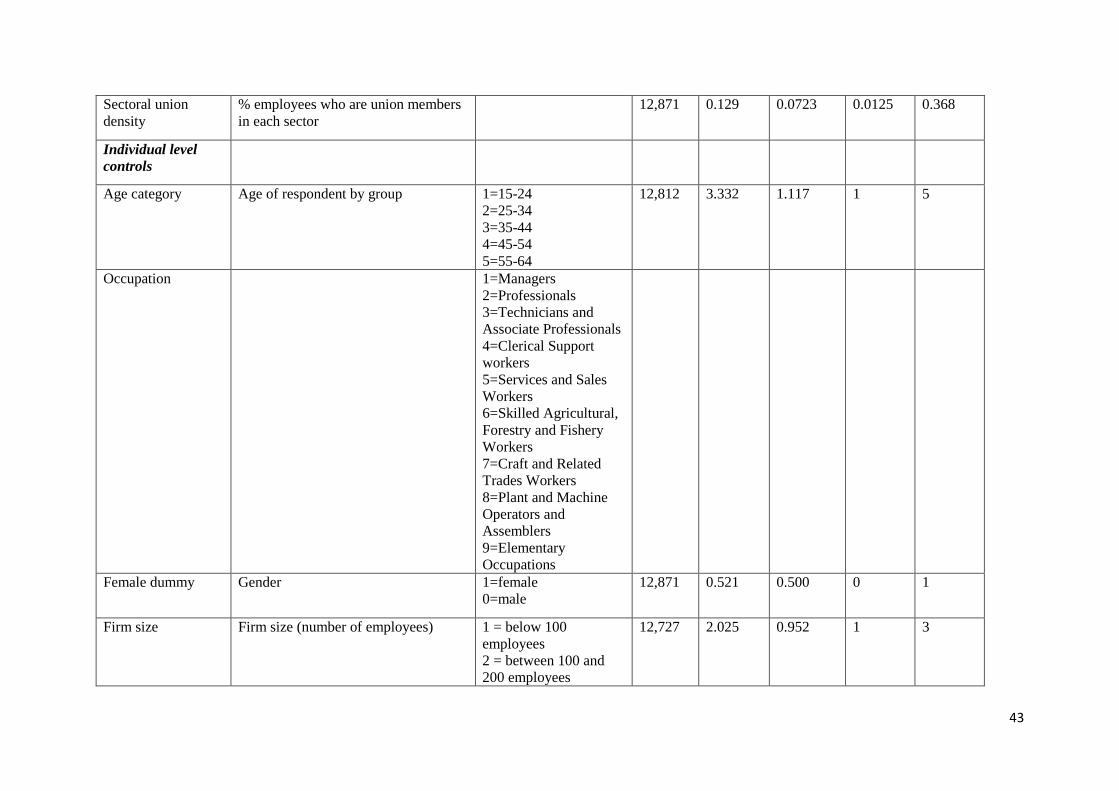
Table A1.3.1: Variable descriptions and summary statistics
Variable name Description Values N mean sd min max
Dependent variable
Hourly low pay
dummy
Hourly pay is calculated as following:
hourly_pay=ijob1/(pgtatzeit*52).
Being ijob1 the annual salary from
main job, pgtatzeit the weekly working
hours and 52 the average number of
weeks in a year.
If hourly pay is lower than 8.5€, which
is 67% of the median hourly wage, it
can be categorized as low pay
1= respondent is on a
low-pay contract
0= respondent is not on
a low-pay contract
12,871 0.24326 0.4290675 0 1
Individual level
independent
variables
Union member Union membership 1= union member
0= not in the union
12,500 0.129 0.335 0 1
Covered by firm
agreement
Being covered by company
agreements in each sector
1= being covered
0= not covered
11,468 .1097837 .3126336 0 1
Covered by sector
agreement
Being covered by sectoral agreements
in each sector
1= being covered
0= not covered
11,468 0.364 0.481 0 1
Covered by sector
or firm agreement
Being covered by sectoral or company
agreements in each sector
1= being covered
0= not covered
11,468 .4742762 .4993596 0 1
Sectoral level
independent
variables
Sectoral bargaining
coverage
Individual coverage by the sectoral
agreement
1= covered by sectoral
agreement
0= not covered by
sectoral agreement
12,871 0.361 0.128 0.0448 0.754
43
Sectoral union
density
% employees who are union members
in each sector 12,871 0.129 0.0723 0.0125 0.368
Individual level
controls
Age category Age of respondent by group 1=15-24
2=25-34
3=35-44
4=45-54
5=55-64
12,812 3.332 1.117 1 5
Occupation 1=Managers
2=Professionals
3=Technicians and
Associate Professionals
4=Clerical Support
workers
5=Services and Sales
Workers
6=Skilled Agricultural,
Forestry and Fishery
Workers
7=Craft and Related
Trades Workers
8=Plant and Machine
Operators and
Assemblers
9=Elementary
Occupations
Female dummy Gender 1=female
0=male
12,871 0.521 0.500 0 1
Firm size Firm size (number of employees) 1 = below 100
employees
2 = between 100 and
200 employees
12,727 2.025 0.952 1 3
44
3= above 200
employees
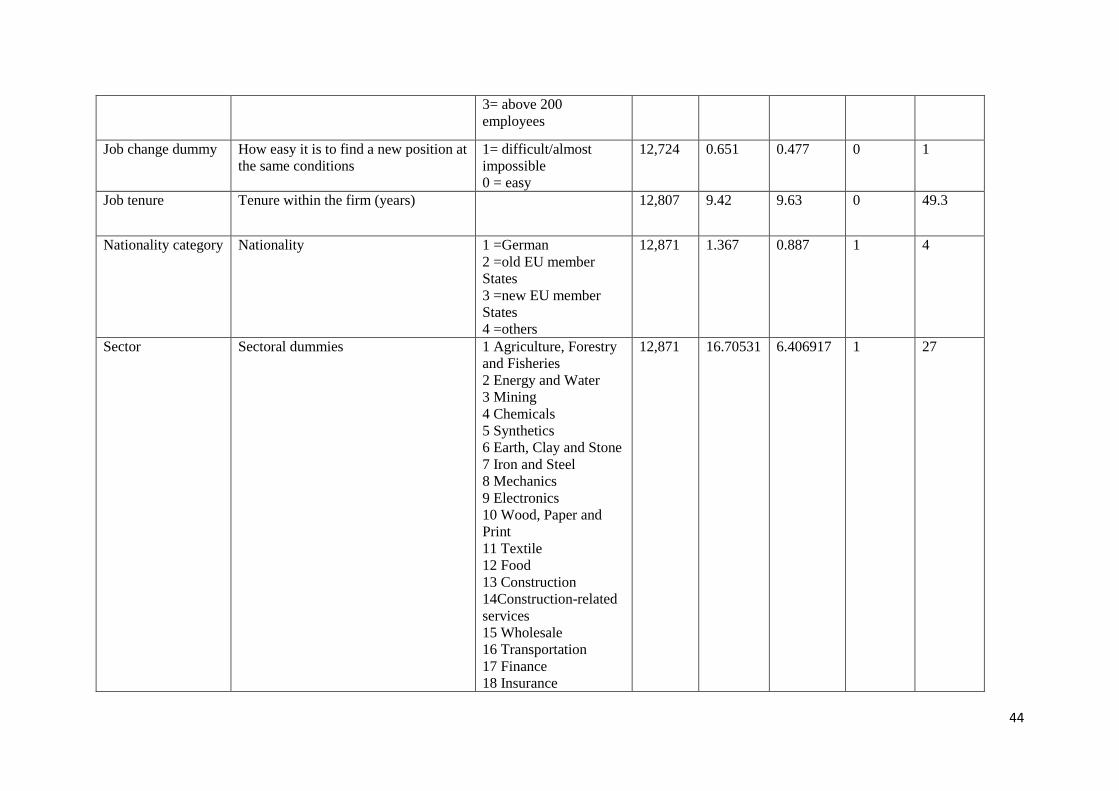
Job change dummy How easy it is to find a new position at
the same conditions
1= difficult/almost
impossible
0 = easy
12,724 0.651 0.477 0 1
Job tenure Tenure within the firm (years) 12,807 9.42 9.63 0 49.3
Nationality category Nationality 1 =German
2 =old EU member
States
3 =new EU member
States
4 =others
12,871 1.367 0.887 1 4
Sector Sectoral dummies 1 Agriculture, Forestry
and Fisheries
2 Energy and Water
3 Mining
4 Chemicals
5 Synthetics
6 Earth, Clay and Stone
7 Iron and Steel
8 Mechanics
9 Electronics
10 Wood, Paper and
11 Textile
12 Food
13 Construction
14Construction-related
services
15 Wholesale
16 Transportation
17 Finance
18 Insurance
12,871 16.70531 6.406917 1 27
45
19 Restaurants
20 Services
21 Trash Removal
22 Education and Sport
23 Health
24 Other services
25 Charities and
Church
26 Private Household
27 Public
Administration
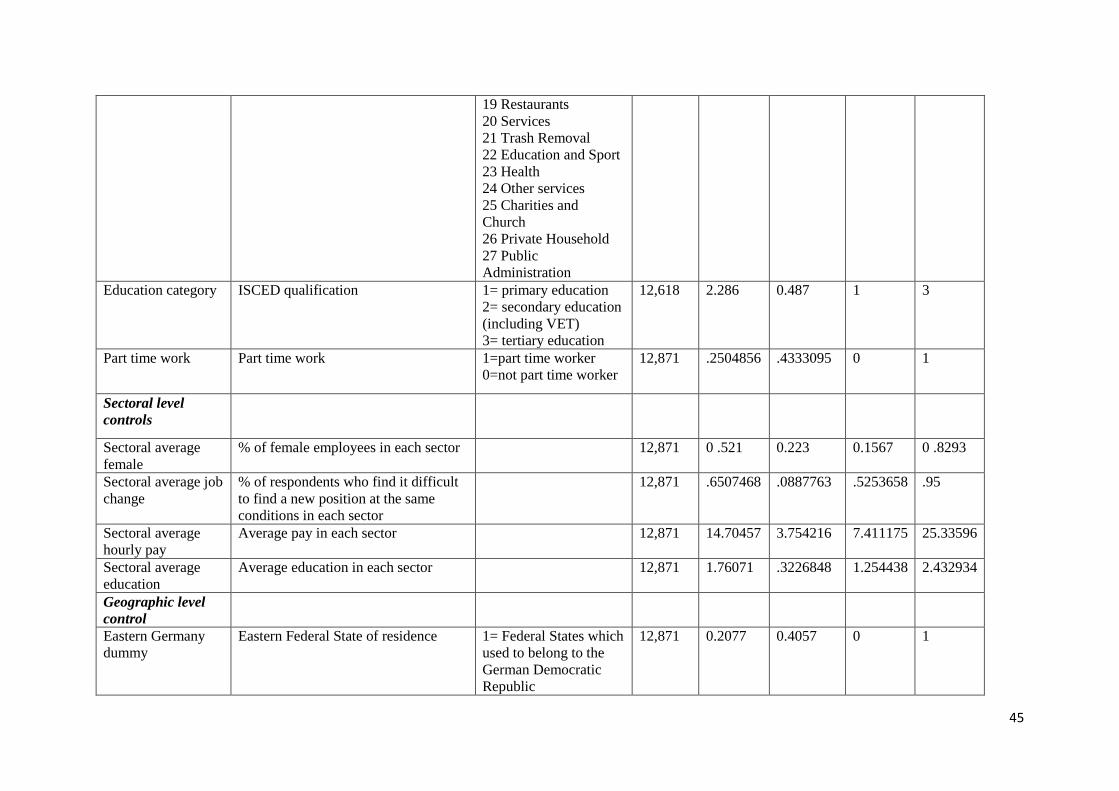
Education category ISCED qualification 1= primary education
2= secondary education
(including VET)
3= tertiary education
12,618 2.286 0.487 1 3
Part time work Part time work 1=part time worker
0=not part time worker
12,871 .2504856 .4333095 0 1
Sectoral level
controls
Sectoral average
female
% of female employees in each sector 12,871 0 .521 0.223 0.1567 0 .8293
Sectoral average job
change
% of respondents who find it difficult
to find a new position at the same
conditions in each sector
12,871 .6507468 .0887763 .5253658 .95
Sectoral average
hourly pay
Average pay in each sector 12,871 14.70457 3.754216 7.411175 25.33596
Sectoral average
education
Average education in each sector 12,871 1.76071 .3226848 1.254438 2.432934
Geographic level
control
Eastern Germany
dummy
Eastern Federal State of residence 1= Federal States which
used to belong to the
German Democratic
Republic
12,871 0.2077 0.4057 0 1
46
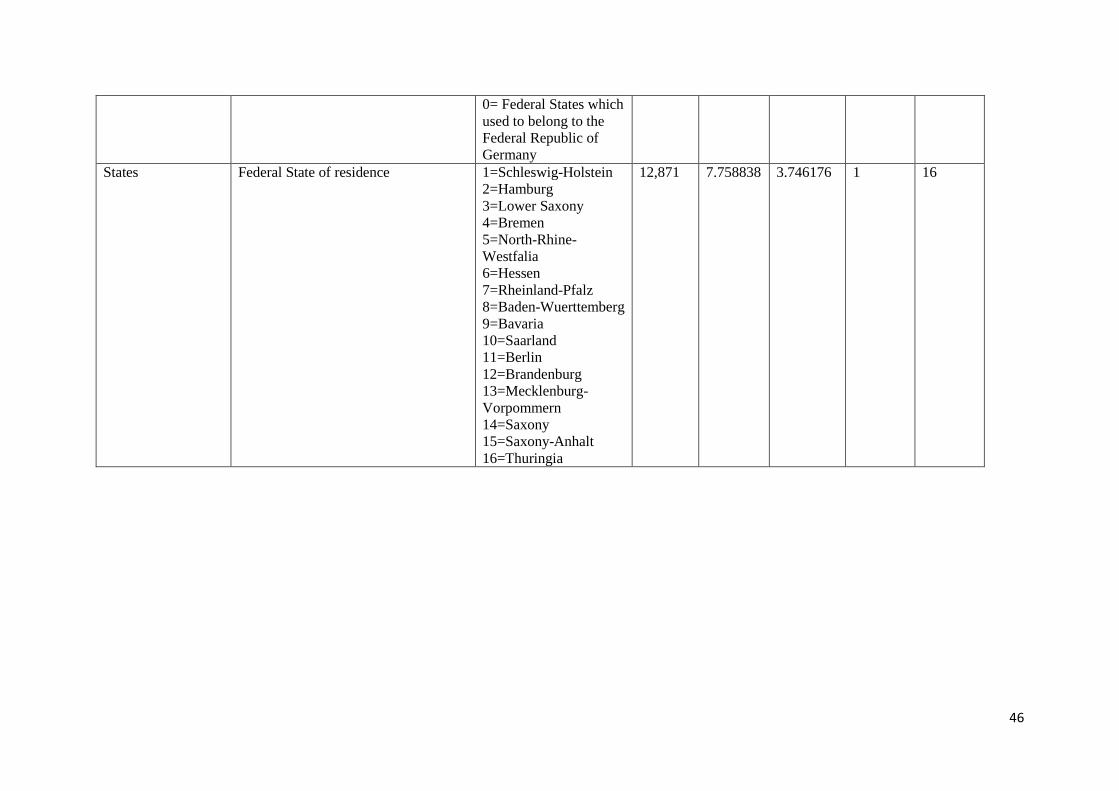
0= Federal States which
used to belong to the
Federal Republic of
Germany
States Federal State of residence 1=Schleswig-Holstein
2=Hamburg
3=Lower Saxony
4=Bremen
5=North-Rhine-
Westfalia
6=Hessen
7=Rheinland-Pfalz
8=Baden-Wuerttemberg
9=Bavaria
10=Saarland
11=Berlin
12=Brandenburg
13=Mecklenburg-
Vorpommern
14=Saxony
15=Saxony-Anhalt
16=Thuringia
12,871 7.758838 3.746176 1 16
47
Table A1.3.2: Correlation table (correlation above 0.4 in bold)
Education Job tenure Female dummy Job change Age Firm size
Education 1
Job tenure -0.00073869 1
Female dummy -0.05661372 -0.0797486 1
Job change -0.05038926 0.22260745 -0.02364915 1
Age 0.0454432 0.47990817 0.01057659 0.26517914 1
Firm size 0.12534484 0.20597231 -0.09241009 0.06893411 0.045714 1
Nationality -0.04891288 -0.21034389 -0.05177594 -0.06951351 -0.16936446 -0.05886641
Job change (sector) 0.03793465 0.20552938 -0.23759931 0.18613349 0.08005454 0.18305587
Female dummy (sector) 0.02092316 -0.09383147 0.44676825 -0.099133 -0.00770024 -0.05162505
Covered by sectoral agreement -0.00388716 0.15775111 0.01896485 0.0524314 0.05767203 0.25521554
Sectoral bargaining coverage 0.13066653 0.19445494 0.02636296 0.0849539 0.10132848 0.23712922
Union membership -0.01670525 0.25143143 -0.10376608 0.10461807 0.1314024 0.20471882
Union density 0.06339256 0.17494566 -0.26471272 0.11395121 0.06851006 0.25168727
Nationality
Job change
(sector)
Female
dummy
(sector)
Covered by
sectoral
agreement
Sectoral
bargaining
coverage
Union
membership
Nationality 1
Job change (sector) -0.08485476 1
Female dummy (sector) -0.01951096 -0.53181778 1
Covered by sectoral agreement -0.03082797 0.12460544 0.01798222 1
Sectoral bargaining coverage -0.14718177 0.45740198 0.05900817 0.26867883 1
Union membership -0.08977075 0.13270764 -0.12836388 0.16915536 0.11069348 1
Union density -0.07495383 0.61205329 -0.59250564 0.13424307 0.50895741 0.21657626
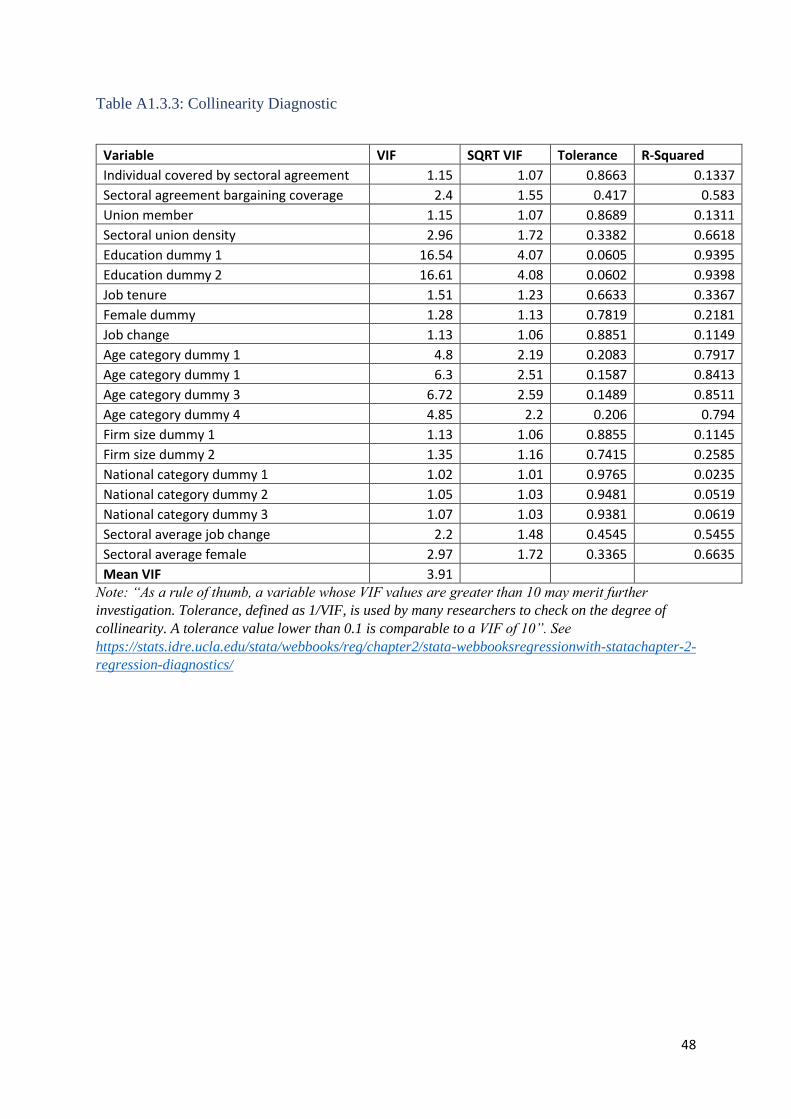
48
Table A1.3.3: Collinearity Diagnostic
Variable VIF SQRT VIF Tolerance R-Squared
Individual covered by sectoral agreement 1.15 1.07 0.8663 0.1337
Sectoral agreement bargaining coverage 2.4 1.55 0.417 0.583
Union member 1.15 1.07 0.8689 0.1311
Sectoral union density 2.96 1.72 0.3382 0.6618
Education dummy 1 16.54 4.07 0.0605 0.9395
Education dummy 2 16.61 4.08 0.0602 0.9398
Job tenure 1.51 1.23 0.6633 0.3367
Female dummy 1.28 1.13 0.7819 0.2181
Job change 1.13 1.06 0.8851 0.1149
Age category dummy 1 4.8 2.19 0.2083 0.7917
Age category dummy 1 6.3 2.51 0.1587 0.8413
Age category dummy 3 6.72 2.59 0.1489 0.8511
Age category dummy 4 4.85 2.2 0.206 0.794
Firm size dummy 1 1.13 1.06 0.8855 0.1145
Firm size dummy 2 1.35 1.16 0.7415 0.2585
National category dummy 1 1.02 1.01 0.9765 0.0235
National category dummy 2 1.05 1.03 0.9481 0.0519
National category dummy 3 1.07 1.03 0.9381 0.0619
Sectoral average job change 2.2 1.48 0.4545 0.5455
Sectoral average female 2.97 1.72 0.3365 0.6635
Mean VIF 3.91 Note: “As a rule of thumb, a variable whose VIF values are greater than 10 may merit further
investigation. Tolerance, defined as 1/VIF, is used by many researchers to check on the degree of
collinearity. A tolerance value lower than 0.1 is comparable to a VIF of 10”. See
https://stats.idre.ucla.edu/stata/webbooks/reg/chapter2/stata-webbooksregressionwith-statachapter-2-
regression-diagnostics/
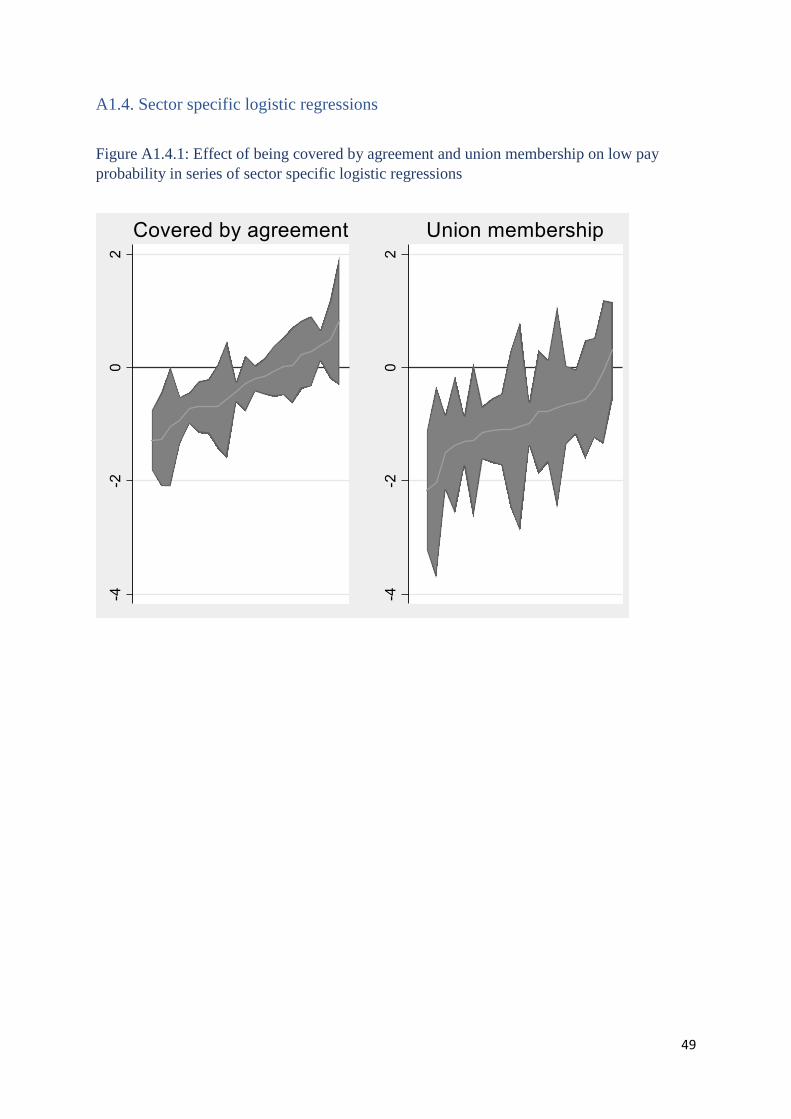
49
A1.4. Sector specific logistic regressions
Figure A1.4.1: Effect of being covered by agreement and union membership on low pay
probability in series of sector specific logistic regressions
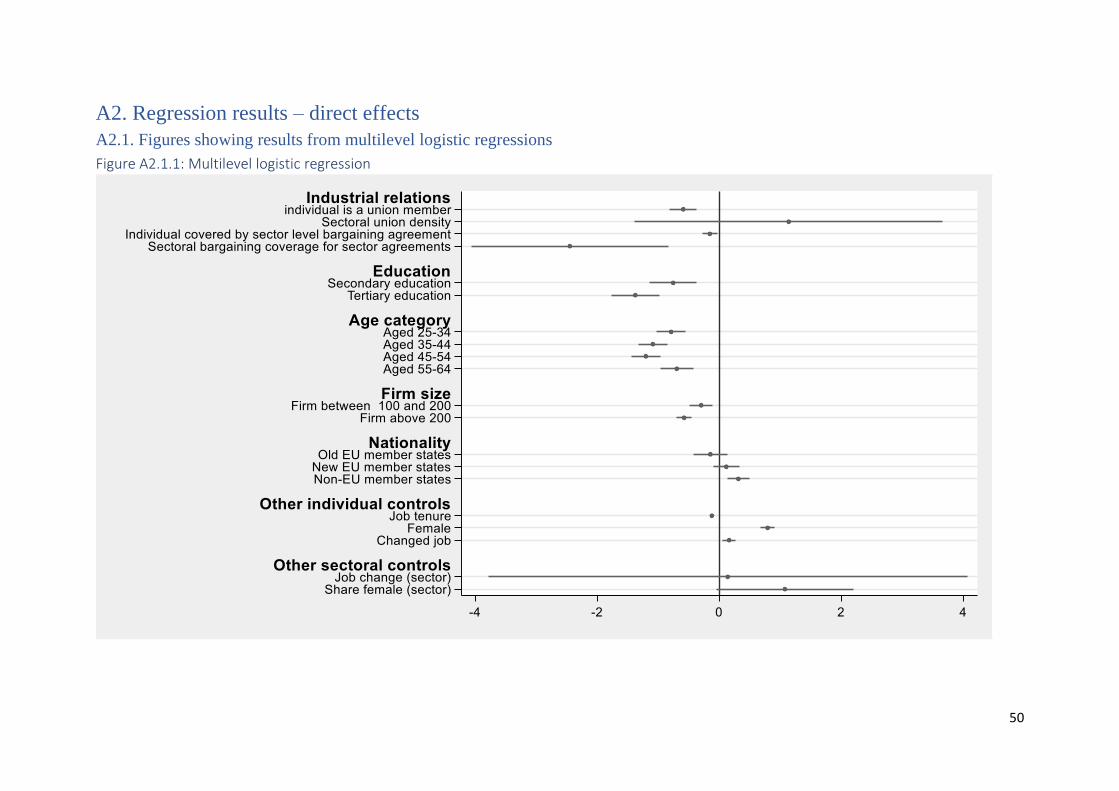
50
A2. Regression results – direct effects
A2.1. Figures showing results from multilevel logistic regressions
Figure A2.1.1: Multilevel logistic regression
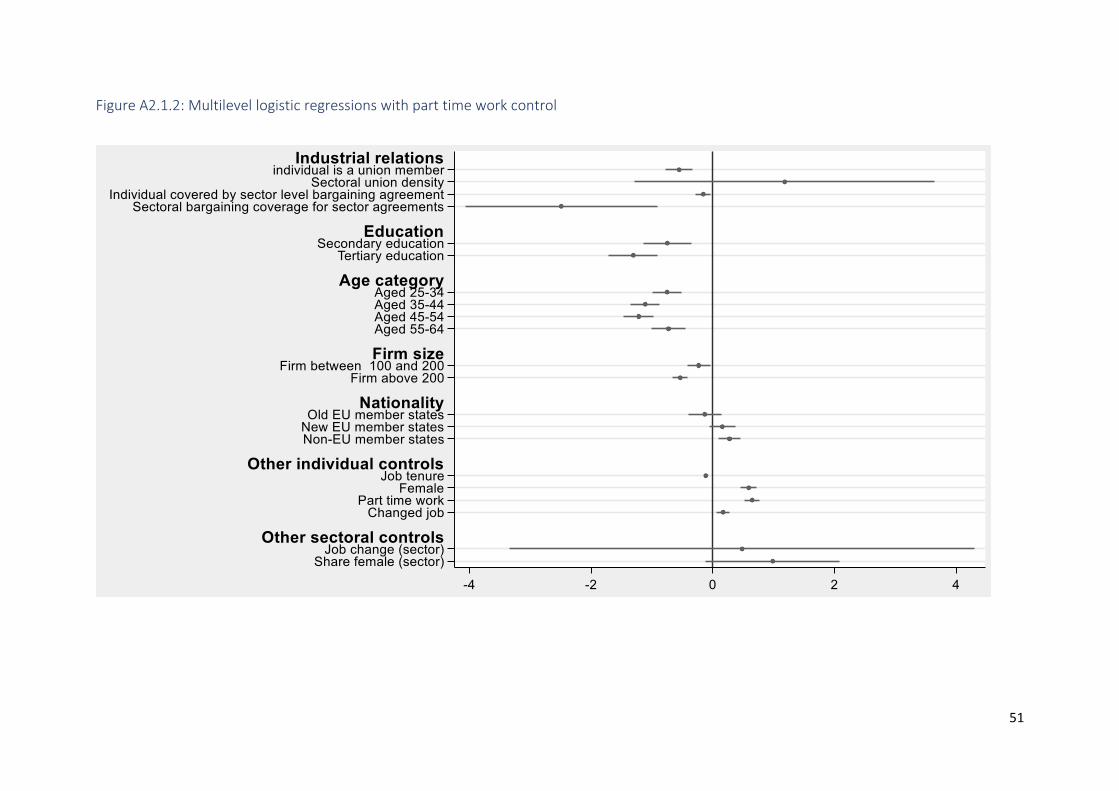
51
Figure A2.1.2: Multilevel logistic regressions with part time work control
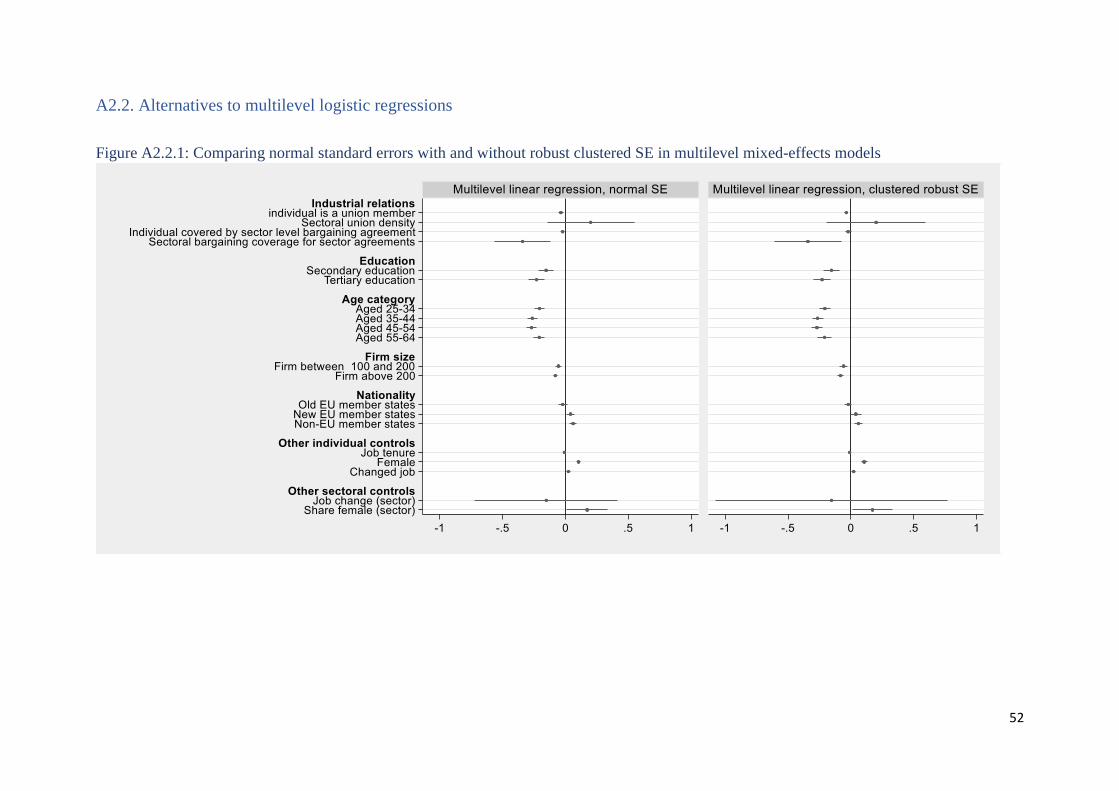
52
A2.2. Alternatives to multilevel logistic regressions
Figure A2.2.1: Comparing normal standard errors with and without robust clustered SE in multilevel mixed-effects models
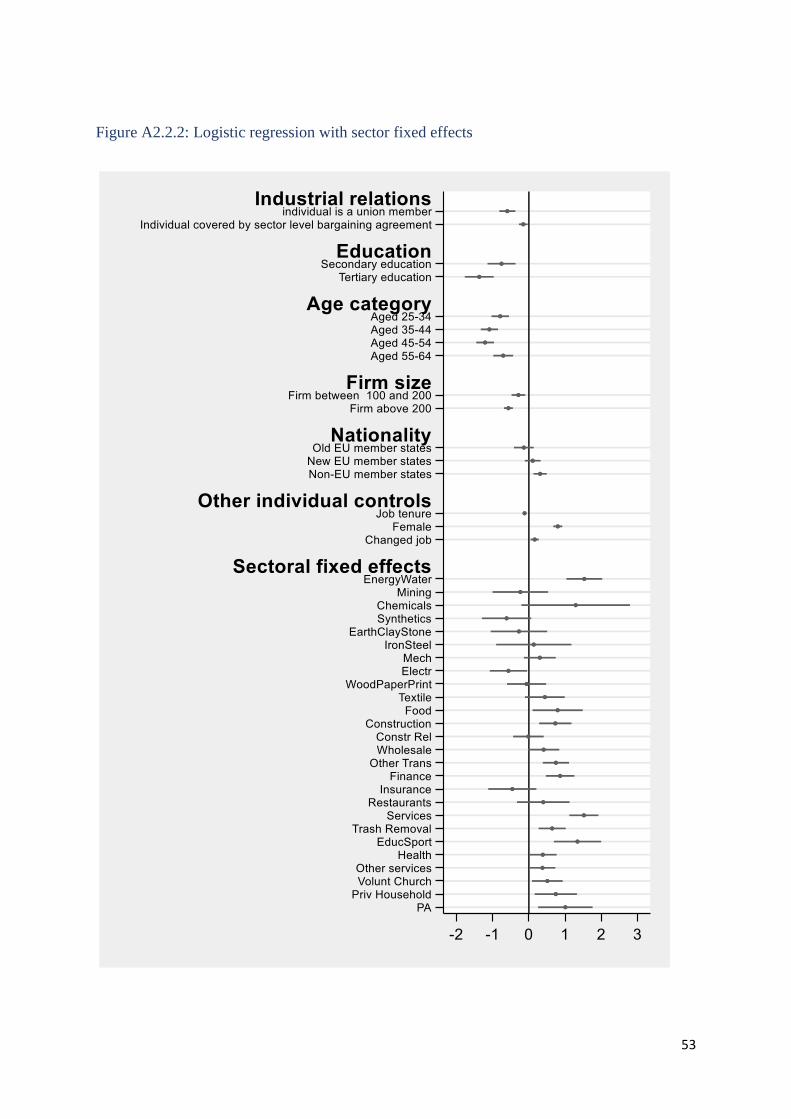
53
Figure A2.2.2: Logistic regression with sector fixed effects
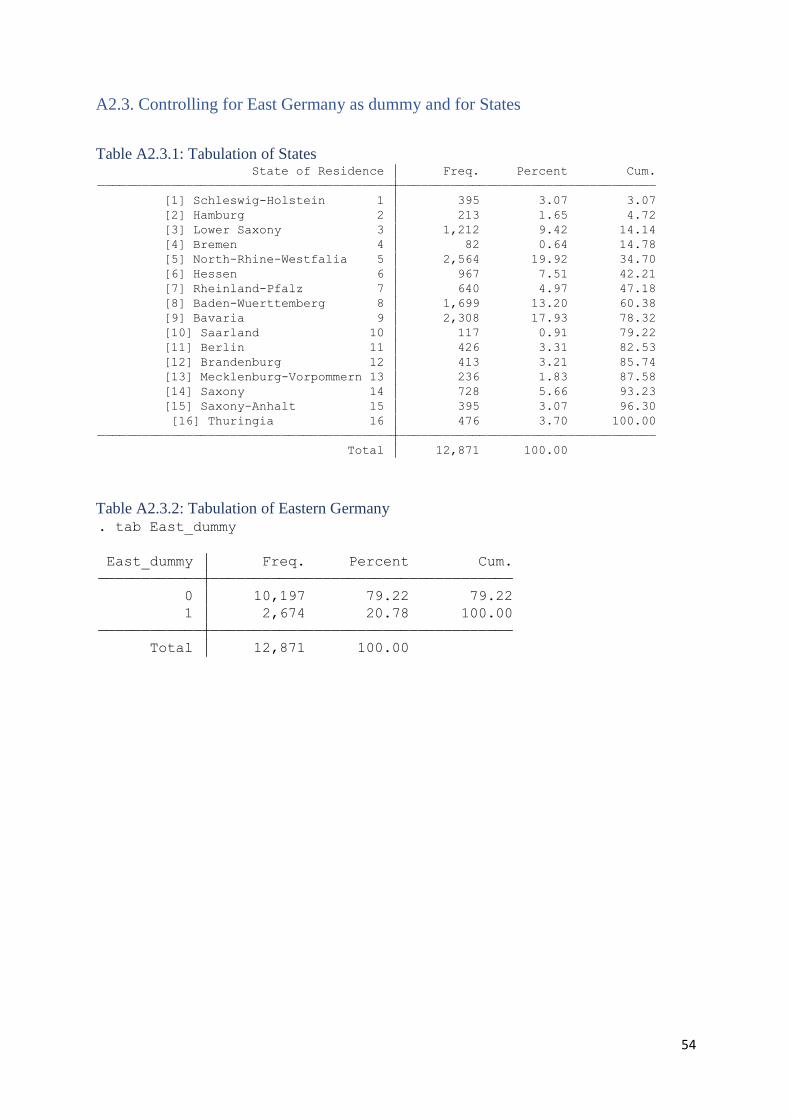
54
A2.3. Controlling for East Germany as dummy and for States
Table A2.3.1: Tabulation of States
Table A2.3.2: Tabulation of Eastern Germany
Total 12,871 100.00
[16] Thuringia 16 476 3.70 100.00
[15] Saxony-Anhalt 15 395 3.07 96.30
[14] Saxony 14 728 5.66 93.23
[13] Mecklenburg-Vorpommern 13 236 1.83 87.58
[12] Brandenburg 12 413 3.21 85.74
[11] Berlin 11 426 3.31 82.53
[10] Saarland 10 117 0.91 79.22
[9] Bavaria 9 2,308 17.93 78.32
[8] Baden-Wuerttemberg 8 1,699 13.20 60.38
[7] Rheinland-Pfalz 7 640 4.97 47.18
[6] Hessen 6 967 7.51 42.21
[5] North-Rhine-Westfalia 5 2,564 19.92 34.70
[4] Bremen 4 82 0.64 14.78
[3] Lower Saxony 3 1,212 9.42 14.14
[2] Hamburg 2 213 1.65 4.72
[1] Schleswig-Holstein 1 395 3.07 3.07
State of Residence Freq. Percent Cum.
Total 12,871 100.00
1 2,674 20.78 100.00
0 10,197 79.22 79.22
East_dummy Freq. Percent Cum.
. tab East_dummy
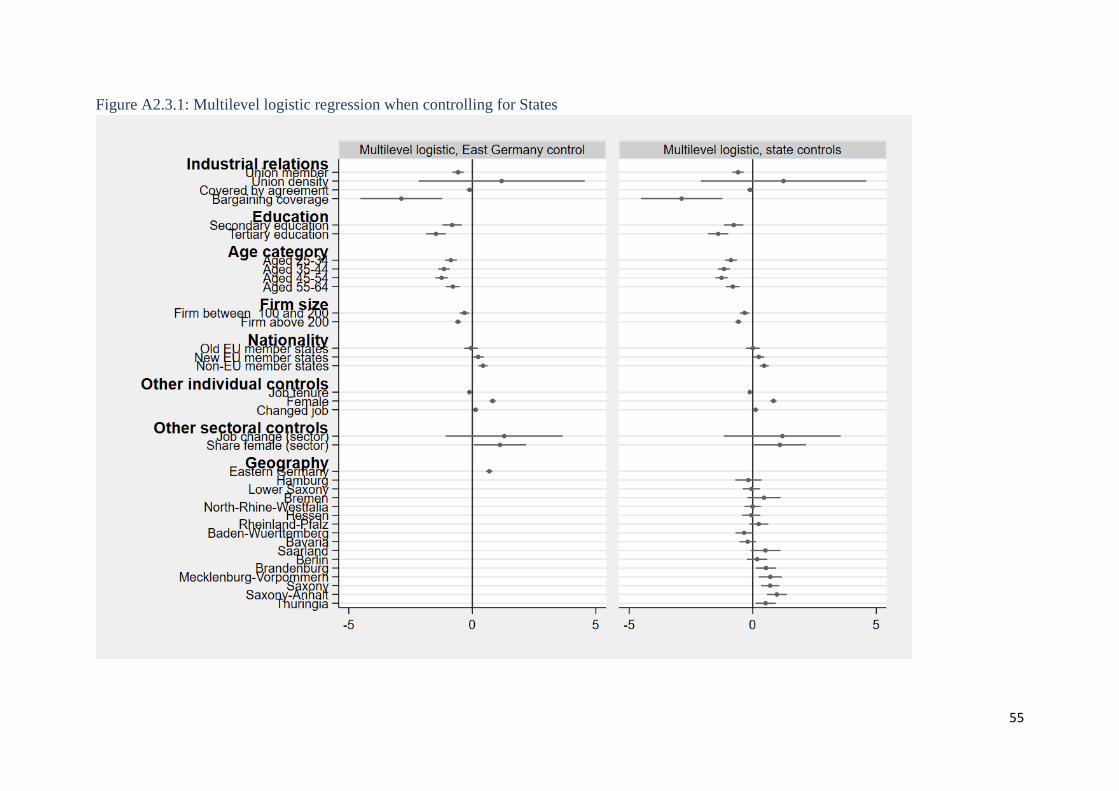
55
Figure A2.3.1: Multilevel logistic regression when controlling for States
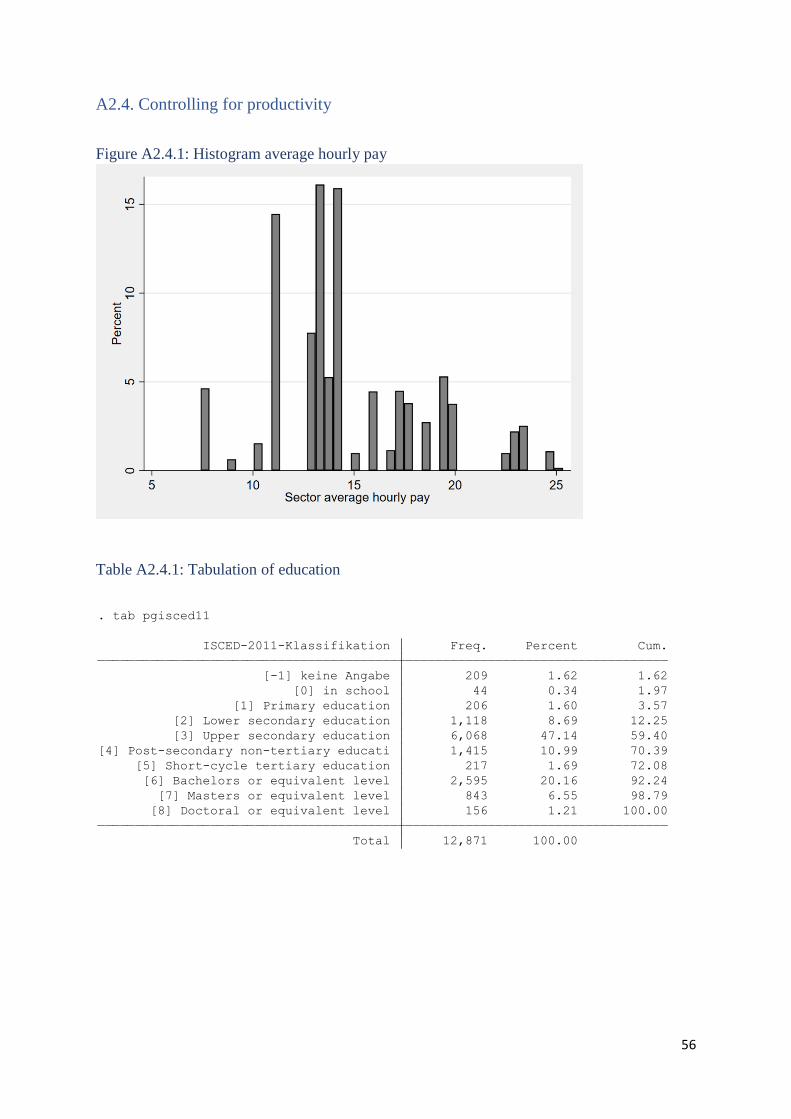
56
A2.4. Controlling for productivity
Figure A2.4.1: Histogram average hourly pay
Table A2.4.1: Tabulation of education
Total 12,871 100.00
[8] Doctoral or equivalent level 156 1.21 100.00
[7] Masters or equivalent level 843 6.55 98.79
[6] Bachelors or equivalent level 2,595 20.16 92.24
[5] Short-cycle tertiary education 217 1.69 72.08
[4] Post-secondary non-tertiary educati 1,415 10.99 70.39
[3] Upper secondary education 6,068 47.14 59.40
[2] Lower secondary education 1,118 8.69 12.25
[1] Primary education 206 1.60 3.57
[0] in school 44 0.34 1.97
[-1] keine Angabe 209 1.62 1.62
ISCED-2011-Klassifikation Freq. Percent Cum.
. tab pgisced11
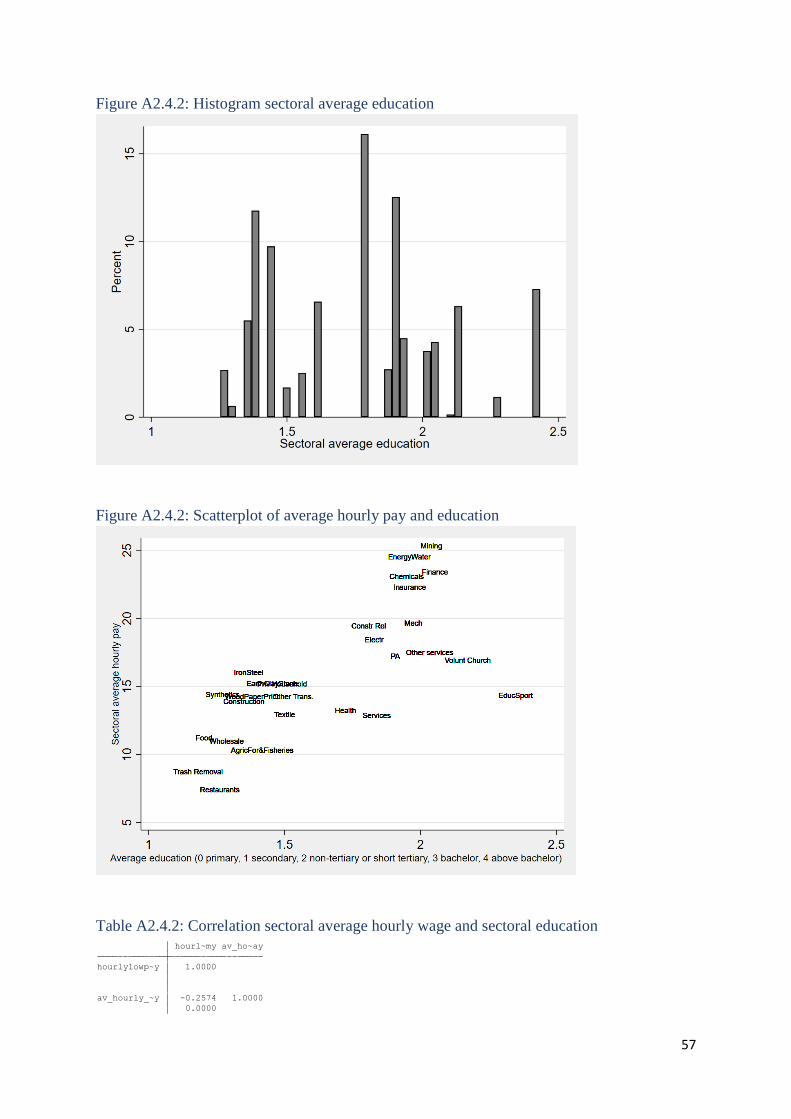
57
Figure A2.4.2: Histogram sectoral average education
Figure A2.4.2: Scatterplot of average hourly pay and education
Table A2.4.2: Correlation sectoral average hourly wage and sectoral education
0.0000
av_hourly_~y -0.2574 1.0000
hourlylowp~y 1.0000
hourl~my av_ho~ay
. pwcorr hourlylowpay_dummy av_hourly_pay, sig
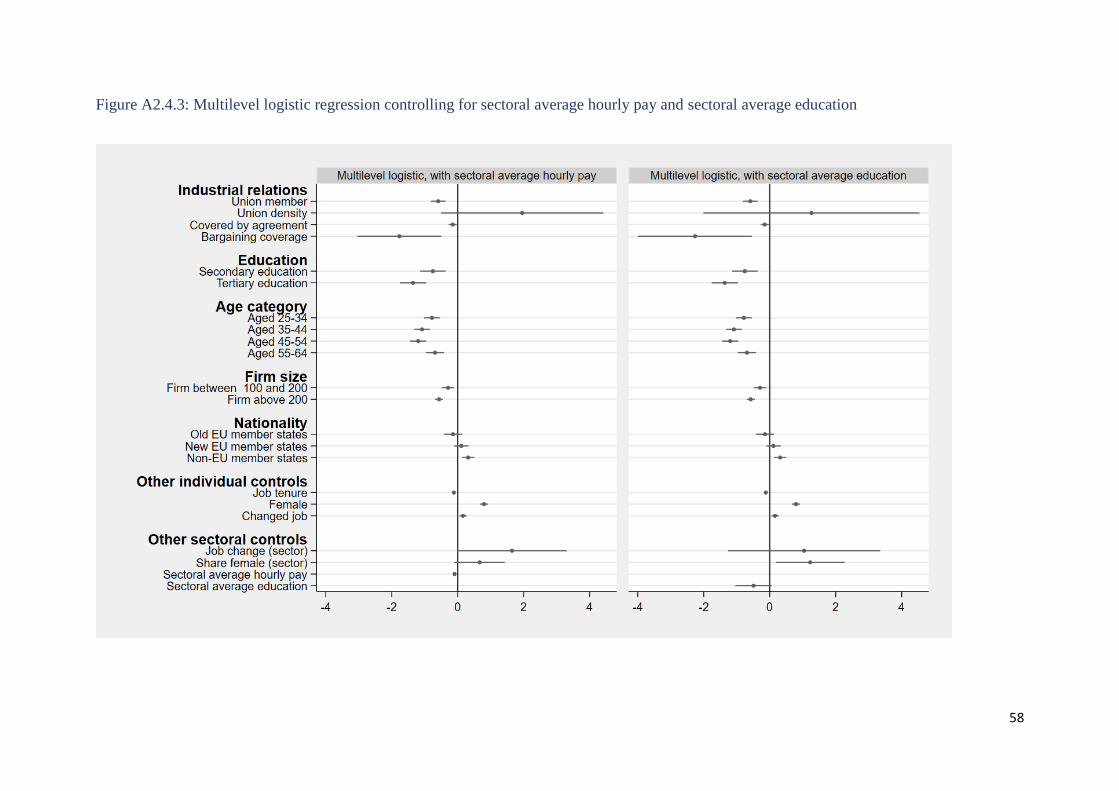
58
Figure A2.4.3: Multilevel logistic regression controlling for sectoral average hourly pay and sectoral average education
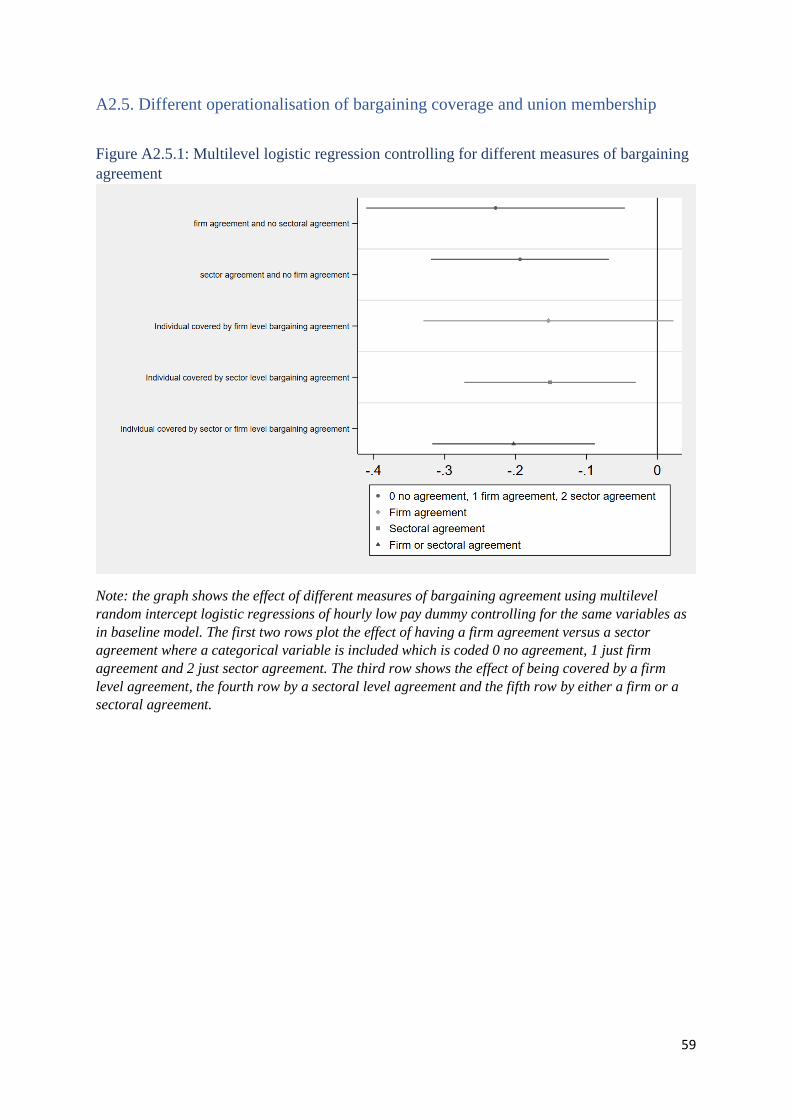
59
A2.5. Different operationalisation of bargaining coverage and union membership
Figure A2.5.1: Multilevel logistic regression controlling for different measures of bargaining
agreement
Note: the graph shows the effect of different measures of bargaining agreement using multilevel
random intercept logistic regressions of hourly low pay dummy controlling for the same variables as
in baseline model. The first two rows plot the effect of having a firm agreement versus a sector
agreement where a categorical variable is included which is coded 0 no agreement, 1 just firm
agreement and 2 just sector agreement. The third row shows the effect of being covered by a firm
level agreement, the fourth row by a sectoral level agreement and the fifth row by either a firm or a
sectoral agreement.
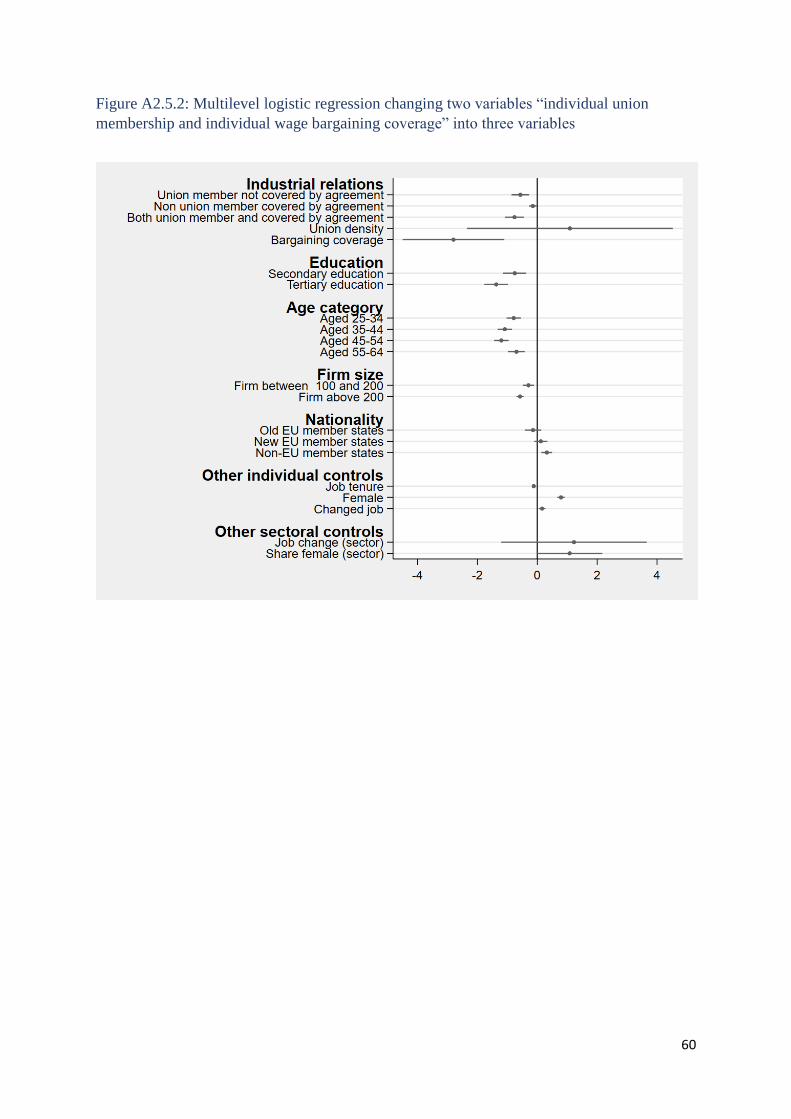
60
Figure A2.5.2: Multilevel logistic regression changing two variables “individual union
membership and individual wage bargaining coverage” into three variables
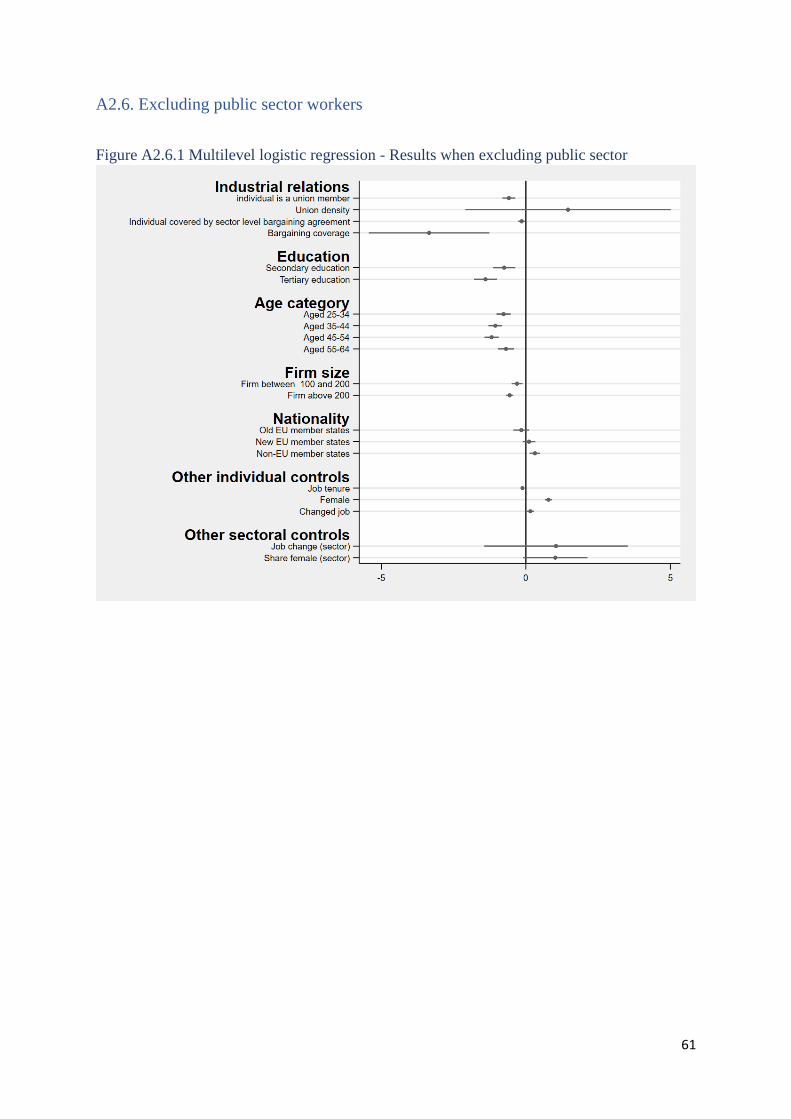
61
A2.6. Excluding public sector workers
Figure A2.6.1 Multilevel logistic regression - Results when excluding public sector
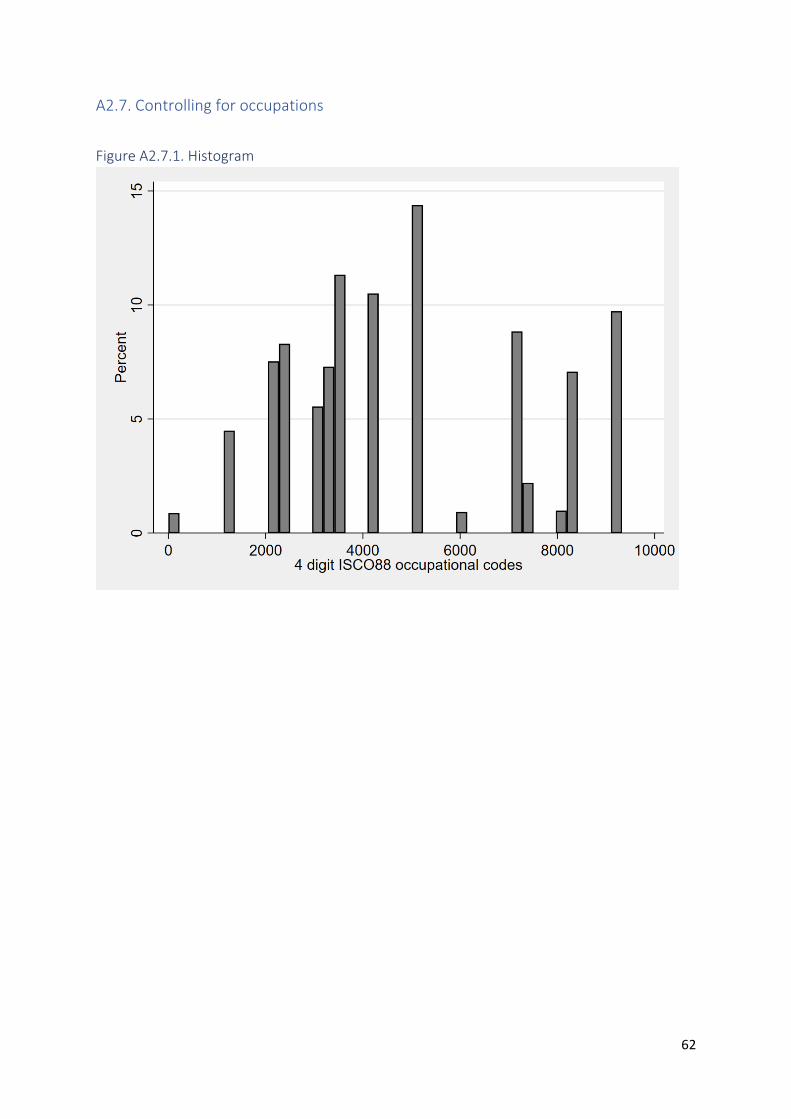
62
A2.7. Controlling for occupations
Figure A2.7.1. Histogram
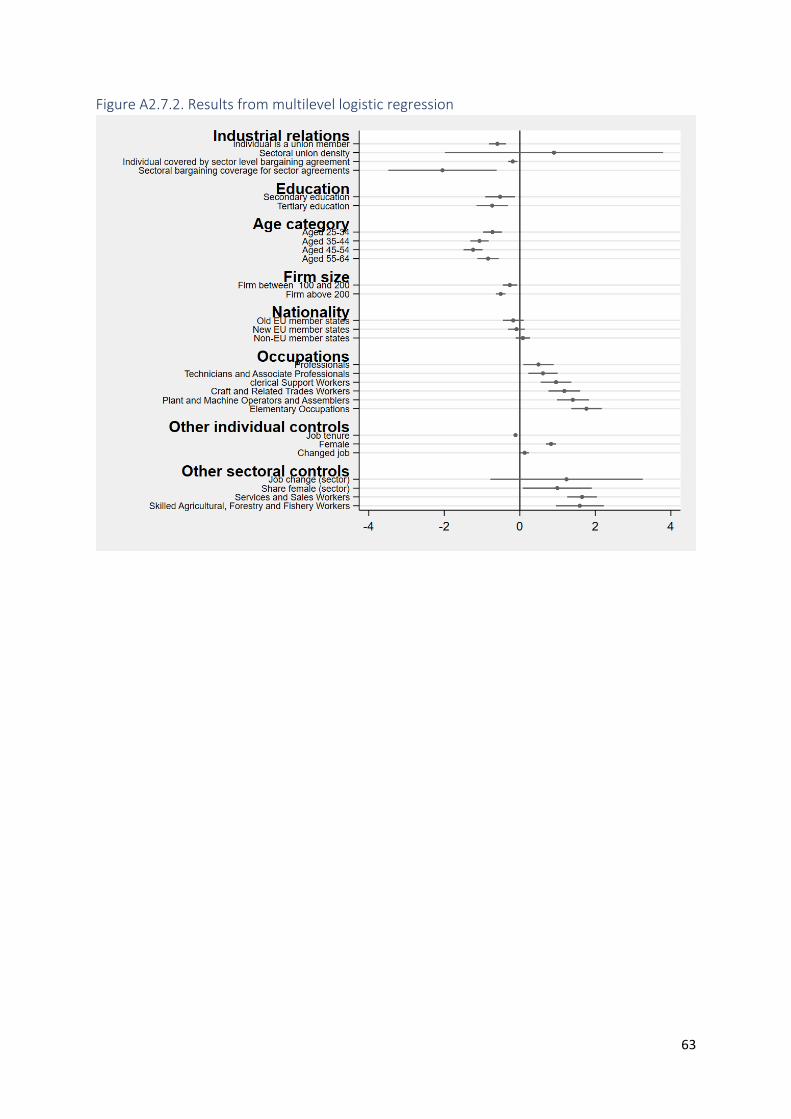
63
Figure A2.7.2. Results from multilevel logistic regression
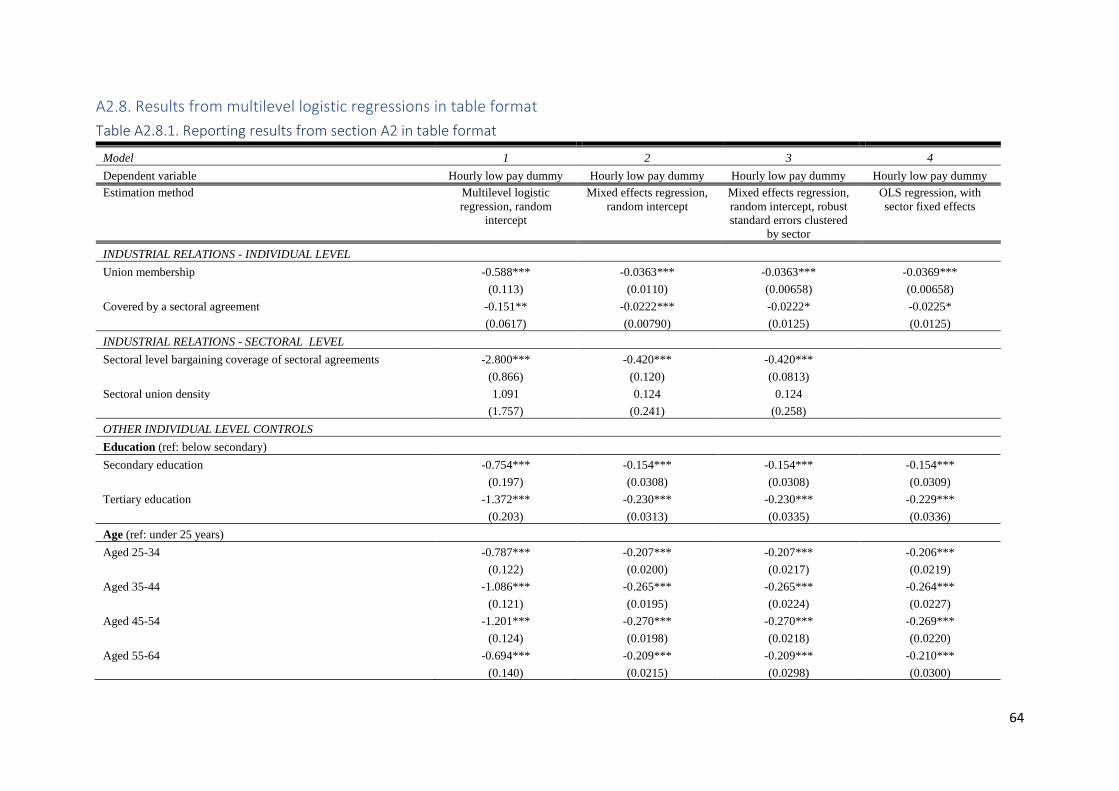
64
A2.8. Results from multilevel logistic regressions in table format
Table A2.8.1. Reporting results from section A2 in table format
Model 1 2 3 4
Dependent variable Hourly low pay dummy Hourly low pay dummy Hourly low pay dummy Hourly low pay dummy
Estimation method Multilevel logistic
regression, random
intercept
Mixed effects regression,
random intercept
Mixed effects regression,
random intercept, robust
standard errors clustered
by sector
OLS regression, with
sector fixed effects
INDUSTRIAL RELATIONS - INDIVIDUAL LEVEL
Union membership -0.588*** -0.0363*** -0.0363*** -0.0369***
(0.113) (0.0110) (0.00658) (0.00658)
Covered by a sectoral agreement -0.151** -0.0222*** -0.0222* -0.0225*
(0.0617) (0.00790) (0.0125) (0.0125)
INDUSTRIAL RELATIONS - SECTORAL LEVEL
Sectoral level bargaining coverage of sectoral agreements -2.800*** -0.420*** -0.420***
(0.866) (0.120) (0.0813)
Sectoral union density 1.091 0.124 0.124
(1.757) (0.241) (0.258)
OTHER INDIVIDUAL LEVEL CONTROLS
Education (ref: below secondary)
Secondary education -0.754*** -0.154*** -0.154*** -0.154***
(0.197) (0.0308) (0.0308) (0.0309)
Tertiary education -1.372*** -0.230*** -0.230*** -0.229***
(0.203) (0.0313) (0.0335) (0.0336)
Age (ref: under 25 years)
Aged 25-34 -0.787*** -0.207*** -0.207*** -0.206***
(0.122) (0.0200) (0.0217) (0.0219)
Aged 35-44 -1.086*** -0.265*** -0.265*** -0.264***
(0.121) (0.0195) (0.0224) (0.0227)
Aged 45-54 -1.201*** -0.270*** -0.270*** -0.269***
(0.124) (0.0198) (0.0218) (0.0220)
Aged 55-64 -0.694*** -0.209*** -0.209*** -0.210***
(0.140) (0.0215) (0.0298) (0.0300)
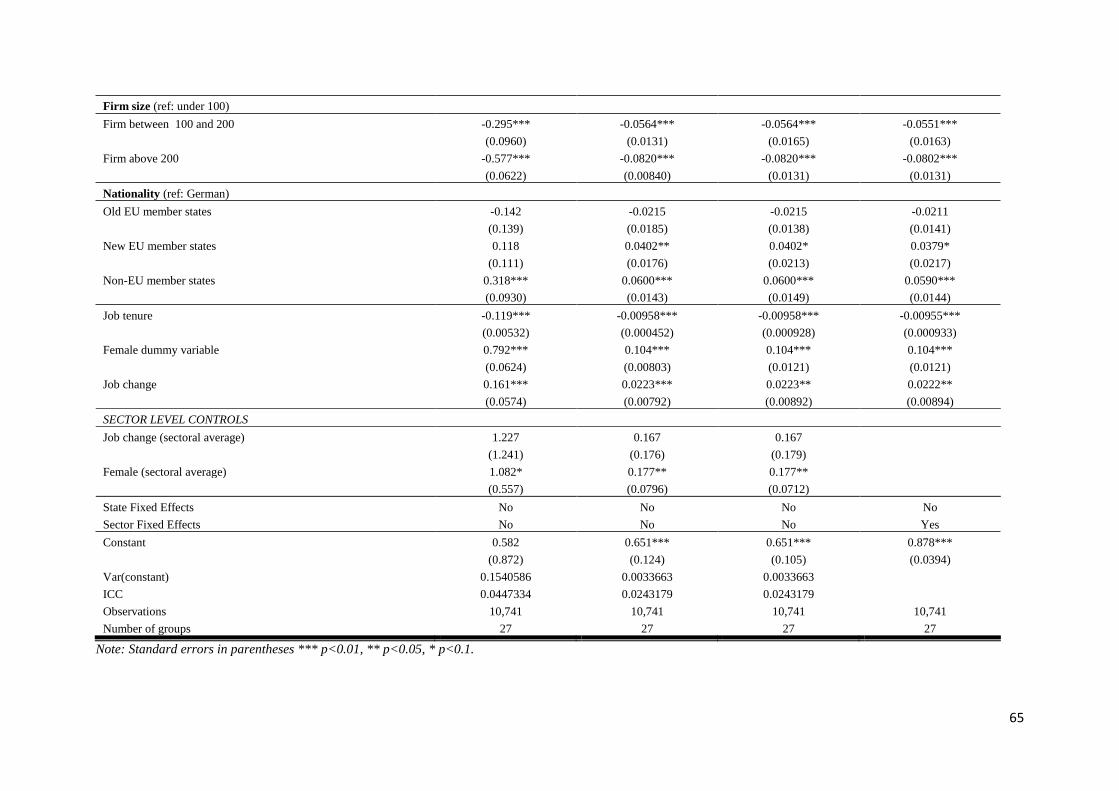
65
Firm size (ref: under 100)
Firm between 100 and 200 -0.295*** -0.0564*** -0.0564*** -0.0551***
(0.0960) (0.0131) (0.0165) (0.0163)
Firm above 200 -0.577*** -0.0820*** -0.0820*** -0.0802***
(0.0622) (0.00840) (0.0131) (0.0131)
Nationality (ref: German)
Old EU member states -0.142 -0.0215 -0.0215 -0.0211
(0.139) (0.0185) (0.0138) (0.0141)
New EU member states 0.118 0.0402** 0.0402* 0.0379*
(0.111) (0.0176) (0.0213) (0.0217)
Non-EU member states 0.318*** 0.0600*** 0.0600*** 0.0590***
(0.0930) (0.0143) (0.0149) (0.0144)
Job tenure -0.119*** -0.00958*** -0.00958*** -0.00955***
(0.00532) (0.000452) (0.000928) (0.000933)
Female dummy variable 0.792*** 0.104*** 0.104*** 0.104***
(0.0624) (0.00803) (0.0121) (0.0121)
Job change 0.161*** 0.0223*** 0.0223** 0.0222**
(0.0574) (0.00792) (0.00892) (0.00894)
SECTOR LEVEL CONTROLS
Job change (sectoral average) 1.227 0.167 0.167
(1.241) (0.176) (0.179)
Female (sectoral average) 1.082* 0.177** 0.177**
(0.557) (0.0796) (0.0712)
State Fixed Effects No No No No
Sector Fixed Effects No No No Yes
Constant 0.582 0.651*** 0.651*** 0.878***
(0.872) (0.124) (0.105) (0.0394)
Var(constant) 0.1540586 0.0033663 0.0033663
ICC 0.0447334 0.0243179 0.0243179
Observations 10,741 10,741 10,741 10,741
Number of groups 27 27 27 27
Note: Standard errors in parentheses *** p<0.01, ** p<0.05, * p<0.1.
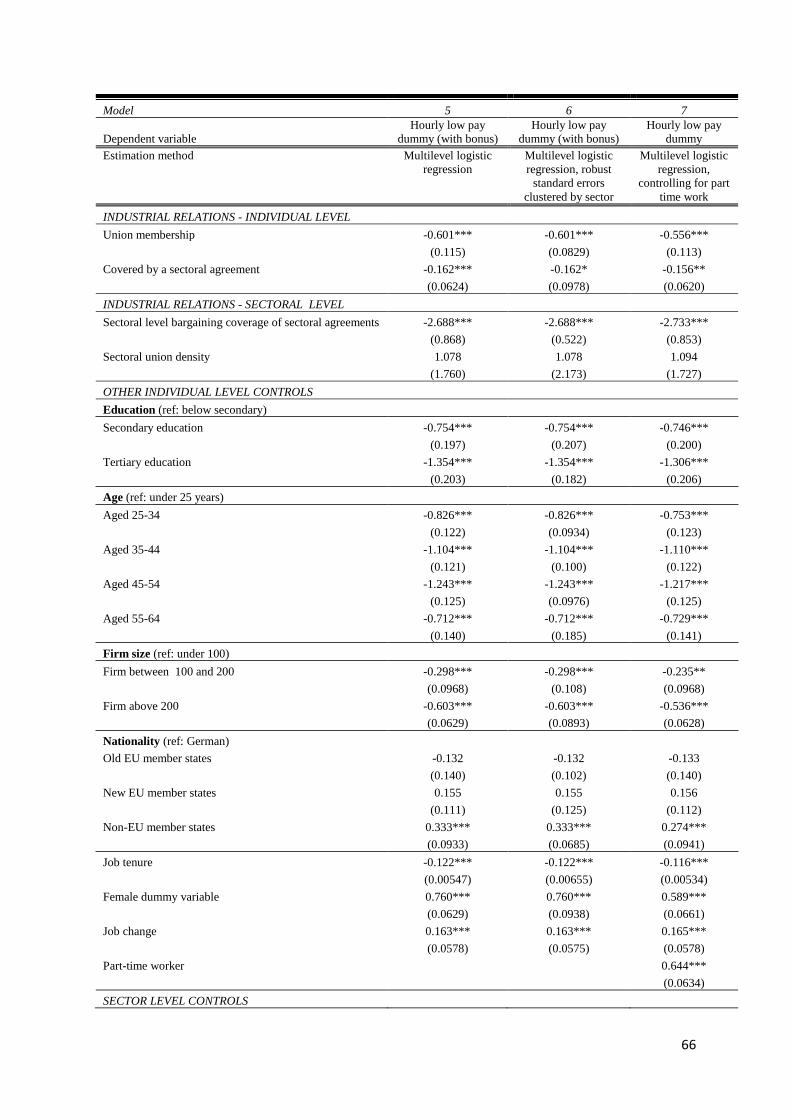
66
Model 5 6 7
Dependent variable
Hourly low pay
dummy (with bonus)
Hourly low pay
dummy (with bonus)
Hourly low pay
dummy
Estimation method Multilevel logistic
regression
Multilevel logistic
regression, robust
standard errors
clustered by sector
Multilevel logistic
regression,
controlling for part
time work
INDUSTRIAL RELATIONS - INDIVIDUAL LEVEL
Union membership -0.601*** -0.601*** -0.556***
(0.115) (0.0829) (0.113)
Covered by a sectoral agreement -0.162*** -0.162* -0.156**
(0.0624) (0.0978) (0.0620)
INDUSTRIAL RELATIONS - SECTORAL LEVEL
Sectoral level bargaining coverage of sectoral agreements -2.688*** -2.688*** -2.733***
(0.868) (0.522) (0.853)
Sectoral union density 1.078 1.078 1.094
(1.760) (2.173) (1.727)
OTHER INDIVIDUAL LEVEL CONTROLS
Education (ref: below secondary)
Secondary education -0.754*** -0.754*** -0.746***
(0.197) (0.207) (0.200)
Tertiary education -1.354*** -1.354*** -1.306***
(0.203) (0.182) (0.206)
Age (ref: under 25 years)
Aged 25-34 -0.826*** -0.826*** -0.753***
(0.122) (0.0934) (0.123)
Aged 35-44 -1.104*** -1.104*** -1.110***
(0.121) (0.100) (0.122)
Aged 45-54 -1.243*** -1.243*** -1.217***
(0.125) (0.0976) (0.125)
Aged 55-64 -0.712*** -0.712*** -0.729***
(0.140) (0.185) (0.141)
Firm size (ref: under 100)
Firm between 100 and 200 -0.298*** -0.298*** -0.235**
(0.0968) (0.108) (0.0968)
Firm above 200 -0.603*** -0.603*** -0.536***
(0.0629) (0.0893) (0.0628)
Nationality (ref: German)
Old EU member states -0.132 -0.132 -0.133
(0.140) (0.102) (0.140)
New EU member states 0.155 0.155 0.156
(0.111) (0.125) (0.112)
Non-EU member states 0.333*** 0.333*** 0.274***
(0.0933) (0.0685) (0.0941)
Job tenure -0.122*** -0.122*** -0.116***
(0.00547) (0.00655) (0.00534)
Female dummy variable 0.760*** 0.760*** 0.589***
(0.0629) (0.0938) (0.0661)
Job change 0.163*** 0.163*** 0.165***
(0.0578) (0.0575) (0.0578)
Part-time worker 0.644***
(0.0634)
SECTOR LEVEL CONTROLS
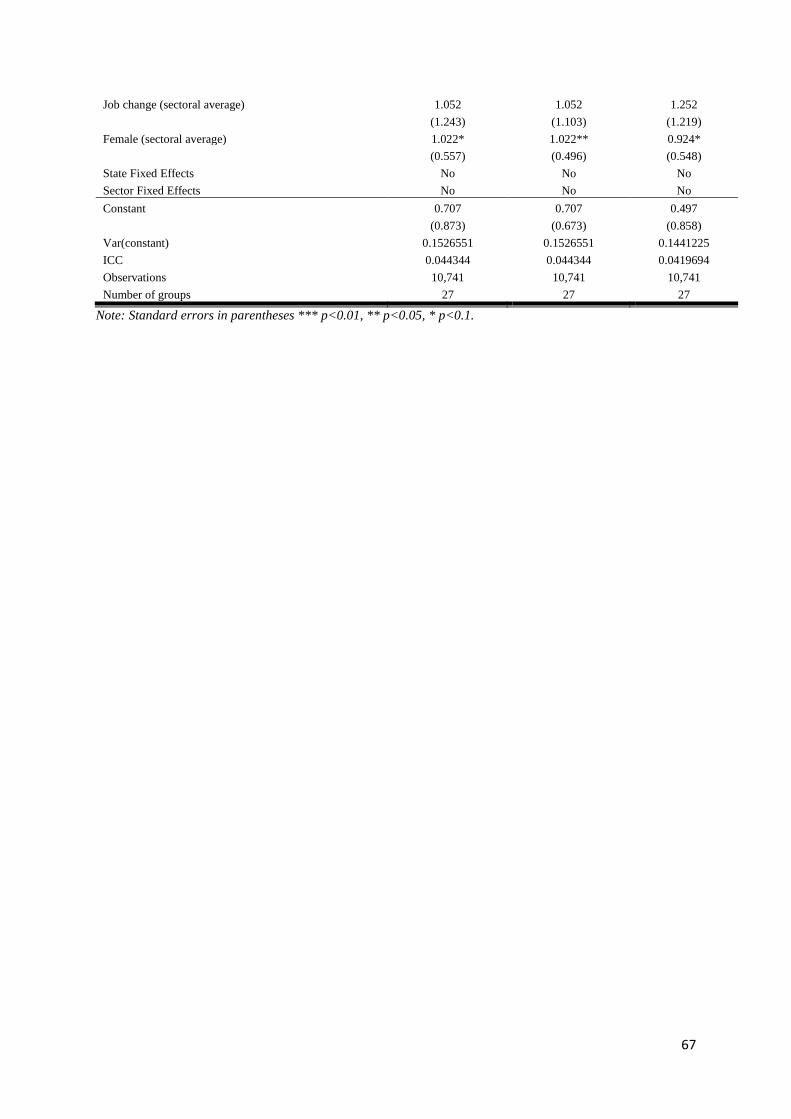
67
Job change (sectoral average) 1.052 1.052 1.252
(1.243) (1.103) (1.219)
Female (sectoral average) 1.022* 1.022** 0.924*
(0.557) (0.496) (0.548)
State Fixed Effects No No No
Sector Fixed Effects No No No
Constant 0.707 0.707 0.497
(0.873) (0.673) (0.858)
Var(constant) 0.1526551 0.1526551 0.1441225
ICC 0.044344 0.044344 0.0419694
Observations 10,741 10,741 10,741
Number of groups 27 27 27
Note: Standard errors in parentheses *** p<0.01, ** p<0.05, * p<0.1.
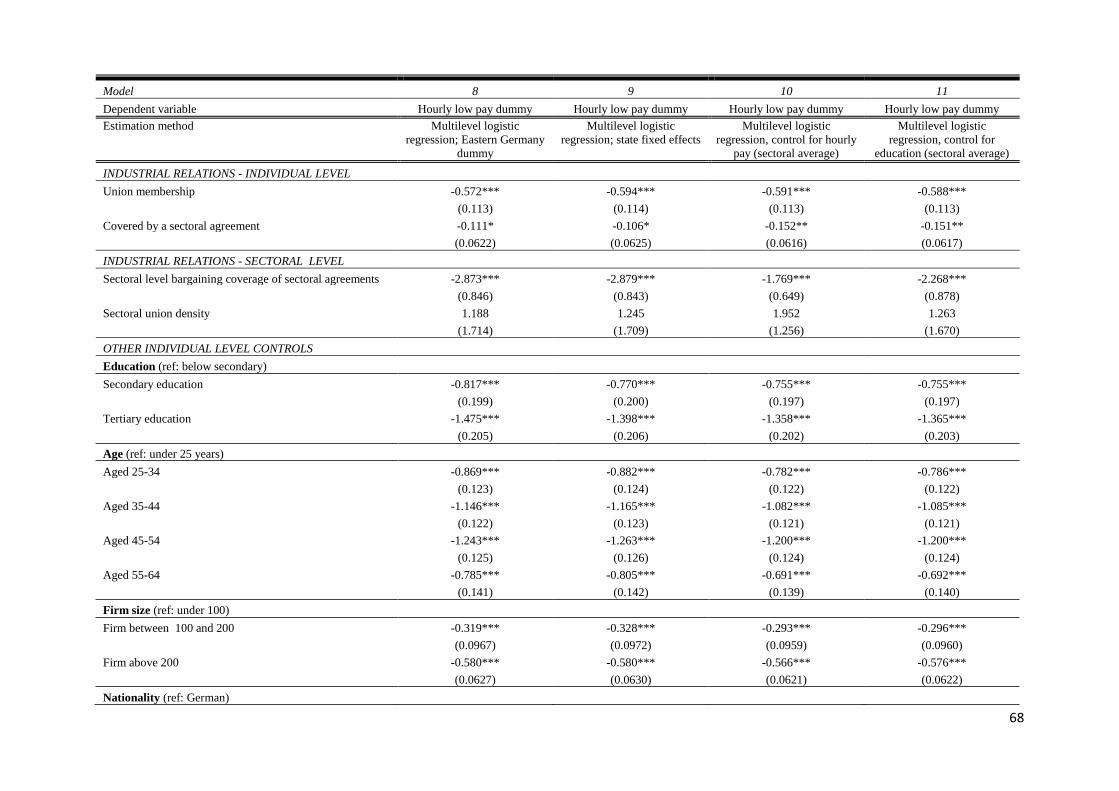
68
Model 8 9 10 11
Dependent variable Hourly low pay dummy Hourly low pay dummy Hourly low pay dummy Hourly low pay dummy
Estimation method Multilevel logistic
regression; Eastern Germany
dummy
Multilevel logistic
regression; state fixed effects
Multilevel logistic
regression, control for hourly
pay (sectoral average)
Multilevel logistic
regression, control for
education (sectoral average)
INDUSTRIAL RELATIONS - INDIVIDUAL LEVEL
Union membership -0.572*** -0.594*** -0.591*** -0.588***
(0.113) (0.114) (0.113) (0.113)
Covered by a sectoral agreement -0.111* -0.106* -0.152** -0.151**
(0.0622) (0.0625) (0.0616) (0.0617)
INDUSTRIAL RELATIONS - SECTORAL LEVEL
Sectoral level bargaining coverage of sectoral agreements -2.873*** -2.879*** -1.769*** -2.268***
(0.846) (0.843) (0.649) (0.878)
Sectoral union density 1.188 1.245 1.952 1.263
(1.714) (1.709) (1.256) (1.670)
OTHER INDIVIDUAL LEVEL CONTROLS
Education (ref: below secondary)
Secondary education -0.817*** -0.770*** -0.755*** -0.755***
(0.199) (0.200) (0.197) (0.197)
Tertiary education -1.475*** -1.398*** -1.358*** -1.365***
(0.205) (0.206) (0.202) (0.203)
Age (ref: under 25 years)
Aged 25-34 -0.869*** -0.882*** -0.782*** -0.786***
(0.123) (0.124) (0.122) (0.122)
Aged 35-44 -1.146*** -1.165*** -1.082*** -1.085***
(0.122) (0.123) (0.121) (0.121)
Aged 45-54 -1.243*** -1.263*** -1.200*** -1.200***
(0.125) (0.126) (0.124) (0.124)
Aged 55-64 -0.785*** -0.805*** -0.691*** -0.692***
(0.141) (0.142) (0.139) (0.140)
Firm size (ref: under 100)
Firm between 100 and 200 -0.319*** -0.328*** -0.293*** -0.296***
(0.0967) (0.0972) (0.0959) (0.0960)
Firm above 200 -0.580*** -0.580*** -0.566*** -0.576***
(0.0627) (0.0630) (0.0621) (0.0622)
Nationality (ref: German)
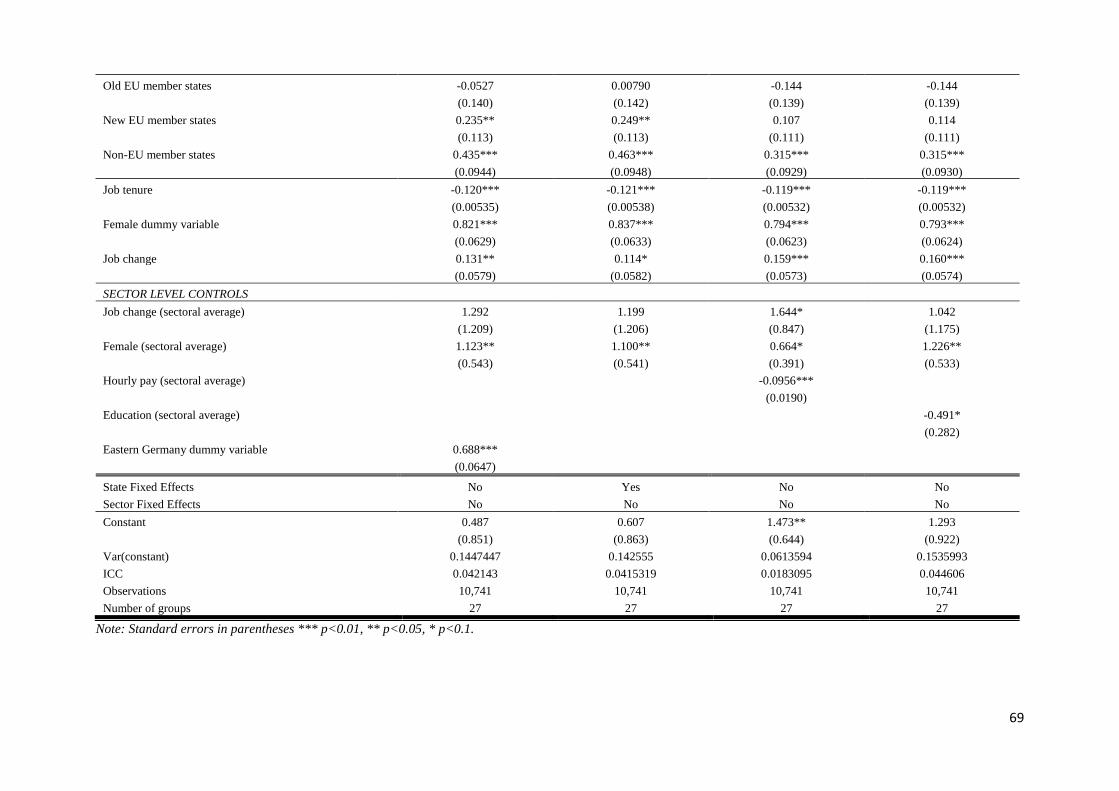
69
Old EU member states -0.0527 0.00790 -0.144 -0.144
(0.140) (0.142) (0.139) (0.139)
New EU member states 0.235** 0.249** 0.107 0.114
(0.113) (0.113) (0.111) (0.111)
Non-EU member states 0.435*** 0.463*** 0.315*** 0.315***
(0.0944) (0.0948) (0.0929) (0.0930)
Job tenure -0.120*** -0.121*** -0.119*** -0.119***
(0.00535) (0.00538) (0.00532) (0.00532)
Female dummy variable 0.821*** 0.837*** 0.794*** 0.793***
(0.0629) (0.0633) (0.0623) (0.0624)
Job change 0.131** 0.114* 0.159*** 0.160***
(0.0579) (0.0582) (0.0573) (0.0574)
SECTOR LEVEL CONTROLS
Job change (sectoral average) 1.292 1.199 1.644* 1.042
(1.209) (1.206) (0.847) (1.175)
Female (sectoral average) 1.123** 1.100** 0.664* 1.226**
(0.543) (0.541) (0.391) (0.533)
Hourly pay (sectoral average) -0.0956***
(0.0190)
Education (sectoral average) -0.491*
(0.282)
Eastern Germany dummy variable 0.688***
(0.0647)
State Fixed Effects No Yes No No
Sector Fixed Effects No No No No
Constant 0.487 0.607 1.473** 1.293
(0.851) (0.863) (0.644) (0.922)
Var(constant) 0.1447447 0.142555 0.0613594 0.1535993
ICC 0.042143 0.0415319 0.0183095 0.044606
Observations 10,741 10,741 10,741 10,741
Number of groups 27 27 27 27
Note: Standard errors in parentheses *** p<0.01, ** p<0.05, * p<0.1.
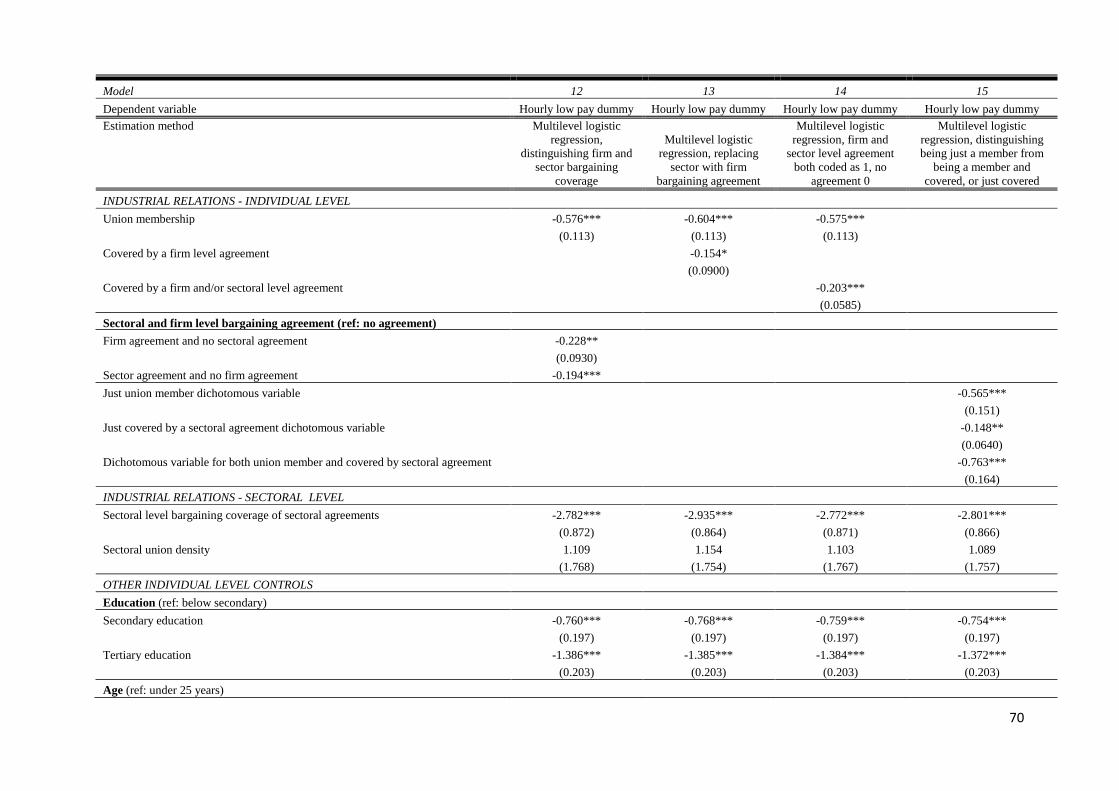
70
Model 12 13 14 15
Dependent variable Hourly low pay dummy Hourly low pay dummy Hourly low pay dummy Hourly low pay dummy
Estimation method Multilevel logistic
regression,
distinguishing firm and
sector bargaining
coverage
Multilevel logistic
regression, replacing
sector with firm
bargaining agreement
Multilevel logistic
regression, firm and
sector level agreement
both coded as 1, no
agreement 0
Multilevel logistic
regression, distinguishing
being just a member from
being a member and
covered, or just covered
INDUSTRIAL RELATIONS - INDIVIDUAL LEVEL
Union membership -0.576*** -0.604*** -0.575***
(0.113) (0.113) (0.113)
Covered by a firm level agreement -0.154*
(0.0900)
Covered by a firm and/or sectoral level agreement -0.203***
(0.0585)
Sectoral and firm level bargaining agreement (ref: no agreement)
Firm agreement and no sectoral agreement -0.228**
(0.0930)
Sector agreement and no firm agreement -0.194***
Just union member dichotomous variable -0.565***
(0.151)
Just covered by a sectoral agreement dichotomous variable -0.148**
(0.0640)
Dichotomous variable for both union member and covered by sectoral agreement -0.763***
(0.164)
INDUSTRIAL RELATIONS - SECTORAL LEVEL
Sectoral level bargaining coverage of sectoral agreements -2.782*** -2.935*** -2.772*** -2.801***
(0.872) (0.864) (0.871) (0.866)
Sectoral union density 1.109 1.154 1.103 1.089
(1.768) (1.754) (1.767) (1.757)
OTHER INDIVIDUAL LEVEL CONTROLS
Education (ref: below secondary)
Secondary education -0.760*** -0.768*** -0.759*** -0.754***
(0.197) (0.197) (0.197) (0.197)
Tertiary education -1.386*** -1.385*** -1.384*** -1.372***
(0.203) (0.203) (0.203) (0.203)
Age (ref: under 25 years)
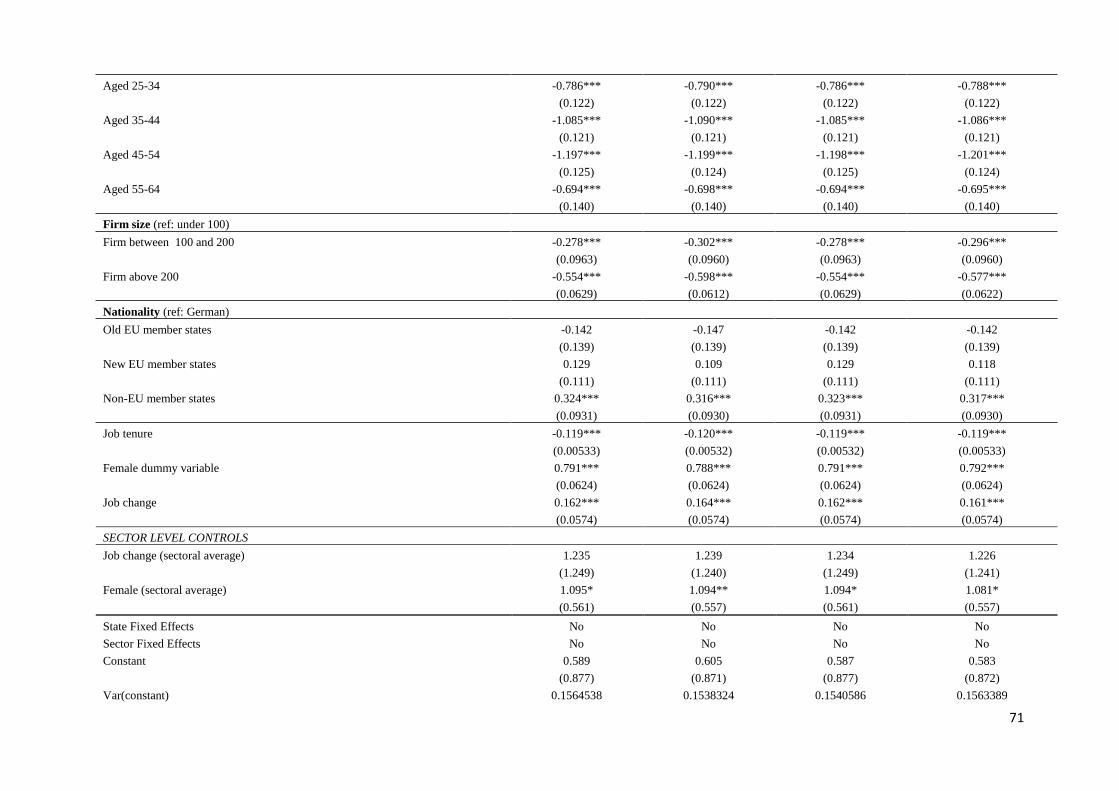
71
Aged 25-34 -0.786*** -0.790*** -0.786*** -0.788***
(0.122) (0.122) (0.122) (0.122)
Aged 35-44 -1.085*** -1.090*** -1.085*** -1.086***
(0.121) (0.121) (0.121) (0.121)
Aged 45-54 -1.197*** -1.199*** -1.198*** -1.201***
(0.125) (0.124) (0.125) (0.124)
Aged 55-64 -0.694*** -0.698*** -0.694*** -0.695***
(0.140) (0.140) (0.140) (0.140)
Firm size (ref: under 100)
Firm between 100 and 200 -0.278*** -0.302*** -0.278*** -0.296***
(0.0963) (0.0960) (0.0963) (0.0960)
Firm above 200 -0.554*** -0.598*** -0.554*** -0.577***
(0.0629) (0.0612) (0.0629) (0.0622)
Nationality (ref: German)
Old EU member states -0.142 -0.147 -0.142 -0.142
(0.139) (0.139) (0.139) (0.139)
New EU member states 0.129 0.109 0.129 0.118
(0.111) (0.111) (0.111) (0.111)
Non-EU member states 0.324*** 0.316*** 0.323*** 0.317***
(0.0931) (0.0930) (0.0931) (0.0930)
Job tenure -0.119*** -0.120*** -0.119*** -0.119***
(0.00533) (0.00532) (0.00532) (0.00533)
Female dummy variable 0.791*** 0.788*** 0.791*** 0.792***
(0.0624) (0.0624) (0.0624) (0.0624)
Job change 0.162*** 0.164*** 0.162*** 0.161***
(0.0574) (0.0574) (0.0574) (0.0574)
SECTOR LEVEL CONTROLS
Job change (sectoral average) 1.235 1.239 1.234 1.226
(1.249) (1.240) (1.249) (1.241)
Female (sectoral average) 1.095* 1.094** 1.094* 1.081*
(0.561) (0.557) (0.561) (0.557)
State Fixed Effects No No No No
Sector Fixed Effects No No No No
Constant 0.589 0.605 0.587 0.583
(0.877) (0.871) (0.877) (0.872)
Var(constant) 0.1564538 0.1538324 0.1540586 0.1563389
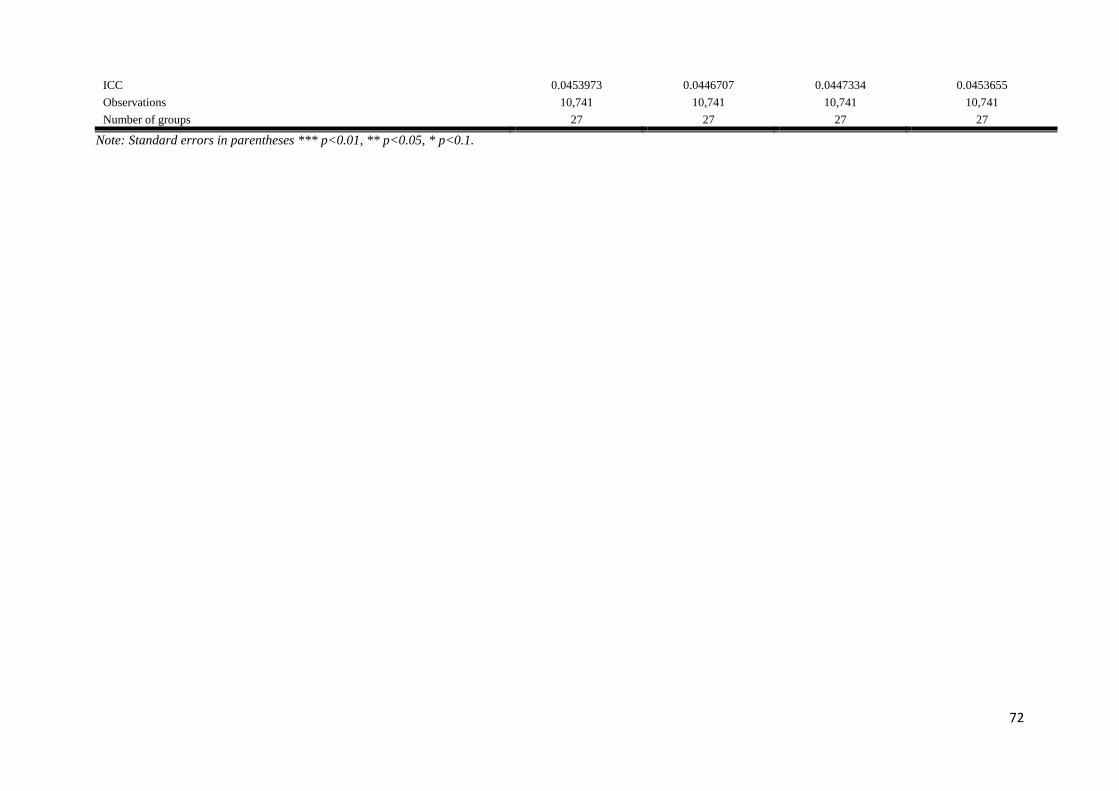
72
ICC 0.0453973 0.0446707 0.0447334 0.0453655
Observations 10,741 10,741 10,741 10,741
Number of groups 27 27 27 27
Note: Standard errors in parentheses *** p<0.01, ** p<0.05, * p<0.1.
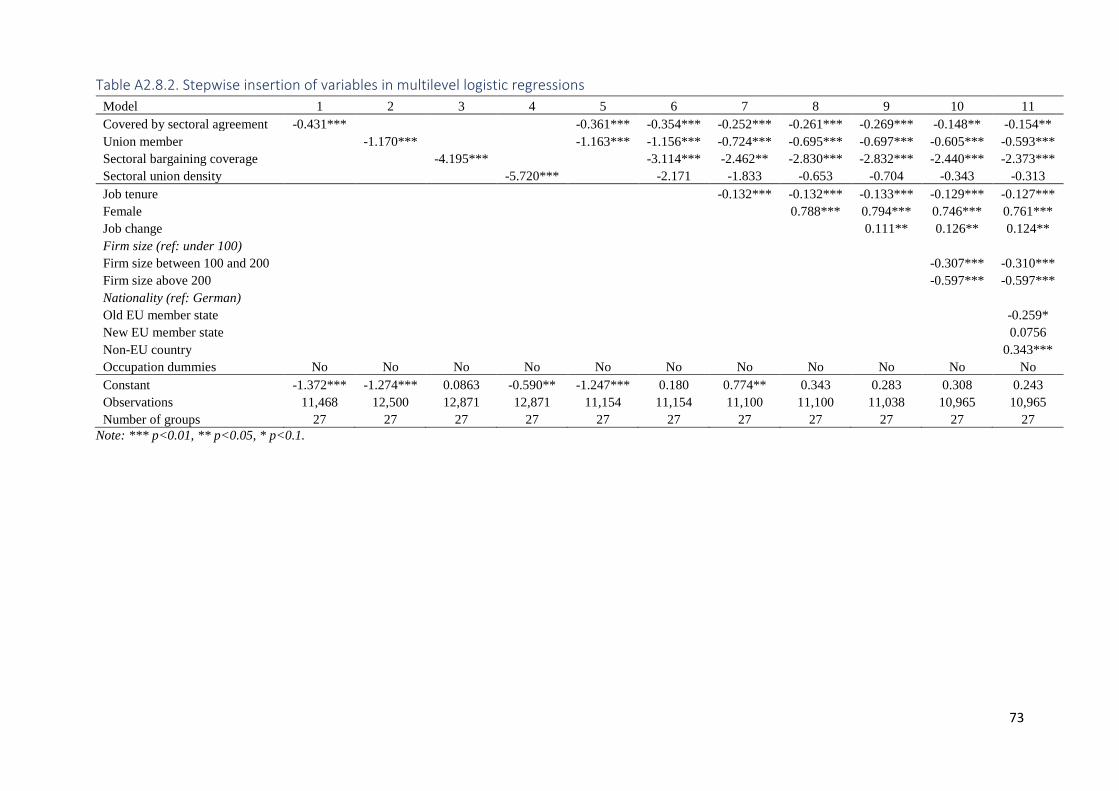
73
Table A2.8.2. Stepwise insertion of variables in multilevel logistic regressions
Model 1 2 3 4 5 6 7 8 9 10 11
Covered by sectoral agreement -0.431*** -0.361*** -0.354*** -0.252*** -0.261*** -0.269*** -0.148** -0.154**
Union member -1.170*** -1.163*** -1.156*** -0.724*** -0.695*** -0.697*** -0.605*** -0.593***
Sectoral bargaining coverage -4.195*** -3.114*** -2.462** -2.830*** -2.832*** -2.440*** -2.373***
Sectoral union density -5.720*** -2.171 -1.833 -0.653 -0.704 -0.343 -0.313
Job tenure -0.132*** -0.132*** -0.133*** -0.129*** -0.127***
Female 0.788*** 0.794*** 0.746*** 0.761***
Job change 0.111** 0.126** 0.124**
Firm size (ref: under 100) Firm size between 100 and 200 -0.307*** -0.310***
Firm size above 200 -0.597*** -0.597***
Nationality (ref: German) Old EU member state -0.259*
New EU member state 0.0756
Non-EU country 0.343***
Occupation dummies No No No No No No No No No No No
Constant -1.372*** -1.274*** 0.0863 -0.590** -1.247*** 0.180 0.774** 0.343 0.283 0.308 0.243
Observations 11,468 12,500 12,871 12,871 11,154 11,154 11,100 11,100 11,038 10,965 10,965
Number of groups 27 27 27 27 27 27 27 27 27 27 27
Note: *** p<0.01, ** p<0.05, * p<0.1.
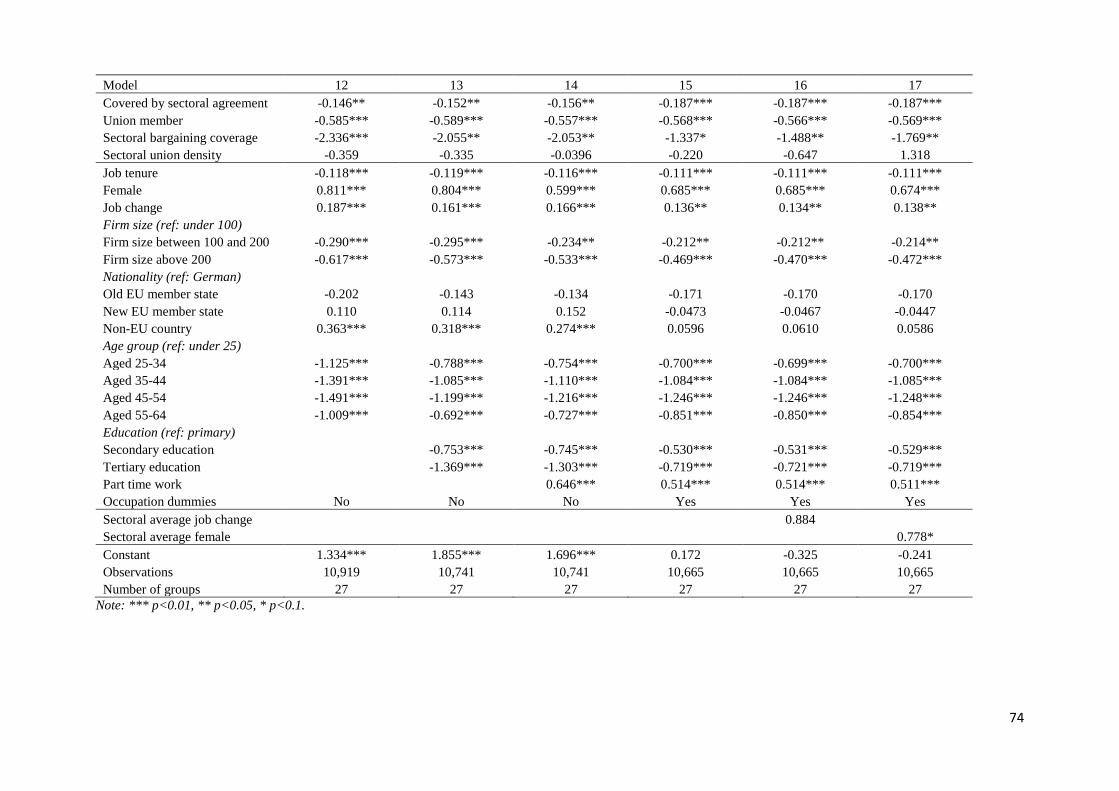
74
Model 12 13 14 15 16 17
Covered by sectoral agreement -0.146** -0.152** -0.156** -0.187*** -0.187*** -0.187***
Union member -0.585*** -0.589*** -0.557*** -0.568*** -0.566*** -0.569***
Sectoral bargaining coverage -2.336*** -2.055** -2.053** -1.337* -1.488** -1.769**
Sectoral union density -0.359 -0.335 -0.0396 -0.220 -0.647 1.318
Job tenure -0.118*** -0.119*** -0.116*** -0.111*** -0.111*** -0.111***
Female 0.811*** 0.804*** 0.599*** 0.685*** 0.685*** 0.674***
Job change 0.187*** 0.161*** 0.166*** 0.136** 0.134** 0.138**
Firm size (ref: under 100) Firm size between 100 and 200 -0.290*** -0.295*** -0.234** -0.212** -0.212** -0.214**
Firm size above 200 -0.617*** -0.573*** -0.533*** -0.469*** -0.470*** -0.472***
Nationality (ref: German) Old EU member state -0.202 -0.143 -0.134 -0.171 -0.170 -0.170
New EU member state 0.110 0.114 0.152 -0.0473 -0.0467 -0.0447
Non-EU country 0.363*** 0.318*** 0.274*** 0.0596 0.0610 0.0586
Age group (ref: under 25) Aged 25-34 -1.125*** -0.788*** -0.754*** -0.700*** -0.699*** -0.700***
Aged 35-44 -1.391*** -1.085*** -1.110*** -1.084*** -1.084*** -1.085***
Aged 45-54 -1.491*** -1.199*** -1.216*** -1.246*** -1.246*** -1.248***
Aged 55-64 -1.009*** -0.692*** -0.727*** -0.851*** -0.850*** -0.854***
Education (ref: primary) Secondary education -0.753*** -0.745*** -0.530*** -0.531*** -0.529***
Tertiary education -1.369*** -1.303*** -0.719*** -0.721*** -0.719***
Part time work 0.646*** 0.514*** 0.514*** 0.511***
Occupation dummies No No No Yes Yes Yes
Sectoral average job change 0.884
Sectoral average female 0.778*
Constant 1.334*** 1.855*** 1.696*** 0.172 -0.325 -0.241
Observations 10,919 10,741 10,741 10,665 10,665 10,665
Number of groups 27 27 27 27 27 27
Note: *** p<0.01, ** p<0.05, * p<0.1.
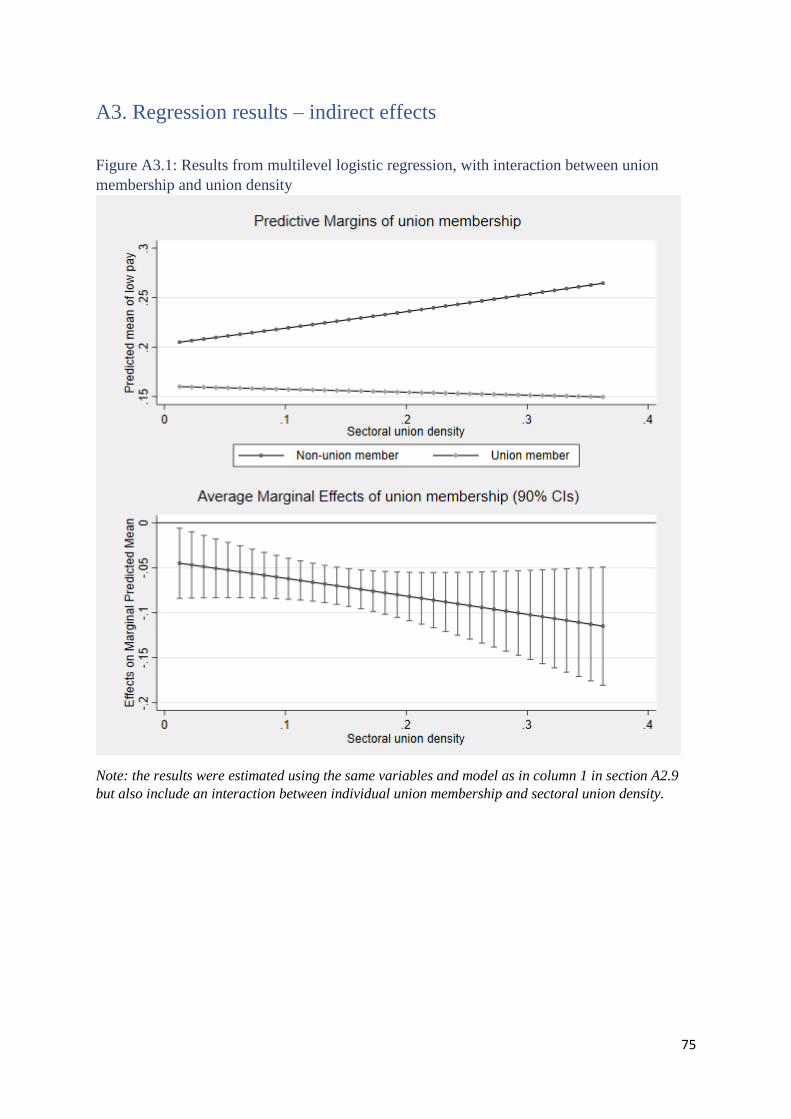
75
A3. Regression results – indirect effects
Figure A3.1: Results from multilevel logistic regression, with interaction between union
membership and union density
Note: the results were estimated using the same variables and model as in column 1 in section A2.9
but also include an interaction between individual union membership and sectoral union density.
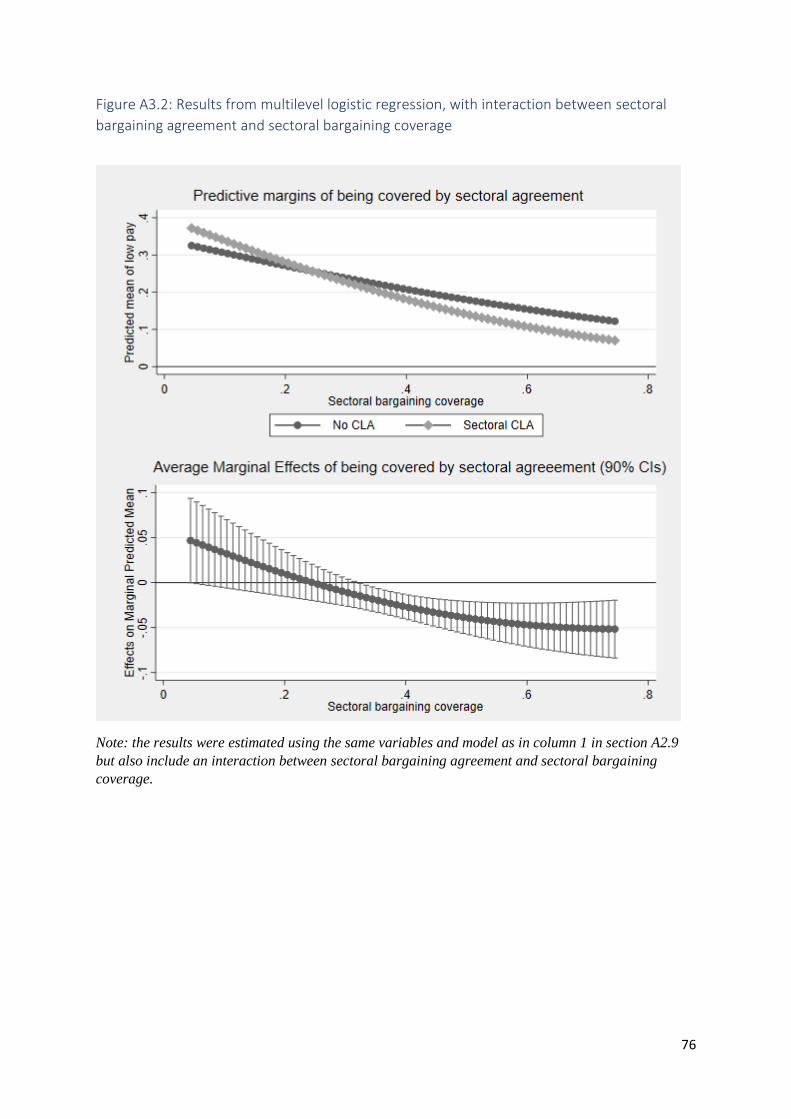
76
Figure A3.2: Results from multilevel logistic regression, with interaction between sectoral
bargaining agreement and sectoral bargaining coverage
Note: the results were estimated using the same variables and model as in column 1 in section A2.9
but also include an interaction between sectoral bargaining agreement and sectoral bargaining
coverage.