Embed Size (px)
Citation preview
Multidisciplinary Design Optimizationof a Strut-Braced Wing Aircraft
with Tip-Mounted Engines
By
J.M. Grasmeyer, A. Naghshineh-Pour, P.-A. Tetrault,
B. Grossman, R.T. Haftka,* R.K. Kapania,
W.H. Mason, and J.A. Schetz
MAD 98-01-01
January, 1998
Supported by the NASA Langley Research Centerunder grant NAG1-1852
Multidisciplinary Analysis and Design Center for Advanced VehiclesDepartment of Aerospace and Ocean EngineeringVirginia Polytechnic Institute and State University
Blacksburg, VA 24061-0203
* Department of Aerospace Engineering, Mechanics and Engineering Science, University of Florida,Gainesville, FL 32611-6250
Not to be distributed to non-U.S. citizens without permissionfrom Dennis Bushnell at NASA Langley Research Center
ii
Contents
1. Executive Summary . . . . . . . . . . . . . . . . . . . . . . . . . . . . . . . . . . . . . . . . . . . . . . . . . . . . . . . . . . . . . 1
2. Introduction . . . . . . . . . . . . . . . . . . . . . . . . . . . . . . . . . . . . . . . . . . . . . . . . . . . . . . . . . . . . . . . . . . . . . 3
3. Problem Statement . . . . . . . . . . . . . . . . . . . . . . . . . . . . . . . . . . . . . . . . . . . . . . . . . . . . . . . . . . . . . . 3
3.1. Mission Profile .. . . . . . . . . . . . . . . . . . . . . . . . . . . . . . . . . . . . . . . . . . . . . . . . . . . . . . . . . . . . . . . . . . . . . . . . . . . . 4
4. Approach . . . . . . . . . . . . . . . . . . . . . . . . . . . . . . . . . . . . . . . . . . . . . . . . . . . . . . . . . . . . . . . . . . . . . . . . 5
4.1. Definition of the Optimization Problem ... . . . . . . . . . . . . . . . . . . . . . . . . . . . . . . . . . . . . . . . . . . . . . 54.2. Multidisciplinary Approach ... . . . . . . . . . . . . . . . . . . . . . . . . . . . . . . . . . . . . . . . . . . . . . . . . . . . . . . . . . . . 9
4.2.1. Aerodynamics, Stability and Control, and Propulsion .. . . . . . . . . . . . . . . . . . . . . . . . 94.2.2. Structures.. . . . . . . . . . . . . . . . . . . . . . . . . . . . . . . . . . . . . . . . . . . . . . . . . . . . . . . . . . . . . . . . . . . . . . . . . . .134.2.3. Interference Drag ... . . . . . . . . . . . . . . . . . . . . . . . . . . . . . . . . . . . . . . . . . . . . . . . . . . . . . . . . . . . . . . .20
4.3. Validation .. . . . . . . . . . . . . . . . . . . . . . . . . . . . . . . . . . . . . . . . . . . . . . . . . . . . . . . . . . . . . . . . . . . . . . . . . . . . . . . . .25
5. Results. . . . . . . . . . . . . . . . . . . . . . . . . . . . . . . . . . . . . . . . . . . . . . . . . . . . . . . . . . . . . . . . . . . . . . . . . . 26
5.1. Comparison of Cantilever and Strut-Braced Designs .. . . . . . . . . . . . . . . . . . . . . . . . . . . . . . .285.2. Understanding the Optimum Configurations.. . . . . . . . . . . . . . . . . . . . . . . . . . . . . . . . . . . . . . . . .315.3. Why is the sweep so high?.. . . . . . . . . . . . . . . . . . . . . . . . . . . . . . . . . . . . . . . . . . . . . . . . . . . . . . . . . . . . . .355.4. Sensitivity to Laminar Flow ... . . . . . . . . . . . . . . . . . . . . . . . . . . . . . . . . . . . . . . . . . . . . . . . . . . . . . . . . . .405.5. Sensitivity to the Airfoil Technology Factor .. . . . . . . . . . . . . . . . . . . . . . . . . . . . . . . . . . . . . . . . .415.6. Sensitivity to the Wing-Strut Interference Drag .. . . . . . . . . . . . . . . . . . . . . . . . . . . . . . . . . . . . .425.7. Sensitivity to the Design Mach Number .. . . . . . . . . . . . . . . . . . . . . . . . . . . . . . . . . . . . . . . . . . . . . .43
6. Imagineering . . . . . . . . . . . . . . . . . . . . . . . . . . . . . . . . . . . . . . . . . . . . . . . . . . . . . . . . . . . . . . . . . . . 44
6.1. Configuration Visualization .. . . . . . . . . . . . . . . . . . . . . . . . . . . . . . . . . . . . . . . . . . . . . . . . . . . . . . . . . . . .45
7. Conclusions and Future Work . . . . . . . . . . . . . . . . . . . . . . . . . . . . . . . . . . . . . . . . . . . . . . . . . . 47
7.1. Summary of Results . . . . . . . . . . . . . . . . . . . . . . . . . . . . . . . . . . . . . . . . . . . . . . . . . . . . . . . . . . . . . . . . . . . . . .477.2. Conclusions .. . . . . . . . . . . . . . . . . . . . . . . . . . . . . . . . . . . . . . . . . . . . . . . . . . . . . . . . . . . . . . . . . . . . . . . . . . . . . . .487.3. Future Work ... . . . . . . . . . . . . . . . . . . . . . . . . . . . . . . . . . . . . . . . . . . . . . . . . . . . . . . . . . . . . . . . . . . . . . . . . . . . .49
iii
List of Figures
3-1 Boeing 777-200IGW mission profile .. . . . . . . . . . . . . . . . . . . . . . . . . . . . . . . . . . . . . . . . . . . . . . . . . . . 54-1 Wing geometry.. . . . . . . . . . . . . . . . . . . . . . . . . . . . . . . . . . . . . . . . . . . . . . . . . . . . . . . . . . . . . . . . . . . . . . . . . . . . . 74-2 MDO code architecture .. . . . . . . . . . . . . . . . . . . . . . . . . . . . . . . . . . . . . . . . . . . . . . . . . . . . . . . . . . . . . . . . . . . 94-3 Drag reduction due to tip-mounted engines .. . . . . . . . . . . . . . . . . . . . . . . . . . . . . . . . . . . . . . . . . . .104-4 Transition Reynolds number vs. sweep... . . . . . . . . . . . . . . . . . . . . . . . . . . . . . . . . . . . . . . . . . . . . . .114-5 Boeing 747-100 drag rise comparison .. . . . . . . . . . . . . . . . . . . . . . . . . . . . . . . . . . . . . . . . . . . . . . . . .124-6 Bending material weight validation .. . . . . . . . . . . . . . . . . . . . . . . . . . . . . . . . . . . . . . . . . . . . . . . . . . . .154-7 Shear force distribution for the single-strut design with tip engines.. . . . . . . . . . . . . . .154-8 Bending moment distribution for the single-strut design with tip engines.. . . . . . . .164-9 Shear force distribution for the single-strut design with under-wing engines .. . . .164-10 Bending moment distribution for the single-strut design with under-wing
engines .. . . . . . . . . . . . . . . . . . . . . . . . . . . . . . . . . . . . . . . . . . . . . . . . . . . . . . . . . . . . . . . . . . . . . . . . . . . . . . . . . . . . .174-11 Structural material thickness distributions for the tip-mounted engine
configuration .. . . . . . . . . . . . . . . . . . . . . . . . . . . . . . . . . . . . . . . . . . . . . . . . . . . . . . . . . . . . . . . . . . . . . . . . . . . . . .184-12 Structural material thickness distributions for the under-wing engine
configuration .. . . . . . . . . . . . . . . . . . . . . . . . . . . . . . . . . . . . . . . . . . . . . . . . . . . . . . . . . . . . . . . . . . . . . . . . . . . . . .184-13 Deflections for the single-strut design with tip-mounted engines.. . . . . . . . . . . . . . . . . .194-14 Deflections for the single-strut design with under-wing engines.. . . . . . . . . . . . . . . . . . .204-15 Grid and CP contours for Douglas wing-pylon-store, M = 0.75, α = 4˚ .. . . . . . . . . . .22
4-16 CP distribution at the pylon station obtained with GASP, M = 0.75, α = 4˚ .. . . . . .23
4-17 CP distribution at the pylon station obtained with USM3D, M = 0.75, α = 4˚ .. . .24
4-18 Grid and CP contours for 30˚ wing-strut intersection, M = 0.75, α = 0˚.. . . . . . . . . . .25
5-1 Current technology baseline cantilever configuration .. . . . . . . . . . . . . . . . . . . . . . . . . . . . . . .275-2 Advanced technology optimized cantilever configuration .. . . . . . . . . . . . . . . . . . . . . . . . . .275-3 Optimum single-strut configuration with tip-mounted engines.. . . . . . . . . . . . . . . . . . . . .285-4 Optimum single-strut configuration with under-wing engines*.. . . . . . . . . . . . . . . . . . . .285-5 Drag comparison.. . . . . . . . . . . . . . . . . . . . . . . . . . . . . . . . . . . . . . . . . . . . . . . . . . . . . . . . . . . . . . . . . . . . . . . . . .315-6 Weight comparison .. . . . . . . . . . . . . . . . . . . . . . . . . . . . . . . . . . . . . . . . . . . . . . . . . . . . . . . . . . . . . . . . . . . . . . .335-7 Wing weight vs. aspect ratio .. . . . . . . . . . . . . . . . . . . . . . . . . . . . . . . . . . . . . . . . . . . . . . . . . . . . . . . . . . . .345-8 Cost comparison .. . . . . . . . . . . . . . . . . . . . . . . . . . . . . . . . . . . . . . . . . . . . . . . . . . . . . . . . . . . . . . . . . . . . . . . . . .355-9 Original optimum single-strut configuration.. . . . . . . . . . . . . . . . . . . . . . . . . . . . . . . . . . . . . . . . . .365-10 50% sweep configuration .. . . . . . . . . . . . . . . . . . . . . . . . . . . . . . . . . . . . . . . . . . . . . . . . . . . . . . . . . . . . . . . .365-11 Fully unswept configuration.. . . . . . . . . . . . . . . . . . . . . . . . . . . . . . . . . . . . . . . . . . . . . . . . . . . . . . . . . . . . .375-12 Drag comparison for unswept configurations.. . . . . . . . . . . . . . . . . . . . . . . . . . . . . . . . . . . . . . . . .38
iv
5-13 Weight comparison for unswept configurations .. . . . . . . . . . . . . . . . . . . . . . . . . . . . . . . . . . . . . .395-14 Laminar flow on optimum single-strut design (shaded regions are laminar) .. . . . .405-15 Sensitivity of the single-strut design to the amount of laminar flow... . . . . . . . . . . . . .415-16 Sensitivity to the airfoil technology factor .. . . . . . . . . . . . . . . . . . . . . . . . . . . . . . . . . . . . . . . . . . . .425-17 Sensitivity to the magnitude of the wing-strut interference drag .. . . . . . . . . . . . . . . . . . .435-18 Optimum takeoff weight vs. design Mach number.. . . . . . . . . . . . . . . . . . . . . . . . . . . . . . . . . . .446-1 Arch-shaped strut configuration .. . . . . . . . . . . . . . . . . . . . . . . . . . . . . . . . . . . . . . . . . . . . . . . . . . . . . . . .456-2 Rendered solid model of the single-strut configuration .. . . . . . . . . . . . . . . . . . . . . . . . . . . . .466-3 Plastic solid model of the arch-shaped strut concept.. . . . . . . . . . . . . . . . . . . . . . . . . . . . . . . . .46
List of Tables
1-1 Improvements of the optimum strut-braced wing configuration relative to thecurrent technology and advanced technology cantilever wing configurations .. . . . 2
4-1 Design variables.. . . . . . . . . . . . . . . . . . . . . . . . . . . . . . . . . . . . . . . . . . . . . . . . . . . . . . . . . . . . . . . . . . . . . . . . . . . . 64-2 Constraints .. . . . . . . . . . . . . . . . . . . . . . . . . . . . . . . . . . . . . . . . . . . . . . . . . . . . . . . . . . . . . . . . . . . . . . . . . . . . . . . . . . 75-1 Configuration comparison .. . . . . . . . . . . . . . . . . . . . . . . . . . . . . . . . . . . . . . . . . . . . . . . . . . . . . . . . . . . . . . .295-2 Configuration comparison for unswept configurations .. . . . . . . . . . . . . . . . . . . . . . . . . . . . . .377-1 Configuration summary... . . . . . . . . . . . . . . . . . . . . . . . . . . . . . . . . . . . . . . . . . . . . . . . . . . . . . . . . . . . . . . . .487-2 Improvements of the single-strut design relative to the advanced technology
cantilever configuration.. . . . . . . . . . . . . . . . . . . . . . . . . . . . . . . . . . . . . . . . . . . . . . . . . . . . . . . . . . . . . . . . . .49
1
1. Executive Summary
The objective of this study is to use Multidisciplinary Design Optimization (MDO) toinvestigate the use of truss-braced wing concepts in concert with other advancedtechnologies to obtain a significant improvement in the performance of transonictransport aircraft. The truss topology introduces several opportunities. A higher aspectratio and decreased wing thickness can be achieved without an increase in wing weightrelative to a cantilever wing. The reduction in thickness allows the wing sweep to bereduced without incurring a transonic wave drag penalty. The reduced wing sweep allowsa larger percentage of the wing area to achieve natural laminar flow. Additionally, tip-mounted engines are used to reduce the induced drag. The MDO approach helps thedesigner achieve the best technology integration by making optimum trades betweencompeting physical effects in the design space.
For this study we are using a mission profile similar to the Boeing 777-200IGW. Thetransport carries 305 passengers in mixed class seating with a cruise Mach number of0.85 for a range of 7,380 nmi. Throughout the study we compare the performance of theoptimum truss-braced configurations with a current technology cantilever design similarto the 777-200IGW and an advanced technology optimized cantilever design.
In the first year of research we developed the basic infrastructure for the MDOevaluation of this concept. A suite of approximate analysis tools was assembled into acomplete, conceptual-level MDO code. A single-strut was initially chosen as the mostbasic representation of the truss-braced wing topology. Several single-strut configurationswere optimized for minimum takeoff gross weight, using eighteen design variables andseven constraints.
Some thought was given to the judicious use of advanced concepts and technology.The study incorporates natural laminar flow and a novel structural concept to overcomethe traditional problem of strut-braced wings: buckling of the strut. Other than that, tip-mounted engines have been incorporated, but the effects of allowing the engines to belocated under the wing have also been studied. The configuration appears to beparticularly robust and amenable to the inclusion of numerous other concepts andtechnologies. However, to reduce risk and development cost, we have not incorporatedthese other possibilities, e.g., active load alleviation, porous wing concepts, etc.
The resulting MDO design features a wing with an aspect ratio of 10.3, a sweep of27.3˚, and a significant reduction in the thickness-to-chord ratio from a comparablecantilever wing configuration. The optimum single-strut design achieves laminar flowover 32% of the wing area, and the strut is fully laminar. The preliminary studies haveshown the following performance gains for the single-strut configuration relative to a
2
current technology baseline cantilever configuration and an advanced technologyoptimum cantilever configuration
Table 1-1: Improvements of the optimum strut-braced wing configuration relative to thecurrent technology and advanced technology cantilever wing configurations
Measure of Effectiveness Relative to Current Technology Baseline Cantilever Configuration
Relative to Advanced Technology Optimum Cantilever Configuration
Takeoff Gross Weight -23% -14%
Fuel Weight -36% -21%
Operational Empty Weight -20% -16%
Cruise L/D 30% 12%
Seat-Miles/Gallon 56% 26%
In addition to the MDO work, we have been conducting weekly brainstormingsessions to develop innovative, unconventional arch-braced and ellipse-braced concepts.A plastic solid model of one of the novel configurations was created using the I-DEASsolid modeling software and the rapid prototyping hardware at Virginia Tech. Thiscapability will allow easy visualization of complex configurations in the future.
3
2. Introduction
The idea of using a truss-braced wing for a long-range, transonic transport aircraft wasfirst proposed by Werner Pfenninger at Northrop in the early 1950s [1]. He continued thiswork on and off until his retirement from NASA Langley in the late 1980s. Other truss-braced wing studies have also been performed at NASA [2] and [3], Boeing [4], andLockheed [5]. However, none of these studies have been performed using aMultidisciplinary Design Optimization (MDO) methodology.
Because of the tight coupling between structures and aerodynamics in the truss-braced wing design problem, an MDO approach is required to assess the true potential ofthe concept. In June of 1996, a small research team within Virginia Tech'sMultidisciplinary Analysis and Design (MAD) Center for Advanced Vehicles was taskedby NASA Langley to perform a thorough feasibility study of transonic, truss-braced wingconfigurations using an MDO approach. This report summarizes the research performedthrough December of 1998.
3. Problem Statement
The goal of this research has been to apply the Multidisciplinary Design Optimization(MDO) methodology to the design of a transonic, truss-braced wing to evaluate theconcept feasibility.
The truss-braced wing concept embraces several synergistic design features to obtaina significant increase in performance. Conceptually, the structural efficiency of the trussallows the span to increase without an increase in wing weight or thickness (they mayactually decrease). The increased span reduces the induced drag, and a decrease inthickness reduces the transonic wave drag and allows the wing sweep to be reduced. Thereduced wing sweep and the smaller chord Reynolds numbers encourage laminar flow,which reduces the parasite drag. Obtaining the most desirable trade-off between theseeffects requires the use of MDO.
The design also uses tip-mounted engines to obtain a reduction in induced drag, assome studies have suggested [6] and [7]. The tip-mounted engines also provide addedinertia relief for the wing structure. Since the engines are located at the wingtips, anengine failure would create a very large yawing moment. To maintain equilibrium flightat the engine-out flight condition, circulation control is used on the vertical tail toincrease its effectiveness. The circulation of the vertical tail airfoil can be controlled byblowing air through slots at the rear of an elliptical section, or by combining the slotswith a deflecting flap for some redundancy. The air for blowing can be provided by theAuxiliary Power Unit (APU), which is already located in the tailcone. In a study of a
4
circulation control stern plane for submarine applications, Englar and Williams [8] haveshown that section lift coefficients of 2.8 are possible with a 20% ellipse. In normalflight, a small amount of blowing could also be used to create zero drag, or even somethrust. The circulation control concept, together with a stability and control analysis isused to incorporate the engine-out condition explicitly as a constraint. The increment inthe vertical tail lift curve is currently used as a design variable with an upper bound of1.0. The present model does not impose a weight penalty for the circulation controlmechanism. Future research will evaluate the weight penalty and power requirements forthe required amount of circulation control.
Thrust vectoring with a third engine mounted at the base of the vertical tail was alsoinvestigated as a means to handle the engine-out condition. We found that the relativelysmall deflection angles allowed by thrust vectoring (15˚) were not sufficient to generate alarge enough yawing moment. The extra weight, maintenance, cost, and complexity ofthe third engine also discouraged the use of thrust vectoring.
The buckling of the strut under the -1g load condition proved to be the criticalstructural challenge in the single-strut configuration. To address this issue we allow thestrut to be inactive in compression, and we optimize the strut force at the criticalmaneuver load condition (see Section 4.2.2 for details). In the Phase II research, we willinvestigate multi-element truss configurations and arch-strut configurations to address thebuckling problem. Load alleviation and the use of composite structures will also beevaluated.
The investigation of the wing-strut interference drag has been started in Phase I with acomputational fluid dynamics (CFD) analysis of a Douglas wing-pylon-storeconfiguration using a structured grid. In Phase II, an unstructured grid methodology isbeing used to evaluate the wing-pylon-store configuration and some representative strut-wing configurations. Results from the unstructured grid analysis will become available inPhase II.
The Phase I research did not impose aeroelastic constraints on the design. In Phase II,an aeroelastic analysis will be performed with NASTRAN, and aeroelastic constraintswill eventually be added to the MDO code.
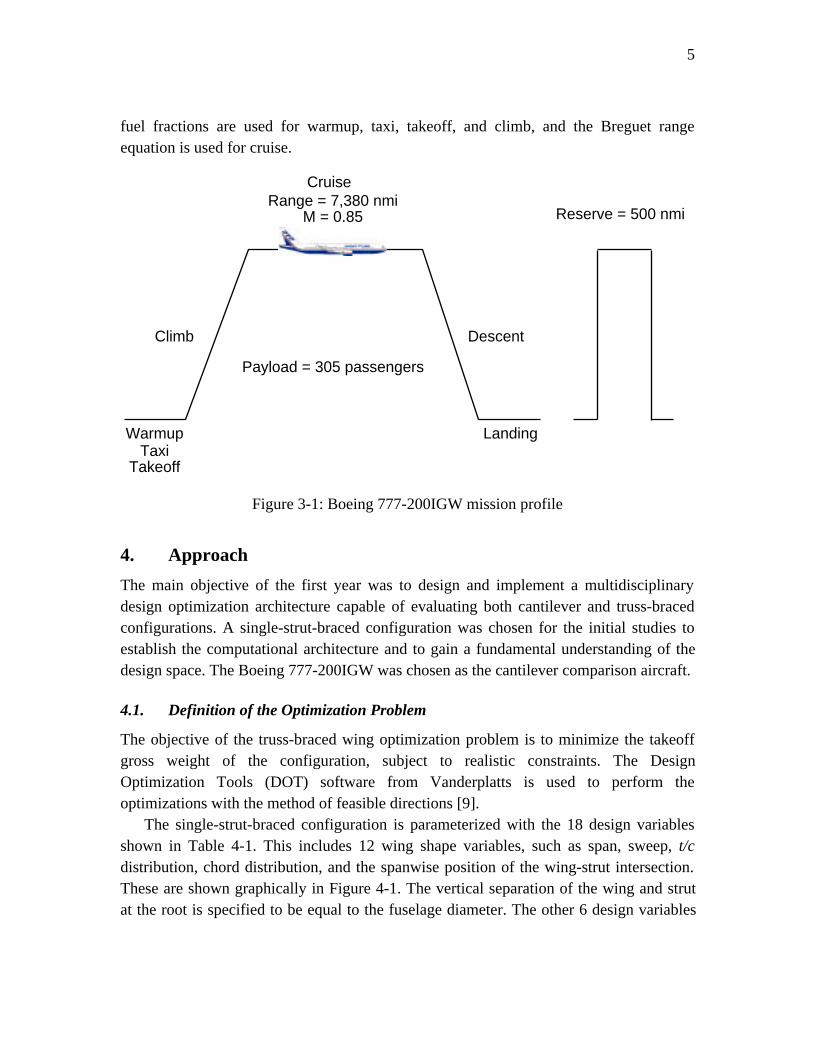
3.1. Mission Profile
The truss-braced wing concept is best suited to a long-range mission, where the increasein efficiency can be fully utilized. A typical mission profile of the Boeing 777-200IGWwas selected as the design mission profile for this study. As shown in Figure 3-1, it has arange of 7,380 nmi at Mach 0.85 with 305 passengers in a three-class configuration. Anadditional 500 nmi of cruise was added to satisfy the reserve fuel requirements. Fixed
5
fuel fractions are used for warmup, taxi, takeoff, and climb, and the Breguet rangeequation is used for cruise.
Cruise
Climb
WarmupTaxi
Takeoff
Descent
Landing
Range = 7,380 nmiM = 0.85
Payload = 305 passengers
Reserve = 500 nmi
Figure 3-1: Boeing 777-200IGW mission profile
4. Approach
The main objective of the first year was to design and implement a multidisciplinarydesign optimization architecture capable of evaluating both cantilever and truss-bracedconfigurations. A single-strut-braced configuration was chosen for the initial studies toestablish the computational architecture and to gain a fundamental understanding of thedesign space. The Boeing 777-200IGW was chosen as the cantilever comparison aircraft.
4.1. Definition of the Optimization Problem
The objective of the truss-braced wing optimization problem is to minimize the takeoffgross weight of the configuration, subject to realistic constraints. The DesignOptimization Tools (DOT) software from Vanderplatts is used to perform theoptimizations with the method of feasible directions [9].
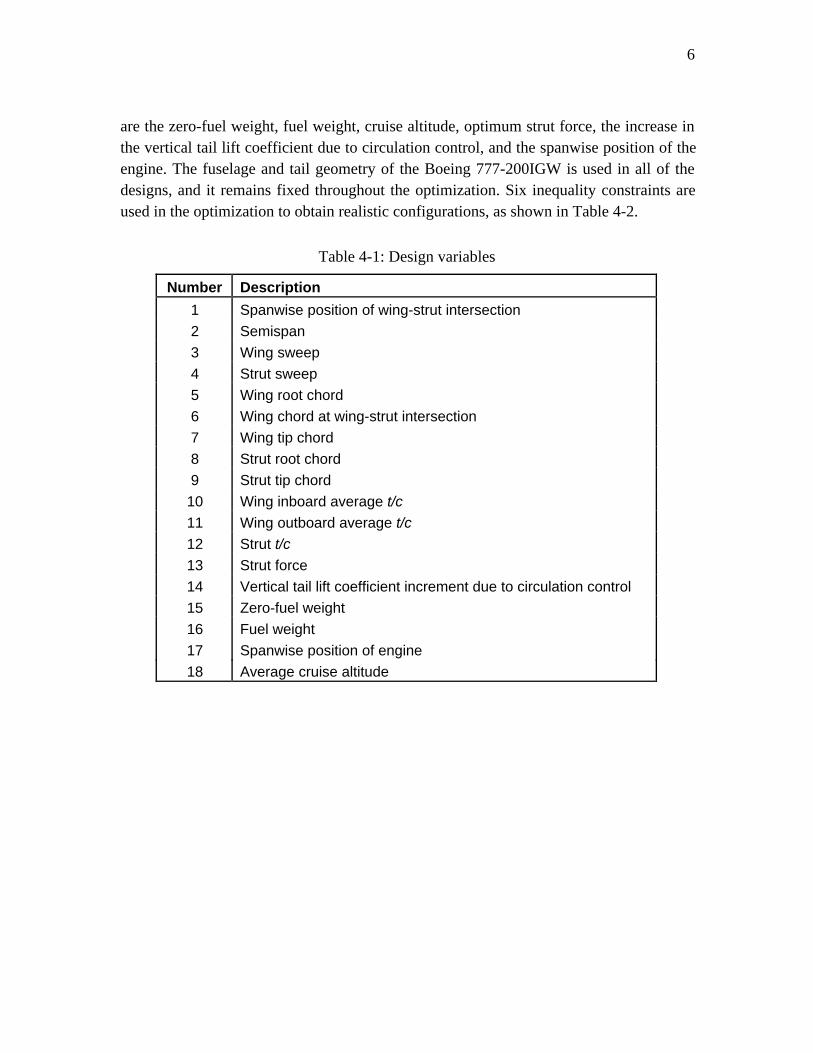
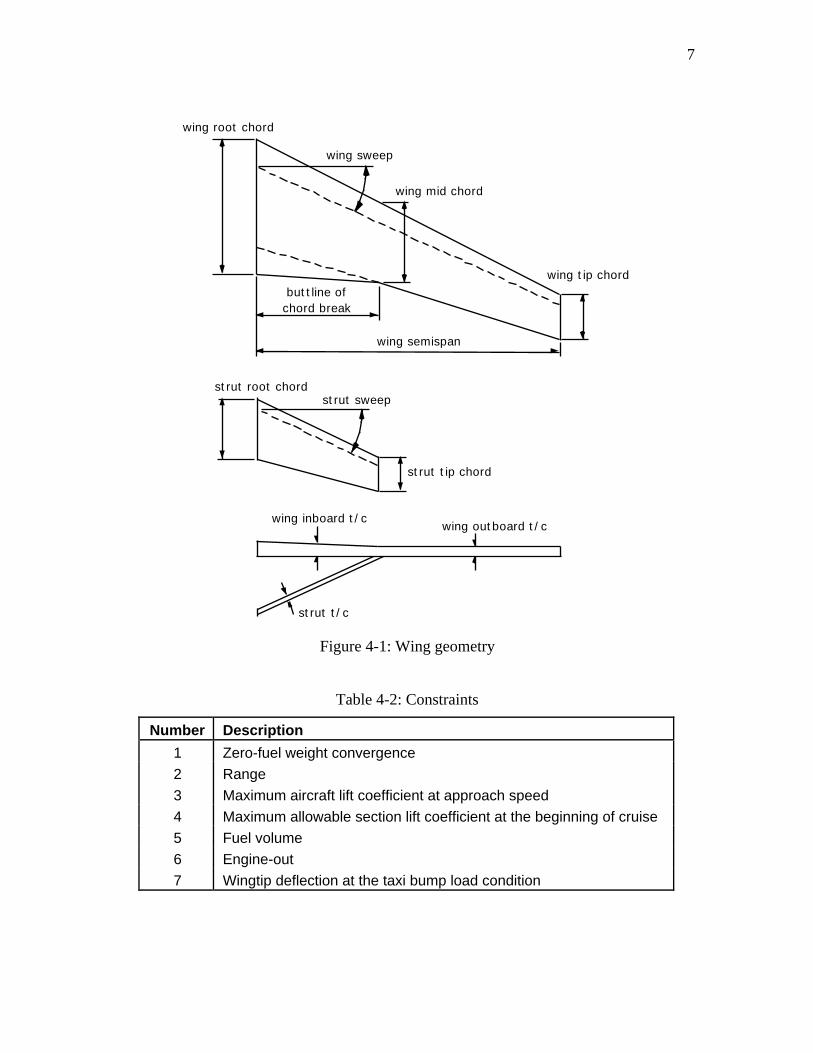
The single-strut-braced configuration is parameterized with the 18 design variablesshown in Table 4-1. This includes 12 wing shape variables, such as span, sweep, t/cdistribution, chord distribution, and the spanwise position of the wing-strut intersection.These are shown graphically in Figure 4-1. The vertical separation of the wing and strutat the root is specified to be equal to the fuselage diameter. The other 6 design variables
6
are the zero-fuel weight, fuel weight, cruise altitude, optimum strut force, the increase inthe vertical tail lift coefficient due to circulation control, and the spanwise position of theengine. The fuselage and tail geometry of the Boeing 777-200IGW is used in all of thedesigns, and it remains fixed throughout the optimization. Six inequality constraints areused in the optimization to obtain realistic configurations, as shown in Table 4-2.
Table 4-1: Design variables
Number Description
1 Spanwise position of wing-strut intersection
2 Semispan
3 Wing sweep
4 Strut sweep
5 Wing root chord
6 Wing chord at wing-strut intersection
7 Wing tip chord
8 Strut root chord
9 Strut tip chord
10 Wing inboard average t/c
11 Wing outboard average t/c
12 Strut t/c
13 Strut force
14 Vertical tail lift coefficient increment due to circulation control
15 Zero-fuel weight
16 Fuel weight
17 Spanwise position of engine
18 Average cruise altitude
7
wing root chord
wing sweep
wing tip chord
wing semispan
wing mid chord
buttline ofchord break
wing outboard t/cwing inboard t/c
strut t/c
strut root chordstrut sweep
strut tip chord
Figure 4-1: Wing geometry
Table 4-2: Constraints
Number Description
1 Zero-fuel weight convergence
2 Range
3 Maximum aircraft lift coefficient at approach speed
4 Maximum allowable section lift coefficient at the beginning of cruise
5 Fuel volume
6 Engine-out
7 Wingtip deflection at the taxi bump load condition
8
The weight equations from NASA Langley’s Flight Optimization System (FLOPS)are used to calculate most of the structural weight and all of the non-structural weight ofthe aircraft [10]. When using empirical weight equations, many of the aircraft structuralcomponents are sized based on an assumed takeoff gross weight. Therefore the calculatedzero-fuel weight is a function of the initially assumed zero-fuel weight plus the fuelweight. In a traditional aircraft design methodology, an internal iteration loop is used toguarantee that the calculated zero-fuel weight is equal to the assumed zero-fuel weight.However, when an optimizer is already part of the code, it is more efficient to cast thezero-fuel weight and fuel weight as design variables, and use a constraint to enforceconvergence [11].
The second constraint ensures that the aircraft range is greater than the rangerequirement specified in the design mission profile.
The third constraint ensures that the maximum aircraft lift coefficient at the approachspeed is large enough to maintain equilibrium flight. The maximum lift coefficient of theunswept wing is assumed to be 3.3. The maximum lift coefficient of the swept wing isthen calculated assuming a loss proportional to the cosine of the quarter-chord sweepangle.
The fourth constraint limits the maximum section lift coefficient at the initial cruiseflight condition to be less 0.70. This prevents shock stall at high speeds.
The fifth constraint ensures that the fuel tanks have adequate capacity to carry the fuelrequired to fly the mission. The code has the capability to place extra fuel tanks in thefuselage outside of the wing carrythrough structure, but the optimum designs shown inthis report do not require additional fuel capacity since this constraint is not active forthem.
The engine-out constraint guarantees that the control system can achieve a sufficientyawing moment to maintain equilibrium flight after an engine failure at the minimumcontrol speed defined by FAR 25.149.
The wingtip deflection constraint ensures that the wingtip or tip-mounted engine doesnot strike the ground during a taxi bump load. The current maximum allowable deflectionis 25 ft., based on the fuselage height and landing gear length of the Boeing 777.
In addition to the inequality constraints mentioned above, side constraints are used tobound each design variable. The upper side constraint on the semispan design variableguarantees that the wing span is within the FAA 80 meter gate box limit. The lower sideconstraints on the wing and strut t/c design variables limit the minimum allowable wingand strut t/c values to 5%. The minimum t/c constraint has initially been arbitrarilyspecified, but it may be refined in the future when a more detailed systems analysis isperformed.
9
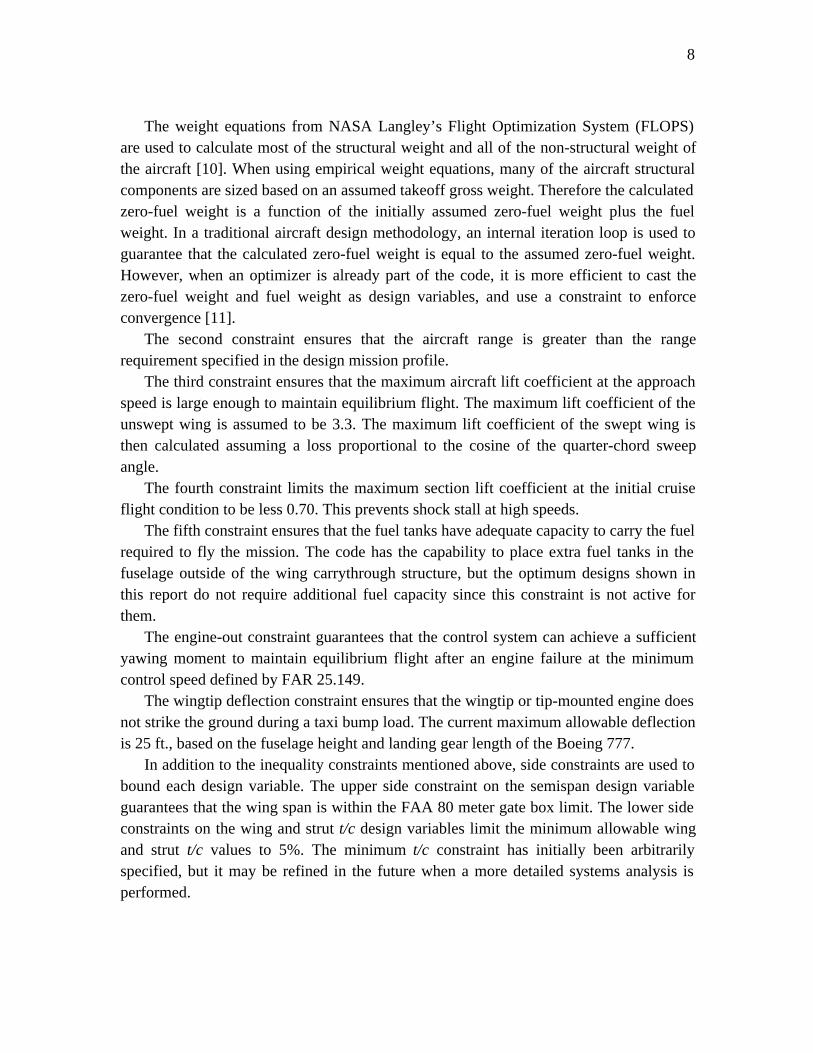
4.2. Multidisciplinary Approach
Since the aerodynamics, structures, propulsion, and controls in the truss-braced wingproblem are highly coupled, it is essential to use a multidisciplinary approach to assessthe true potential of the configuration. Figure 4-2 shows the connectivity for the truss-braced wing design code architecture. This MDO tool integrates several analysis modulesfor aerodynamics, structures, and performance. The modular architecture allows for easyintegration of higher-fidelity analysis modules, and it provides the capability to evaluatemore complex truss topologies in the future.
Baseline Design
Geometry Definition
Structural Optimization
Performance Evaluation
Optimizer
Loads
Objective Function, Constraints
Aerodynamic Analysis
DragWeight
Induced Drag
Friction and Form Drag
Wave Drag
Interference Drag
Updated Design VariablesInitial Design Variables
Offline CFD Interference Drag Analysis
Figure 4-2: MDO code architecture
A brief overview of the aerodynamics, structures, and interference drag modules isgiven below. The complete documentation for the truss-braced wing design code can befound in Reference [12].
4.2.1. Aerodynamics, Stability and Control, and Propulsion
The aerodynamic performance is evaluated by modules for the induced drag, parasitedrag, transonic wave drag, and interference drag. The stability and control derivatives arealso estimated using a DATCOM-based method [13].
The induced drag module uses a discrete vortex method to calculate the induced dragin the Trefftz plane [14]. Given an arbitrary, noncoplanar wing/truss configuration, itprovides the optimum load distribution corresponding to the minimum induced drag.*
* For our near-planar designs almost all of the load is carried by the wing.
10
Although the pitching moment about a specified center of gravity location can bespecified, we did not impose a limitation on stability in this work.
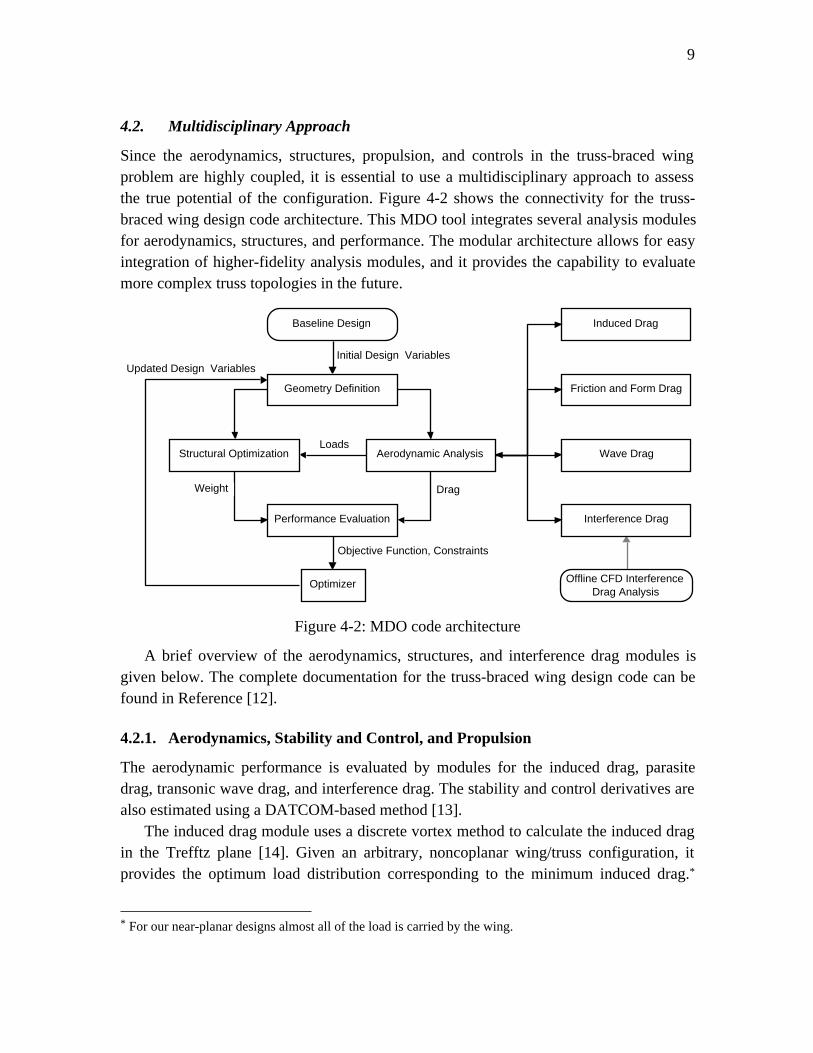
Several studies have shown that the induced drag can be reduced by using tip-mounted engines [6] and [7]. Figure 4-3 shows the drag reduction as a function of the liftcoefficient and aspect ratio, as given by Miranda and Brennan [7]. The MDO code uses asimple model based on this plot to approximate the induced drag reduction due to tip-mounted engines. Although the plot shows the total percent drag reduction, the percentreduction of the induced drag was determined and used in the MDO code. Notice that theaerodynamic advantage of tip-mounted engines gets smaller with increasing aspect ratio.
0%
5%
10%
15%
20%
25%
30%
0 0.2 0.4 0.6 0.8 1
Lift Coefficient
Perc
ent
Tota
l D
rag R
educt
ion
AR = 6
AR = 12
Figure 4-3: Drag reduction due to tip-mounted engines
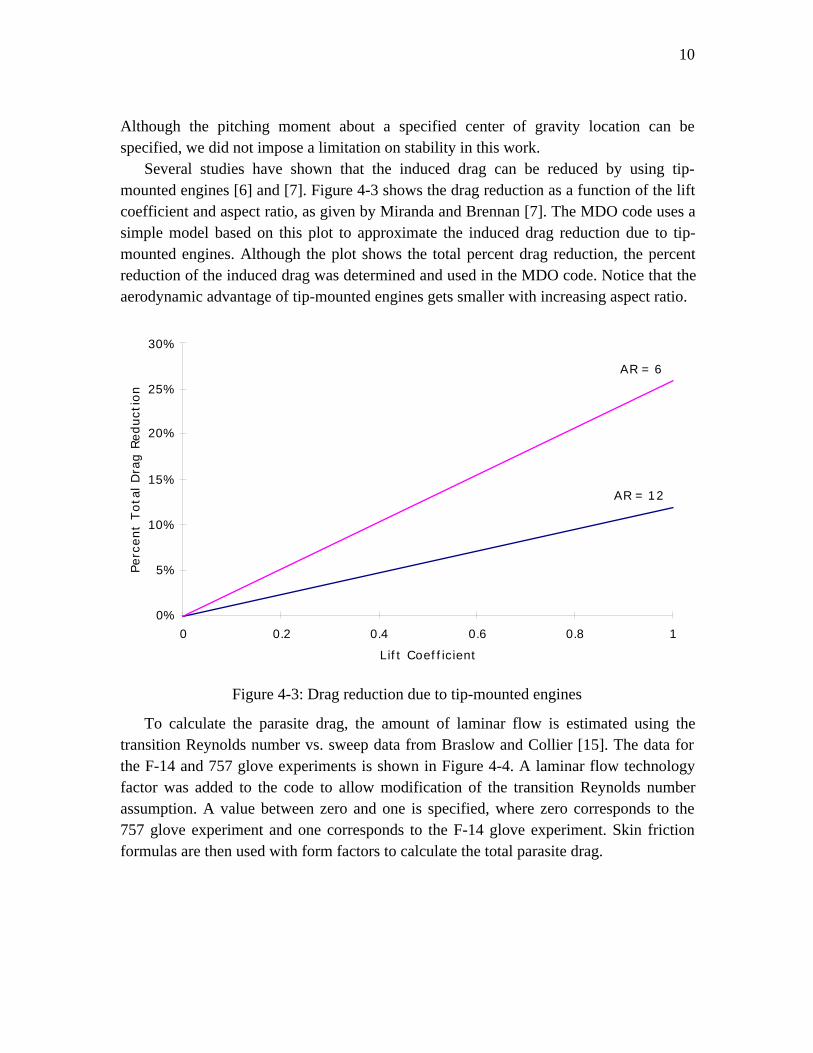
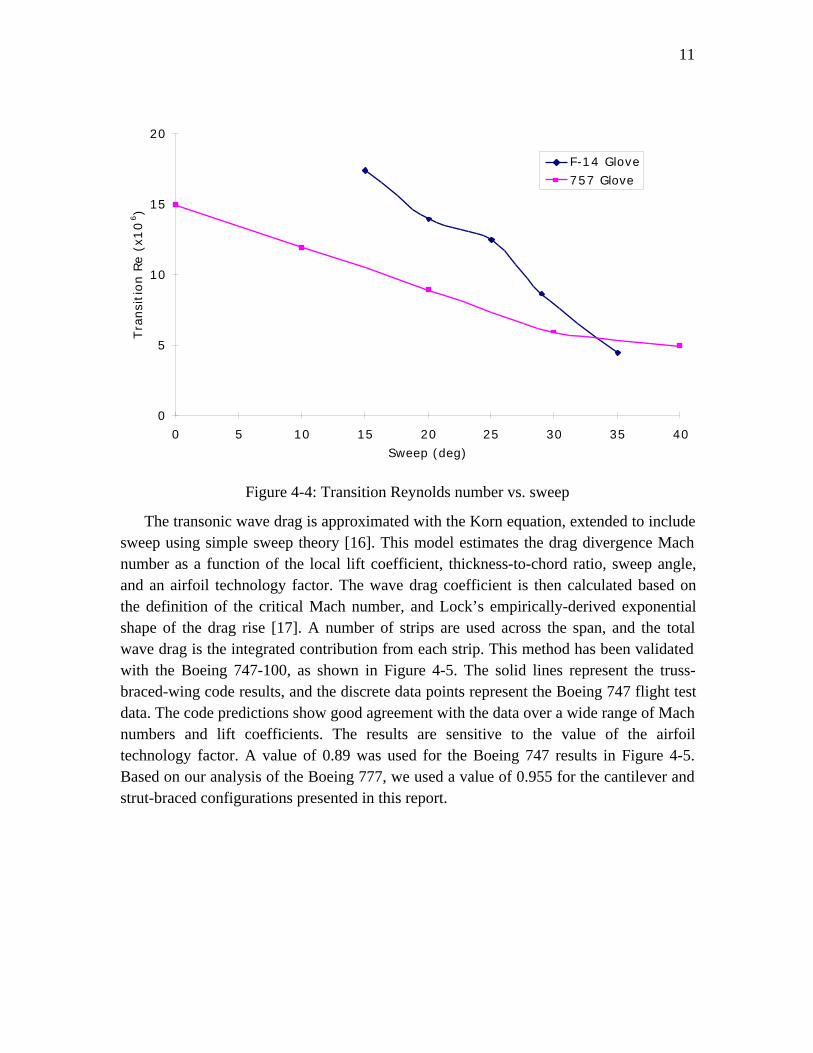
To calculate the parasite drag, the amount of laminar flow is estimated using thetransition Reynolds number vs. sweep data from Braslow and Collier [15]. The data forthe F-14 and 757 glove experiments is shown in Figure 4-4. A laminar flow technologyfactor was added to the code to allow modification of the transition Reynolds numberassumption. A value between zero and one is specified, where zero corresponds to the757 glove experiment and one corresponds to the F-14 glove experiment. Skin frictionformulas are then used with form factors to calculate the total parasite drag.
11
0
5
10
15
20
0 5 10 15 20 25 30 35 40
Sweep (deg)
Tra
nsi
tion R
e (
x10
6)
F-14 Glove
757 Glove
Figure 4-4: Transition Reynolds number vs. sweep
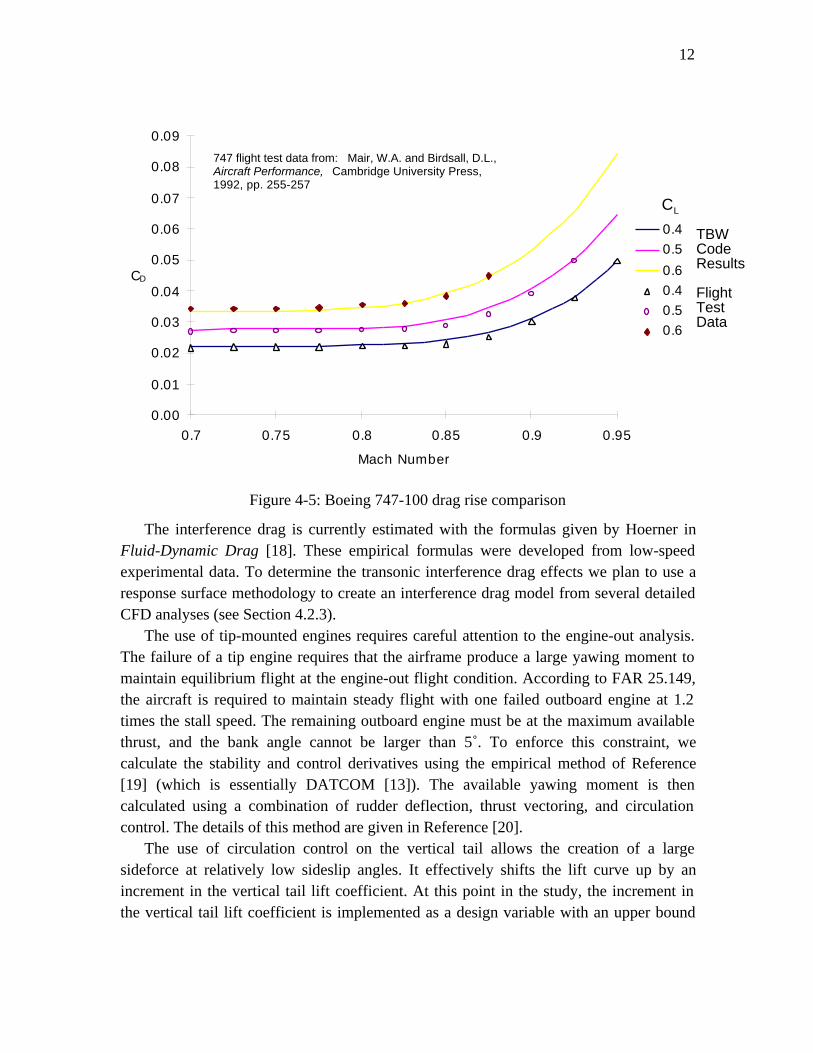
The transonic wave drag is approximated with the Korn equation, extended to includesweep using simple sweep theory [16]. This model estimates the drag divergence Machnumber as a function of the local lift coefficient, thickness-to-chord ratio, sweep angle,and an airfoil technology factor. The wave drag coefficient is then calculated based onthe definition of the critical Mach number, and Lock’s empirically-derived exponentialshape of the drag rise [17]. A number of strips are used across the span, and the totalwave drag is the integrated contribution from each strip. This method has been validatedwith the Boeing 747-100, as shown in Figure 4-5. The solid lines represent the truss-braced-wing code results, and the discrete data points represent the Boeing 747 flight testdata. The code predictions show good agreement with the data over a wide range of Machnumbers and lift coefficients. The results are sensitive to the value of the airfoiltechnology factor. A value of 0.89 was used for the Boeing 747 results in Figure 4-5.Based on our analysis of the Boeing 777, we used a value of 0.955 for the cantilever andstrut-braced configurations presented in this report.
12
0.00
0.01
0.02
0.03
0.04
0.05
0.06
0.07
0.08
0.09
0.7 0.75 0.8 0.85 0.9 0.95
Mach Number
CD
0.40.5
0.60.40.50.6
747 flight test data from: Mair, W.A. and Birdsall, D.L., Aircraft Performance, Cambridge University Press, 1992, pp. 255-257
Figure 4-5: Boeing 747-100 drag rise comparison
The interference drag is currently estimated with the formulas given by Hoerner inFluid-Dynamic Drag [18]. These empirical formulas were developed from low-speedexperimental data. To determine the transonic interference drag effects we plan to use aresponse surface methodology to create an interference drag model from several detailedCFD analyses (see Section 4.2.3).
The use of tip-mounted engines requires careful attention to the engine-out analysis.The failure of a tip engine requires that the airframe produce a large yawing moment tomaintain equilibrium flight at the engine-out flight condition. According to FAR 25.149,the aircraft is required to maintain steady flight with one failed outboard engine at 1.2times the stall speed. The remaining outboard engine must be at the maximum availablethrust, and the bank angle cannot be larger than 5˚. To enforce this constraint, wecalculate the stability and control derivatives using the empirical method of Reference[19] (which is essentially DATCOM [13]). The available yawing moment is thencalculated using a combination of rudder deflection, thrust vectoring, and circulationcontrol. The details of this method are given in Reference [20].
The use of circulation control on the vertical tail allows the creation of a largesideforce at relatively low sideslip angles. It effectively shifts the lift curve up by anincrement in the vertical tail lift coefficient. At this point in the study, the increment inthe vertical tail lift coefficient is implemented as a design variable with an upper bound
CL
TBWCodeResults
FlightTestData
13
of 1.0. Most tip-mounted engine configurations to date have required a change in thevertical tail lift coefficient of about 0.9. According to the data given by Englar andWilliams [8], this appears to be feasible. Future research will identify the weight andpower impacts of using circulation control. The current model assumes no weight penaltyfor the circulation control mechanism.
A simple rubber engine sizing methodology is used to scale the baseline engines tothe required thrust. The rubber engine weight and nacelle drag are assumed to be linearlyproportional to the thrust required at the initial cruise condition. The functional form ofthe thrust lapse as a function of Mach number and altitude is taken from equation 2.42 onp. 36 of Mattingly’s Aircraft Engine Design [21]. The coefficients in the equation wereadjusted using a nonlinear regression analysis with a GE-90-like engine deck provided byNASA Langley.
When this rubber engine sizing methodology is applied to the current technologybaseline cantilever configuration, the required sea-level static thrust is 92,577 lb. This isslightly conservative, compared to the actual sea-level static thrust of 90,764 lb. (from theNASA engine deck).
4.2.2. Structures
The weight equations from NASA Langley’s Flight Optimization System (FLOPS) areused to estimate most of the structural weight, and all of the non-structural weight [10].Since FLOPS only uses an empirical correction factor to estimate the bending materialweight of a strut-braced wing, a more detailed analysis method has been developed. Thewing bending material weight is estimated with a piecewise linear beam model andsubstituted for the value in FLOPS [22]. Replacing the bending material weight fromFLOPS with other estimates has been done in High Speed Civil Transport research atVirginia Tech for several years [11].
The bending material weight model idealizes the wing as a beam with propertiesvarying along the span. Because the strut force and strut position are design variables, thebeam can be treated as a statically determinate structure (even though it is not). Thismeans that we can calculate the bending moment distribution by simple quadrature andcalculate the required panel thickness directly, so that the structural optimization is veryeasy. This also will also allow us to calculate the optimum material distribution needed tomeet the wingtip displacement constraint from a simple formula. This final step will bedone in the remaining Phase II research.
Two maneuver load conditions (2.5 g and -1.0 g), and a 1.67 g taxi bump loadcondition are used to determine the wing bending material weight. Coster and Haftka [23]showed that for a truss-braced wing subjected to negative maneuvers a significant weightpenalty is required to prevent the strut from buckling in the -1.0 g load case. They
14
compared the buckling weights of strut-braced wing configurations with those of truss-braced wing configurations to explore the effects of buckling on different configurations.The results revealed that using a truss would reduce the weight penalty by approximately50%, which is still significant. Hence, to eliminate the weight penalty due to strutbuckling a different design philosophy was adopted.
The strut is assumed to be inactive in compression during the -1.0 g maneuver loadcase and the 1.67 g taxi bump case. This could be done with a telescoping sleevemechanism or a hinge arrangement. During positive g maneuvers, the strut is in tension.Since the wing is clamped to the fuselage, it acts as a cantilever beam in the negative loadcases and as a strut-braced beam in the positive load cases. Moreover, the strut force atthe 2.5 g load case is optimized to provide the minimum total wing bending materialweight. On a typical optimum single-strut design, this means that the strut would firstengage in tension at around 0.75 g. The optimum strut force at 2.5 g is less than the strutforce that would be obtained at 2.5 g if the strut engaged immediately at 0 g (this couldbe thought of as the pre-force or jig-shape force). This design approach results in asignificant reduction in the bending material weight compared to a wing in which acompletely rigid strut is designed to withstand the buckling loads.
To reduce the axial forces on the strut a high-wing configuration is employed. Thehigh wing puts the strut in tension for the 2.5 g load condition, making it much easier tocope with the buckling when it is limited to -1.0 g. Moreover, a high wing will avoidadverse transonic flow interference on the upper surface with a truss placed in thesupersonic flow region.
In the preliminary studies of a truss-braced wing we direct our attention to onlysingle-strut-braced wing configurations which are a special case within the general classof truss-braced wing configurations. We intend to evaluate more complicated truss-braced wing configurations in the future with more advanced modeling techniques suchas the finite element method.
The parameterization scheme used for the current strut-braced wing studies is shownin Figure 4-1. The wing is assumed to be made of a high strength aluminum alloy. Thewing box consists of upper and lower wing skins. The wing is subjected to liftdistribution loads obtained from the aerodynamic analysis.
The structural analysis code has been validated to ensure the integrity of the results.The bending material weight computed from the piecewise linear beam model iscompared with the bending weights given by Torenbeek [24] and FLOPS [10] for theBoeing 747-100. Figure 4-6 presents the comparison. It shows good agreement.
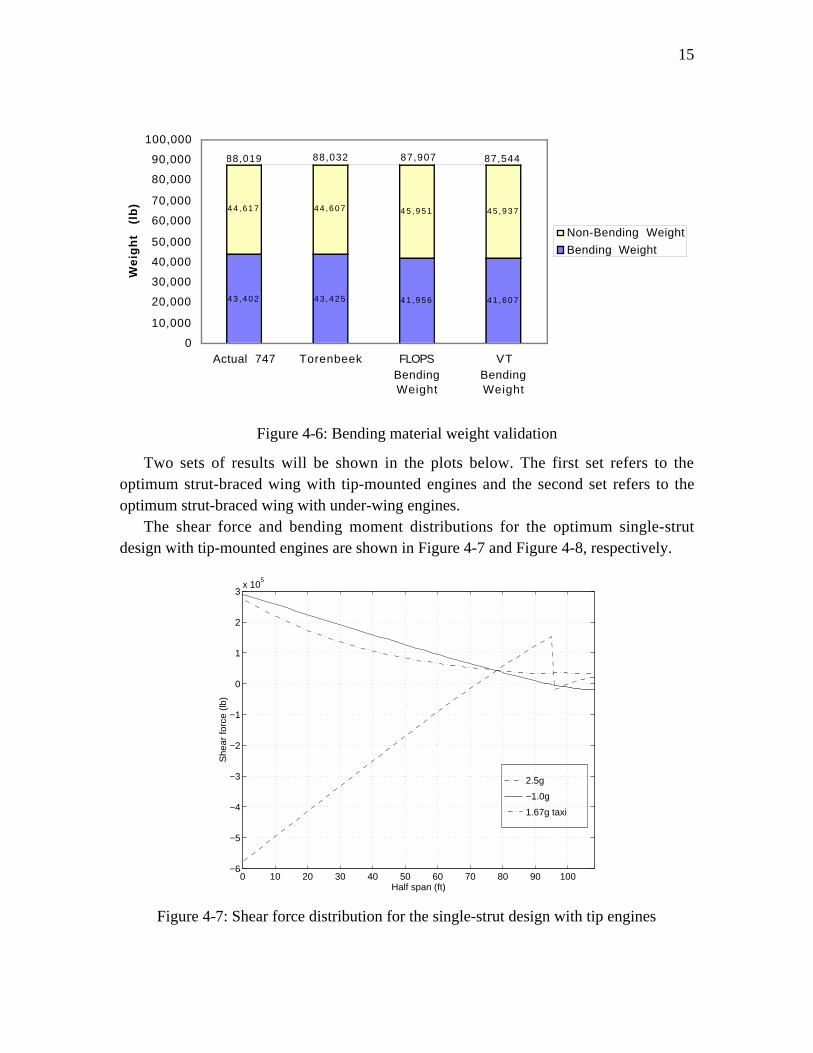
15
43 ,402 43 ,425 4 1 ,9 5 6 4 1 ,6 0 7
44 ,617 44 ,60 7 4 5 ,9 5 1 4 5 ,9 3 7
0
10,000
20,000
30,000
40,000
50,000
60,000
70,000
80,000
90,000
100,000
Actual 747 Torenbeek FLOPSBendingWeight
VTBendingWeight
We
igh
t (l
b)
Non-Bending Weight
Bending Weight
88,019 88,032 87,907 87,544
Figure 4-6: Bending material weight validation
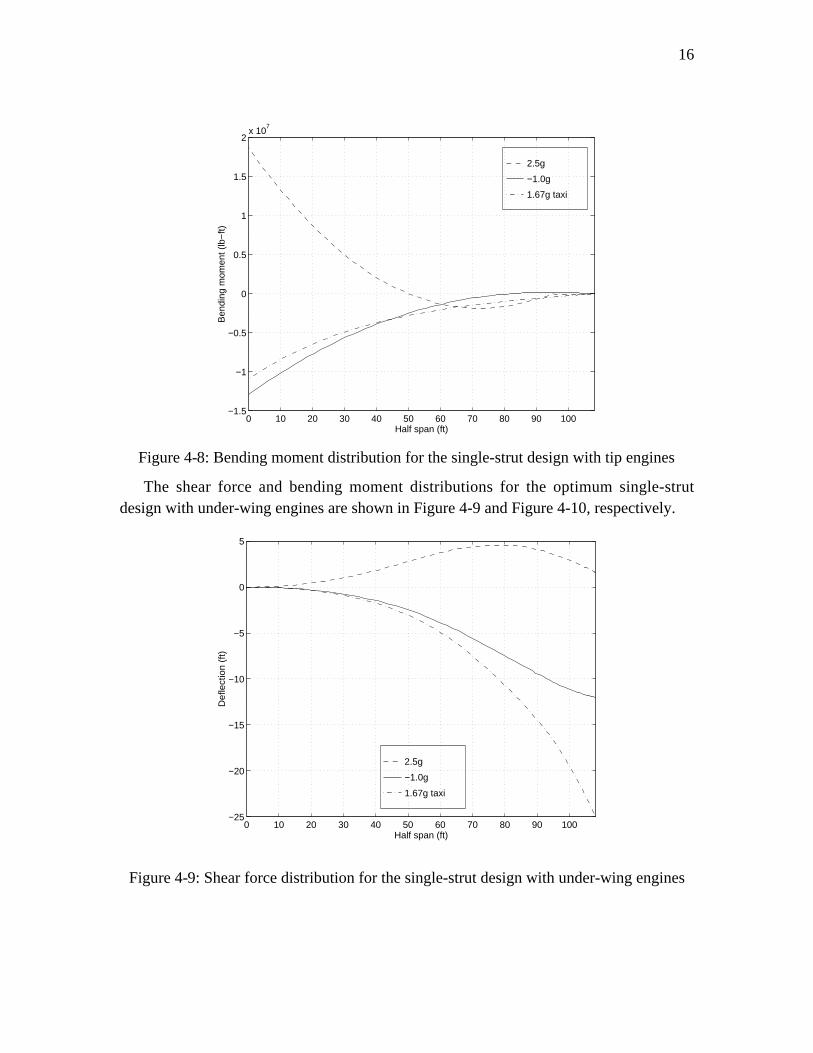
Two sets of results will be shown in the plots below. The first set refers to theoptimum strut-braced wing with tip-mounted engines and the second set refers to theoptimum strut-braced wing with under-wing engines.
The shear force and bending moment distributions for the optimum single-strutdesign with tip-mounted engines are shown in Figure 4-7 and Figure 4-8, respectively.
2.5g
−1.0g
1.67g taxi
0 10 20 30 40 50 60 70 80 90 100−6
−5
−4
−3
−2
−1
0
1
2
3x 10
5
Half span (ft)
She
ar fo
rce
(lb)
Figure 4-7: Shear force distribution for the single-strut design with tip engines
16
2.5g
−1.0g
1.67g taxi
0 10 20 30 40 50 60 70 80 90 100−1.5
−1
−0.5
0
0.5
1
1.5
2x 10
7
Half span (ft)
Ben
ding
mom
ent (
lb−
ft)
Figure 4-8: Bending moment distribution for the single-strut design with tip engines
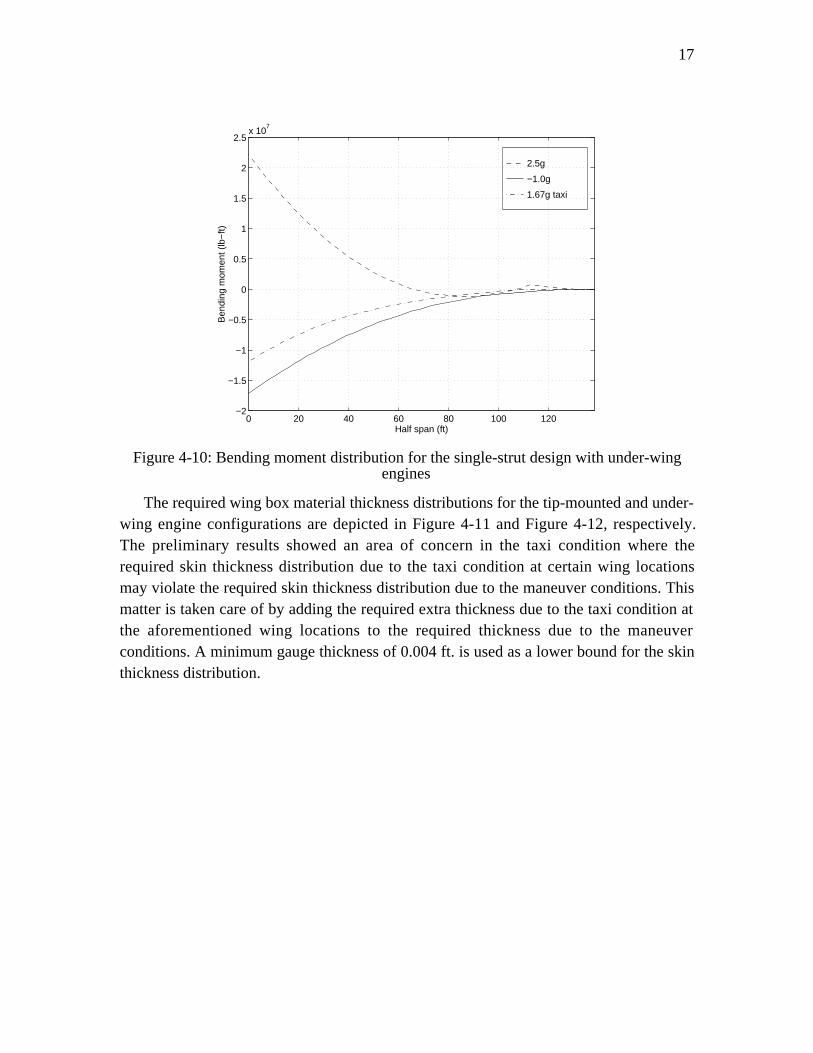
The shear force and bending moment distributions for the optimum single-strutdesign with under-wing engines are shown in Figure 4-9 and Figure 4-10, respectively.
2.5g
−1.0g
1.67g taxi
0 10 20 30 40 50 60 70 80 90 100−25
−20
−15
−10
−5
0
5
Half span (ft)
Def
lect
ion
(ft)
Figure 4-9: Shear force distribution for the single-strut design with under-wing engines
17
2.5g
−1.0g
1.67g taxi
0 20 40 60 80 100 120−2
−1.5
−1
−0.5
0
0.5
1
1.5
2
2.5x 10
7
Half span (ft)
Ben
ding
mom
ent (
lb−
ft)
Figure 4-10: Bending moment distribution for the single-strut design with under-wingengines
The required wing box material thickness distributions for the tip-mounted and under-wing engine configurations are depicted in Figure 4-11 and Figure 4-12, respectively.The preliminary results showed an area of concern in the taxi condition where therequired skin thickness distribution due to the taxi condition at certain wing locationsmay violate the required skin thickness distribution due to the maneuver conditions. Thismatter is taken care of by adding the required extra thickness due to the taxi condition atthe aforementioned wing locations to the required thickness due to the maneuverconditions. A minimum gauge thickness of 0.004 ft. is used as a lower bound for the skinthickness distribution.
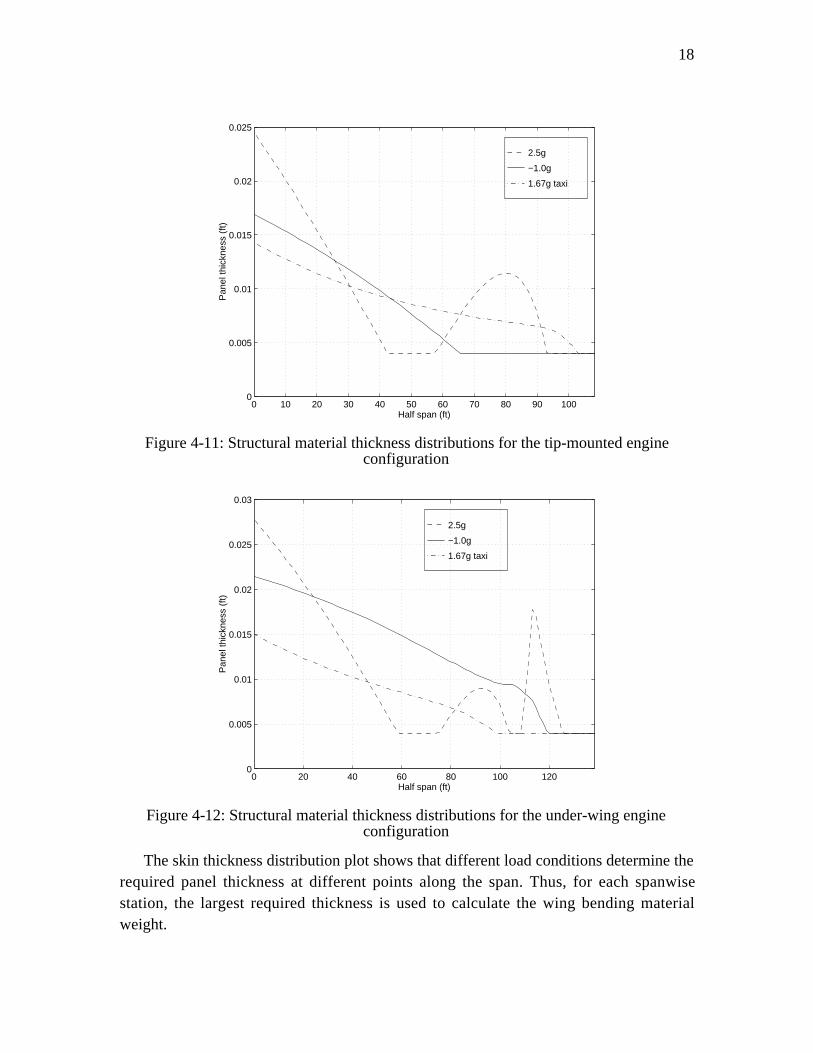
18
2.5g
−1.0g
1.67g taxi
0 10 20 30 40 50 60 70 80 90 1000
0.005
0.01
0.015
0.02
0.025
Half span (ft)
Pan
el th
ickn
ess
(ft)
Figure 4-11: Structural material thickness distributions for the tip-mounted engineconfiguration
2.5g
−1.0g
1.67g taxi
0 20 40 60 80 100 1200
0.005
0.01
0.015
0.02
0.025
0.03
Half span (ft)
Pan
el th
ickn
ess
(ft)
Figure 4-12: Structural material thickness distributions for the under-wing engineconfiguration
The skin thickness distribution plot shows that different load conditions determine therequired panel thickness at different points along the span. Thus, for each spanwisestation, the largest required thickness is used to calculate the wing bending materialweight.
19
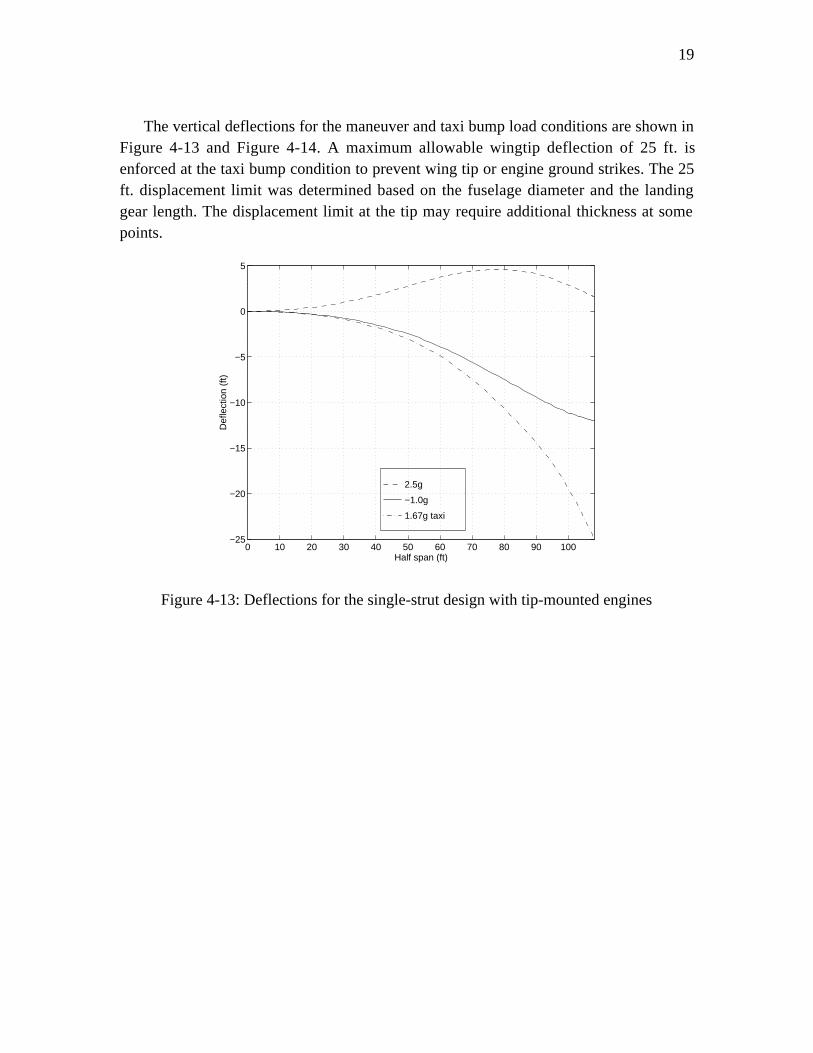
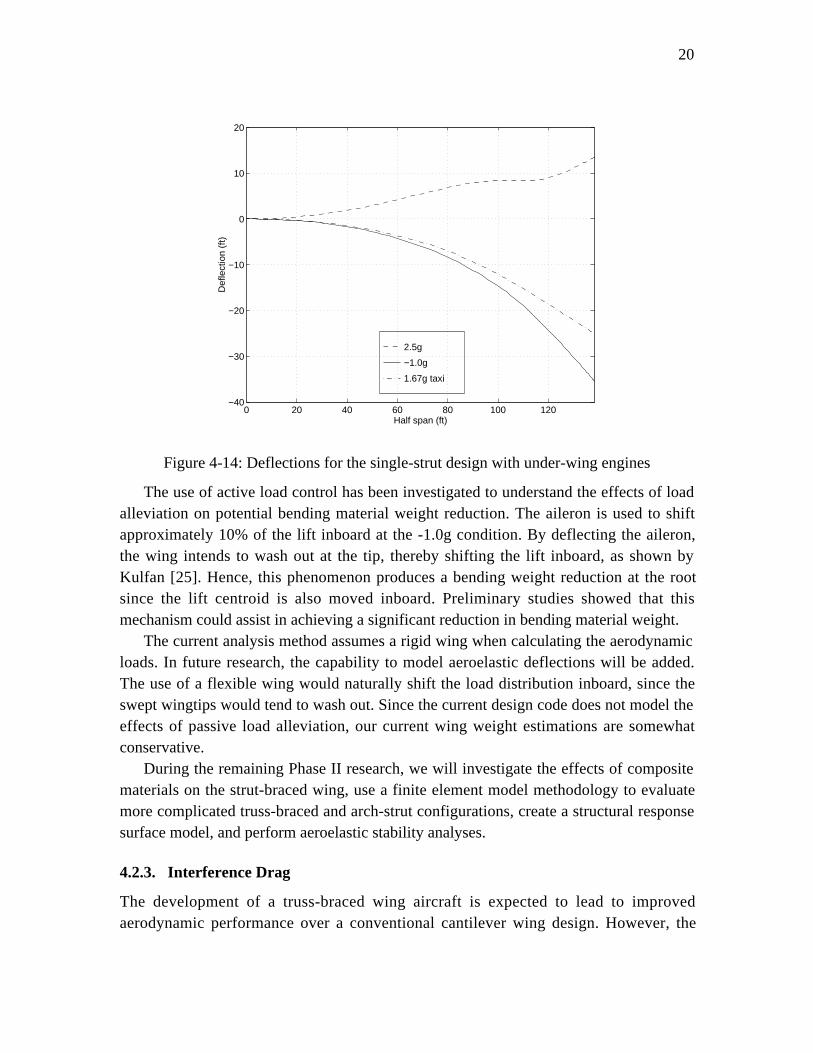
The vertical deflections for the maneuver and taxi bump load conditions are shown inFigure 4-13 and Figure 4-14. A maximum allowable wingtip deflection of 25 ft. isenforced at the taxi bump condition to prevent wing tip or engine ground strikes. The 25ft. displacement limit was determined based on the fuselage diameter and the landinggear length. The displacement limit at the tip may require additional thickness at somepoints.
2.5g
−1.0g
1.67g taxi
0 10 20 30 40 50 60 70 80 90 100−25
−20
−15
−10
−5
0
5
Half span (ft)
Def
lect
ion
(ft)
Figure 4-13: Deflections for the single-strut design with tip-mounted engines
20
2.5g
−1.0g
1.67g taxi
0 20 40 60 80 100 120−40
−30
−20
−10
0
10
20
Half span (ft)
Def
lect
ion
(ft)
Figure 4-14: Deflections for the single-strut design with under-wing engines
The use of active load control has been investigated to understand the effects of loadalleviation on potential bending material weight reduction. The aileron is used to shiftapproximately 10% of the lift inboard at the -1.0g condition. By deflecting the aileron,the wing intends to wash out at the tip, thereby shifting the lift inboard, as shown byKulfan [25]. Hence, this phenomenon produces a bending weight reduction at the rootsince the lift centroid is also moved inboard. Preliminary studies showed that thismechanism could assist in achieving a significant reduction in bending material weight.
The current analysis method assumes a rigid wing when calculating the aerodynamicloads. In future research, the capability to model aeroelastic deflections will be added.The use of a flexible wing would naturally shift the load distribution inboard, since theswept wingtips would tend to wash out. Since the current design code does not model theeffects of passive load alleviation, our current wing weight estimations are somewhatconservative.
During the remaining Phase II research, we will investigate the effects of compositematerials on the strut-braced wing, use a finite element model methodology to evaluatemore complicated truss-braced and arch-strut configurations, create a structural responsesurface model, and perform aeroelastic stability analyses.
4.2.3. Interference Drag
The development of a truss-braced wing aircraft is expected to lead to improvedaerodynamic performance over a conventional cantilever wing design. However, the
21
estimation of the interference drag is a very important consideration in this type ofdesign, especially in the transonic speed range where no detailed analysis has beenperformed in the literature. This drag penalty has to be assessed accurately in terms of thevarious design variables in order to include it in the MDO process.
To determine the effect of the geometry of the strut on the resulting drag coefficient,it was decided to use Computational Fluid Dynamics (CFD) tools. This approach allowsus to analyze a broad range of configurations, from simple geometries such as a singlestrut design to more complex ones, such as an arch-shaped strut or a truss-braced wingaircraft. The effect of other ideas like the compression pylon and fillets can also bedetermined in a reasonable period of time.
As a first step towards that goal, structured grids were generated around a 2-D airfoiland a 3-D wing with GRIDGEN [26]. The CFD code GASP 3.0 [27] was then used tosolve the Euler equations on those grids for M = 0.75 and α = 4˚. For the 3-D wing case,
the results were compared with wind tunnel test data from Douglas and Transonic SmallDisturbance (TSD) calculations from Grumman [28]. Reasonable agreement withexperimental data was obtained.
As the geometries get more complex, it becomes increasingly difficult to obtain agood structured grid. Even with the use of the multi-block capabilities of GRIDGEN, thegrid quality suffers from the presence of stores and oblique struts. Also, a small variationof the design geometry can necessitate a whole new definition of the blocks and gridpoint distribution along each edge. This process can be time-consuming and the CFDresults obtained may not be accurate enough because of this lack of flexibility in the gridgeneration.
The unstructured grid methodology can alleviate most of the problems related tocomplex geometries. Alterations of the original geometry can be incorporated easily andthe grid topology is not tied to the concept of blocks. After the various patches have beendefined over the geometry with GRIDTOOL [29], the unstructured grid generation isperformed with the Advancing Front/Advancing Layers methodology (AFM/ALM) [30,[31, [32] implemented in the software VGRID [29, [33]. Both inviscid and viscous gridscan be developed with this package. The CFD code USM3D [29, [34] is used to solve theEuler equations on the domain.
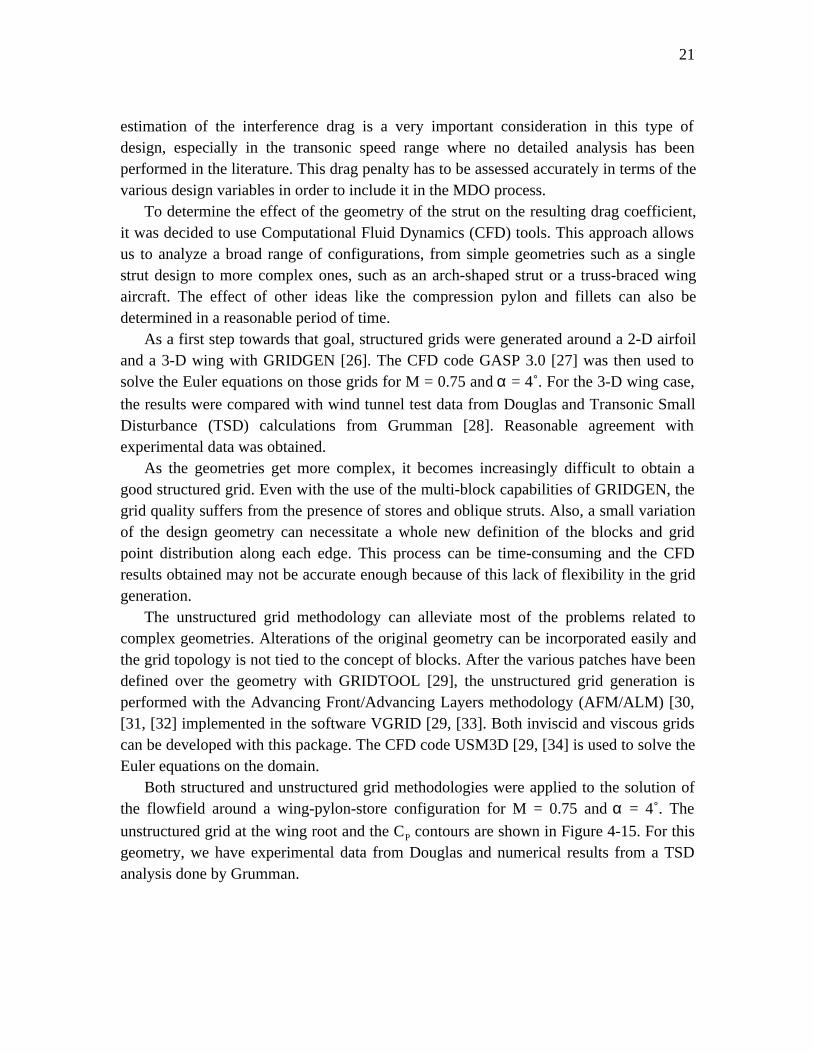
Both structured and unstructured grid methodologies were applied to the solution ofthe flowfield around a wing-pylon-store configuration for M = 0.75 and α = 4˚. The
unstructured grid at the wing root and the CP contours are shown in Figure 4-15. For thisgeometry, we have experimental data from Douglas and numerical results from a TSDanalysis done by Grumman.
22
Figure 4-15: Grid and CP contours for Douglas wing-pylon-store, M = 0.75, α = 4˚
GASP 3.0 was used to solve the Euler equations on a structured grid. The CP
distribution at the pylon station is shown in Figure 4-16. The numerical results on thelower surface of the wing are represented by two curves: one for the inboard surface ofthe pylon and one for the outboard surface. The suction peak at the wing leading edge isoverpredicted by our analysis. The predicted shock at mid-chord is not evident in theexperimental data.
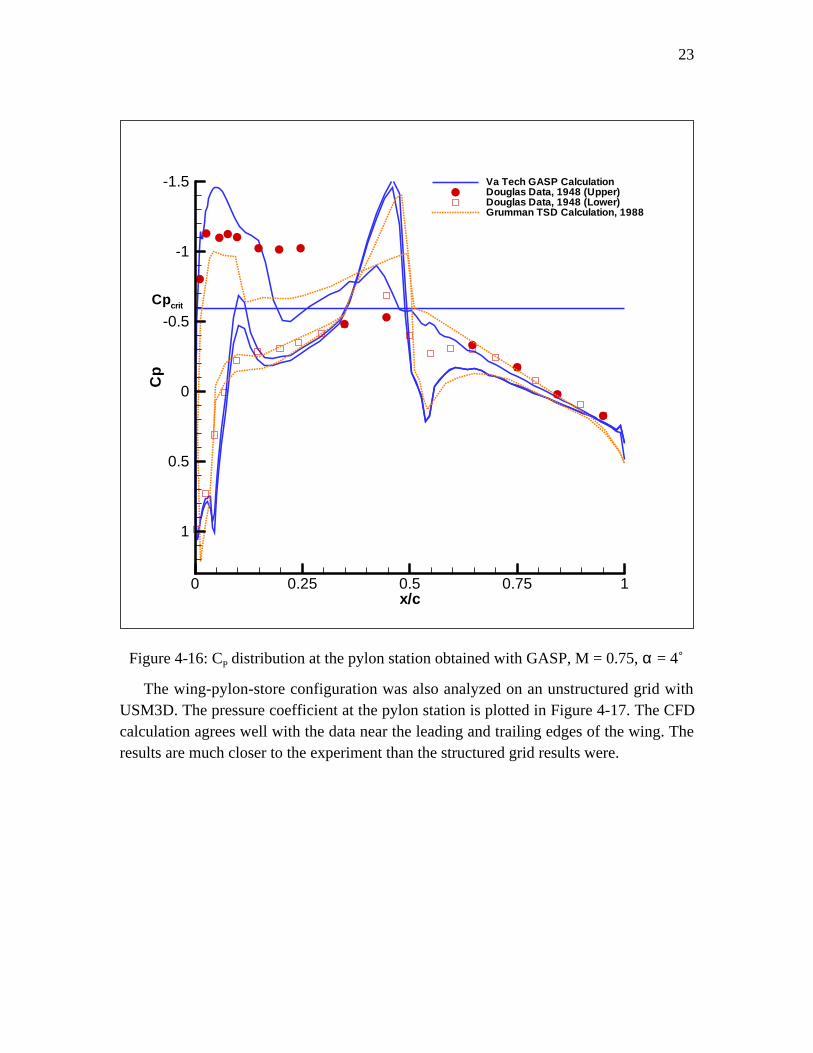
23
0 0.25 0.5 0.75 1x/c
-1.5
-1
-0.5
0
0.5
1
Cp
Va Tech GASP CalculationDouglas Data, 1948 (Upper)Douglas Data, 1948 (Lower)Grumman TSD Calculation, 1988
Cpcrit
Figure 4-16: CP distribution at the pylon station obtained with GASP, M = 0.75, α = 4˚
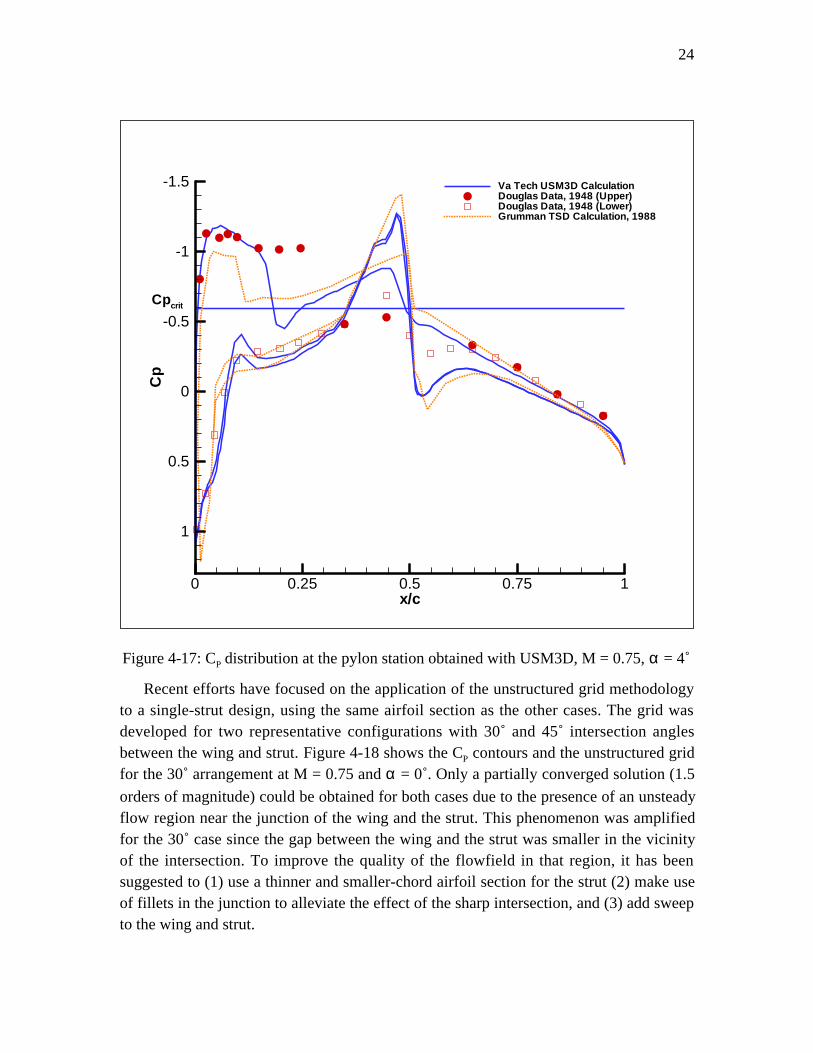
The wing-pylon-store configuration was also analyzed on an unstructured grid withUSM3D. The pressure coefficient at the pylon station is plotted in Figure 4-17. The CFDcalculation agrees well with the data near the leading and trailing edges of the wing. Theresults are much closer to the experiment than the structured grid results were.
24
0 0.25 0.5 0.75 1x/c
-1.5
-1
-0.5
0
0.5
1
Cp
Va Tech USM3D CalculationDouglas Data, 1948 (Upper)Douglas Data, 1948 (Lower)Grumman TSD Calculation, 1988
Cpcrit
Figure 4-17: CP distribution at the pylon station obtained with USM3D, M = 0.75, α = 4˚
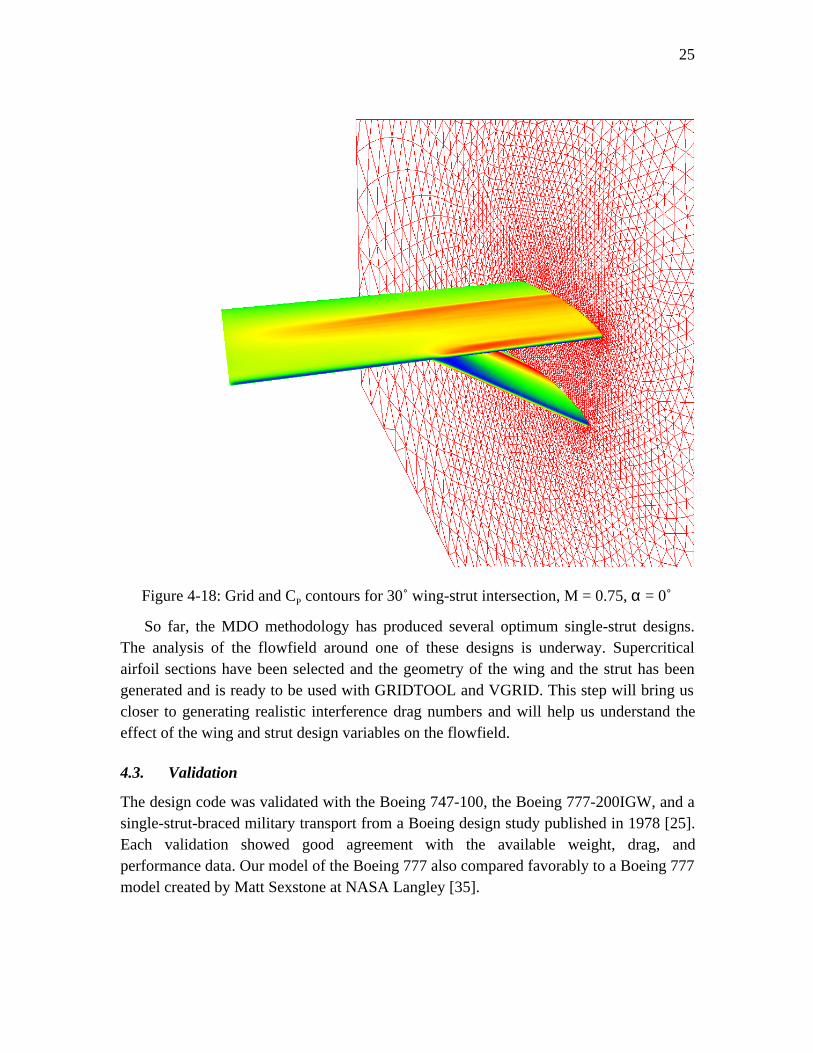
Recent efforts have focused on the application of the unstructured grid methodologyto a single-strut design, using the same airfoil section as the other cases. The grid wasdeveloped for two representative configurations with 30˚ and 45˚ intersection anglesbetween the wing and strut. Figure 4-18 shows the CP contours and the unstructured gridfor the 30˚ arrangement at M = 0.75 and α = 0˚. Only a partially converged solution (1.5
orders of magnitude) could be obtained for both cases due to the presence of an unsteadyflow region near the junction of the wing and the strut. This phenomenon was amplifiedfor the 30˚ case since the gap between the wing and the strut was smaller in the vicinityof the intersection. To improve the quality of the flowfield in that region, it has beensuggested to (1) use a thinner and smaller-chord airfoil section for the strut (2) make useof fillets in the junction to alleviate the effect of the sharp intersection, and (3) add sweepto the wing and strut.
25
Figure 4-18: Grid and CP contours for 30˚ wing-strut intersection, M = 0.75, α = 0˚
So far, the MDO methodology has produced several optimum single-strut designs.The analysis of the flowfield around one of these designs is underway. Supercriticalairfoil sections have been selected and the geometry of the wing and the strut has beengenerated and is ready to be used with GRIDTOOL and VGRID. This step will bring uscloser to generating realistic interference drag numbers and will help us understand theeffect of the wing and strut design variables on the flowfield.
4.3. Validation
The design code was validated with the Boeing 747-100, the Boeing 777-200IGW, and asingle-strut-braced military transport from a Boeing design study published in 1978 [25].Each validation showed good agreement with the available weight, drag, andperformance data. Our model of the Boeing 777 also compared favorably to a Boeing 777model created by Matt Sexstone at NASA Langley [35].
26
5. Results
The goal of this study is to evaluate the feasibility of the truss-braced wing conceptand compare the performance with the cantilever wing configuration, which hasdominated the design of transonic transports since the advent of the Boeing 707. For thispurpose, we have created two cantilever configurations to make such comparisons.
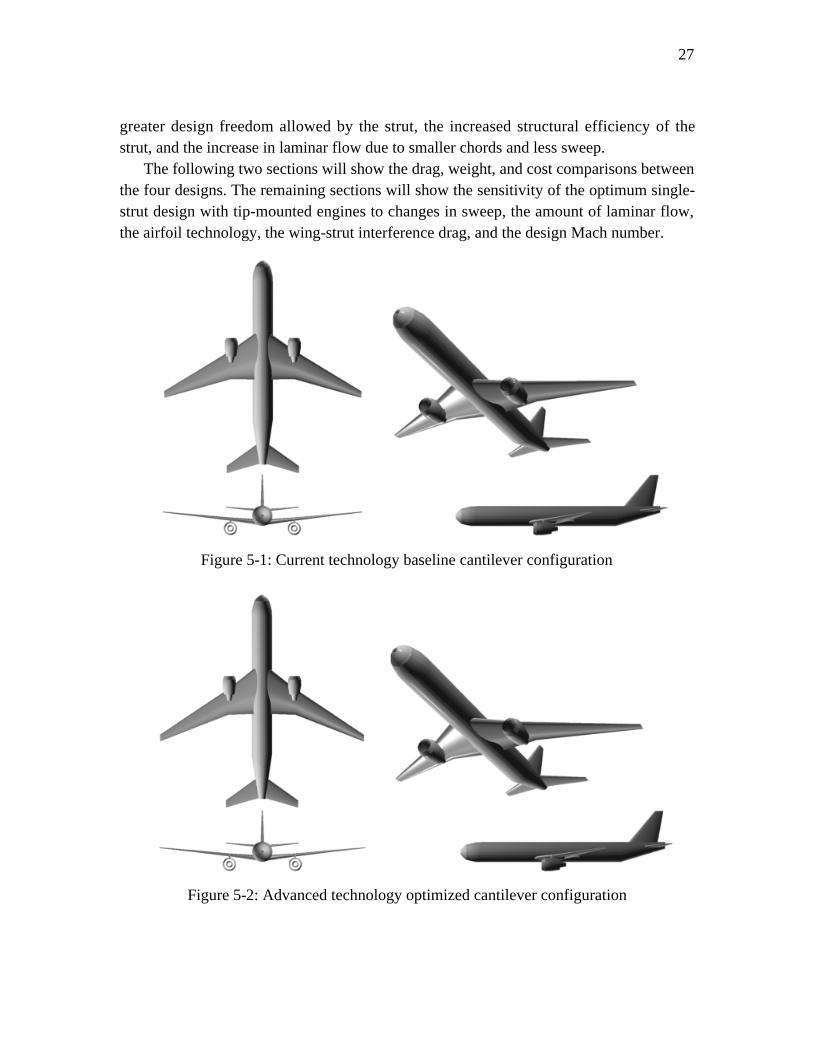
When performing an MDO study using relatively low fidelity analysis codes, it isimportant to validate the codes with a baseline configuration with known performance.For this study, we chose to validate the analysis codes with a representative model of theBoeing 777-200IGW. The weight and performance predicted by the MDO code werefound to be in good agreement with the available data. This design is referred to as thecurrent technology baseline cantilever configuration (Figure 5-1).
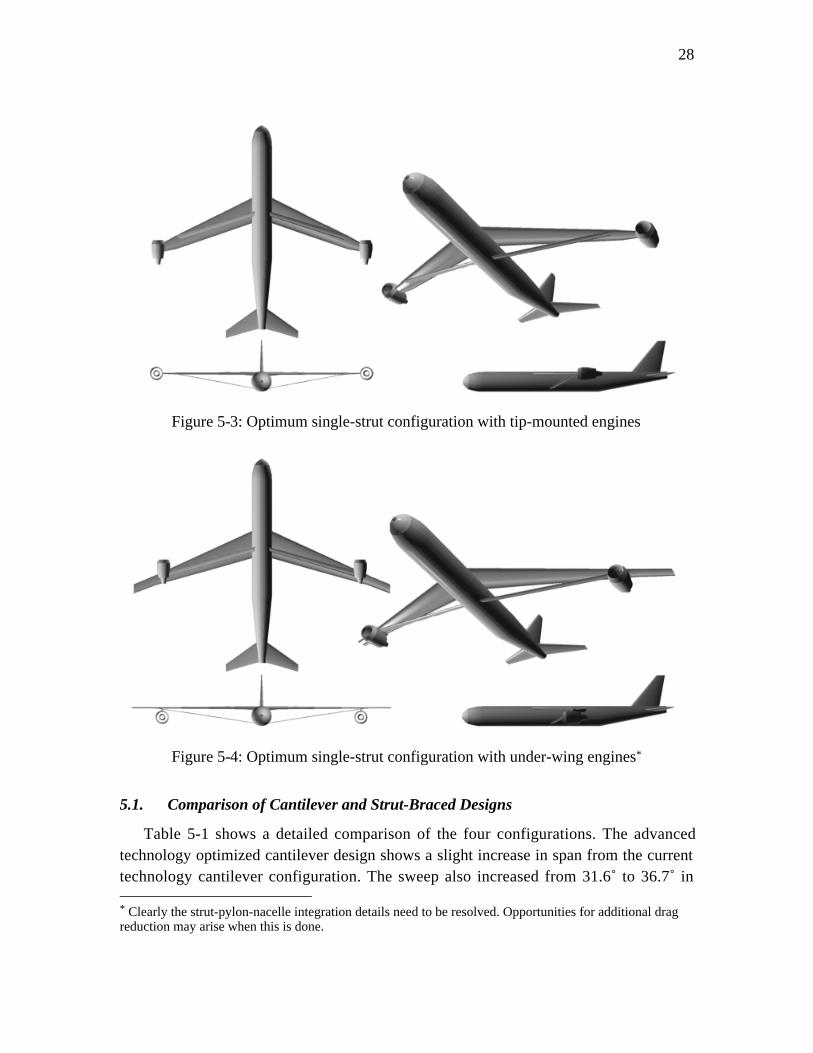
In the truss-braced wing MDO studies, we have introduced advanced technologyconcepts such as natural laminar flow and relaxed static stability to increase performance.We also use a rubber engine sizing method to match the engine size and weight to therequired thrust, and several structural components are sized based on the takeoff grossweight. With these assumptions, the optimizer can redesign the baseline configuration toachieve the maximum benefit. It would be wrong to compare a truss-braced wingutilizing these assumptions and design degrees of freedom with a current technologycantilever design. Therefore, an advanced technology optimized cantilever configuration(Figure 5-2) was created by allowing the span, t/c, sweep, and chord distribution to bedesign variables and minimizing the takeoff gross weight. This configuration allows us tomake valid comparisons between the cantilever and truss-braced wing concepts under thesame set of technology assumptions, and using the same design methodology.
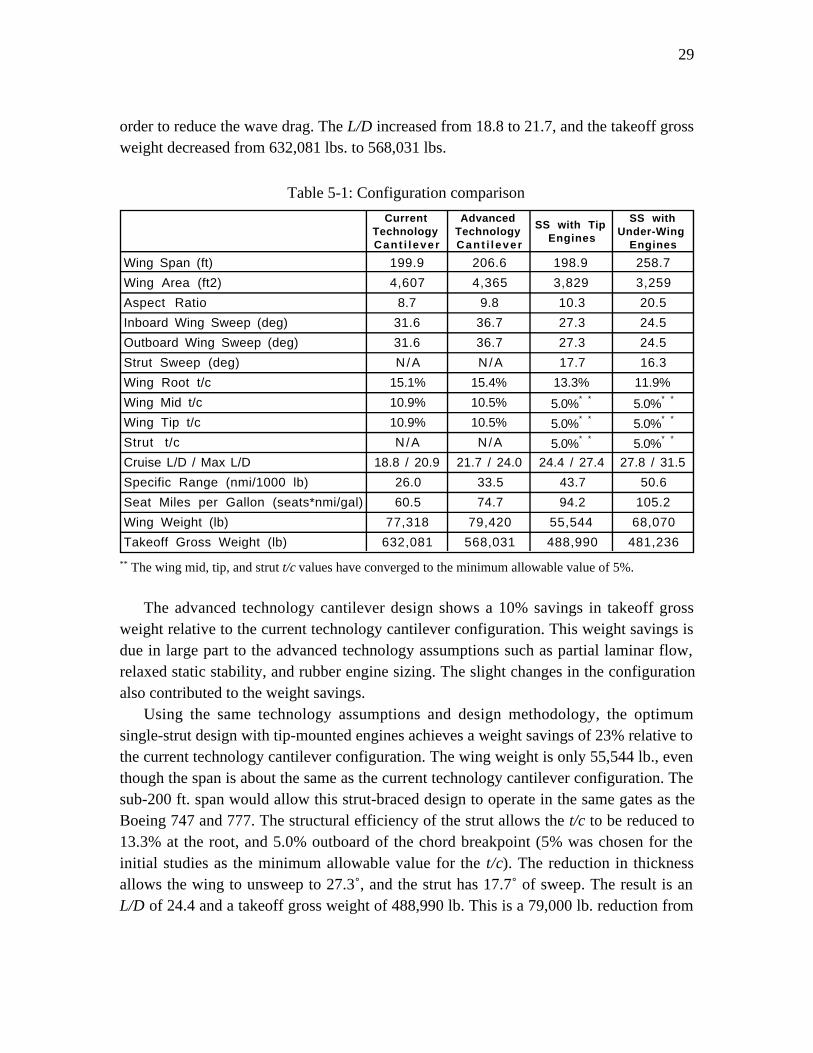
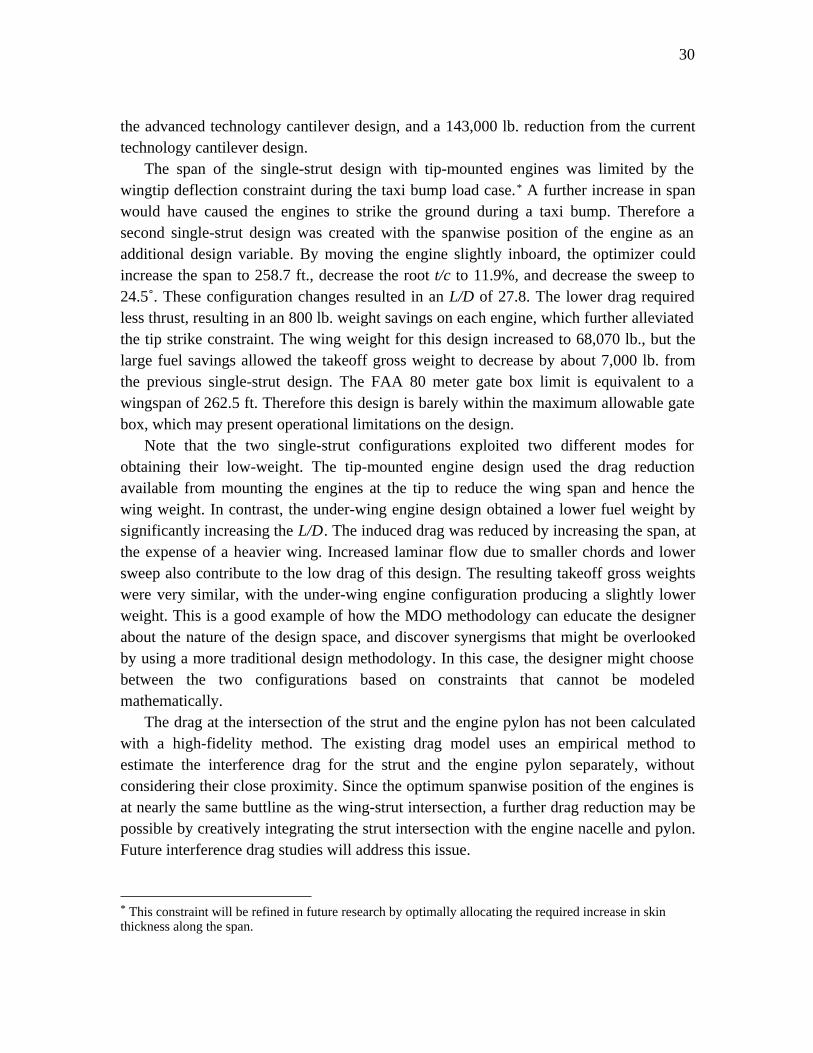
A single-strut-braced high wing configuration is currently used as the most basicrepresentation of the truss-braced wing concept (Figure 5-3). Two variations on thisconcept are shown below. The first single-strut configuration was created by fixing theengines at the wingtips and optimizing seventeen design variables for minimum takeoffgross weight. The second configuration was created by allowing the spanwise position ofthe engines to be an additional design variable (Figure 5-4).*
As presented in Table 5-1, the advanced technology cantilever configuration shows asignificant savings in takeoff gross weight due to the advanced technology assumptions,the design freedom provided by the design variables, the rubber engine sizing, and thesizing of several structural components based on the takeoff gross weight. The optimumsingle-strut design achieves a much larger savings in takeoff gross weight due to the
* We assume that the induced drag reduction due to tip-mounted engines is effective only when the engineis located exactly at the tip. If the engines were located at 99% of the span, no induced drag reductionwould be calculated. For this reason, two single-strut optimizations were performed: one starting with theengines at the tip, and one starting with the engines partially inboard.
27
greater design freedom allowed by the strut, the increased structural efficiency of thestrut, and the increase in laminar flow due to smaller chords and less sweep.
The following two sections will show the drag, weight, and cost comparisons betweenthe four designs. The remaining sections will show the sensitivity of the optimum single-strut design with tip-mounted engines to changes in sweep, the amount of laminar flow,the airfoil technology, the wing-strut interference drag, and the design Mach number.
Figure 5-1: Current technology baseline cantilever configuration
Figure 5-2: Advanced technology optimized cantilever configuration
28
Figure 5-3: Optimum single-strut configuration with tip-mounted engines
Figure 5-4: Optimum single-strut configuration with under-wing engines*
5.1. Comparison of Cantilever and Strut-Braced Designs
Table 5-1 shows a detailed comparison of the four configurations. The advancedtechnology optimized cantilever design shows a slight increase in span from the currenttechnology cantilever configuration. The sweep also increased from 31.6˚ to 36.7˚ in * Clearly the strut-pylon-nacelle integration details need to be resolved. Opportunities for additional dragreduction may arise when this is done.
29
order to reduce the wave drag. The L/D increased from 18.8 to 21.7, and the takeoff grossweight decreased from 632,081 lbs. to 568,031 lbs.
Table 5-1: Configuration comparison
Current Technology Cant i lever
Advanced Technology Cant i lever
SS with Tip Engines
SS with Under-Wing
Engines
Wing Span (ft) 199.9 206.6 198.9 258.7
Wing Area (ft2) 4,607 4,365 3,829 3,259
Aspect Ratio 8.7 9.8 10.3 20.5
Inboard Wing Sweep (deg) 31.6 36.7 27.3 24.5
Outboard Wing Sweep (deg) 31.6 36.7 27.3 24.5
Strut Sweep (deg) N/A N/A 17.7 16.3
Wing Root t/c 15.1% 15.4% 13.3% 11.9%
Wing Mid t/c 10.9% 10.5% 5.0%* * 5.0%* *
Wing Tip t/c 10.9% 10.5% 5.0%* * 5.0%* *
Strut t/c N /A N/A 5.0%* * 5.0%* *
Cruise L/D / Max L/D 18.8 / 20.9 21.7 / 24.0 24.4 / 27.4 27.8 / 31.5
Specific Range (nmi/1000 lb) 26.0 33.5 43.7 50.6
Seat Miles per Gallon (seats*nmi/gal) 60.5 74.7 94.2 105.2
Wing Weight (lb) 77,318 79,420 55,544 68,070
Takeoff Gross Weight (lb) 632,081 568,031 488,990 481,236
** The wing mid, tip, and strut t/c values have converged to the minimum allowable value of 5%.
The advanced technology cantilever design shows a 10% savings in takeoff grossweight relative to the current technology cantilever configuration. This weight savings isdue in large part to the advanced technology assumptions such as partial laminar flow,relaxed static stability, and rubber engine sizing. The slight changes in the configurationalso contributed to the weight savings.
Using the same technology assumptions and design methodology, the optimumsingle-strut design with tip-mounted engines achieves a weight savings of 23% relative tothe current technology cantilever configuration. The wing weight is only 55,544 lb., eventhough the span is about the same as the current technology cantilever configuration. Thesub-200 ft. span would allow this strut-braced design to operate in the same gates as theBoeing 747 and 777. The structural efficiency of the strut allows the t/c to be reduced to13.3% at the root, and 5.0% outboard of the chord breakpoint (5% was chosen for theinitial studies as the minimum allowable value for the t/c). The reduction in thicknessallows the wing to unsweep to 27.3˚, and the strut has 17.7˚ of sweep. The result is anL/D of 24.4 and a takeoff gross weight of 488,990 lb. This is a 79,000 lb. reduction from
30
the advanced technology cantilever design, and a 143,000 lb. reduction from the currenttechnology cantilever design.
The span of the single-strut design with tip-mounted engines was limited by thewingtip deflection constraint during the taxi bump load case.* A further increase in spanwould have caused the engines to strike the ground during a taxi bump. Therefore asecond single-strut design was created with the spanwise position of the engine as anadditional design variable. By moving the engine slightly inboard, the optimizer couldincrease the span to 258.7 ft., decrease the root t/c to 11.9%, and decrease the sweep to24.5˚. These configuration changes resulted in an L/D of 27.8. The lower drag requiredless thrust, resulting in an 800 lb. weight savings on each engine, which further alleviatedthe tip strike constraint. The wing weight for this design increased to 68,070 lb., but thelarge fuel savings allowed the takeoff gross weight to decrease by about 7,000 lb. fromthe previous single-strut design. The FAA 80 meter gate box limit is equivalent to awingspan of 262.5 ft. Therefore this design is barely within the maximum allowable gatebox, which may present operational limitations on the design.
Note that the two single-strut configurations exploited two different modes forobtaining their low-weight. The tip-mounted engine design used the drag reductionavailable from mounting the engines at the tip to reduce the wing span and hence thewing weight. In contrast, the under-wing engine design obtained a lower fuel weight bysignificantly increasing the L/D. The induced drag was reduced by increasing the span, atthe expense of a heavier wing. Increased laminar flow due to smaller chords and lowersweep also contribute to the low drag of this design. The resulting takeoff gross weightswere very similar, with the under-wing engine configuration producing a slightly lowerweight. This is a good example of how the MDO methodology can educate the designerabout the nature of the design space, and discover synergisms that might be overlookedby using a more traditional design methodology. In this case, the designer might choosebetween the two configurations based on constraints that cannot be modeledmathematically.
The drag at the intersection of the strut and the engine pylon has not been calculatedwith a high-fidelity method. The existing drag model uses an empirical method toestimate the interference drag for the strut and the engine pylon separately, withoutconsidering their close proximity. Since the optimum spanwise position of the engines isat nearly the same buttline as the wing-strut intersection, a further drag reduction may bepossible by creatively integrating the strut intersection with the engine nacelle and pylon.Future interference drag studies will address this issue.
* This constraint will be refined in future research by optimally allocating the required increase in skinthickness along the span.
31
Since the t/c of the outboard wing panel is only 5%, one would expect that a largeramount of laminar flow could be achieved on the outer panel by allowing it to have asweep angle independent of the inboard panel sweep. This optimization was performed,and the resulting design has a wing with an inboard sweep of 26.9˚, and an outboardsweep of 19.3˚. The takeoff gross weight of this design is 476,717 lb, which is a 0.9%savings relative to the single-sweep design. Since the structural analysis does not modelthe additional weight and complexity that would be required at this discontinuous joint,the actual weight savings may be negligible, or the weight may actually increase.
5.2. Understanding the Optimum Configurations
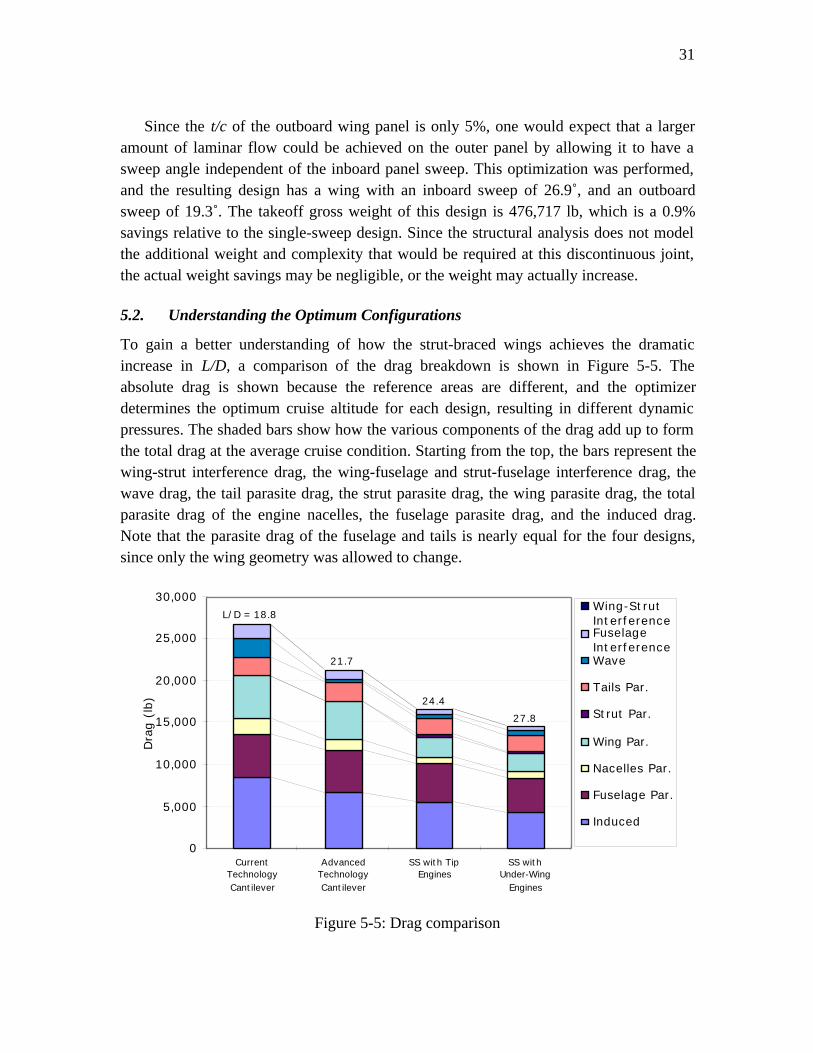
To gain a better understanding of how the strut-braced wings achieves the dramaticincrease in L/D, a comparison of the drag breakdown is shown in Figure 5-5. Theabsolute drag is shown because the reference areas are different, and the optimizerdetermines the optimum cruise altitude for each design, resulting in different dynamicpressures. The shaded bars show how the various components of the drag add up to formthe total drag at the average cruise condition. Starting from the top, the bars represent thewing-strut interference drag, the wing-fuselage and strut-fuselage interference drag, thewave drag, the tail parasite drag, the strut parasite drag, the wing parasite drag, the totalparasite drag of the engine nacelles, the fuselage parasite drag, and the induced drag.Note that the parasite drag of the fuselage and tails is nearly equal for the four designs,since only the wing geometry was allowed to change.
0
5,000
10,000
15,000
20,000
25,000
30,000
CurrentTechnologyCantilever
AdvancedTechnologyCantilever
SS with TipEngines
SS withUnder-Wing
Engines
Dra
g (
lb)
Wing-StrutInterferenceFuselageInterferenceWave
Tails Par.
Strut Par.
Wing Par.
Nacelles Par.
Fuselage Par.
Induced
L/D = 18.8
21.7
24.4
27.8
Figure 5-5: Drag comparison
32
The most dramatic change in drag for the advanced technology cantilever design isthe reduction in induced drag due to the increase in span and decrease in weight and wingarea. The average cruise lift coefficient decreased from 0.46 for the current technologyconfiguration to 0.44 for the advanced technology configuration. The nacelle drag issomewhat smaller, since the higher L/D and lower weight of the optimum cantileverdesign reduce the required thrust, which results in smaller engines. The wing parasitedrag actually decreased slightly, since 9.3% of the wing area became laminar. The wavedrag was significantly reduced by the added sweep.
The optimum single-strut design with tip engines shows a further reduction ininduced drag. The induced drag coefficient is actually slightly larger than the induceddrag coefficient of the advanced technology cantilever design, but the large reduction inwing area resulted in a decrease in the absolute induced drag. The air density is alsolower, since the optimum average cruise altitude increased from 35,987 ft. to 39,432 ft.The interaction of the tip-mounted engines with the wingtip vortex results in a 12.5%savings in induced drag, and a 4.9% savings in total drag for this design (relative to thesame configuration with no induced drag reduction due to the tip engines). This dragsavings would translate to a savings of 3.3% in takeoff gross weight.
Since the strut allows a smaller t/c, the wing can unsweep without a wave dragpenalty. The reduction in sweep allows 31.9% of the wing area to become laminar. Thestrut also has some parasite drag, but since it has a small chord, and a low sweep angle, itis completely laminar and has very little drag.
The optimum single-strut design with under-wing engines shows the most significantreduction in induced drag, since the span increased to 258.7 ft. The smaller wing area anddecreased air density due a further increase in altitude to 41,900 ft. also reduced theabsolute drag. Further unsweeping of the wing to 24.5˚ results in 45.8% of the wingbecoming laminar.
The interference drag is currently estimated using the low speed data and empiricalequations presented in Hoerner's Fluid-Dynamic Drag [18]. The Hoerner data shows thatthe interference drag can be reduced with an increase in sweep. Since the advancedtechnology cantilever design has more sweep than the current technology cantileverdesign, the interference drag is lower, despite the increase in thickness.
The Hoerner data shows that the wing-fuselage interference drag is a function of(t/c)3. Additionally, the drag coefficient is normalized by the chord squared over thereference area squared. Therefore a wing-fuselage intersection with a large t/c and largechord will have high interference drag, and an intersection with a small t/c and smallchord will have low interference drag. Since the strut-braced wing has a smaller t/c and amuch smaller wing root chord relative to the cantilever designs, it achieves a significantreduction in the wing-fuselage interference drag.
33
The main concern with the strut-braced wing has traditionally been the interferencedrag at the wing-strut intersection. However, since the average t/c and the average chordare both relatively small at the intersection, the interference drag is almost negligible. Thereliability of this prediction is somewhat questionable, since the Hoerner data does notinclude transonic effects. Therefore, detailed CFD studies are being performed to locallyshape the intersection geometry to avoid a large interference drag penalty (see Section4.2.3).
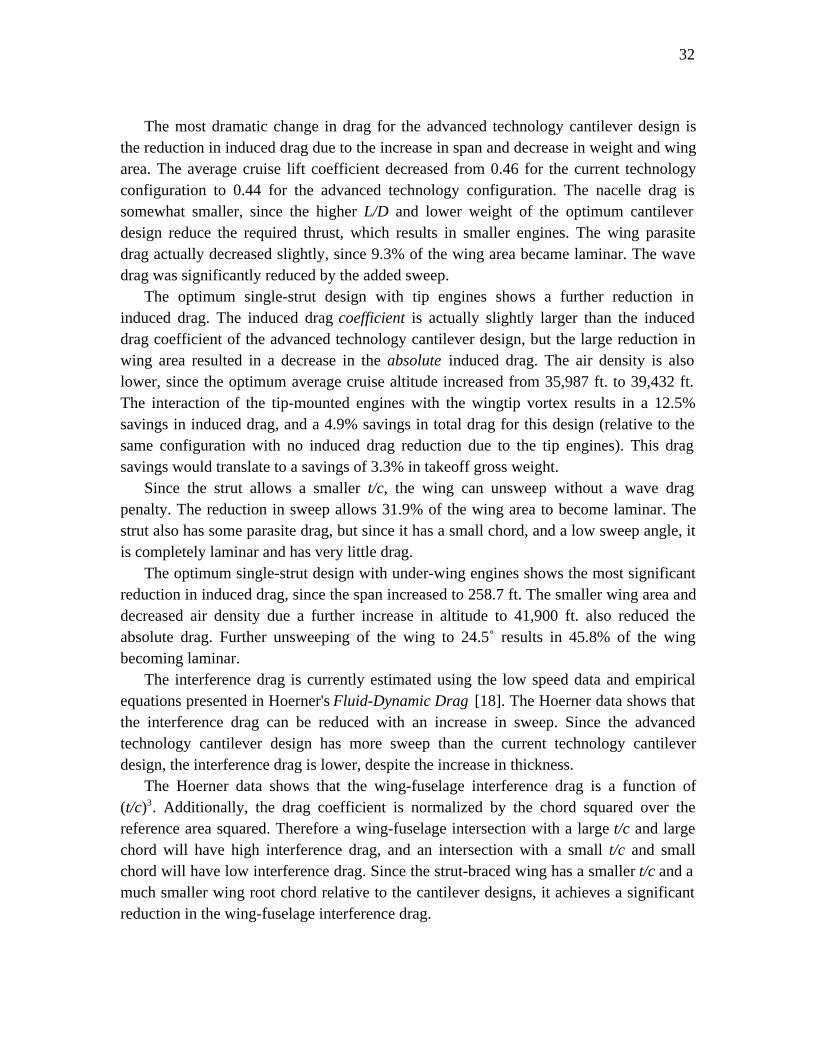
Figure 5-6 shows the weight breakdown for the four designs. Starting from the top,the three shaded bars represent the fuel weight, the wing and strut weight, and the zero-fuel weight minus the weight of the wing and strut.
296,647 279,363 267,648 264,693
77,31879,420
55,544 68,070
258,116
209,249
165,798 148,473
0
100,000
200,000
300,000
400,000
500,000
600,000
700,000
CurrentTechnologyCantilever
AdvancedTechnologyCantilever
SS with TipEngines
SS withUnder-Wing
Engines
Weig
ht
(lbs)
Fuel
Wing and Strut
Zero Fuel - Wing
632,081568,031
488,990 481,236
Figure 5-6: Weight comparison
Because of the increased cruise efficiency, the advanced technology cantilever designshows a 49,000 lb. fuel weight savings relative to the current technology configuration,and the optimum single-strut designs show a fuel weight savings of 92,000 lb. and110,000 lb., respectively
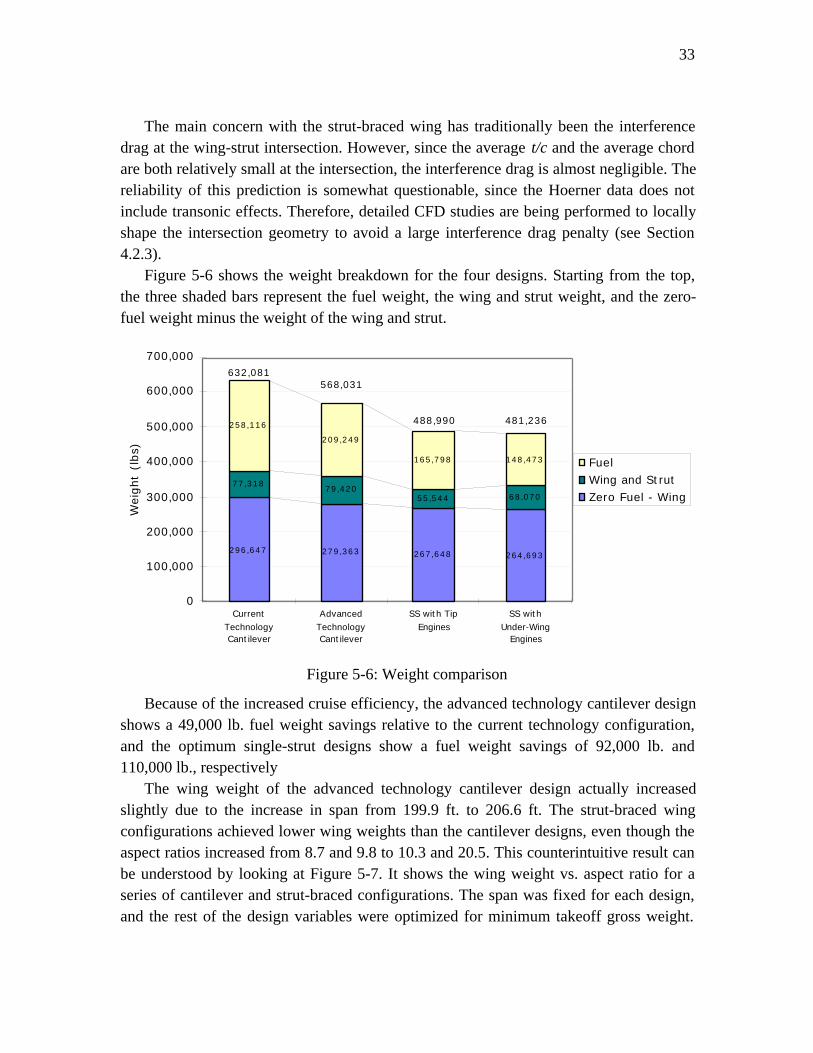
The wing weight of the advanced technology cantilever design actually increasedslightly due to the increase in span from 199.9 ft. to 206.6 ft. The strut-braced wingconfigurations achieved lower wing weights than the cantilever designs, even though theaspect ratios increased from 8.7 and 9.8 to 10.3 and 20.5. This counterintuitive result canbe understood by looking at Figure 5-7. It shows the wing weight vs. aspect ratio for aseries of cantilever and strut-braced configurations. The span was fixed for each design,and the rest of the design variables were optimized for minimum takeoff gross weight.
34
The rightmost point on each curve corresponds to a wing with a span of 262.5 ft., whichis equivalent to the 80 meter gate box limit. The three curves represent a cantilever wing,a strut-braced wing with tip-mounted engines, and a strut-braced wing with under-wingengines at an optimum spanwise position. The strut-braced wings clearly pay a muchsmaller weight penalty for the increase in aspect ratio.
0
20,000
40,000
60,000
80,000
100,000
120,000
5 10 15 20 25
Aspect Ratio
Win
g W
eight
(lb)
CantileverSS, Tip Engines
SS, Under-Wing Engines80 m gate box limit
Each point represents an optimized configuration
Figure 5-7: Wing weight vs. aspect ratio
Notice that the strut-braced wing curves in Figure 5-7 diverge at an aspect ratio ofabout 9.4. As the aspect ratio of the strut-braced wing with tip-mounted engines increasesabove this point, the wing weight increases rapidly since a significant amount of stiffnessmust be added to the wing to prevent the tip engines from striking the ground during ataxi bump. However, if the spanwise position of the engines is allowed to become adesign variable, the engines tend to move inboard (thus sacrificing the induced dragreduction), and the span can increase without a large weight penalty. The upper bound fora strut-braced wing with under-wing engines is an aspect ratio of 21.1.
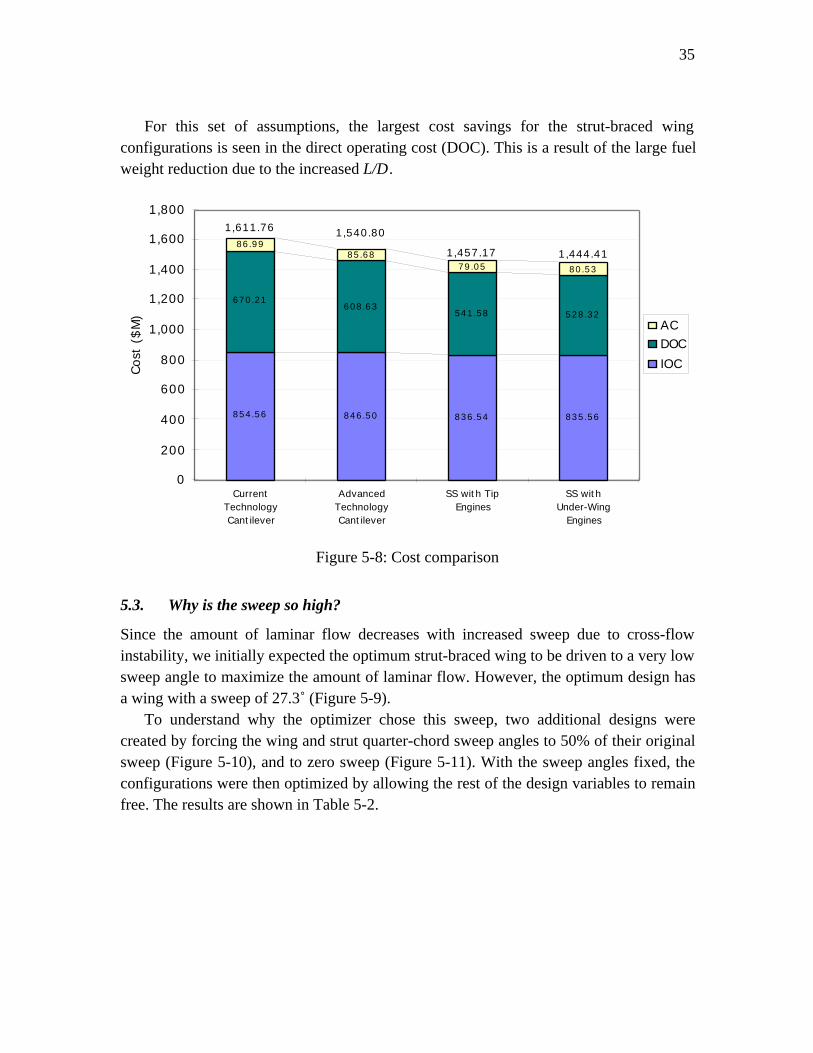
The cost breakdowns, shown in Figure 5-8, were estimated using the FLOPS costmodel. Beginning from the top, the shaded bars represent the acquisition cost (AC), directoperating cost (DOC), and indirect operating cost (IOC). The costs are shown in year2000 dollars. The fuel price was assumed to be $1.00 per gallon, and the airframeproduction quantity was assumed to be 1,000. A 30 year lifetime was used with apassenger load factor of 65%.
35
For this set of assumptions, the largest cost savings for the strut-braced wingconfigurations is seen in the direct operating cost (DOC). This is a result of the large fuelweight reduction due to the increased L/D.
854.56 846.50 836.54 835.56
670.21608.63
541.58 528.32
86.9985.68
79.05 80.53
0
200
400
600
800
1,000
1,200
1,400
1,600
1,800
CurrentTechnologyCantilever
AdvancedTechnologyCantilever
SS with TipEngines
SS withUnder-Wing
Engines
Cos
t ($
M)
ACDOC
IOC
1,611.76 1,540.80
1,457.17 1,444.41
Figure 5-8: Cost comparison
5.3. Why is the sweep so high?
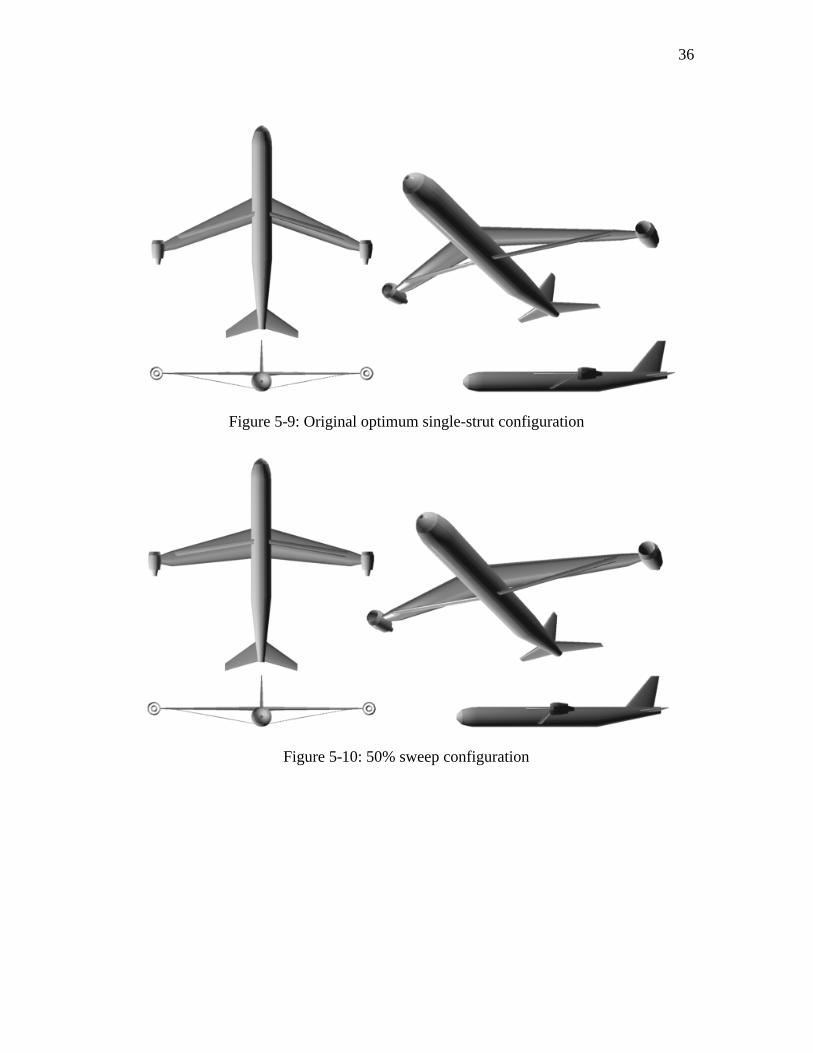
Since the amount of laminar flow decreases with increased sweep due to cross-flowinstability, we initially expected the optimum strut-braced wing to be driven to a very lowsweep angle to maximize the amount of laminar flow. However, the optimum design hasa wing with a sweep of 27.3˚ (Figure 5-9).
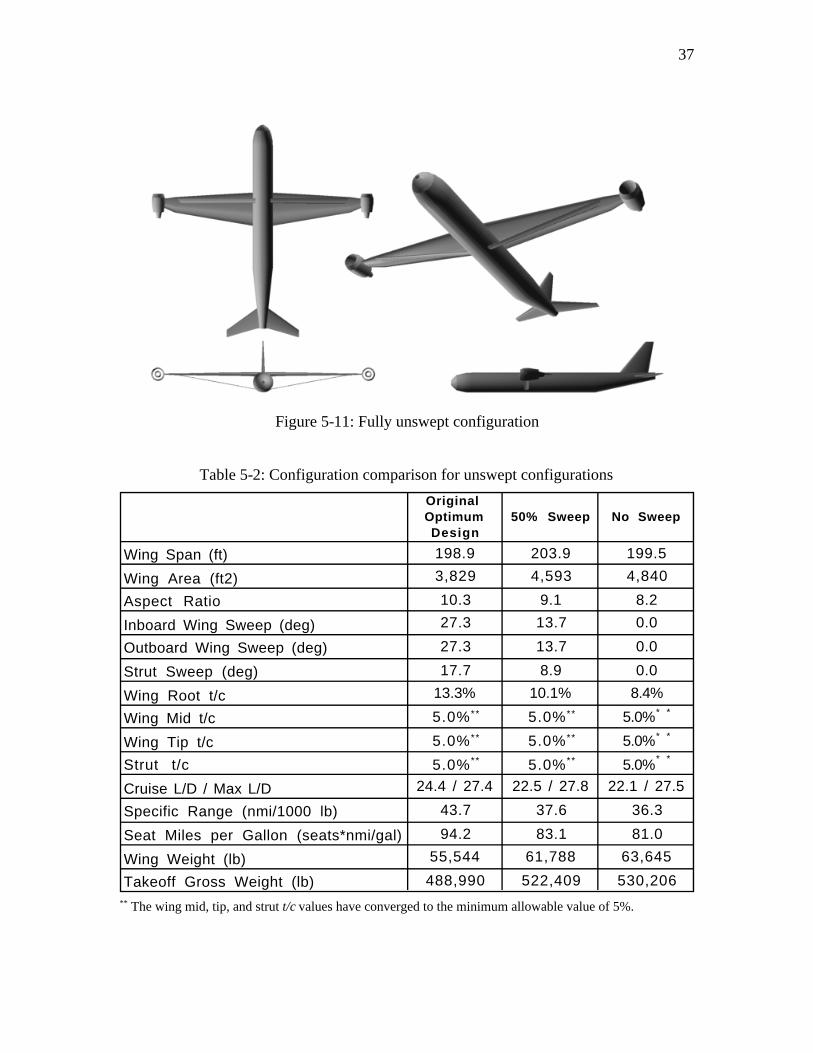
To understand why the optimizer chose this sweep, two additional designs werecreated by forcing the wing and strut quarter-chord sweep angles to 50% of their originalsweep (Figure 5-10), and to zero sweep (Figure 5-11). With the sweep angles fixed, theconfigurations were then optimized by allowing the rest of the design variables to remainfree. The results are shown in Table 5-2.
36
Figure 5-9: Original optimum single-strut configuration
Figure 5-10: 50% sweep configuration
37
Figure 5-11: Fully unswept configuration
Table 5-2: Configuration comparison for unswept configurations
Original Optimum Design
50% Sweep No Sweep
Wing Span (ft) 198.9 203.9 199.5
Wing Area (ft2) 3,829 4,593 4,840
Aspect Ratio 10.3 9.1 8.2
Inboard Wing Sweep (deg) 27.3 13.7 0.0
Outboard Wing Sweep (deg) 27.3 13.7 0.0
Strut Sweep (deg) 17.7 8.9 0.0
Wing Root t/c 13.3% 10.1% 8.4%
Wing Mid t/c 5.0%** 5.0%** 5.0%* *
Wing Tip t/c 5.0%** 5.0%** 5.0%* *
Strut t/c 5.0%** 5.0%** 5.0%* *
Cruise L/D / Max L/D 24.4 / 27.4 22.5 / 27.8 22.1 / 27.5
Specific Range (nmi/1000 lb) 43.7 37.6 36.3
Seat Miles per Gallon (seats*nmi/gal) 94.2 83.1 81.0
Wing Weight (lb) 55,544 61,788 63,645
Takeoff Gross Weight (lb) 488,990 522,409 530,206** The wing mid, tip, and strut t/c values have converged to the minimum allowable value of 5%.
38
As the wing is forced to unsweep, the wing root t/c becomes smaller in an attempt toavoid a transonic wave drag penalty and a large interference drag penalty. As a result, thewing weight increases by 6,244 lbs. for the 50% sweep configuration, and by 8,101 lbs.for the fully unswept configuration.
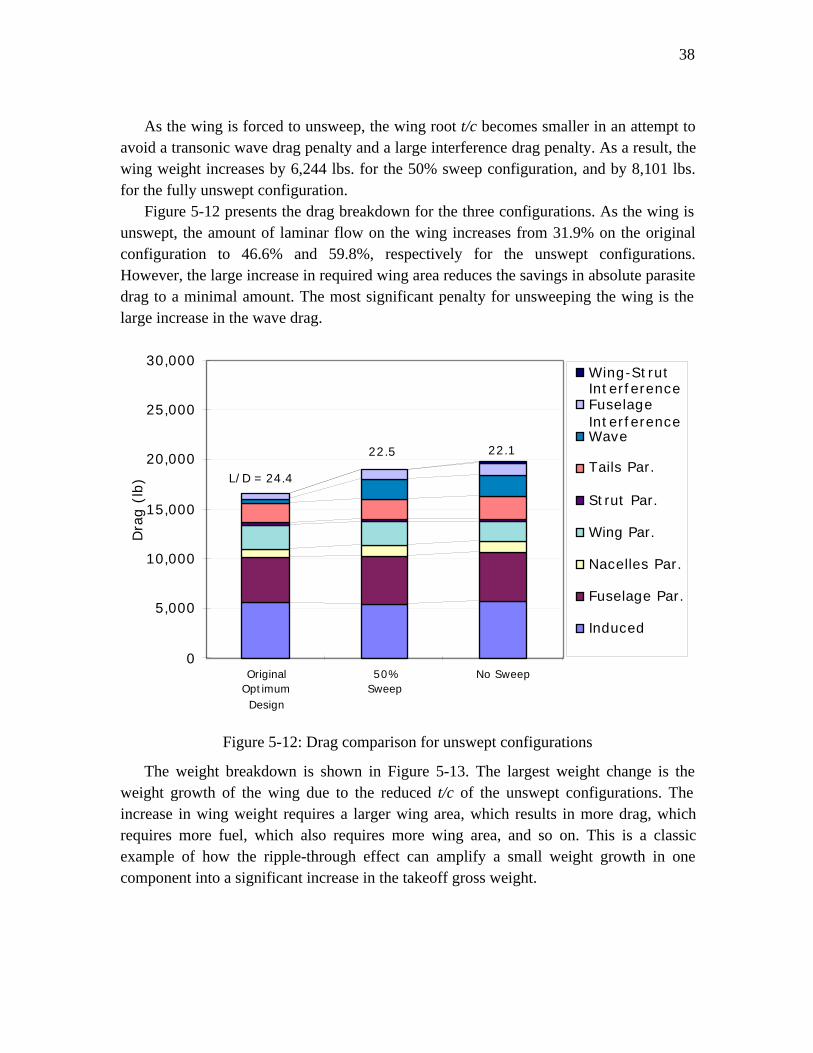
Figure 5-12 presents the drag breakdown for the three configurations. As the wing isunswept, the amount of laminar flow on the wing increases from 31.9% on the originalconfiguration to 46.6% and 59.8%, respectively for the unswept configurations.However, the large increase in required wing area reduces the savings in absolute parasitedrag to a minimal amount. The most significant penalty for unsweeping the wing is thelarge increase in the wave drag.
0
5,000
10,000
15,000
20,000
25,000
30,000
OriginalOptimumDesign
50%Sweep
No Sweep
Dra
g (
lb)
Wing-StrutInterferenceFuselageInterferenceWave
Tails Par.
Strut Par.
Wing Par.
Nacelles Par.
Fuselage Par.
Induced
L/D = 24.4
22.5 22.1
Figure 5-12: Drag comparison for unswept configurations
The weight breakdown is shown in Figure 5-13. The largest weight change is theweight growth of the wing due to the reduced t/c of the unswept configurations. Theincrease in wing weight requires a larger wing area, which results in more drag, whichrequires more fuel, which also requires more wing area, and so on. This is a classicexample of how the ripple-through effect can amplify a small weight growth in onecomponent into a significant increase in the takeoff gross weight.
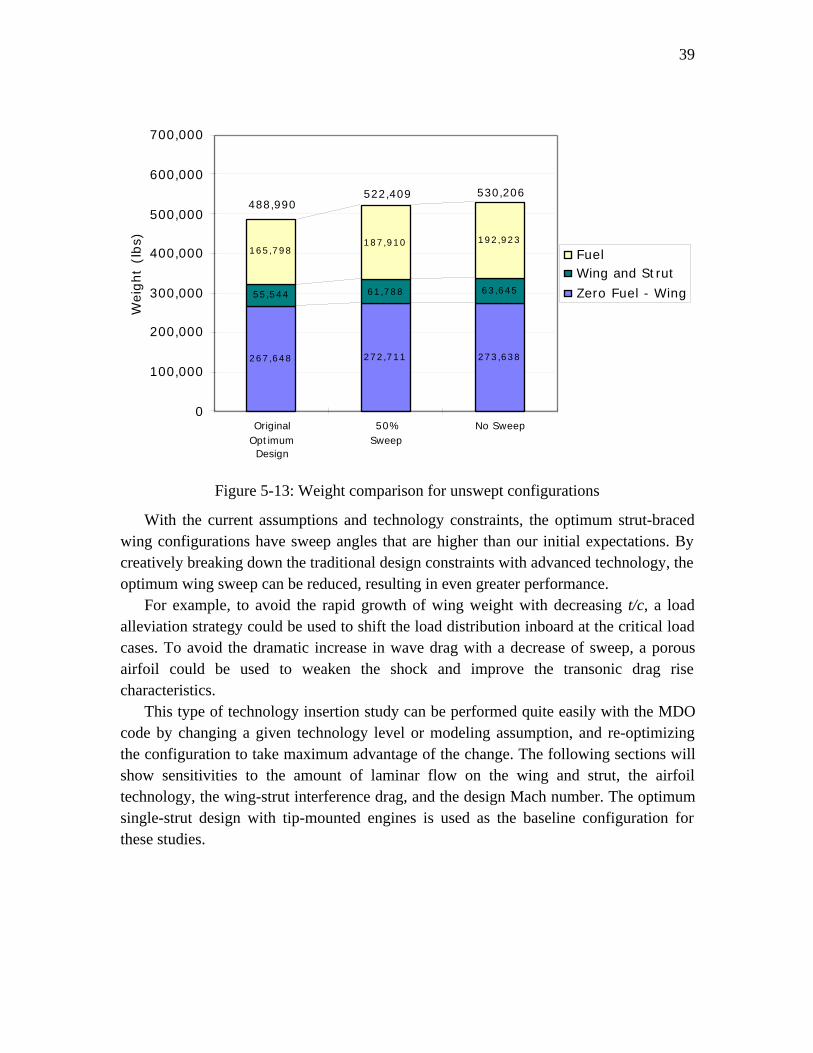
39
267,648 272,711 273,638
55,544 61,788 63,645
165,798187,910 192,923
0
100,000
200,000
300,000
400,000
500,000
600,000
700,000
OriginalOptimumDesign
50%Sweep
No Sweep
Weig
ht
(lbs)
FuelWing and Strut
Zero Fuel - Wing
488,990522,409 530,206
Figure 5-13: Weight comparison for unswept configurations
With the current assumptions and technology constraints, the optimum strut-bracedwing configurations have sweep angles that are higher than our initial expectations. Bycreatively breaking down the traditional design constraints with advanced technology, theoptimum wing sweep can be reduced, resulting in even greater performance.
For example, to avoid the rapid growth of wing weight with decreasing t/c, a loadalleviation strategy could be used to shift the load distribution inboard at the critical loadcases. To avoid the dramatic increase in wave drag with a decrease of sweep, a porousairfoil could be used to weaken the shock and improve the transonic drag risecharacteristics.
This type of technology insertion study can be performed quite easily with the MDOcode by changing a given technology level or modeling assumption, and re-optimizingthe configuration to take maximum advantage of the change. The following sections willshow sensitivities to the amount of laminar flow on the wing and strut, the airfoiltechnology, the wing-strut interference drag, and the design Mach number. The optimumsingle-strut design with tip-mounted engines is used as the baseline configuration forthese studies.
40
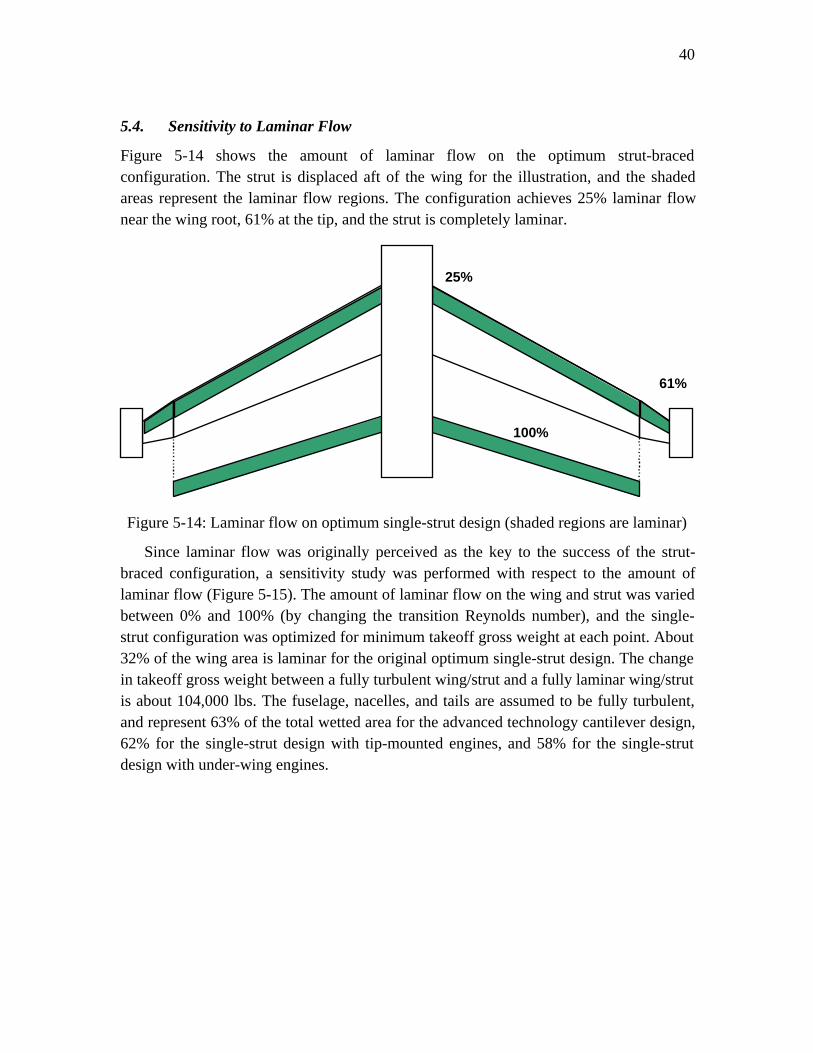
5.4. Sensitivity to Laminar Flow
Figure 5-14 shows the amount of laminar flow on the optimum strut-bracedconfiguration. The strut is displaced aft of the wing for the illustration, and the shadedareas represent the laminar flow regions. The configuration achieves 25% laminar flownear the wing root, 61% at the tip, and the strut is completely laminar.
25%
61%
100%
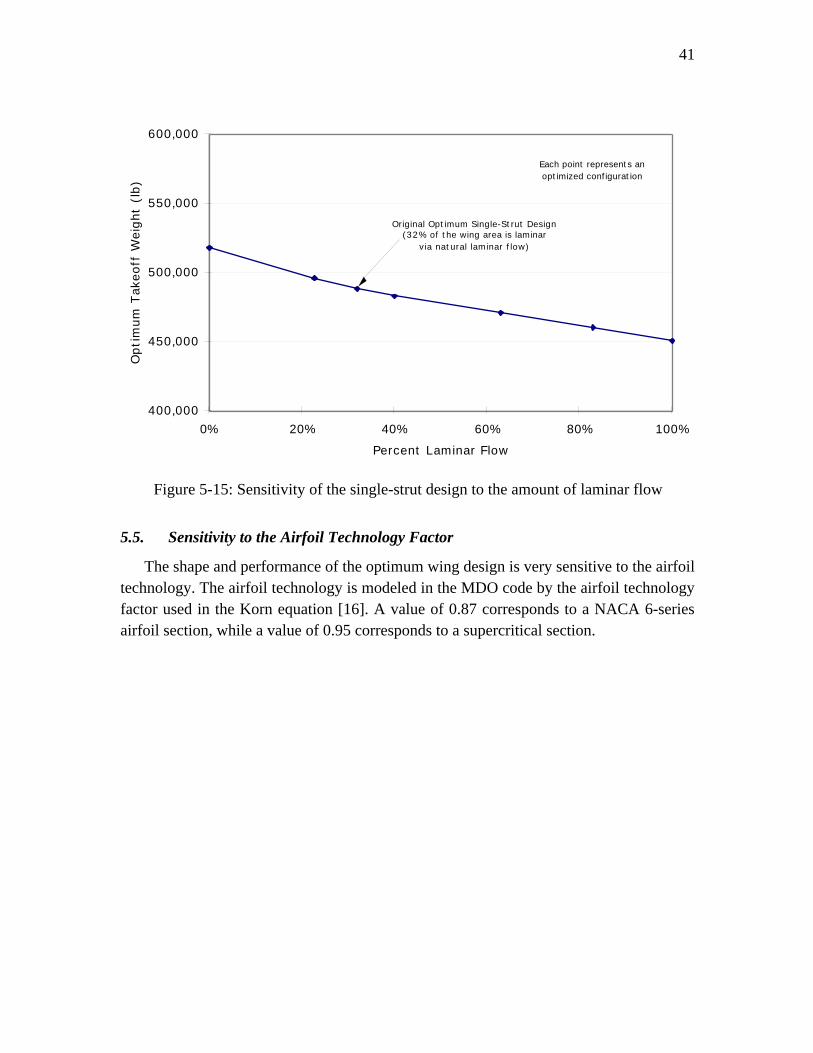
Figure 5-14: Laminar flow on optimum single-strut design (shaded regions are laminar)
Since laminar flow was originally perceived as the key to the success of the strut-braced configuration, a sensitivity study was performed with respect to the amount oflaminar flow (Figure 5-15). The amount of laminar flow on the wing and strut was variedbetween 0% and 100% (by changing the transition Reynolds number), and the single-strut configuration was optimized for minimum takeoff gross weight at each point. About32% of the wing area is laminar for the original optimum single-strut design. The changein takeoff gross weight between a fully turbulent wing/strut and a fully laminar wing/strutis about 104,000 lbs. The fuselage, nacelles, and tails are assumed to be fully turbulent,and represent 63% of the total wetted area for the advanced technology cantilever design,62% for the single-strut design with tip-mounted engines, and 58% for the single-strutdesign with under-wing engines.
41
400,000
450,000
500,000
550,000
600,000
0% 20% 40% 60% 80% 100%
Percent Laminar Flow
Opti
mum
Tak
eoff
Weig
ht
(lb)
Each point represents an optimized configuration
Original Optimum Single-Strut Design (32% of the wing area is laminar
via natural laminar flow)
Figure 5-15: Sensitivity of the single-strut design to the amount of laminar flow
5.5. Sensitivity to the Airfoil Technology Factor
The shape and performance of the optimum wing design is very sensitive to the airfoiltechnology. The airfoil technology is modeled in the MDO code by the airfoil technologyfactor used in the Korn equation [16]. A value of 0.87 corresponds to a NACA 6-seriesairfoil section, while a value of 0.95 corresponds to a supercritical section.
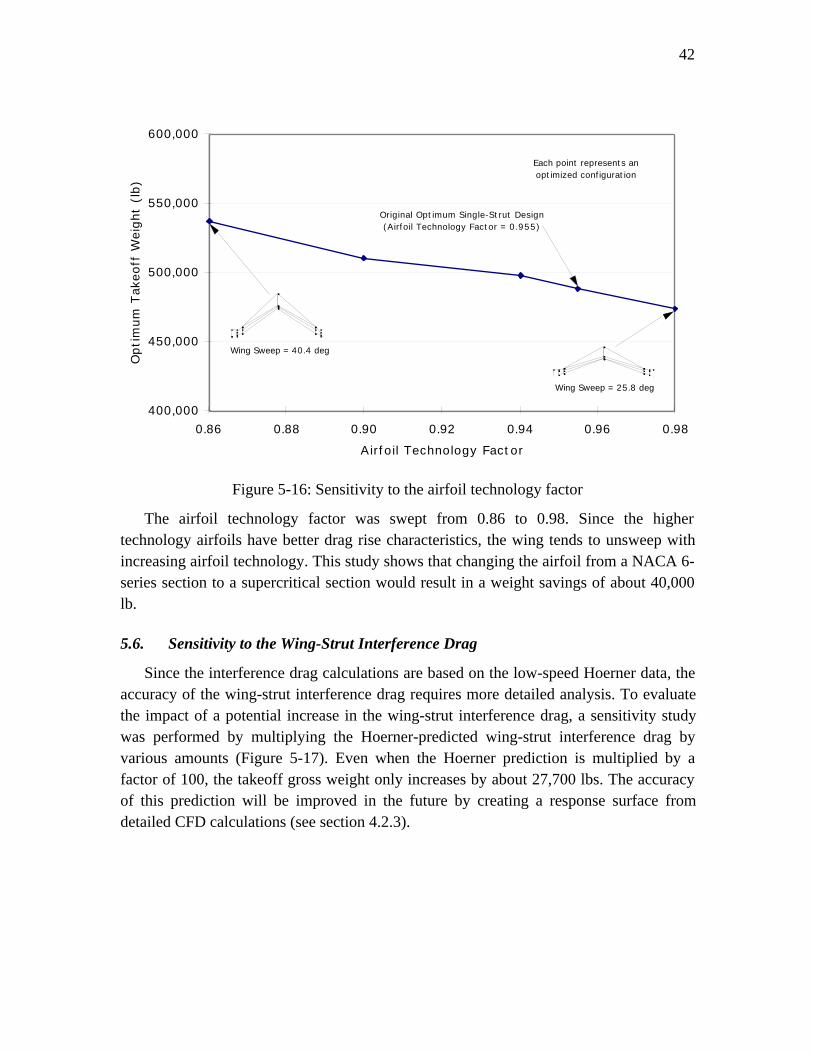
42
400,000
450,000
500,000
550,000
600,000
0.86 0.88 0.90 0.92 0.94 0.96 0.98
Airfoil Technology Factor
Opti
mum
Tak
eoff
Weig
ht
(lb)
Each point represents an optimized configuration
Wing Sweep = 25.8 deg
Wing Sweep = 40.4 deg
Original Optimum Single-Strut Design (Airfoil Technology Factor = 0.955)
Figure 5-16: Sensitivity to the airfoil technology factor
The airfoil technology factor was swept from 0.86 to 0.98. Since the highertechnology airfoils have better drag rise characteristics, the wing tends to unsweep withincreasing airfoil technology. This study shows that changing the airfoil from a NACA 6-series section to a supercritical section would result in a weight savings of about 40,000lb.
5.6. Sensitivity to the Wing-Strut Interference Drag
Since the interference drag calculations are based on the low-speed Hoerner data, theaccuracy of the wing-strut interference drag requires more detailed analysis. To evaluatethe impact of a potential increase in the wing-strut interference drag, a sensitivity studywas performed by multiplying the Hoerner-predicted wing-strut interference drag byvarious amounts (Figure 5-17). Even when the Hoerner prediction is multiplied by afactor of 100, the takeoff gross weight only increases by about 27,700 lbs. The accuracyof this prediction will be improved in the future by creating a response surface fromdetailed CFD calculations (see section 4.2.3).
43
400,000
450,000
500,000
550,000
600,000
0 20 40 60 80 100
Multiple of Hoerner Wing-Strut Interference Drag
Opti
mum
Tak
eoff
Weig
ht
(lb)
Each point represents an optimized configuration
Original Optimum Single-Strut Design (Multiple = 1)
Figure 5-17: Sensitivity to the magnitude of the wing-strut interference drag
5.7. Sensitivity to the Design Mach Number
The single-strut and cantilever configurations are quite sensitive to the design Machnumber, as shown in Figure 5-18. The planforms of the optimum strut-bracedconfigurations for Mach 0.6 and 0.9 are also shown. At Mach 0.6, the optimum strut-braced configuration shows a weight savings of 55,910 lbs. (12%) over the cantileverconfiguration. The advantage of the strut-braced wing increases with increasing designMach number. At Mach 0.9, the strut-braced configuration has a 82,357 lb. (14%) weightsavings over the cantilever configuration.
44
400,000
450,000
500,000
550,000
600,000
0.60 0.65 0.70 0.75 0.80 0.85 0.90
Design Mach Number
Opti
mum
Tak
eoff
Weig
ht
(lb)
Cantilever
Single-StrutEach point represents an optimized configuration
Original Optimum Single-Strut Design (Design Mach Number = 0.85)
Figure 5-18: Optimum takeoff weight vs. design Mach number
6. Imagineering
In addition to the optimization studies shown above, several brainstorming sessionswere held to "imagineer" innovative new design concepts. One of the most promisingconcepts is the arch-shaped strut. When this strut is placed in tension, it straightens outslightly and acts like a normal strut. However, instead of buckling under compression likea straight, rigid strut, it simply acts like a spring and helps to relieve the bending load. Infact, it takes at least 180˚ of rotation to actually buckle the arch-shaped strut!
The arch-shaped strut concept was utilized in the novel configuration shown in Figure6-1. This configuration features a perpendicular intersection between the wing and strutsin the front view, and a chordwise offset of the maximum thickness locations in the planview. Both of these effects should reduce the interference drag. Additionally, the twostruts complement each other by allowing one to be in tension when the other strut islikely to be in compression, thus alleviating the strut buckling problem.
45
Figure 6-1: Arch-shaped strut configuration
6.1. Configuration Visualization
When performing MDO studies, it is important to provide the designer with high-qualityvisual feedback to communicate the shape of the configuration. To meet this goal, aFortran subroutine was written to convert the configuration parameters of a given designinto a DXF file that can be imported into AutoCAD on the PC or Infini-D on theMacintosh. These programs can then be used to create three-dimensional, rendered solidmodels of the configuration, animations, and virtual reality objects. An example of arendered solid model with a background scene is shown in Figure 6-2.
46
Figure 6-2: Rendered solid model of the single-strut configuration
We also took the configuration visualization work one step further by creating aplastic solid model of the arch-shaped strut configuration using the I-DEAS solidmodeling software and the rapid prototyping hardware at Virginia Tech (Figure 6-3).This technology will allow us to easily visualize complex configurations in the future.
Figure 6-3: Plastic solid model of the arch-shaped strut concept
47
7. Conclusions and Future Work
7.1. Summary of Results
The multidisciplinary design optimization approach is absolutely essential for gaining aproper understanding of the nature of the design space and showing the true potential of atruss-braced wing configuration as envisioned by Pfenninger. Some of the results werecounterintuitive at first, but more detailed investigations showed very good reasons forthe design decisions made by the optimizer. For example, we initially expected the wingto unsweep to maximize the amount of laminar flow and reduce the wing weight, but theMDO method showed that the wave drag penalty for unsweeping the wing was largerthan the parasite drag reduction due to the increased laminar flow and wing weightsavings. Additionally, the structural analysis showed that a wing with an exceptionallysmall t/c can severely penalize the total aircraft weight and performance by dramaticallyincreasing the wing weight.
The unique advantages of a strut-braced configuration can be best understood bytracing the design evolution from a cantilever configuration:
• The low wing weight is made possible by a novel structural concept allowing thestrut to be inactive in compression, and by optimizing the strut force at the 2.5 gmaneuver load condition.
• The increased structural efficiency provided by the strut can be utilized to reducethe wing weight significantly with a nearly constant span, or the span can beincreased to reduce the drag with a smaller wing weight savings.- With tip-mounted engines, the span remains under 200 ft., and the wing
weight is reduced by 30% relative to the advanced technology cantileverconfiguration.
- With under-wing engines, the span is increased to 259 ft., with a wing weightreduction of 14% relative to the advanced technology cantilever configuration.
• The wing t/c can be reduced without a large wing weight penalty.• The smaller t/c allows some unsweeping of the wing without a wave drag penalty.• Lower weight and increased span reduce the induced drag.• The amount of laminar flow is increased for three reasons, which reduces the
parasite drag:- Unsweeping the wing reduces the cross-flow instability.- A higher aspect ratio means smaller chords and smaller Reynolds numbers.- Decreasing the t/c allows for more favorable pressure gradients and delays the
shock formation.
48
• The taxi bump load condition imposes a natural upper limit on the span. For thetip-mounted engine configuration, the span is 198.9 ft. If the spanwise position ofthe engines is allowed to be a design variable, the span increases to 258.7 ft.
• According to the low-speed Hoerner interference drag equations, the wing-strutinterference drag is proportional to (t/c)3 and c2, where the t/c and chord are theaverage values of the wing and strut. The optimum designs featured a wing andstrut t/c of 5% at the wing-strut intersection, and relatively small chords.Therefore the wing-strut interference drag was predicted to be almost negligible.Future research will evaluate the transonic effects of the wing-strut intersectionusing CFD.
The final result is a synergistic increase in overall aircraft efficiency and a significantreduction in the takeoff gross weight, as shown in Table 7-1.
Table 7-1: Configuration summary
Current Technology Cantilever
Advanced Technology Cantilever
SS with Tip Engines
SS with Under-Wing Engines
Wing Span (ft) 199.9 206.6 198.9 258.7
Aspect Ratio 8.7 9.8 10.3 20.5
Wing Sweep (deg) 31.6 36.7 27.3 24.5
Cruise L/D 18.8 21.7 24.4 27.8
Takeoff Gross Weight (lb) 632,081 568,031 488,990 481,236
7.2. Conclusions
The preliminary optimization studies were performed with a single-strut-braced wing,which is the most basic truss-braced configuration. The advantages relative to theadvanced technology cantilever configuration are summarized in Table 7-2.
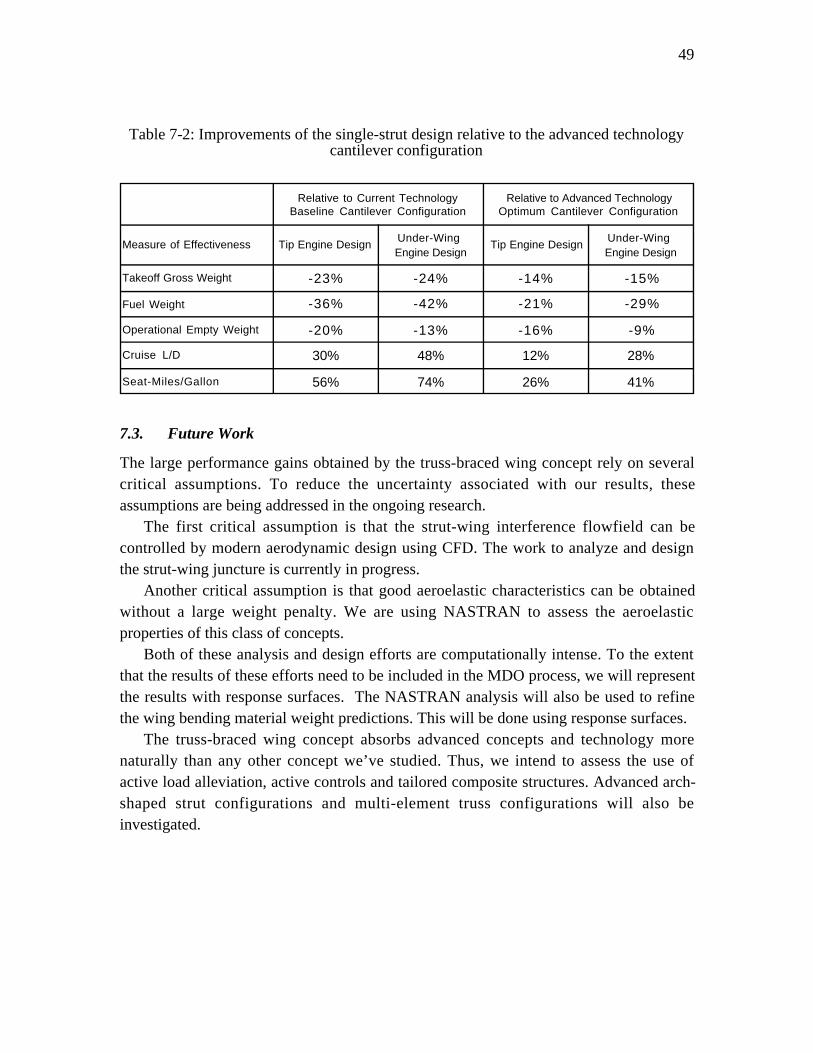
49
Table 7-2: Improvements of the single-strut design relative to the advanced technologycantilever configuration
Relative to Current Technology Baseline Cantilever Configuration
Relative to Advanced Technology Optimum Cantilever Configuration
Measure of Effectiveness Tip Engine DesignUnder-Wing Engine Design
Tip Engine DesignUnder-Wing Engine Design
Takeoff Gross Weight -23% -24% -14% -15%
Fuel Weight -36% -42% -21% -29%
Operational Empty Weight -20% -13% -16% -9%
Cruise L/D 30% 48% 12% 28%
Seat-Miles/Gallon 56% 74% 26% 41%
7.3. Future Work
The large performance gains obtained by the truss-braced wing concept rely on severalcritical assumptions. To reduce the uncertainty associated with our results, theseassumptions are being addressed in the ongoing research.
The first critical assumption is that the strut-wing interference flowfield can becontrolled by modern aerodynamic design using CFD. The work to analyze and designthe strut-wing juncture is currently in progress.
Another critical assumption is that good aeroelastic characteristics can be obtainedwithout a large weight penalty. We are using NASTRAN to assess the aeroelasticproperties of this class of concepts.
Both of these analysis and design efforts are computationally intense. To the extentthat the results of these efforts need to be included in the MDO process, we will representthe results with response surfaces. The NASTRAN analysis will also be used to refinethe wing bending material weight predictions. This will be done using response surfaces.
The truss-braced wing concept absorbs advanced concepts and technology morenaturally than any other concept we’ve studied. Thus, we intend to assess the use ofactive load alleviation, active controls and tailored composite structures. Advanced arch-shaped strut configurations and multi-element truss configurations will also beinvestigated.
50
References
[1] Pfenninger, W., “Design Considerations of Large Subsonic Long Range TransportAirplanes with Low Drag Boundary Layer Suction,” Northrop Aircraft, Inc.,Report NAI-54-800 (BLC-67), November 1954.
[2] Smith, P.M., DeYoung, J., Lovell, W.A., Price, J.E., and Washburn, G.F., “AStudy of High-Altitude Manned Research Aircraft Employing Strut-BracedWings of High-Aspect-Ratio,” NASA-CR-159262, February, 1981.
[3] Turriziani, R.V., Lovell, W.A., Martin, G.L., Price, J.E., Swanson, E.E., andWashburn, G.F., “Preliminary Design Characteristics of a Subsonic Business JetConcept Employing an Aspect Ratio 25 Strut-Braced Wing,” NASA CR-159361,Oct., 1980.
[4] Jobe, C.E., Kulfan, R.M., and Vachal, J.D., “Wing Planforms for Large MilitaryTransports,” AIAA-78-1470, 1978.
[5] Gunston, B., Giants of the Sky: The Biggest Aeroplanes of All Time, PatrickStephens Limited, pp. 249-250.
[6] Patterson, J.C., and Bartlett, G.R., “Evaluation of installed Performance of aWing-Tip-Mounted Pusher Turboprop on a Semispan Wing,” NASA TechnicalPaper 2739, 1987.
[7] Miranda, L.R., and Brennan, J.E., “Aerodynamic Effects of Wingtip-MountedPropellers and Turbines,” AIAA-86-1802, 1986.
[8] Englar, R.J. and Williams, R.M., “Design of a Circulation Control Stern Plane forSubmarine Applications,” March 1971, NSRDC Tech. Note AL-200 (AD901-198), Naval Ship Research and Development Center, Bethesda, MD.
[9] Vanderplaats Research & Development, Inc., DOT User's Manual, Version 4.20,Colorado Springs, CO, 1995.
[10] McCullers, L.A., FLOPS User’s Guide, Release 5.81. Text file included with theFLOPS code.
[11] Dudley, J., Huang, X., MacMillin, P.E., Grossman, B., Haftka, R.T., and Mason,W.H., “Multidisciplinary Optimization of the High-Speed Civil Transport,”AIAA-95-0124, January, 1995.
[12] Grasmeyer, J.M., “Truss-Braced Wing Code Description and User’s Manual,”VPI-AOE-255, January, 1998.
51
[13] Hoak, D.E. et al., USAF Stability and Control DATCOM , Flight Control Division,Air Force Flight Dynamics Laboratory, WPAFB, Ohio, 1978.
[14] Grasmeyer, J.M., “A Discrete Vortex Method for Calculating the MinimumInduced Drag and Optimum Load Distribution for Aircraft Configurations withNoncoplanar Surfaces,” VPI-AOE-242, January, 1997.
[15] Braslow, A.L., Maddalon, D.V., Bartlett, D.W., Wagner, R.D., and Collier, F.S.,“Applied Aspects of Laminar-Flow Technology,” Viscous Drag Reduction inBoundary Layers, AIAA, Washington D.C., 1990, pp. 47-78.
[16] Mason, W.H., “Analytic Models for Technology Integration in Aircraft Design,”AIAA-90-3262, September, 1990.
[17] Malone, B. and Mason, W.H., “Multidisciplinary Optimization in Aircraft DesignUsing Analytic Technology Models,” Journal of Aircraft, Vol. 32, No. 2, March-April 1995, pp. 431-438.
[18] Hoerner, S.F., Fluid-Dynamic Drag, published by Mrs. Hoerner, 1965. Currentaddress: P.O. Box 65283, Vancouver, WA 98665. Phone: (206)576-3997.
[19] Roskam, J., Methods for Estimating Stability and Control Derivatives ofConventional Subsonic Airplanes, Roskam Aviation and EngineeringCorporation, Lawrence, Kansas, 1971.
[20] Grasmeyer, J.M., “Stability and Control Derivative Estimation and Engine-OutAnalysis,” VPI-AOE-254, January, 1998.
[21] Mattingly, J.D., Heiser, W.H., and Daley, D.H., Aircraft Engine Design, AIAA,Washington D.C., 1987.
[22] Naghshineh-Pour, A.H., “Preliminary Structural Analysis of a Truss-BracedWing,” VPI-AOE-256, January, 1998.
[23] Coster, J.E., and Haftka, R., “Preliminary Topology Optimization of a Truss-Braced Wing,” December 1996.
[24] Torenbeek, E., “Development and Application of a Comprehensive, Design-Sensitive Weight Prediction Method for Wing Structures of Transport CategoryAircraft,” Delft University of Technology, Report LR-693, Sept. 1992.
[25] Kulfan, R.M., and Vachal, J.D., “Wing Planform Geometry Effects on LargeSubsonic Military Transport Airplanes,” Boeing Commercial Airplane Company,AFFDL-TR-78-16, Feb. 1978.
[26] Steinbrenner, J.P., and Chawner, J.R., “The GRIDGEN Version 8 – MultipleBlock Grid Generation Software”, MDA Engineering, Inc., May 1993.
[27] “GASP Version 3 – The General Aerodynamic Simulation Program –Computational Flow Analysis Software for the Scientist and Engineer – User’sManual”, Aerosoft, Inc., May 1996.
52
[28] Rosen, B.S., “Method to Predict External Store Carriage Characteristics atTransonic Speeds”, NASA CR-4170, August 1988.
[29] Frink, N.T., Pirzadeh, S., and Parikh, P., “An Unstructured-Grid Software Systemfor Solving Complex Aerodynamic Problems”, NASA CP-3291, May 1995.
[30] Pirzadeh, S., “Structured background Grids for Generation of Unstructured Gridsby Advancing-Fron Method”, AIAA Journal, Vol. 31, February 1993, pp. 257-265.
[31] Pirzadeh, S., “Viscous Unstructured Three-Dimensional Grids by the Advancing-Layers Method”, AIAA Paper 94-0417, 1994.
[32] Pirzadeh, S., “Three-Dimensional Unstructured Viscous Grids by the Advancing-Layers Method”, AIAA Journal, Vol. 34, January 1996, pp. 43-49.
[33] Pirzadeh, S., “Progress Towards a User-Oriented Unstructured Viscous GridGenerator”, AIAA Paper 96-0031, 1996.
[34] Frink, N.T., Parikh, P., and Pirzadeh, S., “A Fast Upwind Solver for the EulerEquations on Three-Dimensional Unstructured Meshes”, AIAA Paper 91-0102,1991.
[35] Sexstone, M.G., Private Communication, Systems Analysis Branch, AeronauticsSystems Analysis Division, NASA Langley Research Center, Hampton, VA23681-0001.