Embed Size (px)
Citation preview

MULTIDIMENSIONAL SCALING:AN INTRODUCTION
Workshop in MethodsIndiana UniversityDecember 7, 2012
William G. JacobyDepartment of Political Science
Michigan State University
Inter-university Consortium for Political and Social ResearchUniversity of Michigan
I. Basic Objectives of Multidimensional Scaling (MDS)
A. MDS produces a geometric model of proximities data
1. Start with data on similarities (or dissimilarities) among a set of stimulusobjects.
2. MDS represents each stimulus as a point within a space.
3. Similarities are represented by interpoint distances— greater similarity be-tween two stimuli is shown by a smaller distance between the two pointsrepresenting those stimuli.
B. Hopefully, the point configuration produced by MDS will make sense in substan-tive terms.
1. Clusters of points may correspond to groups of stimuli that are distinct fromeach other in terms of their characteristics.
2. Directions within the space may correspond to properties and characteristicsthat differentiate among stimuli.
C. A simple (but real) example, using 2004 electorate perceptions of prominent po-litical figures.
1. Input data are contained within a square, symmetric, matrix of perceptualdissimilarities.
2. Dissimilarities data are represented almost perfectly by a two-dimensionalpoint configuration.
3. Geometric model can be interpreted very easily, even without any informationabout the MDS procedure that produced the “map.”

Multidimensional Scaling2012 WIM Workshop, Indiana UniversityPage 2
D. In general, MDS is a very useful and flexible strategy for discerning structurewithin data.
II. Utility of MDS for Social Research
A. Dimension reduction
1. Each of k stimulus objects has a “profile” consisting of its values across qvariables (note that q can be a very large number)
2. In principle, could use the variables that make up the profiles as coordinateaxes, to plot k points (representing the stimuli) in q-dimensional space.
3. Unfortunately, we encounter the “curse of dimensionality” if q is larger thantwo (or maybe three)
4. Instead, use MDS to determine whether the information contained withinq dimensions can be summarized adequately in a much lower-dimensioned,m-dimensional space
5. If m is a sufficiently small positive integer, such as two or three, we can drawa picture which plots the stimulus points within the m-dimensional space
6. Hopefully, the relative positions of the stimulus points will “make sense” insubstantive terms, and summarize the important ways that the stimuli differfrom each other.
B. In survey research contexts, MDS is very useful for modeling respondent percep-tions.
1. Survey questions usually ask respondents to:
a. Provide affective responses to stimuli (e.g., issue positions)
b. Make preferential choices among stimulus objects (e.g., presidential can-didates)
c. Evaluate stimuli according to specified criteria (e.g., place themselves, po-litical parties, and/or candidates along a liberal-conservative continuum).
2. Interpretation of survey responses usually presupposes that respondents’ be-liefs about the stimuli conform to the researcher’s prior expectations. Thisis not always the case:
a. Respondents may not perceive stimuli (e.g., issue alternatives or candi-dates for public office) in the same manner.
b. Respondents may not actually use the evaluative criteria that are of inter-est to the researcher (e.g., they may not think about politics in ideologicalterms).
3. MDS provides empirical evidence about respondents’ perceptual structuresand the evaluative criteria they actually employ when thinking about thestimuli in question.
Multidimensional Scaling2012 WIM Workshop, Indiana UniversityPage 3
C. Theory Testing
1. Many social scientific theories can be recast in terms of spatial models
2. Could apply MDS to appropriate data in order to estimate the parametersof the relevant spatial model, and determine whether the empirical resultscomform to the theory-based predictions.
D. Many different variations of MDS, most of which are relevant for survey research.
1. Classical MDS (sometimes shown as “CMDS”) assumes one set of inputdata and produces one geometric representation (i.e., it assumes homogeneityacross all respondents).
2. Weighted MDS (sometimes shown as “WMDS”) allows for individual differ-ences in perceptions of a common set of stimuli (i.e., allows dimensions tohave greater or lesser “importance” for different subsets of respondents).
3. Unfolding models (sometimes called “ideal points models”) can represent re-spondent’s preferential choices among the stimuli (i.e., respondents shown asa second set of points in the same space; greater preference for a stimuluscorresponds to smaller distance between points representing that respondentand that stimulus).
E. Not too demanding of the input data.
1. There are many different measures of dissimilarity that can be employed asinput data.
2. Nonmetric MDS only requires ordinal-level input data (though it still pro-duces metric, or interval-level output).
F. A very useful measurement tool
1. Can produce interval-level measurement of respondent characteristics andevaluative criteria, using only ordinal-level response data.
2. Again, this is important because it enables researcher to investigate empiri-cally (rather than merely assume)the judgmental standards that respondentsbring to bear on stimuli.
G. Main results of MDS are graphical in nature and, therefore, usually quite easy tointerpret.
1. Researchers can often discern structure that would otherwise remain hiddenin complex data.
2. The graphical output from MDS can be used very easily to convey analyticresults to lay audiences and clients.
Multidimensional Scaling2012 WIM Workshop, Indiana UniversityPage 4
III. Metric Multidimensional Scaling
A. A very simple example, using mileage distances between cities. We will begin bycarrying out a familiar task:
1. Start with a map, which illustrates the relative geographic locations of a setof American cities.
2. The map is a geometric model in which cities are represented as points intwo-dimensional space. The distances between the points are proportional tothe geographic proximities of the cities.
3. Using the map/model it is easy to construct a square matrix containing thedistances between any pair of cities.
4. The matrix, itself, is analogous to the mileage chart that is often includedwith road maps.
B. MDS “reverses” the preceding task.
1. MDS uses the matrix of distances (i.e., the “mileage chart”) as input data.
2. The output from MDS consists of two parts:
a. A model showing the cities as points in space, with the distances betweenthe points proportional to the entries in the input data matrix (i.e., amap).
b. A goodness-of-fit measure showing how closely the geometric point con-figuration corresponds to the data values from the input data matrix.
C. Basic definitions and nomenclature.
1. While we typically say that MDS models proximities, we usually assume thatthe input data are dissimilarities.
a. Dissimilarities are the “opposite” of proximities in that larger data valuesindicate that two objects are ‘less proximal to each other.
b. While admittedly a bit confusing, the use of dissimilarities guarantees thatdata values are directly (rather than inversely) related to the distances inthe MDS solution.
c. Proximities can always be converted to dissimilarities by subtracting themfrom an arbitrary constant, and vice versa.
2. Information about the proximities between all possible pairs of k stimulusobjects is contained in a square, symmetric, matrix of order k. This matrixis called ∆, with cell entry δij giving the dissimilarity between the ith and jth
stimuli.
Multidimensional Scaling2012 WIM Workshop, Indiana UniversityPage 5
3. The number of dimensions in the MDS solution is shown as m.
a. In principle, m can be any integer from 1 to k -1. Larger values of m arepossible, but unnecessary.
b. Ideally, k is a very small integer (i.e., 1, 2, or 3). This is useful becausethe MDS results can be presented very easily in pictorial form.
4. The first part of the MDS output (i.e., the “map” of the stimulus points)consists of the k by m matrix, X. Each cell entry in X, shown as xip, showsthe coordinate of the point representing stimulus i along the pth dimensionwithin the m-dimensional space produced by the MDS solution.
5. In the simplest form of metric MDS, the dissimilarities between the stimuliare assumed to be equal to the interpoint distances in m-dimensional space(which are, themselves, shown as “dij” for the distance between the pointsrepresenting stimuli i and j ):
δij = dij = [m∑p=1
(xip − xjp)2]0.5
D. Restating the objective of the MDS: Find X, using only the information in ∆.
E. Procedure for metric MDS (developed by Warren S. Torgerson).
1. “Double-center” the ∆ matrix, producing a new matrix, ∆∗, with cell entriesδ∗ij.
a. Double-centering is a simple transformation which changes ∆ so that therow means, the column means, and the grand mean of the entries in thenew matrix, ∆∗ are all equal to zero.
b. The formula for double-centering is simple, but not particularly informa-tive. For each cell in the ∆ matrix, create the corresponding entry in ∆∗
by carrying out the following operation:
δ∗ij = −0.5(δ2ij − δ2i. − δ2.j + δ2..)
2. Perform an eigendecomposition on ∆∗ as follows:
∆∗ = V Λ2V ′
Where V is the matrix of eigenvectors and Λ2 is the diagonal matrix of eigen-values.
3. Define X as follows, using only the first m eigenvectors and eigenvalues:
X = V Λ
Multidimensional Scaling2012 WIM Workshop, Indiana UniversityPage 6
4. Plot k points representing the rows of X within an m-dimensional coordinatesystem defined by the columns of X. This is the MDS “map.”
5. Defining a goodness of fit measure.
a. The eigendecomposition is variance-maximizing. That is, each successivedimension (i.e., eigenvector) “explains” the maximum amount of varianceremaining in the data, after taking any previous dimensions into account.
b. The eigenvalues measure the variance explained by each dimension, andthe sum of the eigenvalues is equal to the variance of the entries in ∆∗.
c. The proportion of variance accounted for by the m dimensions in theMDS solution is given by the sum of the first m eigenvalues, divided bythe sum of all eigenvalues (there will usually be k nonzero eigenvalues):
Metric MDS Fit =
∑mp=1 λ
2p∑k
p=1 λ2p
F. Important analogy: Metric MDS is accomplished by performing a principal com-ponents analysis on the double-centered dissimilarities matrix.
1. Using the results provided above, we can present the metric MDS solution asfollows:
∆∗ = XX ′
2. The preceding equation shows that we can think of metric MDS as a matrixoperation that is analogous to taking the square root of a scalar number.(Note, however, that this operation is not taking the square root of the ∆∗
matrix; that is a completely different matrix operation).
IV. A Critically Important Idea: Generalizing the Applicability
A. If MDS works with physical distances, it should also work with “conceptual dis-tances.”
B. A new example.
1. Use the same set of ten American cities as stimuli
2. Define dissimilarities in terms of social, economic, and cultural differencesamong the cities.
a. Places Rated Almanac evaluates cities on a variety of criteria.
b. For each pair of cities, take the sum of squared differences of their scoresacross the criteria. Optionally, take the square root.
c. Result is called a “profile dissimilarity” measure.
C. Simply perform metric MDS on matrix of profile dissimilarities.
Multidimensional Scaling2012 WIM Workshop, Indiana UniversityPage 7
D. Potential problem: Dimensionality is not known in advance.
1. General idea: Each additional dimension in the MDS solution explains morevariance in the dissimilarities data. Use only as many dimensions as arenecessary to obtain a satisfactory amount of explained variance.
2. Proceed by examining eigenvalues. The basic idea is that “meaningful” di-mensions should account for variance in the dissimilarities data. Therefore,the dimensionality of the solution should be equal to the number of eigenvec-tors that have “large” eigenvalues.
3. A graphical approach is often used to evaluate dimensionality.
a. A scree plot graphs eigenvalues against the corresponding dimension num-ber. Adjacent points in the scree plot are connected with line segments.
b. Look for an “elbow” in the scree plot. Dimensionality corresponds to thenumber of dimensions that falls just prior to the elbow.
4. There is often a trade-off between low dimensionality (which enhances visu-alization of the solution) and explained variance (which creates a model thatmore accurately reproduces the entries in the dissimilarities data.
E. MDS of conceptual dissimilarities can often be used to discern substantively in-teresting patterns and structures in the point configuration. This is particularlythe case when the dimensionality of the MDS solution is small enough to facilitatea graphical representation of the stimuli.
V. Measurement Level: A Potential Problem
A. Conceptual dissimilarities (e.g., survey respondents’ judgments about the similar-ities of stimuli) are often measured at the ordinal level.
B. In fact, often not a problem at all. Note that it is always the analyst who deter-mines the measurement level of the data.
C. Could perform MDS on ordinal data, simply “pretending” those data are mea-sured at the interval level.
1. Going back to the intercity distances, we can use the rank-order of the dis-tances between cities, rather than the actual mileages.
2. Metric MDS of the rank-ordered distances produces a solution that is virtuallyidentical to that obtained from the mileage data.
D. The preceding approach is problematic (even though it often works quite well).
1. It really is “cheating” with respect to the characteristics of the data.
2. The rank-ordered data matrix involves an implicit assumption that the amountof dissimilarity is uniform across all stimulus pairs.
Multidimensional Scaling2012 WIM Workshop, Indiana UniversityPage 8
E. Much more satisfactory solution: Develop an MDS method that uses only theordinal properties of the dissimilarities data (and still produces a map of thestimuli with interval-level measurement of distances between points).
VI. Nonmetric Multidimensional Scaling: The Basic Idea
A. General objective of nonmetric MDS
1. Find a configuration of stimulus points in m dimensions such that the inter-point distances are monotonically related to the dissimilarities.
2. In other words, as dissimilarities between pairs of stimuli increase, the dis-tances between the respective point pairs representing the two stimuli neverdecrease. Beyond this simple criterion, there is no limitation on the relation-ship between dissimilarities within the input data and distances in the MDSsolution.
3. The monotonic relationship between dissimilarities and scaled distances canbe shown formally, as follows (i, j, q, and r are stimulus objects and, asbefore, δ represents a pairwise dissimilarity while d represents the scaleddistance between two points):
If δij < δqr then dij ≤ dqr
B. Nonmetric MDS requires a new procedure for obtaining the solution.
1. Recall that metric MDS employed a variance-maximizing procedure whichadded dimensions, if necessary, to account for a satisfactory amount of vari-ance in the dissimilarities data.
2. The concept of “variance” is undefined for ordinal data, so a variance-maximizingsolution strategy cannot be used in nonmetric MDS.
3. Instead, specify dimensionality and obtain a complete MDS solution in aspace with the hypothesized number of dimensions. If the scaled configurationof points is “sufficiently monotonic” with respect to the dissimilarities, theanalysis is complete. If there are too many violations of the monotonicityrequirement (that is, δij < δqr but dij > dqr), then increase the dimensionalityand try again.
4. To obtain a nonmetric solution, tentatively locate points in space of spec-ified dimensionality, then move them around until the interpoint distancescorrespond closely enough to dissimilarity information in data.
5. If the data conform to the assumptions of the MDS model, the final pointlocations will be tightly “constrained”; that is, they cannot be moved verymuch (relative to each other) without violating the monotonicity requirementfor the dissimilarity-distance relationship.

Multidimensional Scaling2012 WIM Workshop, Indiana UniversityPage 9
VII. Nonmetric Multidimensional Scaling: Intuitive (and Informal) Example
A. Example uses artificial data on perceptual dissimilarities among four presidentialcandidates.
1. Data could be obtained from a single respondent or, more likely, aggregated(e.g., averaged) across a larger sample of respondents.
2. Data can be arranged within a square symmetric matrix, as before. Cellentries rank-order the dissimilarities. With four candidates, there are sixdissimilarities; hence, values in the matrix cells range from one to six.
3. For this example, data will be presented differently. candidate pairs will bearrayed in order, from the least-dissimilar (or most similar) pair to the mostdissimilar (or least similar) pair.
4. Caveat: This example is used for instructional purposes only. NonmetricMDS should never be carried out with only four stimuli!
B. Start by attempting a unidimensional scaling solution.
1. Arrange candidate points along a number line such that points represent-ing more dissimilar pairs of candidates are located farther apart than pointsrepresenting less dissimilar candidate pairs.
2. The unidimensional MDS solution fails. It is impossible to locate pointsalong a single dimension in a way that reflects the dissimilarities among thecandidates.
C. Attempting a two-dimensional scaling solution.
1. Begin by locating candidate points randomly within two-dimensional space.
2. This random configuration will almost certainly not produce distances thatare monotonic to the dissimilarities.
3. The random point arrangement is merely a “starting configuration” for thetwo- dimensional MDS solution. The scaling procedure will move the pointsaround within the space until the distances are monotonic to the dissimilar-ities.
D. In order to guide the point movements, we will generate “target distances” foreach pair of stimulus points.
1. Target distances are usually called “disparities” in the MDS literature. Thetarget distance for the pair of points representing stimuli i and j is shown asd̂ij.
2. Target distances are compared against the current, scaled, distances betweenthe points representing i and j. If dij < d̂ij then the points need to be moved
farther apart from each other. If dij > d̂ij then the points need to be movedcloser together.
Multidimensional Scaling2012 WIM Workshop, Indiana UniversityPage 10
E. Disparities possess two important characteristics:
1. Disparities are as close as possible to the actual distances in the current MDSsolution.
2. Disparities are always monotonic to the input dissimilarities, even if the cur-rent distances are not.
F. Calculating disparities for the current MDS point configuration.
1. Sort the interpoint distances according to the dissimilarities between the cor-responding candidate pairs.
2. As we move downward through the sorted array (from least to most dissimilarpairs), the interpoint distances should never decrease. Anytime they do, it isa violation of the monotonicity requirement.
3. Rules for obtaining disparities:
a. Wherever possible, simply use the actual distance as the disparity.
b. When monotonicity is violated, take mean of adjacent distances untilmonotonicity is re-established.
c. When moving through the array of distances, the rule is “Compare for-ward and average backward.”
d. This procedure is called “Kruskal’s monotone regression.” The resultantdisparities are the values that come as close as possible (in the least-squares sense) to the current scaled distance, but which are still monotonicwith the input dissimilarities.
G. After calculating all disparities, move the points (using the comparison of thecurrent distances and the corresponding disparities to guide the movements) inorder to create a new configuration.
H. Calculate disparities for the new point configuration and, once again, move pointsusing the disparities as guides.
I. Repeat the process until no further point movements are necessary (i.e., dij = d̂ijfor all possible pairs of stimulus points, i and j). This implies that the scaleddistances are monotonic with the dissimilarities. Hence, it is a “perfect” scalingsolution.
J. The remarkable feature of the MDS solution is that the relative locations of thepoints are fairly tightly constrained within the two-dimensional space.
1. The relative positions of the points cannot be changed too much, withoutviolating the monotonicity requirement.
2. With only four points, the location constraints are not very “tight.”
3. As the number of points increases (relative to the dimensionality), the pointlocations become more tightly fixed, relative to each other.

Multidimensional Scaling2012 WIM Workshop, Indiana UniversityPage 11
VIII. Nonmetric Multidimensional Scaling: Application to “Real” Data
A. With real data, perfect MDS solutions are rare (but they do occur!).
1. Much more typical to obtain an MDS solution in which the interpoint dis-tances are nearly, but not perfectly, monotonic to the dissimilarities.
2. Therefore, it is necessary to develop a fit measure, which can be used to assessthe quality of the current MDS solution.
B. Kruskal’s Stress Coefficient (named for Joseph Kruskal, one of the pioneers ofnonmetric MDS)
1. With nonmetric MDS, we try to make the distances as close as possible tothe corresponding disparities.
2. This objective can be formalized by saying that we want to minimize thefollowing expression:
#pairs∑(dij − d̂ij)
2
3. However, the measurement units in the MDS solution are arbitrary, so wewill need to standardize the solution somehow.
4. It is also usually more convenient to deal with distances (and disparities)rather than squared distances.
5. Based upon the preceding considerations, Kruskal’s Stress1 coefficient is de-fined as follows:
Stress1 =
[∑#pairs(dij − d̂ij)2∑#pairs d2ij
]0.5
6. The Stress coefficient is a badness-of-fit measure.
a. Smaller values indicate better scaling solutions
b. The minimum value of Stress is zero.
7. Kruskal also developed a second Stress coefficient:
Stress2 =
[∑#pairs(dij − d̂ij)2∑#pairs(dij − d̄ij)2
]0.5
a. Stress2 provides the same kind of information as Stress1, although itsvalue will always be larger.
b. Stress2 does have a particularly convenient interpretation: It shows theproportion of the variance in the scaled distances that is inconsistent withthe monotonicity assumption.
C. The objective of nonmetric MDS is to find the configuration of points within agiven dimensionality that minimizes the Stress coefficient.
Multidimensional Scaling2012 WIM Workshop, Indiana UniversityPage 12
D. Many people are uncomfortable with a badness-of-fit measure like the Stress co-efficient. It is possible to develop goodness-of-fit measures, too.
1. Could take the Spearman rank correlation between the input dissimilaritiesand the scaled distances.
2. Could take the Pearson correlation between the disparities and the scaleddistances.
3. Either of the two preceding correlations can be used to assess the degree towhich the scaled distances are monotonic to the dissimilarities data.
E. The Shepard diagram, a graphical diagnostic tool.
1. The Shepard diagram (named after Roger Shepard, one of the pioneers ofnonmetric MDS) is a scatterplot of the scaled distances versus the inputdissimilarities.
2. The points in the Shepard diagram represent stimulus pairs.
3. The points in the Shepard diagram should conform to a monotonically-increasingpattern. A nonparametric regression curve (e.g., loess) can be fitted to thepoints in order to characterize the shape of the monotonic relationship.
F. Determining appropriate dimensionality for the MDS solution.
1. Analytic objective is to find a solution in the minimum number of dimensionsnecessary in order to accurately reproduce the input dissimilarities.
2. Substantive theory and prior hypotheses are often useful, particularly if thenumber of stimuli is relatively small.
3. As a more “objective” guide, create a scree plot.
a. Instead of the eigenvalues used in the metric MDS, substitute the Stressvalues obtained for nonmetric MDS solutions at increasing dimensionali-ties.
b. The assumption is that each additional “meaningful” dimension will pro-duce a substantial improvement in the consistency between input dissim-ilarities and scaled distances.
c. Look for the elbow in the scree plot, and take the number of dimensionsthat corresponds to it.
IX. Steps in a Nonmetric MDS Procedure
A. Most computer routines for nonmetric MDS work the same way, although thedetails differ from one program to the next.
1. This can affect the results of the MDS in that the point configuration gener-ated by one program will probably be slightly different from the point con-figuration produced by another program.

Multidimensional Scaling2012 WIM Workshop, Indiana UniversityPage 13
2. Note, however, that the differences are generally very small. They rarelyaffect the substantive conclusions that would be drawn from the analysis
B. Steps in a “generic” nonmetric MDS routine.
Step 1: Create a starting configuration of k stimulus points withinm-dimensionalspace.
1. A “random start” simply creates coordinates for the k points using arandom number generator.
2. A “rational start” uses a designated configuration (e.g., perhaps obtainedby performing a metric MDS on the ordinal dissimilarities, or derivedfrom prior substantive theory).
Step 2: Calculate Stress (or some other fit measure) for the starting point con-figuration.
Step 3: Calculate partial derivatives of Stress with respect to the km point co-ordinates, and use them to move the points, creating a new configuration.
1. Partial derivatives show the change in Stress that occurs when each pointcoordinate is changed by a minute amount.
2. Using the information provided by the partial derivatives, move the pointsto produce the maximum possible decrease in Stress.
3. If point movements would increase Stress, then do not move the points.
Step 4: Calculate Stress for the new point configuration.
1. If Stress = 0 then a perfect solution has been achieved. Proceed to Step5.
2. If Stress has not changed since the previous configuration, then the MDSsolution is not improving with the point movements. Proceed to Step 5.
3. If Stress for the new point configuration is smaller than Stress for theprevious point configuration, then the MDS solution is improving withthe point movements. Go back to Step 3 and proceed with further pointmovements.
Step 5: Terminate the MDS routine and print results.
1. Minimally, print the point coordinates and Stress value for the final pointconfiguration.
2. Most MDS routines also provide an “iteration history” showing the Stressvalue for each iteration.
3. Optionally, most MDS routines will plot the point configuration and theShepard diagram for the final scaling solution.
Multidimensional Scaling2012 WIM Workshop, Indiana UniversityPage 14
C. Interesting to note that the “formal” MDS routine described here and the infor-mal, intuitive approach used earlier produce virtually identical results! Why usethe formal approach if the informal strategy works just as well?
1. There is some subjectivity in the informal procedure which may affect finalresults (e.g., which pair of points should we move first?).
2. The computationally-intensive nature of the strategy makes the pencil-and-paper approach impractical for larger datasets (which are necessary in orderto obtain a well-constrained MDS solution).
3. The partial derivatives summarize the full set of movements for each pointcoordinate, making them much more efficient than the step-by-step series ofpairwise point movements employed in the informal approach.
X. Interpretation of MDS Results
A. Important to recognize that nonmetric MDS only determines the relative distancesbetween the points in the scaling solution. The locations of the coordinate axesare completely arbitrary.
1. The final MDS configuration is usually rotated to a varimax orientation (i.e.,it maximizes the variance of the point coordinates along each of the rectan-gular coordinate axes).
2. Point coordinate values are usually standardized along each axis— e.g., setto a mean of zero and a variance of 1.0 (or some other arbitrary value).
3. The axes are simply a device to “hang the points within the m-dimensionalspace. They have no intrinsic substantive importance or interpretation!
B. A big advantage of MDS is the simplicity of the underlying geometric model;therefore simply “eyeballing” the results is often sufficient for interpretation.
1. Look for interesting “directions” within the space, which may correspondto the substantive dimensions underlying the judgments that produced thedissimilarities in the first place.
2. Look for distinct groups or clusters of points, which may reveal how the datasource (presumably, a set of survey respondents) differentiates among thestimulus objects.
3. The subjectivity inherent in simple visual interpretation of MDS results makesit desirable to use more systematic (and, hopefully, “objective”) interpreta-tion methods.
Multidimensional Scaling2012 WIM Workshop, Indiana UniversityPage 15
C. Embedding external information in a point configuration
1. The researcher often has prior hypotheses about the dimensions that differ-entiate the stimuli. If so, then it is useful to obtain external measures of thesedimensions (i.e., obtained separately from the dissimilarities used to createthe MDS solution).
2. It is easy to embed the external information in the scaling solution by sim-ply regressing the external measure on the point coordinates. The estimatedregression coefficients can be used to draw a new axis within the space, cor-responding to the external measure.
3. This strategy is useful for determining whether the MDS results conform toprior expectations.
D. Cluster analysis provides an objective strategy for identifying groups of stimuluspoints within the MDS solution; the analyst can then determine whether theclusters correspond to substantively-interesting groups of stimuli.
1. There are many varieties of cluster analysis. They all work by joining “sim-ilar” objects together into “clusters.” Hierarchical clustering methods aremost common.
2. Begin by considering each stimulus as a separate cluster. Create a new clusterby joining together the two stimuli whose points are closest to each otherwithin the m-dimensional space. Once joined, they are considered a singlecluster (the separate stimuli are no longer distinguished from each other).The location of this cluster is some summary of the locations of the originaltwo stimulus points (e.g., perhaps the mean of their coordinates along eachaxis in the space).
3. Proceed through k steps. On each step, join together the two most similarclusters to form a new cluster. Continue until all k objects are together in asingle cluster.
4. A dendrogram (or tree diagram) traces out the process of joining clusters andis usually considered the main output from a cluster analysis.
E. Be aware that most MDS solutions are amenable to several different substantiveinterpretations.
1. Objective strategies can be used to show that the scaling results are consistentwith some particular interpretation of the space.
2. Objective methods can never be used to find the single “true” meaning of theMDS-produced point configuration.
3. While this uncertainty bothers some researchers, it is really no different fromthe general scientific approach of theory construction and revision throughempirical hypothesis-testing.

Multidimensional Scaling2012 WIM Workshop, Indiana UniversityPage 16
XI. Data for MDS
A. Distinguish between rectangular (or “multivariate”) data and square (or “prox-imities”) data.
1. The difference between the two does not involve the physical shape of thedata matrix.
2. With rectangular data, the rows and columns of the data matrix are separateobjects (usually, observations and variables, respectively— hence, “multivari-ate” data).
3. With square data, the rows and columns of the data matrix are the sameobjects.
B. MDS usually used with square data
1. Entries in a square data matrix show the degree to which row and columnobjects “match” or “correspond to” each other.
2. Matching/correspondence information is reflected to create the dissimilaritiesthat are employed as input to MDS.
C. Even though we call the input data “dissimilarities”, MDS can actually handleany type of data that can be interpreted as a distance function.
1. Many kinds of information can be interpreted as distances.
2. This leads to one of the strong features of MDS— its ability to analyze manydifferent kinds of data.
D. Assume that D is some function that applies to pairs of objects, say a and b. Dis a distance function if the following four properties hold for all possible pairs ofobjects in a given set of objects:
1. D(a, b) ≥ 0 (Non-negativity)
2. D(a, a) = 0 (Identity)
3. D(a, b) = D(b, a) (Symmetry)
4. D(a, b) +D(a, c) ≥ D(b, c) (Triangle inequality)
E. Many different types of data can be interpreted as distance functions.
1. Direct dissimilarity judgments.
a. Could have respondents sort pairs of stimuli according to their perceivedsimilarity.
b. Could have respondents rate similarity of stimulus pairs on some pre-defined scale, and take mean similarity ratings.
Multidimensional Scaling2012 WIM Workshop, Indiana UniversityPage 17
2. Various profile dissimilarity measures.
a. Profile dissimilarities measure how different stimuli are across a “profile”of characteristics.
b. Common example in survey research is “sum of squared differences”. As-sume that n survey respondents rate objects a and b. If the ratings arecalled Ra and Rb, then the dissimilarity of the two stimuli could be mea-sured by the following:
δab =n∑
i=1
(Ria −Rib)2
3. Measures of temporal stability (from panel data)
a. Assume a variable with k categories, measured at two time points.
b. The proportion of respondents who move from one category to the otherover the time interval can be interpreted as the similarity of the twocategories.
4. Theory-based measures of spatial separation.
a. For example, the number of characteristics shared by a pair of respondents(or by two subsets of respondents).
b. The line-of-sight dissimilarity measure developed by Rabinowitz uses thetriangle inequality to convert rating scale responses toward k stimuli intoa matrix of dissimilarities among those stimuli.
5. Correlation coefficients
a. In fact, the correlation coefficient is usually problematic as a dissimilar-ity measure, because it measures the angular separation of two variablevectors, rather than the distance between two points.
b. With certain assumptions, correlations can be converted into dissimilari-ties in various ways (e.g., define δij = 1 − rij).
XII. Potential Problems That Might Occur in an MDS Analysis
A. Too few stimuli in a nonmetric MDS
1. With nonmetric MDS, a fairly large number of stimuli is necessary so thatthe pairwise dissimilarities impose enough restrictions to guarantee that thepoint locations are tightly constrained within the m-dimensional space.
2. Too few stimuli result in unconstrained scaling solutions and, potentially,meaningless results.

Multidimensional Scaling2012 WIM Workshop, Indiana UniversityPage 18
3. General guidelines for the number of stimuli in nonmetric MDS:
a. Never use less than eight stimuli
b. The number of stimuli should always be at least four times the numberof dimensions (and, preferably, more than that).
B. In nonmetric MDS, local minima.
1. The Stress function temporarily may stop decreasing with point movements.In such cases, the MDS software might mistakenly conclude that the “best”solution has been achieved.
2. A local minimum is signalled by a meaningless point configuration accompa-nied by a high Stress value.
3. The problem can usually be fixed by forcing the program to continue iterating.
4. Local minima are not very common with rational starting configurations(which are used by most modern MDS software).
C. Degenerate solutions in nonmetric MDS
1. If the k stimuli in an MDS analysis can be divided into two (or more) com-pletely disjoint subsets, then the scaling solution often causes the stimuluspoints within each subset to converge to a single position. As a result, itis impossible to differentiate between the objects within each subset in thescaling solution.
2. If there are enough stimuli, it might be better to perform MDS separately oneach of the subsets.
3. Even one stimulus that exists “in between” the disjoint subsets can be usedto overcome the degeneracy.
D. MDS terminology is not standardized, so it can be very confusing.
1. For example, the type of metric MDS shown here is sometimes called “classicalscaling” and distinguished from other metric MDS procedures which assumeinterval- level dissimilarities data.
2. WMDS is sometimes called “individual differences scaling,” or “INDSCAL.”
3. Multidimensional scaling, itself, is sometimes called “SSA” or “Smallest SpaceAnalysis” (after a slightly different algorithm and a series of computer pro-grams written by Louis Guttman and James Lingoes).
4. The best advice is to read the program documentation very carefully!
Multidimensional Scaling2012 WIM Workshop, Indiana UniversityPage 19
XIII. Brief Comparison to Factor Analysis
A. Speaking very generally, objectives of factor analysis (FA) are similar to those ofMDS
1. Both procedures analyze a matrix of proximity data.
a. In MDS, proximities are dissimilarities among stimuli.
b. In FA, proximities are correlations between variables.
2. Both procedures represent objects in multidimensional space.
a. MDS locates points representing stimuli
b. FA locates vectors representing variables.
B. MDS and FA differ in the type of model they produce to to represent the inputproximities.
1. MDS represents proximities (dissimilarities) as distances between stimuluspoints.
2. FA represents proximities (correlations) as angles between vectors represent-ing the variables.
C. Speaking very informally, MDS and FA are used to model somewhat differentkinds of phenomena.
1. FA is used to explain why the values of variables tend to go up and downtogether.
2. MDS is used to explain why objects “match” or “coincide with” each other.
D. Some practical differences between MDS and FA
1. The proximity model of MDS is simpler (and, therefore, usually easier tounderstand and convey) than the scalar products model of FA.
2. The assumptions underlying an MDS analysis are usually less stringent thanthose required for FA.
3. FA is really only applicable to correlations, while MDS can be used with manytypes of dissimilarities.
4. When applied to the same data, MDS often produces solutions in lower di-mensionality than factor analysis.

Multidimensional Scaling2012 WIM Workshop, Indiana UniversityPage 20
XIV. Weighted Multidimensional Scaling (A Brief Introduction)
A. WMDS is useful when there are several dissimilarities matrices (of the same stim-uli), obtained from several different data sources (e.g., different subjects in anexperiment, different subsets of survey respondents, surveys taken at differenttime points, etc.)
1. The most common WMDS model assumes that all data sources use the sameset of dimensions to evaluate the stimuli.
2. However, the salience or importance of each dimension can vary from onedata source to the next.
B. Stimuli are located in space, with weighted Euclidean distances used to representthe data sources’ dissimilarities among the stimulus objects.
1. For data source s, the dissimilarity between stimuli i and j (represented byδijs) is modeled as follows:
δijs =
m∑p=1
w2sp(xip − xjp)
2
0.5
2. For data source s, the coordinate of stimulus i along dimension p is wspxip.
C. The weights “stretch” or “shrink” the dimensions of the MDS space differentlyfor each data source.
1. The more salient a dimension for a data source, the more that dimensionis stretched, relative to the other dimensions, and vice versa for less salientdimensions.
2. Because the stretching/shrinking differs across data sources, it distorts thespace into a different form for each data source.
D. Routines for estimating the parameters of the WMDS model generally employan “alternating least squares” procedure that successively estimates the dimen-sion weights and the point coordinates. The first version of this procedure wasdeveloped by J. D. Carroll and J. J. Chang
E. Output from a WMDS routine.
1. Iteration history and fit measure for the final scaling solution.
2. Point coordinates (and, optionally a graph) showing the stimulus locationsin a space with all dimensions weighted equally.
3. Dimension weights.
a. These are usually plotted as vectors, relative to the dimensions of theMDS solution (i.e. the same dimensions used to plot the stimulus points).
b. Each vector summarizes the dimension weights for a single data source.
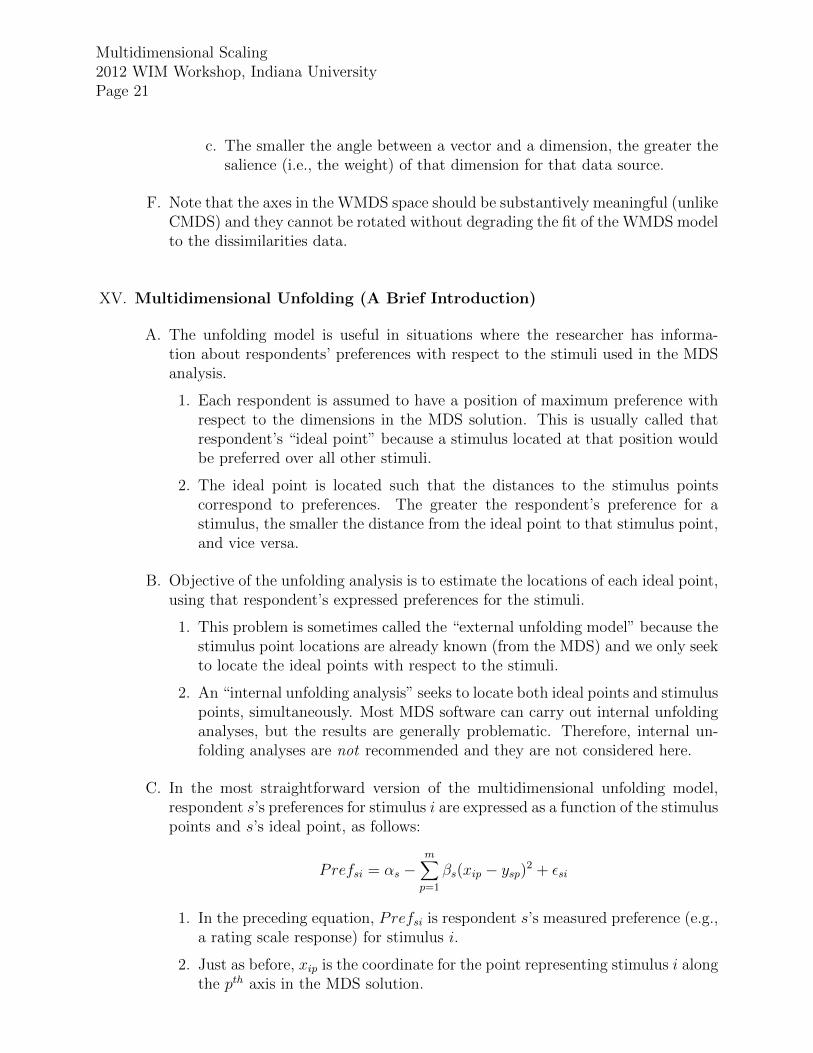
Multidimensional Scaling2012 WIM Workshop, Indiana UniversityPage 21
c. The smaller the angle between a vector and a dimension, the greater thesalience (i.e., the weight) of that dimension for that data source.
F. Note that the axes in the WMDS space should be substantively meaningful (unlikeCMDS) and they cannot be rotated without degrading the fit of the WMDS modelto the dissimilarities data.
XV. Multidimensional Unfolding (A Brief Introduction)
A. The unfolding model is useful in situations where the researcher has informa-tion about respondents’ preferences with respect to the stimuli used in the MDSanalysis.
1. Each respondent is assumed to have a position of maximum preference withrespect to the dimensions in the MDS solution. This is usually called thatrespondent’s “ideal point” because a stimulus located at that position wouldbe preferred over all other stimuli.
2. The ideal point is located such that the distances to the stimulus pointscorrespond to preferences. The greater the respondent’s preference for astimulus, the smaller the distance from the ideal point to that stimulus point,and vice versa.
B. Objective of the unfolding analysis is to estimate the locations of each ideal point,using that respondent’s expressed preferences for the stimuli.
1. This problem is sometimes called the “external unfolding model” because thestimulus point locations are already known (from the MDS) and we only seekto locate the ideal points with respect to the stimuli.
2. An “internal unfolding analysis” seeks to locate both ideal points and stimuluspoints, simultaneously. Most MDS software can carry out internal unfoldinganalyses, but the results are generally problematic. Therefore, internal un-folding analyses are not recommended and they are not considered here.
C. In the most straightforward version of the multidimensional unfolding model,respondent s’s preferences for stimulus i are expressed as a function of the stimuluspoints and s’s ideal point, as follows:
Prefsi = αs −m∑p=1
βs(xip − ysp)2 + εsi
1. In the preceding equation, Prefsi is respondent s’s measured preference (e.g.,a rating scale response) for stimulus i.
2. Just as before, xip is the coordinate for the point representing stimulus i alongthe pth axis in the MDS solution.

Multidimensional Scaling2012 WIM Workshop, Indiana UniversityPage 22
3. ysp is the coordinate for s’s ideal point along the same axis.
4. αs and βs are coefficients specific to respondent s, while ε is a random errorterm.
D. Prefsi and the xip’s are all observed or previously-estimated quantities. Theysp’s and the coefficients are all constants that can be estimated, using a simpleregression model.
E. A separate regression is estimated for each respondent. A procedure developedby J. D. Carroll is used to manipulate the OLS coefficients in order to recoverestimates of the ideal point coordinates. The R2 from the regression shows howwell the respondent’s preferences for the stimuli can be explained by the interpointdistances (i.e., from the ideal point to the stimulus points).
F. What does the external unfolding analysis provide?
1. Minimally, a descriptive, graphical, summary of respondent preferences.
2. Potentially, useful measurement information.
a. Recall that one substantive objective of MDS is to determine the evalu-ative dimensions that people bring to bear on a set of stimulus objects.
b. The unfolded ideal point estimates effectively measure the respondentswith respect to the same evaluative dimensions.
XVI. Software for Multidimensional Scaling
A. SPSS
1. SPSS has two MDS routines, ALSCAL and PROXSCAL
2. Both procedures are very flexible. They can perform many different vari-eties of MDS, and they can be used to construct dissimilarity matrices frommultivariate data.
B. SAS
1. PROC MDS is very flexible and can perform many varieties of MDS (generallymodeled after ALSCAL, although the estimation algorithm is a bit different).
2. PROC MDS does not plot results; instead, it produces a dataset composed ofpoint coordinates, which can be passed along to graphing software (in SAS orother packages).

Multidimensional Scaling2012 WIM Workshop, Indiana UniversityPage 23
C. SYSTAT
1. SYSTAT has a very flexible and easy-to-use MDS routine. It can be used toperform most varieties of MDS.
2. SYSTAT also has an excellent graphics system, which integrates well with theoutput from its MDS routine.
3. Finally, SYSTAT claims to have made important advances in the estimation ofthe internal unfolding model.
D. STATA
1. Beginning with STATA Version 9.0, there are mds and mdsmat procedures.
a. The mds procedure assumes multivariate data that must be convertedto dissimilarities prior to the analysis. Note that mds carries out theconversion.
b. The mdsmat procedure assumes that the data are already contained in adissimilarities matrix.
2. Beginning with STATA Version 10.0, nonmetric multidimensional scaling isavailable; earlier versions of STATA provided only metric MDS.
3. However, mds and mdsmat are well-integrated with STATA’s overall system ofmodel estimation and post-estimation commands.
E. The R Statistical Computing Environment
1. The Base R installation only includes the function cmdscale, which performsmetric MDS.
2. The MASS package includes functions isoMDS, sammon, and Shepard, all ofwhich perform nonmetric CMDS.
3. The smacof package (available in R 2.7.0 and later) provides functions for es-timating metric and nonmetric CMDS, WMDS, and unfolding models, usinga unified analytic approach.
4. While beginners sometimes find R a bit difficult, it is well worth learning.The functions available in R implement many state-of-the-art statistical pro-cedures, and the graphics are better than those available in any other softwarepackage.
5. A big advantage of R is that it is open-source software— in other words, it’sfree! Information about downloading R is available at the following web site:
http://www.r-project.org/

Multidimensional Scaling2012 WIM Workshop, Indiana UniversityPage 24
F. ggvis
1. ggvis is a module within the ggobi software package. ggobi is a programfor visualizing high-dimensional data. It is freely available on the web, at:
http://ggobi.org
ggobi (and ggvis) can be integrated with the R statistical computing envi-ronment, via the rggobi package.
2. ggvis is an interactive MDS program in that the user can manipulate directlythe scaled configuration of points. This can be useful for evaluating therobustness of an MDS solution.
3. The data structures required to use ggvis are a bit unusual, compared toother MDS software.


![What is Multidimensional Scaling [MDS] ?](https://img.pdfslide.us/doc/110x75/56814c0d550346895db90cc1/what-is-multidimensional-scaling-mds-.jpg)