Embed Size (px)
Citation preview

Multidimensional Scaling: Approximation and Complexity
Erik Demaine 1 Adam Hesterberg 2 Frederic Koehler 3 Jayson Lynch 4 John Urschel 3
AbstractMetric Multidimensional scaling (MDS) is a clas-sical method for generating meaningful (non-linear) low-dimensional embeddings of high-dimensional data. MDS has a long history in thestatistics, machine learning, and graph drawingcommunities. In particular, the Kamada-Kawaiforce-directed graph drawing method is equiva-lent to MDS and is one of the most popular waysin practice to embed graphs into low dimensions.Despite its ubiquity, our theoretical understandingof MDS remains limited as its objective functionis highly non-convex. In this paper, we prove thatminimizing the Kamada-Kawai objective is NP-hard and give a provable approximation algorithmfor optimizing it, which in particular is a PTAS onlow-diameter graphs. We supplement this resultwith experiments suggesting possible connectionsbetween our greedy approximation algorithm andgradient-based methods.
1. IntroductionGiven the distances between data points living in a highdimensional space, how can we meaningfully visualize theirrelationships? This is a fundamental task in exploratorydata analysis for which a variety of different approacheshave been proposed. Many of these approaches seek tovisualize high-dimensional data by embedding it into lowerdimensional, e.g. two or three-dimensional, space.
Metric multidimensional scaling (MDS or mMDS) (Kruskal,1964a; 1978) is a classical approach to this problem whichattempts to find a low-dimensional embedding that accu-rately represents the distances between points. Originallymotivated by applications in psychometrics, MDS has now
1Computer Science and Artificial Intelligence Laboratory, MIT,Cambridge, MA, USA 2John A. Paulson School of Engineer-ing and Applied Sciences, Harvard University, Cambridge, MA,USA 3Department of Mathematics, MIT, Cambridge, MA, USA4Cheriton School of Computer Science, University of Waterloo,Waterloo, ON, Canada. Correspondence to: Frederic Koehler<[email protected]>.
Proceedings of the 38 th International Conference on MachineLearning, PMLR 139, 2021. Copyright 2021 by the author(s).
been recognized as a fundamental tool for data analysisacross a broad range of disciplines. See the texts (Kruskal,1978; Borg & Groenen, 2005) for more details, including adiscussion of applications to data from scientific, economic,political, and other domains. Compared to other classicalvisualization tools like PCA1, metric multidimensional scal-ing has the advantage that it 1) is not restricted to linearprojections of the data, i.e. it is nonlinear, and 2) is appli-cable to data from an arbitrary metric space, rather thanjust Euclidean space. Because of this versatility, MDS hasalso become one of the most popular algorithms in the fieldof graph drawing, where the goal is to visualize relation-ships between nodes (e.g. people in a social network). Inthis context, MDS was independently proposed by Kamadaand Kawai (Kamada et al., 1989) as a force-directed graphdrawing method.
In this paper, we consider the algorithmic problem of com-puting the optimal embedding under the MDS/Kamada-Kawai objective. The Kamada-Kawai objective is to mini-mize the following energy/stress functional E : Rrn → R
E(x1, . . . ,xn) =∑i<j
(‖xi − xj‖d(i, j)
− 1
)2
, (1)
which corresponds to the physical situation wherex1, . . . ,xn ∈ Rr are particles and for each i 6= j, particlesxi and xj are connected by an idealized spring with equi-librium length d(i, j) following Hooke’s law with springconstant kij = 1
d(i,j)2 . In applications to visualization, thechoice of dimension is often small, i.e. r = 1, 2, 3. Wealso note that in (1) the terms in the sum are sometimesre-weighted with vertex or edge weights, which we discussin more detail later.
In practice, the MDS/Kamada-Kawai objective (1) is op-timized via a heuristic procedure like gradient descent(Kruskal, 1964b; Zheng et al., 2018) or stress majoriza-tion (De Leeuw et al., 1977; Gansner et al., 2004). Becausethe objective is non-convex, these algorithms may not reachthe global minimum, but instead may terminate at approx-imate critical points of the objective function. Heuristicssuch as restarting an algorithm from different initializations
1In the literature, PCA is sometimes referred to as classicalmultidimensional scaling, in contrast to metric multidimensionalscaling, which we study in this work.

Multidimensional Scaling: Approximation and Complexity
and using modified step size schedules have been proposedto improve the quality of results. In practice, these heuris-tic methods do seem to work well for the Kamada-Kawaiobjective and are implemented in popular packages likeGRAPHVIZ (Ellson et al., 2001) and the SMACOF packagein R.
1.1. Our Results
In this work, we revisit this problem from an approximationalgorithms perspective. First, we resolve the computationalcomplexity of minimizing (1) by proving that findingthe global minimum is NP-hard, even for graph metrics(where the metric is the shortest path distance on a graph).Consider the decision version of stress minimization overgraph metrics, which we formally define below:
STRESS MINIMIZATIONInput: Graph G = ([n], E), r ∈ N, L ≥ 0.Output: TRUE if there exists x = (x1, . . . ,xn) ∈ Rnrsuch that E(x) ≤ L; FALSE otherwise.
Theorem 1. There exists a polynomial p(n) such that thefollowing gap version of STRESS MINIMIZATION indimension r = 1 is NP-hard: given an input graph Gwith n vertices and L > 0, return TRUE if there existsx such that E(x) ≤ L and return FALSE if for every x,E(x) ≥ L + 1/p(n). Furthermore, the problem is hardeven restricted to input graphs with diameter bounded byan absolute constant.
As a gap problem, the output is allowed to be arbitrary if nei-ther case holds; the hardness of the gap formulation showsthat there cannot exist a Fully-Polynomial Randomized Ap-proximation Scheme (FPRAS) for this problem if P 6= NP,i.e. the runtime cannot be polynomial in the desired ap-proximation guarantee. Our reduction shows this problemis hard even when the input graph has low diameter (evenbounded by an absolute constant): this is a natural setting toconsider since many real world graphs (for example, socialnetworks (Dodds et al., 2003)) and random graph models(Watts & Strogatz, 1998) indeed have low diameter due tothe “small-world phenomena”. Other key aspects of thishardness proof are: 1) we show the problem is hard evenwhen the input d is a graph metric, and 2) we show it is hardeven in its canonical unweighted formulation (1).
Given that computing the minimizer is NP-hard, a naturalquestion is whether there exist polynomial time approxima-tion algorithms for minimizing (1). We show that if the inputgraph has bounded diameter D = O(1), then there indeedexists a Polynomial-Time Approximation Scheme (PTAS) tominimize (1), i.e. for fixed ε > 0 and fixedD there exists analgorithm to approximate the global minimum of a n vertex
diameter D graph up to multiplicative error (1 + ε) in timef(ε,D) · poly(n). More generally, we show:
Theorem 2 (Informal version of Theorem 4). Let R >ε > 0 be arbitrary. Algorithm KKSCHEME runs intime n2(R/ε)O(rR4/ε2) and outputs x1, . . . ,xn ∈ Rr with‖xi‖ ≤ R such that
E [E(x1, . . . ,xn)] ≤ E(x∗1, . . . ,x∗n) + εn2
for any x∗1, . . . ,x∗n with ‖x∗i ‖ ≤ R for all i, where E is the
expectation over the randomness of the algorithm.
where KKSCHEME is a simple greedy algorithm describedin Section 4 below. The fact that this result is a PTAS forbounded diameter graphs follows from combining it withthe two structural results regarding optimal Kamada-Kawaiembeddings, which are of independent interest. The first(Lemma 4) shows that the optimal objective value for lowdiameter graphs must be of order Ω(n2) and the second(Lemma 5) shows that the optimal KK embedding is “con-tractive” in the sense that the diameter of the output is nevermuch larger than the diameter of the input.
Lemma 1 (Informal version of Lemma 4). For any targetdimension r ≥ 1, all graphs of diameter D = O(n1/r)satisfy E(x) = Ω(n2/Dr) for all x.
Lemma 2 (Informal version of Lemma 5). For any graphof diameter D and any target dimension r ≥ 1, any globalminimizer of E(x) satisfies
maxi,j‖xi − xj‖ = O(D log logD),
i.e. the diameter of the embedding is O(D log logD).
1.2. Related Work
Other Approaches to Nonlinear Dimensionality Reduc-tion and Visualization. Recently, there has been renewedinterest in force-directed graph layouts due to new appli-cations in machine learning and data science. MDS itselfis a popular technique for dimension reduction. Newertechniques, such as t-SNE (Maaten & Hinton, 2008) andUMAP (McInnes et al., 2018), can be viewed as similartype of force-directed weighted graph drawing with morecomplex objectives than Kamada-Kawai (see the discussionin (McInnes et al., 2018)); in comparison, some other di-mensionality reduction methods, e.g. Laplacian eigenmaps(Belkin & Niyogi, 2003), are based on spectral embeddingsof graphs.
In practice, methods like t-SNE and UMAP appear to workquite well, even though they are based on optimizing non-convex objectives with gradient descent, which in generalcomes with no guarantee of success. Towards explainingthis phenomena, t-SNE has been mathematically analyzed

Multidimensional Scaling: Approximation and Complexity
in a fairly specific setting where the data is split into well-separated clusters (e.g. generated by well-separated Gaus-sian mixtures); in this case, the works (Arora et al., 2018;Linderman & Steinerberger, 2019) prove that the visual-ization recovers the corresponding cluster structure. A dif-ficulty when proving more general guarantees is that thet-SNE and UMAP objectives are fairly complex, and hencenot so easy to mathematically analyze.
Partially for this reason, in this work we focus on the simplermetric MDS/Kamada-Kawai objective. Experimentally, ithas been observed that, using this objective, it is easy to findhigh quality minima in many different situations (see e.g.(Zheng et al., 2018)), but to our knowledge there has notbeen a mathematical explanation of this phenomena.
Other related work. In the multidimensional scaling lit-erature, there has been some study of the local conver-gence of algorithms like stress majorization, see for example(De Leeuw, 1988), which shows that stress majorization willconverge quickly if in a sufficiently small neighborhood ofa local minimum. This work seems to propose the firstprovable guarantees for global optimization. The closestprevious hardness result is the work of (Cayton & Dasgupta,2006) where they showed that a similar problem is hard. Intheir problem: 1) the terms in (1) are weighted by d(i, j)and absolute value loss replaces the squared loss and 2) theinput is an arbitrary pseudometric where nodes in the inputare allowed to be at distance zero from each other. Thesecond assumption makes the diameter (ratio of max to mindistance in the input) infinite, and this is a major obstruc-tion to modifying their approach to show Theorem 1. SeeRemark 1 for further discussion. A much earlier hardnessresult is the work of (Saxe, 1979), in the easier (for prov-ing hardness) case where distortion is only measured withrespect to edges of the graph.
In the approximation algorithms literature, there has been agreat deal of interest in optimizing the worst-case distortionof metric embeddings into various spaces, see e.g. (Badoiuet al., 2005) for approximation algorithms for embeddingsinto one dimension, and (Deza & Laurent, 2009; Naor, 2012)for more general surveys of low distortion metric embed-dings. Though conceptually related, the techniques used inthis literature are not generally targeted for minimizing ameasure of average pairwise distortion like (1).
In the graph drawing literature, there are a number of com-peting methods for drawing a graph, with the best approachdepending on application (Battista et al., 1998). Tutte’sspring embedding theorem is often considered the seminalwork in the force-directed layout community, and provides amethod for producing a planar drawing of a three-connectedplanar graph (Tutte, 1963). Though the problem under con-sideration in this work does indeed belong to the class of
force-directed layouts, we stress the layouts under consider-ation do not minimize edge crossings in any sense.
Notation. In the remainder of the paper, we will generallyassume the input is given as an unweighted graph to simplifynotation; however, for the upper bounds (e.g. Theorem 2)we do handle the general case of arbitrary metrics withdistances in [1, D] — note that the lower bound of 1 iswithout loss of generality after re-scaling. In the lowerbound (i.e. Theorem 1), we prove the (stronger) result thatthe problem is hard when restricted to graph metrics, insteadof just for arbitrary metrics. We use standard asymptoticnotation: f(n) = O(g(n)) means that lim supn→∞
f(n)g(n) <
∞, f(n) = Ω(g(n)) means that lim infn→∞f(n)g(n) > 0,
and f(n) = Θ(g(n)) means that f(n) = Ω(g(n)) andf(n) = O(g(n)). The notation [n] denotes 1, . . . , n.Unless otherwise noted, ‖ · ‖ denotes the Euclidean norm.
We also recall that a metric d : V × V → R≥0 on a set V isformally defined to be any function satisfying 1) d(v, w) =0 iff v = w, 2) d(v, w) = d(w, v) for all v, w ∈ V and3) d(v, w) ≤ d(v, u) + d(u,w) for any u, v, w ∈ V . Apseudometric relaxes 1) to the requirement that d(v, v) = 0for all v.
2. Structural Results for OptimalEmbeddings
In this section, we present two results regarding optimallayouts of a given graph. In particular, we provide a lowerbound for the energy of a graph layout and an upper boundfor the diameter of an optimal layout. The techniques usedprimarily involve estimating different components of theobjective function E(x1, . . . ,xn) given by (1) (written asE(x) in this section for convenience). For this reason, weintroduce the notation
Ei,j(x) :=
(‖xi − xj‖d(i, j)
− 1
)2
for i, j ∈ [n],
ES(x) :=∑i,j∈Si<j
Ei,j(x) for S ⊂ [n],
ES,T (x) :=∑i∈S
∑j∈T
Ei,j(x) for S, T ⊂ [n], S ∩ T = ∅.
We also make use of this notation in Appendices A and B.
First, we recall the following standard ε-net estimate.
Lemma 3 (Corollary 4.2.13 of (Vershynin, 2018)). LetBR = x : ‖x‖ ≤ R ⊂ Rr be the origin-centered ra-dius R ball in r dimensions. For any ε ∈ (0, R) there existsa subset Sε ⊂ BR with |Sε| ≤ (3R/ε)r such that
max‖x‖≤R
miny∈Sε‖x− y‖ ≤ ε,

Multidimensional Scaling: Approximation and Complexity
i.e. Sε is an ε-net of BR.
Using this result, we prove the following lower bound forthe objective value of any layout of a diameter D graph inRr.Lemma 4. Let G = ([n], E) have diameter
D ≤ (n/2)1/r
10.
Then any layout x ∈ Rrn has energy
E(x) ≥ n2
81(10D)r.
Proof. Let G = ([n], E) have diameter D ≤ (n/2)1/r/10,and suppose that there exists a layout x ⊂ Rr of G indimension r with energy E(x) = cn2 for some c ≤ 1/810.If no such layout exists, then we are done. We aim to lowerbound the possible values of c. For each vertex i ∈ [n], weconsider the quantity Ei,V \i(x). The sum∑
i∈[n]
Ei,V \i(x) = 2cn2,
and so there exists some i′ ∈ [n] such that Ei′,V \i′(x) ≤2cn. By Markov’s inequality,∣∣j ∈ [n] |Ei′,j(x) > 10c
∣∣ < n/5,
and so at least 4n/5 vertices (including i′) in [n] satisfy(‖xi′ − xj‖d(i′, j)
− 1
)2
≤ 10c,
and also
‖xi′ − xj‖ ≤ d(i′, j)(1 +√
10c) ≤ 10
9D.
The remainder of the proof consists of taking the d-dimensional ball with center xi∗ and radius 10D/9 (whichcontains ≥ 4n/5 vertices), partitioning it into smaller sub-regions, and then lower bounding the energy resulting fromthe interactions between vertices within each sub-region.
By applying Lemma 3 with R := 10D/9 and ε := 1/3,we may partition the r dimensional ball with center xi′
and radius 10D/9 into (10D)r disjoint regions, each ofdiameter at most 2/3. For each of these regions, we denoteby Sj ⊂ [n], j ∈ [(10D)r], the subset of vertices whosecorresponding point lies in the corresponding region. Aseach region is of diameter at most 2/3 and the graph distancebetween any two distinct vertices is at least one, either
ESj (x) ≥(|Sj |2
)(2/3− 1)2 =
|Sj |(|Sj | − 1)
18
or |Sj | = 0. Empty intervals provide no benefit and can besafely ignored. The optimization problem
min∑k=1
mk(mk−1) s.t.∑k=1
mk = m, mk ≥ 1, k ∈ [`],
has a non-empty feasible region for m ≥ `, and the solutionis given by m(m/`− 1) (achieved when mk = m/` for allk). In our situation, m := 4n/5 and ` := (10D)r, and, byassumption, m ≥ `. This leads to the lower bound
cn2 = E(x) ≥∑j=1
ESj (x) ≥ 4n
90
[4n
5(10D)r− 1
],
which implies that
c ≥ 16
450(10D)r
(1− 5(10D)r
4n
)≥ 1
75(10D)r
for D ≤ (n/2)1/r/10. This completes the proof.
The above estimate has the correct dependence for r = 1.For instance, consider the lexicographical product of a pathPD and a clique Kn/D: i.e. a graph with D cliques in aline, and complete bipartite graphs between neighboringcliques. This graph has diameter D, and the layout in whichthe “vertices” (each corresponding to a copy of Kn/D) ofPD lie exactly at the integer values [D] has objective valuen2 (n/D − 1). This estimate is almost certainly not tightfor dimensions r > 1, as there is no higher dimensionalanalogue of the path (i.e., a graph with O(Dr) vertices anddiameter D that embeds isometrically in Rr).
Next, we provide an upper bound for the diameter of anyoptimal layout of a diameter D graph. For the sake of space,the proof of this result is reserved for Appendix A.
Lemma 5 (Proved in Appendix A). Let G = ([n], E) havediameter D. Then, for any optimal layout x ∈ Rrn, i.e., xsuch that E(x) ≤ E(y) for all y ∈ Rrn,
‖xi − xj‖2 . D log logD
for all i, j ∈ [n].
While the above estimate is sufficient for our purposes, weconjecture that this is not tight, and that the diameter of anoptimal layout of a diameter D graph is always at most 2D.
3. Algorithmic Lower BoundsIn this section, we discuss algorithmic lower bounds formultidimensional scaling. In particular, we provide a sketchof the reduction used in the proof of Theorem 1. The formalproof itself is quite involved, and is therefore reserved forAppendix B.

Multidimensional Scaling: Approximation and Complexity
To show that minimizing (1) is NP-hard in dimensionr = 1, we use a reduction from a version of Max All-Equal3SAT. The Max All-Equal 3SAT decision problem askswhether, given variables t1, . . . , t`, clauses C1, . . . , Cm ⊂t1, . . . , t`, t1, . . . , t` each consisting of at most three lit-erals (variables or their negation), and some value L, thereexists an assignment of variables such that at least L clauseshave all literals equal. The Max All-Equal 3SAT decisionproblem is known to be APX-hard, as it does not satisfy theconditions of the Max CSP classification theorem for a poly-nomial time optimizable Max CSP (Khanna et al., 2001).More precisely, this is because of the following properties:1) setting all variables true or all variables false does notsatisfy all clauses, and 2) all clauses cannot be written in dis-junctive normal form as two terms, one with all unnegatedvariables and one with all negated variables.
We require a much more restrictive version of this problem.In particular, we require a version in which all clauses haveexactly three literals, no literal appears in a clause morethan once, the number of copies of a clause is equal to thenumber of copies of its complement (defined as the negationof all its elements), and each literal appears in exactly kclauses. This more restricted version is shown to still beAPX-hard in Appendix B.
Suppose we have an instance of the aforementioned ver-sion of Max All-Equal 3SAT with variables t1, . . . , t` andclauses C1, . . . , C2m. Let L = t1, . . . , t`, t1, . . . , t` bethe set of literals and C = C1, . . . , C2m be the mul-tiset of clauses. Consider the graph G = (V,E), withV = V0 t V1 t V2, where
V0 = vi : i ∈ [Nv],V1 = ti : t ∈ L, i ∈ [Nt],V2 = Ci : C ∈ C, i ∈ [Nc],
and E = V (2) \ (E1 ∪ E2), where
E1 = (ti, tj) : t ∈ L, i, j ∈ [Nt],E2 = (ti, Cj) : t ∈ C,C ∈ C, i ∈ [Nt], j ∈ [Nc],
t denotes disjoint union, parameters Nv Nt Nc m, and V (2) := U ⊂ V : |U | = 2.
For simplicity, in the following description we assume thatcliques (other than V0) in the original graph generally embedtogether as one collection of nearby points, so we can treatthem as single objects in the embedding. In Appendix B,this intuition is rigorously justified.
The clique on vertices V0 serves as an “anchor” that forcesall other vertices to be almost exactly at the correct distancefrom its center. Without loss of generality, assume thisanchor clique is centered at 0. In this graph, the cliquescorresponding to literals and clauses, given by tii∈[Nt]
and Cii∈[NC ] respectively, are all at distance one from theanchor clique. Literal cliques are at distance one from eachother, except negations of each other, which are at distancetwo. Clause cliques are distance two from the literal cliquescorresponding to literals in the clause and distance one fromliteral cliques corresponding to literals not in the clause.Clause cliques are all distance one from each other. Themain idea of the reduction is that the location of the centerof the anchor clique at 0 forces each literal to roughly be ateither −1 or +1, and the distance between negations forcesnegations to be on opposite sides, i.e., xti ≈ −xti . Clausecliques are also roughly at either −1 or +1 and the distanceto literals forces clauses to be opposite the side with themajority of its literals, i.e., clause C = t1, t2, t3 lies atxCi ≈ −χxti1 + xti2 + xti3 ≥ 0, where χ is the indicatorvariable. The optimal embedding of G, i.e. the locationof variable cliques at either +1 or −1, corresponds to anoptimal assignment for the Max All-Equal 3SAT instance.
Remark 1 (Comparison to (Cayton & Dasgupta, 2006)). Asmentioned in the Introduction, the reduction here is signifi-cantly more involved than the hardness proof for a relatedproblem in (Cayton & Dasgupta, 2006). At a high level, thekey difference is that in (Cayton & Dasgupta, 2006) theywere able to use a large number of distance-zero verticesto create a simple structure around the origin. This is nolonger possible in our setting (in particular, with boundeddiameter graph metrics), which results in graph layouts withmuch less structure. For this reason, we require a graphthat exhibits as much structure as possible. To this end, areduction from Max All-Equal 3SAT using both literals andclauses in the graph is a much more suitable technique thana reduction from NAE 3SAT using only literals. In fact, itis not at all obvious that the same approach in (Cayton &Dasgupta, 2006), applied to unweighted graphs, would leadto a computationally hard instance.
4. Approximation AlgorithmIn this section, we formally describe an approximation algo-rithm using tools from the Dense CSP literature, and provetheoretical guarantees for the algorithm.
4.1. Preliminaries: Greedy Algorithms for Max-CSP
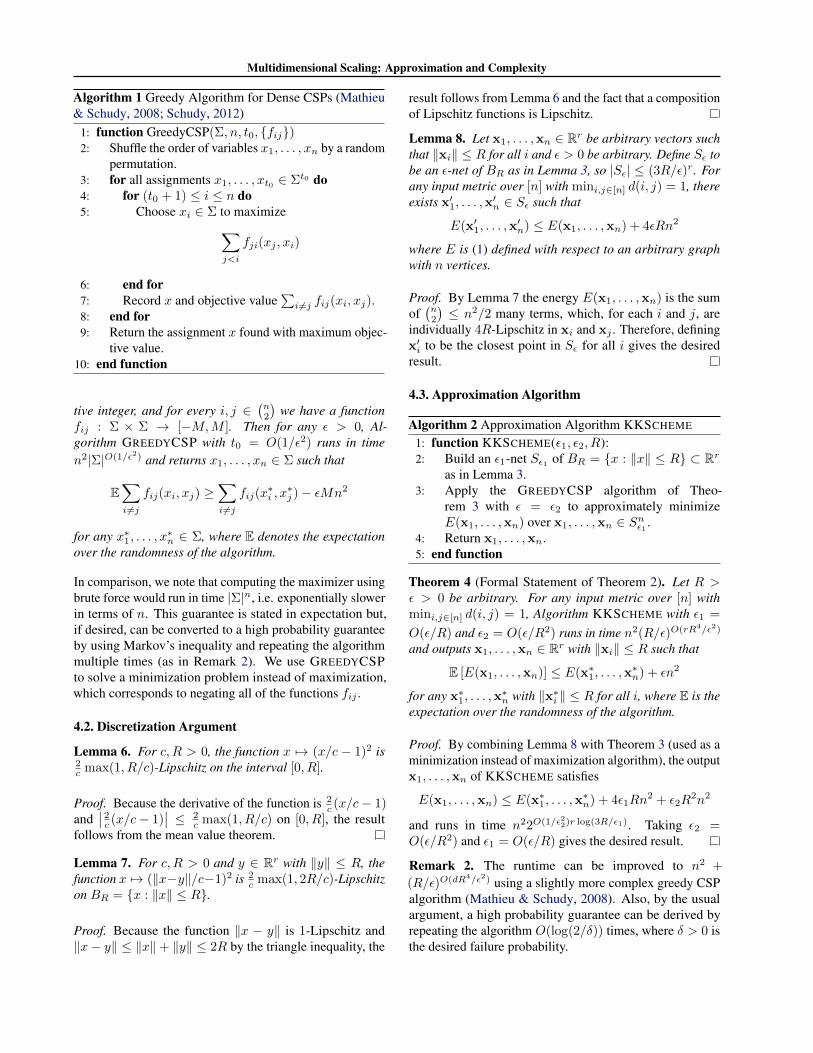
A long line of work studies the feasibility of solving theMax-CSP problem under various related pseudorandom-ness and density assumptions. In our case, an algorithmwith mild dependence on the alphabet size is extremelyimportant. A very simple greedy approach, proposed andanalyzed by Mathieu and Schudy (Mathieu & Schudy, 2008;Schudy, 2012) (see also (Yaroslavtsev, 2014)), satisfies thisrequirement.
Theorem 3 ((Mathieu & Schudy, 2008; Schudy, 2012)).Suppose that Σ is a finite alphabet, n ≥ 1 is a posi-
Multidimensional Scaling: Approximation and Complexity
Algorithm 1 Greedy Algorithm for Dense CSPs (Mathieu& Schudy, 2008; Schudy, 2012)
1: function GreedyCSP(Σ, n, t0, fij)2: Shuffle the order of variables x1, . . . , xn by a random
permutation.3: for all assignments x1, . . . , xt0 ∈ Σt0 do4: for (t0 + 1) ≤ i ≤ n do5: Choose xi ∈ Σ to maximize∑
j<i
fji(xj , xi)
6: end for7: Record x and objective value
∑i 6=j fij(xi, xj).
8: end for9: Return the assignment x found with maximum objec-
tive value.10: end function
tive integer, and for every i, j ∈(n2
)we have a function
fij : Σ × Σ → [−M,M ]. Then for any ε > 0, Al-gorithm GREEDYCSP with t0 = O(1/ε2) runs in timen2|Σ|O(1/ε2) and returns x1, . . . , xn ∈ Σ such that
E∑i 6=j
fij(xi, xj) ≥∑i 6=j
fij(x∗i , x∗j )− εMn2
for any x∗1, . . . , x∗n ∈ Σ, where E denotes the expectation
over the randomness of the algorithm.
In comparison, we note that computing the maximizer usingbrute force would run in time |Σ|n, i.e. exponentially slowerin terms of n. This guarantee is stated in expectation but,if desired, can be converted to a high probability guaranteeby using Markov’s inequality and repeating the algorithmmultiple times (as in Remark 2). We use GREEDYCSPto solve a minimization problem instead of maximization,which corresponds to negating all of the functions fij .
4.2. Discretization Argument
Lemma 6. For c,R > 0, the function x 7→ (x/c − 1)2 is2c max(1, R/c)-Lipschitz on the interval [0, R].
Proof. Because the derivative of the function is 2c (x/c− 1)
and∣∣ 2c (x/c− 1)
∣∣ ≤ 2c max(1, R/c) on [0, R], the result
follows from the mean value theorem.
Lemma 7. For c,R > 0 and y ∈ Rr with ‖y‖ ≤ R, thefunction x 7→ (‖x−y‖/c−1)2 is 2
c max(1, 2R/c)-Lipschitzon BR = x : ‖x‖ ≤ R.
Proof. Because the function ‖x − y‖ is 1-Lipschitz and‖x− y‖ ≤ ‖x‖+ ‖y‖ ≤ 2R by the triangle inequality, the
result follows from Lemma 6 and the fact that a compositionof Lipschitz functions is Lipschitz.
Lemma 8. Let x1, . . . ,xn ∈ Rr be arbitrary vectors suchthat ‖xi‖ ≤ R for all i and ε > 0 be arbitrary. Define Sε tobe an ε-net of BR as in Lemma 3, so |Sε| ≤ (3R/ε)r. Forany input metric over [n] with mini,j∈[n] d(i, j) = 1, thereexists x′1, . . . ,x
′n ∈ Sε such that
E(x′1, . . . ,x′n) ≤ E(x1, . . . ,xn) + 4εRn2
where E is (1) defined with respect to an arbitrary graphwith n vertices.
Proof. By Lemma 7 the energy E(x1, . . . ,xn) is the sumof(n2
)≤ n2/2 many terms, which, for each i and j, are
individually 4R-Lipschitz in xi and xj . Therefore, definingx′i to be the closest point in Sε for all i gives the desiredresult.
4.3. Approximation Algorithm
Algorithm 2 Approximation Algorithm KKSCHEME
1: function KKSCHEME(ε1, ε2, R):2: Build an ε1-net Sε1 of BR = x : ‖x‖ ≤ R ⊂ Rr
as in Lemma 3.3: Apply the GREEDYCSP algorithm of Theo-
rem 3 with ε = ε2 to approximately minimizeE(x1, . . . ,xn) over x1, . . . ,xn ∈ Snε1 .
4: Return x1, . . . ,xn.5: end function
Theorem 4 (Formal Statement of Theorem 2). Let R >ε > 0 be arbitrary. For any input metric over [n] withmini,j∈[n] d(i, j) = 1, Algorithm KKSCHEME with ε1 =
O(ε/R) and ε2 = O(ε/R2) runs in time n2(R/ε)O(rR4/ε2)
and outputs x1, . . . ,xn ∈ Rr with ‖xi‖ ≤ R such that
E [E(x1, . . . ,xn)] ≤ E(x∗1, . . . ,x∗n) + εn2
for any x∗1, . . . ,x∗n with ‖x∗i ‖ ≤ R for all i, where E is the
expectation over the randomness of the algorithm.
Proof. By combining Lemma 8 with Theorem 3 (used as aminimization instead of maximization algorithm), the outputx1, . . . ,xn of KKSCHEME satisfies
E(x1, . . . ,xn) ≤ E(x∗1, . . . ,x∗n) + 4ε1Rn
2 + ε2R2n2
and runs in time n22O(1/ε22)r log(3R/ε1). Taking ε2 =O(ε/R2) and ε1 = O(ε/R) gives the desired result.
Remark 2. The runtime can be improved to n2 +
(R/ε)O(dR4/ε2) using a slightly more complex greedy CSPalgorithm (Mathieu & Schudy, 2008). Also, by the usualargument, a high probability guarantee can be derived byrepeating the algorithm O(log(2/δ)) times, where δ > 0 isthe desired failure probability.

Multidimensional Scaling: Approximation and Complexity
4.4. Extension to Vertex-Weighted Setting
In this section, we generalize the approximation algorithmto handle vertex weights. This generalization is useful if ver-tices have associated importance weights, e.g. each vertexrepresents a different number of people, and larger/more im-portant vertices should be embedded more accurately. Givena probability measure µ over [n], the weighted Kamada-Kawai objective is
Eµ(x1, . . . ,xn) = n2∑i<j
µ(i)µ(j)
(‖xi − xj‖d(i, j)
− 1
)2
.
(2)Note that when µ is the uniform measure on [n], this reducesto (1).
Theorem 5. Let R > ε > 0 be arbitrary. Algo-rithm KKSCHEME with ε1 = O(ε/R) and ε2 = O(ε/R2)
runs in time nO(rR4 log(R/ε)/ε2) and outputs x1, . . . ,xn ∈Rr with ‖xi‖ ≤ R such that
E [E(x1, . . . ,xn)] ≤ E(x∗1, . . . ,x∗n) + εn2
for any x∗1, . . . ,x∗n with ‖x∗i ‖ ≤ R for all i, where E is the
expectation over the randomness of the algorithm.
Proof. The proof is the same as Theorem 4, except thatwe require a different dense CSP algorithm. More pre-cisely, we can directly verify that the discretization Lemma,Lemma 8, holds with the same guarantee for the weightedKamada-Kawai objective. This reduces the problem to ap-proximating a dense CSP with vertex weights, for which weuse Theorem 6.
The following Theorem formally describes the guaranteewe use for approximately optimizing dense CSPs with ver-tex/variable weights. This result can be proved by slightlymodifying the algorithm and analysis in (Yoshida & Zhou,2014). For completeness, we provide a proof in Appendix C.
Theorem 6 (Proved in Appendix C). Suppose that Σ is afinite alphabet, n ≥ 1 is a positive integer, and for everyi, j ∈
(n2
)we have a function fij : Σ × Σ → [−M,M ].
Then for any ε > 0, there exists an algorithm which runs intime nO(log |Σ|/ε2) and returns x1, . . . , xn ∈ Σ such that
E [Ei,j∼µfij(xi, xj)] ≥ Ei,j∼µfij(x∗i , x∗j )− εM
for any x∗1, . . . , x∗n ∈ Σ, where the outer E denotes the
expectation over the randomness of the algorithm.
5. ExperimentsWe implemented the GREEDYCSP-based algorithm de-scribed above as well as a standard gradient descent ap-proach to minimizing the Kamada-Kawai objective. In this
section we compare the behavior of these algorithms in afew interesting instances.
In addition to gradient descent, a couple of other local searchheuristics are popular for minimizing the Kamada-Kawaiobjective: 1) the original algorithm proposed by Kamadaand Kawai (Kamada et al., 1989), which updates singlepoints at a time using a Newton-Raphson scheme, and 2)a variational approach known as majorization, which op-timizes a sequence of upper bounds on the KK objective(De Leeuw et al., 1977; Gansner et al., 2004), where eachstep reduces to solving a Laplacian system. The recent workof (Zheng et al., 2018) compared these local search heuris-tics and argued that (stochastic) gradient descent, proposedin the early work of (Kruskal, 1964a), is one of the bestperforming methods in practice. For this reason, we focuson comparing with gradient descent.
Some Graph Drawing Examples. In Figure 1 we showthe result of embedding a random Watts-Strogatz “smallworld” graph (Watts & Strogatz, 1998), a model of randomgraph intended to reflect some properties of real world net-works. In Figure 2 we show an embedding of the “3elt”graph from (Diekmann & Preis); in this case, it’s interest-ing that all of the methods optimizing (1) seem to find thesame solution, except Greedy suffers a small loss due todiscretization. This suggests that this solution may be theglobal optimum.
Note that in all figures, the MDS/Kamada-Kawai objectivevalue achieved (normalized by 1/n2, where n is the numberof vertices) is included in the subtitle of each plot. Forcomparison, in the bottom right of each Figure we displaythe standard spectral embedding given by embedding eachvertex according to the entries of the bottom two nontrivialeigenvectors of the graph Laplacian.
Experiment with restarts. The algorithm we propose inTheorem 4 is randomized, which leaves open the possibilitythat better results are obtained by running the algorithmmultiple times and taking the best result. In Figure 3, weshow the result of embedding a well-known social networkgraph, the Davis Southern Women Network (Davis et al.,2009), by running all methods 10 times and taking the resultwith best objective value. This graph has a total of 32nodes and records the attendance of 18 Southern womenat 14 social events during the 1930s. To compare withthe minimum, the average objective value achieved in therun is 0.0588, 0.0498, and 0.0515 for Greedy, Greedy andGrad, and Grad respectively so all methods did improvedslightly by running multiple times. Finally, we note thatrunning gradient descent with 30 restarts (as opposed to 10)improved its best score to 0.0478, essentially the same asthe Greedy and Grad result.

Multidimensional Scaling: Approximation and Complexity
Figure 1. Embeddings of Watts Strogatz graph on 50 nodes withgraph parameters K = 4 and β = 0.3 and t0 = 3 forGREEDYCSP.
Figure 2. 3elt graph from AG Monien collection (Diekmann &Preis); GREEDYCSP run with parameter t0 = 2.
Figure 3. Embedding of Davis Southern Women Network graph.The top left figure was generated using GREEDYCSP with t0 = 3.
Runtime Greedy Grad LaplacianDavis 5.6 s 4 s 4 msWatts-Strogatz 453 s 4 s 20 ms
Table 1. Runtimes for methods with parameters used in figures.
Community Detection Experiment. A lot of the recentinterest in force-directed graph drawing algorithms has beenin their ability to discover interesting latent structure in dataand with a view towards applications like non-linear dimen-sionality reduction. As a test of this concept on syntheticdata, we tested the algorithms on a celebrated model oflatent community structure in graphs, the stochastic blockmodel. The results are shown in Figure 4, along with theresults of a standard spectral embedding using the bottomtwo nontrivial eigenvectors of the Laplacian. We did notdraw the edges in this case as they make the Figure diffi-cult to read; more importantly, the location of points in theembedding show that nontrivial community structure wasrecovered; for example, the green and blue communities areroughly linearly separable in all of the embeddings. Notethat the spectral embedding approach admits strong provableguarantees for community recovery (see the survey (Abbe,2017)), and so the interesting thing to observe here is thatthe force-directed drawing methods also recover nontrivialinformation about the latent structure.
Implementation details. All experiments were per-formed on a standard Kaggle GPU Kernel with a V80 GPU.Gradient descent was run with learning rate 0.005 for 4000steps on all instances. We seeded the RNG with zero beforeeach simulation for reproducibility. For the greedy method,

Multidimensional Scaling: Approximation and Complexity
Figure 4. Embeddings of a 3-community Stochastic Block Model
(SBM) with connection probabilities
0.09 0.03 0.020.03 0.15 0.040.02 0.04 0.1
and
community sizes 35, 35, 50. Colors correspond to latent com-munity assignments. The top left is constructed using theGREEDYCSP algorithm with t0 = 3. For this experiment only,we used the degree-normalized Laplacian since it is generallypreferred in the context of the SBM.
we eliminated the rotation and translation degrees of free-dom when implementing the initial brute force step; theparameter R was set to 2.5 for the Davis experiment, andset to 4 for all others — informally, the tuning rule for thisparameter is to increase its value until the plot does not hitthe boundary of the region. We compare runtimes in Table 5;the runtime for Greedy in Watts-Strogatz is much larger dueto the larger value of n and of R used; the latter roughlycorresponds to the larger diameter of the underlying graph(cf. Lemma 4).
6. ConclusionsOur theory and experimental results suggest the follow-ing natural question: does gradient descent, with enoughrandom restarts, have a similar provable guarantee to Theo-rem 3? As noted in our experiments and in the experimentsof (Zheng et al., 2018), gradient-based optimization oftenseems to find high quality (albeit not global) minima of theKamada-Kawai objective, even though the loss is highlynon-convex. In fact, combining our analysis with a differenttheorem from (Schudy, 2012) proves that running a vari-ant of GREEDYCSP without the initial brute force step (i.e.with t0 = 0), achieves an additive O(εn2) approximation
if we repeat the algorithm 221/ε2
many times. A similar
guarantee for gradient descent, a different sort of greedyprocedure, sounds plausible.
Acknowledgements Frederic Koehler was supported inpart by NSF CAREER Award CCF-1453261, NSF LargeCCF-1565235, Ankur Moitra’s ONR Young InvestigatorAward, and E. Mossel’s Vannevar Bush Fellowship ONR-N00014-20-1-2826. The work of J. Urschel was supportedin part by ONR Research Contract N00014-17-1-2177. Theauthors would like to thank Michel Goemans for valuableconversations on the subject. The authors are grateful toLouisa Thomas for greatly improving the style of presenta-tion.
ReferencesAbbe, E. Community detection and stochastic block models:
recent developments. The Journal of Machine LearningResearch, 18(1):6446–6531, 2017.
Arora, S., Hu, W., and Kothari, P. K. An analysis of thet-sne algorithm for data visualization. arXiv preprintarXiv:1803.01768, 2018.
Badoiu, M., Dhamdhere, K., Gupta, A., Rabinovich, Y.,Racke, H., Ravi, R., and Sidiropoulos, A. Approxima-tion algorithms for low-distortion embeddings into low-dimensional spaces. In SODA, volume 5, pp. 119–128.Citeseer, 2005.
Barak, B., Raghavendra, P., and Steurer, D. Roundingsemidefinite programming hierarchies via global correla-tion. In 2011 ieee 52nd annual symposium on foundationsof computer science, pp. 472–481. IEEE, 2011.
Battista, G. D., Eades, P., Tamassia, R., and Tollis, I. G.Graph drawing: algorithms for the visualization ofgraphs. Prentice Hall PTR, 1998.
Belkin, M. and Niyogi, P. Laplacian eigenmaps for di-mensionality reduction and data representation. Neuralcomputation, 15(6):1373–1396, 2003.
Borg, I. and Groenen, P. J. Modern multidimensional scal-ing: Theory and applications. Springer Science & Busi-ness Media, 2005.
Cayton, L. and Dasgupta, S. Robust euclidean embedding.In Proceedings of the 23rd international conference onmachine learning, pp. 169–176, 2006.
Cover, T. M. Elements of information theory. John Wiley &Sons, 1999.
Davis, A., Gardner, B. B., and Gardner, M. R. Deep South:A social anthropological study of caste and class. Univof South Carolina Press, 2009.

Multidimensional Scaling: Approximation and Complexity
De Leeuw, J. Convergence of the majorization method formultidimensional scaling. Journal of classification, 5(2):163–180, 1988.
De Leeuw, J., Barra, I. J., Brodeau, F., Romier, G., Van Cut-sem, B., et al. Applications of convex analysis to multidi-mensional scaling. In Recent Developments in Statistics.Citeseer, 1977.
Deza, M. M. and Laurent, M. Geometry of cuts and metrics,volume 15. Springer, 2009.
Diekmann, R. and Preis, R. Ag-monien graph collectionn.https://www.cise.ufl.edu/research/sparse/mat/AG-Monien/README.txt. Ac-cessed: 2020-02-01.
Dodds, P. S., Muhamad, R., and Watts, D. J. An experimen-tal study of search in global social networks. science, 301(5634):827–829, 2003.
Ellson, J., Gansner, E., Koutsofios, L., North, S. C., andWoodhull, G. Graphviz—open source graph drawingtools. In International Symposium on Graph Drawing,pp. 483–484. Springer, 2001.
Feige, U. A threshold of lnn for approximating setcover. J. ACM, 45(4):634–652, 1998. doi: 10.1145/285055.285059. URL https://doi.org/10.1145/285055.285059.
Filho, I. T. F. A. Characterizing Boolean Satisfiability Vari-ants. PhD thesis, Massachusetts Institute of Technology,2019.
Gansner, E. R., Koren, Y., and North, S. Graph drawingby stress majorization. In International Symposium onGraph Drawing, pp. 239–250. Springer, 2004.
Kamada, T., Kawai, S., et al. An algorithm for drawinggeneral undirected graphs. Information processing letters,31(1):7–15, 1989.
Khanna, S., Sudan, M., Trevisan, L., and Williamson, D. P.The approximability of constraint satisfaction problems.SIAM Journal on Computing, 30(6):1863–1920, 2001.
Kruskal, J. B. Multidimensional scaling by optimizinggoodness of fit to a nonmetric hypothesis. Psychometrika,29(1):1–27, 1964a.
Kruskal, J. B. Nonmetric multidimensional scaling: a nu-merical method. Psychometrika, 29(2):115–129, 1964b.
Kruskal, J. B. Multidimensional scaling. Number 11. Sage,1978.
Linderman, G. C. and Steinerberger, S. Clustering witht-sne, provably. SIAM Journal on Mathematics of DataScience, 1(2):313–332, 2019.
Maaten, L. v. d. and Hinton, G. Visualizing data usingt-sne. Journal of machine learning research, 9(Nov):2579–2605, 2008.
Mathieu, C. and Schudy, W. Yet another algorithm for densemax cut: go greedy. In SODA, pp. 176–182, 2008.
McInnes, L., Healy, J., and Melville, J. Umap: Uniformmanifold approximation and projection for dimensionreduction. arXiv preprint arXiv:1802.03426, 2018.
Montanari, A. Estimating random variables from randomsparse observations. European Transactions on Telecom-munications, 19(4):385–403, 2008.
Naor, A. An introduction to the ribe program. JapaneseJournal of Mathematics, 7(2):167–233, 2012.
Papadimitriou, C. H. and Yannakakis, M. Optimiza-tion, approximation, and complexity classes. J. Com-put. Syst. Sci., 43(3):425–440, 1991. doi: 10.1016/0022-0000(91)90023-X. URL https://doi.org/10.1016/0022-0000(91)90023-X.
Raghavendra, P. and Tan, N. Approximating csps withglobal cardinality constraints using sdp hierarchies. InProceedings of the twenty-third annual ACM-SIAM sym-posium on Discrete Algorithms, pp. 373–387. SIAM,2012.
Saxe, J. B. Embeddability of weighted graphs in k-space isstrongly np-hard. In Proc. of 17th Allerton Conferencein Communications, Control and Computing, Monticello,IL, pp. 480–489, 1979.
Schudy, W. Approximation Schemes for Inferring Rankingsand Clusterings from Pairwise Data. PhD thesis, BrownUniversity, 2012.
Tutte, W. T. How to draw a graph. Proceedings of theLondon Mathematical Society, 3(1):743–767, 1963.
Vershynin, R. High-dimensional probability: An introduc-tion with applications in data science, volume 47. Cam-bridge university press, 2018.
Watts, D. J. and Strogatz, S. H. Collective dynamicsof ‘small-world’networks. nature, 393(6684):440–442,1998.
Yaroslavtsev, G. Going for speed: Sublinear algorithms fordense r-csps. arXiv preprint arXiv:1407.7887, 2014.
Yoshida, Y. and Zhou, Y. Approximation schemes viasherali-adams hierarchy for dense constraint satisfactionproblems and assignment problems. In Proceedings ofthe 5th conference on Innovations in theoretical computerscience, pp. 423–438, 2014.

Multidimensional Scaling: Approximation and Complexity
Zheng, J. X., Pawar, S., and Goodman, D. F. Graph drawingby stochastic gradient descent. IEEE transactions onvisualization and computer graphics, 25(9):2738–2748,2018.