Embed Size (px)
Citation preview

389
Multidimensional Computerized AdaptiveTesting in a Certification or Licensure ContextRichard M. Luecht
National Board of Medical Examiners
Multidimensional item response theory (MIRT) com-puterized adaptive testing, building on recent work bySegall (1996), is applied in a licensing/certificationcontext. An example of a medical licensure test is usedto demonstrate situations in which complex, integratedcontent must be balanced at the total test level for va-
lidity reasons, but items assigned to reportablesubscore categories may be used under a MIRT adaptiveparadigm to improve the reliability of the subscores. Aheuristic optimization framework is outlined that gen-eralizes to both univariate and multivariate statistical
objective functions, with additional systems of con-straints included to manage the content balancing orother test specifications on adaptively constructed testforms. Simulation results suggested that a multivariatetreatment of the problem, although complicating some-what the objective function used and the estimation oftraits, nonetheless produces advantages from a psycho-metric perspective. Index terms: adaptive testing,computerized adaptive testing, information functions,licensure testing, multidimensional item responsetheory, sequential testing.
The merging of multidimensional item response theory (MIRT; e.g., Reckase, 1985) and computerizedadaptive testing (CAT; e.g., Kingsbury & Weiss, 1983; Wainer, Dorans, Flaugher, Green, Mislevy, Steinberg,& Thissen, 1990; Weiss & Kingsbury, 1984) is an intriguing direction to explore (Bloxom & Vale, 1987;Miller, Reckase, Spray, Luecht, & Davey, in press; Segall, 1996). However, the problems of CAT itemselection and parameter estimation become more complex in a multidimensional context. For example,unlike a unidimensional CAT, which merely administers items targeted to an examinee’s location along ascore scale, a MIRT CAT must locate an examinee’s trait estimates on a plane or hyperplane and administeritems that ideally minimize the joint estimation errors for those estimates.
Faced with these complexities, it is appropriate to ask whether MIRT CAT is worth the added complications,and Segall (1996) demonstrated that it may be. Segall compared a unidimensional CAT for nine power achieve-ment subtests in an Armed Services Vocational Aptitude test battery to a multivariate CAT, fixing the covari-ance structure in the latter case so that the items in each subtest loaded on individual trait composites (i.e.,oblique simple structure). He also implemented a Bayes modal estimation procedure that allowed the popu-lation covariances among the nine traits to enter into the solutions. By maximizing the determinant of theposterior variance-covariance matrix as the statistical objective function for the MIRT adaptive item selec-tions, Segall demonstrated some detectable gains in the reliabilities of the outcome subscores when comparedto simulated unidimensional CATs. The present study both cross-validated and extended Segall’s work byintroducing a somewhat different application, one that contends with mandatory, complex content constraintsin a context related to certification or licensure testing-specifically, medical licensure.
Licensure/Certification Tests
Many professional certification or licensure tests consist of multifarious content structures covering alarge domain of integrated knowledge and require applications of that knowledge to realistic problems inthe profession. The multidisciplinary concepts and applications tend to be of a broad scope, in-depth, and
APPLIED PSYCHOLOGICAL MEASUREMENTVol. 20, No. 4, December 1996, pp. 389-404© Copyright 1996 Applied Psychological Measurement Inc.0146-6216/96/040389-16$2.05
Downloaded from the Digital Conservancy at the University of Minnesota, http://purl.umn.edu/93227. May be reproduced with no cost by students and faculty for academic use. Non-academic reproduction
requires payment of royalties through the Copyright Clearance Center, http://www.copyright.com/

390
highly interrelated, comprised of items specifically written to an integrated content outline covering nu-merous hierarchical levels, with various combinations of crossed and nested specifications (e.g., Federa-tion of State Medical Boards & National Board of Medical Examiners, 1996a, 1996b). However, the primarypurpose of the assessment may be to produce a single total test score or decision (e.g., competency to becertified or licensed as a professional); this purpose implies that there is a single underlying statisticaldimension of interest.
If the reported outcome measure is strictly univariate (e.g., a total test score or decision), there may be littleapparent practical advantage in considering a complex multivariate framework that attempts to capture thesalient multidimensionality of the test, subject, or course, to empirically evaluating for serious violations ofthe requisite assumptions underlying the use of a particular unidimensional item response theory (IRT) cali-bration or scaling model. For example, a test comprised of several hundred &dquo;cells&dquo; in a fully- or semi-crossedcontent specifications matrix would not be feasible to model by assigning latent trait dimensions for eachcontent cell. At the same time, content experts might strongly question the validity of building test formsstrictly to optimize the reliability of trait or factor scores for statistically determined factors (e.g., factorsdetermined using exploratory factor analysis and therefore subject to arbitrary interpretation and capriciousdecisions about the number of factors to use, the type of rotation to use, and so forth).
That professional certification or licensure tests comprised of complex, integrated content are perhapsmultidimensional is not the relevant issue. Rather, the question is whether there is any advantage to at-tempting to decompose the total test into arbitrary-and perhaps substantively meaningless-statisticalmultivariate latent structures when the most that could be accomplished would be to estimate a set of(probably unstable) coefficients or loadings for recombining the multivariate scores in some fashion togenerate a total test composite score.
What is needed, therefore, is a reason to use a multidimensional statistical framework-a reason that
arguably relates to reported scores. The relevant issue may be whether there exists an estimable and mean-ingful multivariate structure that can be used in a MIRT CAT to serve some auxiliary score reporting pur-pose, such as providing subscore profiles to help examinees diagnose their strengths or weaknesses orproviding schools with aggregate performance feedback in what some might term core areas. Of course, atotal test score applicable for making accurate decisions needs to be produced and the requisite contentvalidity at the total test level needs to be maintained.
This type of dual purpose (i.e., making total test pass/fail decisions and also reporting subscores based onitems that are logically assigned to various categories) is not uncommon in professional certification or licensuretesting (e.g., Swanson, Case, Kelley, Lawley, Nungester, Powell, & Volle, 1991 ). For example, the integrated,applied content for a medical licensure test covering clinical science concepts and patient management couldbe inappropriately represented, from a content perspective, if the test were built strictly along traditionaldiscipline dimensions (e.g., 50 items each covering medicine, pediatrics, surgery, obstetrics and gynecology,and so forth; see, e.g., Greenburg, Case, Golden, & Melnick, 1996). There are numerous other dimensions tocover on such a test (e.g., physician tasks, various organ systems, disease categories, sites of care).
The construction of test forms instead requires a more comprehensive system of content taxonomiesand constraints to capture the breadth and depth of the clinical sciences in the medical profession (Federa-tion of State Medical Boards & National Board of Medical Examiners, 1996b). However, examinees mightstill benefit from knowing how they performed on items logically related to those somewhat traditionaldisciplines. Medical schools might also request to use the aggregate information of their students’ perform-ance in such core areas for program evaluation or to inform aspects of the curriculum. It is suggested herethat the secondary purpose of the test (i.e., generating subscores) could be used to establish a multivariateframework amenable to MIRT CAT.
It is important to make this distinction that relates the purpose(s) of the test to the scores that are re-
Downloaded from the Digital Conservancy at the University of Minnesota, http://purl.umn.edu/93227. May be reproduced with no cost by students and faculty for academic use. Non-academic reproduction
requires payment of royalties through the Copyright Clearance Center, http://www.copyright.com/
391
ported. CAT can improve the reliability of scores using targeted item selections and heuristics for locallyoptimizing a particular statistical objective function (e.g., minimizing error variances); it does not neces-sarily improve validity in any substantive way. This perspective serves as an introduction to what will be aconfirmatory view of multidimensionality and test construction following from the intended purpose ofthe test, the content specifications and, ultimately, the scores that are reported.
A Multidimensional Framework for Estimating Multiple Traits
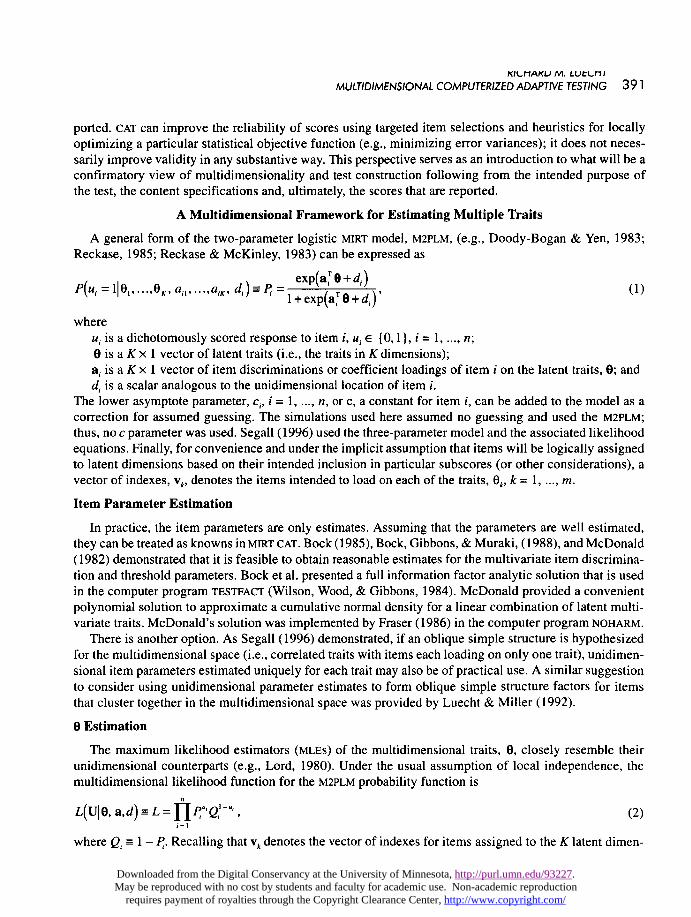
A general form of the two-parameter logistic MIRT model, M2PLM, (e.g., Doody-Bogan & Yen, 1983;Reckase, 1985; Reckase & McKinley, 1983) can be expressed as
where
u, is a dichotomously scored response to item i, u, E {0,1 }, i = 1,..., n;0 is a K x 1 vector of latent traits (i.e., the traits in K dimensions);a, is a K x 1 vector of item discriminations or coefficient loadings of item i on the latent traits, 0; andd, is a scalar analogous to the unidimensional location of item i.
The lower asymptote parameter, c,, i = 1,..., n, or c, a constant for item i, can be added to the model as acorrection for assumed guessing. The simulations used here assumed no guessing and used the M2PLM;thus, no c parameter was used. Segall (1996) used the three-parameter model and the associated likelihoodequations. Finally, for convenience and under the implicit assumption that items will be logically assignedto latent dimensions based on their intended inclusion in particular subscores (or other considerations), avector of indexes, vkl denotes the items intended to load on each of the traits, 6k, k = 1, ..., m.
Item Parameter Estimation
In practice, the item parameters are only estimates. Assuming that the parameters are well estimated,they can be treated as knowns in MIRT CAT. Bock ( 1985), Bock, Gibbons, & Muraki, (1988), and McDonald(1982) demonstrated that it is feasible to obtain reasonable estimates for the multivariate item discrimina-tion and threshold parameters. Bock et al. presented a full information factor analytic solution that is usedin the computer program TESTFACT (Wilson, Wood, & Gibbons, 1984). McDonald provided a convenientpolynomial solution to approximate a cumulative normal density for a linear combination of latent multi-variate traits. McDonald’s solution was implemented by Fraser (1986) in the computer program NOHARM.
There is another option. As Segall (1996) demonstrated, if an oblique simple structure is hypothesizedfor the multidimensional space (i.e., correlated traits with items each loading on only one trait), unidimen-sional item parameters estimated uniquely for each trait may also be of practical use. A similar suggestionto consider using unidimensional parameter estimates to form oblique simple structure factors for itemsthat cluster together in the multidimensional space was provided by Luecht & Miller (1992).
0 Estimation
The maximum likelihood estimators (MLES) of the multidimensional traits, 0, closely resemble theirunidimensional counterparts (e.g., Lord, 1980). Under the usual assumption of local independence, themultidimensional likelihood function for the M2PLM probability function is
where Q, m 1 - P,. Recalling that v, denotes the vector of indexes for items assigned to the K latent dimen-
Downloaded from the Digital Conservancy at the University of Minnesota, http://purl.umn.edu/93227. May be reproduced with no cost by students and faculty for academic use. Non-academic reproduction
requires payment of royalties through the Copyright Clearance Center, http://www.copyright.com/

392
sions, the MILES can be computed by taking the natural logarithm of Equation 2, differentiating with respectto each element in 0, and solving the equations when the partial first derivatives are set equal to 0:
where 3~/30~ = a,~1flQ,. The symmetric K x K matrix of second derivatives, H(O), has diagonal elementsa2ln(L)/a6K, and off-diagonal elements a2 ln(L)/aO,O, (k = 1, ..., K; I = 1, ..., K; k # l). By evaluating thesecond derivatives at the same point as the first derivatives, the expectation ofR(9) can be found. R(9) canbe well approximated by the negative information matrix under Fisher’s concept of information; that is,
The information matrix is also a K x K symmetric matrix. Segall (1996) provided more complete details onthe derivations. Using the information matrix, Fisher’s method of scoring can be implemented instead ofthe more common Newton-Raphson method as
where the superscript [s + 1] represents the updated estimates of 0 and
Bayes mean estimators (e.g., Bock, 1985; Bock & Aitkin, 1981; Mislevy, 1986) can also be derived bydirect extension of the unidimensional estimators, but for a multidimensional trait space. The posteriordistribution,
is merely a joint posterior for the vector-valued 0, with a multivariate probability density, p(9 ~ 1.1,1:), and withpopulation parameters, ji and E. It is necessary to integrate over the joint posterior to obtain the Bayes meanestimators [i.e., expected a posteriori estimates (EAPS)] and the associated estimation variance-covarianceerrors (Bock & Aitkin, 1981).
Bloxom & Vale (1987) provided closed-form approximations to the Bayes centroids and variances andcovariances by extending Owen’s (1975) formulas to multivariate, orthonormal traits. Although Bloxomand Vale’s approximations to the centroids were not EAPS, strictly speaking, they serve as reasonable sur-rogates for obtaining provisional 0 estimates and can be used to speed up the estimation process if the traits
Downloaded from the Digital Conservancy at the University of Minnesota, http://purl.umn.edu/93227. May be reproduced with no cost by students and faculty for academic use. Non-academic reproduction
requires payment of royalties through the Copyright Clearance Center, http://www.copyright.com/

393
are orthogonal. In general, EAP estimates are often the preferred estimators over MLEs because: (1) they areavailable for all response patterns, including null or perfect response; and (2) it is impossible to improve onthe minimum variance properties of EAPS, on average, over a population of traits (e.g., Bock & Mislevy,1982). However, EAPS, when used as point estimates, also tend to overestimate the true correlations be-tween the multivariate latent traits (e.g., Luecht & Miller, 1992; Segall, 1996). In those cases, a methodsuggested by Mislevy (1984), using pseudocounts computed over the joint posterior for all examinees, canbe used to directly obtain better estimates of the population correlation or variance-covariance matrices.
Segall (1996) also presented the solutions for the multidimensional Bayes modal estimators, which gener-alize to orthogonal or oblique traits for a multivariate normal prior probability density. As Segall noted,estimating the modes of the posterior distribution may be easier to do in practice than estimating EAPS whenthe number of dimensions is more than two or three, because they avoid the need for integration.
Item Selection Heuristics in a Multidimensional Context
As presented above, it is relatively straightforward to derive multidimensional estimators for 0; however,obtaining stable estimates in a practical CAT environment (e.g., using less-than-infinite item banks) is princi-pally an empirical issue that depends largely on how items are selected from a given bank. CAT is fundamen-tally a heuristic process by which items are selected sequentially to maximize or minimize a particular objectivefunction, subject to various content or other constraints (e.g., word counts, the test length, or any of the usualadaptive stopping rules). Heuristics are used quite often in other types of automated test assembly (e.g.,Luecht & Hirsch, 1992; Stocking & Swanson, 1993) and using them for CAT is a natural extension of thetechnology (Luecht, in press; Stocking & Swanson, 1993). Heuristics allow each item selection to be mod-eled as a local optimization problem having a statistical criterion-the objective function. Equally importantin selecting items are content or other constraints that follow from test specifications.An important challenge of using heuristics to locally optimize the item selections in MIRT CAT concerns
the choice of the objective function. In unidimensional IRT, a MLE is asymptotically consistent and nor-mally distributed around the true but unknown trait, 0. Where certain regularity conditions hold (e.g.,Lehmann, 1983), the variance of the maximum likelihood estimate, 6, about 0 is
In Equation 8, ln(L) denotes the log-likelihood function; for example, the natural logarithm of Equation 2,but for a unidimensional likelihood function. As the number of items becomes very large, the mean of thesampling distribution of estimates approaches the true parameter, 0 (i.e., j6 8 --~ 0) and the informationthat the MLE provides about 0 reduces to
for a unidimensional item response function, P,, with known item parameters (e.g., a, and b,). Equation 9 isthe unidimensional IRT item information function (Birnbaum, 1968). Therefore, if the item parameters areassumed to be known, maximizing Equation 9 by selecting the most informative items in CAT will mini-mize the asymptotic error variance in Equation 9.
The unidimensional CAT objective function is therefore defined as maximizing the IRT test informationfunction in Equation 9 (a single-valued function computed at the current MLE), selecting the item that
Downloaded from the Digital Conservancy at the University of Minnesota, http://purl.umn.edu/93227. May be reproduced with no cost by students and faculty for academic use. Non-academic reproduction
requires payment of royalties through the Copyright Clearance Center, http://www.copyright.com/
394
contributes the most item information to the sum of the item information functions. This item selection
strategy assumes minimum errors of estimation as a global objective function following the traditionalleast-squares principle for the deviations of the estimators about the true value of the parameter, eventhough the item selection mechanism only yields a locally optimal decision at the current, provisionalestimate of 0. Because the numerator of Equation 9 is the squared regression slope (i.e., squared partialfirst derivative of the response function), by maximizing the squared slope of the likelihood function theerror variance of the estimates about the true parameter is minimized (Birnbaum, 1968).
Generalizing to the multidimensional case, for some vector-valued trait, 0, the MLES tend toward asymp-totic multivariate normality under regularity conditions (e.g., Kendall & Stuart, 1967; Lehmann, 1983). Theapproximate asymptotic variance-covariance matrix of the sampling distribution of estimators about the tnieparameters (i.e., the dispersion matrix) is the inverse of the information matrix given in Equation 4. Becausethe objective function in CAT usually must be reduced to a single value, a composite function for locallyoptimizing the item selections must be found. The information criterion is represented by a matrix.
Miller, Reckase, Spray, Luecht, & Davey (in press) reported a variety of composite functions that oper-ate on the information matrix, each intended to maximize some aspect of the information (e.g., maximizingthe trace of the information matrix). Using simulation results, they concluded that maximizing the determi-nant of the inverse information matrix was the most effective approach to use, although computationallyless intensive procedures also produced adequate results. Bloxom & Vale (1987) and Segall (1996) simi-larly recommended using the determinant of the inverse information matrix as an objective function forMIRT CAT; Segall further provided a complete statistical justification for this strategy.
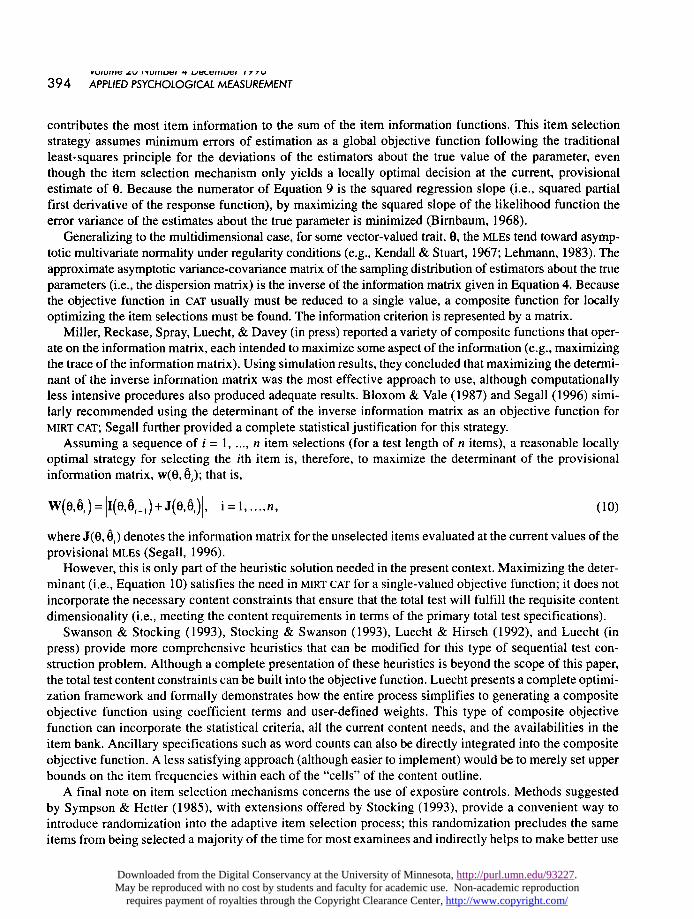
Assuming a sequence of i = 1, ..., n item selections (for a test length of n items), a reasonable locallyoptimal strategy for selecting the ith item is, therefore, to maximize the determinant of the provisionalinformation matrix, w(O, 6,); that is,
where J(9, 6,) denotes the information matrix for the unselected items evaluated at the current values of theprovisional MLEs (Segall, 1996).
However, this is only part of the heuristic solution needed in the present context. Maximizing the deter-minant (i.e., Equation 10) satisfies the need in MIRT CAT for a single-valued objective function; it does notincorporate the necessary content constraints that ensure that the total test will fulfill the requisite contentdimensionality (i.e., meeting the content requirements in terms of the primary total test specifications).
Swanson & Stocking (1993), Stocking & Swanson (1993), Luecht & Hirsch (1992), and Luecht (inpress) provide more comprehensive heuristics that can be modified for this type of sequential test con-struction problem. Although a complete presentation of these heuristics is beyond the scope of this paper,the total test content constraints can be built into the objective function. Luecht presents a complete optimi-zation framework and formally demonstrates how the entire process simplifies to generating a compositeobjective function using coefficient terms and user-defined weights. This type of composite objectivefunction can incorporate the statistical criteria, all the current content needs, and the availabilities in theitem bank. Ancillary specifications such as word counts can also be directly integrated into the compositeobjective function. A less satisfying approach (although easier to implement) would be to merely set upperbounds on the item frequencies within each of the &dquo;cells&dquo; of the content outline.
A final note on item selection mechanisms concerns the use of exposure controls. Methods suggestedby Sympson & Hetter (1985), with extensions offered by Stocking (1993), provide a convenient way tointroduce randomization into the adaptive item selection process; this randomization precludes the sameitems from being selected a majority of the time for most examinees and indirectly helps to make better use
Downloaded from the Digital Conservancy at the University of Minnesota, http://purl.umn.edu/93227. May be reproduced with no cost by students and faculty for academic use. Non-academic reproduction
requires payment of royalties through the Copyright Clearance Center, http://www.copyright.com/

395
of the entire item bank. In general, exposure controls use a predetermined item statistic (usually an empiri-cally derived probability value) and a uniform random generating function to randomly determine whetherthe next optimally selected item should be administered to the current examinee. This procedure controlsthe expected frequency of use for the item within an assumed population of examinees. (See Stocking &
Lewis, 1995, for a somewhat different approach to exposure controls.)Obviously, without some type of item exposure controls in place, the security of any type of high-stakes
examination would quickly be breached due to examinees memorizing and sharing the items (especially ifthe statistically best items were always selected). However, exposure controls can counteract the statisticaloptimization in a CAT. The result of implementing exposure controls, in practice, may be to produce lessreliable tests than might be achieved in ideal settings in which the item banks are infinite and no examineesever cheat. The latter point is made to emphasize that for simulation results (such as those presentedbelow), caution should be used so as not to overinterpret statistical efficiency gains that might not beachievable to the same degree in practice.
Method
A simulation study was conducted to compare the use of MIRT CAT to a traditional unidimensional CATfor=a medical licensure exam. The outcome measures from the CAT were to be used for two purposes: (1)generation of total test scores with full content balancing; and (2) production of discipline-related subscoresfor items assigned to eight categories.
The Examination Context, Content, and Item Bank
2,458 previously administered items from the United States Medical Licensing Examination (USMLE)Step 1 were used as the item bank for the simulation study. USMLE is a joint testing program of the Federa-tion of State Medical Boards (FSMB) and the National Board of Medical Examiners (NBME). USMLE Step 1is the first of three examinations required to obtain a medical license in the U.S. The purpose of Step 1 is tomeasure examinees’ understanding of important concepts of the basic biomedical sciences, emphasizingprinciples and mechanisms underlying health, disease, and modes of therapy. The examination is usuallytaken by U.S. medical students following their second year of medical school. Foreign medical graduatesmust also pass Step 1 as part of the requirements for a medical license in all 50 states. A typical Step 1 is
administered in paper-and-pencil format over a two-day period and has over 600 scored items.The paper-and-pencil tests are constructed according to detailed content specifications involving several hun-
dred constraints and are designed to statistically optimize score precision in the region of the Step 1 pass score.Step 1 total test score reliability coefficients for the U.S. first-taker group are usually in the range of .96 to .97.
Table 1 summarizes the primary categories in the Step 1 content outline (Federation of State MedicalBoards & National Board of Medical Examiners, 1996a) that were used for test construction in this simu-lation study. For the actual full-length Step 1 examinations, the content dimensions in Table 1 would becovered to an additional depth of four or five outline levels and additional content criteria would be used.The Secondary Processes Dimension was fully crossed with Categories 2 to 11 of the primary GeneralPrinciples and Organ Systems dimension. Thus, a system of constraints covering 60 independent cells hadto be developed for the simulated CATs. Every constructed CAT form was forced to meet all the constraintsat the total test level. The General Principles section comprised approximately 45% of each test form. TheOrgan Systems (Categories 2 to 11) comprised the remaining 55% of the test length. The five Processes (Ato E) were constrained to be marginally represented at approximately 15%, 25%, 35%, 15%, and 15%,respectively, across the Organ Systems categories and correspond to the approximate percentages used toconstruct the full-length USMLE Step 1 test forms (Federation of State Medical Boards & National Board ofMedical Examiners, 1996a).
Downloaded from the Digital Conservancy at the University of Minnesota, http://purl.umn.edu/93227. May be reproduced with no cost by students and faculty for academic use. Non-academic reproduction
requires payment of royalties through the Copyright Clearance Center, http://www.copyright.com/

396
Table 1
USMLE Step 1 Primary Content Dimensions for the Total Test
Note. The USMLE Step 1 Primary Content Dimensions are reprinted with the permission of The Federationof State Medical Boards of the United States and the National Board of Medical Examiners®.
In addition to reporting a total Step 1 test score based on all scored items and making a corresponding pass/fail decision, discipline-related subscores are produced to provide examinees with feedback in a graphicalprofile of their strengths and weakness. Within-school means, standard deviations (SDs), and graphical sum-maries are also supplied to medical schools for the discipline subscores. There are currently eight biomedicalscience &dquo;core&dquo; areas reported as subscores: physiology, biochemistry, pathology, microbiology, pharmacol-ogy, behavioral sciences, gross anatomy, and histology. Other subscores in various organ system areas arealso produced; however, these were ignored for the present study.
There is a long-standing tradition behind reporting these &dquo;core&dquo; discipline subscores, even though it iswell-recognized that a Step 1 examination is far more than the simple sum of eight discipline components. Infact, items are assigned by physicians and biomedical content experts to each of the eight categories specifi-cally for the purpose of subscore reporting, based solely on the relevance of each item for that core area andwithout regard to overlap of items among the disciplines (i.e., even the item counts across disciplines do notsum to the total test length).
662 items in the item bank of 2,458 items had overlapping discipline category assignments. Each item hadbeen classified previously by content experts as having substantive relevance for the discipline. Most itemswere assigned to a single category; no single item was assigned to more than three categories. Upper-boundconstraints were established for each of the eight discipline categories, factoring in availabilities of items in
Downloaded from the Digital Conservancy at the University of Minnesota, http://purl.umn.edu/93227. May be reproduced with no cost by students and faculty for academic use. Non-academic reproduction
requires payment of royalties through the Copyright Clearance Center, http://www.copyright.com/

397
the bank, overlapping content, and the total test length for each of the simulated CATs. These constraints wererelaxed enough to allow the heuristics some freedom in selecting items, but prevented any test form fromcontaining a disproportionately large number of items in any particular discipline area, regardless of thestatistical optimization. The same constraints were used throughout the simulation.
The 2,458 items in the bank had been calibrated previously using the Rasch model (Linacre & Wright,1994; Wright & Stone, 1979) and equated to common scales for the total test and for each of the eightdisciplines (physiology, biochemistry, pathology, microbiology, pharmacology, behavioral sciences, grossanatomy, and histology). Nine item difficulty estimates were available for each item: a total test calibrateddifficulty and eight within-discipline calibrated item difficulty estimates. The use of these item difficultiesin the simulations is explained below. The Rasch model has been demonstrated to fit the Step 1 data quitewell; thus, there was no compelling reason to use a more complicated model for the simulations. Practi-cally speaking, it also would have been extremely difficult to use any of the existing multidimensionalsoftware described above to calibrate the response data for these examinations of 600+ items, much less
attempt to link 2,458 items onto a common set of eight multidimensional scales.
Item Statistics and Data Generation for the Simulated CATs
To simulate true Os for the discipline subscores, eight multivariate normal deviates were generated foreach of 2,000 simulated examinees, using an implementation of the Box-Muller algorithm (Aquinis, 1994).The total test trait composite was ignored during this data generation phase of the simulation. The meansand SDs of the marginal distributions were input as .75 and .65, respectively, for all Os and correspondedclosely to past performance of the Step 1 population, where the within-discipline item difficulties have amean of 0 to fix those scales, in accordance with typical Rasch model calibration practices. Therefore, theSDs of the item difficulties and the means and SDs of the trait distribution were free to vary.
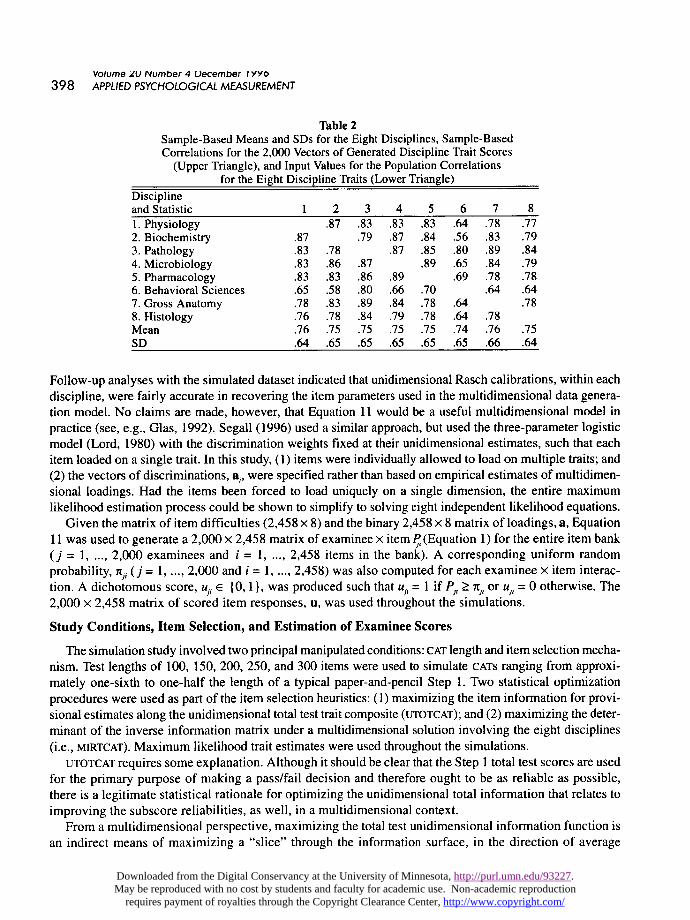
Table 2 shows the means and SDs for the sample of generated traits, as well as the correlations among theeight discipline scores. The lower triangle of the correlation matrix in Table 2 shows the input values assumedfor the population. The upper triangle shows the sample-based product-moment correlations for the 2,000vectors of generated discipline trait scores. The input values for the population correlations (lower triangle)are based on empirical interdiscipline correlations for recent Step 1 examinations, disattenuated for unrelia-bility. As Table 2 shows, the population parameters and sample statistics for the 2,000 generated trait vectorswere similar.
The Rasch difficulty estimates for the bank of 2,458 items were also treated as known parameters ingenerating the data and were subsequently used for estimation of the trait scores. To approximate a M2PLM(i.e., Equation 1) pseudodiscriminations or loadings were generated for each item as binary vectors; that is,a~e {0,1 }, i = 1, ..., I, k = 1, ..., K, (for I items in the bank) such that a,k = 1 if the item loaded on trait Ok or 0otherwise. For example, an item that loaded only on the second and fourth traits would be assigned the vector,a = (0,1, 0,1, 0, 0, 0, 0). This approach is conceptually similar to using &dquo;imputed&dquo; discrimination weights underthe one-parameter logistic model developed by Verhelst & Glas (1995), but in a multidimensional context (alsosee Glas, 1992); here, the weights were binary. Any variety of nonzero values could have been derived orestimated to use as the discrimination weights for items loading on particular discipline dimensions.
Finally, a minor reparameterization of the M2PLM was made to accommodate the use of the eight sepa-rate discipline-based difficulty estimates for each item in the simulations. That is, Equation 1 was
reparameterized as
Downloaded from the Digital Conservancy at the University of Minnesota, http://purl.umn.edu/93227. May be reproduced with no cost by students and faculty for academic use. Non-academic reproduction
requires payment of royalties through the Copyright Clearance Center, http://www.copyright.com/
398
Table 2
Sample-Based Means and SDs for the Eight Disciplines, Sample-BasedCorrelations for the 2,000 Vectors of Generated Discipline Trait Scores
(Upper Triangle), and Input Values for the Population Correlationsfor the Eight Discipline Traits (Lower Triangle)
Follow-up analyses with the simulated dataset indicated that unidimensional Rasch calibrations, within eachdiscipline, were fairly accurate in recovering the item parameters used in the multidimensional data genera-tion model. No claims are made, however, that Equation 11 would be a useful multidimensional model inpractice (see, e.g., Glas, 1992). Segall (1996) used a similar approach, but used the three-parameter logisticmodel (Lord, 1980) with the discrimination weights fixed at their unidimensional estimates, such that eachitem loaded on a single trait. In this study, (1) items were individually allowed to load on multiple traits; and(2) the vectors of discriminations, a,, were specified rather than based on empirical estimates of multidimen-sional loadings. Had the items been forced to load uniquely on a single dimension, the entire maximumlikelihood estimation process could be shown to simplify to solving eight independent likelihood equations.
Given the matrix of item difficulties (2,458 x 8) and the binary 2,458 x 8 matrix of loadings, a, Equation11 was used to generate a 2,000 x 2,458 matrix of examinee x item P (Equation 1) for the entire item bank( j = 1, ..., 2,000 examinees and i = 1, ..., 2,458 items in the bank). A corresponding uniform randomprobability, x, ( j = 1,..., 2,000 and i = 1, ..., 2,458) was also computed for each examinee x item interac-tion. A dichotomous score, u~, E {0,1 }, was produced such that u, = 1 if P~, >_ 1tJI or u, = 0 otherwise. The2,000 x 2,458 matrix of scored item responses, u, was used throughout the simulations.
Study Conditions, Item Selection, and Estimation of Examinee Scores
The simulation study involved two principal manipulated conditions: CAT length and item selection mecha-nism. Test lengths of 100, 150, 200, 250, and 300 items were used to simulate CATS ranging from approxi-mately one-sixth to one-half the length of a typical paper-and-pencil Step 1. Two statistical optimizationprocedures were used as part of the item selection heuristics: (1) maximizing the item information for provi-sional estimates along the unidimensional total test trait composite (UTOTCAT); and (2) maximizing the deter-minant of the inverse information matrix under a multidimensional solution involving the eight disciplines(i.e., MIRTCAT). Maximum likelihood trait estimates were used throughout the simulations.
UTOTCAT requires some explanation. Although it should be clear that the Step 1 total test scores are usedfor the primary purpose of making a pass/fail decision and therefore ought to be as reliable as possible,there is a legitimate statistical rationale for optimizing the unidimensional total information that relates toimproving the subscore reliabilities, as well, in a multidimensional context.
From a multidimensional perspective, maximizing the total test unidimensional information function isan indirect means of maximizing a &dquo;slice&dquo; through the information surface, in the direction of average
Downloaded from the Digital Conservancy at the University of Minnesota, http://purl.umn.edu/93227. May be reproduced with no cost by students and faculty for academic use. Non-academic reproduction
requires payment of royalties through the Copyright Clearance Center, http://www.copyright.com/

399
maximum information along a &dquo;reference composite&dquo; (Wang, 1986; for a discussion of directional infor-mation and &dquo;reference composites&dquo; see also Green, 1988; Reckase, 1985; Reckase & McKinley, 1983).That is, the total test composite trait fit using a unidimensional IRT model essentially extracts a commonfactor (e.g., Baker, 1992; Lord, 1980). Maximizing the common information, in principle, should result initems being selected that are also in the general vicinity of the true parameters along the individual disci-pline trait composites, because those traits can be considered linear composites of the common and uniquefactors in which the unique variances might be assumed to be small for highly intercorrelated traits andignorable for purposes of item selection.
Each CAT was constructed to meet precisely the Step 1 content specifications outlined in Table 1, pro-portionally reduced for each of the five test lengths (i.e., exact matches to frequencies in each of the 60content cells described earlier), and also subject to the relaxed upper-bound constraints placed on thefrequencies of items selected for each of the eight disciplines. The two item selection conditions x five testlengths x 2,000 examinees resulted in 20,000 simulated CATS.
Results
Because the simulations modeled a testing situation with two distinct purposes (i.e., obtaining accuratescores for the content balanced total test and improving the reliability of the eight discipline scores), differ-ent criteria were evaluated, taking into account the purpose of the outcome measures.
Total Test Results
A unique &dquo;true trait score&dquo; for the total test was never generated for the simulated examinees; instead asurrogate value was created that encompassed the multidimensionality induced in the data by the simula-tion model and removed as much estimation error as possible. The obvious choice was to use a total testMLE, based on the item difficulties from the bank and using all 2,458 item responses for each simulatedexaminee. The marginal reliability of the obtained total test MLEs was .994. Using these item bank-basedMLEs as the approximate total test &dquo;true&dquo; scores (T), reliability coefficients were computed as the squaredcorrelation between the CAT-produced MLES, X, and T; that is, RX,. = R&dquo;~, (which follows from classical truescore theory). Table 3 provides the reliability coefficients for each of the test lengths (100, 150, 200, 250,and 300 items).
The results were somewhat predictable. First, increasing the test length improved reliability. For ex-ample, the coefficient for UTOTCAT increased from .921 at 100 items to .978 at 300 items. A similar trendwas evident for MIRTCAT. Second, because UTOTCAT specifically optimized information for the total test&dquo;reference composite&dquo; (Wang, 1986), it was expected that UTOTCAT would do a better job of selectingitems than MIRTCAT for that same trait composite. That appears to be precisely what happened. For ex-ample, at 200 items the reliability coefficients for UTOTCAT and MIRTCAT were .963 and .958, respectively,where UTOTCAT showed a slight improvement in estimation accuracy. The same type of improvement in
Table 3Total Test Score Reliability
Coefficients ( R~ )
Downloaded from the Digital Conservancy at the University of Minnesota, http://purl.umn.edu/93227. May be reproduced with no cost by students and faculty for academic use. Non-academic reproduction
requires payment of royalties through the Copyright Clearance Center, http://www.copyright.com/
400
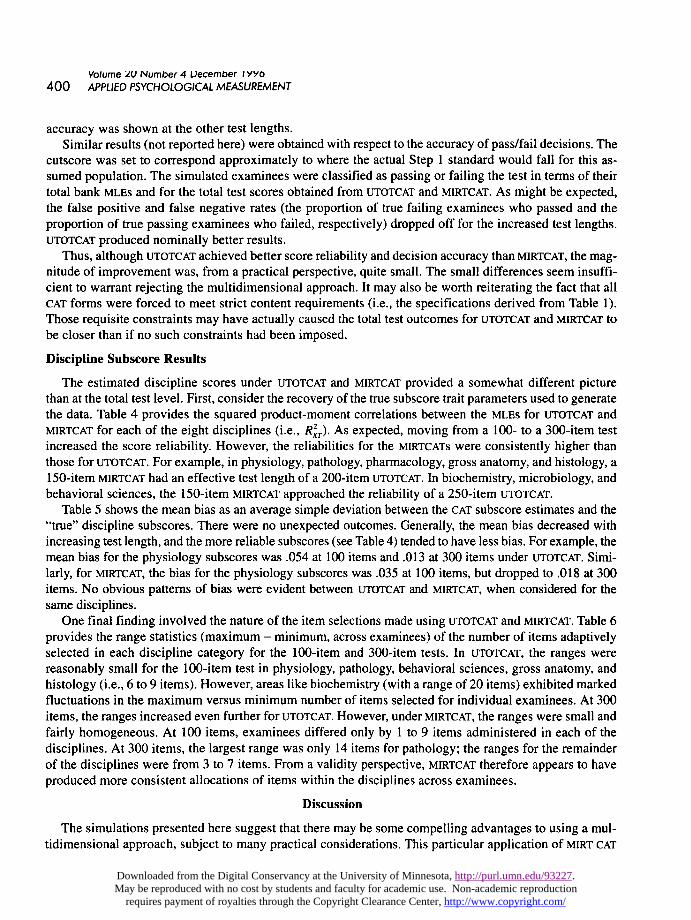
accuracy was shown at the other test lengths.Similar results (not reported here) were obtained with respect to the accuracy of pass/fail decisions. The
cutscore was set to correspond approximately to where the actual Step 1 standard would fall for this as-sumed population. The simulated examinees were classified as passing or failing the test in terms of theirtotal bank MLEs and for the total test scores obtained from UTOTCAT and MIRTCAT. As might be expected,the false positive and false negative rates (the proportion of true failing examinees who passed and theproportion of true passing examinees who failed, respectively) dropped off for the increased test lengths.UTOTCAT produced nominally better results.
Thus, although UTOTCAT achieved better score reliability and decision accuracy than MIRTCAT, the mag-nitude of improvement was, from a practical perspective, quite small. The small differences seem insuffi-cient to warrant rejecting the multidimensional approach. It may also be worth reiterating the fact that allCAT forms were forced to meet strict content requirements (i.e., the specifications derived from Table 1).Those requisite constraints may have actually caused the total test outcomes for UTOTCAT and MIRTCAT tobe closer than if no such constraints had been imposed.
Discipline Subscore Results
The estimated discipline scores under UTOTCAT and MIRTCAT provided a somewhat different picturethan at the total test level. First, consider the recovery of the true subscore trait parameters used to generatethe data. Table 4 provides the squared product-moment correlations between the MLEs for UTOTCAT andMIRTCAT for each of the eight disciplines (i.e., RXT). As expected, moving from a 100- to a 300-item testincreased the score reliability. However, the reliabilities for the MIRTCATs were consistently higher thanthose for UTOTCAT. For example, in physiology, pathology, pharmacology, gross anatomy, and histology, a150-item MIRTCAT had an effective test length of a 200-item UTOTCAT. In biochemistry, microbiology, andbehavioral sciences, the 150-item MIRTCAT approached the reliability of a 250-item UTOTCAT.
Table 5 shows the mean bias as an average simple deviation between the CAT subscore estimates and the&dquo;true&dquo; discipline subscores. There were no unexpected outcomes. Generally, the mean bias decreased withincreasing test length, and the more reliable subscores (see Table 4) tended to have less bias. For example, themean bias for the physiology subscores was .054 at 100 items and .013 at 300 items under UTOTCAT. Simi-larly, for MIRTCAT, the bias for the physiology subscores was .035 at 100 items, but dropped to .018 at 300items. No obvious patterns of bias were evident between UTOTCAT and MIRTCAT, when considered for thesame disciplines.
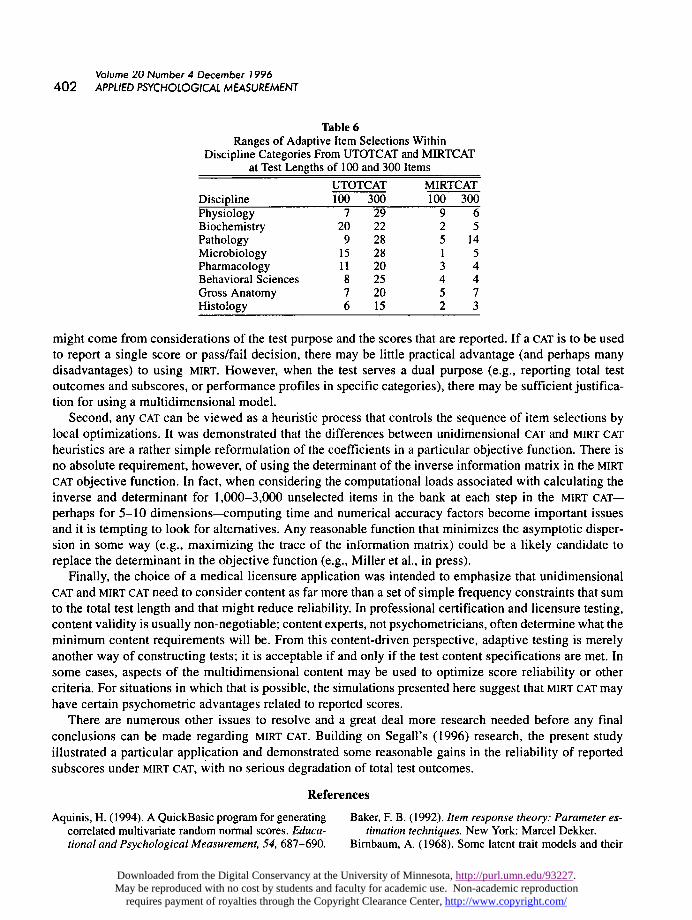
One final finding involved the nature of the item selections made using UTOTCAT and MIRTCAT. Table 6provides the range statistics (maximum - minimum, across examinees) of the number of items adaptivelyselected in each discipline category for the 100-item and 300-item tests. In UTOTCAT, the ranges werereasonably small for the 100-item test in physiology, pathology, behavioral sciences, gross anatomy, andhistology (i.e., 6 to 9 items). However, areas like biochemistry (with a range of 20 items) exhibited markedfluctuations in the maximum versus minimum number of items selected for individual examinees. At 300
items, the ranges increased even further for UTOTCAT. However, under MIRTCAT, the ranges were small and
fairly homogeneous. At 100 items, examinees differed only by 1 to 9 items administered in each of the
disciplines. At 300 items, the largest range was only 14 items for pathology; the ranges for the remainderof the disciplines were from 3 to 7 items. From a validity perspective, MIRTCAT therefore appears to haveproduced more consistent allocations of items within the disciplines across examinees.
Discussion
The simulations presented here suggest that there may be some compelling advantages to using a mul-tidimensional approach, subject to many practical considerations. This particular application of MIRT CAT
Downloaded from the Digital Conservancy at the University of Minnesota, http://purl.umn.edu/93227. May be reproduced with no cost by students and faculty for academic use. Non-academic reproduction
requires payment of royalties through the Copyright Clearance Center, http://www.copyright.com/

401
Table 4
Rx2.r Reliability Coefficients Resulting from UTOTCATand MIRTCAT for the Eight Discipline Subscores at
Test Lengths of 100, 150, 200, 250, 300
to a medical licensure context attempted to illustrate three of those considerations.First, there needs to be a reason to use a multidimensional model, given the estimation and item selec-
tion complexities involved in MIRT CAT. It was suggested that the justification for implementing MIRT CAT
Table 5Mean Bias Functions (Observed - True) From UTOTCATand MIRTCAT for the Eight Discipline Subscores at Test
Lengths of 100, 150, 200, 250, 300
Downloaded from the Digital Conservancy at the University of Minnesota, http://purl.umn.edu/93227. May be reproduced with no cost by students and faculty for academic use. Non-academic reproduction
requires payment of royalties through the Copyright Clearance Center, http://www.copyright.com/
402
Table 6
Ranges of Adaptive Item Selections WithinDiscipline Categories From UTOTCAT and MIRTCATat Test Lengths of 100 and 300 Items
might come from considerations of the test purpose and the scores that are reported. If a CAT is to be usedto report a single score or pass/fail decision, there may be little practical advantage (and perhaps manydisadvantages) to using MIRT. However, when the test serves a dual purpose (e.g., reporting total testoutcomes and subscores, or performance profiles in specific categories), there may be sufficient justifica-tion for using a multidimensional model.
Second, any CAT can be viewed as a heuristic process that controls the sequence of item selections bylocal optimizations. It was demonstrated that the differences between unidimensional CAT and MIRT CATheuristics are a rather simple reformulation of the coefficients in a particular objective function. There isno absolute requirement, however, of using the determinant of the inverse information matrix in the MIRTCAT objective function. In fact, when considering the computational loads associated with calculating theinverse and determinant for 1,000-3,000 unselected items in the bank at each step in the MIRT CAT-perhaps for 5-10 dimensions--computing time and numerical accuracy factors become important issuesand it is tempting to look for alternatives. Any reasonable function that minimizes the asymptotic disper-sion in some way (e.g., maximizing the trace of the information matrix) could be a likely candidate toreplace the determinant in the objective function (e.g., Miller et al., in press).
Finally, the choice of a medical licensure application was intended to emphasize that unidimensionalCAT and MIRT CAT need to consider content as far more than a set of simple frequency constraints that sumto the total test length and that might reduce reliability. In professional certification and licensure testing,content validity is usually non-negotiable; content experts, not psychometricians, often determine what theminimum content requirements will be. From this content-driven perspective, adaptive testing is merelyanother way of constructing tests; it is acceptable if and only if the test content specifications are met. Insome cases, aspects of the multidimensional content may be used to optimize score reliability or othercriteria. For situations in which that is possible, the simulations presented here suggest that MIRT CAT mayhave certain psychometric advantages related to reported scores.
There are numerous other issues to resolve and a great deal more research needed before any finalconclusions can be made regarding MIRT CAT. Building on Segall’s (1996) research, the present studyillustrated a particular application and demonstrated some reasonable gains in the reliability of reportedsubscores under MIRT CAT, with no serious degradation of total test outcomes.
References
Aquinis, H. (1994). A QuickBasic program for generatingcorrelated multivariate random normal scores. Educa-tional and Psychological Measurement, 54, 687-690.
Baker, F. B. (1992). Item response theory: Parameter es-timation techniques. New York: Marcel Dekker.
Birnbaum, A. (1968). Some latent trait models and their
Downloaded from the Digital Conservancy at the University of Minnesota, http://purl.umn.edu/93227. May be reproduced with no cost by students and faculty for academic use. Non-academic reproduction
requires payment of royalties through the Copyright Clearance Center, http://www.copyright.com/

403
use in inferring an examinee’s ability. In F. Lord & M.
Novick, Statistical theories of mental test scores (pp.397-479). Reading MA: Addison-Wesley.
Bloxom, B., & Vale, C. D. (1987, June). Multidimensionaladaptive testing: A procedure for sequential estima-tion of the posterior centroid and dispersion of theta.Paper presented at the annual meeting of the Psycho-metric Society, Montreal.
Bock, R. D. (1985). Contributions of empirical Bayes andmarginal maximum likelihood methods to the measure-ment of individual differences. In E. E. Roskam (Ed.),Measurement and personality assessment (pp. 75-99).North Holland, The Netherlands: Elsevier.
Bock, R.D., & Aitkin, M. (1981). Marginal maximumlikelihood estimation of item parameters: Applicationof an EM algorithm. Psychometrika, 46, 29-51.
Bock, R. D., Gibbons, R., & Muraki, E. (1988). Full-in-formation factor analysis. Applied Psychological Mea-surement, 12, 261-280.
Bock, R.D., & Mislevy, R. J. (1982). Adaptive EAP esti-mation of ability in a microcomputer environment.Applied Psychological Measurement, 6, 431-444.
Doody-Bogan, E., & Yen, W. M. (1983, April). Detectingmultidimensionality and examining its effects on verti-cal equating with the three-parameter logistic model.Paper presented at the annual meeting of the Ameri-can Educational Research Association, Montreal.
Federation of State Medical Boards & National Board ofMedical Examiners. (1996a). Step 1: General instruc-tions, content description, and sample items. Philadel-phia PA: National Board of Medical Examiners.
Federation of State Medical Boards & National Board ofMedical Examiners. (1996b). Step 2: General instruc-tions, content description, and sample items. Philadel-phia PA: National Board of Medical Examiners.
Fraser, C. (1986). NOHARM: An IBM PC computer pro-gram for fitting both unidimensional and multidimen-sional normal ogive models of latent trait theory.Armidale, New South Wales, Australia: The Univer-sity of New England.
Glas, C. A. W. (1992). A Rasch model with a multivariatedistribution of ability. In M. Wilson (Ed.), Objectivemeasurement: Theory into practice (pp. 236-258).Norwood NJ: Ablex.
Green, B. F. (1988, October). Notes on the item informa-tion function in the multidimensional compensatoryIRT model (Research Report 88-10). Baltimore MD:Psychometric Laboratory, The Johns Hopkins Uni-versity.
Greenburg, A. G., Case, S. M., Golden, G. S., & Melnick,D. E. (1996, June). Core content of Step 2 of the USMLEusing surgery as an example. Paper presented at the7th Annual International Ottawa Conference,Maastricht, The Netherlands. (Proceedings in press).
Kendall, M. G., & Stuart, A. (1967). The advanced theory
of statistics (Vol. 2). New York: Hafner.Kingsbury, G. G., & Weiss, D. J. (1983). A comparison
of IRT-based adaptive mastery testing and a sequen-tial mastery testing procedure. In D. J. Weiss (Ed.),New horizons in testing: Latent trait test theory andcomputerized adaptive testing (pp. 257-283). NewYork: Academic Press.
Lehmann, E. L. (1983). Theories of point estimation. NewYork: Wiley.
Linacre, M., & Wright, B. D. (1994). BigSteps [Computerprogram]. Chicago: MESA Press.
Lord, F. M. (1980). Applications of item response theoryto practical testing problems. Hillsdale NJ: Erlbaum.
Luecht, R. M. (in press). A generalized heuristic for testconstruction using item response theory. Applied Psy-chological Measurement.
Luecht, R. M., & Hirsch, T. M. (1992). Item selection us-ing an average growth approximation of target infor-mation functions. Applied Psychological Measurement,16, 41-51.
Luecht, R. M., & Miller, T. R. (1992). Unidimensionalcalibrations and interpretations of composite traits formultidimensional tests. Applied Psychological Mea-surement, 16, 279-294.
McDonald, R. P. (1982). Linear versus nonlinear modelsin item response theory. Applied Psychological Mea-surement, 6, 379-396.
Miller, T., Reckase, R., Spray, J., Luecht, R., & Davey, T.(in press). Multidimensional item response theory. IowaCity IA: ACT Publications.
Mislevy, R. J. (1984). Estimating latent distributions.Psychometrika, 49, 359-381.
Mislevy, R. J. (1986). Bayes modal estimation in item re-sponse models. Psychometrika, 51, 177-195.
Owen, R. J. (1975). A Bayesian sequential procedure forquantal response in the context of adaptive mental test-ing. Journal of the American Statistical Association,70,351-356.
Reckase, M. R. (1985). The difficulty of test items thatmeasure more than one dimension. Applied Psycho-logical Measurement, 9, 401-412.
Reckase, M. R., & McKinley, R. L. (1983, April). Thedefinition of difficulty and discrimination for multidi-mensional item response theory models. Paper pre-sented at the annual meeting of the American Educa-tional Research Association, Montreal.
Segall, D. O. (1996). Multidimensional adaptive testing.Psychometrika, 61, 331-354.
Stocking, M. L. (1993). Controlling item exposure ratesin a realistic adaptive testing paradigm (ETS ResearchReport 93-2). Princeton NJ: Educational Testing Ser-vice.
Stocking, M. L., & Lewis, C. (1995). A new method ofcontrolling item exposure in computerized adaptivetesting (ETS Research Report 95-25). Princeton NJ:
Downloaded from the Digital Conservancy at the University of Minnesota, http://purl.umn.edu/93227. May be reproduced with no cost by students and faculty for academic use. Non-academic reproduction
requires payment of royalties through the Copyright Clearance Center, http://www.copyright.com/
404
Educational Testing Service.Stocking, M. L., & Swanson, L. (1993). A method for
severely constrained item selection in adaptive test-ing. Applied Psychological Measurement, 17, 277-292.
Swanson, D. B., Case, S. M., Kelley, P. R., Lawley, J. L.,Nungester, R. J., Powell, R.D., & Volle, R. L. (1991).Phase-in of the NBME Comprehensive Part I Exami-nation. Ideas for Medical Education, 66, 443-444.
Swanson, L., & Stocking, M. L. (1993). A model and heu-ristic for solving large item selection problems. Ap-plied Psychological Measurement, 17, 151-166.
Sympson, J. B., & Hetter, R. D. (1985). Controlling itemexposure rates in computerized adaptive testing. Pro-ceedings of the 27th Annual Meeting of the MilitaryTesting Association (pp. 973-977). San Diego CA:Navy Personnel Research and Development Center.
Verhelst, N. D., & Glas, C. A. W. (1995). The one param-eter logistic model. In G. H. Fischer & I. W. Molenaar
(Eds.), Rasch models: Foundations, recent develop-ments and applications (pp. 215-237). New York:Springer-Verlag.
Wainer, H., Dorans, N. J., Flaugher, R., Green, B. F.,Mislevy, R., Steinberg, L., & Thissen, D. (1990). Com-puterized adaptive testing: A primer. Hillsdale NJ:
Erlbaum.
Wang, M. M. (1986, April). Fitting a unidimensional modelto multidimensional item response data. Paper pre-sented at the Office of Naval Research Contractors’
Meeting, Knoxville TN.Weiss, D. J., & Kingsbury, G. G. (1984). Application of
computerized adaptive testing to educational problems.Journal of Educational Measurement, 21, 361-375.
Wilson, D., Wood, R. L., & Gibbons, R. (1984).TESTFACT: Test scoring and item factor analysis[Computer program]. Chicago: Scientific Software, Inc.
Wright, B. D., & Stone, M. H. (1979). Best test design.Chicago: MESA Press.
AcknowledgmentsThanks to Terry Ackerman and two anonymous review-ers for their extremely helpful comments on an earlierdraft of this paper. n
Author’s Address
Send requests for reprints or further information toRichard M. Luecht, National Board of Medical Examin-ers, 3750 Market Street, Philadelphia PA 19104, U.S.A.Email: rluechtC~mail.nbme.org.
Downloaded from the Digital Conservancy at the University of Minnesota, http://purl.umn.edu/93227. May be reproduced with no cost by students and faculty for academic use. Non-academic reproduction
requires payment of royalties through the Copyright Clearance Center, http://www.copyright.com/