Embed Size (px)
Citation preview
M2TB rev. 3.5.2
Multichannel Monitoring Tutorial Booklet
2nd Edition
With Reference to
and
the surround monitoring functions of the Yamaha DM2000, DM1000, and 02R96 digital consoles
May 2005 rev. 3.5.2
©2005 YAMAHA Corporation
©2005 SONA Corporation
USO
RES
TRIT
O
Multichannel Monitoring Tutorial Booklet (M2TB) rev. 3.5.2
Masataka Nakahara : SONA Corporation ©2005 YAMAHA Corporation, ©2005 SONA Corporation
2 / 74
Multichannel Monitoring Tutorial Booklet
Second edition, rev. 3.5.2., May 2005
(First edition, rev. 230, June 2002)
Contents
Foreword ...................................................................................................................................................... 3
Preface .......................................................................................................................................................... 4
1. Introduction ............................................................................................................................................. 5
2. What is surround? .................................................................................................................................. 6
1-1. Stereo and surround ..................................................................................................... 6
1-2. Channel configuration ................................................................................................. 6
1-3. Key points for multi-channel monitoring ................................................................... 8
3. Multi-channel formats ........................................................................................................................... 9
2-1. Surround processing methods. .................................................................................. 17
2-2. Encoding and compression methods ........................................................................ 19
2-3. Recording response .................................................................................................... 22
2-4. Playback response ...................................................................................................... 23
2-5. Down-mixing ............................................................................................................. 29
4. Playback environment ......................................................................................................................... 32
3-1. Rec. ITU-R BS. 775-1 ............................................................................................... 32
3-2. L, R ............................................................................................................................. 35
3-3. LS, RS ........................................................................................................................ 36
3-4. C.................................................................................................................................. 40
3-5. Playback image compatibility with the playback environment ............................... 41
3-6. SUB ............................................................................................................................ 42
3-7. Monitoring distance ................................................................................................... 43
3-8. Monitor alignment ..................................................................................................... 45
3-9. THX TM pm3TM Certified Studios .............................................................................. 48
5. Bass management.................................................................................................................................. 50
4-1. Acoustical treatment of the room .............................................................................. 50
4-2. Speaker placement ..................................................................................................... 50
4-3. Electro-acoustic methods .......................................................................................... 50
4-4. Monitoring the decoder output .................................................................................. 57
6. Monitor systems .................................................................................................................................... 59
5-1. Monitor matrix ........................................................................................................... 60
5-2. Bass management ...................................................................................................... 60
5-3. Monitor alignment ..................................................................................................... 60
7. Measurement and adjustment ............................................................................................................ 61
6-1. Test signal .................................................................................................................. 61
6-2. Main channel level balance ....................................................................................... 62
6-3. Narrow-band pink noise ............................................................................................ 65
6-4. LFE channel level balance ........................................................................................ 67
6-5. Delay adjustments ...................................................................................................... 69
8. Summary ................................................................................................................................................ 71
Reference materials .................................................................................................................................. 72
USO
RES
TRIT
O
Multichannel Monitoring Tutorial Booklet (M2TB) rev. 3.5.2
Masataka Nakahara : SONA Corporation ©2005 YAMAHA Corporation, ©2005 SONA Corporation
3 / 74
Foreword
Surround sound has evolved into more than the experience heard in cinemas. Through the introduction of the DVD, it has invaded most every aspect of our lives — our homes, our cars, and even our workplaces. We now listen to multi-channel audio delivered via television programs, video games, and even by the music of our favorite bands. With the introduction of the DM2000, DM1000, and O2R96 Digital Consoles, Yamaha provides a platform that includes complete surround sound mixing and monitoring capabilities for studios of all types. These consoles offer a vast array of features and functions that enable the user to create a world of multi-channel content.
Masataka Nakahara (the celebrated acoustician/studio designer and the author of this booklet) and SONA
Corporation have designed and supported numerous THX pm3 Certified Studios. As the THX pm3
representatives in Japan, they continually inform and educate studios owners in the calibration and design
of studio playback systems. During the development of these consoles, Mr. Nakahara offered his years of
experience to assist in the design of the surround monitoring capabilities. In conjunction with THX
engineers, the release of the Version2 software expands their features even further. This THX pm3
Approved revision includes the addition of THX presets for film, DVD, and music mixing. These are the
same settings used in THX certified studios.
Studios have a long track record in mixing mono and stereo content, but for some industry professionals,
multi-channel mixing is relatively new. There are more channels, more equipment, and more techniques
to be learned. How do you set up your studio? Do I use bass management? There are many questions to be
answered. This booklet offers an excellent compilation of the knowledge required to construct a
properly configured surround playback environment. Much of this document shares the same principles as
THX pm3 program. We are proud of our association with Yamaha, Mr. Nakahara, and SONA Corporation
and their efforts to create a manual to help guide the user. It is my sincere wish that engineers carefully
read this guidebook in order to obtain an accurate understanding of the surround monitoring functionality
provided by the Yamaha digital consoles. Here are the tools. Now, it's up to you to create the
perfect mix.
Steven P. Martz
THX Ltd.
USO
RES
TRIT
O
4 / 74
Multichannel Monitoring Tutorial Booklet (M2TB) rev. 3.5.2
Masataka Nakahara : SONA Corporation ©2005 YAMAHA Corporation, ©2005 SONA Corporation
Preface
As one whose profession is the acoustical design of studios, I place great value on the parting ceremony of handing over to its new owner my creation (studio) whose playback environment and acoustical response I have ensured.
In order to actualize these characteristics in a multichannel studio, it is necessary to collect the fragmentary technical information provided by various standards organizations and manufacturers, and then to organize and understand this information.
Doing so takes an enormous amount of time, but one of the most valuable things I gained from the process has been friendships with many superb professionals in the field, including Mr. Steven Martz from THX.
As the lessons I learned from them began to take root in me, I have been acquiring valuable new strategies
and techniques for studio design.
Initially, I had doubts regarding techniques that seemed at first glance to conflict with a professional approach, such as bass management and diffused surround, but as I spent time with professionals of multi-channel audio, I came to see why many top-ranked experts with far more experience than myself held these opinions and requirements for surround studios. In the process, I gradually obtained a glimpse of various problems and aspects of surround playback that lie behind such questions.
This publication is a valuable booklet that brings together much valuable information obtained from first- rate professionals such as Steven from THX. I consider myself to have been a “ghost-writer” for these experts, and think of them as the real authors of this booklet.
I would like to take this opportunity to extend my thanks to each of them.
In view of these intentions, portions of this booklet dealing with various standards have been written so as
to list the various multichannel formats as broadly, fairly, and accurately as possible.
I beg the indulgence of the reader for allowing me to include material that represents my own opinion as an acoustic designer.
In my opinion, user experience as a listener is of great value in the production process.
In order for this to be so, a space for hearing multichannel audio in a correct playback environment is a requirement not only for commercial applications but also for personal applications. This is a case of “one hearing is better than a hundred views.”
It is my hope that this booklet will be a step toward obtaining the “hundred views” that will give you the confidence to construct your own multichannel playback environment.
Masataka Nakahara, author SONA Corporation
USO
RES
TRIT
O
5 / 74
Multichannel Monitoring Tutorial Booklet (M2TB) rev. 3.5.2
Masataka Nakahara : SONA Corporation ©2005 YAMAHA Corporation, ©2005 SONA Corporation
1. Introduction
The most important consideration for a studio monitoring environment is that “the response of all channels be consistent.” The second most important consideration is that this consistent response be “good response.”
We could list numerous parameters for deciding whether the response is “good,” ranging from subjective to physical, but the key point is that there be no large peaks or dips in the frequency response.
In the case of two-channel, it is fairly easy to create an environment in which “the response of all
channels — i.e., L and R — is consistent.” We simply need to ensure that the shape of the room and the
placement of the speakers is symmetrical between left and right. In the case of multi-channel, on the other hand, it is often difficult to obtain a consistent playback
response for all channels simply by creating a symmetrical speaker placement and room shape.
Mixing of the final product must be done in a properly configured playback environment.
No matter how high the grade of your equipment, it is impossible to create a final mix unless you have a
good-sounding playback environment.
The essential identity of a professional studio is in its good monitoring environment.
The arrival of multi-channel is a good opportunity for us to reconsider the question of “what is a studio
monitoring environment?”
USO
RES
TRIT
O
6 / 74
Multichannel Monitoring Tutorial Booklet (M2TB) rev. 3.5.2
Masataka Nakahara : SONA Corporation ©2005 YAMAHA Corporation, ©2005 SONA Corporation
L R
3-1ch
S
2. What is surround?
1-1. Stereo and surround
“Multi-channel” is sometimes called “surround,” and “two-channel” is often called “stereo.”
The precise terms are as follows.
Correct term two-channel stereophonic Abbreviation two-channel Common term stereo
Correct term multi-channel stereophonic
Abbreviation multi-channel
Common term surround
“Stereo (-phonic) = spatial acoustics”
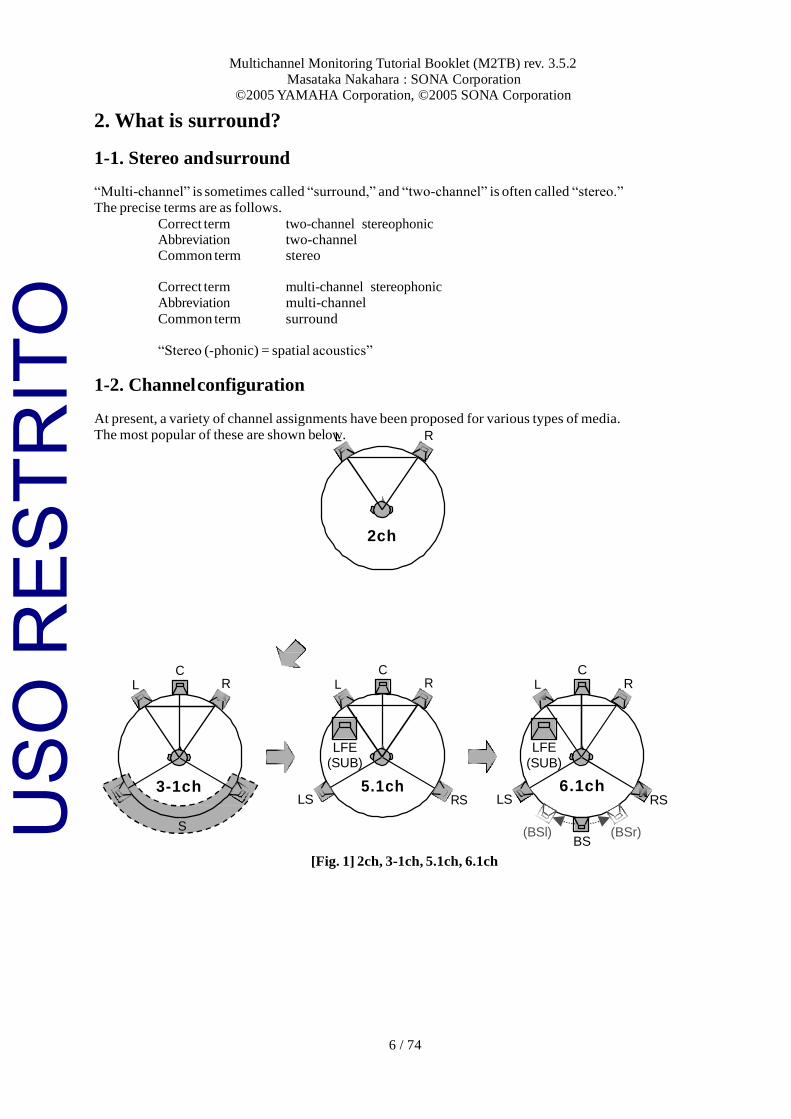
1-2. Channel configuration
At present, a variety of channel assignments have been proposed for various types of media.
The most popular of these are shown below.
C C C L R L R
LFE (SUB)
5.1ch LS RS
LFE
(SUB)
6.1ch LS RS
(BSl) (BSr)
BS
[Fig. 1] 2ch, 3-1ch, 5.1ch, 6.1ch
L R
2ch
USO
RES
TRIT
O
7 / 74
Multichannel Monitoring Tutorial Booklet (M2TB) rev. 3.5.2
Masataka Nakahara : SONA Corporation ©2005 YAMAHA Corporation, ©2005 SONA Corporation
1-2-1. 3-1 ch
This method is based on a two-channel system (L, R), and adds a center channel (C) and surround channel (S). Although there are two surround speakers, one each at left and right, the playback is monaural.
The “3” in “3-1” indicates L, C, and R, and the “–1” indicates S. Note that if “3-1” is expressed as “3.1,” this means “L, C, R” + “LFE” .
1-2-2. 5.1 ch
This method is based on the 3-1 ch system, but changes the surround to stereo (LS, RS) and adds an LFE (Low Frequency Effect) channel for low-frequency effects.
The LFE channel is played back through a dedicated subwoofer designed for low-frequency playback.
1-2-3. 6.1 ch
This method is based on the 5.1 ch system, and adds a new back-surround channel (BS).
If two speakers are provided to play back the back-surround channel, these are sometimes called BSl and BSr, but the signal that is played back is a monaural signal where BSl = BSr.
1-2-4. Other
As other formats, there is 3-2 (without LFE) and 2-2 (without C and LFE), which are based on 5.1ch but
do not use specific channel(s) of them
As a format with a greater number of channels than 6.1ch, we have 7.1ch. 7.1ch can be subdivided into the SDDS format which is used in film, and Dolby ProLogic IIx which is
used in DVD-Video etc. SDDS is a discrete 7.1ch format which adds LC and RC channels between L and C and between R and C
respectively, and is used in applications such as supplementing the center gap between screen speakers in large movie theaters. Since the 7.1ch SDDS format is compatible with 5.1ch, we can say that SDDS
supports both 5.1ch and 7.1ch configurations.
Dolby ProLogic IIx uses matrix logic processing within the decoder to stereoize BS (BSl, BSr), and at
present is targeted for surround processing in the playback system of consumer decoders (receivers).
Current multi-channel systems were developed to maintain compatibility with previous systems, and have
not been researched or developed in order to reproduce a 360° virtual acoustic space.
This means that if you expect current multi-channel systems to deliver full virtual acoustic playback capability, you will be at your wits end. In particular, sound images directly to the side (the phantom sound image of L and LS, or the phantom sound image of R and RS) are difficult to portray with current
speaker configurations, due to the physiology of hearing.
The key to multi-channel production is how to make effective use of the newly-obtained channels to
create a product with the maximum “entertainment value.” USO
RES
TRIT
O
8 / 74
Multichannel Monitoring Tutorial Booklet (M2TB) rev. 3.5.2
Masataka Nakahara : SONA Corporation ©2005 YAMAHA Corporation, ©2005 SONA Corporation
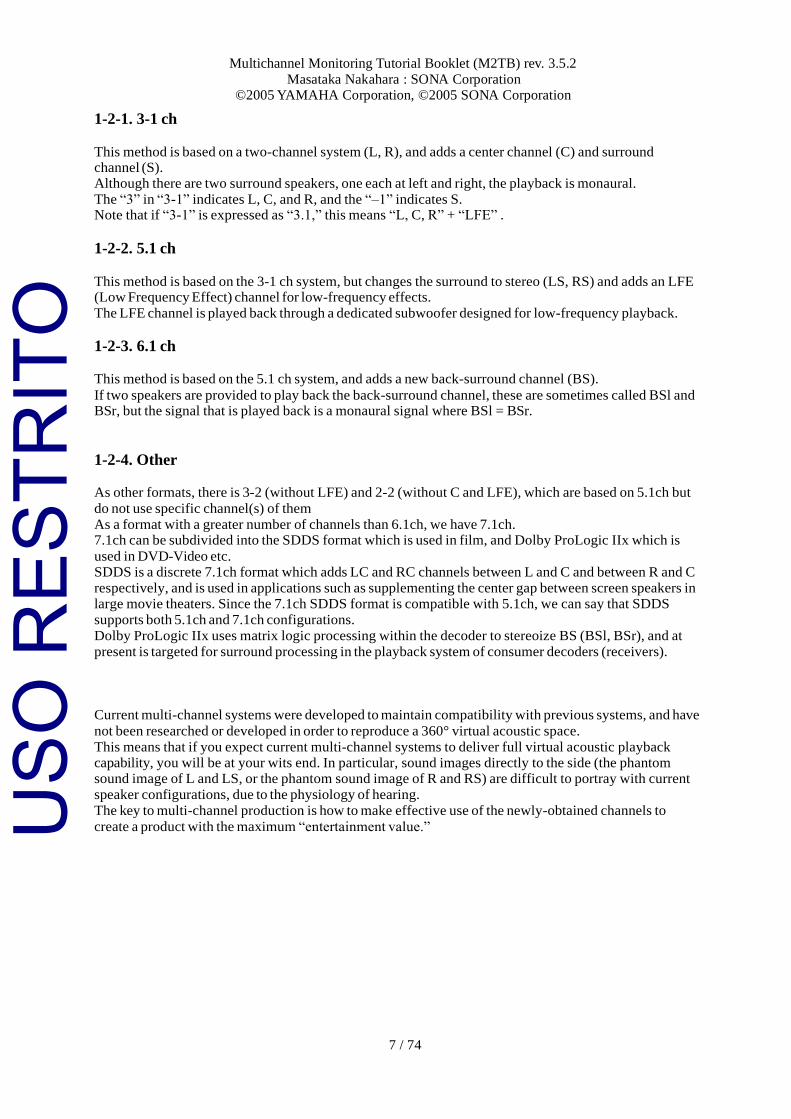
1-3. Key points for multi-channel monitoring
In our consideration of multi-channel monitoring, it is important to understand the following three key points.
[Fig. 2] Three keys of multichannel monitoring
In addition to the above three points, this document will discuss the construction of a monitor system, and the measurements and adjustments that are necessary in order to create a multi-channel playback environment.
It should be noted that this booklet is written for medium-to-small multichannel studios, and that much of the material (e.g., speaker placement, delay adjustment, bass management) will not apply to surround monitoring in a large space, such as in a movie theater or in a dubbing studio where the final mix of a film
is being made.
Multichannel
formats
Playback environment
Bass management
USO
RES
TRIT
O
9 / 74
Multichannel Monitoring Tutorial Booklet (M2TB) rev. 3.5.2
Masataka Nakahara : SONA Corporation ©2005 YAMAHA Corporation, ©2005 SONA Corporation
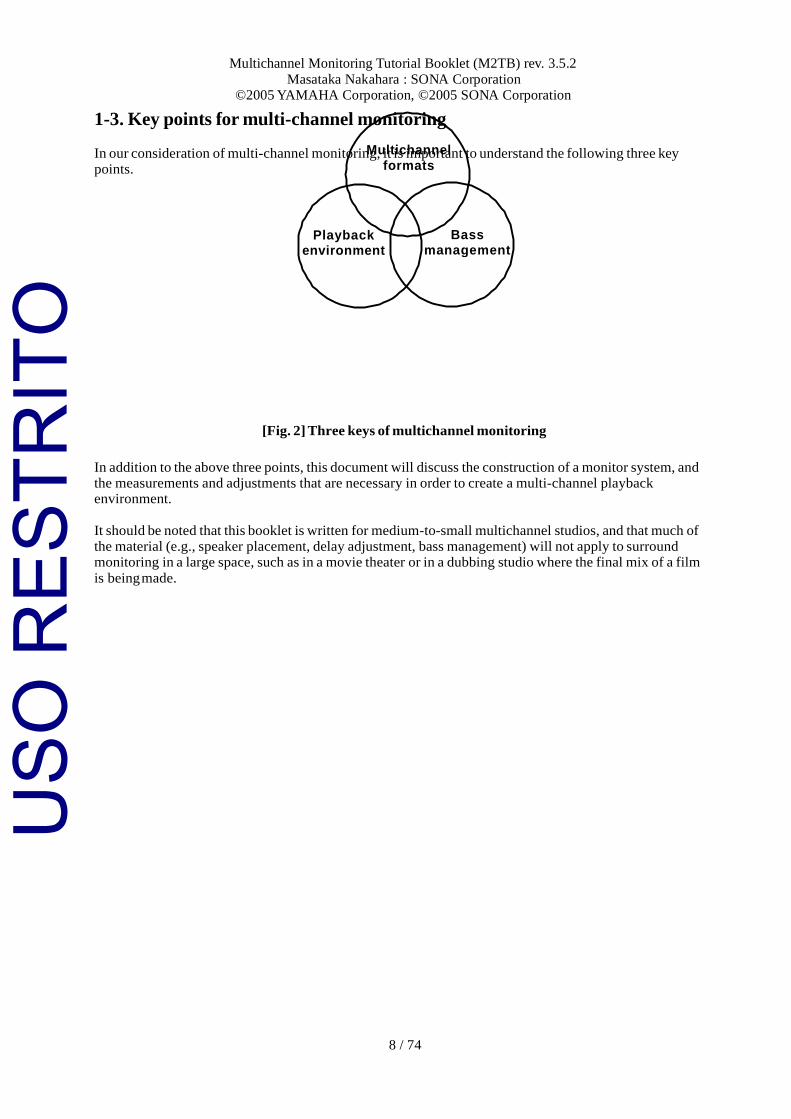
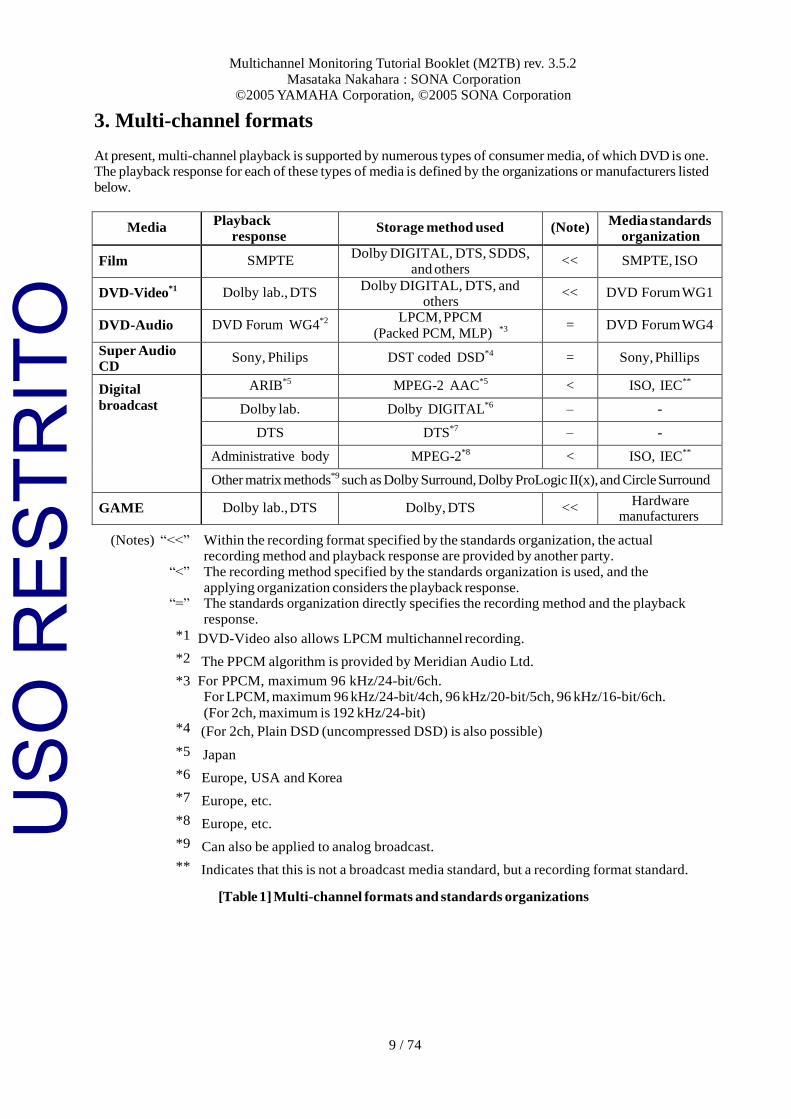
3. Multi-channel formats
At present, multi-channel playback is supported by numerous types of consumer media, of which DVD is one. The playback response for each of these types of media is defined by the organizations or manufacturers listed below.
Media Playback
response
specification
Storage method used (Note) Media standards
organization
Film SMPTE Dolby DIGITAL, DTS, SDDS,
and others << SMPTE, ISO
DVD-Video*1 Dolby lab., DTS
Dolby DIGITAL, DTS, and others
<< DVD Forum WG1
DVD-Audio DVD Forum WG4*2
LPCM, PPCM
(Packed PCM, MLP) *3
= DVD Forum WG4
Super Audio CD
Sony, Philips DST coded DSD*4 = Sony, Phillips
Digital
broadcast
ARIB*5 MPEG-2 AAC*5
< ISO, IEC**
Dolby lab. Dolby DIGITAL*6 – -
DTS DTS*7 – -
Administrative body MPEG-2*8 < ISO, IEC**
Other matrix methods*9 such as Dolby Surround, Dolby ProLogic II(x), and Circle Surround
GAME Dolby lab., DTS Dolby, DTS << Hardware
manufacturers
(Notes) “<<” Within the recording format specified by the standards organization, the actual recording method and playback response are provided by another party.
“<” The recording method specified by the standards organization is used, and the
applying organization considers the playback response. “=” The standards organization directly specifies the recording method and the playback
response.
*1 DVD-Video also allows LPCM multichannel recording.
*2 The PPCM algorithm is provided by Meridian Audio Ltd.
*3 For PPCM, maximum 96 kHz/24-bit/6ch. For LPCM, maximum 96 kHz/24-bit/4ch, 96 kHz/20-bit/5ch, 96 kHz/16-bit/6ch.
(For 2ch, maximum is 192 kHz/24-bit) *4 (For 2ch, Plain DSD (uncompressed DSD) is also possible)
*5 Japan
*6 Europe, USA and Korea
*7 Europe, etc.
*8 Europe, etc.
*9 Can also be applied to analog broadcast.
** Indicates that this is not a broadcast media standard, but a recording format standard.
[Table 1] Multi-channel formats and standards organizations
USO
RES
TRIT
O
Multichannel Monitoring Tutorial Booklet (M2TB) rev. 3.5.2
Masataka Nakahara : SONA Corporation ©2005 YAMAHA Corporation, ©2005 SONA Corporation
10 / 74
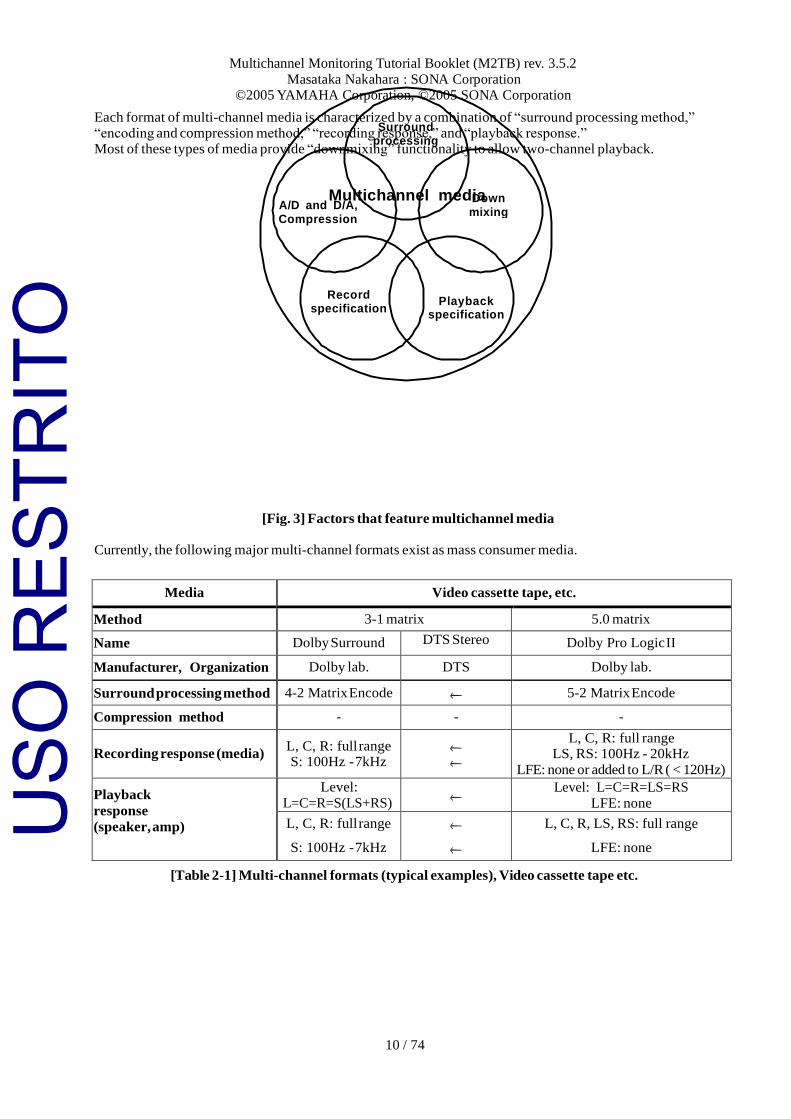
Each format of multi-channel media is characterized by a combination of “surround processing method,” “encoding and compression method,” “recording response,” and “playback response.” Most of these types of media provide “downmixing” functionality to allow two-channel playback.
Multichannel media
[Fig. 3] Factors that feature multichannel media
Currently, the following major multi-channel formats exist as mass consumer media.
Media Video cassette tape, etc.
Method 3-1 matrix 5.0 matrix
Name Dolby Surround DTS Stereo Dolby Pro Logic II
Manufacturer, Organization Dolby lab. DTS Dolby lab.
Surround processing method 4-2 Matrix Encode 5-2 Matrix Encode
Compression method - - -
Recording response (media) L, C, R: full range S: 100Hz - 7kHz
L, C, R: full range LS, RS: 100Hz - 20kHz
LFE: none or added to L/R ( < 120Hz)
Playback
response
(speaker, amp)
Level:
L=C=R=S(LS+RS)
Level: L=C=R=LS=RS
LFE: none
L, C, R: full range
S: 100Hz - 7kHz
L, C, R, LS, RS: full range
LFE: none
[Table 2-1] Multi-channel formats (typical examples), Video cassette tape etc.
Surround processing
A/D and D/A, Compression
Down mixing
Record specification
Playback specification
USO
RES
TRIT
O
Multichannel Monitoring Tutorial Booklet (M2TB) rev. 3.5.2
Masataka Nakahara : SONA Corporation ©2005 YAMAHA Corporation, ©2005 SONA Corporation
11 / 74
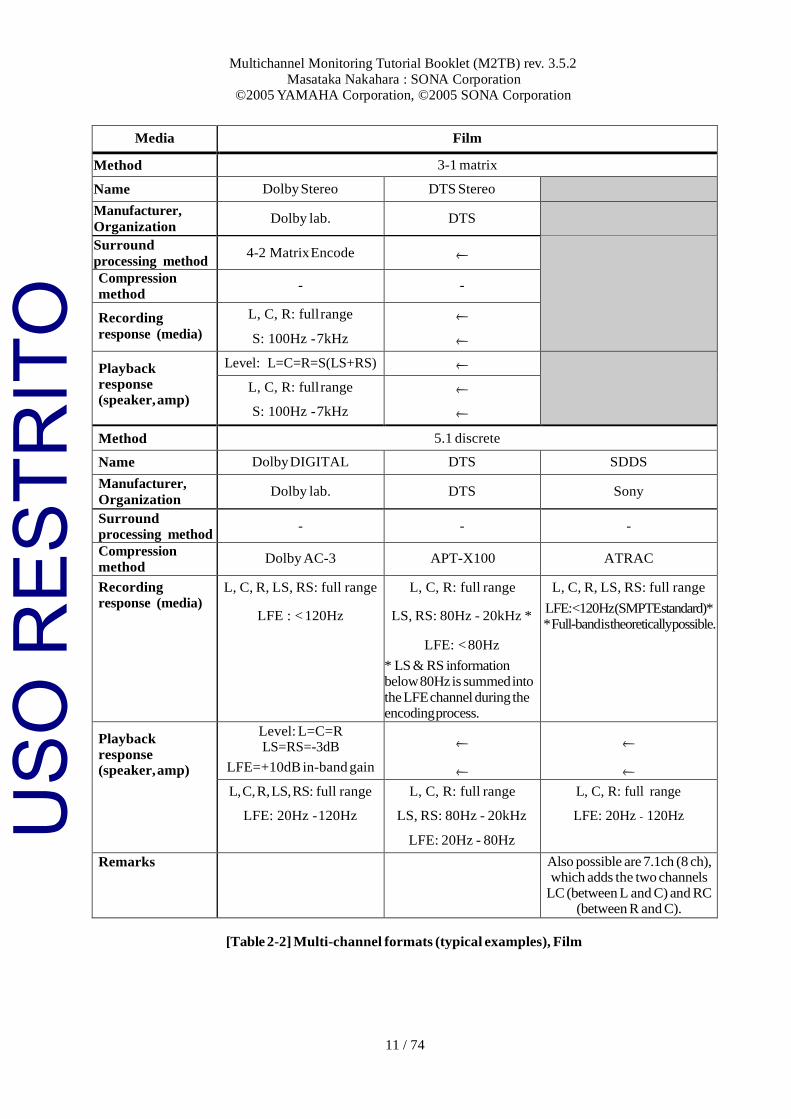
Media Film
Method 3-1 matrix
Name Dolby Stereo DTS Stereo
Manufacturer,
Organization Dolby lab. DTS
Surround
processing method 4-2 Matrix Encode
Compression
method - -
Recording
response (media)
L, C, R: full range
S: 100Hz - 7kHz
Playback response
(speaker, amp)
Level: L=C=R=S(LS+RS)
L, C, R: full range
S: 100Hz - 7kHz
Method 5.1 discrete
Name Dolby DIGITAL DTS SDDS
Manufacturer,
Organization Dolby lab. DTS Sony
Surround
processing method - - -
Compression
method Dolby AC-3 APT-X100 ATRAC
Recording
response (media) L, C, R, LS, RS: full range
LFE : < 120Hz
L, C, R: full range
LS, RS: 80Hz - 20kHz *
LFE: < 80Hz
* LS & RS information below 80Hz is summed into
the LFE channel during the encoding process.
L, C, R, LS, RS: full range
LFE: <120Hz (SMPTE standard)* * Full-band is theoretically possible.
Playback
response (speaker, amp)
Level: L=C=R LS=RS=-3dB
LFE=+10dB in-band gain
L, C, R, LS, RS: full range
LFE: 20Hz - 120Hz
L, C, R: full range
LS, RS: 80Hz - 20kHz
LFE: 20Hz - 80Hz
L, C, R: full range
LFE: 20Hz - 120Hz
Remarks Also possible are 7.1ch (8 ch), which adds the two channels
LC (between L and C) and RC (between R and C).
[Table 2-2] Multi-channel formats (typical examples), Film
USO
RES
TRIT
O
Multichannel Monitoring Tutorial Booklet (M2TB) rev. 3.5.2
Masataka Nakahara : SONA Corporation ©2005 YAMAHA Corporation, ©2005 SONA Corporation
12 / 74
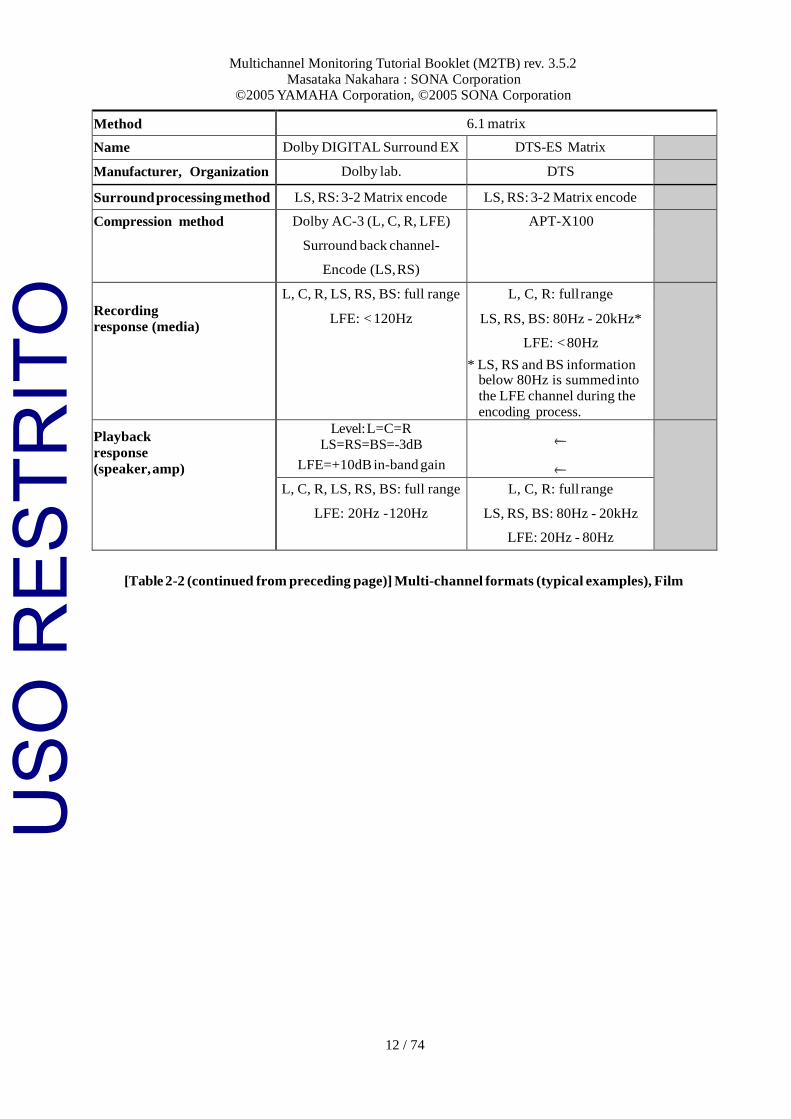
Method 6.1 matrix
Name Dolby DIGITAL Surround EX DTS-ES Matrix
Manufacturer, Organization Dolby lab. DTS
Surround processing method LS, RS: 3-2 Matrix encode LS, RS: 3-2 Matrix encode
Compression method Dolby AC-3 (L, C, R, LFE)
Surround back channel-
Encode (LS, RS)
APT-X100
Recording
response (media)
L, C, R, LS, RS, BS: full range
LFE: < 120Hz
L, C, R: full range
LS, RS, BS: 80Hz - 20kHz*
LFE: < 80Hz
* LS, RS and BS information below 80Hz is summed into
the LFE channel during the
encoding process.
Playback
response
(speaker, amp)
Level: L=C=R
LS=RS=BS=-3dB
LFE=+10dB in-band gain
L, C, R, LS, RS, BS: full range
LFE: 20Hz - 120Hz
L, C, R: full range
LS, RS, BS: 80Hz - 20kHz
LFE: 20Hz - 80Hz
[Table 2-2 (continued from preceding page)] Multi-channel formats (typical examples), Film
USO
RES
TRIT
O
Multichannel Monitoring Tutorial Booklet (M2TB) rev. 3.5.2
Masataka Nakahara : SONA Corporation ©2005 YAMAHA Corporation, ©2005 SONA Corporation
13 / 74
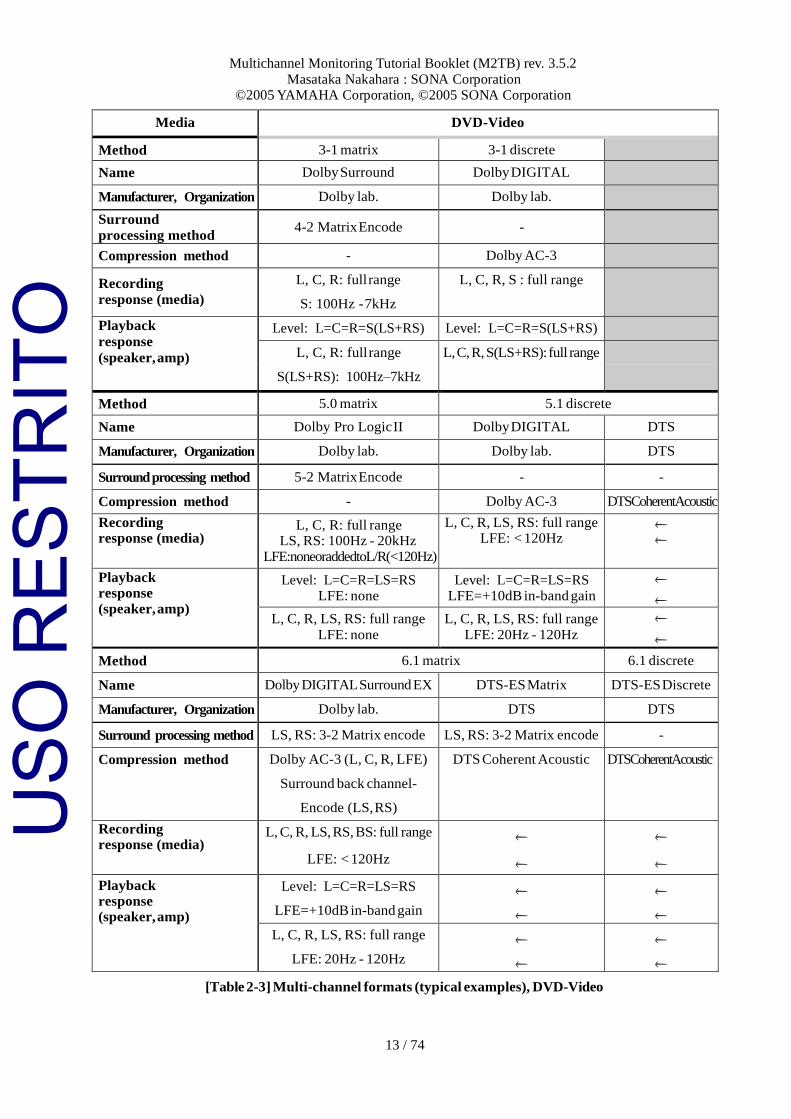
Media DVD-Video
Method 3-1 matrix 3-1 discrete
Name Dolby Surround Dolby DIGITAL
Manufacturer, Organization Dolby lab. Dolby lab.
Surround
processing method 4-2 Matrix Encode -
Compression method - Dolby AC-3
Recording
response (media)
L, C, R: full range
S: 100Hz - 7kHz
L, C, R, S : full range
Playback
response
(speaker, amp)
Level: L=C=R=S(LS+RS) Level: L=C=R=S(LS+RS)
L, C, R: full range
S(LS+RS): 100Hz–7kHz
L, C, R, S(LS+RS): full range
Method 5.0 matrix 5.1 discrete
Name Dolby Pro Logic II Dolby DIGITAL DTS
Manufacturer, Organization Dolby lab. Dolby lab. DTS
Surround processing method 5-2 Matrix Encode - -
Compression method - Dolby AC-3 DTSCoherentAcoustic
Recording response (media)
L, C, R: full range LS, RS: 100Hz - 20kHz
LFE:noneoraddedtoL/R(<120Hz)
L, C, R, LS, RS: full range LFE: < 120Hz
Playback response
(speaker, amp)
Level: L=C=R=LS=RS LFE: none
Level: L=C=R=LS=RS LFE=+10dB in-band gain
L, C, R, LS, RS: full range
LFE: none
L, C, R, LS, RS: full range
LFE: 20Hz - 120Hz
Method 6.1 matrix 6.1 discrete
Name Dolby DIGITAL Surround EX DTS-ES Matrix DTS-ES Discrete
Manufacturer, Organization Dolby lab. DTS DTS
Surround processing method LS, RS: 3-2 Matrix encode LS, RS: 3-2 Matrix encode -
Compression method Dolby AC-3 (L, C, R, LFE)
Surround back channel-
Encode (LS, RS)
DTS Coherent Acoustic DTSCoherentAcoustic
Recording response (media)
L, C, R, LS, RS, BS: full range
LFE: < 120Hz
Playback response (speaker, amp)
Level: L=C=R=LS=RS
LFE=+10dB in-band gain
L, C, R, LS, RS: full range
LFE: 20Hz - 120Hz
[Table 2-3] Multi-channel formats (typical examples), DVD-Video
USO
RES
TRIT
O
Multichannel Monitoring Tutorial Booklet (M2TB) rev. 3.5.2
Masataka Nakahara : SONA Corporation ©2005 YAMAHA Corporation, ©2005 SONA Corporation
14 / 74
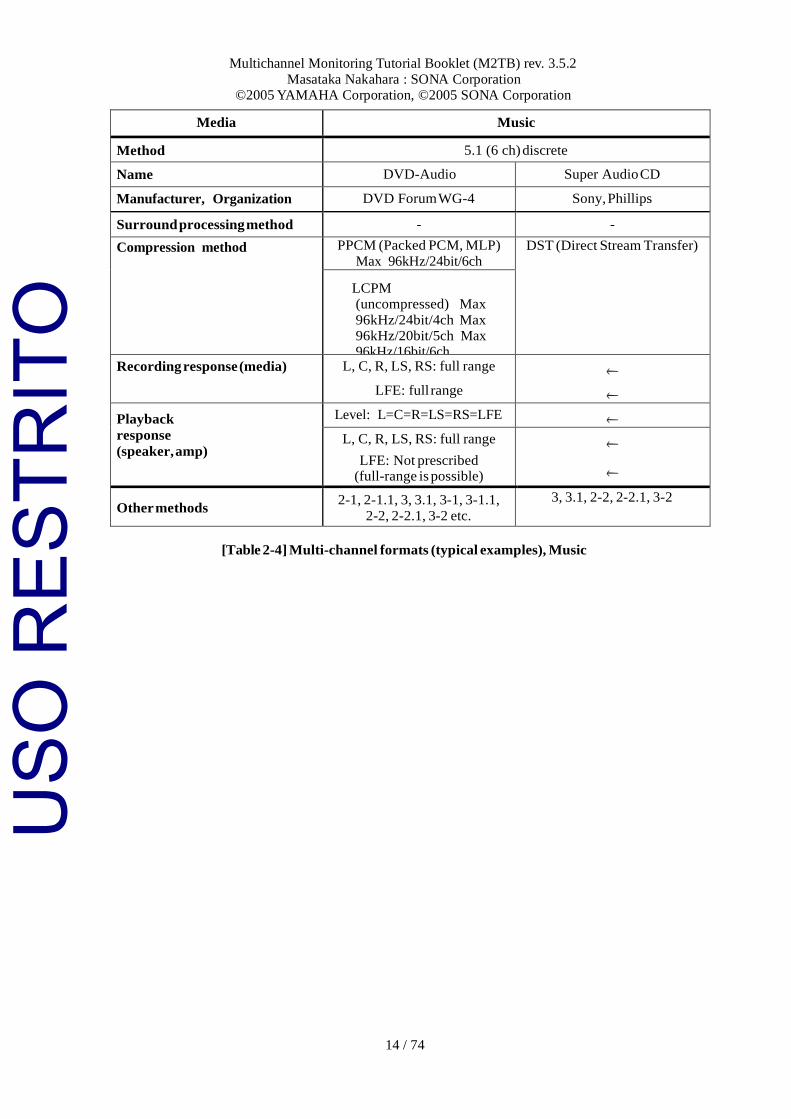
Media Music
Method 5.1 (6 ch) discrete
Name DVD-Audio Super Audio CD
Manufacturer, Organization DVD Forum WG-4 Sony, Phillips
Surround processing method - -
Compression method PPCM (Packed PCM, MLP)
Max 96kHz/24bit/6ch DST (Direct Stream Transfer)
LCPM (uncompressed) Max
96kHz/24bit/4ch Max 96kHz/20bit/5ch Max 96kHz/16bit/6ch
Recording response (media) L, C, R, LS, RS: full range
LFE: full range
Playback
response
(speaker, amp)
Level: L=C=R=LS=RS=LFE
L, C, R, LS, RS: full range
LFE: Not prescribed (full-range is possible)
Other methods 2-1, 2-1.1, 3, 3.1, 3-1, 3-1.1,
2-2, 2-2.1, 3-2 etc.
3, 3.1, 2-2, 2-2.1, 3-2
[Table 2-4] Multi-channel formats (typical examples), Music
USO
RES
TRIT
O
Multichannel Monitoring Tutorial Booklet (M2TB) rev. 3.5.2
Masataka Nakahara : SONA Corporation ©2005 YAMAHA Corporation, ©2005 SONA Corporation
15 / 74
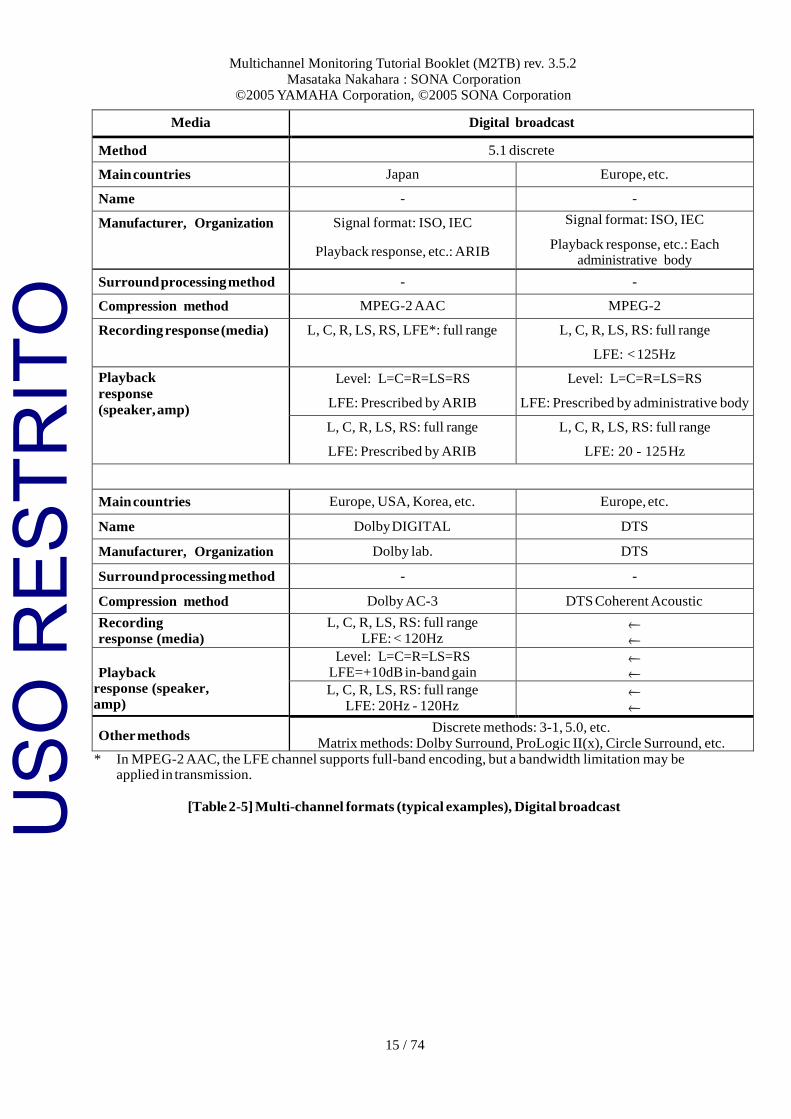
Media Digital broadcast
Method 5.1 discrete
Main countries Japan Europe, etc.
Name - -
Manufacturer, Organization Signal format: ISO, IEC
Playback response, etc.: ARIB
Signal format: ISO, IEC
Playback response, etc.: Each administrative body
Surround processing method - -
Compression method MPEG-2 AAC MPEG-2
Recording response (media) L, C, R, LS, RS, LFE*: full range L, C, R, LS, RS: full range
LFE: < 125Hz
Playback
response
(speaker, amp)
Level: L=C=R=LS=RS
LFE: Prescribed by ARIB
Level: L=C=R=LS=RS
LFE: Prescribed by administrative body
L, C, R, LS, RS: full range
LFE: Prescribed by ARIB
L, C, R, LS, RS: full range
LFE: 20 - 125 Hz
Main countries Europe, USA, Korea, etc. Europe, etc.
Name Dolby DIGITAL DTS
Manufacturer, Organization Dolby lab. DTS
Surround processing method - -
Compression method Dolby AC-3 DTS Coherent Acoustic
Recording
response (media)
L, C, R, LS, RS: full range
LFE: < 120Hz
Playback
response (speaker,
amp)
Level: L=C=R=LS=RS LFE=+10dB in-band gain
L, C, R, LS, RS: full range
LFE: 20Hz - 120Hz
Other methods Discrete methods: 3-1, 5.0, etc.
Matrix methods: Dolby Surround, ProLogic II(x), Circle Surround, etc.
* In MPEG-2 AAC, the LFE channel supports full-band encoding, but a bandwidth limitation may be applied in transmission.
[Table 2-5] Multi-channel formats (typical examples), Digital broadcast USO
RES
TRIT
O
Multichannel Monitoring Tutorial Booklet (M2TB) rev. 3.5.2
Masataka Nakahara : SONA Corporation ©2005 YAMAHA Corporation, ©2005 SONA Corporation
16 / 74
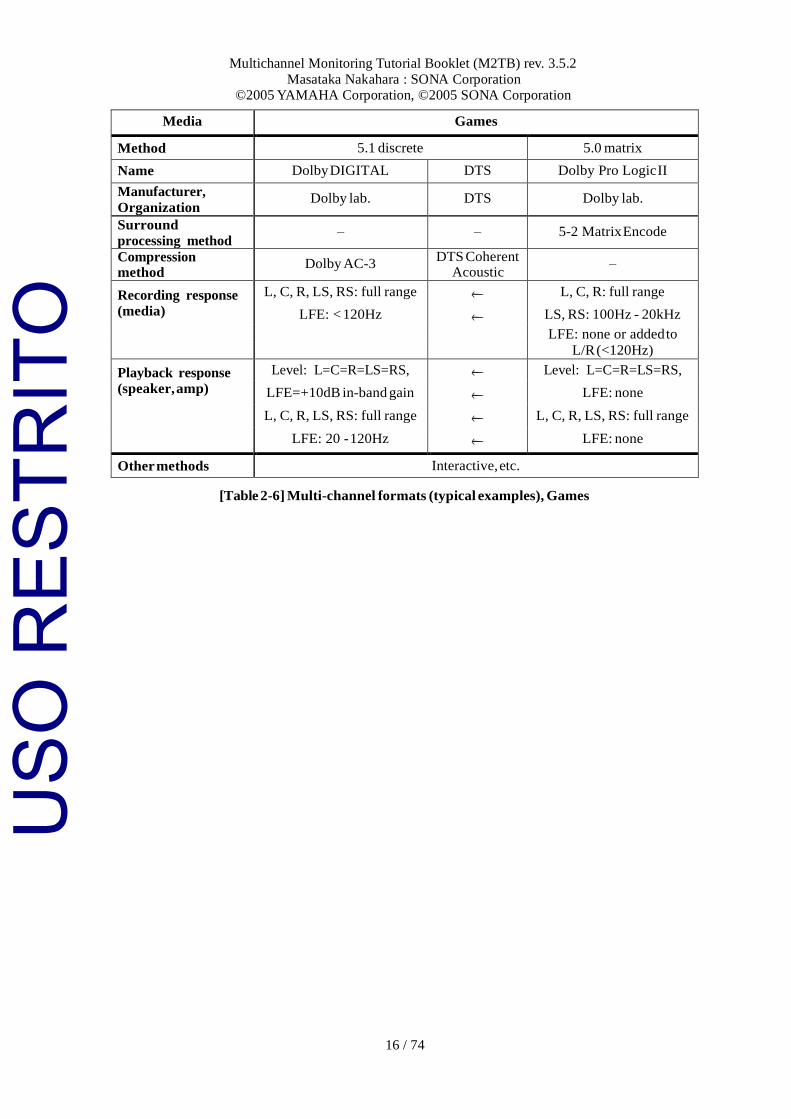
Media Games
Method 5.1 discrete 5.0 matrix
Name Dolby DIGITAL DTS Dolby Pro Logic II
Manufacturer,
Organization Dolby lab. DTS Dolby lab.
Surround
processing method – – 5-2 Matrix Encode
Compression method
Dolby AC-3 DTS Coherent
Acoustic –
Recording response L, C, R, LS, RS: full range
L, C, R: full range
(media) LFE: < 120Hz LS, RS: 100Hz - 20kHz
LFE: none or added to
L/R (<120Hz)
Playback response Level: L=C=R=LS=RS,
Level: L=C=R=LS=RS,
(speaker, amp) LFE=+10dB in-band gain LFE: none
L, C, R, LS, RS: full range L, C, R, LS, RS: full range
LFE: 20 - 120Hz LFE: none
Other methods Interactive, etc.
[Table 2-6] Multi-channel formats (typical examples), Games
USO
RES
TRIT
O
Multichannel Monitoring Tutorial Booklet (M2TB) rev. 3.5.2
Masataka Nakahara : SONA Corporation ©2005 YAMAHA Corporation, ©2005 SONA Corporation
17 / 74
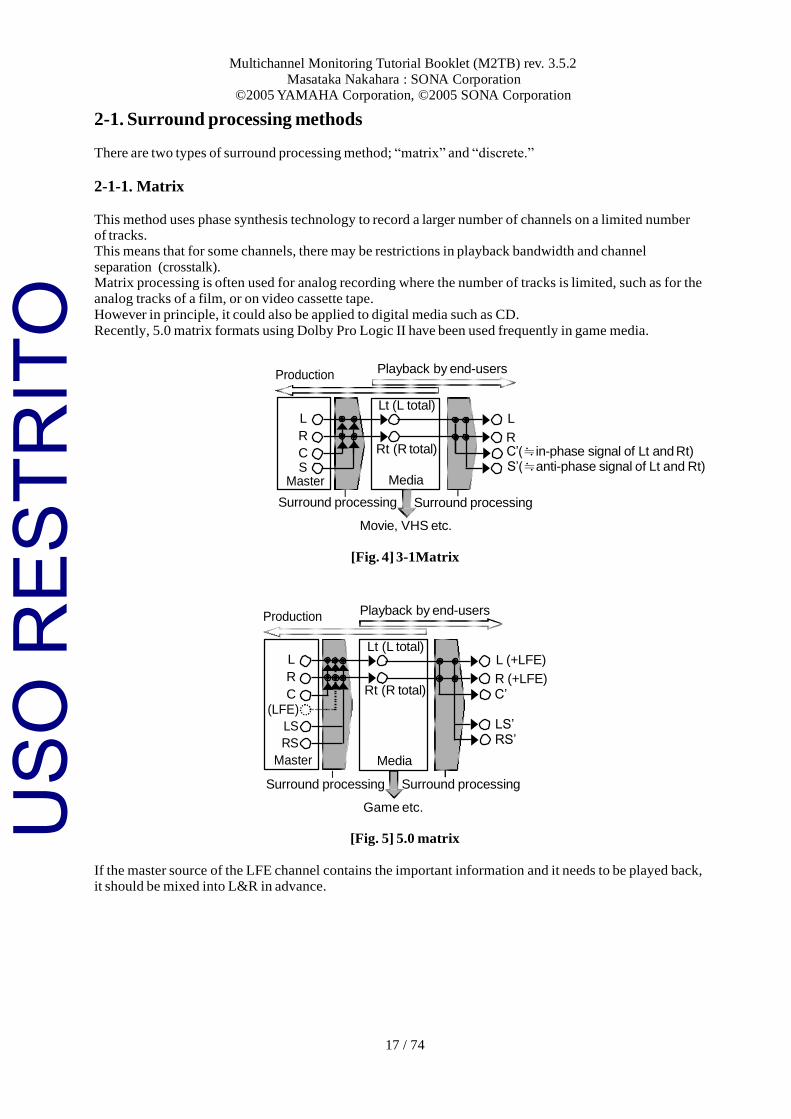
2-1. Surround processing methods
There are two types of surround processing method; “matrix” and “discrete.”
2-1-1. Matrix
This method uses phase synthesis technology to record a larger number of channels on a limited number of tracks. This means that for some channels, there may be restrictions in playback bandwidth and channel
separation (crosstalk). Matrix processing is often used for analog recording where the number of tracks is limited, such as for the
analog tracks of a film, or on video cassette tape.
However in principle, it could also be applied to digital media such as CD.
Recently, 5.0 matrix formats using Dolby Pro Logic II have been used frequently in game media.
Production Playback by end-users
L
R
C S
Master
Lt (L total)
Rt (R total)
Media
L
R C’(≒in-phase signal of Lt and Rt) S’(≒anti-phase signal of Lt and Rt)
Surround processing Surround processing
Movie, VHS etc.
[Fig. 4] 3-1Matrix
Production Playback by end-users
L
R
C (LFE)
LS
RS
Master
Lt (L total)
Rt (R total)
Media
L (+LFE)
R (+LFE) C’
LS’ RS’
Surround processing Surround processing
Game etc.
[Fig. 5] 5.0 matrix
If the master source of the LFE channel contains the important information and it needs to be played back, it should be mixed into L&R in advance.
USO
RES
TRIT
O
Multichannel Monitoring Tutorial Booklet (M2TB) rev. 3.5.2
Masataka Nakahara : SONA Corporation ©2005 YAMAHA Corporation, ©2005 SONA Corporation
18 / 74
Production Playback by end-users
L
R
C
LFE
LS
RS
BS
Master
L
R
C
LFE
LSt
RSt
Media
L
R
C
LFE
LS
RS BS’(≒in-phase signal of LSt and RSt)
Surround processing Surround processing
Movie, DVD-Video etc.
[Fig. 6] 6.1 matrix
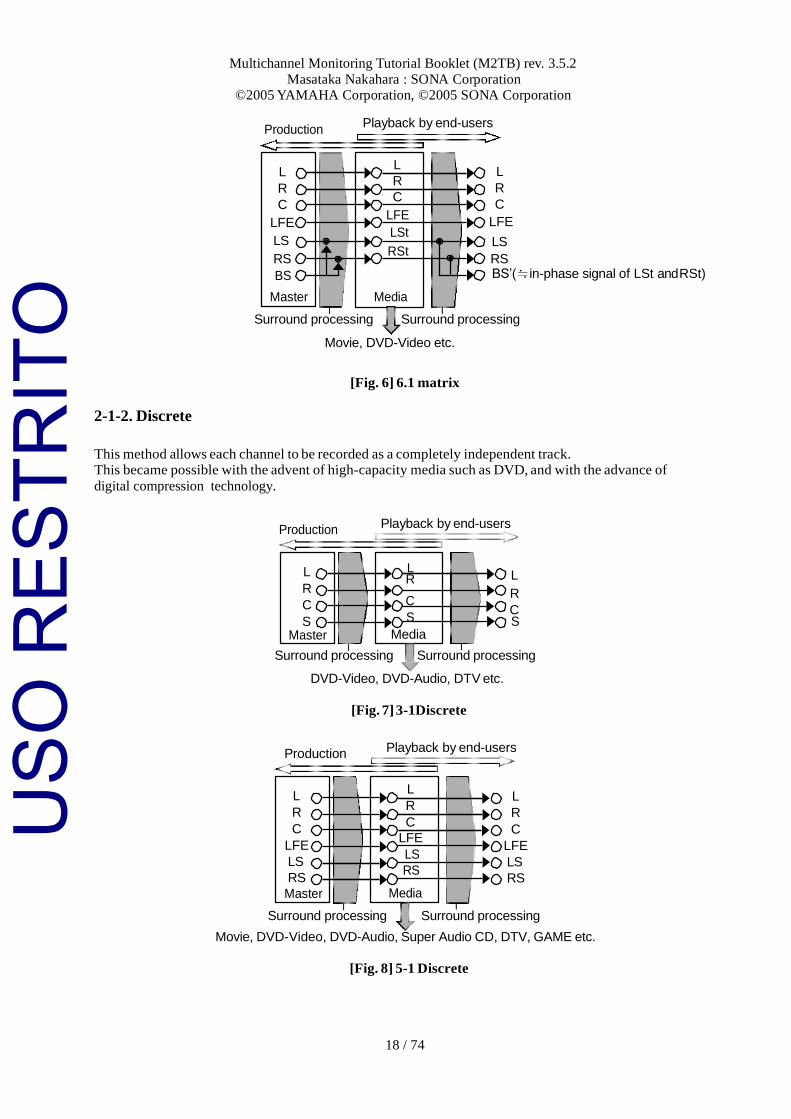
2-1-2. Discrete
This method allows each channel to be recorded as a completely independent track. This became possible with the advent of high-capacity media such as DVD, and with the advance of
digital compression technology.
Production Playback by end-users
L
R
C
S Master
L L
R
C R
S C S
Media
Surround processing Surround processing
DVD-Video, DVD-Audio, DTV etc.
[Fig. 7] 3-1Discrete
Production Playback by end-users
L
R
C
LFE
LS
RS
Master
L
R
C
LFE
LS
RS
Media
L
R
C
LFE
LS
RS
Surround processing Surround processing
Movie, DVD-Video, DVD-Audio, Super Audio CD, DTV, GAME etc.
[Fig. 8] 5-1 Discrete
USO
RES
TRIT
O
Multichannel Monitoring Tutorial Booklet (M2TB) rev. 3.5.2
Masataka Nakahara : SONA Corporation ©2005 YAMAHA Corporation, ©2005 SONA Corporation
19 / 74
Production Playback by end-users
L
C
R
LFE LS
L
C
R
LFE
LS
L
C
R
LFE LS
RS RS
RS
BS
Master
BS BS
Media
Surround processing Surround processing
DVD-Video
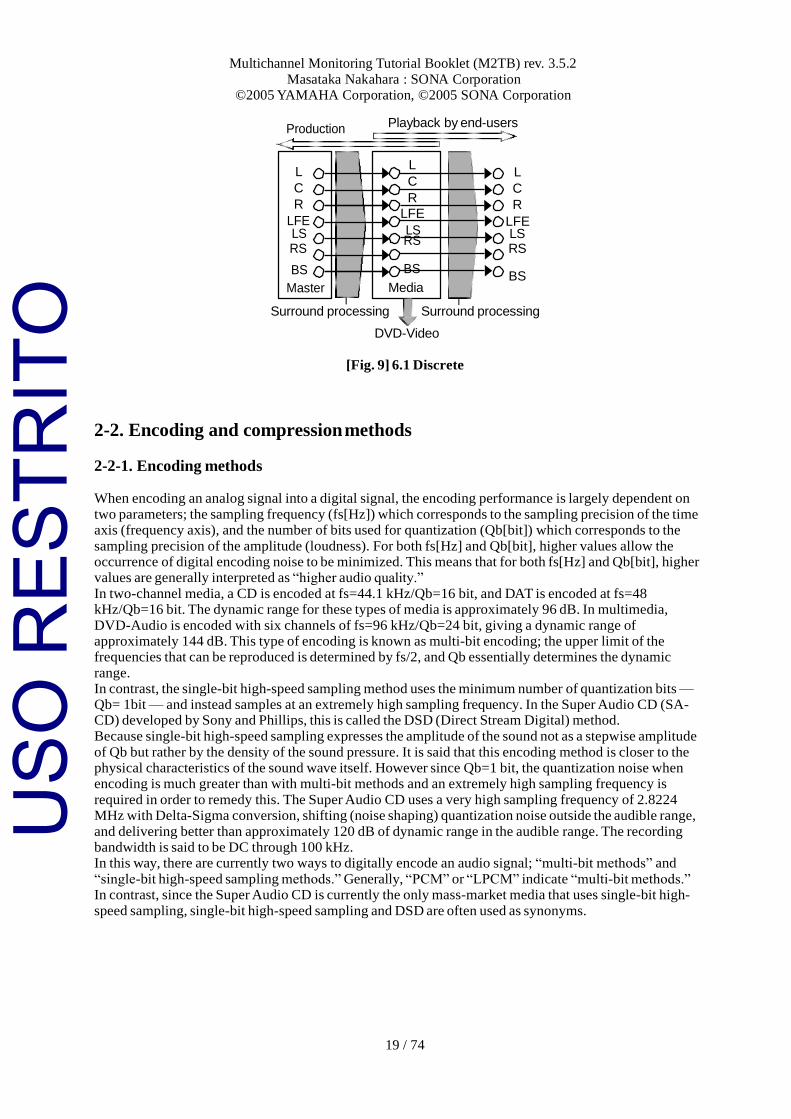
[Fig. 9] 6.1 Discrete
2-2. Encoding and compression methods
2-2-1. Encoding methods
When encoding an analog signal into a digital signal, the encoding performance is largely dependent on
two parameters; the sampling frequency (fs[Hz]) which corresponds to the sampling precision of the time axis (frequency axis), and the number of bits used for quantization (Qb[bit]) which corresponds to the
sampling precision of the amplitude (loudness). For both fs[Hz] and Qb[bit], higher values allow the occurrence of digital encoding noise to be minimized. This means that for both fs[Hz] and Qb[bit], higher values are generally interpreted as “higher audio quality.”
In two-channel media, a CD is encoded at fs=44.1 kHz/Qb=16 bit, and DAT is encoded at fs=48 kHz/Qb=16 bit. The dynamic range for these types of media is approximately 96 dB. In multimedia,
DVD-Audio is encoded with six channels of fs=96 kHz/Qb=24 bit, giving a dynamic range of approximately 144 dB. This type of encoding is known as multi-bit encoding; the upper limit of the frequencies that can be reproduced is determined by fs/2, and Qb essentially determines the dynamic
range. In contrast, the single-bit high-speed sampling method uses the minimum number of quantization bits — Qb= 1bit — and instead samples at an extremely high sampling frequency. In the Super Audio CD (SA- CD) developed by Sony and Phillips, this is called the DSD (Direct Stream Digital) method.
Because single-bit high-speed sampling expresses the amplitude of the sound not as a stepwise amplitude
of Qb but rather by the density of the sound pressure. It is said that this encoding method is closer to the physical characteristics of the sound wave itself. However since Qb=1 bit, the quantization noise when encoding is much greater than with multi-bit methods and an extremely high sampling frequency is
required in order to remedy this. The Super Audio CD uses a very high sampling frequency of 2.8224 MHz with Delta-Sigma conversion, shifting (noise shaping) quantization noise outside the audible range,
and delivering better than approximately 120 dB of dynamic range in the audible range. The recording bandwidth is said to be DC through 100 kHz. In this way, there are currently two ways to digitally encode an audio signal; “multi-bit methods” and
“single-bit high-speed sampling methods.” Generally, “PCM” or “LPCM” indicate “multi-bit methods.” In contrast, since the Super Audio CD is currently the only mass-market media that uses single-bit high-
speed sampling, single-bit high-speed sampling and DSD are often used as synonyms.
USO
RES
TRIT
O
Multichannel Monitoring Tutorial Booklet (M2TB) rev. 3.5.2
Masataka Nakahara : SONA Corporation ©2005 YAMAHA Corporation, ©2005 SONA Corporation
20 / 74
2-2-2. Compression methods
Compression methods can be broadly divided into two types; lossy compression and lossless compression. With lossy compression, the original signal cannot be recovered in its entirety from the compressed signal
that is recorded; i.e., this is irreversible compression. This method generally takes advantage of psychoacoustic phenomena to lower the redundancy of the
original signal, thus compressing it. Lossless compression allows the original signal to be completely recovered from the compressed signal that is recorded; i.e., this is reversible compression. This method is used to compress files on a computer. It uses mathematical means to lower the redundancy of the original signal, compressing it.
Thus, lossless compression delivers a lower compression ratio than lossy compression.
Examples of lossy compression
Method Media
Dolby AC-3, DTS coherent acoustic,ATRAC, MPEG-2(AAC), etc. Film, DVD-Video, digital broadcast, games, etc.
Examples of lossless compression
Method Media
MLP (PPCM: Packed PCM), DST (Direct Stream Transfer) DVD-Audio, Super Audio CD
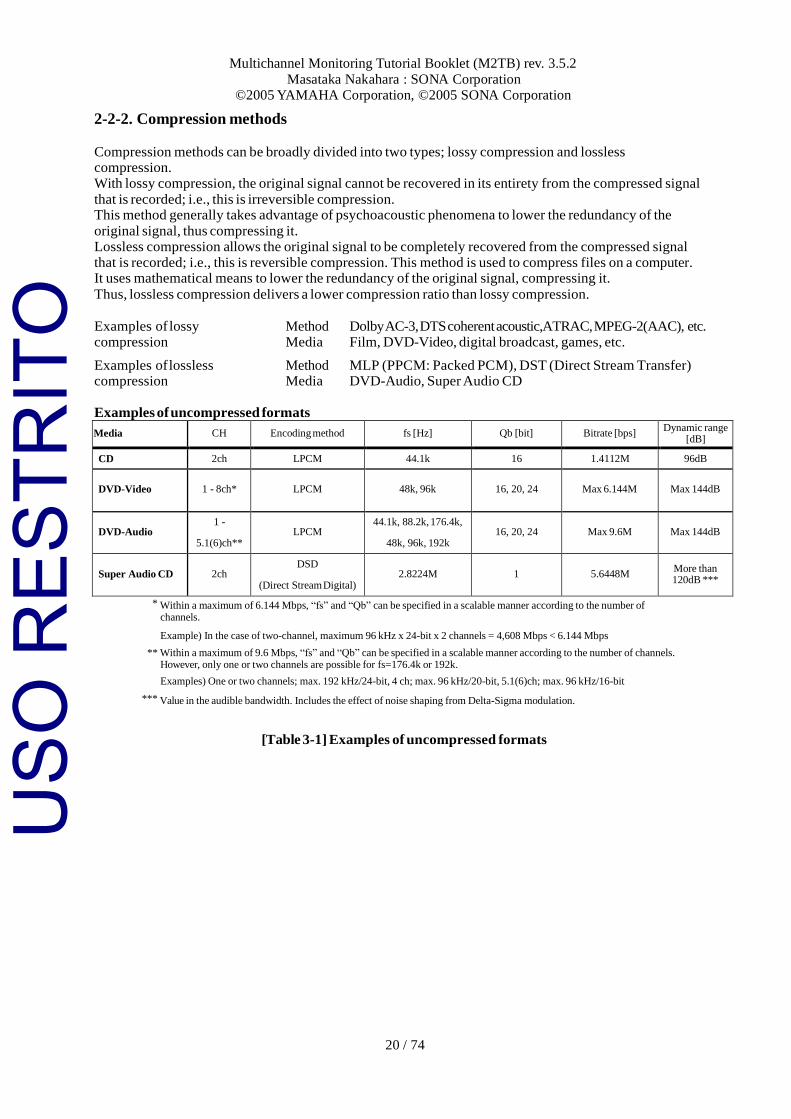
Examples of uncompressed formats
Media CH Encoding method fs [Hz] Qb [bit] Bitrate [bps] Dynamic range
[dB]
CD 2ch LPCM 44.1k 16 1.4112M 96dB
DVD-Video
1 - 8ch*
LPCM
48k, 96k
16, 20, 24
Max 6.144M
Max 144dB
DVD-Audio
1 -
5.1(6)ch**
LPCM
44.1k, 88.2k, 176.4k,
48k, 96k, 192k
16, 20, 24
Max 9.6M
Max 144dB
Super Audio CD
2ch
DSD
(Direct Stream Digital)
2.8224M
1
5.6448M
More than 120dB ***
* Within a maximum of 6.144 Mbps, “fs” and “Qb” can be specified in a scalable manner according to the number of channels.
Example) In the case of two-channel, maximum 96 kHz x 24-bit x 2 channels = 4,608 Mbps < 6.144 Mbps
** Within a maximum of 9.6 Mbps, “fs” and “Qb” can be specified in a scalable manner according to the number of channels. However, only one or two channels are possible for fs=176.4k or 192k.
Examples) One or two channels; max. 192 kHz/24-bit, 4 ch; max. 96 kHz/20-bit, 5.1(6)ch; max. 96 kHz/16-bit
*** Value in the audible bandwidth. Includes the effect of noise shaping from Delta-Sigma modulation.
[Table 3-1] Examples of uncompressed formats
USO
RES
TRIT
O
Multichannel Monitoring Tutorial Booklet (M2TB) rev. 3.5.2
Masataka Nakahara : SONA Corporation ©2005 YAMAHA Corporation, ©2005 SONA Corporation
21 / 74
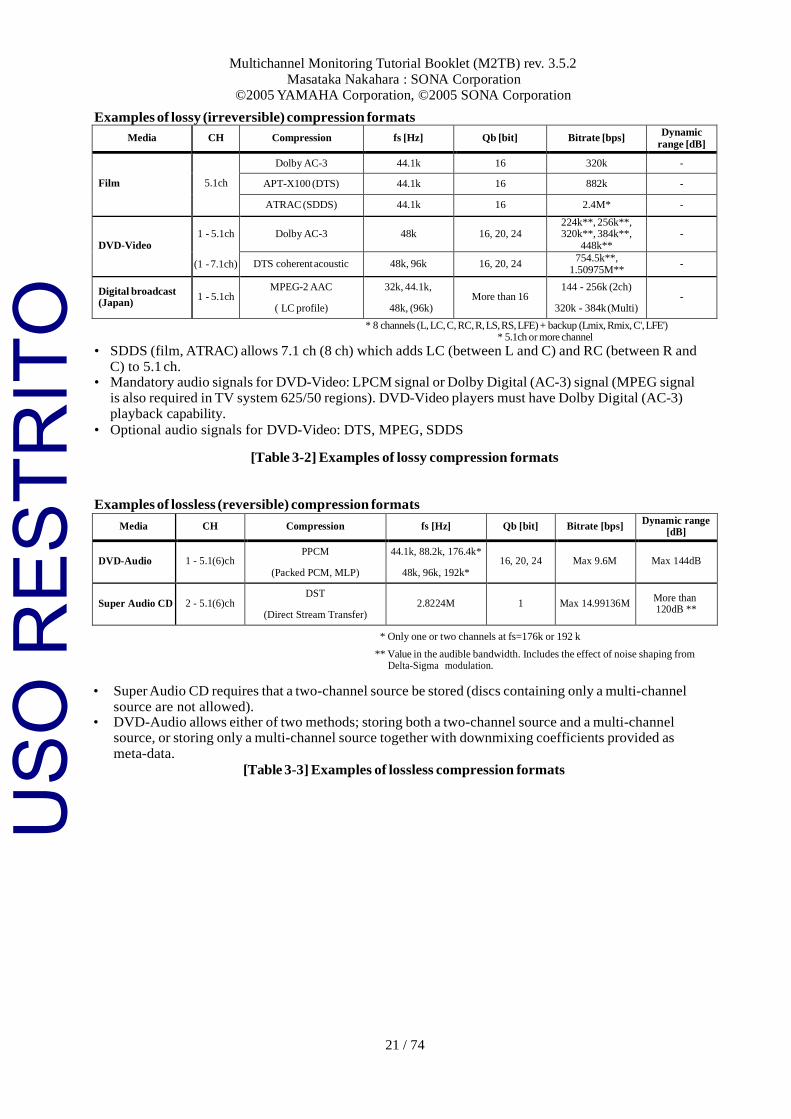
Examples of lossy (irreversible) compression formats
Media CH Compression fs [Hz] Qb [bit] Bitrate [bps] Dynamic
range [dB]
Film
5.1ch
Dolby AC-3 44.1k 16 320k -
APT-X100 (DTS) 44.1k 16 882k -
ATRAC (SDDS) 44.1k 16 2.4M* -
DVD-Video
1 - 5.1ch
(1 - 7.1ch)
Dolby AC-3
48k
16, 20, 24 224k**, 256k**, 320k**, 384k**,
448k**
-
DTS coherent acoustic 48k, 96k 16, 20, 24 754.5k**,
1.50975M** -
Digital broadcast (Japan)
1 - 5.1ch
MPEG-2 AAC
( LC profile)
32k, 44.1k,
48k, (96k)
More than 16
144 - 256k (2ch)
320k - 384k (Multi)
-
* 8 channels (L, LC, C, RC, R, LS, RS, LFE) + backup (Lmix, Rmix, C', LFE') * 5.1ch or more channel
• SDDS (film, ATRAC) allows 7.1 ch (8 ch) which adds LC (between L and C) and RC (between R and C) to 5.1 ch.
• Mandatory audio signals for DVD-Video: LPCM signal or Dolby Digital (AC-3) signal (MPEG signal is also required in TV system 625/50 regions). DVD-Video players must have Dolby Digital (AC-3) playback capability.
• Optional audio signals for DVD-Video: DTS, MPEG, SDDS
[Table 3-2] Examples of lossy compression formats
Examples of lossless (reversible) compression formats
* Only one or two channels at fs=176k or 192 k
** Value in the audible bandwidth. Includes the effect of noise shaping from Delta-Sigma modulation.
• Super Audio CD requires that a two-channel source be stored (discs containing only a multi-channel source are not allowed).
• DVD-Audio allows either of two methods; storing both a two-channel source and a multi-channel source, or storing only a multi-channel source together with downmixing coefficients provided as meta-data.
[Table 3-3] Examples of lossless compression formats
Media CH Compression fs [Hz] Qb [bit] Bitrate [bps] Dynamic range
[dB]
DVD-Audio
1 - 5.1(6)ch PPCM
(Packed PCM, MLP)
44.1k, 88.2k, 176.4k*
48k, 96k, 192k*
16, 20, 24
Max 9.6M
Max 144dB
Super Audio CD
2 - 5.1(6)ch
DST
(Direct Stream Transfer)
2.8224M
1
Max 14.99136M
More than 120dB **
USO
RES
TRIT
O
Multichannel Monitoring Tutorial Booklet (M2TB) rev. 3.5.2
Masataka Nakahara : SONA Corporation ©2005 YAMAHA Corporation, ©2005 SONA Corporation
22 / 74
2-3. Recording response
By “recording response” we mean the response allowed when the master tape produced by the studio is recorded onto the production target media.
The response of each channel recorded on the media will depend on the encoding method and compression method as described above. In the case of analog recording, the response will depend on the specifications of the recording media. However for lossy compression (irreversible compression), it is important to note that “fs” and “Qb” do not directly determine the recording response (in particular, the dynamic range).
Currently for most media, full-range recording is possible for all channels.
However in the case of LFE and surround channels, there will be differences depending on the media.
2-3-1. LFE channel
For media that is recorded in Dolby DIGITAL, such as film and DVD-Video, the bandwidth is restricted
to 120 Hz at the time of encoding*.
This also applies to DTS. However in film, the range to 80 Hz is the recording band for the LFE channel of DTS.
Similarly for the MPEG-2 used in digital broadcast (Europe), the upper limit of the LFE storage bandwidth is restricted to 125 Hz. In MPEG-2 AAC (digital broadcast, Japan), full-range recording is possible for encoding, but due to
considerations of the propagation spectrum, there may be a bandwidth limitation on the LFE channel. Thus, it is necessary to be aware of the recording bandwidth of the LFE channel when the propagation
system is taken into account (see ISO/IEC and ARIB). For music media (DVD-Audio, Super Audio CD), the LFE channel allows full-range recording in the
same way as the main channels.
* To be precise, Dolby Digital can record signals of up to about 600 Hz on the LFE channel of DVD-
Video, but since the LFE channel LPF (fc=120 Hz) is applied by default as an option during encoding, it is best to consider 120 Hz as the upper frequency limit for recording and playback on the LFE channel except for special cases.
2-3-2. Surround channels (S, LS, RS, BS)
For 3-1 matrix (Dolby stereo, Dolby surround, DTS stereo), the recording bandwidth of the S channel is restricted to 100 Hz–7 kHz. For 5.0 matrix (Dolby Pro Logic II), the LS and RS recording channels are restricted to 100 Hz–20 kHz.
In DTS for film (5.1, 6.1), the recording bandwidth of the surround channels (LS, RS, BS) is restricted to 80 Hz and above, but since sound recorded on the master tape that is lower than this point is collectively
recorded on the LFE channel, the resulting playback is full-range. This is known as “bass management” (described in section 4).
USO
RES
TRIT
O
23 / 74
Multichannel Monitoring Tutorial Booklet (M2TB) rev. 3.5.2
Masataka Nakahara : SONA Corporation ©2005 YAMAHA Corporation, ©2005 SONA Corporation
2-4. Playback response
By “playback response” we mean the desired (recommended) response of the playback system that plays back the media. For example, this corresponds to the frequency response of each speaker and the level balance.
It is important to be aware that depending on the media and the channel format, playback response may not be the same as the recording response.
The following pages describe playback response for typical media.
2-4-1. DVD-Video: Dolby, DTS
90
80
70
60
50
1/3 octave band center frequency [Hz]
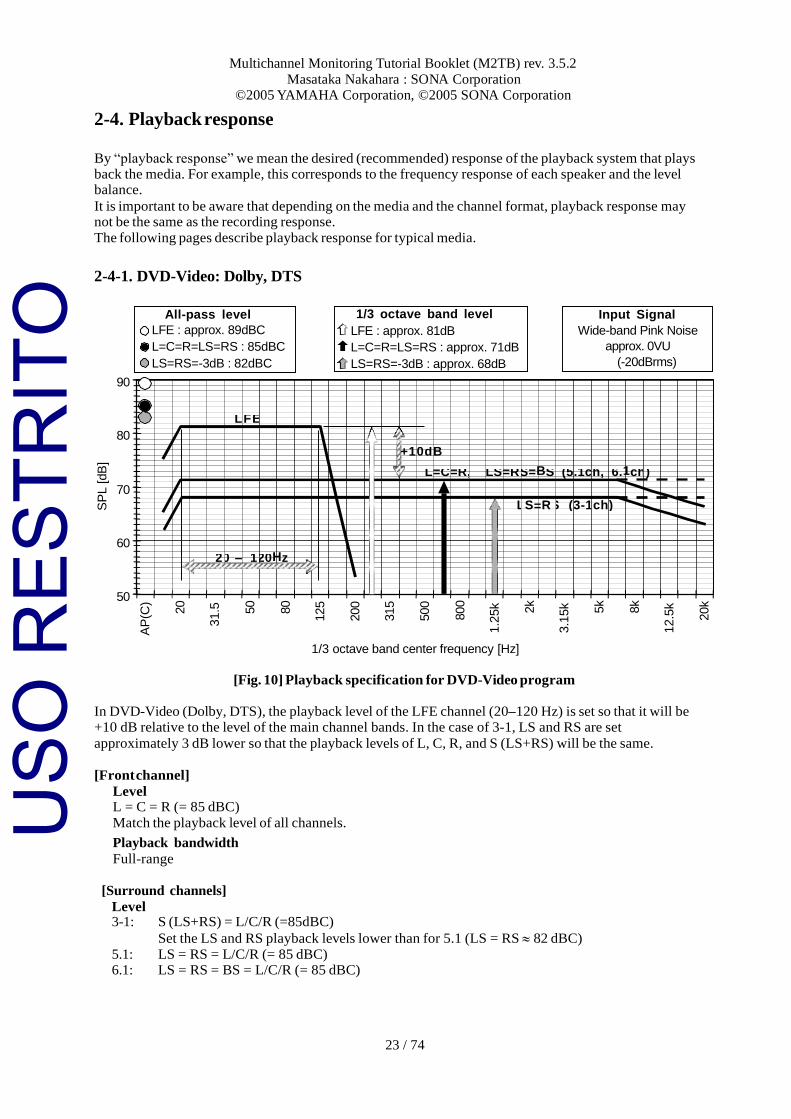
[Fig. 10] Playback specification for DVD-Video program
In DVD-Video (Dolby, DTS), the playback level of the LFE channel (20–120 Hz) is set so that it will be +10 dB relative to the level of the main channel bands. In the case of 3-1, LS and RS are set
approximately 3 dB lower so that the playback levels of L, C, R, and S (LS+RS) will be the same.
[Front channel]
Level L = C = R (= 85 dBC)
Match the playback level of all channels.
Playback bandwidth
Full-range
[Surround channels]
Level 3-1: S (LS+RS) = L/C/R (=85dBC)
Set the LS and RS playback levels lower than for 5.1 (LS = RS 82 dBC)
5.1: LS = RS = L/C/R (= 85 dBC) 6.1: LS = RS = BS = L/C/R (= 85 dBC)
Input Signal
Wide-band Pink Noise
approx. 0VU
(-20dBrms)
1/3 octave band level
LFE : approx. 81dB
L=C=R=LS=RS : approx. 71dB
LS=RS=-3dB : approx. 68dB
All-pass level
LFE : approx. 89dBC
L=C=R=LS=RS : 85dBC
LS=RS=-3dB : 82dBC
L FE
+1 0d B
L =C =R, LS =R S= S (5 .1c h, 6. ch )
L S R S ( 3-1 ch )
2 0 – 1 20 z
B 1
=
H
SP
L [dB
]
AP
(C)
20
31.5
50
80
125
200
315
500
800
1.2
5k
2k
3.1
5k
5k
8k
12.5
k
20k
USO
RES
TRIT
O
24 / 74
Multichannel Monitoring Tutorial Booklet (M2TB) rev. 3.5.2
Masataka Nakahara : SONA Corporation ©2005 YAMAHA Corporation, ©2005 SONA Corporation
Playback bandwidth 3-1: In the case of matrix, 100 - 7 kHz (it is best to use full-range speakers)
In the case of discrete, full-range 5.1: Full-range 5.1 : In the case of matrix, 100 Hz - 20 kHz (it is best to use full-range
speakers) In the case of discrete, full-range 6.1: Full-range
[LFE channel]
Level
“Band level” is +10 dB compared to the main channel.
Playback bandwidth
(20 Hz) - 120 Hz
2-4-2. Film: Dolby, DTS
90
80
70
60
50
1/3 octave band center frequency [Hz]
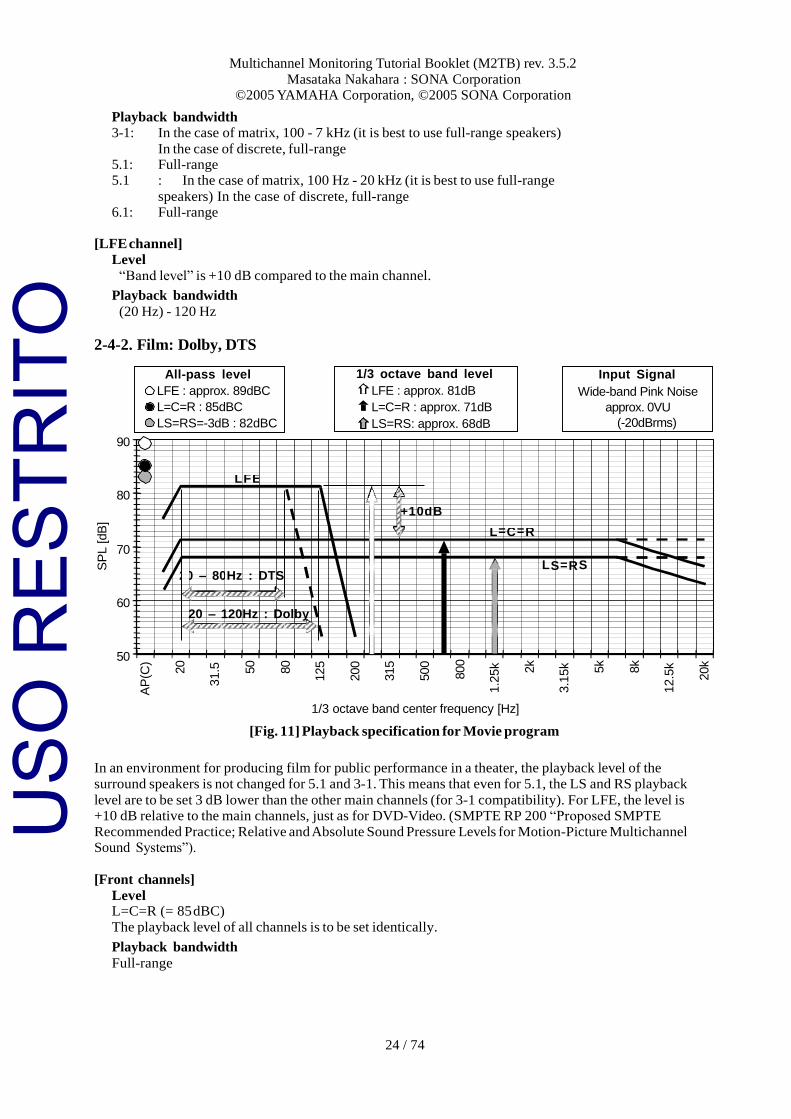
[Fig. 11] Playback specification for Movie program
In an environment for producing film for public performance in a theater, the playback level of the
surround speakers is not changed for 5.1 and 3-1. This means that even for 5.1, the LS and RS playback
level are to be set 3 dB lower than the other main channels (for 3-1 compatibility). For LFE, the level is +10 dB relative to the main channels, just as for DVD-Video. (SMPTE RP 200 “Proposed SMPTE
Recommended Practice; Relative and Absolute Sound Pressure Levels for Motion-Picture Multichannel Sound Systems”).
[Front channels]
Level L=C=R (= 85 dBC)
The playback level of all channels is to be set identically.
Playback bandwidth
Full-range
Input Signal
Wide-band Pink Noise
approx. 0VU
(-20dBrms)
1/3 octave band level
LFE : approx. 81dB
L=C=R : approx. 71dB
LS=RS: approx. 68dB
All-pass level
LFE : approx. 89dBC
L=C=R : 85dBC
LS=RS=-3dB : 82dBC
L FE
+1 0d B
L C R
L = S 2 0 – 80 Hz : DT S
= =
S R
20 – 120Hz : Dolby
SP
L [dB
]
AP
(C)
20
31.5
50
80
125
200
315
500
800
1.2
5k
2k
3.1
5k
5k
8k
12.5
k
20k
USO
RES
TRIT
O
25 / 74
Multichannel Monitoring Tutorial Booklet (M2TB) rev. 3.5.2
Masataka Nakahara : SONA Corporation ©2005 YAMAHA Corporation, ©2005 SONA Corporation
40
50
63
80
100
125
160
200
250
315
400
500
630
800
1k
1.2
5k
1.6
k
2k
2.5
k
3.1
5k
4k
5k
6.3
k
8k
10k
12.5
k
16k
[Surround channels]
Level For film productions, set the playback level of surround channels at -3 dB relative to the front
channels. The film playback environment is designed based on the level balance for 3-1
(L=C=R=S=(LS+RS)=85dBC, LS=RS 82 dBC); the surround playback level is not changed for 5.1. 3-1: LS=RS=82 dBC; in other words, S (LS+RS) =85 dBC 5.1: LS=RS=82 dBC
6.1: LS=RS=BS=82 dBC
Playback bandwidth
3-1: For matrix, 100 - 7 kHz (it is best to provide full-range speakers) For discrete, full-range
5.1: Full-range
6.1: Full-range
[LFE channel]
Level Relative to the main channels, the “band level” is +10 dB.
Playback bandwidth
(20 Hz) – 120 Hz Dolby
(20 Hz) – 80 Hz DTS
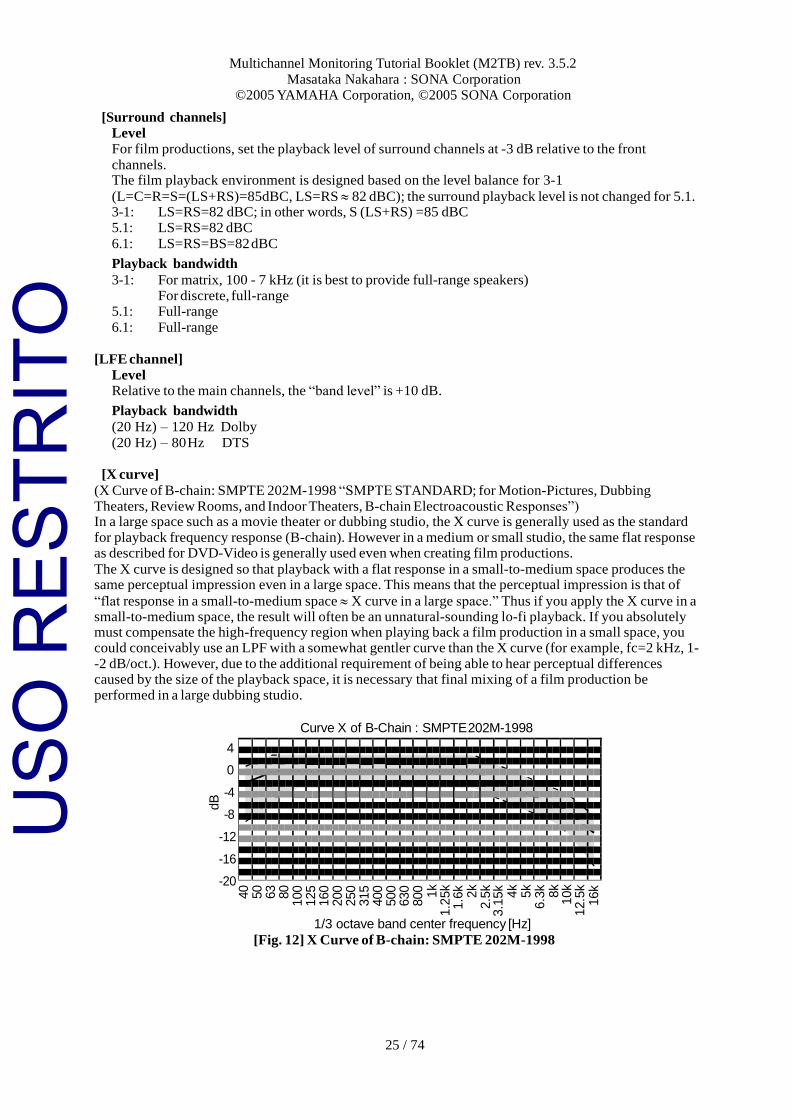
[X curve]
(X Curve of B-chain: SMPTE 202M-1998 “SMPTE STANDARD; for Motion-Pictures, Dubbing Theaters, Review Rooms, and Indoor Theaters, B-chain Electroacoustic Responses”) In a large space such as a movie theater or dubbing studio, the X curve is generally used as the standard for playback frequency response (B-chain). However in a medium or small studio, the same flat response as described for DVD-Video is generally used even when creating film productions.
The X curve is designed so that playback with a flat response in a small-to-medium space produces the same perceptual impression even in a large space. This means that the perceptual impression is that of
“flat response in a small-to-medium space X curve in a large space.” Thus if you apply the X curve in a small-to-medium space, the result will often be an unnatural-sounding lo-fi playback. If you absolutely must compensate the high-frequency region when playing back a film production in a small space, you could conceivably use an LPF with a somewhat gentler curve than the X curve (for example, fc=2 kHz, 1- -2 dB/oct.). However, due to the additional requirement of being able to hear perceptual differences caused by the size of the playback space, it is necessary that final mixing of a film production be performed in a large dubbing studio.
4
0
-4
-8
-12
-16
-20
Curve X of B-Chain : SMPTE 202M-1998
1/3 octave band center frequency [Hz]
[Fig. 12] X Curve of B-chain: SMPTE 202M-1998
dB
USO
RES
TRIT
O
26 / 74
Multichannel Monitoring Tutorial Booklet (M2TB) rev. 3.5.2
Masataka Nakahara : SONA Corporation ©2005 YAMAHA Corporation, ©2005 SONA Corporation
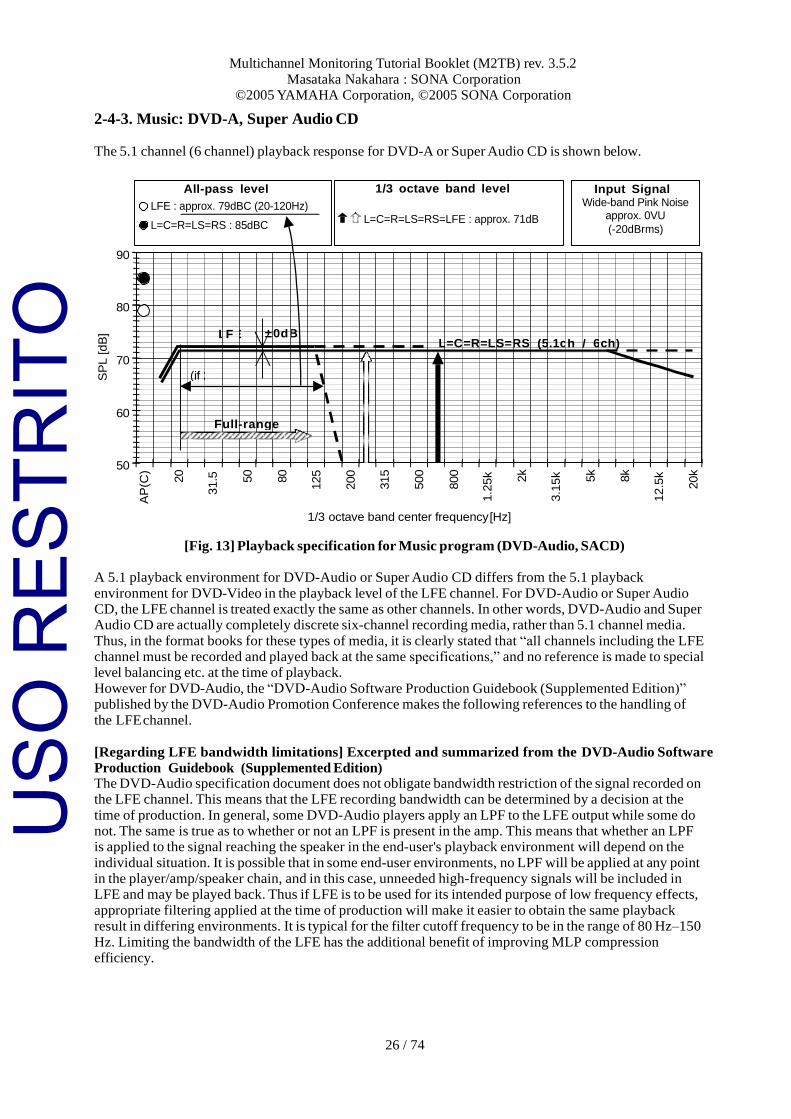
2-4-3. Music: DVD-A, Super Audio CD
The 5.1 channel (6 channel) playback response for DVD-A or Super Audio CD is shown below.
90
80
70
60
50
1/3 octave band center frequency [Hz]
[Fig. 13] Playback specification for Music program (DVD-Audio, SACD)
A 5.1 playback environment for DVD-Audio or Super Audio CD differs from the 5.1 playback
environment for DVD-Video in the playback level of the LFE channel. For DVD-Audio or Super Audio CD, the LFE channel is treated exactly the same as other channels. In other words, DVD-Audio and Super Audio CD are actually completely discrete six-channel recording media, rather than 5.1 channel media.
Thus, in the format books for these types of media, it is clearly stated that “all channels including the LFE channel must be recorded and played back at the same specifications,” and no reference is made to special level balancing etc. at the time of playback.
However for DVD-Audio, the “DVD-Audio Software Production Guidebook (Supplemented Edition)” published by the DVD-Audio Promotion Conference makes the following references to the handling of
the LFE channel.
[Regarding LFE bandwidth limitations] Excerpted and summarized from the DVD-Audio Software
Production Guidebook (Supplemented Edition) The DVD-Audio specification document does not obligate bandwidth restriction of the signal recorded on the LFE channel. This means that the LFE recording bandwidth can be determined by a decision at the
time of production. In general, some DVD-Audio players apply an LPF to the LFE output while some do not. The same is true as to whether or not an LPF is present in the amp. This means that whether an LPF is applied to the signal reaching the speaker in the end-user's playback environment will depend on the
individual situation. It is possible that in some end-user environments, no LPF will be applied at any point in the player/amp/speaker chain, and in this case, unneeded high-frequency signals will be included in LFE and may be played back. Thus if LFE is to be used for its intended purpose of low frequency effects,
appropriate filtering applied at the time of production will make it easier to obtain the same playback result in differing environments. It is typical for the filter cutoff frequency to be in the range of 80 Hz–150
Hz. Limiting the bandwidth of the LFE has the additional benefit of improving MLP compression efficiency.
Input Signal Wide-band Pink Noise
approx. 0VU
(-20dBrms)
All-pass level
LFE : approx. 79dBC (20-120Hz)
L=C=R=LS=RS : 85dBC
1/3 octave band level
L=C=R=LS=RS=LFE : approx. 71dB
L F E ± 0d B L =C =R =L S= RS (5 .1c h / 6 ch )
(if 20-120Hz)
Full-range
SP
L [dB
]
AP
(C)
20
31.5
50
80
125
200
315
500
800
1.2
5k
2k
3.1
5k
5k
8k
12.5
k
20k
USO
RES
TRIT
O
27 / 74
Multichannel Monitoring Tutorial Booklet (M2TB) rev. 3.5.2
Masataka Nakahara : SONA Corporation ©2005 YAMAHA Corporation, ©2005 SONA Corporation
[Regarding LFE recording and playback levels] Excerpted and summarized from the DVD-Audio
Software Production Guidebook (Supplemented Edition) Systems such as Dolby Digital prescribe the mechanism by which the LFE level is boosted during playback, and LFE is boosted (+10 dB) by the playback system in the same way during production as
well. On the other hand in DVD-Audio specification audio tracks (LPCM, MLP), the LFE signal level (not the signal amplitude itself, but the playback reference level) is handled in the same way as other channels, and it is assumed that all channels will be at the same level. This means that LFE does not
require any special handling in the way of level adjustments at the time of production. The final LFE volume obtained in the end-user environment may be affected by numerous factors, such as the bass management system applied by the user's system. Ultimately, if we are not taking bass management into
consideration, the signal level of all channels should be thought of as equal.
Thus for DVD-Audio and Super Audio CD, note that the LFE playback level must be +/-0 dB just as the
other channels, which is -10 dB in comparison to DVD-Video playback environments such as Dolby or DTS. The frequency bandwidth of the LFE signal also differs from DVD-Video in that since an LPF is not applied during encoding, full-range recording and playback is possible. However as stated in the
“DVD-Audio Software Production Guidebook (Supplemented Edition),” it is desirable that an LPF be applied during production to the LFE master source in order to maintain compatibility for a variety of
end-user playback environments. Attention must be paid to the playback level of the LFE signal particularly when producing DVD-Audio
and DVD-Video hybrid multichannel discs. For example, in order for an LFE signal produced in a DVD- Audio environment to be converted for use with DVD-Video, the LFE master signal must be recorded at a level 10 dB lower.
[Front channel]
Level L = C = R
Playback bandwidth
Full-range
[Surround channel]
Level 3-1: S=(LS+RS)=L/C/R, LS= RS L/C/R - 3dB (DVD-Audio) 5.1: LS = RS = L/C/R
Playback bandwidth
3-1: Full-range (DVD-Audio) 5.1: Full-range
[LFE channel]
Level Band level +/-0 dB (same as main channels).
Playback bandwidth Not specified (full-range is possible)
[Monaural surround in DVD-Audio and Super Audio CD]
Monaural surround in DVD-Audio DVD-Audio provides monaural surround (S=LS+RS) formats, of which 3-1 (L/C/R/S) is an example. In
this case, the LS and RS playback levels are (LS+RS)=L=C=R, and LS=RS L/C/R-3dB. Thus in DVD- Audio, it is necessary to re-adjust the LS and RS playback level depending on whether you are producing for 5.1 or 3-1. This is the same for DVD-Video. In other words in DVD-Audio, multi-channel production can use the same playback environment DVD-Video with the exception of LFE. Below, we summarize and excerpt from material on monaural surround in the “DVD-Audio Software
Production Guidebook (Supplemented Edition), DVD Audio Promotion Conference.”
USO
RES
TRIT
O
28 / 74
Multichannel Monitoring Tutorial Booklet (M2TB) rev. 3.5.2
Masataka Nakahara : SONA Corporation ©2005 YAMAHA Corporation, ©2005 SONA Corporation
[When reproducing monaural surround (S) from LS and RS] DVD-Audio Software Production
Guidebook (Supplemented Edition) If no independent speaker is provided at a location corresponding to monaural surround (S), it is usual to adjust S by -3 dB and distribute it to LS and RS for playback. In most cases at present, the player does not
have an analog output for the S channel separately from LS and RS, so this distribution is performed within the player, and the S signal is sent from the analog LS and RS outputs. If the player does have an S channel output, or if the S channel is being conveyed by a multi-channel digital stream via IEEE 1394 etc.,
the amplifier performs the above distribution processing.
Monaural surround in Super Audio CD Super Audio CD does not provide monaural surround as a format. This means that if you are producing monaural surround for Super Audio CD, you will need to mono-mix the S channel to LS and RS at the appropriate level in the stereo surround (LS, RS) environment. 5.2 (6 ch) is the basic multichannel format for Super Audio CD; other formats are supported by recording digital mute signals for unused channels as well as setting mute flags. This means that the same playback environment can be applied for all channel formats of Super Audio CD.
2-4-4. Broadcast: Dolby DIGITAL, DTS, MPEG-2, MPEG-2 AAC
In the case of Dolby DIGITAL or DTS, the DVD-Video playback response is used. In the cases of MPEG-2 and MPEG-2 AAC, the response is defined by the administrative body (LFE
channel handling in particular). For MPEG-2 (digital broadcast, Europe), the ISO standard limits the LFE recording bandwidth to 125 Hz, but the playback level is defined by the administrative body. For the LFE of MPEG-2 AAC (digital broadcast, Japan), full-band recording is possible according to the ISO/IEC
specification. However in some cases, bandwidth limitations may occur during propagation (ISO/IEC). In actual operation, bandwidth limitation and playback level is defined by the ARIB (Association of Radio Industries and Businesses). In the cases of MPEG-2 and MPEG-2 AAC, the playback level of LS and RS
for monaural surround (the S (LS+RS) channel in 3-1) must also be as specified by the administrative body.
2-4-5. GAME
Audio for games falls in two categories; multi-channel playback for the “movie” portion of role-playing games etc., and “interactive” multi-channel playback that occurs in response to movements within the game. These multi-channel formats will depend on the audio processing method used by each manufacturer.
Currently, Dolby DIGITAL or DTS are widely used.
In this case, the playback environment will be as described for DVD-Video.
The Yamaha DM2000, DM1000, and 02R96 digital consoles support these various playback environments by providing LFE boost functions and LS/RS attenuation functions in the bass management section of their surround monitor functionality, making it possible to switch instantly between playback environments. U
SO R
ESTR
ITO
29 / 74
Multichannel Monitoring Tutorial Booklet (M2TB) rev. 3.5.2
Masataka Nakahara : SONA Corporation ©2005 YAMAHA Corporation, ©2005 SONA Corporation
2-5. Down-mixing
Most multi-channel media requires two-channel playback.
There are two possible ways in which content equivalent to a multi-channel production can be mixed to
two channels. One way is to generate a separate two-channel mix using the individual musical materials (stems) that were used for multi-channel mixing.
The other way is to use electrical circuitry to forcibly create the two-channel program (fold down).
The fold-down algorithm is defined for each type of media, and the production side must store attenuator
values etc. on the media as meta-data. Typical examples of two-channel fold-down are shown below.
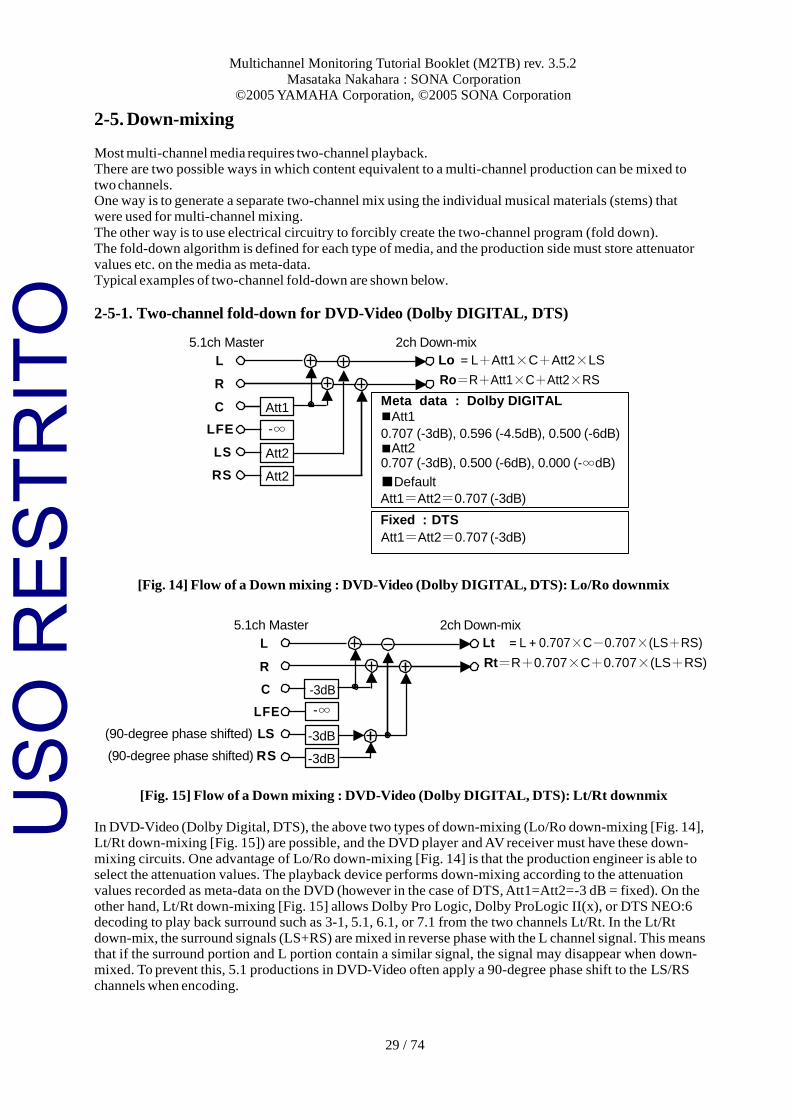
2-5-1. Two-channel fold-down for DVD-Video (Dolby DIGITAL, DTS)
5.1ch Master 2ch Down-mix
L Lo =L+Att1×C+Att2×LS
R
C Att1
Ro=R+Att1×C+Att2×RS
Meta data : Dolby DIGITAL ■Att1
LFE
LS
RS
-∞
Att2
Att2
0.707 (-3dB), 0.596 (-4.5dB), 0.500 (-6dB) ■Att2 0.707 (-3dB), 0.500 (-6dB), 0.000 (-∞dB)
■Default
Att1=Att2=0.707 (-3dB)
Fixed : DTS
Att1=Att2=0.707 (-3dB)
[Fig. 14] Flow of a Down mixing : DVD-Video (Dolby DIGITAL, DTS): Lo/Ro downmix
5.1ch Master 2ch Down-mix
L Lt =L+0.707×C-0.707×(LS+RS)
R
C -3dB
Rt=R+0.707×C+0.707×(LS+RS)
LFE
(90-degree phase shifted) LS
(90-degree phase shifted) RS
-∞
-3dB
-3dB
[Fig. 15] Flow of a Down mixing : DVD-Video (Dolby DIGITAL, DTS): Lt/Rt downmix
In DVD-Video (Dolby Digital, DTS), the above two types of down-mixing (Lo/Ro down-mixing [Fig. 14], Lt/Rt down-mixing [Fig. 15]) are possible, and the DVD player and AV receiver must have these down-
mixing circuits. One advantage of Lo/Ro down-mixing [Fig. 14] is that the production engineer is able to select the attenuation values. The playback device performs down-mixing according to the attenuation
values recorded as meta-data on the DVD (however in the case of DTS, Att1=Att2=-3 dB = fixed). On the other hand, Lt/Rt down-mixing [Fig. 15] allows Dolby Pro Logic, Dolby ProLogic II(x), or DTS NEO:6 decoding to play back surround such as 3-1, 5.1, 6.1, or 7.1 from the two channels Lt/Rt. In the Lt/Rt
down-mix, the surround signals (LS+RS) are mixed in reverse phase with the L channel signal. This means that if the surround portion and L portion contain a similar signal, the signal may disappear when down-mixed. To prevent this, 5.1 productions in DVD-Video often apply a 90-degree phase shift to the LS/RS
channels when encoding.
USO
RES
TRIT
O
Multichannel Monitoring Tutorial Booklet (M2TB) rev. 3.5.2
Masataka Nakahara : SONA Corporation ©2005 YAMAHA Corporation, ©2005 SONA Corporation
30 / 74
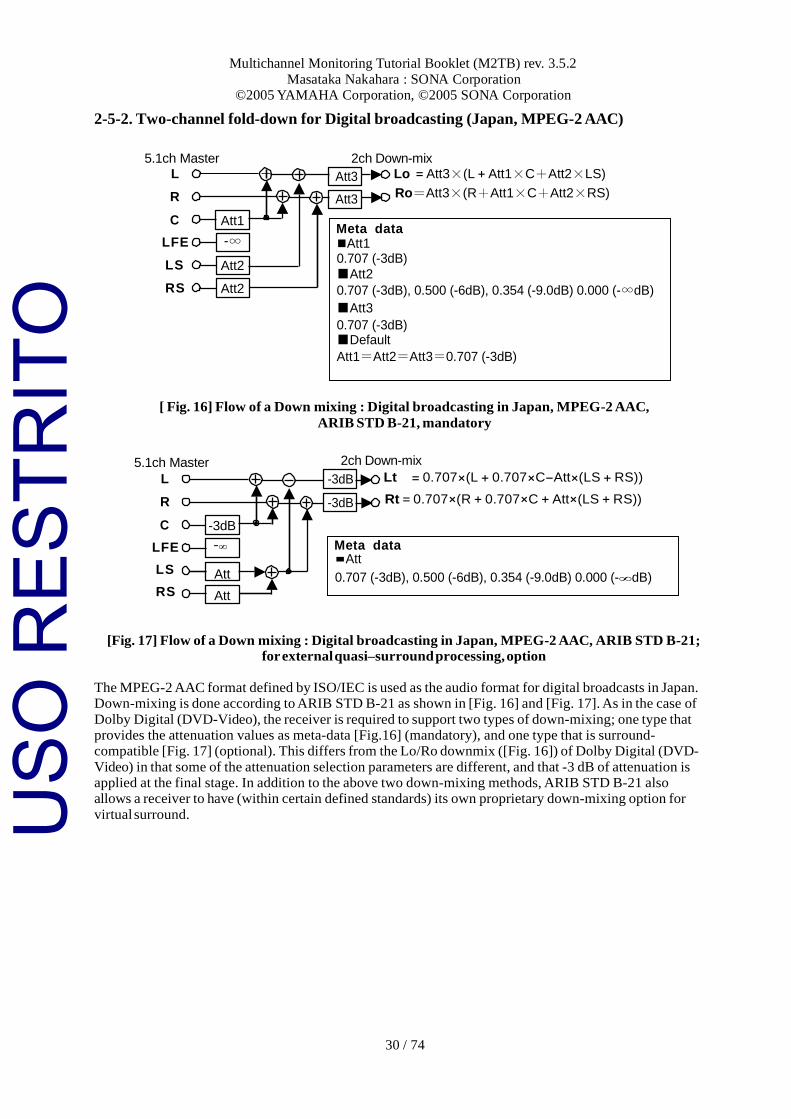
2-5-2. Two-channel fold-down for Digital broadcasting (Japan, MPEG-2 AAC)
5.1ch Master 2ch Down-mix L
R
C Att1
Att3
Att3
Lo =Att3×(L+Att1×C+Att2×LS)
Ro=Att3×(R+Att1×C+Att2×RS)
LFE
LS
RS
-∞
Att2
Att2
[ Fig. 16] Flow of a Down mixing : Digital broadcasting in Japan, MPEG-2 AAC,
ARIB STD B-21, mandatory
5.1ch Master 2ch Down-mix
L
R
C -3dB
-3dB
-3dB
Lt =0.707×(L+0.707×C−Att×(LS+RS))
Rt=0.707×(R+0.707×C+Att×(LS+RS))
LFE
LS
RS
-∞
Att
Att
[Fig. 17] Flow of a Down mixing : Digital broadcasting in Japan, MPEG-2 AAC, ARIB STD B-21; for external quasi–surround processing, option
The MPEG-2 AAC format defined by ISO/IEC is used as the audio format for digital broadcasts in Japan. Down-mixing is done according to ARIB STD B-21 as shown in [Fig. 16] and [Fig. 17]. As in the case of
Dolby Digital (DVD-Video), the receiver is required to support two types of down-mixing; one type that provides the attenuation values as meta-data [Fig.16] (mandatory), and one type that is surround- compatible [Fig. 17] (optional). This differs from the Lo/Ro downmix ([Fig. 16]) of Dolby Digital (DVD-
Video) in that some of the attenuation selection parameters are different, and that -3 dB of attenuation is applied at the final stage. In addition to the above two down-mixing methods, ARIB STD B-21 also allows a receiver to have (within certain defined standards) its own proprietary down-mixing option for
virtual surround.
Meta data ■Att1 0.707 (-3dB)
■Att2
0.707 (-3dB), 0.500 (-6dB), 0.354 (-9.0dB) 0.000 (-∞dB)
■Att3
0.707 (-3dB) ■Default
Att1=Att2=Att3=0.707 (-3dB)
Meta data ■Att
0.707 (-3dB), 0.500 (-6dB), 0.354 (-9.0dB) 0.000 (-∞dB)
USO
RES
TRIT
O
Multichannel Monitoring Tutorial Booklet (M2TB) rev. 3.5.2
Masataka Nakahara : SONA Corporation ©2005 YAMAHA Corporation, ©2005 SONA Corporation
31 / 74
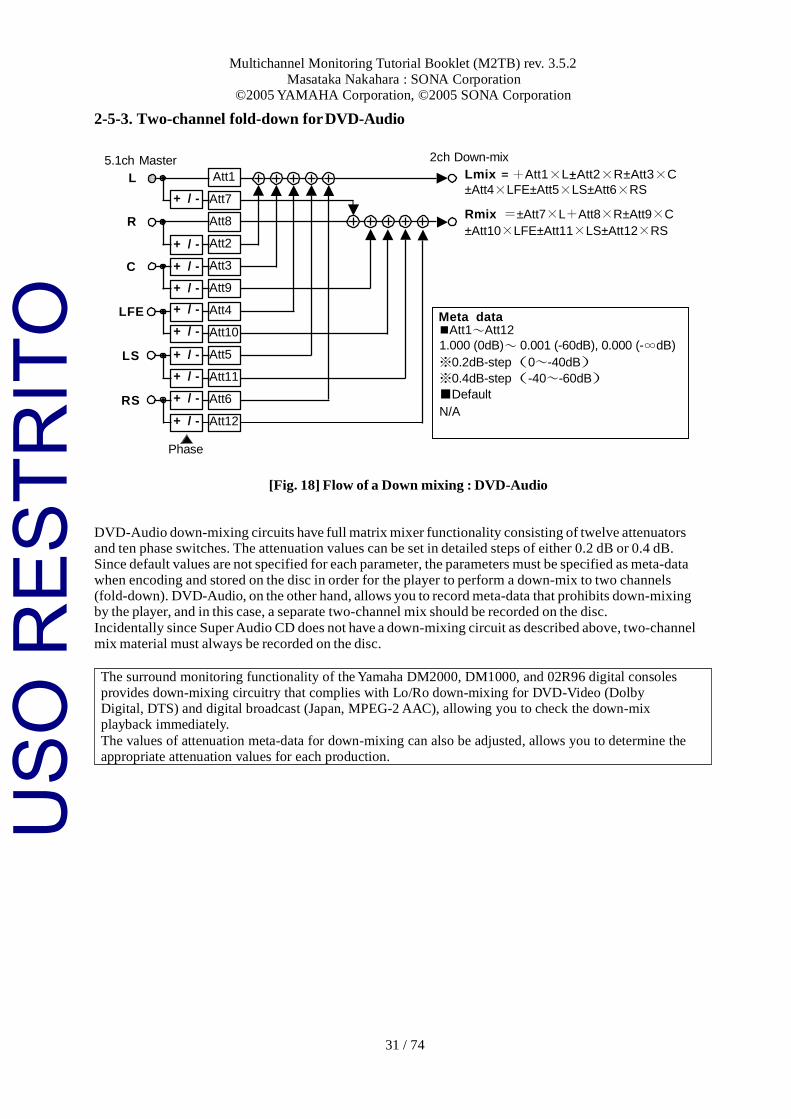
2-5-3. Two-channel fold-down for DVD-Audio
5.1ch Master 2ch Down-mix
L
R
C
LFE
LS
RS
+ / -
+ / -
+ / -
+ / -
+ / -
+ / -
+ / -
+ / -
+ / -
+ / -
Att1
Att7
Att8
Att2
Att3
Att9
Att4
Att10
Att5
Att11
Att6
Att12
Lmix =+Att1×L±Att2×R±Att3×C ±Att4×LFE±Att5×LS±Att6×RS
Rmix =±Att7×L+Att8×R±Att9×C
±Att10×LFE±Att11×LS±Att12×RS
Phase
[Fig. 18] Flow of a Down mixing : DVD-Audio
DVD-Audio down-mixing circuits have full matrix mixer functionality consisting of twelve attenuators and ten phase switches. The attenuation values can be set in detailed steps of either 0.2 dB or 0.4 dB. Since default values are not specified for each parameter, the parameters must be specified as meta-data
when encoding and stored on the disc in order for the player to perform a down-mix to two channels (fold-down). DVD-Audio, on the other hand, allows you to record meta-data that prohibits down-mixing by the player, and in this case, a separate two-channel mix should be recorded on the disc.
Incidentally since Super Audio CD does not have a down-mixing circuit as described above, two-channel
mix material must always be recorded on the disc.
The surround monitoring functionality of the Yamaha DM2000, DM1000, and 02R96 digital consoles
provides down-mixing circuitry that complies with Lo/Ro down-mixing for DVD-Video (Dolby Digital, DTS) and digital broadcast (Japan, MPEG-2 AAC), allowing you to check the down-mix playback immediately.
The values of attenuation meta-data for down-mixing can also be adjusted, allows you to determine the appropriate attenuation values for each production.
Meta data ■Att1~Att12 1.000 (0dB)~ 0.001 (-60dB), 0.000 (-∞dB)
※0.2dB-step (0~-40dB)
※0.4dB-step (-40~-60dB)
■Default
N/A
USO
RES
TRIT
O
Multichannel Monitoring Tutorial Booklet (M2TB) rev. 3.5.2
Masataka Nakahara : SONA Corporation ©2005 YAMAHA Corporation, ©2005 SONA Corporation
32 / 74
4. Playback environment
The playback environment consists of two aspects; room acoustics (which include the room shape, absorptivity, reflectivity, and diffusivity characteristics), and speaker placement. This chapter will discuss speaker placement.
Discussions of music-related media commonly refer to Rec. ITU-R BS. 775-1[1] ([Fig. 19]) recommendations. For other media as well, references are often made to ITU-R standards, or to compliance with the above-discussed DVD-Video environment.
3-1. Rec. ITU-R BS. 775-1 The ITU-R speaker placement is a recommendation (Rec.) set forth by the International
Telecommunication Union -- Radio Communication Section. Rec. ITU-R BS. 775-1 (Multi-channel Stereophonic Sound System With and Without Accompanying Picture) was produced by the radio communication sector of the ITU under the impetus of the advent of HDTV (1992-1994). For this reason, most broadcast stations take Rec. ITU-R BS. 775-1 as the standard for their playback environment. This speaker placement is also acknowledged as the standard one for a wide range of playback environments, including music production. If you want to apply a uniform standard to your production environment, or if you do not have special intentions regarding the playback sound-field, it is desirable to adopt the ITU-R placement for your playback environment.
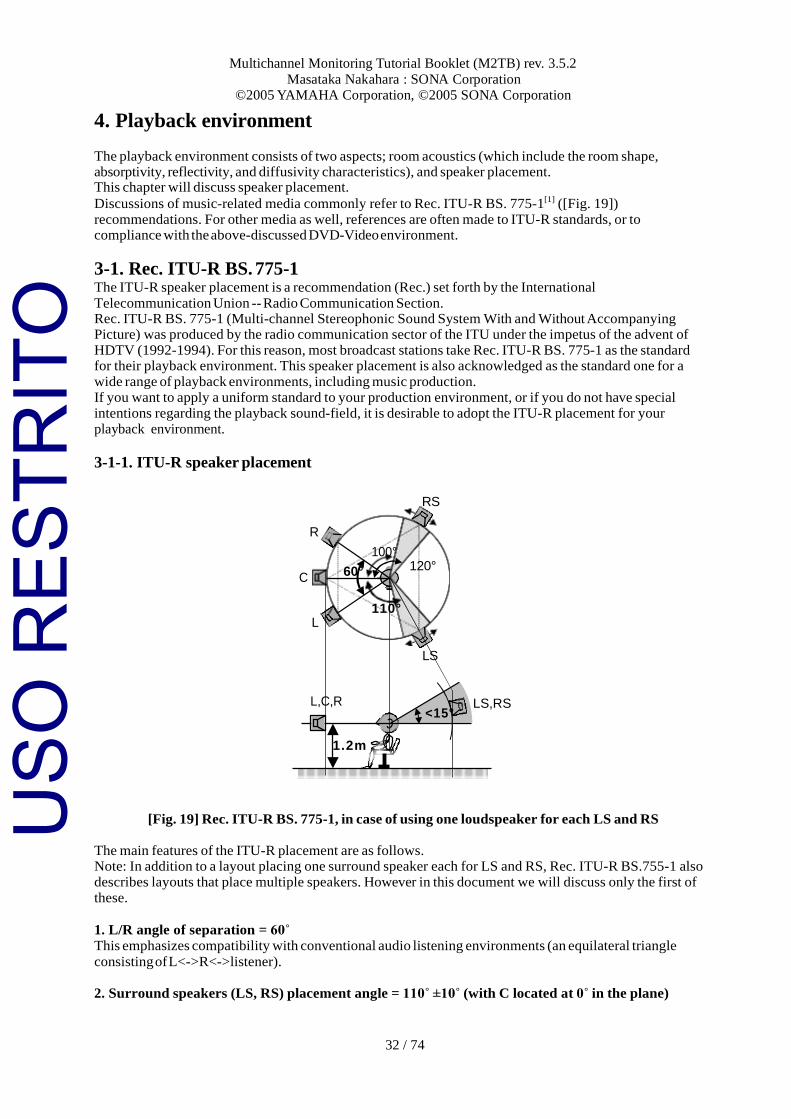
3-1-1. ITU-R speaker placement
RS
R
C 60°
100°
120°
110° L
LS
L,C,R
<15°
LS,RS
1.2m
[Fig. 19] Rec. ITU-R BS. 775-1, in case of using one loudspeaker for each LS and RS
The main features of the ITU-R placement are as follows. Note: In addition to a layout placing one surround speaker each for LS and RS, Rec. ITU-R BS.755-1 also describes layouts that place multiple speakers. However in this document we will discuss only the first of these.
1. L/R angle of separation = 60˚ This emphasizes compatibility with conventional audio listening environments (an equilateral triangle
consisting of L<->R<->listener).
2. Surround speakers (LS, RS) placement angle = 110˚ ±10˚ (with C located at 0˚ in the plane)
USO
RES
TRIT
O
Multichannel Monitoring Tutorial Booklet (M2TB) rev. 3.5.2
Masataka Nakahara : SONA Corporation ©2005 YAMAHA Corporation, ©2005 SONA Corporation
33 / 74
3. Height of each speaker = 1.2 m (listener ear height) The surround speakers (LS, RS) may be placed higher than L, C, and R as long as the elevation angle is
within 15˚.
Surround speakers (LS, RS) are placed at the sides rather than at the rear. It is said that this type of placement (at the sides toward the rear) is able to provide more information to the human auditory system.
It is one of the most effective placements in order to supply information that is lacking in conventional L/R two-channel playback. However, it is difficult for this type of horizontally-located surround speaker placement to provide a sound image that has depth in the backward direction.
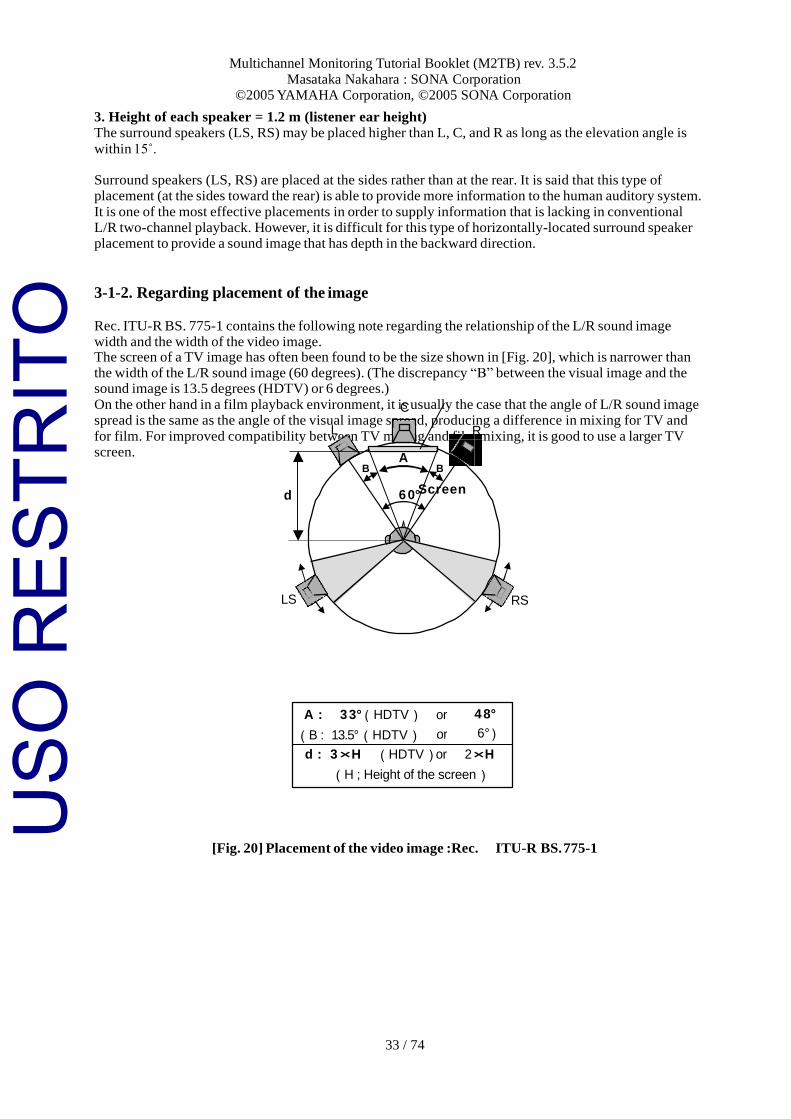
3-1-2. Regarding placement of the image
Rec. ITU-R BS. 775-1 contains the following note regarding the relationship of the L/R sound image width and the width of the video image. The screen of a TV image has often been found to be the size shown in [Fig. 20], which is narrower than the width of the L/R sound image (60 degrees). (The discrepancy “B” between the visual image and the sound image is 13.5 degrees (HDTV) or 6 degrees.)
On the other hand in a film playback environment, it is usually the case that the angle of L/R sound image spread is the same as the angle of the visual image spread, producing a difference in mixing for TV and
for film. For improved compatibility between TV mixing and film mixing, it is good to use a larger TV screen.
Screen
[Fig. 20] Placement of the video image :Rec. ITU-R BS. 775-1
A : 3 3°(HDTV)
(B : 13.5°(HDTV)
or
or
4 8°
6°)
d : 3 ×H (HDTV)or 2×H
(H ; Height of the screen)
C
L R
A B B
d 6 0°
LS RS
USO
RES
TRIT
O
34 / 74
Multichannel Monitoring Tutorial Booklet (M2TB) rev. 3.5.2
Masataka Nakahara : SONA Corporation ©2005 YAMAHA Corporation, ©2005 SONA Corporation
3-1-3. Center speaker placement
Rec. ITU-R BS. 775-1 recommends that the L, C, and R speakers all be placed at the same height (ear
level). Thus, if the playback environment includes video, an acoustically transparent screen is recommended. If an acoustically transparent screen is not used, it is stated that the center speaker should be placed immediately above or below the screen (CRT).
3-1-4. LFE (sub-woofer) placement
Rec. ITU-R BS. 775-1 mentions systems that include an added LFE system (optional), but does not
specify the placement of the sub-woofer speaker for playback. However, the playback bandwidth is specified as 20 Hz--120 Hz (Annex 7). Also, while the playback level is said to be under consideration, it is stated that it is useful to provide gain in the range of +10--+12 dB as with film.
3-1-5. Monitoring distance
The distance from the listening point to each speaker (the monitoring distance) is not explicitly stated in
Rec. ITU-R BS. 775-1, but the Rec. ITU-R BS. 1116-1[2] cited as a reference does recommend a monitoring distance of two to three meters for a multi-channel playback environment.
Rec. ITU-R BS. 775-1 is the basis of a surround monitoring environment, but in cases such as the following, it may be better to consider other speaker placements.
1. When dynamic surround panning such as fly-overs are an important means of acoustical expression, such as in films.
2. When many of the target end-uses for your productions are at variance with the ITU-R placement, and
you want to give consideration to compatibility with these end-users. 3. When it is difficult to implement the ITU-R configuration in the room (studio). Or, in cases in which
forcibly implementing the ITU-R configuration produces an unnatural sound field. For example if you
implement the ITU-R configuration in an extremely narrow room, the surround speakers would be placed directly beside your ears, producing an unnatural-feeling surround playback.
The ideal speaker placement will depend on the size of the room, the monitoring radius (the distance from
the speakers to the listening point), and the acoustical treatment of the room (absorption, diffuseness,
etc.).
Thus, decisions regarding speaker placement must take into account both the character of the media produced in the studio and the physical environment of the studio (the size of the space, the monitoring radius).
It is important for the production people to have an understanding of his or her own surround playback environment. In particular if you are considering a configuration other than the ITU-R (which is often called the standard for the playback environment), it is important to understand the characteristics of your
particular playback environment.
Speaker placement is determined largely by two factors; the angle of L-R separation, and the placement of
the surround speakers.
USO
RES
TRIT
O
35 / 74
Multichannel Monitoring Tutorial Booklet (M2TB) rev. 3.5.2
Masataka Nakahara : SONA Corporation ©2005 YAMAHA Corporation, ©2005 SONA Corporation
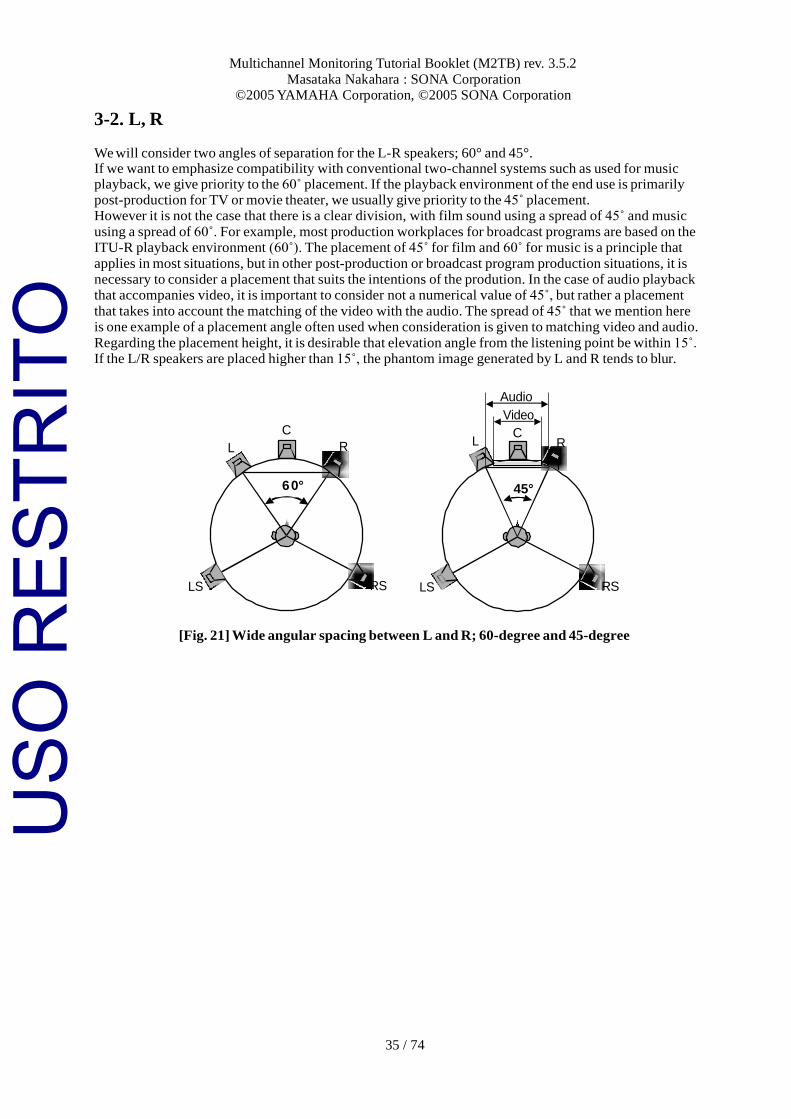
3-2. L, R
We will consider two angles of separation for the L-R speakers; 60° and 45°. If we want to emphasize compatibility with conventional two-channel systems such as used for music playback, we give priority to the 60˚ placement. If the playback environment of the end use is primarily post-production for TV or movie theater, we usually give priority to the 45˚ placement. However it is not the case that there is a clear division, with film sound using a spread of 45˚ and music
using a spread of 60˚. For example, most production workplaces for broadcast programs are based on the ITU-R playback environment (60˚). The placement of 45˚ for film and 60˚ for music is a principle that
applies in most situations, but in other post-production or broadcast program production situations, it is necessary to consider a placement that suits the intentions of the prodution. In the case of audio playback that accompanies video, it is important to consider not a numerical value of 45˚, but rather a placement
that takes into account the matching of the video with the audio. The spread of 45˚ that we mention here is one example of a placement angle often used when consideration is given to matching video and audio.
Regarding the placement height, it is desirable that elevation angle from the listening point be within 15˚. If the L/R speakers are placed higher than 15˚, the phantom image generated by L and R tends to blur.
C
L R L
Audio
Video
C R
6 0° 45°
LS RS LS RS
[Fig. 21] Wide angular spacing between L and R; 60-degree and 45-degree
USO
RES
TRIT
O
36 / 74
Multichannel Monitoring Tutorial Booklet (M2TB) rev. 3.5.2
Masataka Nakahara : SONA Corporation ©2005 YAMAHA Corporation, ©2005 SONA Corporation
L C
R
LS R S
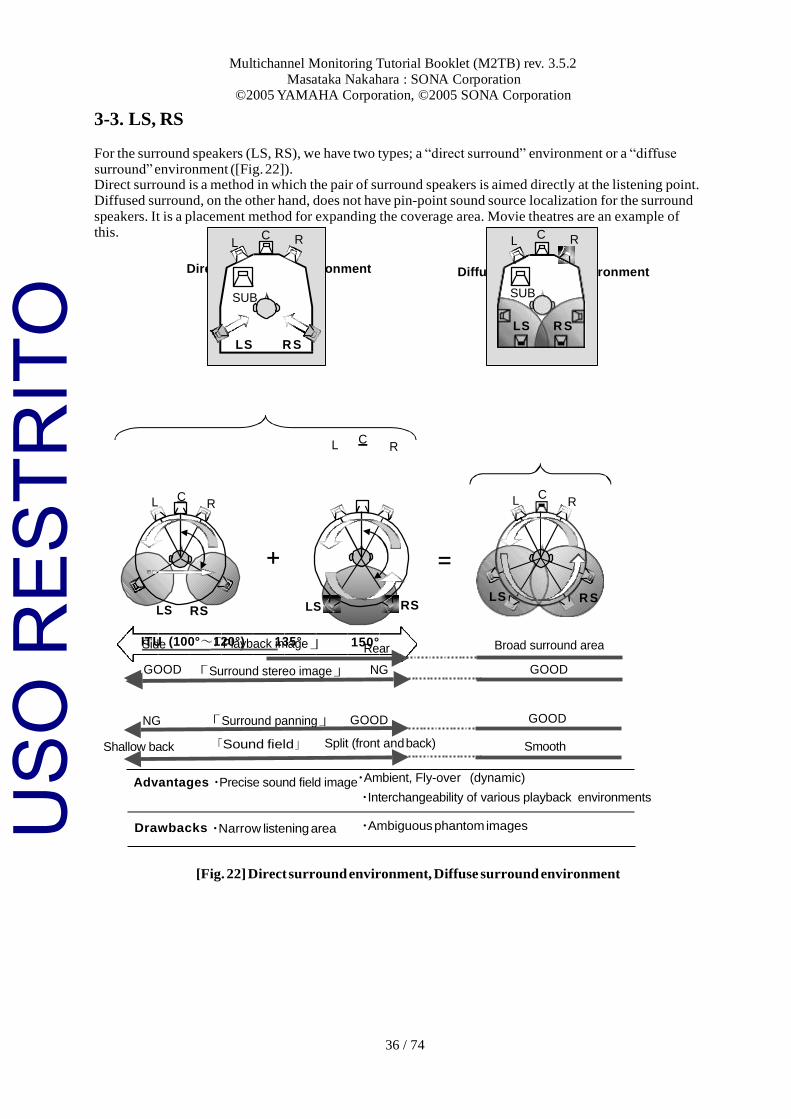
L C R
NG 「Surround panning」 GOOD GOOD
3-3. LS, RS
For the surround speakers (LS, RS), we have two types; a “direct surround” environment or a “diffuse surround” environment ([Fig. 22]). Direct surround is a method in which the pair of surround speakers is aimed directly at the listening point. Diffused surround, on the other hand, does not have pin-point sound source localization for the surround
speakers. It is a placement method for expanding the coverage area. Movie theatres are an example of this.
Direct Surround Environment Diffuse Surround Environment
+ =
LS RS LS RS
ITU (100°~120°) 135° 150°
Shallow back 「Sound field」 Split (front and back) Smooth
Advantages ・Precise sound field image・Ambient, Fly-over (dynamic)
・Interchangeability of various playback environments
Drawbacks ・Narrow listening area ・Ambiguous phantom images
[Fig. 22] Direct surround environment, Diffuse surround environment
Side 「Playback image」
GOOD 「Surround stereo image」
Rear
NG
Broad surround area
GOOD
L C R
L C R
SUB
LS R S
L C R
SUB
LS R S
USO
RES
TRIT
O
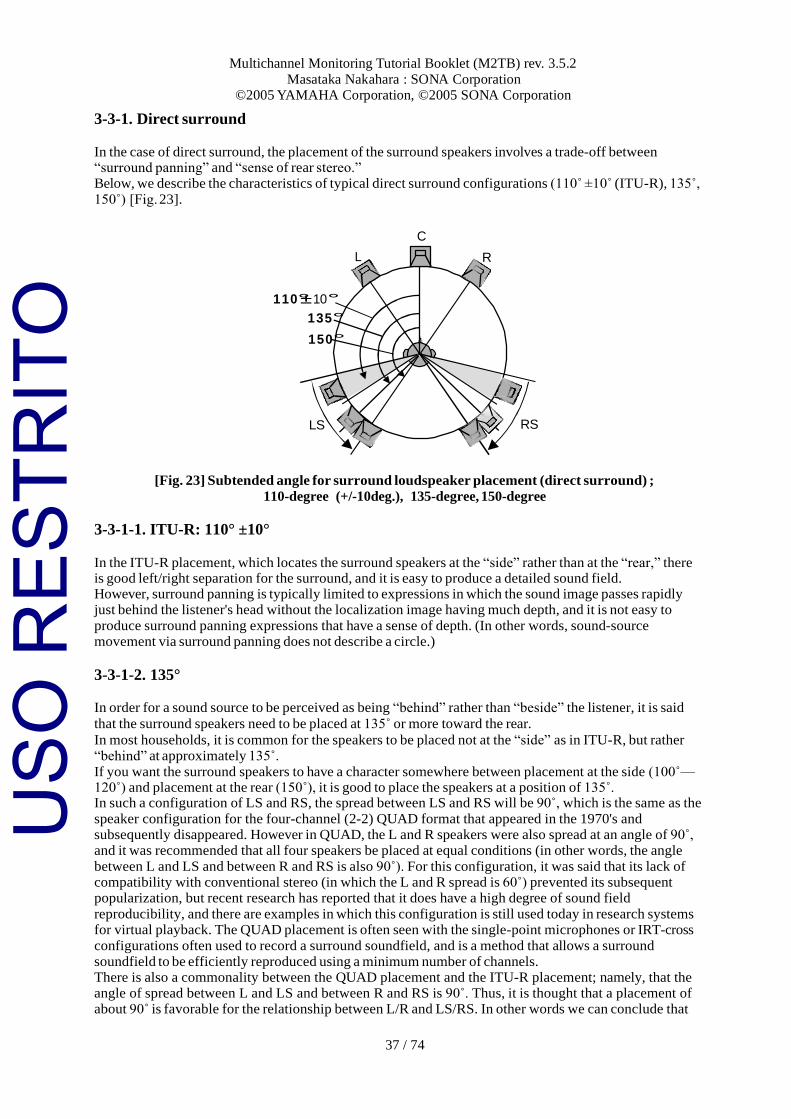
37 / 74
Multichannel Monitoring Tutorial Booklet (M2TB) rev. 3.5.2
Masataka Nakahara : SONA Corporation ©2005 YAMAHA Corporation, ©2005 SONA Corporation
3-3-1. Direct surround
In the case of direct surround, the placement of the surround speakers involves a trade-off between “surround panning” and “sense of rear stereo.” Below, we describe the characteristics of typical direct surround configurations (110˚ ±10˚ (ITU-R), 135˚,
150˚) [Fig. 23].
C
L R
11 0°±10°
135°
150°
LS RS
[Fig. 23] Subtended angle for surround loudspeaker placement (direct surround) ;
110-degree (+/-10deg.), 135-degree, 150-degree
3-3-1-1. ITU-R: 110° ±10°
In the ITU-R placement, which locates the surround speakers at the “side” rather than at the “rear,” there is good left/right separation for the surround, and it is easy to produce a detailed sound field. However, surround panning is typically limited to expressions in which the sound image passes rapidly just behind the listener's head without the localization image having much depth, and it is not easy to
produce surround panning expressions that have a sense of depth. (In other words, sound-source movement via surround panning does not describe a circle.)
3-3-1-2. 135°
In order for a sound source to be perceived as being “behind” rather than “beside” the listener, it is said
that the surround speakers need to be placed at 135˚ or more toward the rear.
In most households, it is common for the speakers to be placed not at the “side” as in ITU-R, but rather “behind” at approximately 135˚.
If you want the surround speakers to have a character somewhere between placement at the side (100˚—120˚) and placement at the rear (150˚), it is good to place the speakers at a position of 135˚. In such a configuration of LS and RS, the spread between LS and RS will be 90˚, which is the same as the
speaker configuration for the four-channel (2-2) QUAD format that appeared in the 1970's and subsequently disappeared. However in QUAD, the L and R speakers were also spread at an angle of 90˚, and it was recommended that all four speakers be placed at equal conditions (in other words, the angle
between L and LS and between R and RS is also 90˚). For this configuration, it was said that its lack of compatibility with conventional stereo (in which the L and R spread is 60˚) prevented its subsequent popularization, but recent research has reported that it does have a high degree of sound field
reproducibility, and there are examples in which this configuration is still used today in research systems for virtual playback. The QUAD placement is often seen with the single-point microphones or IRT-cross
configurations often used to record a surround soundfield, and is a method that allows a surround soundfield to be efficiently reproduced using a minimum number of channels. There is also a commonality between the QUAD placement and the ITU-R placement; namely, that the angle of spread between L and LS and between R and RS is 90˚. Thus, it is thought that a placement of about 90˚ is favorable for the relationship between L/R and LS/RS. In other words we can conclude that
USO
RES
TRIT
O
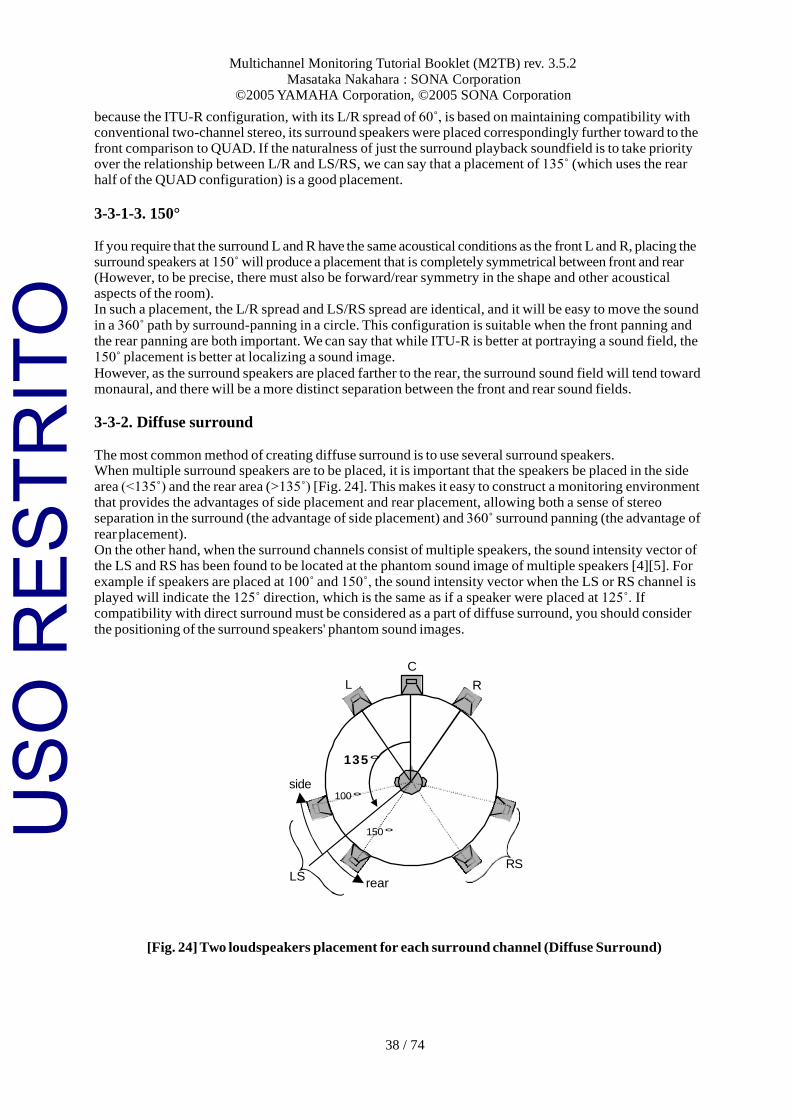
38 / 74
Multichannel Monitoring Tutorial Booklet (M2TB) rev. 3.5.2
Masataka Nakahara : SONA Corporation ©2005 YAMAHA Corporation, ©2005 SONA Corporation
because the ITU-R configuration, with its L/R spread of 60˚, is based on maintaining compatibility with conventional two-channel stereo, its surround speakers were placed correspondingly further toward to the front comparison to QUAD. If the naturalness of just the surround playback soundfield is to take priority over the relationship between L/R and LS/RS, we can say that a placement of 135˚ (which uses the rear half of the QUAD configuration) is a good placement.
3-3-1-3. 150°
If you require that the surround L and R have the same acoustical conditions as the front L and R, placing the surround speakers at 150˚ will produce a placement that is completely symmetrical between front and rear (However, to be precise, there must also be forward/rear symmetry in the shape and other acoustical aspects of the room). In such a placement, the L/R spread and LS/RS spread are identical, and it will be easy to move the sound
in a 360˚ path by surround-panning in a circle. This configuration is suitable when the front panning and the rear panning are both important. We can say that while ITU-R is better at portraying a sound field, the
150˚ placement is better at localizing a sound image.
However, as the surround speakers are placed farther to the rear, the surround sound field will tend toward monaural, and there will be a more distinct separation between the front and rear sound fields.
3-3-2. Diffuse surround
The most common method of creating diffuse surround is to use several surround speakers. When multiple surround speakers are to be placed, it is important that the speakers be placed in the side
area (<135˚) and the rear area (>135˚) [Fig. 24]. This makes it easy to construct a monitoring environment that provides the advantages of side placement and rear placement, allowing both a sense of stereo separation in the surround (the advantage of side placement) and 360˚ surround panning (the advantage of
rear placement). On the other hand, when the surround channels consist of multiple speakers, the sound intensity vector of the LS and RS has been found to be located at the phantom sound image of multiple speakers [4][5]. For
example if speakers are placed at 100˚ and 150˚, the sound intensity vector when the LS or RS channel is played will indicate the 125˚ direction, which is the same as if a speaker were placed at 125˚. If compatibility with direct surround must be considered as a part of diffuse surround, you should consider
the positioning of the surround speakers' phantom sound images.
C
L R
side
135°
100°
150°
RS LS
rear
[Fig. 24] Two loudspeakers placement for each surround channel (Diffuse Surround)
USO
RES
TRIT
O
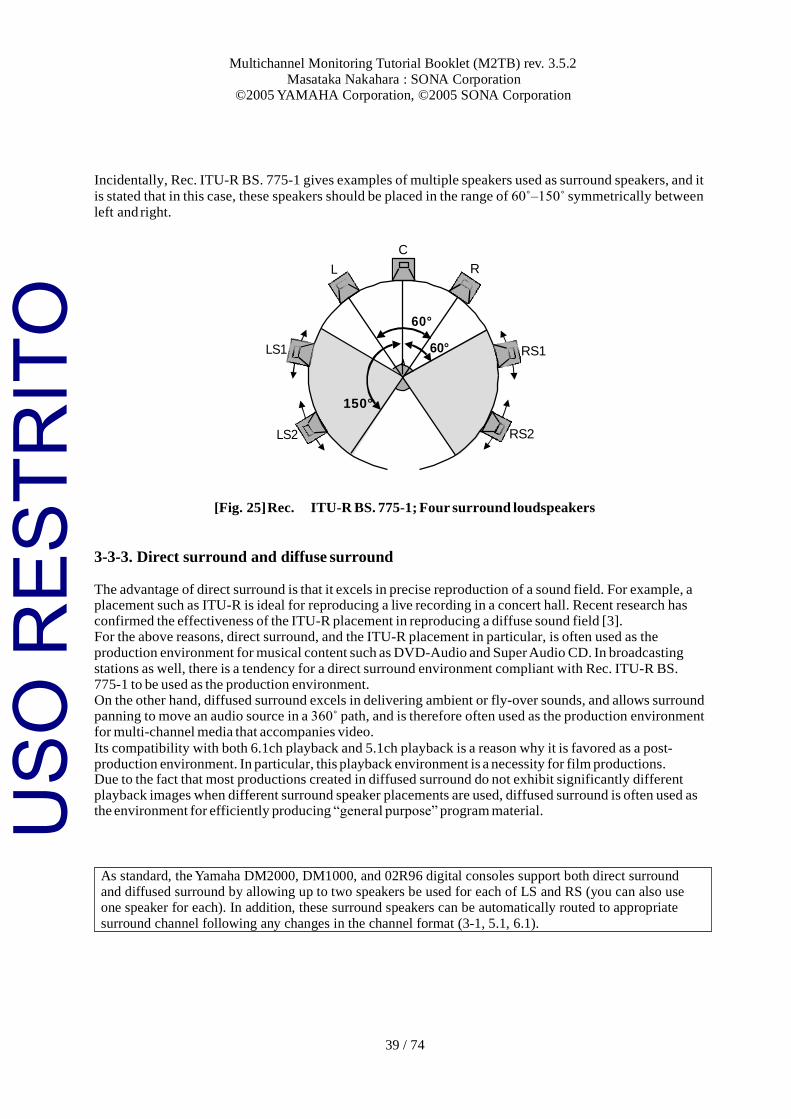
39 / 74
Multichannel Monitoring Tutorial Booklet (M2TB) rev. 3.5.2
Masataka Nakahara : SONA Corporation ©2005 YAMAHA Corporation, ©2005 SONA Corporation
Incidentally, Rec. ITU-R BS. 775-1 gives examples of multiple speakers used as surround speakers, and it
is stated that in this case, these speakers should be placed in the range of 60˚–150˚ symmetrically between
left and right.
C
L R
LS1
60°
60°
RS1
150°
LS2 RS2
[Fig. 25] Rec. ITU-R BS. 775-1; Four surround loudspeakers
3-3-3. Direct surround and diffuse surround
The advantage of direct surround is that it excels in precise reproduction of a sound field. For example, a placement such as ITU-R is ideal for reproducing a live recording in a concert hall. Recent research has confirmed the effectiveness of the ITU-R placement in reproducing a diffuse sound field [3]. For the above reasons, direct surround, and the ITU-R placement in particular, is often used as the
production environment for musical content such as DVD-Audio and Super Audio CD. In broadcasting
stations as well, there is a tendency for a direct surround environment compliant with Rec. ITU-R BS. 775-1 to be used as the production environment. On the other hand, diffused surround excels in delivering ambient or fly-over sounds, and allows surround panning to move an audio source in a 360˚ path, and is therefore often used as the production environment for multi-channel media that accompanies video.
Its compatibility with both 6.1ch playback and 5.1ch playback is a reason why it is favored as a post- production environment. In particular, this playback environment is a necessity for film productions. Due to the fact that most productions created in diffused surround do not exhibit significantly different playback images when different surround speaker placements are used, diffused surround is often used as the environment for efficiently producing “general purpose” program material.
As standard, the Yamaha DM2000, DM1000, and 02R96 digital consoles support both direct surround and diffused surround by allowing up to two speakers be used for each of LS and RS (you can also use one speaker for each). In addition, these surround speakers can be automatically routed to appropriate
surround channel following any changes in the channel format (3-1, 5.1, 6.1).
USO
RES
TRIT
O
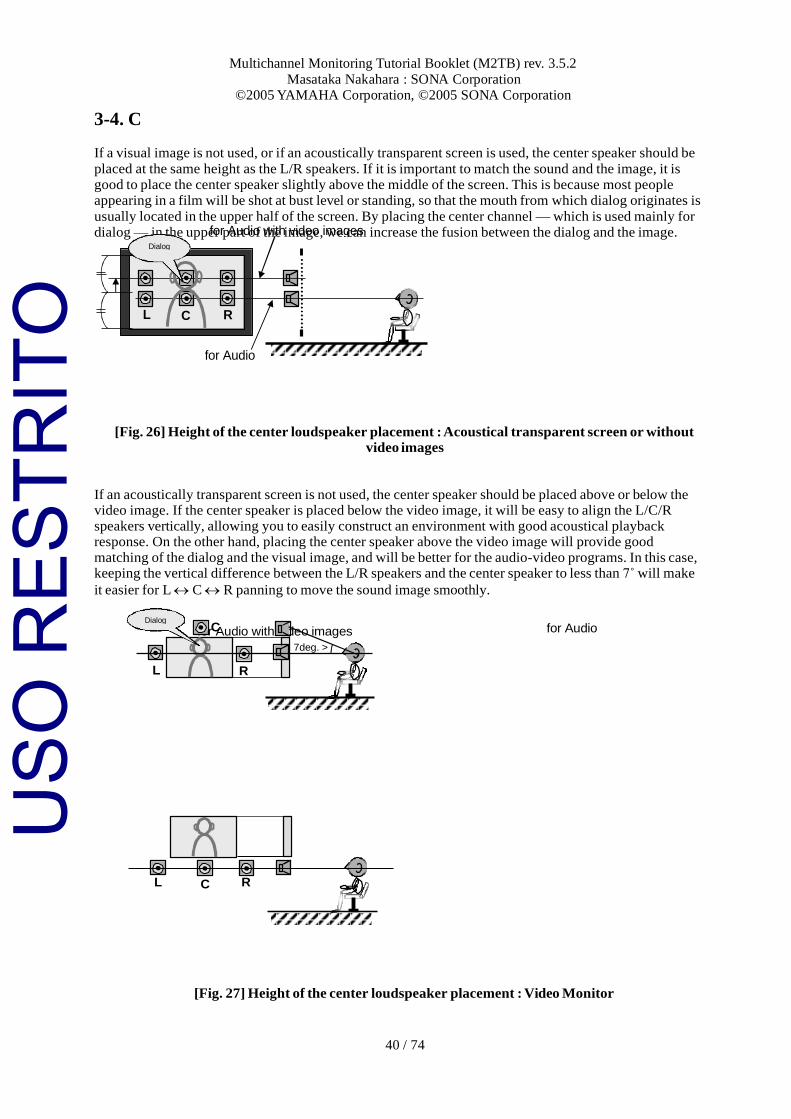
Multichannel Monitoring Tutorial Booklet (M2TB) rev. 3.5.2
Masataka Nakahara : SONA Corporation ©2005 YAMAHA Corporation, ©2005 SONA Corporation
40 / 74
3-4. C
If a visual image is not used, or if an acoustically transparent screen is used, the center speaker should be
placed at the same height as the L/R speakers. If it is important to match the sound and the image, it is good to place the center speaker slightly above the middle of the screen. This is because most people appearing in a film will be shot at bust level or standing, so that the mouth from which dialog originates is
usually located in the upper half of the screen. By placing the center channel — which is used mainly for dialog — in the upper part of the image, we can increase the fusion between the dialog and the image.
[Fig. 26] Height of the center loudspeaker placement : Acoustical transparent screen or without video images
If an acoustically transparent screen is not used, the center speaker should be placed above or below the video image. If the center speaker is placed below the video image, it will be easy to align the L/C/R speakers vertically, allowing you to easily construct an environment with good acoustical playback response. On the other hand, placing the center speaker above the video image will provide good matching of the dialog and the visual image, and will be better for the audio-video programs. In this case, keeping the vertical difference between the L/R speakers and the center speaker to less than 7˚ will make
it easier for L C R panning to move the sound image smoothly.
for Audio with video images for Audio
[Fig. 27] Height of the center loudspeaker placement : Video Monitor
L C R
Dialog C
7deg. >
L R
for Audio with video images Dialog
L C R
for Audio
USO
RES
TRIT
O
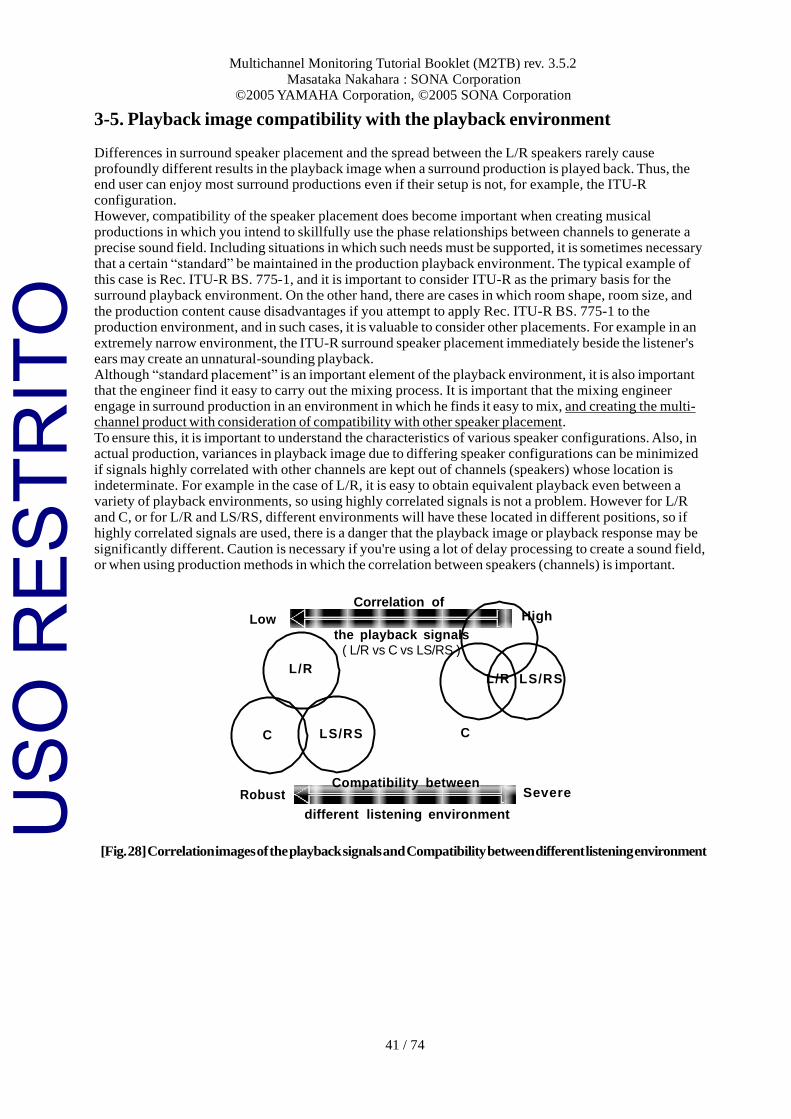
Multichannel Monitoring Tutorial Booklet (M2TB) rev. 3.5.2
Masataka Nakahara : SONA Corporation ©2005 YAMAHA Corporation, ©2005 SONA Corporation
41 / 74
Low the playback signals
( L/R vs C vs LS/RS )
L/R L/R
C LS/RS C
Compatibility between
3-5. Playback image compatibility with the playback environment
Differences in surround speaker placement and the spread between the L/R speakers rarely cause profoundly different results in the playback image when a surround production is played back. Thus, the end user can enjoy most surround productions even if their setup is not, for example, the ITU-R configuration. However, compatibility of the speaker placement does become important when creating musical
productions in which you intend to skillfully use the phase relationships between channels to generate a precise sound field. Including situations in which such needs must be supported, it is sometimes necessary
that a certain “standard” be maintained in the production playback environment. The typical example of this case is Rec. ITU-R BS. 775-1, and it is important to consider ITU-R as the primary basis for the surround playback environment. On the other hand, there are cases in which room shape, room size, and
the production content cause disadvantages if you attempt to apply Rec. ITU-R BS. 775-1 to the production environment, and in such cases, it is valuable to consider other placements. For example in an
extremely narrow environment, the ITU-R surround speaker placement immediately beside the listener's ears may create an unnatural-sounding playback. Although “standard placement” is an important element of the playback environment, it is also important that the engineer find it easy to carry out the mixing process. It is important that the mixing engineer engage in surround production in an environment in which he finds it easy to mix, and creating the multi- channel product with consideration of compatibility with other speaker placement.
To ensure this, it is important to understand the characteristics of various speaker configurations. Also, in actual production, variances in playback image due to differing speaker configurations can be minimized
if signals highly correlated with other channels are kept out of channels (speakers) whose location is indeterminate. For example in the case of L/R, it is easy to obtain equivalent playback even between a variety of playback environments, so using highly correlated signals is not a problem. However for L/R
and C, or for L/R and LS/RS, different environments will have these located in different positions, so if highly correlated signals are used, there is a danger that the playback image or playback response may be
significantly different. Caution is necessary if you're using a lot of delay processing to create a sound field, or when using production methods in which the correlation between speakers (channels) is important.
Correlation of High
Robust Severe
different listening environment
[Fig. 28] Correlation images of the playback signals and Compatibility between different listening environment
LS/RS
USO
RES
TRIT
O
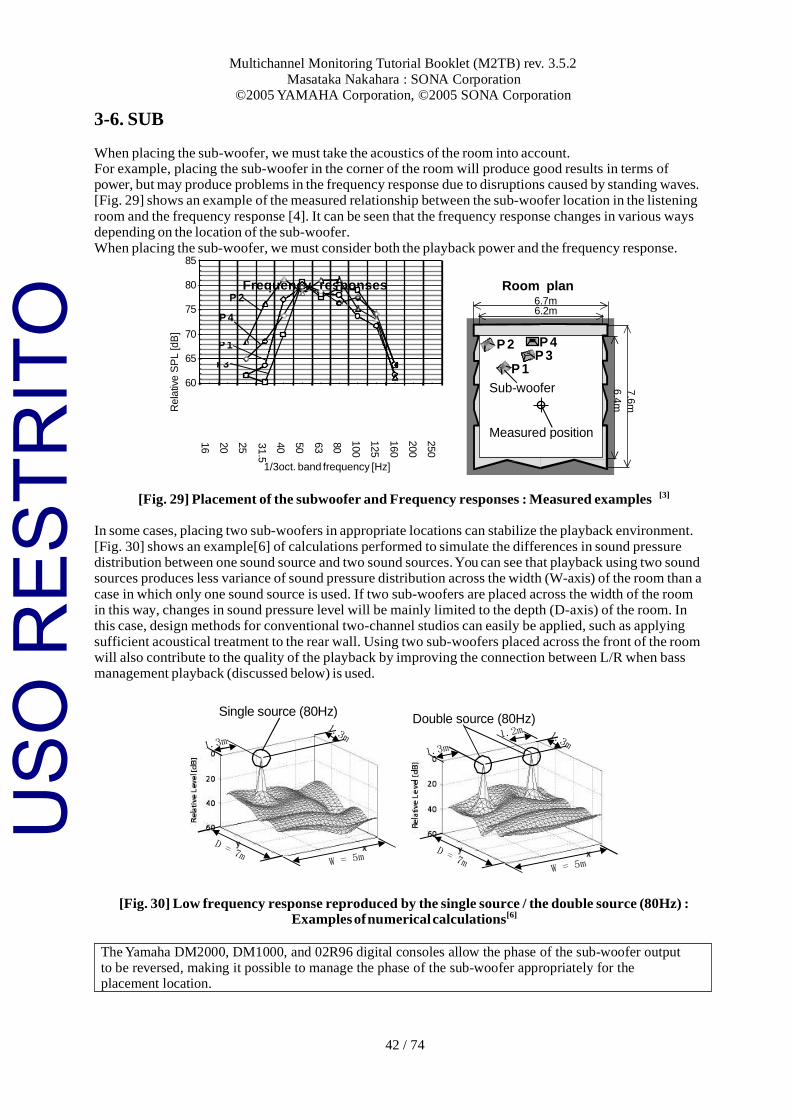
42 / 74
Multichannel Monitoring Tutorial Booklet (M2TB) rev. 3.5.2
Masataka Nakahara : SONA Corporation ©2005 YAMAHA Corporation, ©2005 SONA Corporation
250
200
160
125
100
80
63
50
40
31
.5
25
20
16
3-6. SUB
When placing the sub-woofer, we must take the acoustics of the room into account. For example, placing the sub-woofer in the corner of the room will produce good results in terms of power, but may produce problems in the frequency response due to disruptions caused by standing waves. [Fig. 29] shows an example of the measured relationship between the sub-woofer location in the listening
room and the frequency response [4]. It can be seen that the frequency response changes in various ways depending on the location of the sub-woofer.
When placing the sub-woofer, we must consider both the playback power and the frequency response.
Frequency responses Room plan
1/3oct. band frequency [Hz]
[Fig. 29] Placement of the subwoofer and Frequency responses : Measured examples [3]
In some cases, placing two sub-woofers in appropriate locations can stabilize the playback environment.
[Fig. 30] shows an example[6] of calculations performed to simulate the differences in sound pressure distribution between one sound source and two sound sources. You can see that playback using two sound sources produces less variance of sound pressure distribution across the width (W-axis) of the room than a
case in which only one sound source is used. If two sub-woofers are placed across the width of the room in this way, changes in sound pressure level will be mainly limited to the depth (D-axis) of the room. In this case, design methods for conventional two-channel studios can easily be applied, such as applying
sufficient acoustical treatment to the rear wall. Using two sub-woofers placed across the front of the room will also contribute to the quality of the playback by improving the connection between L/R when bass management playback (discussed below) is used.
Single source (80Hz)
[Fig. 30] Low frequency response reproduced by the single source / the double source (80Hz) : Examples of numerical calculations[6]
The Yamaha DM2000, DM1000, and 02R96 digital consoles allow the phase of the sub-woofer output to be reversed, making it possible to manage the phase of the sub-woofer appropriately for the placement location.
P 2
P 4
P 1
P 3
85 80
75
70
65 60
6.2m 6.7m
P 2
P 1
P 4 P 3
Sub-woofer
Measured position
Double source (80Hz)
7.6
m
6.4
m R
ela
tive S
PL [d
B]
USO
RES
TRIT
O
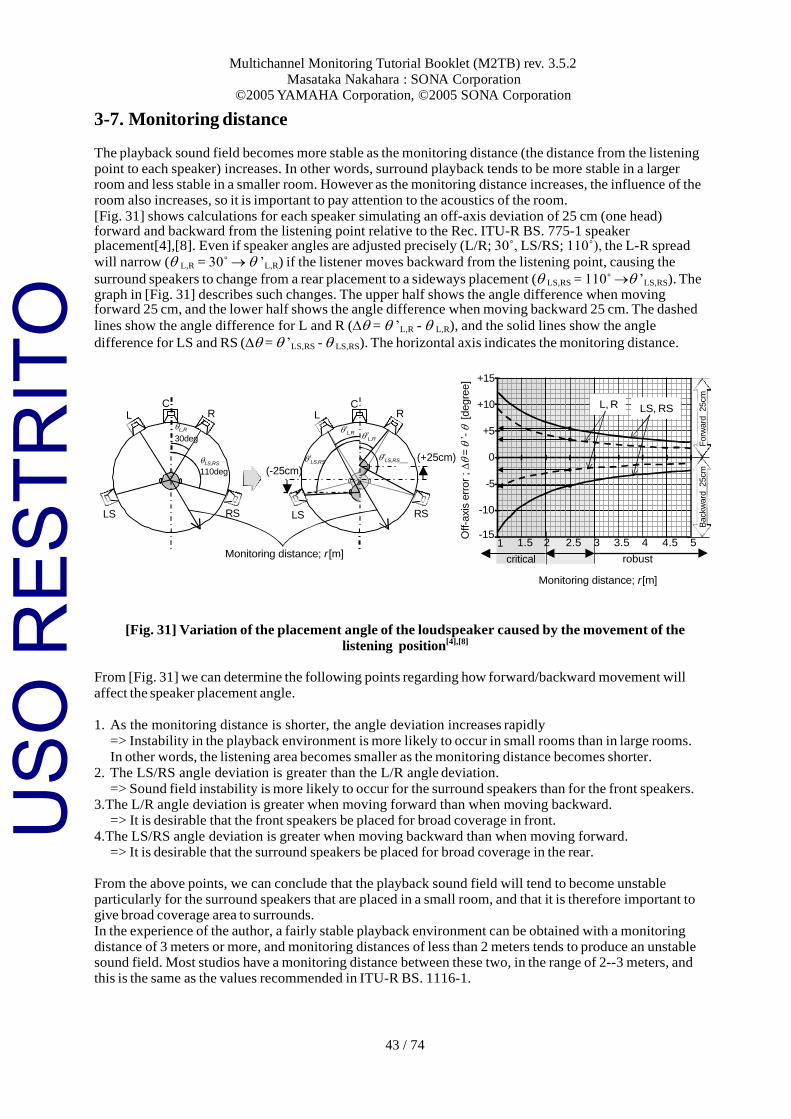
43 / 74
Multichannel Monitoring Tutorial Booklet (M2TB) rev. 3.5.2
Masataka Nakahara : SONA Corporation ©2005 YAMAHA Corporation, ©2005 SONA Corporation
3-7. Monitoring distance
The playback sound field becomes more stable as the monitoring distance (the distance from the listening point to each speaker) increases. In other words, surround playback tends to be more stable in a larger room and less stable in a smaller room. However as the monitoring distance increases, the influence of the room also increases, so it is important to pay attention to the acoustics of the room.
[Fig. 31] shows calculations for each speaker simulating an off-axis deviation of 25 cm (one head) forward and backward from the listening point relative to the Rec. ITU-R BS. 775-1 speaker placement[4],[8]. Even if speaker angles are adjusted precisely (L/R; 30˚, LS/RS; 110˚), the L-R spread
will narrow (L,R = 30˚ ’L,R) if the listener moves backward from the listening point, causing the
surround speakers to change from a rear placement to a sideways placement (LS,RS = 110˚ ’LS,RS). The graph in [Fig. 31] describes such changes. The upper half shows the angle difference when moving forward 25 cm, and the lower half shows the angle difference when moving backward 25 cm. The dashed
lines show the angle difference for L and R (= ’L,R - L,R), and the solid lines show the angle
difference for LS and RS (= ’LS,RS - LS,RS). The horizontal axis indicates the monitoring distance.
C L
L,R
30deg
R
LS,RS
110deg
(-25cm)
L
’LS,RS
C
’L,R
’L,R
R
’LS,RS
(+25cm)
+15
+10
+5
0
-5
L, R
LS, RS
LS RS LS RS -10
-15
1
1.5 2
2.5 3
3.5 4
4.5 5
Monitoring distance; r [m] critical robust
Monitoring distance; r [m]
[Fig. 31] Variation of the placement angle of the loudspeaker caused by the movement of the
listening position[4],[8]
From [Fig. 31] we can determine the following points regarding how forward/backward movement will
affect the speaker placement angle.
1. As the monitoring distance is shorter, the angle deviation increases rapidly
=> Instability in the playback environment is more likely to occur in small rooms than in large rooms.
In other words, the listening area becomes smaller as the monitoring distance becomes shorter.
2. The LS/RS angle deviation is greater than the L/R angle deviation.
=> Sound field instability is more likely to occur for the surround speakers than for the front speakers. 3.The L/R angle deviation is greater when moving forward than when moving backward.
=> It is desirable that the front speakers be placed for broad coverage in front.
4.The LS/RS angle deviation is greater when moving backward than when moving forward. => It is desirable that the surround speakers be placed for broad coverage in the rear.
From the above points, we can conclude that the playback sound field will tend to become unstable particularly for the surround speakers that are placed in a small room, and that it is therefore important to give broad coverage area to surrounds.
In the experience of the author, a fairly stable playback environment can be obtained with a monitoring distance of 3 meters or more, and monitoring distances of less than 2 meters tends to produce an unstable sound field. Most studios have a monitoring distance between these two, in the range of 2--3 meters, and this is the same as the values recommended in ITU-R BS. 1116-1.
Off-a
xis
err
or
;
=
’-
[d
egre
e]
Backw
ard
25cm
F
orw
ard
25cm
USO
RES
TRIT
O
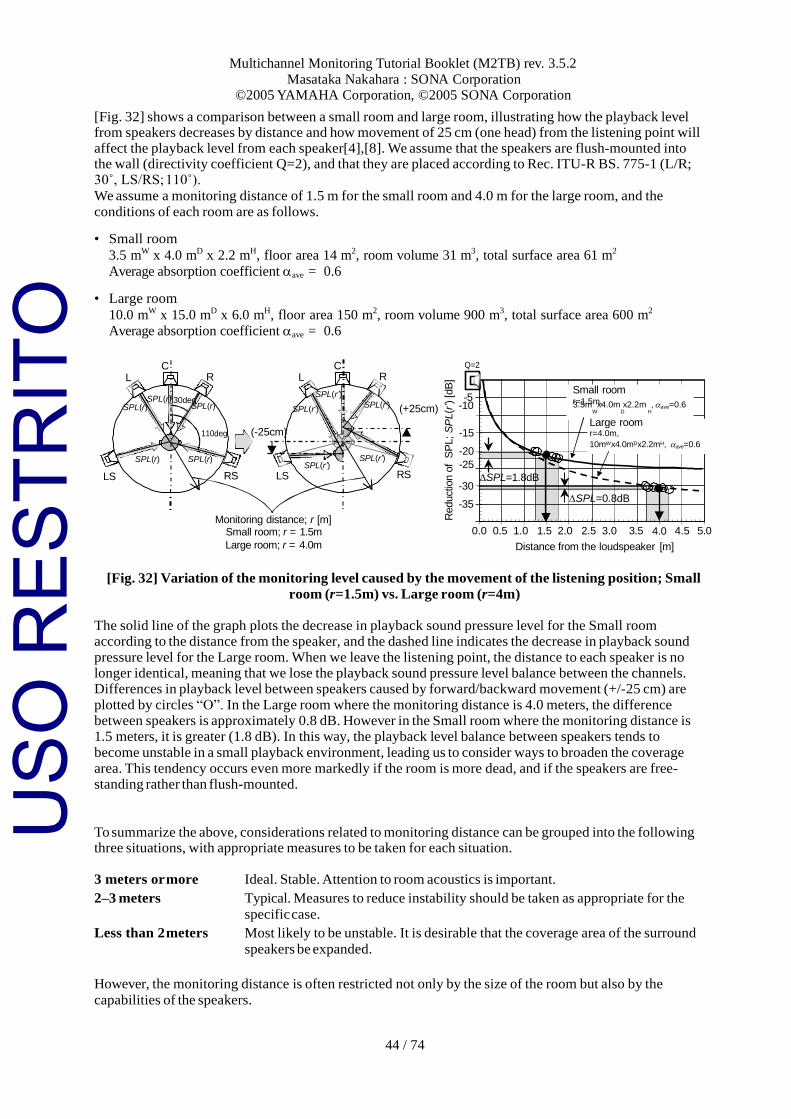
44 / 74
Multichannel Monitoring Tutorial Booklet (M2TB) rev. 3.5.2
Masataka Nakahara : SONA Corporation ©2005 YAMAHA Corporation, ©2005 SONA Corporation
0
[Fig. 32] shows a comparison between a small room and large room, illustrating how the playback level from speakers decreases by distance and how movement of 25 cm (one head) from the listening point will affect the playback level from each speaker[4],[8]. We assume that the speakers are flush-mounted into the wall (directivity coefficient Q=2), and that they are placed according to Rec. ITU-R BS. 775-1 (L/R; 30˚, LS/RS; 110˚).
We assume a monitoring distance of 1.5 m for the small room and 4.0 m for the large room, and the
conditions of each room are as follows.
• Small room
3.5 mW x 4.0 mD x 2.2 mH, floor area 14 m2, room volume 31 m3, total surface area 61 m2
Average absorption coefficient ave = 0.6
• Large room
10.0 mW x 15.0 mD x 6.0 mH, floor area 150 m2, room volume 900 m3, total surface area 600 m2
Average absorption coefficient ave = 0.6
C L R
SPL(r) 30deg
C L R
SPL(r’)
Q=2
-5
Small room r=1.5m,
SPL(r) SPL(r) SPL(r’) SPL(r’) (+25cm) -10 3.5m x4.0m x2.2m , ave=0.6
W D H
110deg
SPL(r) SPL(r)
(-25cm)
SPL(r’)
SPL(r’)
-15
-20
-25
Large room r=4.0m,
10mWx4.0mDx2.2mH, ave=0.6
LS RS LS RS
-30
-35
SPL=1.8dB
SPL=0.8dB
Monitoring distance; r [m] Small room; r = 1.5m
0.0 0.5 1.0 1.5 2.0 2.5 3.0 3.5
4.0
4.5 5.0
Large room; r = 4.0m Distance from the loudspeaker [m]
[Fig. 32] Variation of the monitoring level caused by the movement of the listening position; Small
room (r=1.5m) vs. Large room (r=4m)
The solid line of the graph plots the decrease in playback sound pressure level for the Small room according to the distance from the speaker, and the dashed line indicates the decrease in playback sound
pressure level for the Large room. When we leave the listening point, the distance to each speaker is no longer identical, meaning that we lose the playback sound pressure level balance between the channels. Differences in playback level between speakers caused by forward/backward movement (+/-25 cm) are
plotted by circles “O”. In the Large room where the monitoring distance is 4.0 meters, the difference between speakers is approximately 0.8 dB. However in the Small room where the monitoring distance is 1.5 meters, it is greater (1.8 dB). In this way, the playback level balance between speakers tends to
become unstable in a small playback environment, leading us to consider ways to broaden the coverage
area. This tendency occurs even more markedly if the room is more dead, and if the speakers are free- standing rather than flush-mounted.
To summarize the above, considerations related to monitoring distance can be grouped into the following three situations, with appropriate measures to be taken for each situation.
3 meters or more Ideal. Stable. Attention to room acoustics is important.
2–3 meters Typical. Measures to reduce instability should be taken as appropriate for the
specific case.
Less than 2 meters Most likely to be unstable. It is desirable that the coverage area of the surround
speakers be expanded.
However, the monitoring distance is often restricted not only by the size of the room but also by the
capabilities of the speakers.
Reductio
n o
f S
PL; S
PL(r’)
[dB
]
USO
RES
TRIT
O
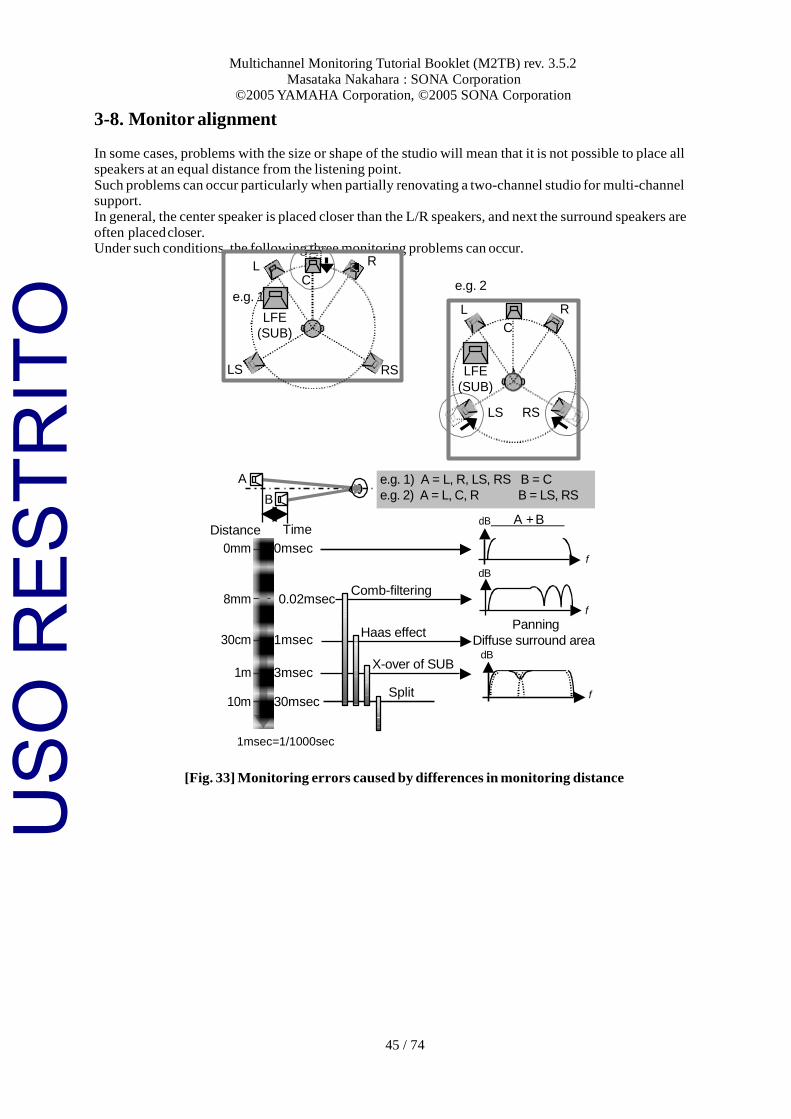
45 / 74
Multichannel Monitoring Tutorial Booklet (M2TB) rev. 3.5.2
Masataka Nakahara : SONA Corporation ©2005 YAMAHA Corporation, ©2005 SONA Corporation
A
B
3-8. Monitor alignment
In some cases, problems with the size or shape of the studio will mean that it is not possible to place all speakers at an equal distance from the listening point.
Such problems can occur particularly when partially renovating a two-channel studio for multi-channel support. In general, the center speaker is placed closer than the L/R speakers, and next the surround speakers are
often placed closer. Under such conditions, the following three monitoring problems can occur.
e.g. 1 e.g. 2
Distance Time dB A + B
0mm
8mm
30cm
1m
10m
0msec
0.02msec
1msec
3msec
30msec
Comb-filtering
Haas effect
X-over of SUB
Split
f
dB
f
Panning
Diffuse surround area dB
f
1msec=1/1000sec
[Fig. 33] Monitoring errors caused by differences in monitoring distance
e.g. 1) A = L, R, LS, RS B = C
e.g. 2) A = L, C, R B = LS, RS
L R
C
LFE
(SUB)
LS RS
L R
C
LFE
(SUB)
LS RS
USO
RES
TRIT
O
46 / 74
Multichannel Monitoring Tutorial Booklet (M2TB) rev. 3.5.2
Masataka Nakahara : SONA Corporation ©2005 YAMAHA Corporation, ©2005 SONA Corporation
3-8-1. Comb filtering: Distance difference > 8 mm
If the same sound is played back from two speakers whose distance to the listening point differs by 8 mm or more, dips will occur in the frequency region below 20 kHz. A distance of 8 mm corresponds to a minute time difference of approximately 0.025 msec when converted by the speed of sound, and can be caused not only by differences in physical distance, but also by the rigidity of the speaker, the wiring, and electrical delay produced by equipment.
3-8-2. Haas effect: Distance difference > 30 cm
This is also called the “precedence effect,” which is the phenomenon that causes the perceptual sound source to be strongly localized around the closer of two sound sources. The distance difference at which the Haas effect appears depends on the type of signal, but in general is greater than 30 cm. A monitoring
environment in which the Hass effect is occurring may experience problems such as failure of the sound image to move smoothly when panning occurs. For example if the surround speakers (LS, RS) are placed more than 30 cm closer than the front speakers (L, C, R), the sound source movement when you
surround-pan from surround -> front will not be heard smoothly because the perceptual panning is pulled strongly toward the surround speakers.
Another problem is that in a diffuse surround environment, the surround coverage area may not be wide enough, causing the perceived sound image to be located only around the nearest surround speaker.
3-8-3. Crossover with the sub-woofer: Distance difference > 1 m
If there is more than 1 meter of difference between the distance from the sub-woofer to the listening point and the distance from the other speakers to the listening point, dips are likely to occur in the combined response.
Severe dips occur in the region of the sub-woofer cutoff frequency. If the monitor system uses bass management (discussed below), special care must be taken to avoid
significantly impairing the frequency response of the main channels.
If the above monitoring problems occur, you will need to reconsider the speaker placement, and try
adjusting the speaker phase (in particular, the sub-woofer).
If improvements cannot be expected from the above adjustments, it will be necessary to apply electrical delays to each speaker.
In addition to delay, designing your monitor system so that an attenuator or GEQ (PEQ) can be applied to each speaker often provides useful ways to adjust the monitoring response.
USO
RES
TRIT
O
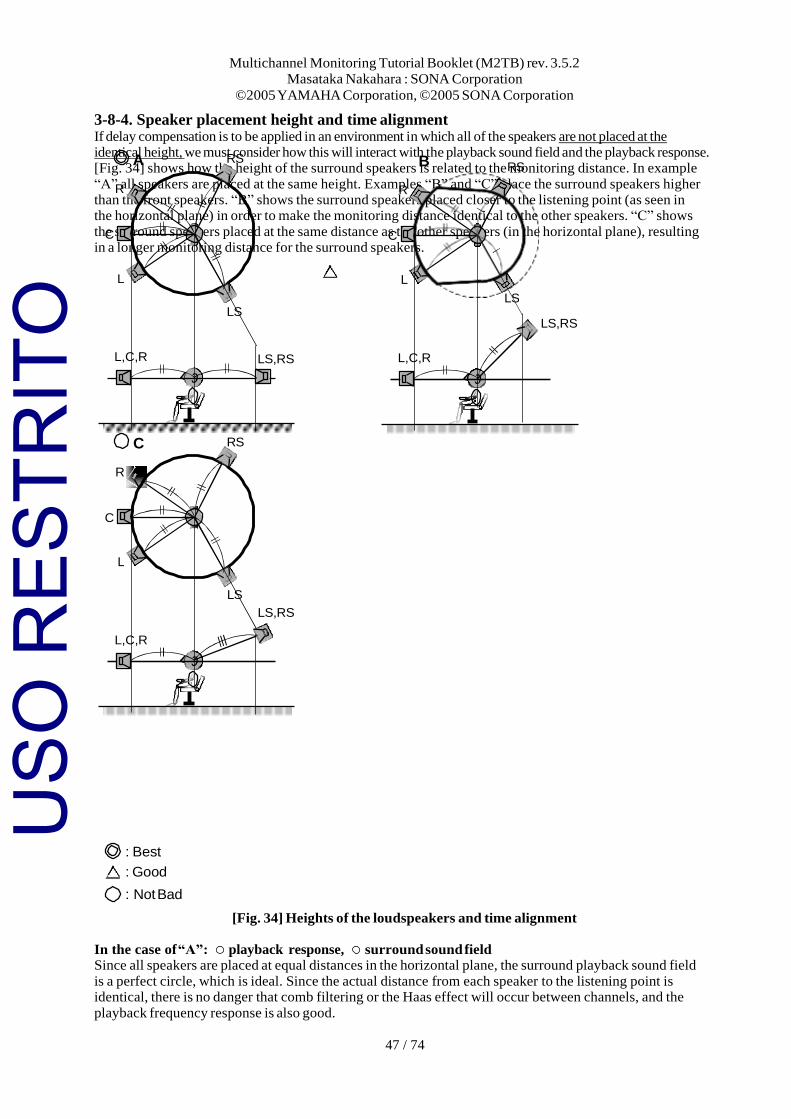
47 / 74
Multichannel Monitoring Tutorial Booklet (M2TB) rev. 3.5.2
Masataka Nakahara : SONA Corporation
©2005 YAMAHA Corporation, ©2005 SONA Corporation
3-8-4. Speaker placement height and time alignment If delay compensation is to be applied in an environment in which all of the speakers are not placed at the identical height, we must consider how this will interact with the playback sound field and the playback response. [Fig. 34] shows how the height of the surround speakers is related to the monitoring distance. In example
“A” all speakers are placed at the same height. Examples “B” and “C” place the surround speakers higher than the front speakers. “B” shows the surround speakers placed closer to the listening point (as seen in the horizontal plane) in order to make the monitoring distance identical to the other speakers. “C” shows
the surround speakers placed at the same distance as the other speakers (in the horizontal plane), resulting in a longer monitoring distance for the surround speakers.
: Best
: Good
: Not Bad
[Fig. 34] Heights of the loudspeakers and time alignment
In the case of “A”: playback response, surround sound field Since all speakers are placed at equal distances in the horizontal plane, the surround playback sound field
is a perfect circle, which is ideal. Since the actual distance from each speaker to the listening point is identical, there is no danger that comb filtering or the Haas effect will occur between channels, and the
playback frequency response is also good.
C,R
C RS
R
C
L
LS
LS,RS
L,
C,R
B RS
R
C
L
LS
LS,RS
L, C,R
A RS
R
C
L
LS
L, LS,RS
USO
RES
TRIT
O
48 / 74
In the case of “B”: playback response, surround sound field Since the actual distance from each speaker to the listening point is identical, there is no danger that comb
filtering or the Haas effect will occur between channels, and the playback frequency response is also good. However in the horizontal plane, the surround speakers are closer, meaning that the surround sound field is
not a perfect circle. Naturalness of the surround playback field is obtained when the distance from each speaker to the listening point is the same in the horizontal plane. In such cases, the perceptual impression will be that the surround sound is being played back from a nearby but higher location, and the surround
playback will be lacking in depth. If the surround is more distant than the front it will seldom be perceived as being unnatural, but if it is closer, the listener will usually sense that something is wrong. Sometimes this type of sound field can be created by automatically adjusted delay compensation, so caution is needed.
In the case of “C”: playback response, surround sound field Since equal distance in the horizontal plane is maintained, the surround sound field is a perfect circle, which is good. On the other hand, the actual distance from the surround speakers to the listening point is
greater than the distance to the front speakers, possibly causing problems with the playback response. For example if the same type of signal is being played back from the front channels and the surround channels,
USO
RES
TRIT
O
48 / 74
Multichannel Monitoring Tutorial Booklet (M2TB) rev. 3.5.2
Masataka Nakahara : SONA Corporation
©2005 YAMAHA Corporation, ©2005 SONA Corporation
comb filtering could cause highs to be attenuated in the playback sound.
In musical productions, signals that are highly correlated between the front channels and surround channels are sometimes used to create phantom sound images in a variety of directions. In such cases, it is
desirable that the distance from each speaker to the listening point be identical so that loss of highs does not occur in the playback response. In addition, in order to obtain a good surround playback sound field, it is necessary that all speakers be placed at the same height. This means that “A” is ideal as a playback
environment for musical productions, but if for various reasons the height of the surround speakers must differ from the height of the front speakers, you must decide whether the surround playback sound field or the playback response are of greater importance, and choose either “B” or “C” as the playback
environment. For post-productions such as DVD-Video and film on the other hand, it is customary to place the surround
speakers higher than the front speakers, and in this case it is best to construct environment “C” in which priority is given to the naturalness of the surround sound field. In post-productions, it is usually the case
that the acoustical roles can be divided between the three categories of L/R, C, and LS/RS, and it is seldom the case that signals are highly correlated between these. Thus, even if the actual distance to the front channels differs slightly from the distance to the surround channels, it is not likely that comb
filtering effects between the two signals will cause problems in the playback response such as a loss of highs. This means that we should give preference to environment “C,” since the surround sound field will be well-formed and gestures such as flyovers can be performed. However if the distance difference
between the front channels and surround channels is so great that the Haas effect results, we need to consider an environment that falls between “B” and “C.”
3-9. THX pm3 Certified Studios
At present, there is a profusion of multi-channel playback environments. When deciding which playback environment you will ultimately construct, you must take into account overall considerations such as the media you will be producing, and the state of your room.
It is also important that the level balance and frequency response of each speaker in
your multi-channel monitoring system be adjusted according to the media you are producing.
Announced by THX Ltd. in 1999, THX pm3 is a program for designing this type of small to medium size multi-channel studio, and is currently the only design program that provides a total solution.
The THX pm3 Certified Studio program allows the design of a multi-channel studio according to the following guidelines.
1. Achievement of room acoustic performance that meets standards for soundproofing, NC values, and reverberation time etc.
2. Consideration of the ideal speaker placement as appropriate for the purpose of the studio and the room environment.
3. Monitor adjustments and certification measurements performed by a specialized THX engineer.
4. If the room acoustics and monitoring response satisfies the THX pm3 reference values, certification as a THX pm3 Certified Studio.
5. Following certification, certification measures are performed at yearly intervals, and monitor response is re-adjusted if necessary. This ensures that a monitoring environment in compliance with the regulations is maintained.
The Yamaha DM2000, DM1000, and 02R96 digital consoles allow a delay in 0.02 ms steps (0 - 30 msec) and a gain adjustment in 0.1 dB steps (-12db - +12 dB) to be applied to each speaker output. This allows precise adjustments to be made to eradicate comb filtering effects in the audible band
( <20 kHz).
USO
RES
TRIT
O
49 / 74
Multichannel Monitoring Tutorial Booklet (M2TB) rev. 3.5.2
Masataka Nakahara : SONA Corporation ©2005 YAMAHA Corporation, ©2005 SONA Corporation
In order to construct a reliable monitoring environment, THX pm3 also requires that playback equipment such as speakers and amps be selected from a list of approved equipment that has met careful testing by
THX. In addition to this equipment, equipment related to surround monitoring (such as the bass management controller described in the following section) must also be approved.
The combination of “appropriate room acoustic design,” “appropriate combination of playback equipment,” and a “yearly check by dedicated staff” makes a THX pm3 Certified Studio that reliably delivers an accurate multi-channel playback environment.
* For details regarding THX pm3 Certified Studios, refer to http://www.thx.com
THX and THX pm3 are trademarks of THX Ltd. which may be registered in some jurisdictions. All rights reserved.
The Yamaha DM2000, DM1000, and 02R digital consoles are the first mixing consoles whose bass management and other surround monitoring controller functionality have been approved as THX pm3 Approved equipment (DM2000 and
02R96: Ver.2.1 and later, DM1000: Ver.2.0 and later). In addition to being the first approved bass management controllers built into mixing consoles, these are also the first full-digital THX pm3 Approved bass management controllers. This indicates
that the surround monitoring functionality of the DM2000, DM1000, and
02R96 provides sufficient functionality to act as a stand-alone monitor controller.
USO
RES
TRIT
O
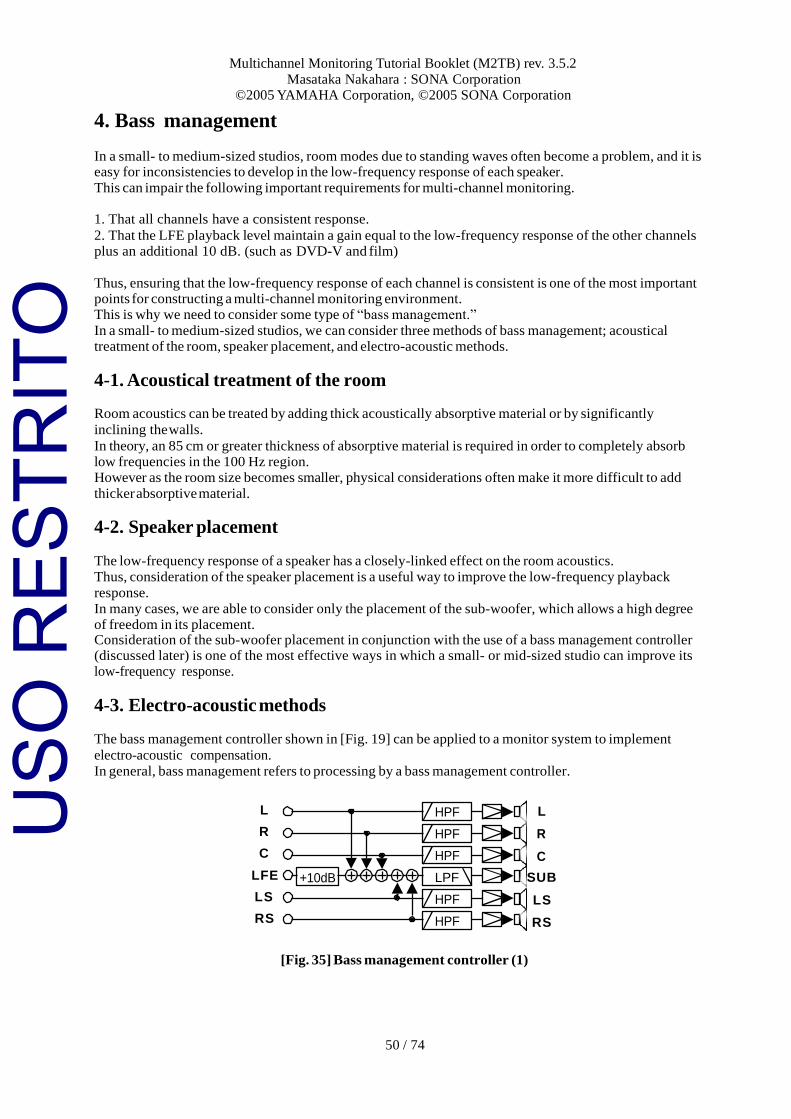
Multichannel Monitoring Tutorial Booklet (M2TB) rev. 3.5.2
Masataka Nakahara : SONA Corporation ©2005 YAMAHA Corporation, ©2005 SONA Corporation
50 / 74
4. Bass management
In a small- to medium-sized studios, room modes due to standing waves often become a problem, and it is easy for inconsistencies to develop in the low-frequency response of each speaker.
This can impair the following important requirements for multi-channel monitoring.
1. That all channels have a consistent response.
2. That the LFE playback level maintain a gain equal to the low-frequency response of the other channels plus an additional 10 dB. (such as DVD-V and film)
Thus, ensuring that the low-frequency response of each channel is consistent is one of the most important points for constructing a multi-channel monitoring environment. This is why we need to consider some type of “bass management.”
In a small- to medium-sized studios, we can consider three methods of bass management; acoustical treatment of the room, speaker placement, and electro-acoustic methods.
4-1. Acoustical treatment of the room
Room acoustics can be treated by adding thick acoustically absorptive material or by significantly
inclining the walls.
In theory, an 85 cm or greater thickness of absorptive material is required in order to completely absorb low frequencies in the 100 Hz region. However as the room size becomes smaller, physical considerations often make it more difficult to add
thicker absorptive material.
4-2. Speaker placement
The low-frequency response of a speaker has a closely-linked effect on the room acoustics.
Thus, consideration of the speaker placement is a useful way to improve the low-frequency playback
response.
In many cases, we are able to consider only the placement of the sub-woofer, which allows a high degree of freedom in its placement. Consideration of the sub-woofer placement in conjunction with the use of a bass management controller (discussed later) is one of the most effective ways in which a small- or mid-sized studio can improve its low-frequency response.
4-3. Electro-acoustic methods
The bass management controller shown in [Fig. 19] can be applied to a monitor system to implement
electro-acoustic compensation.
In general, bass management refers to processing by a bass management controller.
L
R
C
LFE
LS
RS
+10dB
HPF
HPF
HPF
LPF
HPF
HPF
L
R
C
SUB
LS
RS
[Fig. 35] Bass management controller (1)
USO
RES
TRIT
O
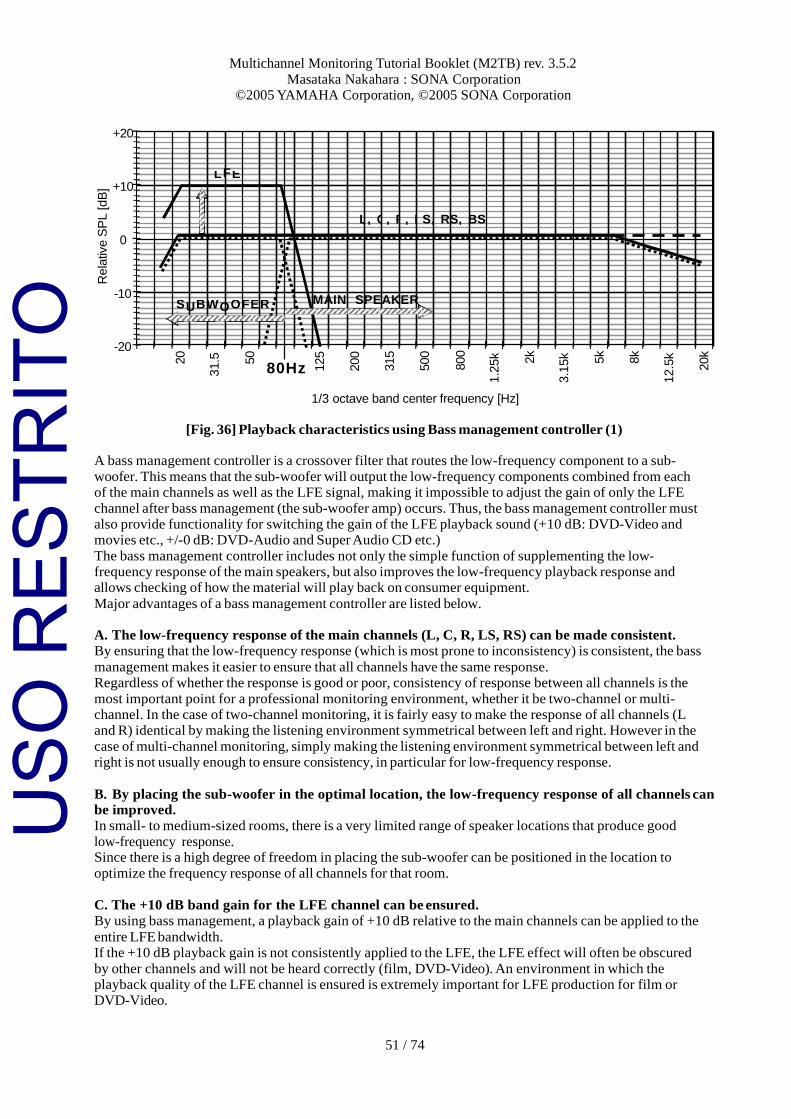
Multichannel Monitoring Tutorial Booklet (M2TB) rev. 3.5.2
Masataka Nakahara : SONA Corporation ©2005 YAMAHA Corporation, ©2005 SONA Corporation
51 / 74
L E
+10dB L , C , R , L S, R S, BS
S B W O FE R
F
U O MAIN SPEAKER
+20
+10
0
-10
-20 80Hz
1/3 octave band center frequency [Hz]
[Fig. 36] Playback characteristics using Bass management controller (1)
A bass management controller is a crossover filter that routes the low-frequency component to a sub-
woofer. This means that the sub-woofer will output the low-frequency components combined from each of the main channels as well as the LFE signal, making it impossible to adjust the gain of only the LFE
channel after bass management (the sub-woofer amp) occurs. Thus, the bass management controller must also provide functionality for switching the gain of the LFE playback sound (+10 dB: DVD-Video and movies etc., +/-0 dB: DVD-Audio and Super Audio CD etc.)
The bass management controller includes not only the simple function of supplementing the low- frequency response of the main speakers, but also improves the low-frequency playback response and allows checking of how the material will play back on consumer equipment.
Major advantages of a bass management controller are listed below.
A. The low-frequency response of the main channels (L, C, R, LS, RS) can be made consistent. By ensuring that the low-frequency response (which is most prone to inconsistency) is consistent, the bass
management makes it easier to ensure that all channels have the same response. Regardless of whether the response is good or poor, consistency of response between all channels is the
most important point for a professional monitoring environment, whether it be two-channel or multi- channel. In the case of two-channel monitoring, it is fairly easy to make the response of all channels (L and R) identical by making the listening environment symmetrical between left and right. However in the
case of multi-channel monitoring, simply making the listening environment symmetrical between left and right is not usually enough to ensure consistency, in particular for low-frequency response.
B. By placing the sub-woofer in the optimal location, the low-frequency response of all channels can be improved. In small- to medium-sized rooms, there is a very limited range of speaker locations that produce good
low-frequency response. Since there is a high degree of freedom in placing the sub-woofer can be positioned in the location to
optimize the frequency response of all channels for that room.
C. The +10 dB band gain for the LFE channel can be ensured. By using bass management, a playback gain of +10 dB relative to the main channels can be applied to the
entire LFE bandwidth. If the +10 dB playback gain is not consistently applied to the LFE, the LFE effect will often be obscured
by other channels and will not be heard correctly (film, DVD-Video). An environment in which the playback quality of the LFE channel is ensured is extremely important for LFE production for film or DVD-Video.
Rela
tive
SP
L [dB
]
20
31.5
50
125
200
315
500
800
1.2
5k
2k
3.1
5k
5k
8k
12.5
k
20k
USO
RES
TRIT
O
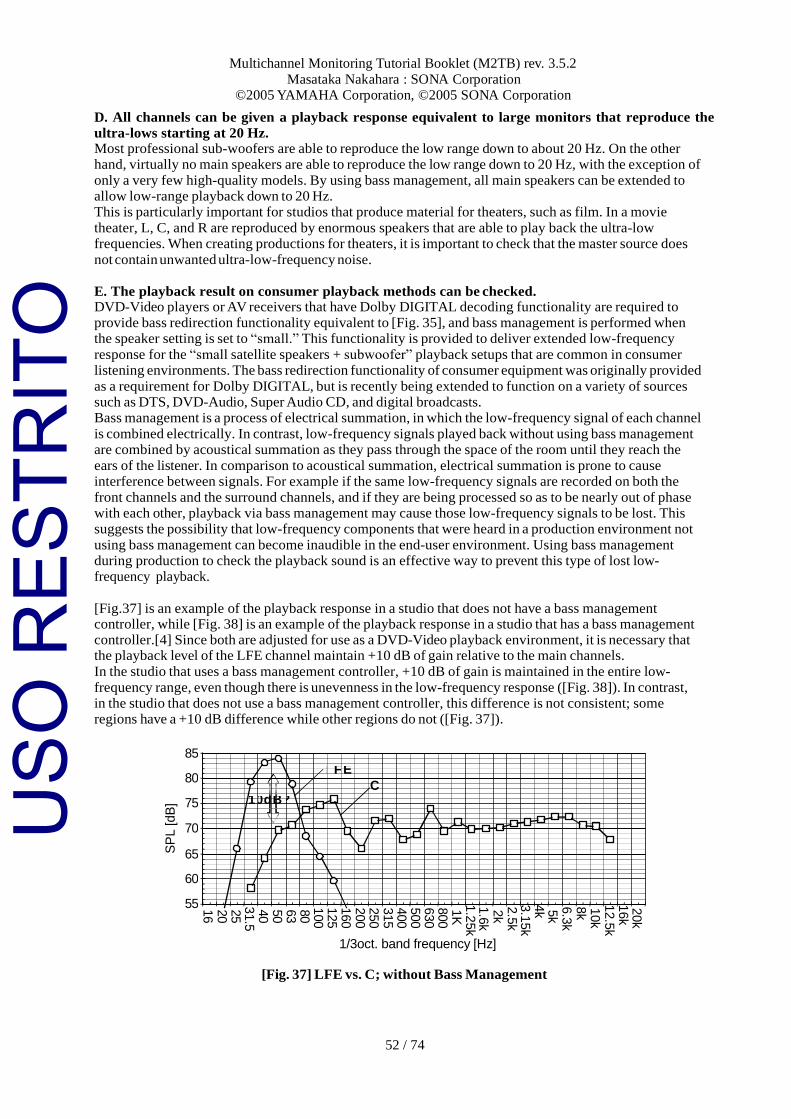
Multichannel Monitoring Tutorial Booklet (M2TB) rev. 3.5.2
Masataka Nakahara : SONA Corporation ©2005 YAMAHA Corporation, ©2005 SONA Corporation
52 / 74
L F E
1 0d B ?
85
80
75
70
65
60
55
C
20k
16k
12.5
k
10k
8k
6.3
k
5k
4k
3.1
5k
2.5
k
2k
1.6
k
1.2
5k
1K
800
630
500
400
315
250
200
160
125
100
80
63
50
40
31.5
25
20
16
D. All channels can be given a playback response equivalent to large monitors that reproduce the
ultra-lows starting at 20 Hz. Most professional sub-woofers are able to reproduce the low range down to about 20 Hz. On the other hand, virtually no main speakers are able to reproduce the low range down to 20 Hz, with the exception of
only a very few high-quality models. By using bass management, all main speakers can be extended to allow low-range playback down to 20 Hz. This is particularly important for studios that produce material for theaters, such as film. In a movie
theater, L, C, and R are reproduced by enormous speakers that are able to play back the ultra-low frequencies. When creating productions for theaters, it is important to check that the master source does
not contain unwanted ultra-low-frequency noise.
E. The playback result on consumer playback methods can be checked. DVD-Video players or AV receivers that have Dolby DIGITAL decoding functionality are required to provide bass redirection functionality equivalent to [Fig. 35], and bass management is performed when the speaker setting is set to “small.” This functionality is provided to deliver extended low-frequency
response for the “small satellite speakers + subwoofer” playback setups that are common in consumer listening environments. The bass redirection functionality of consumer equipment was originally provided
as a requirement for Dolby DIGITAL, but is recently being extended to function on a variety of sources such as DTS, DVD-Audio, Super Audio CD, and digital broadcasts. Bass management is a process of electrical summation, in which the low-frequency signal of each channel
is combined electrically. In contrast, low-frequency signals played back without using bass management are combined by acoustical summation as they pass through the space of the room until they reach the
ears of the listener. In comparison to acoustical summation, electrical summation is prone to cause interference between signals. For example if the same low-frequency signals are recorded on both the
front channels and the surround channels, and if they are being processed so as to be nearly out of phase with each other, playback via bass management may cause those low-frequency signals to be lost. This suggests the possibility that low-frequency components that were heard in a production environment not
using bass management can become inaudible in the end-user environment. Using bass management during production to check the playback sound is an effective way to prevent this type of lost low- frequency playback.
[Fig.37] is an example of the playback response in a studio that does not have a bass management controller, while [Fig. 38] is an example of the playback response in a studio that has a bass management controller.[4] Since both are adjusted for use as a DVD-Video playback environment, it is necessary that the playback level of the LFE channel maintain +10 dB of gain relative to the main channels.
In the studio that uses a bass management controller, +10 dB of gain is maintained in the entire low-
frequency range, even though there is unevenness in the low-frequency response ([Fig. 38]). In contrast, in the studio that does not use a bass management controller, this difference is not consistent; some regions have a +10 dB difference while other regions do not ([Fig. 37]).
1/3oct. band frequency [Hz]
[Fig. 37] LFE vs. C; without Bass Management
SP
L [d
B] USO
RES
TRIT
O
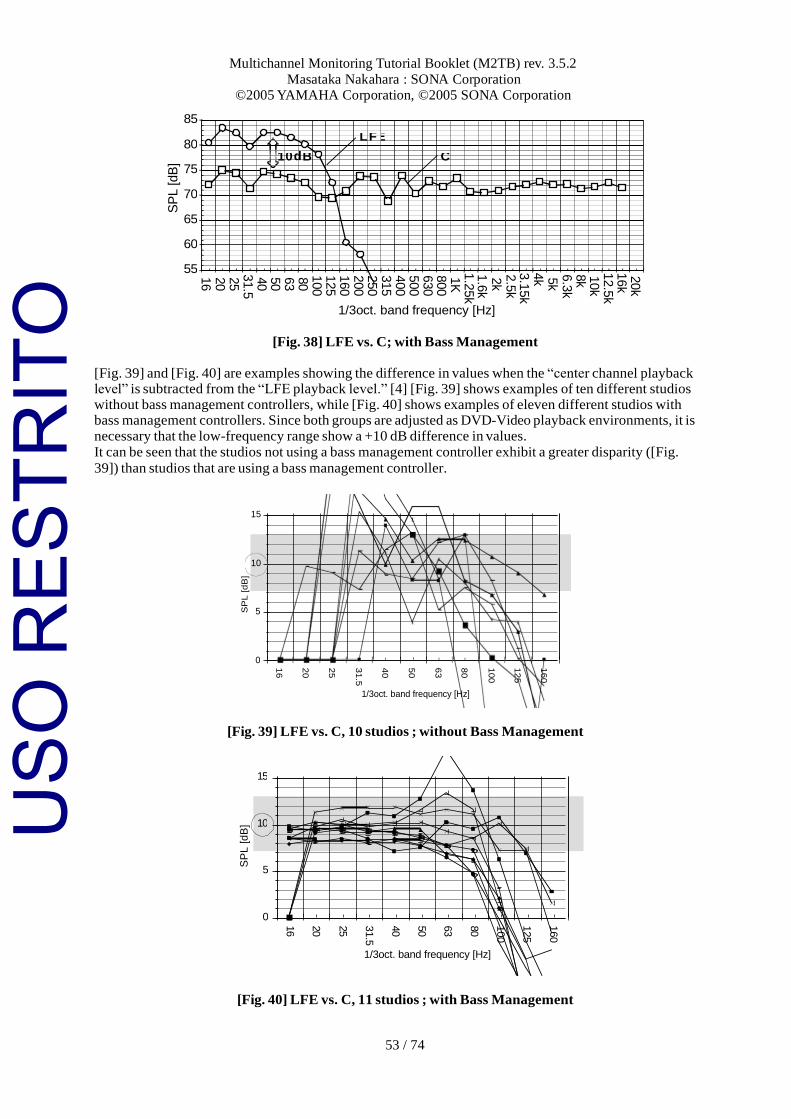
Multichannel Monitoring Tutorial Booklet (M2TB) rev. 3.5.2
Masataka Nakahara : SONA Corporation ©2005 YAMAHA Corporation, ©2005 SONA Corporation
53 / 74
L F E
1 0 B C 80
75
70
65
60
55
d 20k
16k
12.5
k
10k
8k
6.3
k
5k
4k
3.1
5k
2.5
k
2k
1.6
k
1.2
5k
1K
800
630
500
400
315
250
200
160
125
100
80
63
50
40
31.5
25
20
16
85
1/3oct. band frequency [Hz]
[Fig. 38] LFE vs. C; with Bass Management
[Fig. 39] and [Fig. 40] are examples showing the difference in values when the “center channel playback level” is subtracted from the “LFE playback level.” [4] [Fig. 39] shows examples of ten different studios without bass management controllers, while [Fig. 40] shows examples of eleven different studios with bass management controllers. Since both groups are adjusted as DVD-Video playback environments, it is necessary that the low-frequency range show a +10 dB difference in values.
It can be seen that the studios not using a bass management controller exhibit a greater disparity ([Fig.
39]) than studios that are using a bass management controller.
[Fig. 39] LFE vs. C, 10 studios ; without Bass Management
[Fig. 40] LFE vs. C, 11 studios ; with Bass Management
15
10
5
0
1/3oct. band frequency [Hz]
15
10
5
0
1/3oct. band frequency [Hz]
160
160
125
125
100
100
80
80
63
63
50
50
40
40
31.5
3
1.5
25
25
20
20
16
16
SP
L [dB
]
SP
L [d
B]
SP
L [d
B]
USO
RES
TRIT
O
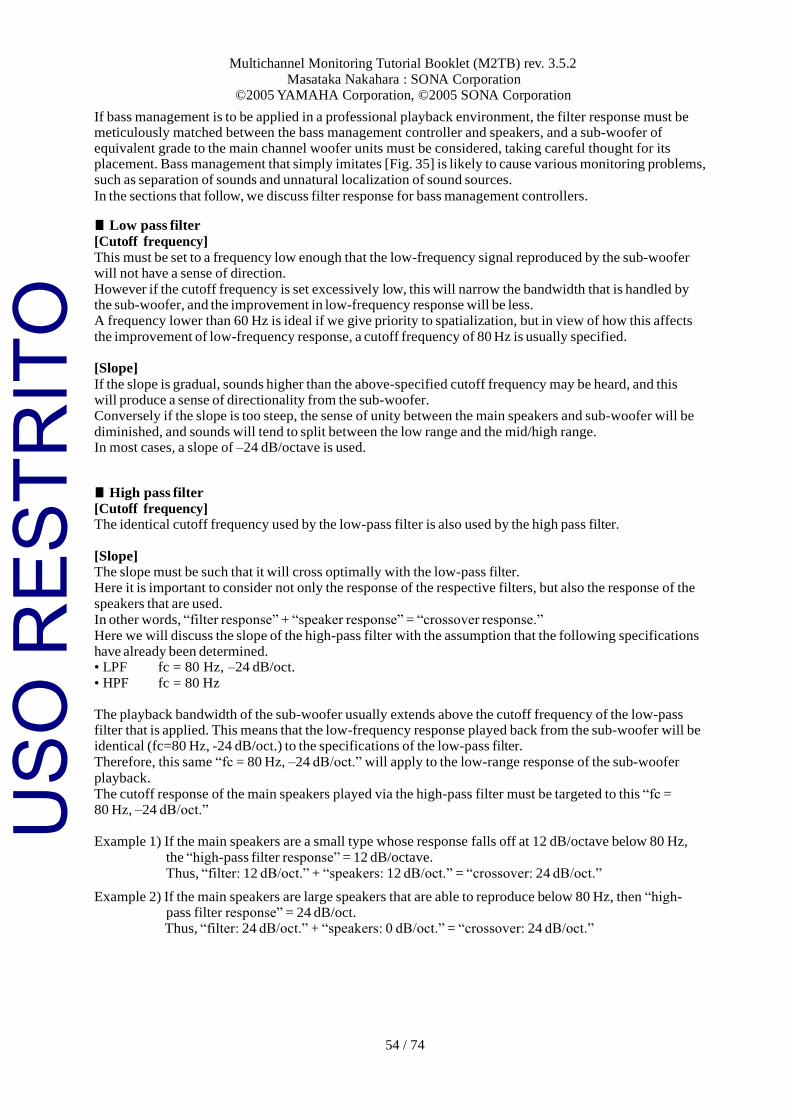
Multichannel Monitoring Tutorial Booklet (M2TB) rev. 3.5.2
Masataka Nakahara : SONA Corporation ©2005 YAMAHA Corporation, ©2005 SONA Corporation
54 / 74
If bass management is to be applied in a professional playback environment, the filter response must be meticulously matched between the bass management controller and speakers, and a sub-woofer of equivalent grade to the main channel woofer units must be considered, taking careful thought for its placement. Bass management that simply imitates [Fig. 35] is likely to cause various monitoring problems, such as separation of sounds and unnatural localization of sound sources.
In the sections that follow, we discuss filter response for bass management controllers.
■ Low pass filter
[Cutoff frequency]
This must be set to a frequency low enough that the low-frequency signal reproduced by the sub-woofer will not have a sense of direction.
However if the cutoff frequency is set excessively low, this will narrow the bandwidth that is handled by the sub-woofer, and the improvement in low-frequency response will be less. A frequency lower than 60 Hz is ideal if we give priority to spatialization, but in view of how this affects
the improvement of low-frequency response, a cutoff frequency of 80 Hz is usually specified.
[Slope]
If the slope is gradual, sounds higher than the above-specified cutoff frequency may be heard, and this will produce a sense of directionality from the sub-woofer. Conversely if the slope is too steep, the sense of unity between the main speakers and sub-woofer will be
diminished, and sounds will tend to split between the low range and the mid/high range. In most cases, a slope of –24 dB/octave is used.
■ High pass filter
[Cutoff frequency] The identical cutoff frequency used by the low-pass filter is also used by the high pass filter.
[Slope] The slope must be such that it will cross optimally with the low-pass filter. Here it is important to consider not only the response of the respective filters, but also the response of the
speakers that are used.
In other words, “filter response” + “speaker response” = “crossover response.”
Here we will discuss the slope of the high-pass filter with the assumption that the following specifications have already been determined. • LPF fc = 80 Hz, –24 dB/oct.
• HPF fc = 80 Hz
The playback bandwidth of the sub-woofer usually extends above the cutoff frequency of the low-pass filter that is applied. This means that the low-frequency response played back from the sub-woofer will be identical (fc=80 Hz, -24 dB/oct.) to the specifications of the low-pass filter.
Therefore, this same “fc = 80 Hz, –24 dB/oct.” will apply to the low-range response of the sub-woofer
playback.
The cutoff response of the main speakers played via the high-pass filter must be targeted to this “fc = 80 Hz, –24 dB/oct.”
Example 1) If the main speakers are a small type whose response falls off at 12 dB/octave below 80 Hz,
the “high-pass filter response” = 12 dB/octave.
Thus, “filter: 12 dB/oct.” + “speakers: 12 dB/oct.” = “crossover: 24 dB/oct.”
Example 2) If the main speakers are large speakers that are able to reproduce below 80 Hz, then “high- pass filter response” = 24 dB/oct. Thus, “filter: 24 dB/oct.” + “speakers: 0 dB/oct.” = “crossover: 24 dB/oct.”
USO
RES
TRIT
O
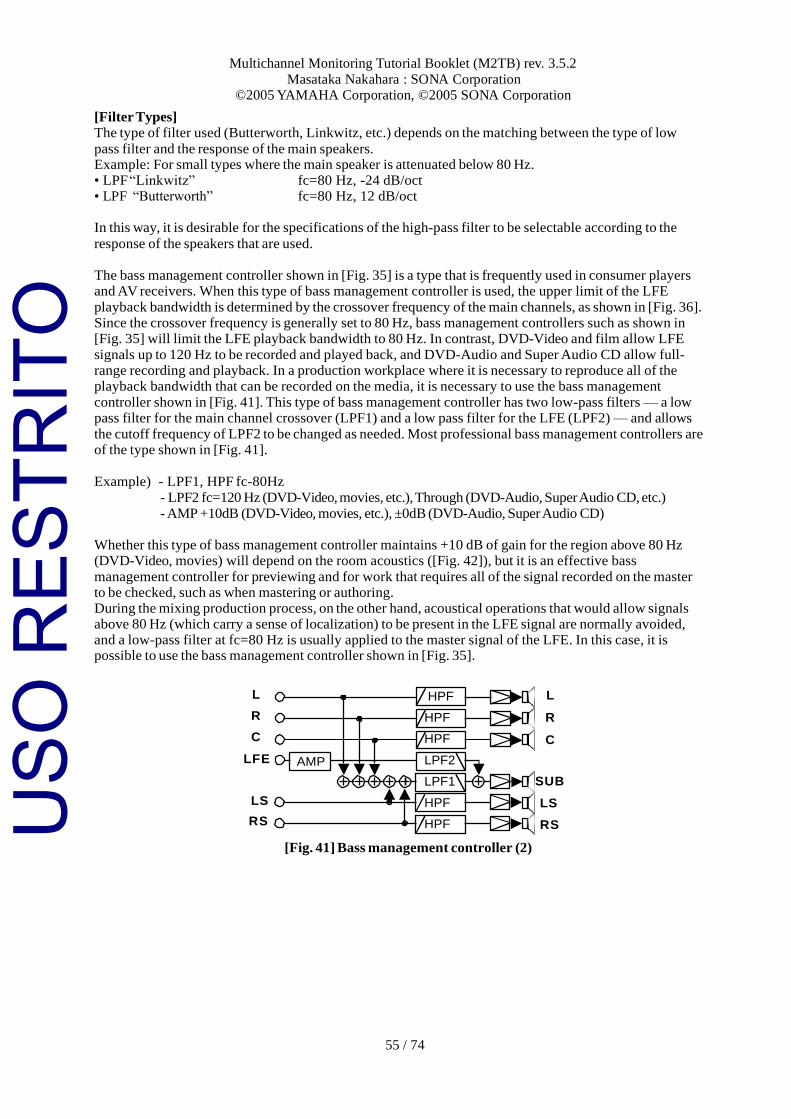
55 / 74
Multichannel Monitoring Tutorial Booklet (M2TB) rev. 3.5.2
Masataka Nakahara : SONA Corporation ©2005 YAMAHA Corporation, ©2005 SONA Corporation
[Filter Types] The type of filter used (Butterworth, Linkwitz, etc.) depends on the matching between the type of low
pass filter and the response of the main speakers. Example: For small types where the main speaker is attenuated below 80 Hz. • LPF “Linkwitz” fc=80 Hz, -24 dB/oct • LPF “Butterworth” fc=80 Hz, 12 dB/oct
In this way, it is desirable for the specifications of the high-pass filter to be selectable according to the
response of the speakers that are used.
The bass management controller shown in [Fig. 35] is a type that is frequently used in consumer players and AV receivers. When this type of bass management controller is used, the upper limit of the LFE
playback bandwidth is determined by the crossover frequency of the main channels, as shown in [Fig. 36]. Since the crossover frequency is generally set to 80 Hz, bass management controllers such as shown in [Fig. 35] will limit the LFE playback bandwidth to 80 Hz. In contrast, DVD-Video and film allow LFE
signals up to 120 Hz to be recorded and played back, and DVD-Audio and Super Audio CD allow full- range recording and playback. In a production workplace where it is necessary to reproduce all of the playback bandwidth that can be recorded on the media, it is necessary to use the bass management
controller shown in [Fig. 41]. This type of bass management controller has two low-pass filters — a low pass filter for the main channel crossover (LPF1) and a low pass filter for the LFE (LPF2) — and allows
the cutoff frequency of LPF2 to be changed as needed. Most professional bass management controllers are of the type shown in [Fig. 41].
Example) - LPF1, HPF fc-80Hz
- LPF2 fc=120 Hz (DVD-Video, movies, etc.), Through (DVD-Audio, Super Audio CD, etc.)
- AMP +10dB (DVD-Video, movies, etc.), ±0dB (DVD-Audio, Super Audio CD)
Whether this type of bass management controller maintains +10 dB of gain for the region above 80 Hz (DVD-Video, movies) will depend on the room acoustics ([Fig. 42]), but it is an effective bass
management controller for previewing and for work that requires all of the signal recorded on the master to be checked, such as when mastering or authoring. During the mixing production process, on the other hand, acoustical operations that would allow signals above 80 Hz (which carry a sense of localization) to be present in the LFE signal are normally avoided, and a low-pass filter at fc=80 Hz is usually applied to the master signal of the LFE. In this case, it is possible to use the bass management controller shown in [Fig. 35].
L
R
C
LFE
LS
RS
AMP
HPF
HPF
HPF
LPF2
LPF1
HPF
HPF
L
R
C
SUB
LS
RS
[Fig. 41] Bass management controller (2)
USO
RES
TRIT
O
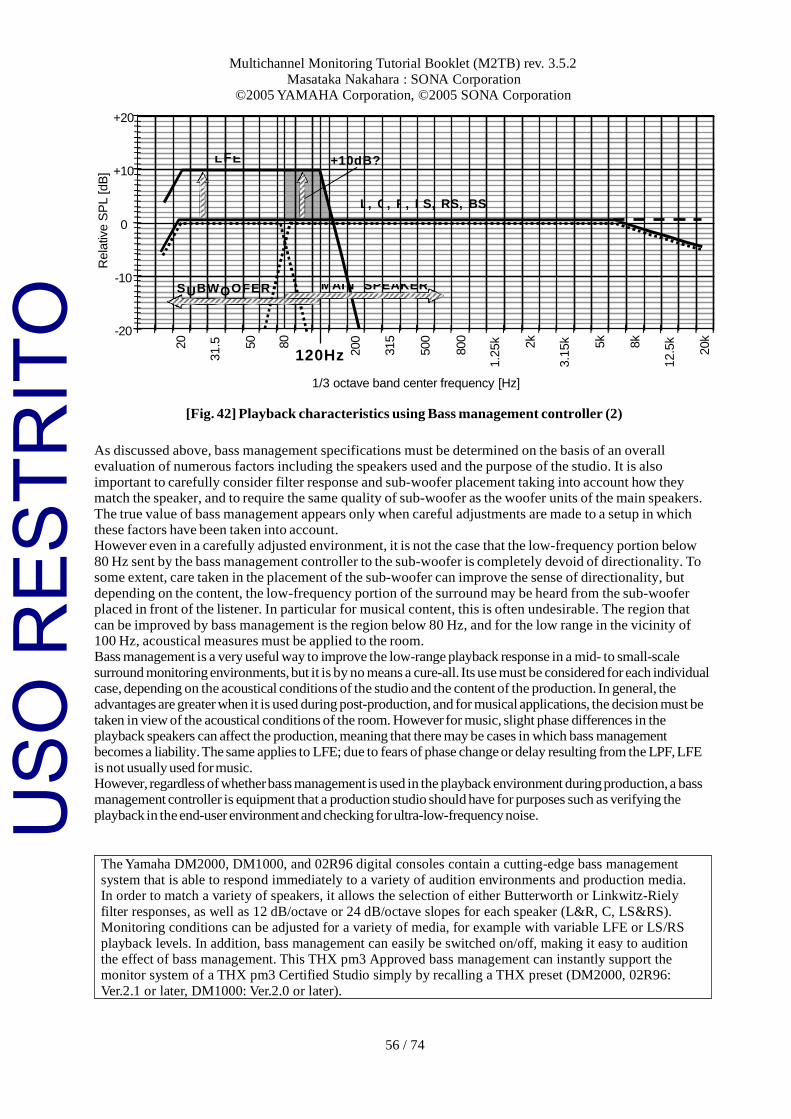
56 / 74
Multichannel Monitoring Tutorial Booklet (M2TB) rev. 3.5.2
Masataka Nakahara : SONA Corporation ©2005 YAMAHA Corporation, ©2005 SONA Corporation
L E +1 0d ?
+10dB L , C , R , L S, R S, BS
S B W O FE R M AI N SP EA KE R
F B
U O
+20
+10
0
-10
-20
120Hz
1/3 octave band center frequency [Hz]
[Fig. 42] Playback characteristics using Bass management controller (2)
As discussed above, bass management specifications must be determined on the basis of an overall evaluation of numerous factors including the speakers used and the purpose of the studio. It is also
important to carefully consider filter response and sub-woofer placement taking into account how they match the speaker, and to require the same quality of sub-woofer as the woofer units of the main speakers.
The true value of bass management appears only when careful adjustments are made to a setup in which these factors have been taken into account. However even in a carefully adjusted environment, it is not the case that the low-frequency portion below
80 Hz sent by the bass management controller to the sub-woofer is completely devoid of directionality. To some extent, care taken in the placement of the sub-woofer can improve the sense of directionality, but
depending on the content, the low-frequency portion of the surround may be heard from the sub-woofer placed in front of the listener. In particular for musical content, this is often undesirable. The region that
can be improved by bass management is the region below 80 Hz, and for the low range in the vicinity of 100 Hz, acoustical measures must be applied to the room. Bass management is a very useful way to improve the low-range playback response in a mid- to small-scale
surround monitoring environments, but it is by no means a cure-all. Its use must be considered for each individual case, depending on the acoustical conditions of the studio and the content of the production. In general, the advantages are greater when it is used during post-production, and for musical applications, the decision must be
taken in view of the acoustical conditions of the room. However for music, slight phase differences in the playback speakers can affect the production, meaning that there may be cases in which bass management becomes a liability. The same applies to LFE; due to fears of phase change or delay resulting from the LPF, LFE
is not usually used for music. However, regardless of whether bass management is used in the playback environment during production, a bass management controller is equipment that a production studio should have for purposes such as verifying the
playback in the end-user environment and checking for ultra-low-frequency noise.
The Yamaha DM2000, DM1000, and 02R96 digital consoles contain a cutting-edge bass management system that is able to respond immediately to a variety of audition environments and production media. In order to match a variety of speakers, it allows the selection of either Butterworth or Linkwitz-Riely
filter responses, as well as 12 dB/octave or 24 dB/octave slopes for each speaker (L&R, C, LS&RS). Monitoring conditions can be adjusted for a variety of media, for example with variable LFE or LS/RS
playback levels. In addition, bass management can easily be switched on/off, making it easy to audition the effect of bass management. This THX pm3 Approved bass management can instantly support the monitor system of a THX pm3 Certified Studio simply by recalling a THX preset (DM2000, 02R96:
Ver.2.1 or later, DM1000: Ver.2.0 or later).
Rela
tive
SP
L [dB
]
20
31.5
50
80
200
315
500
800
1.2
5k
2k
3.1
5k
5k
8k
12.5
k
20k
USO
RES
TRIT
O
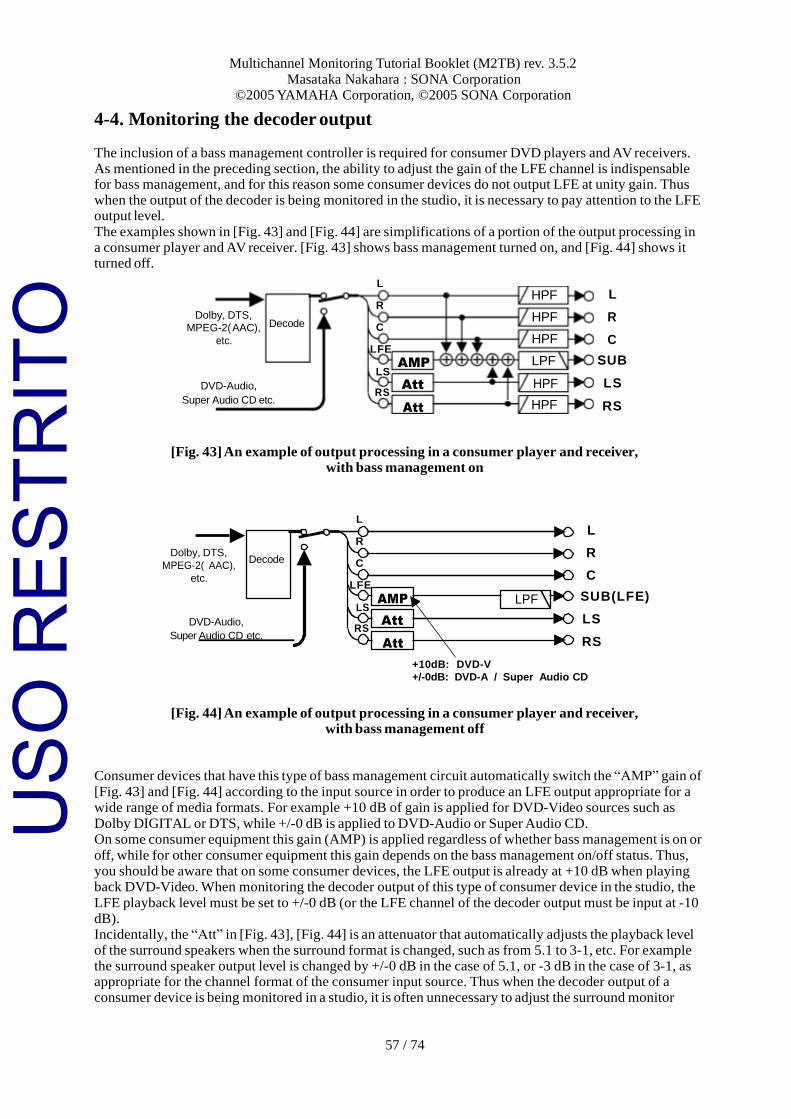
57 / 74
Multichannel Monitoring Tutorial Booklet (M2TB) rev. 3.5.2
Masataka Nakahara : SONA Corporation ©2005 YAMAHA Corporation, ©2005 SONA Corporation
4-4. Monitoring the decoder output
The inclusion of a bass management controller is required for consumer DVD players and AV receivers. As mentioned in the preceding section, the ability to adjust the gain of the LFE channel is indispensable for bass management, and for this reason some consumer devices do not output LFE at unity gain. Thus when the output of the decoder is being monitored in the studio, it is necessary to pay attention to the LFE output level.
The examples shown in [Fig. 43] and [Fig. 44] are simplifications of a portion of the output processing in a consumer player and AV receiver. [Fig. 43] shows bass management turned on, and [Fig. 44] shows it turned off.
Dolby, DTS,
MPEG-2( AAC),
etc.
DVD-Audio,
Decode
L
R
C
LFE
LS
RS
AMP
Att
HPF
HPF
HPF
LPF
HPF
L
R
C
SUB
LS
Super Audio CD etc. Att HPF RS
[Fig. 43] An example of output processing in a consumer player and receiver, with bass management on
Dolby, DTS,
MPEG-2( AAC),
etc.
DVD-Audio,
Decode
L
R
C
LFE
LS
RS
AMP
Att
LPF
L
R
C
SUB(LFE)
LS
Super Audio CD etc. Att RS
+10dB: DVD-V
+/-0dB: DVD-A / Super Audio CD
[Fig. 44] An example of output processing in a consumer player and receiver, with bass management off
Consumer devices that have this type of bass management circuit automatically switch the “AMP” gain of
[Fig. 43] and [Fig. 44] according to the input source in order to produce an LFE output appropriate for a wide range of media formats. For example +10 dB of gain is applied for DVD-Video sources such as
Dolby DIGITAL or DTS, while +/-0 dB is applied to DVD-Audio or Super Audio CD. On some consumer equipment this gain (AMP) is applied regardless of whether bass management is on or
off, while for other consumer equipment this gain depends on the bass management on/off status. Thus, you should be aware that on some consumer devices, the LFE output is already at +10 dB when playing back DVD-Video. When monitoring the decoder output of this type of consumer device in the studio, the
LFE playback level must be set to +/-0 dB (or the LFE channel of the decoder output must be input at -10 dB). Incidentally, the “Att” in [Fig. 43], [Fig. 44] is an attenuator that automatically adjusts the playback level of the surround speakers when the surround format is changed, such as from 5.1 to 3-1, etc. For example the surround speaker output level is changed by +/-0 dB in the case of 5.1, or -3 dB in the case of 3-1, as appropriate for the channel format of the consumer input source. Thus when the decoder output of a consumer device is being monitored in a studio, it is often unnecessary to adjust the surround monitor
USO
RES
TRIT
O
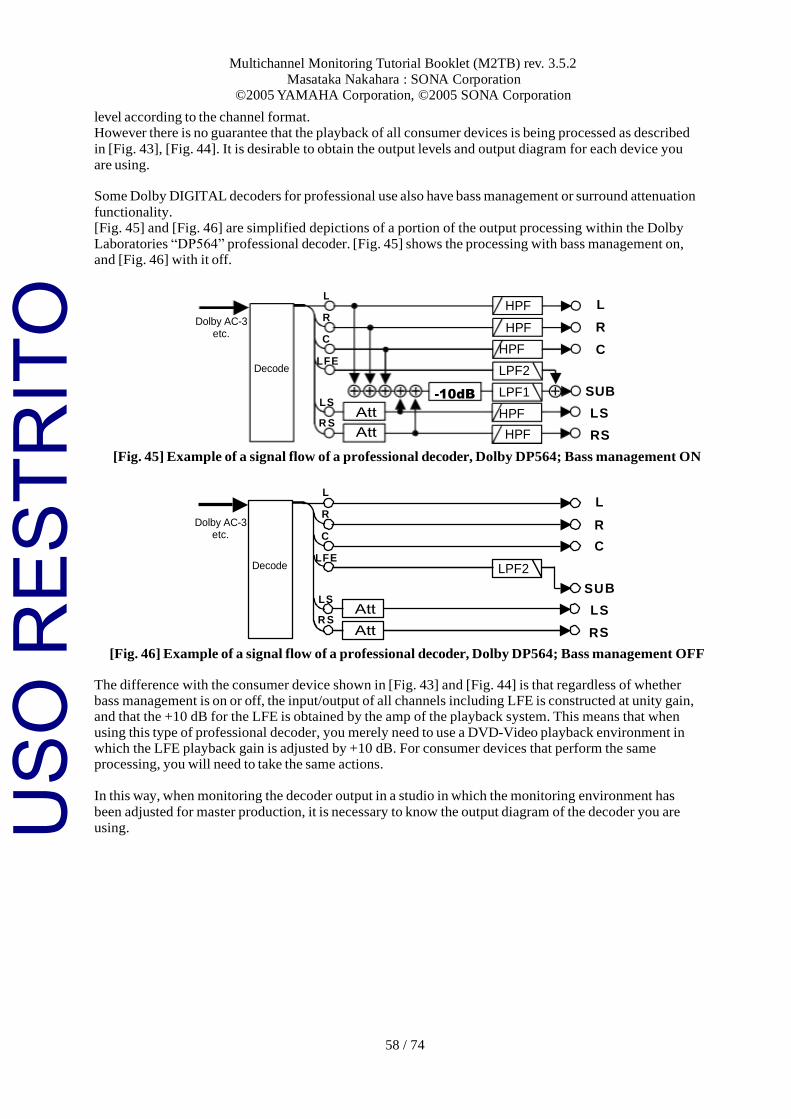
58 / 74
Multichannel Monitoring Tutorial Booklet (M2TB) rev. 3.5.2
Masataka Nakahara : SONA Corporation ©2005 YAMAHA Corporation, ©2005 SONA Corporation
LPF2
Att
Att
R Dolby AC-3
etc. C
L
R
C
Decode LFE
LS
R S
SU
L
R
level according to the channel format. However there is no guarantee that the playback of all consumer devices is being processed as described
in [Fig. 43], [Fig. 44]. It is desirable to obtain the output levels and output diagram for each device you
are using.
Some Dolby DIGITAL decoders for professional use also have bass management or surround attenuation
functionality. [Fig. 45] and [Fig. 46] are simplified depictions of a portion of the output processing within the Dolby
Laboratories “DP564” professional decoder. [Fig. 45] shows the processing with bass management on, and [Fig. 46] with it off.
L
R
C
SUB
LS
RS
[Fig. 45] Example of a signal flow of a professional decoder, Dolby DP564; Bass management ON
L
B
S
S
[Fig. 46] Example of a signal flow of a professional decoder, Dolby DP564; Bass management OFF
The difference with the consumer device shown in [Fig. 43] and [Fig. 44] is that regardless of whether bass management is on or off, the input/output of all channels including LFE is constructed at unity gain, and that the +10 dB for the LFE is obtained by the amp of the playback system. This means that when
using this type of professional decoder, you merely need to use a DVD-Video playback environment in which the LFE playback gain is adjusted by +10 dB. For consumer devices that perform the same processing, you will need to take the same actions.
In this way, when monitoring the decoder output in a studio in which the monitoring environment has
been adjusted for master production, it is necessary to know the output diagram of the decoder you are
using.
L
Dolby AC-3 etc.
R
C
Decode LFE
LS
R S
-10dB
Att
Att
HPF
HPF
HPF
LPF2
LPF1
HPF
HPF
USO
RES
TRIT
O
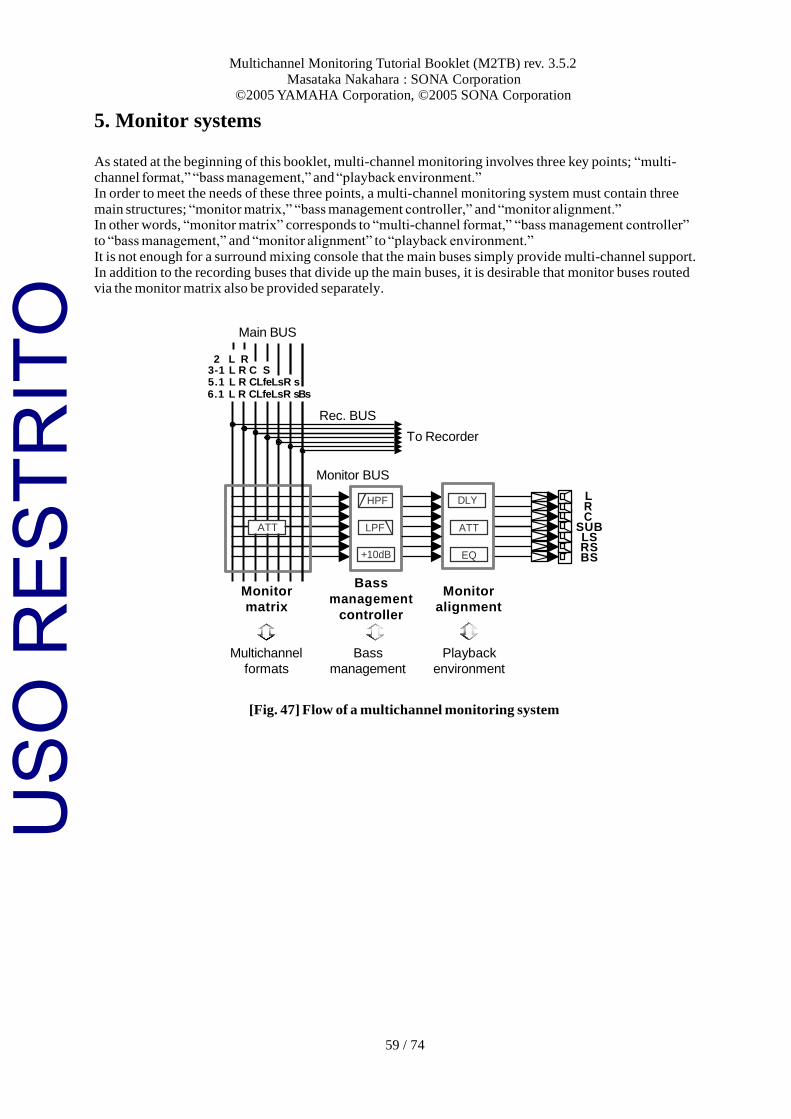
59 / 74
Multichannel Monitoring Tutorial Booklet (M2TB) rev. 3.5.2
Masataka Nakahara : SONA Corporation ©2005 YAMAHA Corporation, ©2005 SONA Corporation
5. Monitor systems
As stated at the beginning of this booklet, multi-channel monitoring involves three key points; “multi- channel format,” “bass management,” and “playback environment.” In order to meet the needs of these three points, a multi-channel monitoring system must contain three
main structures; “monitor matrix,” “bass management controller,” and “monitor alignment.” In other words, “monitor matrix” corresponds to “multi-channel format,” “bass management controller” to “bass management,” and “monitor alignment” to “playback environment.”
It is not enough for a surround mixing console that the main buses simply provide multi-channel support. In addition to the recording buses that divide up the main buses, it is desirable that monitor buses routed via the monitor matrix also be provided separately.
Main BUS
2 L R 3-1 L R C S 5.1 L R CLfeLsR s 6.1 L R CLfeLsR sBs
Rec. BUS
To Recorder
ATT
Monitor
matrix
Monitor BUS
Bass
management
controller
Monitor
alignment
L R C
SUB LS RS BS
Multichannel
formats
Bass
management
Playback
environment
[Fig. 47] Flow of a multichannel monitoring system
EQ
ATT
DLY
+10dB
LPF
HPF
USO
RES
TRIT
O
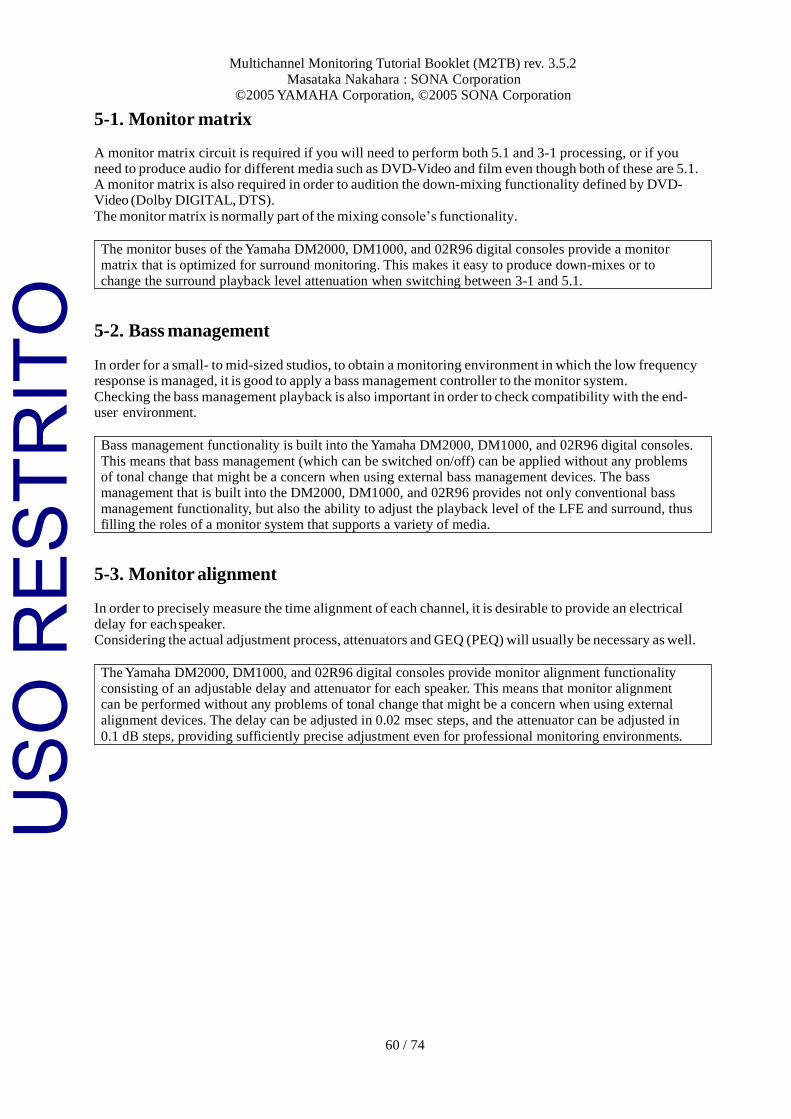
Multichannel Monitoring Tutorial Booklet (M2TB) rev. 3.5.2
Masataka Nakahara : SONA Corporation ©2005 YAMAHA Corporation, ©2005 SONA Corporation
60 / 74
5-1. Monitor matrix
A monitor matrix circuit is required if you will need to perform both 5.1 and 3-1 processing, or if you need to produce audio for different media such as DVD-Video and film even though both of these are 5.1. A monitor matrix is also required in order to audition the down-mixing functionality defined by DVD- Video (Dolby DIGITAL, DTS).
The monitor matrix is normally part of the mixing console’s functionality.
5-2. Bass management
In order for a small- to mid-sized studios, to obtain a monitoring environment in which the low frequency response is managed, it is good to apply a bass management controller to the monitor system.
Checking the bass management playback is also important in order to check compatibility with the end- user environment.
5-3. Monitor alignment
In order to precisely measure the time alignment of each channel, it is desirable to provide an electrical delay for each speaker. Considering the actual adjustment process, attenuators and GEQ (PEQ) will usually be necessary as well.
The Yamaha DM2000, DM1000, and 02R96 digital consoles provide monitor alignment functionality consisting of an adjustable delay and attenuator for each speaker. This means that monitor alignment can be performed without any problems of tonal change that might be a concern when using external
alignment devices. The delay can be adjusted in 0.02 msec steps, and the attenuator can be adjusted in
0.1 dB steps, providing sufficiently precise adjustment even for professional monitoring environments.
Bass management functionality is built into the Yamaha DM2000, DM1000, and 02R96 digital consoles.
This means that bass management (which can be switched on/off) can be applied without any problems of tonal change that might be a concern when using external bass management devices. The bass management that is built into the DM2000, DM1000, and 02R96 provides not only conventional bass
management functionality, but also the ability to adjust the playback level of the LFE and surround, thus filling the roles of a monitor system that supports a variety of media.
The monitor buses of the Yamaha DM2000, DM1000, and 02R96 digital consoles provide a monitor matrix that is optimized for surround monitoring. This makes it easy to produce down-mixes or to
change the surround playback level attenuation when switching between 3-1 and 5.1.
USO
RES
TRIT
O
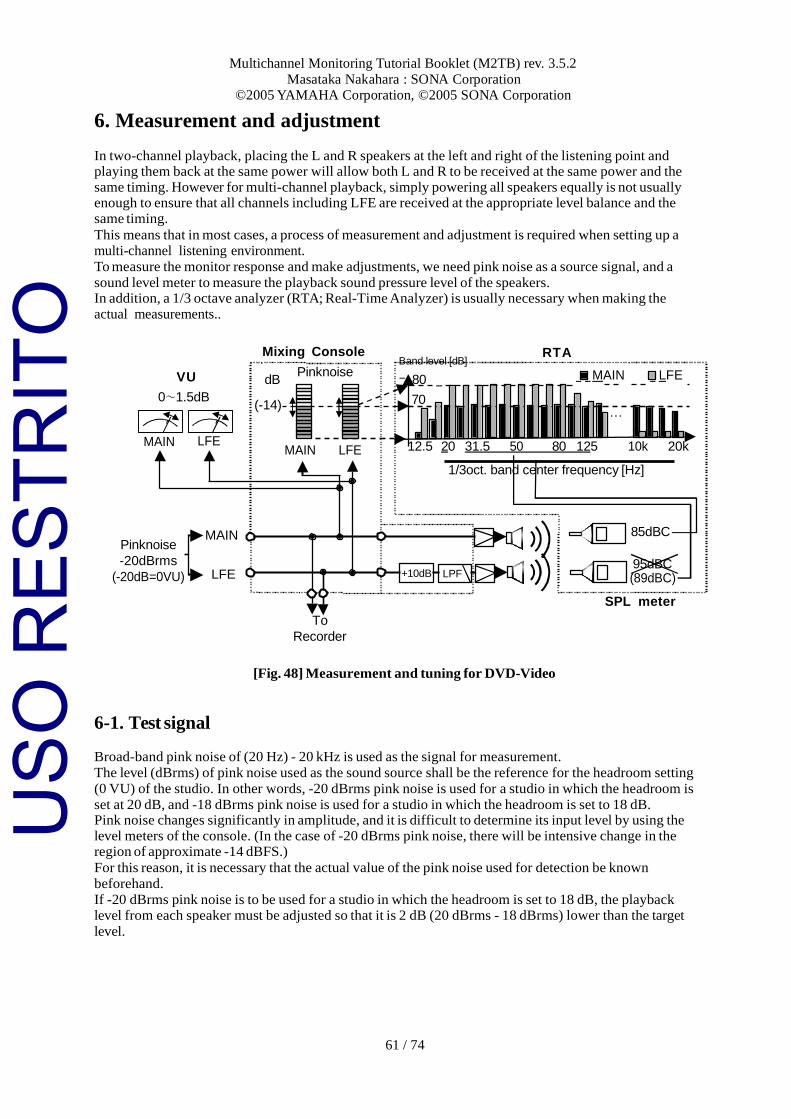
Multichannel Monitoring Tutorial Booklet (M2TB) rev. 3.5.2
Masataka Nakahara : SONA Corporation ©2005 YAMAHA Corporation, ©2005 SONA Corporation
61 / 74
6. Measurement and adjustment
In two-channel playback, placing the L and R speakers at the left and right of the listening point and playing them back at the same power will allow both L and R to be received at the same power and the same timing. However for multi-channel playback, simply powering all speakers equally is not usually enough to ensure that all channels including LFE are received at the appropriate level balance and the same timing.
This means that in most cases, a process of measurement and adjustment is required when setting up a multi-channel listening environment.
To measure the monitor response and make adjustments, we need pink noise as a source signal, and a
sound level meter to measure the playback sound pressure level of the speakers. In addition, a 1/3 octave analyzer (RTA; Real-Time Analyzer) is usually necessary when making the actual measurements..
Mixing Console
Band level [dB] RTA
VU
0~1.5dB
dB
(-14)
Pinknoise 80
70
MAIN LFE
…
MAIN LFE
MAIN
LFE
12.5
20 31.5 50 80 125
10k 20k
1/3oct. band center frequency [Hz]
Pinknoise
-20dBrms
(-20dB=0VU)
MAIN
LFE
To
Recorder
+10dB
LPF
85dBC
95dBC (89dBC)
SPL meter
[Fig. 48] Measurement and tuning for DVD-Video
6-1. Test signal
Broad-band pink noise of (20 Hz) - 20 kHz is used as the signal for measurement.
The level (dBrms) of pink noise used as the sound source shall be the reference for the headroom setting
(0 VU) of the studio. In other words, -20 dBrms pink noise is used for a studio in which the headroom is
set at 20 dB, and -18 dBrms pink noise is used for a studio in which the headroom is set to 18 dB. Pink noise changes significantly in amplitude, and it is difficult to determine its input level by using the level meters of the console. (In the case of -20 dBrms pink noise, there will be intensive change in the region of approximate -14 dBFS.)
For this reason, it is necessary that the actual value of the pink noise used for detection be known
beforehand.
If -20 dBrms pink noise is to be used for a studio in which the headroom is set to 18 dB, the playback level from each speaker must be adjusted so that it is 2 dB (20 dBrms - 18 dBrms) lower than the target
level.
USO
RES
TRIT
O
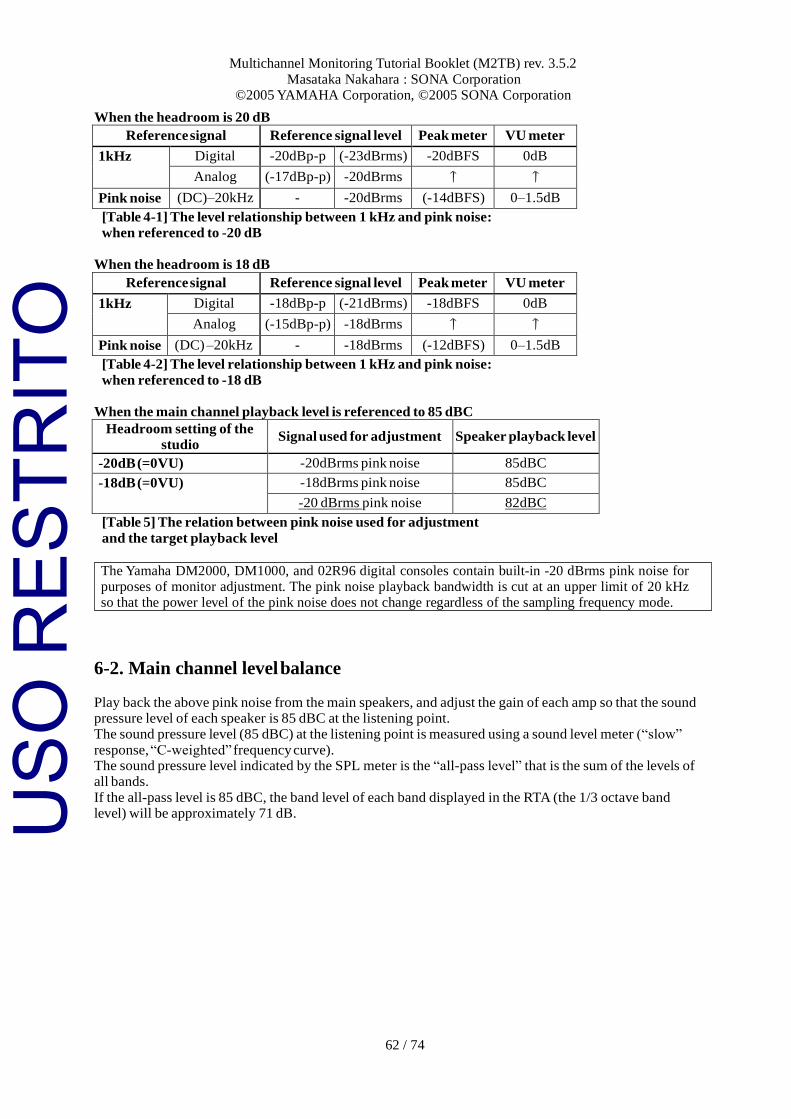
Multichannel Monitoring Tutorial Booklet (M2TB) rev. 3.5.2
Masataka Nakahara : SONA Corporation ©2005 YAMAHA Corporation, ©2005 SONA Corporation
62 / 74
When the headroom is 20 dB
Reference signal Reference signal level Peak meter VU meter
1kHz Digital -20dBp-p (-23dBrms) -20dBFS 0dB
Analog (-17dBp-p) -20dBrms
Pink noise (DC)–20kHz - -20dBrms (-14dBFS) 0–1.5dB
[Table 4-1] The level relationship between 1 kHz and pink noise:
when referenced to -20 dB
When the headroom is 18 dB
Reference signal Reference signal level Peak meter VU meter
1kHz Digital -18dBp-p (-21dBrms) -18dBFS 0dB
Analog (-15dBp-p) -18dBrms
Pink noise (DC) –20kHz - -18dBrms (-12dBFS) 0–1.5dB
[Table 4-2] The level relationship between 1 kHz and pink noise:
when referenced to -18 dB
When the main channel playback level is referenced to 85 dBC
Headroom setting of the
studio Signal used for adjustment Speaker playback level
-20dB (=0VU) -20dBrms pink noise 85dBC
-18dB (=0VU) -18dBrms pink noise 85dBC
-20 dBrms pink noise 82dBC
[Table 5] The relation between pink noise used for adjustment
and the target playback level
6-2. Main channel level balance
Play back the above pink noise from the main speakers, and adjust the gain of each amp so that the sound pressure level of each speaker is 85 dBC at the listening point. The sound pressure level (85 dBC) at the listening point is measured using a sound level meter (“slow”
response, “C-weighted” frequency curve). The sound pressure level indicated by the SPL meter is the “all-pass level” that is the sum of the levels of all bands.
If the all-pass level is 85 dBC, the band level of each band displayed in the RTA (the 1/3 octave band level) will be approximately 71 dB.
The Yamaha DM2000, DM1000, and 02R96 digital consoles contain built-in -20 dBrms pink noise for purposes of monitor adjustment. The pink noise playback bandwidth is cut at an upper limit of 20 kHz so that the power level of the pink noise does not change regardless of the sampling frequency mode.
USO
RES
TRIT
O
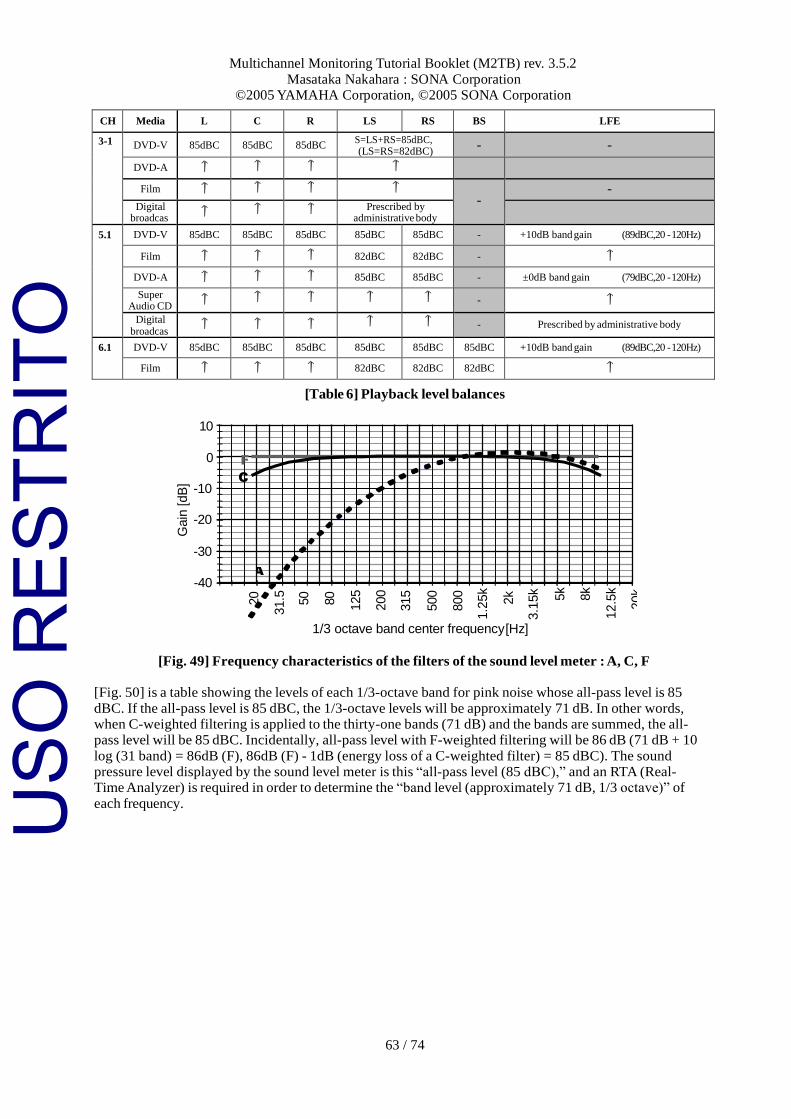
Multichannel Monitoring Tutorial Booklet (M2TB) rev. 3.5.2
Masataka Nakahara : SONA Corporation ©2005 YAMAHA Corporation, ©2005 SONA Corporation
63 / 74
A
F
C
20
31.5
50
80
125
200
315
500
800
1.2
5k
2k
3.1
5k
5k
8k
12.5
k
20k
CH Media L C R LS RS BS LFE
3-1 DVD-V 85dBC 85dBC 85dBC S=LS+RS=85dBC, (LS=RS=82dBC)
- -
DVD-A
Film
-
-
Digital broadcast
Prescribed by administrative body
5.1 DVD-V 85dBC 85dBC 85dBC 85dBC 85dBC - +10dB band gain (89dBC,20 - 120Hz)
Film
82dBC 82dBC -
DVD-A
85dBC 85dBC - ±0dB band gain (79dBC,20 - 120Hz)
Super Audio CD
-
Digital broadcast
- Prescribed by administrative body
6.1 DVD-V 85dBC 85dBC 85dBC 85dBC 85dBC 85dBC +10dB band gain (89dBC,20 - 120Hz)
Film
82dBC 82dBC 82dBC
[Table 6] Playback level balances
10
0
-10
-20
-30
-40
1/3 octave band center frequency [Hz]
[Fig. 49] Frequency characteristics of the filters of the sound level meter : A, C, F
[Fig. 50] is a table showing the levels of each 1/3-octave band for pink noise whose all-pass level is 85
dBC. If the all-pass level is 85 dBC, the 1/3-octave levels will be approximately 71 dB. In other words, when C-weighted filtering is applied to the thirty-one bands (71 dB) and the bands are summed, the all- pass level will be 85 dBC. Incidentally, all-pass level with F-weighted filtering will be 86 dB (71 dB + 10
log (31 band) = 86dB (F), 86dB (F) - 1dB (energy loss of a C-weighted filter) = 85 dBC). The sound pressure level displayed by the sound level meter is this “all-pass level (85 dBC),” and an RTA (Real- Time Analyzer) is required in order to determine the “band level (approximately 71 dB, 1/3 octave)” of
each frequency.
Gain
[dB
]
USO
RES
TRIT
O
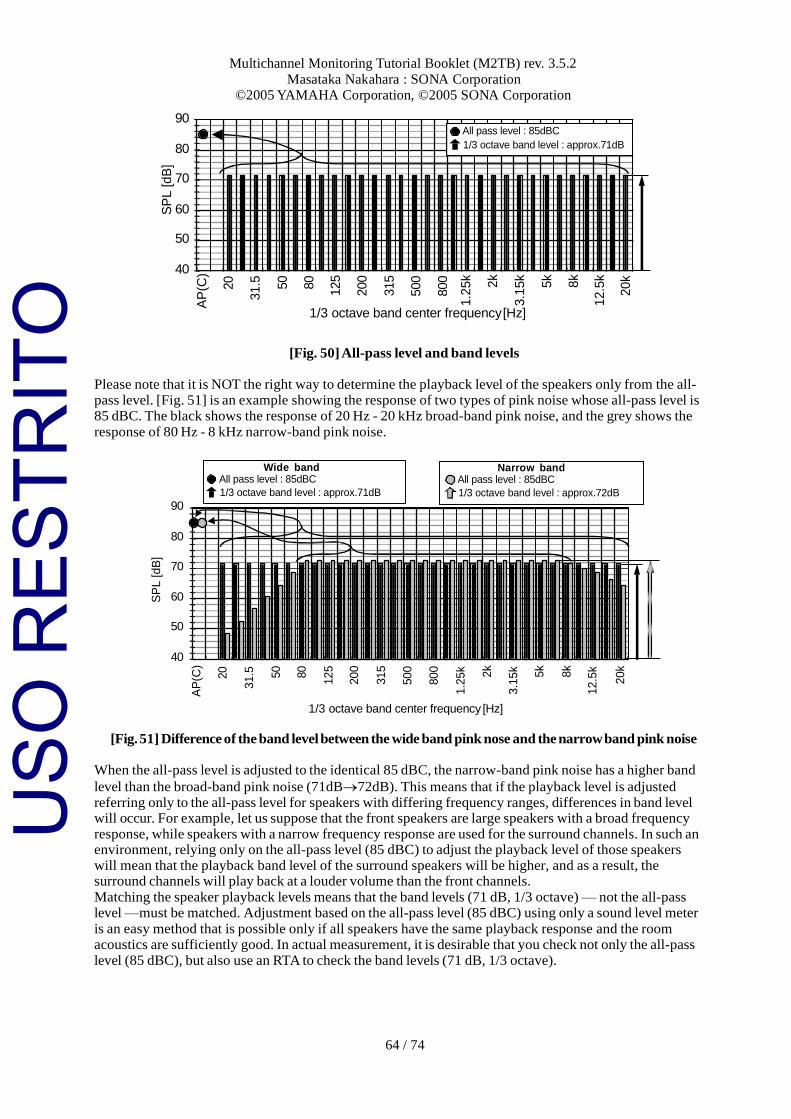
Multichannel Monitoring Tutorial Booklet (M2TB) rev. 3.5.2
Masataka Nakahara : SONA Corporation ©2005 YAMAHA Corporation, ©2005 SONA Corporation
64 / 74
All pass level : 85dBC
1/3 octave band level : approx.71dB
SP
L [d
B]
AP
(C)
20
31.5
50
80
125
200
315
500
800
1.2
5k
2k
3.1
5k
5k
8k
12.5
k
90
80
70
60
50
40
1/3 octave band center frequency [Hz]
[Fig. 50] All-pass level and band levels
Please note that it is NOT the right way to determine the playback level of the speakers only from the all- pass level. [Fig. 51] is an example showing the response of two types of pink noise whose all-pass level is 85 dBC. The black shows the response of 20 Hz - 20 kHz broad-band pink noise, and the grey shows the
response of 80 Hz - 8 kHz narrow-band pink noise.
90
80
70
60
50
40
1/3 octave band center frequency [Hz]
[Fig. 51] Difference of the band level between the wide band pink nose and the narrow band pink noise
When the all-pass level is adjusted to the identical 85 dBC, the narrow-band pink noise has a higher band
level than the broad-band pink noise (71dB72dB). This means that if the playback level is adjusted referring only to the all-pass level for speakers with differing frequency ranges, differences in band level will occur. For example, let us suppose that the front speakers are large speakers with a broad frequency response, while speakers with a narrow frequency response are used for the surround channels. In such an environment, relying only on the all-pass level (85 dBC) to adjust the playback level of those speakers will mean that the playback band level of the surround speakers will be higher, and as a result, the surround channels will play back at a louder volume than the front channels.
Matching the speaker playback levels means that the band levels (71 dB, 1/3 octave) — not the all-pass level —must be matched. Adjustment based on the all-pass level (85 dBC) using only a sound level meter
is an easy method that is possible only if all speakers have the same playback response and the room acoustics are sufficiently good. In actual measurement, it is desirable that you check not only the all-pass level (85 dBC), but also use an RTA to check the band levels (71 dB, 1/3 octave).
Wide band All pass level : 85dBC
1/3 octave band level : approx.71dB
Narrow band All pass level : 85dBC
1/3 octave band level : approx.72dB
SP
L [d
B]
AP
(C)
20
31.5
50
80
125
200
315
500
800
1.2
5k
2k
3.1
5k
5k
8k
12.5
k
20k
20k
USO
RES
TRIT
O
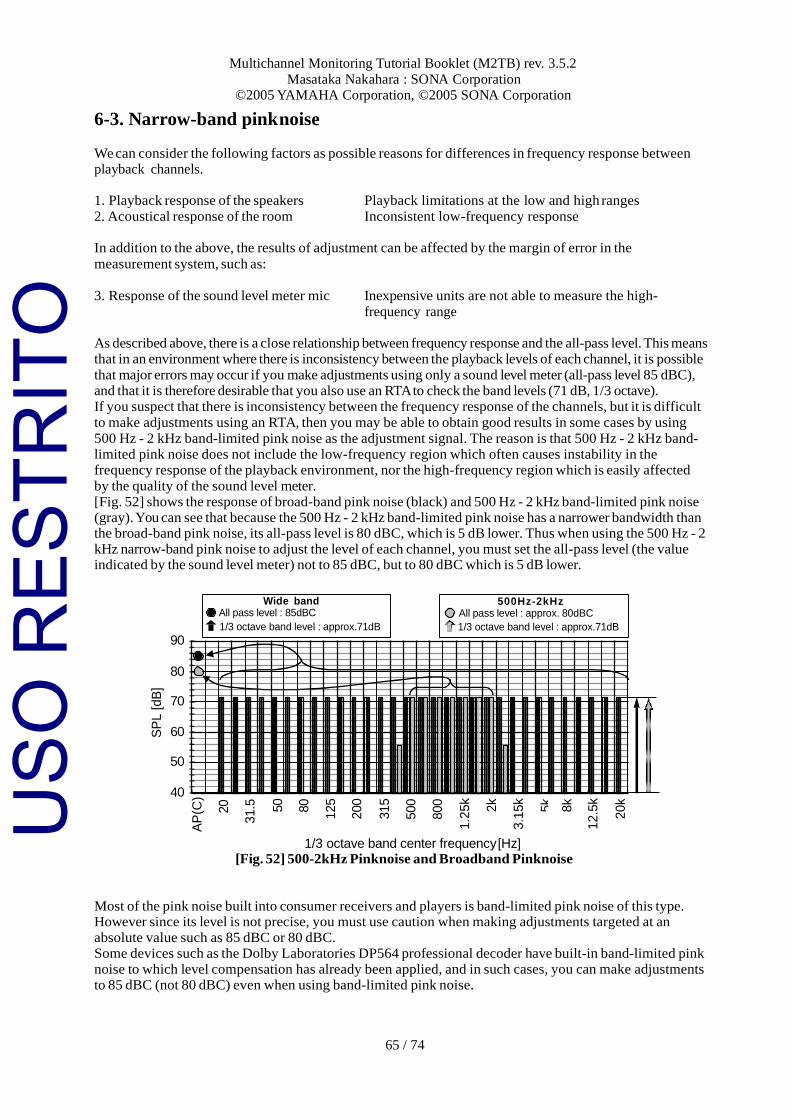
Multichannel Monitoring Tutorial Booklet (M2TB) rev. 3.5.2
Masataka Nakahara : SONA Corporation ©2005 YAMAHA Corporation, ©2005 SONA Corporation
65 / 74
6-3. Narrow-band pink noise
We can consider the following factors as possible reasons for differences in frequency response between playback channels.
1. Playback response of the speakers Playback limitations at the low and high ranges
2. Acoustical response of the room Inconsistent low-frequency response
In addition to the above, the results of adjustment can be affected by the margin of error in the
measurement system, such as:
3. Response of the sound level meter mic Inexpensive units are not able to measure the high-
frequency range
As described above, there is a close relationship between frequency response and the all-pass level. This means that in an environment where there is inconsistency between the playback levels of each channel, it is possible
that major errors may occur if you make adjustments using only a sound level meter (all-pass level 85 dBC), and that it is therefore desirable that you also use an RTA to check the band levels (71 dB, 1/3 octave). If you suspect that there is inconsistency between the frequency response of the channels, but it is difficult
to make adjustments using an RTA, then you may be able to obtain good results in some cases by using
500 Hz - 2 kHz band-limited pink noise as the adjustment signal. The reason is that 500 Hz - 2 kHz band- limited pink noise does not include the low-frequency region which often causes instability in the frequency response of the playback environment, nor the high-frequency region which is easily affected
by the quality of the sound level meter. [Fig. 52] shows the response of broad-band pink noise (black) and 500 Hz - 2 kHz band-limited pink noise (gray). You can see that because the 500 Hz - 2 kHz band-limited pink noise has a narrower bandwidth than the broad-band pink noise, its all-pass level is 80 dBC, which is 5 dB lower. Thus when using the 500 Hz - 2 kHz narrow-band pink noise to adjust the level of each channel, you must set the all-pass level (the value indicated by the sound level meter) not to 85 dBC, but to 80 dBC which is 5 dB lower.
90
80
70
60
50
40
1/3 octave band center frequency [Hz] [Fig. 52] 500-2kHz Pinknoise and Broadband Pinknoise
Most of the pink noise built into consumer receivers and players is band-limited pink noise of this type. However since its level is not precise, you must use caution when making adjustments targeted at an absolute value such as 85 dBC or 80 dBC. Some devices such as the Dolby Laboratories DP564 professional decoder have built-in band-limited pink noise to which level compensation has already been applied, and in such cases, you can make adjustments to 85 dBC (not 80 dBC) even when using band-limited pink noise.
500Hz-2kHz All pass level : approx. 80dBC
1/3 octave band level : approx.71dB
Wide band All pass level : 85dBC
1/3 octave band level : approx.71dB
SP
L [dB
]
AP
(C)
20
31.5
50
80
125
200
315
500
800
1.2
5k
2k
3.1
5k
5k
8k
12.5
k
20k USO
RES
TRIT
O
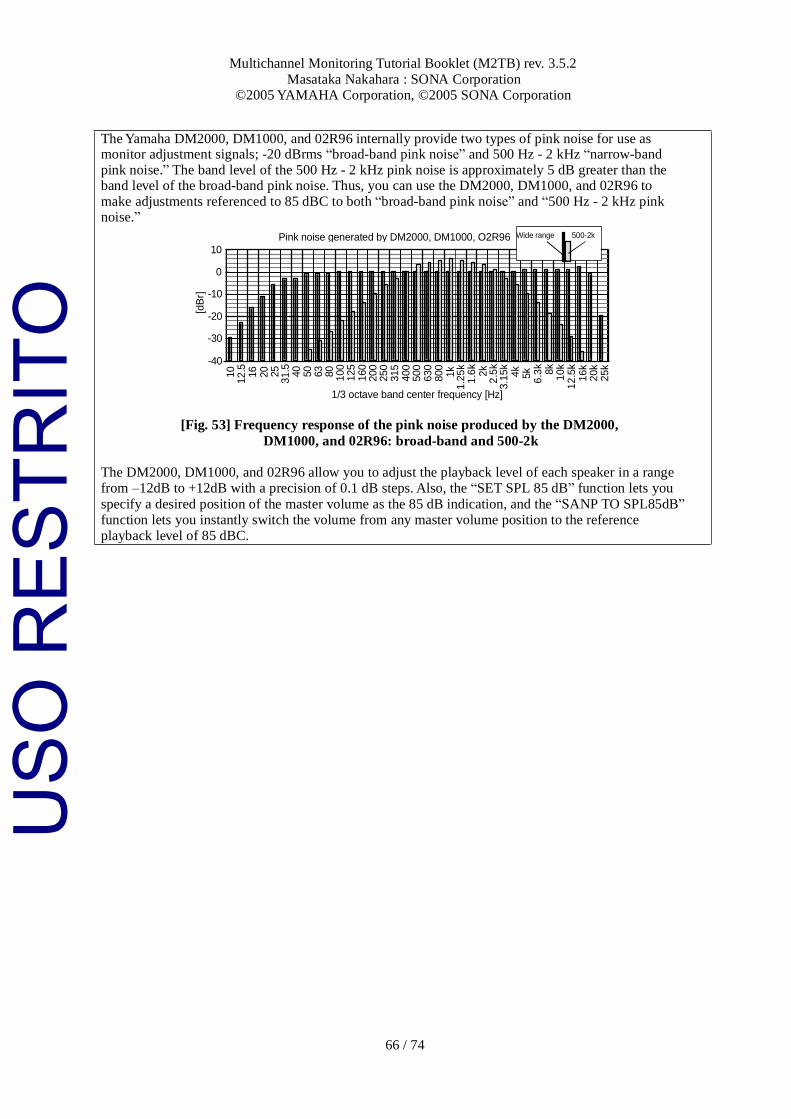
Multichannel Monitoring Tutorial Booklet (M2TB) rev. 3.5.2
Masataka Nakahara : SONA Corporation ©2005 YAMAHA Corporation, ©2005 SONA Corporation
66 / 74
The Yamaha DM2000, DM1000, and 02R96 internally provide two types of pink noise for use as monitor adjustment signals; -20 dBrms “broad-band pink noise” and 500 Hz - 2 kHz “narrow-band pink noise.” The band level of the 500 Hz - 2 kHz pink noise is approximately 5 dB greater than the band level of the broad-band pink noise. Thus, you can use the DM2000, DM1000, and 02R96 to make adjustments referenced to 85 dBC to both “broad-band pink noise” and “500 Hz - 2 kHz pink noise.”
Pink noise generated by DM2000, DM1000, O2R96 Wide range 500-2k
10
0
-10
-20
-30
-40
1/3 octave band center frequency [Hz]
[Fig. 53] Frequency response of the pink noise produced by the DM2000,
DM1000, and 02R96: broad-band and 500-2k
The DM2000, DM1000, and 02R96 allow you to adjust the playback level of each speaker in a range from –12dB to +12dB with a precision of 0.1 dB steps. Also, the “SET SPL 85 dB” function lets you
specify a desired position of the master volume as the 85 dB indication, and the “SANP TO SPL85dB” function lets you instantly switch the volume from any master volume position to the reference playback level of 85 dBC.
[dB
r]
10
12
.5
16
20
25
31
.5
40
50
63
80
100
125
160
200
250
315
400
500
630
800
1k
1.2
5k
1.6
k
2k
2.5
k
3.1
5k
4k
5k
6.3
k
8k
10
k
12
.5k
16
k
20
k
25k
USO
RES
TRIT
O
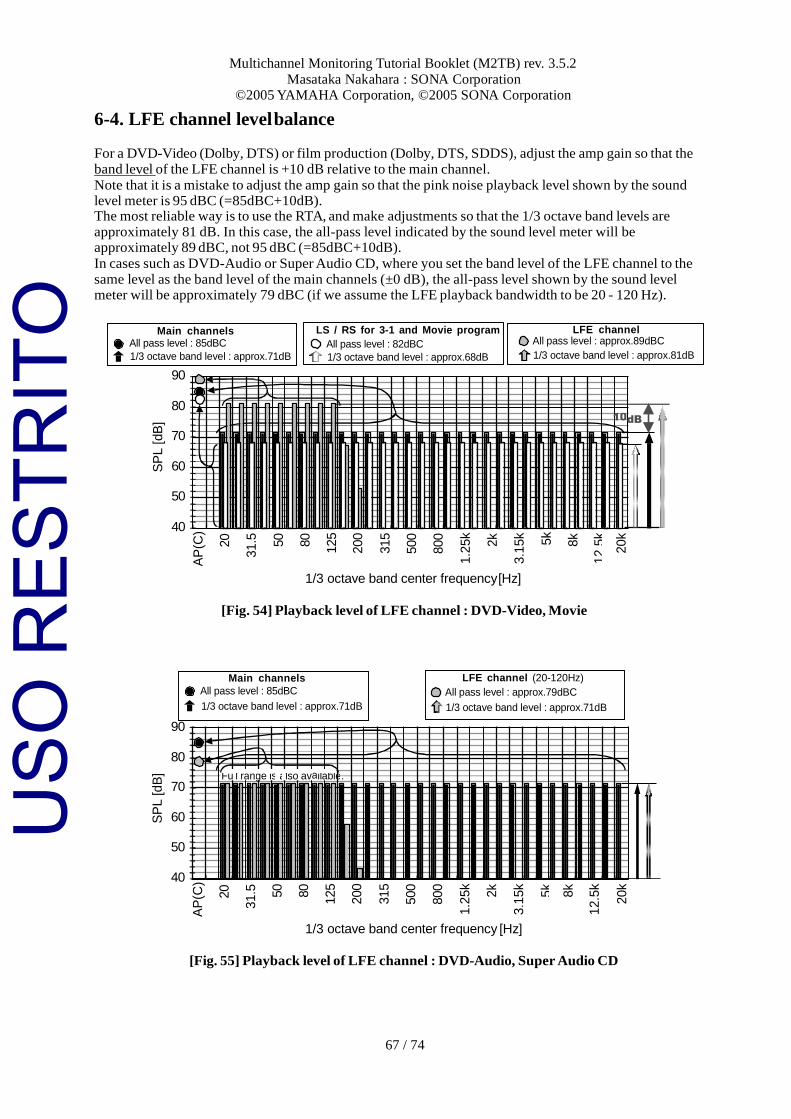
Multichannel Monitoring Tutorial Booklet (M2TB) rev. 3.5.2
Masataka Nakahara : SONA Corporation ©2005 YAMAHA Corporation, ©2005 SONA Corporation
67 / 74
6-4. LFE channel level balance
For a DVD-Video (Dolby, DTS) or film production (Dolby, DTS, SDDS), adjust the amp gain so that the band level of the LFE channel is +10 dB relative to the main channel.
Note that it is a mistake to adjust the amp gain so that the pink noise playback level shown by the sound level meter is 95 dBC (=85dBC+10dB). The most reliable way is to use the RTA, and make adjustments so that the 1/3 octave band levels are approximately 81 dB. In this case, the all-pass level indicated by the sound level meter will be approximately 89 dBC, not 95 dBC (=85dBC+10dB).
In cases such as DVD-Audio or Super Audio CD, where you set the band level of the LFE channel to the same level as the band level of the main channels (±0 dB), the all-pass level shown by the sound level meter will be approximately 79 dBC (if we assume the LFE playback bandwidth to be 20 - 120 Hz).
90
80
70
60
50
40
1/3 octave band center frequency [Hz]
[Fig. 54] Playback level of LFE channel : DVD-Video, Movie
90
80
70
60
50
40
1/3 octave band center frequency [Hz]
[Fig. 55] Playback level of LFE channel : DVD-Audio, Super Audio CD
LFE channel (20-120Hz)
All pass level : approx.79dBC
1/3 octave band level : approx.71dB
Main channels
All pass level : 85dBC
1/3 octave band level : approx.71dB
LS / RS for 3-1 and Movie program
All pass level : 82dBC
1/3 octave band level : approx.68dB
LFE channel All pass level : approx.89dBC
1/3 octave band level : approx.81dB
Main channels All pass level : 85dBC
1/3 octave band level : approx.71dB
Ful l ra n ge is a lso av il able . a
1 0 dB
SP
L [d
B]
SP
L [dB
]
AP
(C)
20
31.5
AP
(C)
20
31.5
50
80
125
200
315
500
800
1.2
5k
2k
3.1
5k
5k
8k
12.5
k
50
80
125
200
315
500
800
1.2
5k
2k
3.1
5k
5k
8k
12.5
k
20k
20k
USO
RES
TRIT
O
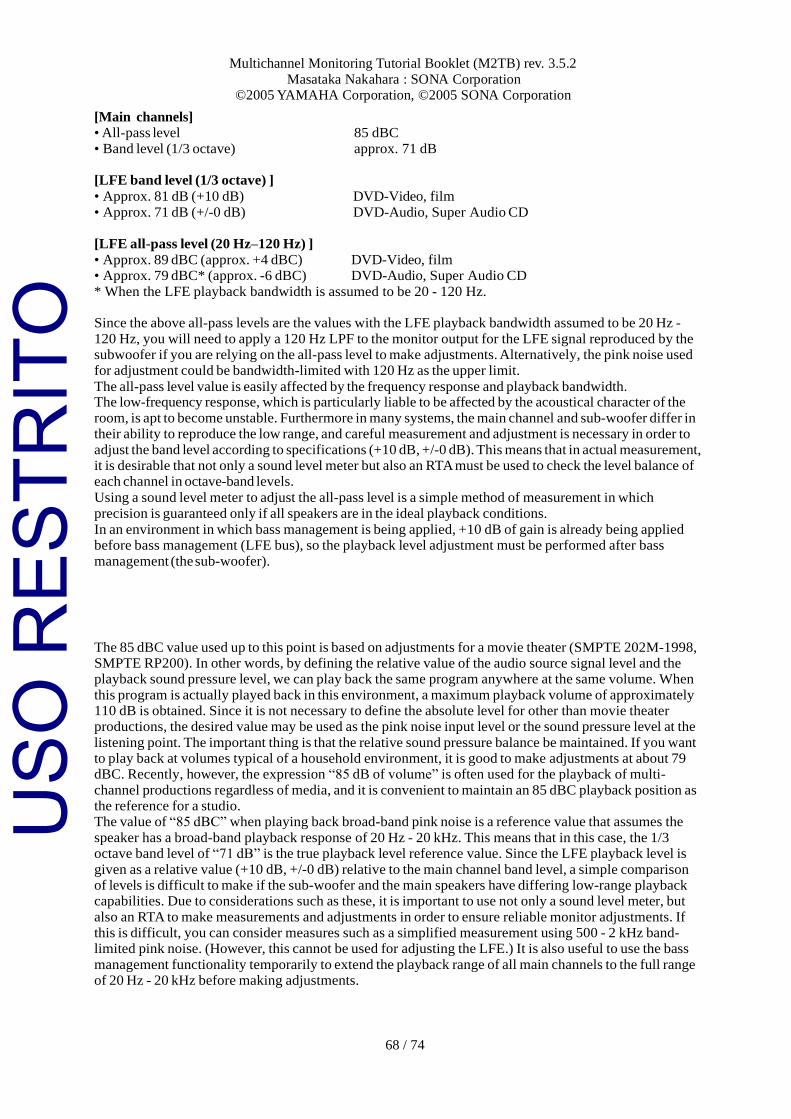
Multichannel Monitoring Tutorial Booklet (M2TB) rev. 3.5.2
Masataka Nakahara : SONA Corporation ©2005 YAMAHA Corporation, ©2005 SONA Corporation
68 / 74
[Main channels] • All-pass level 85 dBC
• Band level (1/3 octave) approx. 71 dB
[LFE band level (1/3 octave) ]
• Approx. 81 dB (+10 dB) DVD-Video, film
• Approx. 71 dB (+/-0 dB) DVD-Audio, Super Audio CD
[LFE all-pass level (20 Hz–120 Hz) ]
• Approx. 89 dBC (approx. +4 dBC) DVD-Video, film • Approx. 79 dBC* (approx. -6 dBC) DVD-Audio, Super Audio CD
* When the LFE playback bandwidth is assumed to be 20 - 120 Hz.
Since the above all-pass levels are the values with the LFE playback bandwidth assumed to be 20 Hz -
120 Hz, you will need to apply a 120 Hz LPF to the monitor output for the LFE signal reproduced by the subwoofer if you are relying on the all-pass level to make adjustments. Alternatively, the pink noise used for adjustment could be bandwidth-limited with 120 Hz as the upper limit.
The all-pass level value is easily affected by the frequency response and playback bandwidth. The low-frequency response, which is particularly liable to be affected by the acoustical character of the
room, is apt to become unstable. Furthermore in many systems, the main channel and sub-woofer differ in their ability to reproduce the low range, and careful measurement and adjustment is necessary in order to
adjust the band level according to specifications (+10 dB, +/-0 dB). This means that in actual measurement, it is desirable that not only a sound level meter but also an RTA must be used to check the level balance of each channel in octave-band levels.
Using a sound level meter to adjust the all-pass level is a simple method of measurement in which
precision is guaranteed only if all speakers are in the ideal playback conditions.
In an environment in which bass management is being applied, +10 dB of gain is already being applied before bass management (LFE bus), so the playback level adjustment must be performed after bass
management (the sub-woofer).
The 85 dBC value used up to this point is based on adjustments for a movie theater (SMPTE 202M-1998, SMPTE RP200). In other words, by defining the relative value of the audio source signal level and the playback sound pressure level, we can play back the same program anywhere at the same volume. When
this program is actually played back in this environment, a maximum playback volume of approximately 110 dB is obtained. Since it is not necessary to define the absolute level for other than movie theater productions, the desired value may be used as the pink noise input level or the sound pressure level at the
listening point. The important thing is that the relative sound pressure balance be maintained. If you want to play back at volumes typical of a household environment, it is good to make adjustments at about 79 dBC. Recently, however, the expression “85 dB of volume” is often used for the playback of multi-
channel productions regardless of media, and it is convenient to maintain an 85 dBC playback position as the reference for a studio. The value of “85 dBC” when playing back broad-band pink noise is a reference value that assumes the
speaker has a broad-band playback response of 20 Hz - 20 kHz. This means that in this case, the 1/3 octave band level of “71 dB” is the true playback level reference value. Since the LFE playback level is
given as a relative value (+10 dB, +/-0 dB) relative to the main channel band level, a simple comparison of levels is difficult to make if the sub-woofer and the main speakers have differing low-range playback capabilities. Due to considerations such as these, it is important to use not only a sound level meter, but
also an RTA to make measurements and adjustments in order to ensure reliable monitor adjustments. If this is difficult, you can consider measures such as a simplified measurement using 500 - 2 kHz band- limited pink noise. (However, this cannot be used for adjusting the LFE.) It is also useful to use the bass
management functionality temporarily to extend the playback range of all main channels to the full range of 20 Hz - 20 kHz before making adjustments.
USO
RES
TRIT
O
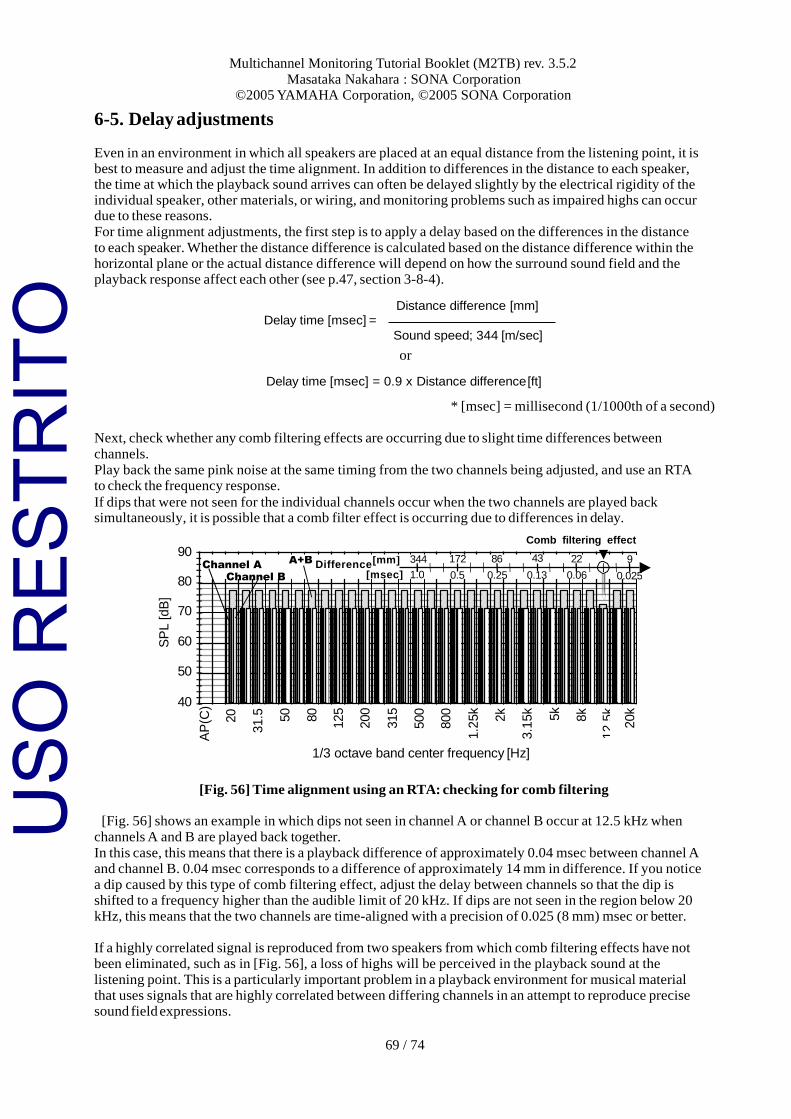
Multichannel Monitoring Tutorial Booklet (M2TB) rev. 3.5.2
Masataka Nakahara : SONA Corporation ©2005 YAMAHA Corporation, ©2005 SONA Corporation
69 / 74
6-5. Delay adjustments
Even in an environment in which all speakers are placed at an equal distance from the listening point, it is best to measure and adjust the time alignment. In addition to differences in the distance to each speaker, the time at which the playback sound arrives can often be delayed slightly by the electrical rigidity of the individual speaker, other materials, or wiring, and monitoring problems such as impaired highs can occur due to these reasons.
For time alignment adjustments, the first step is to apply a delay based on the differences in the distance
to each speaker. Whether the distance difference is calculated based on the distance difference within the horizontal plane or the actual distance difference will depend on how the surround sound field and the playback response affect each other (see p.47, section 3-8-4).
Distance difference [mm] Delay time [msec] =
Sound speed; 344 [m/sec]
or
Delay time [msec] = 0.9 x Distance difference [ft]
* [msec] = millisecond (1/1000th of a second)
Next, check whether any comb filtering effects are occurring due to slight time differences between
channels.
Play back the same pink noise at the same timing from the two channels being adjusted, and use an RTA to check the frequency response.
If dips that were not seen for the individual channels occur when the two channels are played back simultaneously, it is possible that a comb filter effect is occurring due to differences in delay.
Comb filtering effect 90
80
70
60
50
40
1/3 octave band center frequency [Hz]
[Fig. 56] Time alignment using an RTA: checking for comb filtering
[Fig. 56] shows an example in which dips not seen in channel A or channel B occur at 12.5 kHz when
channels A and B are played back together.
In this case, this means that there is a playback difference of approximately 0.04 msec between channel A and channel B. 0.04 msec corresponds to a difference of approximately 14 mm in difference. If you notice
a dip caused by this type of comb filtering effect, adjust the delay between channels so that the dip is shifted to a frequency higher than the audible limit of 20 kHz. If dips are not seen in the region below 20 kHz, this means that the two channels are time-aligned with a precision of 0.025 (8 mm) msec or better.
If a highly correlated signal is reproduced from two speakers from which comb filtering effects have not been eliminated, such as in [Fig. 56], a loss of highs will be perceived in the playback sound at the
listening point. This is a particularly important problem in a playback environment for musical material that uses signals that are highly correlated between differing channels in an attempt to reproduce precise sound field expressions.
Channel A
Channel B
A+B Difference[mm] 344
[msec] 1.0
172 86 43 22
0.5 0.25 0.13 0.06
9
0.025
SP
L [d
B]
AP
(C)
20
31.5
50
80
125
200
315
500
800
1.2
5k
2k
3.1
5k
5k
8k
12.5
k
20k
USO
RES
TRIT
O
Multichannel Monitoring Tutorial Booklet (M2TB) rev. 3.5.2
Masataka Nakahara : SONA Corporation ©2005 YAMAHA Corporation, ©2005 SONA Corporation
70 / 74
Adjusting the delay between channels is important not only for the broad purpose of correcting the speaker placement locations, but also for the purpose of maintaining the playback frequency response in the production environment. For this purpose, it is desirable that you use monitoring equipment that allows the delay to be adjusted with a precision of greater than 0.025 msec (one sample at fs=48k or 44.1k).
In a playback environment for which all channels are precisely time-aligned at a certain point, a focused surround playback sound field will be created with that point as its center. Normally, this point will be the
listening point. Once a focused surround sound field has been created, a location-appropriate surround sound field can be experienced even if you leave the listening point. In this way, creating a clear, time- aligned listening point does not limit the listening area to a single point, but expands the listening area. In
contrast, a surround playback environment whose focus is not defined will have an unsatisfactory sound field at all locations, and the “least-worst” point will be the listening point. This means that the listening area is conversely narrowed.
In an environment in which bass management is being applied, delay adjustments must be applied after
the bass management (speakers, sub-woofer), not before the bass management (channel buses).
The Yamaha DM2000, DM1000 and 02R96 digital consoles allow delay compensation to be adjusted
in detail for each speaker, in steps of 0.02 msec (max. 30 msec).
USO
RES
TRIT
O
Multichannel Monitoring Tutorial Booklet (M2TB) rev. 3.5.2
Masataka Nakahara : SONA Corporation ©2005 YAMAHA Corporation, ©2005 SONA Corporation
71 / 74
7. Summary
At present, multi-channel productions are being released in numerous types of consumer media, including film, DVD-Video, DVD-Audio, Super Audio CD, digital broadcast, and games. The multi-channel
playback specification is defined for each of these types of media, and the construction of a playback environment that complies with these is required of studios in which such productions are being created. This means that in order to construct a multi-channel playback environment, it is first necessary to
understand the formats for the types of media that are being produced.
When compared with two-channel systems, end-user playback environments are highly diverse, involving factors such as down-mixing and bass management. Being mindful of compatibility with the end-user environment is professional technique that is a requirement for any workplace that creates packaged
media, and on this point, there is no difference between two-channel and multi-channel production. In order to be mindful of the end-user listening environment, it is important that the mixing engineer understands the playback (decoding) process of consumer devices and the problems of speaker placement
in the typical home. To this end, it is important not only to have an interest in constructing the ultimate surround playback environment in the studio, but also to have a full consumer-level experience of how the home surround user sets up his surround environment, operates his equipment, and listens. In two-channel
production, most engineers have mixing techniques that take into account playback on a radio cassette player, TV, car stereo, or through headphones, and this is due to their own experience as an end-user.
Due to the above considerations, consideration of the playback environment is important when creating multi-channel productions, and when constructing a monitoring environment for such work, the acoustic design and selection of equipment must involve an overall consideration of the following factors:
1. Understanding of the format for the media being produced
2. Consideration of the studio environment (spaciousness, acoustic absorption)
3. Consideration of the end-user environment (compatibility with a variety of playback
environments).
4. The process of measurement and adjustment.
This document provides the basic items needed for this process, and it is the hope of the author that it will
be of assistance to those involved in constructing a multi-channel monitoring environment.
The Yamaha DM2000, DM1000, and 02R96 digital consoles contain virtually all of the monitoring system required for multi-channel playback, and allow a professional-level playback environment to be easily constructed without the use of special external equipment. Consideration has been taken for
specialized operability for surround playback, and changes in playback format for a variety of media can be performed intuitively. Measurement signals such as pink noise are also built in, making this a surround console that provides all-around support for the establishing of a playback environment.
USO
RES
TRIT
O
72 / 74
Multichannel Monitoring Tutorial Booklet (M2TB) rev. 3.5.2
Masataka Nakahara : SONA Corporation ©2005 YAMAHA Corporation, ©2005 SONA Corporation
Reference materials
[References]
[1] “Multichannel stereophonic sound system with and without accompanying pictures”, Recommendation ITU-R BS. 775-1
(1992-1994)
[2] “Method for the subjective assessment of small impairments in audio systems including multichannel sound systems”,
Recommendation ITU-R BS. 1116-1 (1994-1997)
[3] Koichiro Hiyama, Setsu Komiyama, Kimio Hamasaki, “The minimum number of loudspeakers and its arrangement for
reproducing the special impression of diffuse sound field”, AES 113th Convention, Los Angels, preprint (2002)
[4] Masataka Nakahara, Akira Omoto, “Room acoustic design for small multichannel studios”, AES 24th International
Conference on Multichannel Audio, Banff, preprint (2003)
[5] Masataka Nakahara, Atsuro Ikeda, Shin-ichi Ueoka, Hisaharu Suzuki, Akira Omoto, “On the loudspeaker layouts for
multichannel studios”, AES 11th Regional Convention, Tokyo, preprint (2003)
[6] Hisaharu Suauki, Akira Omoto, Kyoji Fujiwara, “Diffuseness and the sound pressure distribution in an enclosure”,
AES 11th Regional Convention, Tokyo, preprint (2003)
[7] “Multichannel surround systems and operations”, AES Technical council document, ESTD1001.0.01-05
[8] “Surround production handbook” (in Japanese), Mick Sawaguchi, editor, Kenrokukan publishing (2001)
[9] “Surround recording technical principles” (in Japanese), Japan Association of Professional Recording Studios,
Kenrokukan publishing (2001, 2004)
[10] Masataka Nakahara, “Acoustic design for multichannel studios” (in Japanese), Prosound magazine vol.103-108, Stereo
Sound Publishing (2001-2002)
[11] “Dolby Digital Check Disc” DVD-Video (All reagion,, in Japanese),Geneon entertainment Inc., (2003)
[12] AES http://www.aes.org/
[13] ARIB http://www.arib.or.jp/
[14] Dolby lab. http://www.dolby.com/
[15] DTS http://www.dtsonline.com/
[16] DVD-Audio promotion conference http://www.dvdaudio-net.com/ (in Japanese)
[17] DVD Forum http://www.dvdforum.org/
[18] ISO http://www.iso.ch/
[19] ITU http://www.itu.int/
[20] SDDS http://www.sdds.com/
[21] Super Audio CD http://www.superaudio-cd.com/
[22] SMPTE http://www.smpte.org/
[23] THX http://www.thx.com/
[24] Surround Terakoya by Mick Sawaguchi http://hw001.gate01.com/mick-sawa/
USO
RES
TRIT
O
73 / 74
Multichannel Monitoring Tutorial Booklet (M2TB) rev. 3.5.2
Masataka Nakahara : SONA Corporation ©2005 YAMAHA Corporation, ©2005 SONA Corporation
[Acknowledgement] Completion of this booklet was made possible by the cooperation of the following people. I would like to
take this opportunity to express my thanks to them. (Honorific titles are omitted.)
• Hisayuki Nakayama Content Production / Studio Services,
Dolby Laboratories International Services Inc. Japan Branch
• Roy H. Onoyama Technical Support, dts Japan KK
• Mariko Konta Encoding Engineer,
dts Japan KK
• Bike H. Suzuki Integrated AV System Strategy Div.,
(Chairman of DVD Forum WG4) Victor Company of Japan, Ltd.
• Norihiko Fuchigami Technology Development Div.,
(Member of DVD Forum WG4) Victor Company of Japan, Ltd.
• Akira Fukada Music & Entertainment Program Engineering, Production Operations Center, Broadcast Engineering Department,
Japan Broadcasting Corporation
• Shigeru Inoue S-Project, Product Planning Dept., Audio Group,
HENC
Sony Corporation
• Muneyasu Maeda Storage Technologies Development Dept., Optical System Development Division, Home Electronics Development Group,
HENC
Sony Corporation
• Satoshi Yoneya Media and Systems Technology Development Department,
Technologies Development Division, PSNC
Sony Corporation
• Toshiyuki Shirasu Media Storage Systems Department, Storage Systems Division,
PSNC B&P Company,
Sony Corporation
• Steven P. Martz Design Engineering Manager, THX Studio,
THX Ltd.
• Andrew M. Poulain Professional Applications Engineer,
THX Ltd.
• Shigenobu Kanno Commercial Audio Division, CA Tokyo Branch, Yamaha Corporation
• Hirochika Maegaki AV & IT Business Group,
Home Theater Products Development Division, Yamaha Corporation
• Tak T. Shono Marketing Group, Commercial Audio Business Unit,
Yamaha Corporation
USO
RES
TRIT
O
74 / 74
[Author]
Masataka Nakahara
Multichannel Monitoring Tutorial Booklet (M2TB) rev. 3.5.2
Masataka Nakahara : SONA Corporation
©2005 YAMAHA Corporation, ©2005 SONA Corporation
Engineering manager, SONA Corporation (http://www.sona.co.jp).
Director of the AES Japan section.
He graduated from the graduate school of the Kyushu Institute of Design in Fukuoka, in 1995. And then, he joined the SONA Corporation in Tokyo, and is engaged in acoustic design for professional studios. In 2005, he received Dr. Design degree from the Kyushu University.
Since 2001, he has cooperated with YAMAHA in development of the monitoring functions for DM2000, DM1000 and O2R96.
All product names, corporate names, and other trademarks appearing in this
document are the property of their respective owners.
Multichannel Monitoring Tutorial Booklet (M2TB)
2nd Edition May 2005
rev. 3.5.2
Copyright 2005 Yamaha Corporation
Copyright 2005 SONA Corporation
This document can also be downloaded from the following websites.
http://www.yamahaproaudio.com/
http://www.sona.co.jp/
USO
RES
TRIT
O


![Download PLC tutorial [2.0MB] - software for automation ... · PDF filePlc-project Page 2 Tutorial PREFACE This booklet contains a description of how to document a simple plc installation](https://img.pdfslide.us/doc/110x75/5a72ab697f8b9aac538db910/download-plc-tutorial-20mb-software-for-automation-wwwpcschematiccommanualsukuktutorialplcprojectpdfpdf.jpg)