Embed Size (px)
Citation preview

Issue 9 - June 2015 - Multiaxial Haigh Diagrams from Incremental Two Scale Damage Analysis AL09-05 1
Life Prediction Methodologies for Materials and Structures
Multiaxial Haigh Diagrams from Incremental Two Scale
Damage Analysis
R. Desmorat LMT (ENS Cachan / CNRS / U. Paris Saclay)A. du Tertre, P. Gaborit(Snecma) E-mail: [email protected]
DOI : 10.12762/2015.AL09-05
In High Cycle Fatigue, plasticity and damage are localized at a microscale, a scale smaller than the Representative Volume Element (RVE) scale of continuum mecha-
nics. An incremental two-scale damage model has been built on this basis by Lemaitre et al, and has been mainly applied to alternated loading with no plasticity at the RVE scale. A modified Eshelby-Kröner scale transition law is derived here, taking into ac-count RVE mesoscale plasticity and also microscale plasticity and damage. The ability of the corresponding two-scale damage model to deal with multiaxiality in a wide range of load ratios (from -1 to 0.9) is then focused on.
The crack initiation conditions for axisymmetric notched specimens loaded at different mean stresses are studied on the basis of several fatigue tests on TA6V specimens at a low temperature. Both the notch first loading pre-plastification and the biaxial stress state are naturally taken into account by the incremental analysis. Two multiaxial Haigh diagrams are finally drawn for TA6V at a low temperature. Their main features, such as a horizontal asymptote, are highlighted. A piecewise linear extension for a stronger mean stress effect is finally given within the two-scale damage framework considered.
Introduction
High fatigue is often addressed in terms of stress amplitude, i.e., with laws directly relating the stress amplitude to the number of cycles to failure or to crack initiation [2, 49, 1, 39, 28]. The mean stress effect is then simply represented by the introduction into the previous law, as a parameter, of the stress ratio R = min/Max (minimum stress divided by the maximum stress over a cycle). The difficulty is then to extend such a modeling to 3D cases and to non-cyclic loading conditions [60, 7, 13, 34, 14, 55, 56, 53, 52].
On the other hand, Continuum Damage Mechanics, naturally a 3D model, can also be used for fatigue [40, 41, 42, 8, 10, 54, 25, 31, 48, 57, 61, 24, 18, 51, 11, 29, 23, 47]. The cyclic relationships are obtained first from the time integration over one cycle of the damage and the constitutive laws, and second from the integration over the entire loading [43]. The introduction of the stress ratio is then not natural and may become a difficult task [46, 3]. One possibility is to model the microdefect or microcrack closure effect (also called quasi-unilateral condition, [36, 9, 21]) and its coupling with damage growth [32, 22]. With this in mind and with the additional fact that High Cycle Fatigue (HCF) corresponds most often to fatigue in the elastic regime, an incremental two scale damage model has been proposed with good fatigue capabilities [44, 45, 17, 38, 26]. Such a
model is extended in this work, in order to recover the mean stress effect obtained in simple but nevertheless representative structures, namely in axisymmetric notched specimens made of a TA6V titanium alloy. The tests have been performed at a low temperature by Snec-ma, with the support of CNES, within the framework of rocket engine applications.
These specimens have been chosen to represent real loading condi-tions, i.e., multiaxial conditions with stress triaxialities greater than that encountered under tension and with localized yielding. In order to characterize the model response over the entire stress ratio range from R = -1 to R = 0.9, TA6V notched specimens with different stress concentration factors KT = 1.5, 2.5 and 3.5 have been tested at dif-ferent nominal stress – or load – ratios. Axisymmetric notched speci-mens are found to be very useful to test the HCF behavior of a material submitted to bi-axial stresses at a given – and especially at a high – stress ratio R. It is indeed quite difficult to "explore" the upper stress ratio domain with classical uniaxial (smooth) specimens, since most of the time, for high numbers of cycles to rupture (i.e., over 106), the mean stress required to obtain R > 0.6 is so high that the yield stress, or even the ultimate stress, are rapidly reached. On the contrary, axi-symmetric notched specimens encounter small scale yielding and allow local yielding to be obtained in a biaxial state of stress (the lon-gitudinal and hoop stresses in the notch can represent 70% and 30%

Issue 9 - June 2015 - Multiaxial Haigh Diagrams from Incremental Two Scale Damage Analysis AL09-05 2
of the stress tensor trace respectively). Once plastified, they allow the material fatigue response to be tested in a simple manner at high stress ratios R. They can be considered as representative of industrial cases encountered in certain engine components submitted to high static loads and to high frequency alternate loads.
Multiaxial Haigh diagrams are constructed in this work, using a two-scale damage analysis of such tests.
Two-scale damage model
A two-scale damage model has been built [44, 45, 17, 20, 58] considering that High Cycle Fatigue, either thermally or mechani-cally activated, occurs for an elastic regime at the RVE scale, the mesoscale of continuum mechanics. It accounts for micro-plastici-ty and micro-damage at the defect scale (or microscale). The model is phenomenological, describing micro-plasticity with classical 3D Von Mises plasticity equations and describing micro-damage by the Lemaitre damage evolution law = ( / )sD Y S p
[43, 42] of damage governed by the accumulated plastic strain rate p and enhanced by the strain energy density (with Y denoting the thermodynamic force associated with the damage variable D). Parameters S and s are material and temperature dependent. A scale transition law, such as the Eshelby-Kröner localization law, links both the mesoscopic and microscopic scales.
Incremental two-scale analysis
The general principles for building an initial two-scale damage model for complex fatigue applications are as follows (figure 1). Only iso-thermal conditions are considered in this work (for the anisothermal case, refer to [21]).
• At the mesoscale, the scale of the RVE of continuum mecha-nics, the behavior is considered as elastic, the material yield stress y usually not being reached in HCF.
Figure 1 - Micro-element embedded in an elastic Representative Volume Element
• The microscale is the defect scale, with defects conceptually gathered as a weak inclusion embedded in previous RVE. The beha-vior considered for the microscale is (thermo-)elasto-plasticity cou-pled with damage, the weakness of the inclusion being represented by a yield stress at the microscale <y y
µσ σ considered equal to the asymptotic fatigue limit of the material fσ ∞ .
At the mesoscale, the stresses are denoted by and the total, elastic and plastic strains are denoted by , e, p. These are known from an elasto-plastic Finite Element computation. The values at the micros-cale have an upper-script , except for the damage variable D =D at the microscale, which has no upper-script.
Scale transition law
In earlier developments within the two-scale damage framework of Lemaitre et al, plasticity and damage were assumed to occur at the microscale only, thus setting p 0, D =D 0 but also setting a zero value for the plastic strains at the mesoscale (p = 0). In the notched specimen fatigue case considered, the yield stress will be reached at some stress concentration points and plasticity will occur, localized, but nevertheless present at the mesoscale ( i.e., present in Finite Element computations of the notched specimens).
The two-scale damage model must be extended, in order to take into account non-zero plastic strains p, either constant or evolving (p(t)) at each time step of an incremental fatigue analysis. A (quite) simple way to proceed is to extend the Eshelby-Kröner scale transition law of a spherical inclusion embedded in an infinite elastic isotropic matrix to our case. In the initial problem [27, 35], the inclusion has the same elastic properties as the matrix and is subject to free strains F; the matrix is subjected to a far field strain (or stress ).
The strain in the inclusion is then the sum of the far field strain and of an additional strain due to the inclusion free strains and the matrix elasticity (case (a) in figure 2),
= : Fµε ε ε+ S (1)
Which is equivalent to
= : ( ) : Fµσ σ ε+ − S I (2)
where I is a fourth order identity tensor and where S is an isotropic Eshelby tensor such that
1: = =3(1 )
να αν
+−
1 1S (3)
for a second order identity tensor 1 and
2 4 5: ' = ' =15 1
νβ βν
−−
T TS (4)
for any deviatoric tensor T'. By setting F equal to the micro-plastic strain upε , the localization law for an undamaged inclusion used so far [14, 45] is obtained
= = 2 (1 )p pGµ µ µ µε ε βε σ σ β ε+ − −or (5)
where G is the shear modulus.
Figure 2 - a) Initial Eshelby problem of an inclusion with free strain F, b) Considered problem with matrix plasticity and damaged inclusion, c) Problem making both cases a) and b) equivalent, due to an adequate choice of the free strain Fε
.
Structure calculation
Localization lawMESO micro
RVEElastic E, vPlastic y f
µσ σ∞=Damage D(t)Elastic E, v
(Plastic y)
( ) ( ) ( )( ), , peij ij ijt t tσ ε ε
( ) ( ) ( )peij ij ijt t tµµµσ ε ε
initial eshelby problem
(a)
Considered problemwith a damage inclusion
(b)
Equivalenteshelby problem
(c)
Fε pµε Fε
∗
, , , , p

Issue 9 - June 2015 - Multiaxial Haigh Diagrams from Incremental Two Scale Damage Analysis AL09-05 3
The problem considered in this work is slightly different, given that the elastic properties of the inclusion = (1 )D− are affected by the damage D and given that the matrix withstands (mesoscopic) plastic strains p (case (b) of figure 2). It is possible to derive the corres-ponding localization law from previous Eshelby analysis. Due to the elastic mismatch between both scales, the inclusion must be concep-tually changed into an equivalent inclusion with the same total strains and stresses, but with undamaged elasticity (case (c) in figure 2, [30]). In order to do this, an equivalent free strain Fε
is derived, in which the damage effect is embedded, so that for Fε
classical expressions (1)-(2) the following is enforced
= : ( )
= : ( )
= :
= : ( ) :
p
p
F
F
µ µ µ
µ
µ
σ ε ε
σ ε ε
ε ε ε
σ σ ε
−
−
+
+ −
S
S I
(6)
This therefore defines Fε ,
1= ( ) : : ( ) : : :p p
Fµε ε ε ε
− − − − + − S (7)
The equivalent strain Fε replaces F in equation (1) so that, after
some mathematical arrangements and bearing in mind the fact that a plastic strain tensor is a deviatoric tensor, the modified Eshelby-Kröner scale transition law coupled with damage is obtained:
( )1 ( )= (1 )t1 3(1 )p pD DrD D
µ µα βε ε ε β ε εβ α
−+ + − − − −
1 (8)
where and are the previous Eshelby parameters. For an unda-maged inclusion (D = 0) in an elasto-plastic matrix, the previous law is simplified, as expected, to ( )= p pµ µε ε β ε ε+ − .
Plasticity and damage at the microscale
The history of the stresses (t), strains (t) and plastic strains p(t) at the RVE mesoscale is assumed to be known from an elasto-plastic (incremental) finite element calculation. The scale transition is made using equation (8), which must be solved altogether with microscale constitutive equations (still incremental).
A law of elasto-plasticity coupled with damage is considered at the microscale. The elasticity law is then written as (recall that the -upper-script stands for "variable at the microscale"):
1= =t 1e rE E D
µµ µ µ µν ν σε σ σ σ+
−−
1 (9)
In the yield criterion, the hardening X is kinematic, linear, and the yield stress is the asymptotic fatigue limit of the material, denoted by fσ ∞ ,
= ( )eq ff µ µ µσ σ ∞− −X (10)
where (.)eq is the Von Mises norm and where = / (1 )Dµ µσ σ − is the effective stress and < 0f µ → elasticity. This ensures that mi-cro-plasticity, and therefore damage and failure, occurs for stresses ranging between the fatigue limit fσ ∞ and the RVE yield stress y.
The set of constitutive equations at the microscale is thus:
=1= t
3= =2 ( )
2= (1 )3
=
=
e p
e
Dp
eq
py
s
c
rE E
p p
C D
YD pS
D D
µ µ µ
µ µ µ
µ µµ µ µ
µ µ
µ µ
µµ
ε ε εν νε σ σ
σεσ
ε
+
+ −
− − −
→
1
X nX
X
crack initiation
(11)
with the plastic modulus Cy, the damage strength S, the damage exponent s and the critical damage Dc as material parameters. The damage growth is smaller in compression than in tension, due to the consideration of the micro-defect closure parameter h within the strain energy release rate Y,
2 2
2 2
2 2
1 : :=2 (1 ) (1 )
t t2 (1 ) (1 )
Y hE D hD
r rhE D hD
µ µ µ µµ
µ µ
ν σ σ σ σ
σ σν
+ + − −
+ −
+ ⟨ ⟩ ⟨ ⟩ ⟨ ⟩ ⟨ ⟩+
− − ⟨ ⟩ ⟨ ⟩
− + − −
(12)
since 0 < h < 1 and usually for metals h 0.2 [43], and where . +⟨ ⟩ , . −⟨ ⟩ stand for the positive and negative parts of a scalar
and . +⟨ ⟩ , . −⟨ ⟩ for the positive and negative parts of a tensor (in terms of principal values). Note that equation (12) is simplified to
( )22= ( ) / 2 1tensY E Dµ µσ − for tension at the microscale and in
( )22= ( ) / 2 1compY h E hDµ µσ − for compression at the microscale,
so that the damage rate in compression = ( / )scomp compD Y S pµ µ
is much lower, for a small h, than the damage rate in tension
= ( / )stens tensD Y S pµ µ
.
In previous constitutive equations, 1/22= ( : ) d3
p pp tµ µ µε ε∫ is the
accumulated plastic strain at the micro-scale and no damage thres-hold is considered (for loading dependent thresholds, refer to [45, 46]). The plastic multiplier = (1 )p Dµλ −
is determined from the consistency condition = 0f µ and = 0f µ
.
The internal variables pµε , pµ and =D Dµ are often considered to be equal to zero at t = 0. A pre-hardening or pre-damage cor-respond to non-vanishing initial values 0pε , 0p , 0D for the time integration of the differential equations (11): pre-hardening is natu-rally accounted for in a rate form modeling [5]. Note also that the localization law takes into account the plastic strain evolution ( )p tε at the RVE scale. This means that the pre-plastification stage of the structures before undergoing elastic fatigue is taken into account by means of the pε -term of the scale transition law (8). Further study of notched specimens loaded at high mean stresses uses this feature (§ "Fatigue of axisymmetric notched specimens").

Issue 9 - June 2015 - Multiaxial Haigh Diagrams from Incremental Two Scale Damage Analysis AL09-05 4
Numerical implementation
With regard to the numerical implementation, a post-processing approach is proposed. The strain and plastic strain histories at the mesoscale are assumed to be known from a reference Finite Element elastic or elasto-plastic computation. The micro-plas-ticity and damage are obtained by the time integration, step by step, of the incremental constitutive equations. At each time step tn+1
and for a known strain increment at the mesoscale = n+1
- n, the numerical scheme must calculate, by time in-tegration of the constitutive equations at the microscale together with the consideration of the localization law, the strain 1n
µε + , stress 1n
µσ + , plastic strain 1p
nµε + , accumulated plastic strain 1npµ
+ and damage 1nD + at microscale. The Euler backward scheme is used to discretize their rate form, as for classical single scale plasticity and damage models. The 3 stages for the numerical resolutions of the two-scale model equations are classically [44, 46, 20]: 1) an elastic prediction at the microscale, taking into account the localization law, 2) a test over the criterion function f µ , and 3) if f µ is found to be positive, a plastic-damage cor-
rection (still at the microscale).
Elastic Prediction
The elastic prediction assumes an elastic behavior at the microscale with constant plastic strain 1 =p p
nnµ µε ε+ , constant kinematic harde-
ning 1 = nnµ µ+X X and constant damage 1 =n nD D+ . The elastic pre-
diction gives a first estimate for the total strain, the elastic strain and the effective stress at the microscale at time 1nt + ,
{
}
1 1
1
( )1= t1 3(1 )
(1 )
=
= :
= (1 )
nn n
n np p
n n n
e pn
e
n
DrD D
D
D
µ
µ
µ µ µ
µ µ
µ µ
α βε ε εβ α
β ε ε
ε ε ε
σ ε
σ σ
+ +
+
−+
− −
+ − −
−
−
1
(13)
Plastic-damage correction
The previous elastic prediction gives the estimate σ of the effec-tive stress 1nσ + at time 1nt + , with unchanged kinematic harde-ning = nX X , and allows the yield criterion to be calculated. If the condition 1 0nf
µ+ ≤ is fulfilled, the calculation is over and
1 =p pnn
µ µε ε+ , 1 =n n+X X , 1 =n nD D+ is set. If not, this elastic solu-tion is corrected by ensuring the consistency condition 1 = 0nf
µ+ .
The Euler Backward scheme is used for all variables except da-mage: = nD D is considered over a time step 1= n nt t t+∆ − in the strain localization law and in plasticity equations coupled with damage. This is of course not a limitation at all in fatigue, since over an entire cycle – made up of many time steps – the damage increment usually does not exceed 3/ < 10c RD N − where 1cD ≤ is the critical damage and RN is the number of cycles to crack initiation.
Assuming then that the damage does not increase much over a time step, the set of nonlinear equations (11) must be solved, including the localization law,
1 11 1
( ) = 0t1 (1 )(1 )
e e
n n
p n
n n n
D DD
rD D D
µ µβε ε εβ β
α ββ ε εβ β α
−∆ + ∆ − ∆
− −
−+ ∆ − ∆
− − −1
(14)
and the yield condition = 0f µ at time 1nt +
1 1 1= ( ) = 0eq fn n nf µ µ µσ σ ∞+ + +− −X (15)
Equations (14)-(15) are combined with the normality rule for plas-tic strain and with the evolution law for kinematic hardening, dis-
cretized as 1 1 1
1 1 1
3 3= =2 2( ) ( )
D Dp n n n
eq eqn n np p
µ µ µµ µ µ
µ µ µσ
εσ
+ + +
+ + +
−∆ ∆ ∆
−X s
X s
and
( )2= 13
py nC Dµ µε∆ − ∆X . These equations can of course be
solved using the Newton iterative method, but must be rewritten in the following form,
1 1
1
1
= 0( )
( ) = 0
Dn n
seqn
eq fn
pE
µ µµ
µ
µ σ
+ +
+
∞+
+ Γ ∆ +
−
s s Qs
s (16)
a function of the unknown accumulated plastic strain increment pµ∆ and of the unknown variable 1 1 1=n n n
µ µ µσ+ + +−s X allows a closed-form solution to be obtained explicitly. The following is set in Equa-tions (16) (details can be found in [20]):
1=(1 )
( ): 2t1
1 1= 3 (1 )1
n ns
n
pn
n
y nn
E E D
DK GrD
G C DE D
µ µσβ
α βε ε β εα
ββ
−− − ×
−
−∆ + ∆ − ∆ −
−Γ + − −
XQ
1
(17)
where = / 2(1 )G E ν+ and = / 3(1 2 )K E ν− are the shear and bulk moduli.
The exact solution of the set of equations (16) for the plastic-damage correction is:
1
1
1 1 1
=
1=
( ) =1
= ( )
sHH n
fseq
'' s
n
f
'n n H n
s EQ
p QE
EE p
s
µ
µ
µ
µ
µ µ µ
σ
σ
+
∞
+
∞
+ + +
−
∆ − Γ
−Γ
+ ∆
+
Qs
s s 1
(18)
where 3= :2
' 'seq s sQ Q Q is the Von Mises norm of sQ ,
1= t3sH sQ rQ is its hydrostatic part and ='s s sHQ−Q Q 1 is its
deviatoric part.
Issue 9 - June 2015 - Multiaxial Haigh Diagrams from Incremental Two Scale Damage Analysis AL09-05 5
The proposed scheme is implicit but does require iterations.
Variable updating
Once the previous plastic-damage correction has been made, all of the variables at the microscale are updated as follows:
• normal to the yield surface: 13=2
Dn
f
µµ
σ+∞
sm
• plastic strain: 1 =p pnn pµ µ µ µε ε+ + ∆m
• kinematic hardening: 1 12= (1 )3
py n nn nC Dµ µ µε+ +− ∆ +X X
• effective stress: 1 1 1=n n nµ µ µσ + + ++s X
• damage:
11
2
1 1 1 1 1
22 2
1 1
=
11= [ : : ]2 1
1[ ]t t2 1
sn
n n
nn n n n n
n
nn n
n
YD D pS
DY hE hD
Dhr rE hD
µµ
µ µ µ µ µ
µ µ
ν σ σ σ σ
ν σ σ
++
+ + − −+ + + + +
+ −+ +
+ ∆
−+⟨ ⟩ ⟨ ⟩ + ⟨ ⟩ ⟨ ⟩ −
−− ⟨ ⟩ + ⟨ ⟩ −
with
• stress tensor : 11 1= (1 )nn nDµ µσ σ++ +− and the calculation can then be started at time 2nt +
DAMAGE EAS post-processor for multiaxial fatigue
The DAMAGE_EAS post-processor solves the two-scale damage model constitutive equations and allows the micro-plasticity and damage history to be determined for complex loading. For a given material parameter file and for a given loading sequence (made up of the repetition by blocks of complex cycles defined at the RVE mesoscale), the post-processor calculates the damage history D(t) and the time to crack initiation, i.e., the time for D to reach the critical damage Dc. The inputs (mesostrains, total and plastic) come from a Finite Element reference computation and are thus at one or several user chosen structure Gauss points. Given that the maximum number of increments used to describe a cycle is large (actually 5000), the program allows quasi random fatigue calculations. The post-processor DAMAGE_EAS has a graphical interface with material parameter identification and result plotting capabilities [19].
The inputs are thus a material file and a loading file. The outputs of any calculation are: • the number of cycles to crack initiation for the case considered; •a standard result file made up of 50 lines with the values (the histories) versus the number of cycles of the accumulated plastic strain and of the damage at the microscale; •optional (large) files for complete results at the mesoscale and microscale (stresses, strains and plastic strain components versus time).
Fast identification procedure
The purpose of this work is to study the ability of the model to handle notched structure fatigue, when the material parameters are first identified on tensile uniaxial (or "smooth") testing specimens. For the parameter identification, the following is proposed.
Stage 1. The mesoscale parameters (Young modulus E, Poisson ratio v, yield stress y, plastic modulus Cy) are identified at each tem-perature on the monotonic tensile curve.
Stage 2. The asymptotic fatigue limit fσ ∞ is guessed from an experimental Wöhler curve as the horizontal "asymptote" at a very high number of cycles to rupture (at least 7> 10RN ),
( ) =2 2 f RNσ σ σ
∞∞∆ ∆
→ ⇒ →∞
For a non-symmetric fatigue loading (and in this model because of the Von Mises yield criterion at the microscale), the asymptote in terms of
the stress amplitude ( ) =2 fσ σ
∞∞∆ is independent from the load ratio
= /min MaxR σ σ . In terms of maximum stress, the corres-ponding asymptote is = 2 / (1 )Max f Rσ σ∞ ∞ − – it is still due to
( ) = (1 ) =2 2
MaxfRσσ σ
∞∞∆
− – and is dependent on R.
If the Maxσ vs. RN diagram is used, the guessed horizontal asymptote Maxσ ∞ at a given load ratio R thus allows the – material parameter – fatigue limit fσ ∞ to be identified as:
1= (1 )2f MaxRσ σ∞ ∞− (19)
Stage 3. The parameters h and Dc are considered to be equal to the default constant values for metals, = 0.2h , = 0.3cD [43].
Stage 4. The damage parameters S and s are pre-identified from a non-linear curve fitting in Wšhler diagram (figure 3) using an approxi-mate closed-form expression for NR (under the assumption h = 1 of a no micro-defect closure effect). This allows a first estimate of the damage parameters S and s to be easily determined. For a cyclically varying stress of = Max minσ σ σ∆ − between minσ and Maxσ , the following closed form expression for the number of cycles to rupture is used [15, 16], here with no damage threshold,
2
2
2
(2 )2
= 3 (1 ) (1 ) 3 (1 ),
2 1= (1 ) (1 2 )3 3
2 1= (1 ) (1 2 )3 3
sc
R s s sf min Maxf
y
minmin
f
MaxMax
f
ES DNR R
G C D G
R
R
ν ν
ν
ν
σ σ σ
β β
σν νσ
σν νσ
∞ ∞
∞
∞
≈ ∆ − +
− + − ≈ −
+ + −
+ + −
(20)
where G is the shear modulus.

Issue 9 - June 2015 - Multiaxial Haigh Diagrams from Incremental Two Scale Damage Analysis AL09-05 6
Stage 5. At this final identification stage, the values for all parameters are kept identical, except for the damage strength S; h = 0.2 is set and the parameter S is re-adjusted by comparison with the reference Wöhler curve. The full set of constitutive equations is solved – nume-rically this time – instead of using the approximate formula (20).
An illustration of Stages 4 and 5 of the identification procedure is given for a TA6V alloy at a low temperature in figure 3, in which the experimental fatigue curve and the analytic (from equation 20) and computed (DAMAGE_EAS) model responses are sketched and com-pared.
The final set of material parameters is only composed of the elasticity parameters E, v 0.3, the plastic modulus Cy, the asymptotic fatigue limit fσ ∞ , the damage strength S (in MPa), the damage exponent s, the micro-defect closure effect parameter h = 0.2 and the critical damage Dc = 0.3. Let us point out that the identification of parame-ters S, s and fσ ∞ is carried out by using a first population of uniaxial (smooth) specimens at R = 0.1 (test results reported as marks in figure 3). Next, the model is evaluated on a second independent popu-lation of notched specimens made of the same material, tested at the same temperature, but at higher stress ratios.
Figure 3 - Illustration of Stages 4 and 5 of the identification procedure on the Wöhler curve for TA6V at a low temperature (marks: experimental, analytical: Eq. (20), DAMAGE: numerical solution by DAMAGE_EAS of set of equations (8) and (11)).
Fatigue of axisymmetric notched specimens
Axisymmetric Finite Element computations of 3 notched specimens have been performed with a refined mesh in the notch (figure 4). The three elastic stress concentration factors are Kr = 1.5, 2.5 and 3.5. The specimen height is 60 mm.
Elasto-plastic constitutive equations with linear kinematic hardening are used to model TA6V behavior. The considered stress ratios are positive, the notch plastification only occurs at the first load applica-tion. The microscale behavior is represented by the elasto-plasticity coupled with damage constitutive equations (11). The scale transition law is Eq. (8).
Figure 4 - Details of the meshes in the notch for Kr = 1.5 (left), Kr = 2.5 (middle) and Kr = 3.5 (right).
Structure computations with pre-plastification
The applied loading is presented in figure 5. It consists in a uniaxial (longitudinal) load varying between a maximum load MaxF and a minimum load minF . Various maximum loads are considered, cor-responding to different numbers of cycles to crack initiation. Various positive load ratios = /F min MaxR F F are also considered, which are equal to the (applied) far field stress ratio and to the local longitudinal stress ratio /min Maxσ σ obtained in elastic computations. As mentio-ned already, plastification takes place in the stress concentration zone during the first load application (a stage therefore called pre-plastifi-cation) making the local stress ratio R obtained in plasticity different from the applied load ratio RF (The value of obtained is lower than RF).
An example of a map of accumulated plastic strains in the notch is gi-ven in figure 6 for = 46minF kN , = 52MaxF kN , = 0.88FR . Sim-ply note that this pre-plastification is naturally taken into account wit-hin the two-scale damage model, through the use of the localization law (8) (through the existence of a mesoscopic plastic strain pε ).
Figure 5 - Applied loading
Figure 6 - Maps of plastic strain after pre-plastification for one of the = 2.5TK specimens (applied load ratio = / = 0.88F min MaxR F F , compu-
ted stress ratio = / = 0.72min MaxR σ σ ).
point exp.
analytic
Damage
Stre
ss
log (NR)
F
0
t1 t
4
t3
t2
F max
F moy
F min
t (s)
KT= 2.5Plastic strain = 4.37%
Issue 9 - June 2015 - Multiaxial Haigh Diagrams from Incremental Two Scale Damage Analysis AL09-05 7
Number of cycles to rupture from two-scale damage analysis
For the calculations of the numbers of cycles to crack initiation (or for the prediction of the "no crack initiation" events), the total and plastic p strain tensors have been interpolated at the node located at the surface of the notch. These data constitute the input of the DAMAGE EAS post-processor and are entered in the form of an ASCII file. The tensors are extracted from the plasticity computa-tions at time steps t
1, t
2, t
3 and t
4 defined in figure 5. Only the second
part of the loading – the part between FMax and Fmin – is repeated. A maximum number of repetitions of this sequence or block must be set when using DAMAGE_EAS ( 107 in these calculations). The 21 damage post-processings corresponding to 21 tested notched specimens were made in a single (batch) operation taking approxi-mately 45 min on a PC.
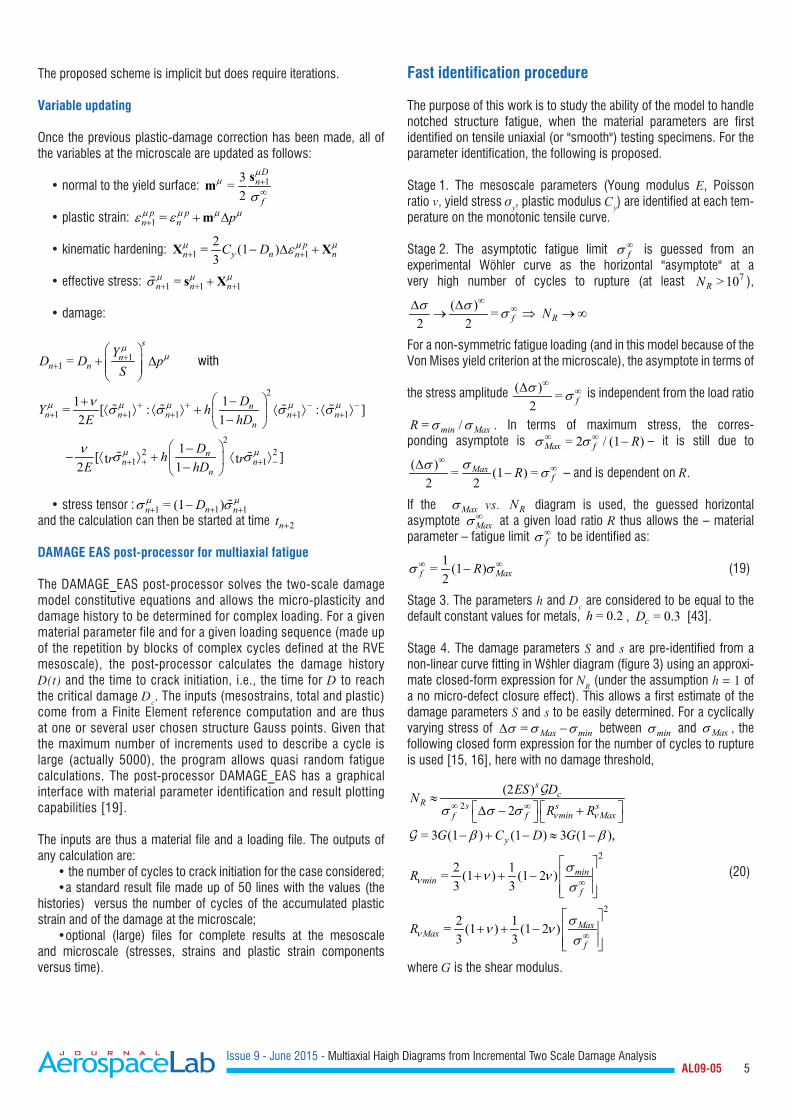
Figure 7 - Comparison between the experimental and predicted lifetimes for axisymmetric notched specimens
Failure is interpreted here as the mesocrack initiation condition, which corresponds to when the damage D reaches the critical value Dc (a material parameter here equal to 0.3).
The results obtained show an average ratio Experimental num-ber of cycles to failure exp
RN / Calculated number of cycles ( )calc
R cN N D D= = of 1.9 (figure 7). As far as the unbroken spe-cimens at cycles are concerned, the model correctly predicts the non-initiation of a crack in 10 out of 12 cases (83%). The fact that most of the predictions underestimate the experimental fatigue lifetimes seems logical. We must indeed recall that the model only predicts the crack initiation at the RVE mesoscale and does not take into account the cycles necessary to make these small cracks propagate to the final structural failure.
As far as the results obtained here for the TA6V alloy at a low temperature are concerned, the mean factor 2 obtained is quite a good result: this corresponds to the expected performance of a model for its industrial use, when the results are obtained from an independent identification on uniaxial (smooth) fatigue specimens. What is also of utmost importance is the ability of the model to correctly predict the time to crack initiation of a specimen subjec-ted to a high mean stress effect, with more or less plastification (up to 5% here) and for a multiaxial stress state.
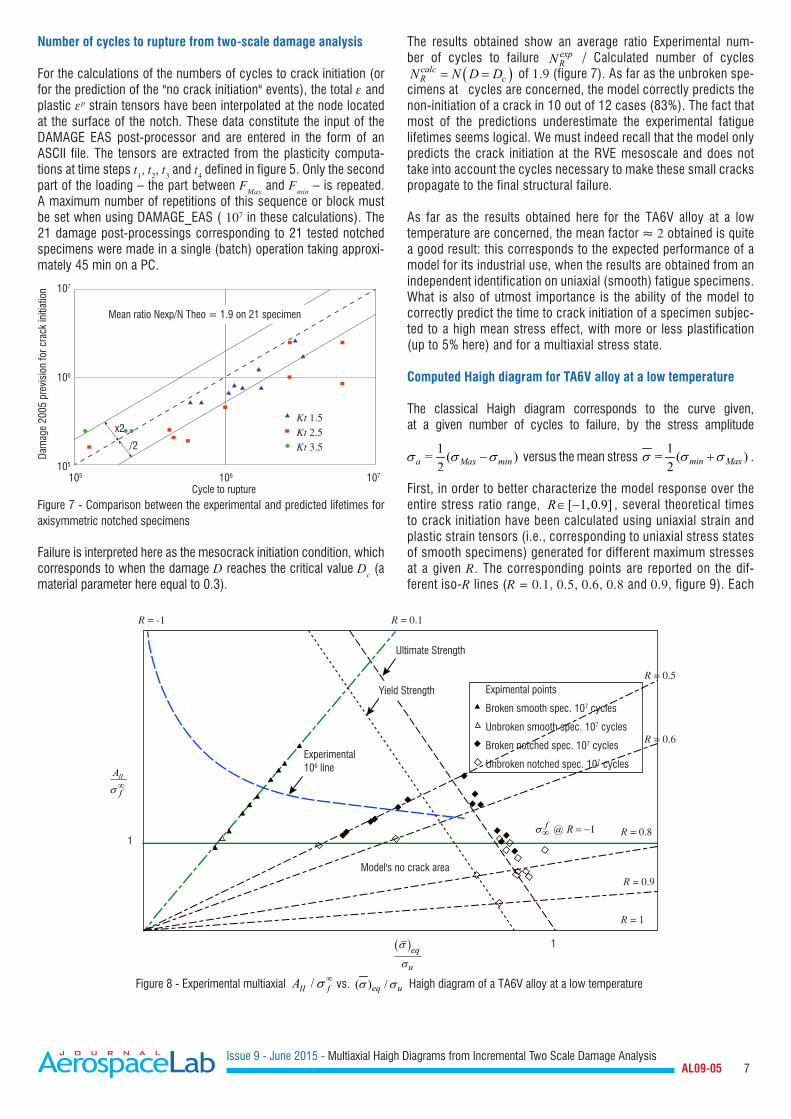
Computed Haigh diagram for TA6V alloy at a low temperature
The classical Haigh diagram corresponds to the curve given, at a given number of cycles to failure, by the stress amplitude
1= ( )2a Max minσ σ σ− versus the mean stress
1= ( )2 min Maxσ σ σ+ .
First, in order to better characterize the model response over the entire stress ratio range, [ 1,0.9]R∈ − , several theoretical times to crack initiation have been calculated using uniaxial strain and plastic strain tensors (i.e., corresponding to uniaxial stress states of smooth specimens) generated for different maximum stresses at a given R. The corresponding points are reported on the dif-ferent iso-R lines (R = 0.1, 0.5, 0.6, 0.8 and 0.9, figure 9). Each
Figure 8 - Experimental multiaxial /II fA σ ∞ vs. ( ) /eq uσ σ Haigh diagram of a TA6V alloy at a low temperature
Mean ratio Nexp/N Theo = 1.9 on 21 specimen
Cycle to rupture
107
106
x2
/2
105
105 106
Kt 1.5Kt 2.5Kt 3.5
107
Dam
age
2005
pre
visi
on fo
r cra
ck in
itiat
ion
Ultimate Strength
Expimental points
Broken smooth spec. 107 cycles
Unbroken smooth spec. 107 cycles
Broken notched spec. 107 cycles
Unbroken notched spec. 107 cycles
Yield Strength
Model's no crack area
1
1
R = -1 R = 0.1
R = 0.5
R = 0.6
R = 0.8
R = 0.9
R = 1
Experimental106 line
II
f
Aσ∞
( )eq
u
σ
σ
@ 1f Rσ∞ = −

Issue 9 - June 2015 - Multiaxial Haigh Diagrams from Incremental Two Scale Damage Analysis AL09-05 8
point is associated with a number of cycles to crack initiation calculated by DAMAGE EAS. The maximum stress was syste-matically chosen above the fσ ∞ -fatigue limit identified for the material at R = -1 which is, in this two-scale analysis, the limit below which the model does not announce any crack initiation. With such a network of theoretical points associated with their lifetime prediction, it is then possible to plot both the experimental (here at NR = 106 cycles, "Experimental 1E6 line") and the theore-tical iso-lifetime curves (using a Box-Cox regression technique). The iso-lifetime curves given by the two-scale damage model for 106(1E6), 5 106(5E6) and 107(1E7) cycles are shown in figure 9, each corresponding to a classical Haigh diagram for this TA6V alloy.
IIA vs. ( )eqσ multiaxial Haigh diagram
Both the experimental and computational results have been reported in figures 8 and 9 (by means of the two scale damage analysis). The asymptotic fatigue limit and the ultimate stress are respectively denoted by fσ ∞ and uσ . The unbroken specimens after 107 cycles are represented by white marks, whereas the broken ones are repre-sented by plain black marks. The smooth specimens (R = 0.1) are represented by triangular marks. The notched specimens are repre-sented by diamonds marks. For these, the stress state is 3D so a first multiaxial Haigh diagram can be plotted by replacing the uniaxial stress amplitude (vertical axis) by the octahedral shear II , the local equivalent alternated stress,
1 3= = ( ) : ( )2 2
' ' ' 'a II Max min Max minAσ σ σ σ σ− − (21)
and by replacing the uniaxial mean stress (horizontal axis) by the Von Mises equivalent stress of the mean stress tensor, the mean local stress is
1 3( ) = ( ) : ( )2 2
' ' ' 'eq Max min Max minσ σ σ σ σ+ + (22)
The horizontal line / = / = 1II f a fA σ σ σ∞ ∞ or = =II a fA σ σ ∞ corres-ponds to the infinite alternated fatigue limit (identified from the § "Fast identification" procedure). It is interesting to notice that, for this TA6V at a low temperature, this limit separates the broken specimens (black marks) from the unbroken ones (white marks) quite well. Note that the model theoretical iso-lifetime curves drawn here are rapidly decreasing in the -1 to 0.1 -range. All of the lines converge towards the asymptotic fatigue limit identified at R = -1 (horizontal line / = 1a fσ σ ∞ ). This line constitutes an asymptote for the iso-lifetime curves when the number of cycles to crack initiation increases. This feature is due to the fact that the equation for the asymptote is = 0f µ and that in this case a Von Mises plasticity criterion is considered at the microscale.
In order to directly compare the theoretical iso-lifetime curves to their experimental counterparts, a more detailed study can be carried out on the 6= 10RN line – which corresponds to the usual Haigh diagram at 106 cycles – for both the theoretical predictions and the available experimental data. A non-linear data regression allows the experimental 106(1E6) iso-life line (dashed line) to be plotted. It is remarkable that the experimental line fits its theoretical counterpart quite well. The global decreasing shape of the 6= 10RN computed Haigh diagram is quite similar to that of the experimental one: the two-scale damage model proposes an evolution of the theoretical iso-lifetime curve in good accordance with the experimental 6= 10RN line evolution for this TA6V alloy at a low temperature.
Finally, the influence of the local plastification on the local true stress ratio can also be observed. Once the yield stress is reached (straight line "Yield Strength" in figure 8), the local stress ratio computed at the notch tip decreases and the corresponding point leaves its original
Figure 9 - Multiaxial /II fA σ∞ vs. ( ) /eq uσ σ Haigh diagram with two-scale damage model iso-lifetime lines
Model's106 line
Model's5 106 line
Model's107 line
Expimental points
Broken smooth spec. 107 cycles
Unbroken smooth spec. 107 cycles
Broken notched spec. 107 cycles
Unbroken notched spec. 107 cycles
Model's no crack area
1
1
R = -1 R = 0.1
R = 0.5
R = 0.6
R = 0.8
R = 0.9
R = 1
Experimental106 line
II
f
Aσ∞
( )eq
u
σ
σ
@ 1f Rσ∞ = −

Issue 9 - June 2015 - Multiaxial Haigh Diagrams from Incremental Two Scale Damage Analysis AL09-05 9
iso-R line. All plastified points accumulate along the 45° "Ultimate Strength" straight line. This phenomenon has already been observed [37] and shows the importance of considering the local stress and strain state when drawing Haigh diagrams for notched specimens.
IIA vs. trσ multiaxial Haigh diagram
It is also possible to use another multiaxial extension of the Haigh diagram, the octahedral shear =a IIAσ versus the trace of the mean stress tensor,
11 22 331tr = = ( )2 min Maxσ σ σ σ σ σ σ+ + +with (23)
This complementary representation offers the advantage of better taking the stress triaxiality into account (it is consistent with the Sines approach of multiaxial fatigue [59]). The further values of the stress tensor trace are those of the smooth and notched fatigue specimens, computed by Finite Elements.
In figure 10, three different iso-lifetime lines predicted by the two-scale damage model have been plotted: the 5 105(5E5), 106(1E6) and 5 106(5E6) iso-lifetime lines, with the corresponding experimen-tal points. Several fatigue tests carried out on smooth specimens at R = -1, R = 0.1 and R = 0.5 up to 106 cycles, allow the shape of the 6= 10RN cycles line to be confirmed. As mentioned before, the theory and experiments fit quite well. Figure 11 is the equivalent of figure 9 (with ( )eqσ replaced by trσ ). The level of local triaxiality and yielding for each test is better ap-prehended (this information was not clear in figure 9, since all plasti-fied points were aligned).
Let us insist once again on the fact that the observations made here only concern locally plastified specimens. It would not have been pos-sible to explore such high stress ratio values and such high plastifica-tion levels in the High Cycle Fatigue with uniaxial smooth specimens.
Stronger asymptotic mean stress effect
The mean stress obtained previously in the mean stress range considered was in fact not so important, so that it has been mode-led through the dissymmetry of damage growth (by means of a low fatigue limit and a micro-crack closure parameter h<<1). A more general model is possible, still within the kinetic framework of rate form damage modeling, i.e., still with no need for the notion of cycle or for the Rainflow-type counting cycle method.
Linear mean stress effect
A linear mean stress effect on the fatigue asymptote can be intro-duced into the two-scale damage model by considering a Drucker-Prager criterion function at the microscale [3, 4], where is a material parameter,
( )( )
= tr
= 3
feq
H feq
f X a
X a
µ µ µ µ
µ µ
σ σ σ
σ σ σ
∞
∞
− + −
− + − (24)
i.e., by making the fatigue criterion pressure/first invariant dependent, as proposed by many authors [12, 59, 13, 24, 42, 50] for fatigue. From the Eshelby-Kröner scale transition law (5) – as well as from the scale transition law (8) – and incompressible plasticity, tr = tr = 3 H
µσ σ σ is still obtained. The differences here compared with classical works are: (i) the infinite lifetime domain < 0f µ is translated by micro-plasticity, (ii) the current values of the stresses are used (not the maximum or mean values) and the modeling remains incremental. Micro-plasticity and damage are the solution of a kinetic differential equation, so there is no need to define a cycle in order to calculate the time to crack initiation (it is the time at which D(t) = Dc, the critical damage).
Figure 10 - Partial multiaxial /II fA σ∞ vs. trσ Haigh diagram (TA6V alloy at a low temperature).
Expimental points
Broken specimen @ 106 cycles (exp)
Broken specimen @ 2 106 cycles (exp)
Broken specimen @ 5 106 cycles (exp)
Model predicted 5 105 cycles iso-life line
Model predicted 106 cycles iso-life line
Experimental 106 cycles iso-life line
Model predicted 5 106 cycles iso-life line
Model predicted 2 105 cycles iso-life line
Model predicted no crack area
0 500 1000 1500 2000 2500 3000Local mean stress trace (MPa)
Loca
l equ
ival
ent a
ltern
ated
stre
ss (M
Pa)
@ 1f Rσ∞ = −

Issue 9 - June 2015 - Multiaxial Haigh Diagrams from Incremental Two Scale Damage Analysis AL09-05 10
In box 1, from the two-scale damage model constitutive equations, the asymptotic fatigue limit is shown to be linearly mean stress de-pendent as at infinite lifetime,
: = =
, : = = tra f
II f
a
A a
σ σ σ σ
σ σ σ
∞
∞
−
−
in 1D
in 3D proportional loading (25)
so that the Sines criterion is retrieved in 3D, under a proportional loading assumption with octahedral stress IIA equal to the Von Mises norm of stress tensor amplitude. The fatigue limit in shear is obtained as = / 3f fτ σ∞ ∞ for any mean shear stress τ : it is not mean stress dependent, as experimentally observed [59, 42].
Bi-linear mean stress effect
A non-linear or at least bilinear modeling of the mean stress effect is sometimes needed if the applications range from alternated fatigue to high mean stress loading [33, 6].
A bilinear mean stress effect on the fatigue asymptote can be intro-duced into the two-scale damage model, by considering a bilinear definition of the first invariant term of the criterion function at the microscale, as
( )
1 0
2 1 2 0 0
= ( ) 3
133( ) =
13 ( ) >3
H feq
H H
H
H H
f X K
a ifK
a a a if
µ µ µ µ
µ
σ σ τ
σ σ σσ
σ σ σ σ
∞− + −
≤ + −
(26)
where a1, a
2 and the mean stress domain transition stress
0 are material parameters and ( = 0) = 0HK µ σ so fτ
∞ is the fatigue limit mean stress, independent in pure shear.
( ) = 3 = tr = trH HK a a aµ µσ σ σ σ is recovered and the linear mean stress effect from a
1 = a
2 = a.
The dependency of the fatigue limit σ
on the mean stress is now obtained as follows. For a positive mean stress:
• for 0σ σ≤ 0=a f aσ σ σ∞ −
• for 0>σ σ 1 2 0 2= 3 ( )a f a a aσ τ σ σ∞ − − −
where
1 2 0
1 2
1 2 00
0 2
1 20
1 2
2 3 ( )=
2 ( )
3 ( )=
=2 ( )
ff
f f
a aa a
a aa a
a aaa a
τ σσ
σ τ σσ
∞∞
∞ ∞
− −
− −
− + −
−
+− −
(27)
The calculations of an asymptotic multiaxial Haigh diagram (at infinite lifetime) can be found in Appendix A. Note that over the entire range of mean stresses, including the highly negative ones, the Haigh diagram is in fact trilinear.
Conclusion
The computation of two complementary multiaxial Haigh diagrams has been presented by means of an incremental two-scale damage analysis. Damage and failure are considered as part of the material behavior, in High Cycle Fatigue also, and this even if a structure be-haves elastically at the macroscopic scale. The time integration, time step by time step, of the plasticity coupled with the damage micros-cale constitutive equations determines HCF failure, here the micro-crack initiation, simply by the reaching of a critical damage, D = Dc, in 3D cases, in notch yielding cases, in any general complex fatigue loading cases.
Figure 11 - Multiaxial /II fA σ∞ vs. trσ Haigh diagram (TA6V alloy at a low temperature).
Expimental points
Broken specimen @ 106 cycles (exp)
Broken specimen @ 2 106 cycles (exp)
Broken specimen @ 5 106 cycles (exp)
Model 5 105 cy iso-life lineModel 106 cy iso-life line
Experimental 106 cy iso-life lineModel 5 106 cy iso-life line
Model 2 105 cy iso-life line
Model predicted no crack area below the asymptote line
0 500 1000 1500 2000 2500 3000
Local mean stress trace (MPa)
Loca
l equ
ival
ent a
ltern
ated
stre
ss (M
Pa)
@ 1f Rσ∞ = −

Issue 9 - June 2015 - Multiaxial Haigh Diagrams from Incremental Two Scale Damage Analysis AL09-05 11
The two scale damage analysis has been carried out on TA6V not-ched specimens at a low temperature. The TA6V specimens were tested at up to 107 cycles at different stress ratios, from R = 0.5 up to R = 0.9. The advantages of notched specimens have been pointed out as twofold, • on the one hand, they allow an interesting bi-axial stress state to be obtained in the average proportion of 70% in axial and 30% in hoop stresses, • on the other hand, they allow high stress ratios and high local plastification levels to be easily explored; these levels are often obser-ved in real structures.
This is often not possible with uniaxial (smooth) specimens.
The model has been identified first by fatigue data for a single popula-tion of smooth specimens tested at R = -1. It has then been applied, in a post-processing approach, to notched specimens exhibiting plas-tification at the notch tip (at different stress ratios R). Both the non-rupture events and the numbers of cycles to crack initiation have been correctly predicted. An average factor of 2 has been obtained between
the experimental lifetimes and the computed numbers of cycles to crack initiation (over a 21 notched specimen population).This work also emphasizes a quite good concordance between the experimental iso-lifetime curves and their theoretical counterparts, at least at NR = 106 for TA6V at a low temperature: they decrease and seem to converge towards a unique asymptote in Haigh diagrams, as the stress ratio increases. This asymptote corresponds to the infinite alternated fatigue limit, a material parameter also called asymptotic fatigue limit, for the considered titanium alloy – a TA6V optimized for aeronautics applications.
The asymptote may not be horizontal, thus leading to a stronger mean stress effect. A way to obtain a linear or piecewise linear Haigh dia-gram from the two-scale damage model has been finally addressed.
Finally, note that neither the scale nor the gradient effects have been introduced (nor are they needed) in the modeling. A quantitative study of such effects for this titanium alloy is left for further work. It must be noted that the possibilities of gradient modeling within a two-scale damage model can be found, in [16, 46]
Box 1 - Mean stress effect from a two-scale damage model: proof under proportional loading Under a proportional loading, a time-space multiplicative decomposition can be applied:
2= ( ) = ' : ' = 13eqtσ σ Σ Σ Σ Σwith (1-1)
where = ( ) = ( ) eqt signσ σ σ σ is a scalar function (the signed Von Mises stress) and is a constant tensor, normed, such as
tr>0, so the stress triaxiality is 1/ = ( )t3H eq sign rσ σ σ Σ .
At the microscale, due to the Eshelby-Kršner scale transition (5), proportionality is maintained only for deviatoric tensors :
3e = ' = '2
p p X Xµ µ µ µε Σ Σand (1-2)
where = (1 ) pX C Dµ µ µε−
for the now scalar kinematic hardening law.
The deviatoric part of the scale transition for the deviatoric tensors gives = ' 2 (1 ) = ( 3 (1 ) ) 'p pG Gµ µ µσ σ β ε σ β ε′ − − − − Σ , so quanti-ties at the microscale can be expressed from the scalar signed Von Mises stress :
( ) = ( ) = ( )t t t( ) =| (3 (1 ) ) |p
eq
r r rX G C
µ
µ µ µ µ
σ σ σ
σ σ β ε
Σ
− − − + (1-3)
The expression (24), generalized into Eq. (26) for the yield criterion at the microscale, becomes in proportional loading :
=| (3 (1 ) ) | ( ) 3pH ff G C Kµ µ µ µσ β ε σ τ ∞− − + + − (1-4)
The extrema of a cycle at the onset of plasticity f = 0 at both the maximum stress Max and minimum stress min are
= (3 (1 ) ) ( ) 3 = 0
= 3 (1 ) ( ) 3 = 0
pMax Max HMax f
pmin min Hmin f
f G X K
f G X K
µ µ µ
µ µ µ
σ β ε σ τ
σ β ε σ τ
∞
∞
− − + + −
− + − + + − (1-5)

Issue 9 - June 2015 - Multiaxial Haigh Diagrams from Incremental Two Scale Damage Analysis AL09-05 12
Infinite lifetime (endurance) corresponds to a possible pre-yielding, but then to elastic loading at constant p and X at the microscale,
to a stress amplitude lower than 1 1= ( ) = ( ) =2 2a Max min Max min eq IIAσ σ σ σ σ′ ′− Σ − Σ (due to = 1eqΣ ) determined from both condi-
tions = = 0Max minf f . In any case, it is 1= 3 ( ( ) ( ))2II f Hmin HMaxA K Kµ µτ σ σ∞ − + ,
• if a linear Drucker-Prager expression (24) is used 1 ( ( ) ( )) =2 HMax HminK K ktrµ µσ σ σ+ so that linear Sines criterion describing
the infinite lifetime domain is obtained :
1= ( ) = 3 t2II Max min eq fA a rσ σ τ σ∞− − (1-6)
• if a bilinear definition of function ( )HK µ σ is used, there are 3 cases :
i) 0t Maxrσ σ≤ or ii) 0t minrσ σ≥ or iii) 0( ) >t Maxr σ σ and 0( ) <t minr σ σ .
For cases (i) and (ii) the same parameter ai acts in fmin and fmin so that the same calculations as previously hold, therefore the mean stress effect is linear (but with different slopes a1 or a2) as
Max 0 1
min 0 1 2 0 2
1< = ( ) = 3tr t21> = ( ) = 3 ( )tr t2
II Max min eq f
II Max min eq f
A a r
A a a a r
σ σ σ σ τ σ
σ σ σ σ τ σ σ
∞
∞
− −
− − − −
when
when (1-7)
In the last case, the two constants a1 and a2 act as in eq. (26)
0 2 1 2 0
0 1
> = (3 (1 ) ) ( ) 3 = 0t t
< = 3 (1 ) 3 = 0t t
pMax Max Max f
pmin min min f
f G X a a ar r
f G X ar r
µ µ µ
µ µ µ
σ σ σ β ε σ σ τ
σ σ σ β ε σ τ
∞
∞
− − + + Σ+ − −
− + − + + Σ− (1-8)
By adding the two equations, at identical p, the amplitude is obtained:
1 2 0 2 1= 3 ( ) ( )ta f Max mina a a a rσ τ σ σ σ∞ − − − + Σ (1-9)
Finally, using =Max aσ σ σ+ , =min aσ σ σ− , = /t t eqr rσ σΣ and =a IIAσ in such a proportional cyclic loading a linear mean stress effect is obtained, which is stress triaxiality dependent, with a slope in the Haigh diagram different from parameters a1 and a2,
1 2 00 1 2
01 2 1 2
2 3 ( )>t = t<t 2 3( ) 2 3( )
fMax
H Hmin
eq eq
a a a ar A II rr a a a a
τ σσ σσσ σσ σ
σ σ
∞ − − +−
− − − −when (1-10)
In uniaxial tension-compression = [1,0,0]diagΣ , there is a diagonal tensor so
1 2 0 1 20
1 2 1 2
2 3 ( )= =
2 ( ) 2 ( )f
a fa a a a a
a a a aτ σ
σ σ σ σ∞
∞− − +− −
− − − − (1-11)
This last equation defines the mean stress effect at low mean stress, if a parameter 0 is identified that is smaller than the uniaxial
fatigue limit fσ ∞ . It thus defines the fatigue limit at zero mean stress fσ ∞ from the fatigue limit in pure shear fτ∞ and the parameters
a1, a2, 0 of the bilinear ( )HK µ σ function.

Issue 9 - June 2015 - Multiaxial Haigh Diagrams from Incremental Two Scale Damage Analysis AL09-05 13
Acknowledgements
Snecma and LMT-Cachan would like to especially acknowledge the CNES (Direction des Lanceurs) for its support for this study carried out on the TA6V alloy.
References
[1] K. AAS-JACKOBSEN, R. LENSHOW R - Behavior of Reinforced Columns Subjected to Fatigue Loading. ACI Journal, 70(3), pp. 199-206, 1973. [2] O.H. BASQUIN (1910) - The Exponential Law of Endurance Tests. Proc. ASTM, 10, 625–630. [3] G. BARBIER, R. DESMORAT, J.P. SERMAGE, A. DUTERTRE, S. COURTIN, J. DEHOUVE, D. TCHOU-KIEN - Mean Stress Effect by Incremental Two Scale Damage Model, LCF6. 6th International Conference on Low Cycle Fatigue, Berlin, Sept. 8-12, 2008. [4] G. BARBIER, R. DESMORAT, B. RAKA - Mean Stress Effect and Bi-Axial Fatigue of Structures from Two Scale Damage Model. ICTAM 2008 -22nd Inter-national Congress of Theoretical and Applied Mechanics, Adelaide, Australie, August 25-29, 2008. [5] A. BENALLAL, R. BILLARDON, I. DOGHRI, L. MORET-BAILLY - Crack Initiation and Propagation Analyses Taking into Account Initial Strain Hardening and Damage Fields. Luxmore A. (ed.), Numerical Methods in Fracture Mechanics, Pineridge Press, pp. 337-351, 1987. [6] V. BONNAND, J.L. CHABOCHE, P. GOMEZ, P. KANOUTÉ, D. PACOU - Investigation of Multiaxial Fatigue in the Context of Turboengine Disc Applications. International Journal of Fatigue 33, 1006–1016, 2011. [7] M.W. BROWN, K.J. ILLER - A Theory for Fatigue Failure under Multiaxial Stress-Strain Conditions Institution of Mechanical Engineers. Proceedings. vol. 187, no. 65, pp. 745-755. 1973 [8] J.L. CHABOCHE - Continuum Damage Mechanics and its Application to Structural Lifetime Predictions. La Recherche Aerospatiale (English Edition), 4, pp. 37-54, 1987. [9] J.L. CHABOCHE - Development of Continuum Damage Mechanics for Elastic Solids Sustaining Anisotropic and Unilateral Damage. Int. J. Damage Mechanics, Vol. 2, pp. 311-329, 1993. [10] J.L. CHABOCHE, P.M. LESNE - A Non-Linear Continuous Fatigue Damage Model. Fatigue Fract Engng Mater Struc 11, 1-17, 1988. [11] J.L. CHABOCHE, P.M. LESNE - Fatigue & Fracture of Engineering Materials & Structures, 11, p. 1-17, 1988. [12] B. CROSSLAND - Effect of Large Hydrostatic Pressures on the Torsional Fatigue Strength of an Alloy Steel. Proc. of the Inter. Conf. on fatigue metals Inst. Mech. Engr., pp. 138-149, 1956. [13] K. DANG-VAN - Sur la résistance à la fatigue des métaux. Sciences et Techniques de l’Armement, vol. 3, pp. 647-722, 1973. [14] K. DANG-VAN - Macro-Micro Approach in High-Cycle Multiaxial Fatigue, Advances in Multiaxial Fatigue. ASTMSTP1191, D.L. McDowell and R. Ellis Eds., Americain Society for Testing Materials, Philadelphia, pp. 120-130, 1993. [15] R. DESMORAT - Modélisation et estimation rapide de la plasticité et de l’endommagement. Habilitation à Diriger des Recherches, Université Paris 6, 2000. [16] R. DESMORAT - Two Scale Damage Model for Fatigue Representation of Gradient Effects. 6th National Congress on Mechanics, Thessaloniki, Grèce, Vol. 2, p. 318-327, 19-21 july 2001. [17] R. DESMORAT, J. LEMAITRE - Two Scale Damage Model for Quasi-Brittle and Fatigue Damage, Handbook of Materials Behavior Models. J. Lemaitre Ed., Academic Press, chapter Continuous Damage, Section 6.15, pp. 525-535, 2001. [18] R. DESMORAT - Damage and Fatigue : Continuum Damage Mechanics Modeling for Fatigue of Materials and Structures. European Journal of Environ-mental and Civil Engineering (Revue Européenne de Génie Civil), 10, p. 849-877, 2006. [19] R. DESMORAT, F. PAUGET, J.P. SERMAGE - DAMAGE_2005: a Post-Processor for High Cycle Fatigue under Complex Thermomechanical Loading. ASME Pressure Vessels and Piping Division Conference, Vancoucer, BC, Canada, july 23-27, 2006. [20] R. DESMORAT, A. KANE, M. SEYEDI, J.P. SERMAGE - Two Scale Damage Model and Related Numerical Issues for Thermo-Mechanical High Cycle Fatigue. Eur. J. Mech A/Solids, Vol. 26, pp. 909-935, 2007. [21] R. DESMORAT, F. RAGUENEAU, H. PHAM - Continuum Damage Mechanics for Hysteresis and Fatigue of Quasi-Brittle Materials and Structures. Inter-national Journal of Numerical and Analytical Methods for Geomaterials, vol. 31, p. 307-329, 2007. [22] R. DESMORAT, S. CANTOURNET - Modeling Micro-Defects Closure Effect with Isotropic/Anisotropic Damage. International Journal of Damage Mecha-nics, vol. 17, pp. 65–96, 2008. [23] R. DESMORAT, S. OTIN - Cross-Identification Isotropic/Anisotropic Damage and Application to Anisothermal Structural Failure. Engineering Fracture Mechanics, 75(11), p. 3446-3463, 2008. [24] C. DOUDARD, S. CALLOCH, P. CUGY, A. GALTIER, F. HILD - A Probabilistic Two Scale Model for High-Cycle Fatigue Life Prediction, Fatigue Fract. Engng Mater Struct, 28, p. 279-288, 2005. [25] J. DUFAILLY, J. LEMAITRE - Modeling Very Low Cycle Fatigue. International Journal of Damage Mechanics, 4, p. 153-170, 1995. [26] C. ERNY, D. THEVENET, J.Y. COGNARD, M. KÖRNER - Fatigue Life Prediction of Welded Ship Details. Marine Structures, 25, p. 13-32, 2012. [27] J.D. ESHELBY - The Determination of the Elastic Field of an Ellipsoidal Inclusion, Related Problems. Proc. Roy. Soc., London, vol. A241, p. 376, 1957. [28] A. FATEMI, L. YANG - Cumulative Fatigue Damage and Life Prediction Theories: a Survey of the State of the Art for Homogeneous Materials. Interna-tional Journal of Fatigue, vol. 20, pp. 9-34, 1998. [29] L. FLACELIERE, F. MOREL, A. DRAGON - Coupling Between Mesoplasticity and Damage in High-Cycle Fatigue. International Journal of Damage Mechanics, 16, pp. 473-509, 2007. [30] D. FRANÇOIS, A. PINEAU, A. ZAOUI - Comportement mécanique des matériaux – élasticité et plasticité. Hermès Paris, 1992. [31] F. GALLERNEAU, J.L. CHABOCHE - Fatigue Life Prediction of Single Crystals for Turbine Blade Applications. International Journal of Damage Mecha-nics, 8(4), pp. 404-427, 1999. [32] A. GANCZARSKI, L. BARWACZ - Low Cycle Fatigue Based on Unilateral Damage Evolution. International Journal of Damage Mechanics, 16, pp. 159-177, 2007.

Issue 9 - June 2015 - Multiaxial Haigh Diagrams from Incremental Two Scale Damage Analysis AL09-05 14
[33] V. GOMEZ - Etude en fatigue biaxiale à haute température d’alliages métalliques pour disques de turbomachines aéronautiques. PhD thesis, Univ. Paul Sabatier, 2001. [34] C.T. HUA, D.F. SOCIE - Fatigue Damage in 1045 Steel under Constant Amplitude Biaxial Loading. Fatigue Eng. Mat. Struct., 7, 165–179, 1984. [35] E. KRÖNER - On the Plastic Deformation of Polycrystals. Acta Metall., vol. 9, pp. 155-161, 1961. [36] P. LADEVÈZE, J. LEMAITRE, 1984 - Damage Effective Stress in Quasi unilateral Conditions. 16th International Congress of Theoretical and Applied Mechanics, Lyngby, Denmark. [37] D.B. LANNING, T. NICHOLAS, G.K. HARITOS - On the use of Critical Distance Theories for the Prediction of the High Cycle Fatigue Limit Stress in Notched Ti-6Al-4V. International Journal of Fatigue, vol. 27, pp. 45-57, 2005. [38] N. LAUTROU, D. THEVENET, J.Y. COGNARD - A Fatigue Crack Initiation Approach for Naval Welded Joints. Oceans 2005 - Europe, 2, p. 1163 - 1170, 2005 [39] H.H.E. LEIHOLZ - On the Modified S-N Curve for Metal Fatigue Prediction and its Experimental Verification. Engineering Fracture Mechanics, vol. 23, pp. 495-505, 1986. [40] J. LEMAITRE, J.L. CHABOCHE - A Non-Linear Model of Creep-Fatigue Damage Cumulation and Interaction. Symposium IUTAM, Gothenburg, 2-6 september 1974. [41] J. LEMAITRE, A. PLUMTREE - Application of Damage Concepts to Predict Creep-Fatigue Failures. Journal of Engineering Materials Technology, vol. 101, pp. 284–292, 1979. [42] J. LEMAITRE, J.L. CHABOCHE - Mécanique des matériaux solides. Dunod 1985, Mechanics of solid materials (3rd Edition 2009), Oxford University Press, 1991 (english translation). [43] J. LEMAITRE - A course on Damage Mechanics. Springer Verlag, 1992. [44] J. LEMAITRE, I. DOGHRI - Damage 90: a Post-Processor for Crack Initiation. Comp. Methods Appl. Mech. Engrg. 115: 197-232, 1994. [45] J. LEMAITRE, J.P. SERMAGE, R. DESMORAT - A two Scale Damage Concept Applied to Fatigue. International Journal of Fracture, vol. 97, pp. 67-81, 1999. [46] J. LEMAITRE, R. DESMORAT - Engineering Damage Mechanics : Ductile, Creep, Fatigue and Brittle Failures. Springer, 2005. [47] Z.X. Li, F.F. Jiang, Y.Q. Tang - Multi-Scale Analyses on Seismic Damage and Progressive Failure of Steel Structures. Finite Elements in Analysis and Design, 48, p. 1358-1369, 2012. [48] D.L. MCDOWELL - Damage Mechanics and Metal Fatigue: A Discriminating Perspective. International Journal of Damage Mechanics, 8, pp. 376-403, 1999. [49] S.S. Manson, M.H. Hirschberg 1964 - Fatigue: An Interdisciplinary Approach. Syracuse University Press, Syracuse, N.Y. [50] A. MARMI, A HABRAKEN, L. DUCHENE - Multiaxial Fatigue Damage Modelling at Macro Scale of Ti6AL4V Alloy. International Journal of Fatigue, 31, 2031-2040, 2009. [51] V. MONCHIET, E. CHARKALUK, D. KONDO - Plasticity-Damage Based Micromechanical Modelling in High Cycle Fatigue. C. R. Mecanique, 334, p. 129-136, 2006. [52] F. MOREL - A Critical Plane Approach for Life Prediction of High Cycle Fatigue under Multiaxial Variable Amplitude Loadingn. International Journal of Fatigue vol. 22(2), pp. 101-119, 2000. [53] T. NICHOLAS - Critical Issues in High Cycle Fatigue. International Journal of Fatigue, 21(1), pp. 221-231, 1999. [54] M.H. PAAS, P.J.G. SCHREURS, W.A.M. BREKELMANS - A Continuum Approach to Brittle and Fatigue Damage: Theory and Numerical Procedures. Int. J. Solids Struct., 30, 579–599, 1993. [55] I.V. PAPADOPOULOS - A High-Cycle Fatigue Criterion Applied in Biaxial and Triaxial Out-of-Phase Stress Conditions. Fatigue & Fracture of Engineering Materials & Structures vol. 18(1), pp. 79-91, 1995. [56] I.V. PAPADOPOULOS, P. DAVOLI, C. GORLA, M. FILIPPINI, A. BERNASCONI - A Comparative Study of Multiaxial High-Cycle Fatigue Criteria for Metals. International Journal of Fatigue Vol. 19(3), pp. 219-235, 1997. [57] J.P. SERMAGE, J. LEMAITRE, R. DESMORAT - Multiaxial Creep Fatigue under Anisothermal Conditions. Fatigue and Fracture of Engng Mater. & Struct., 23(3), pp. 241 - 252, 2000. [58] M. SAUZAY - Effet de surface en fatigue polycyclique. PhD thesis Univ. Paris 6, 2000. [59] G. SINES - Behavior of Metals under Complex Static and Alternating Stresses. In: Sines, G., Waisman, J.L. (Eds.). McGraw-Hill, New York, pp. 145–169, 1959. [60] R. SMITH, P. WATSON, T. TOPPER - A Stress-Strain Function for the Fatigue of Metals. Journal of Mat., vol. 5, pp. 767-778, 1970. [61] K. THEPVONGSA, Y. SONODA, H. HIKISAKA - Journal of Applied Mechanics, 6, p. 1227-1234, 2003.

Issue 9 - June 2015 - Multiaxial Haigh Diagrams from Incremental Two Scale Damage Analysis AL09-05 15
AUTHORS
Rodrigue Desmorat. A former student of the Ecole Normale Supérieure de Cachan (ENSC) and Research Associate in Me-chanics, Rodrigue Desmorat, 47, has been an Assistant Pro-fessor at the University Paris 6. Since 2002, he has been a full Professor at ENSC and carries out research at the LMT-Cachan
in the field of Damage Mechanics. He is the co-author of two books.
Pierre Gaborit. A graduate from Arts et Métiers ParisTech and Karlsruher Institut für Technologie in Mechanical Engineering, Pierre Gaborit, 27, carried out his PhD research at the LMT-Cachan (Ecole Normale Supérieure de Cachan). This work will be defended in the second half of 2015. Since July 2014 he
has been working as a Material Engineer for forged products at Snecma.
Alban du Tertre. A graduate from the ECAM Lyon, Alban du Tertre, 40, joined the Space Engine Division of Snecma at Ver-non (F) in 1999. He was successively in charge of thermome-chanical computations and of powder metallurgy component development in the cryogenic turbo-pump department. He then
managed various research and methodological projects, mainly linked to HCF and LCF fatigue applied to rocket engine components, in cooperation with the LMT Cachan, ONERA, the Pprime Institute, etc. Promoted to Expert status in 2014, he now works as a mechanical development project manager in the combustion device design office.