Embed Size (px)
Citation preview

Multi zone modeling of HCCI combustion at Multi zone modeling of HCCI combustion at University of ZagrebUniversity of Zagreb
Kozarac D., Mahalec I.
Department of IC Engines and Mechanical Handling Equipment
Chair of IC engines and Motor Vehicles
25 May 2009 BOOST - HCCI 2
Content:Reason for HCCI modeling
Simulation of HCCI combustion
Conclusions and future work
Current multi zone simulation model (6)
Results
Validation of six zone simulation model

25 May 2009 BOOST - HCCI 3
Reason for HCCI modelingWhat is HCCI combustion?Relatively new combustion process of IC engines
Combustion characteristics:
homogeneous mixture (SI like)
compression ignition (Diesel like)
25 May 2009 BOOST - HCCI 4
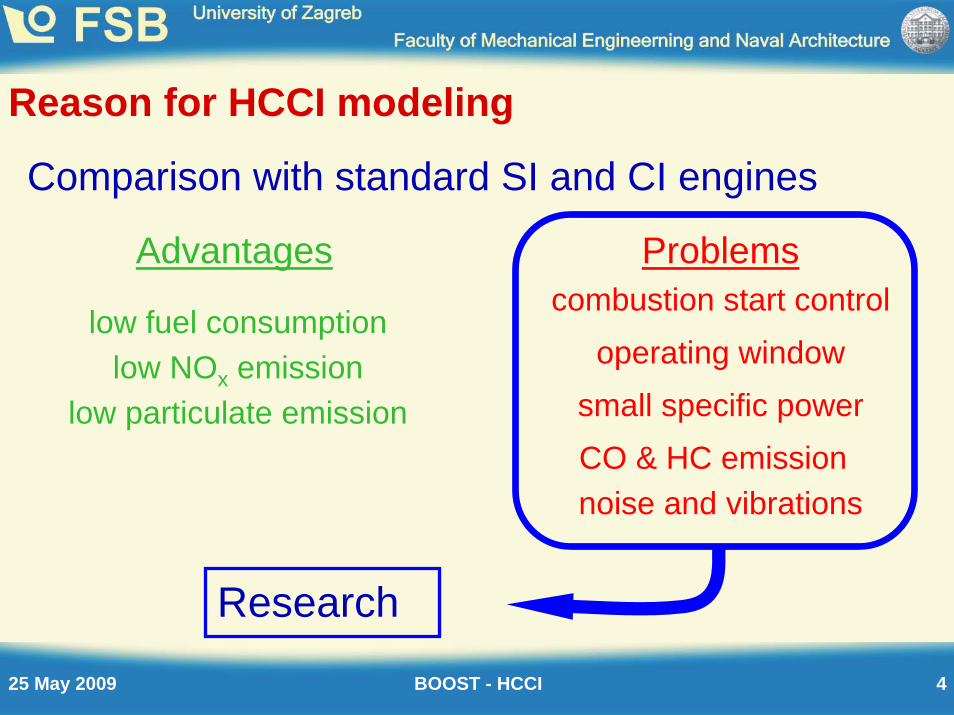
combustion start controlAdvantages
Reason for HCCI modeling
Comparison with standard SI and CI engines
Problems
low fuel consumptionoperating windowlow NOx emission
low particulate emission small specific powerCO & HC emissionnoise and vibrations
Research

25 May 2009 BOOST - HCCI 5
Simulation of HCCI combustionIC engine simulations: single zone models
multi zone modelsmulti-dimensional models(CFD)
HCCI simulations: chemical kinetics
Single and multi zone calculation + detailed chemical kinetics
CFD + reduced chemical kinetics
CFD + detailed chemical kinetics

25 May 2009 BOOST - HCCI 6
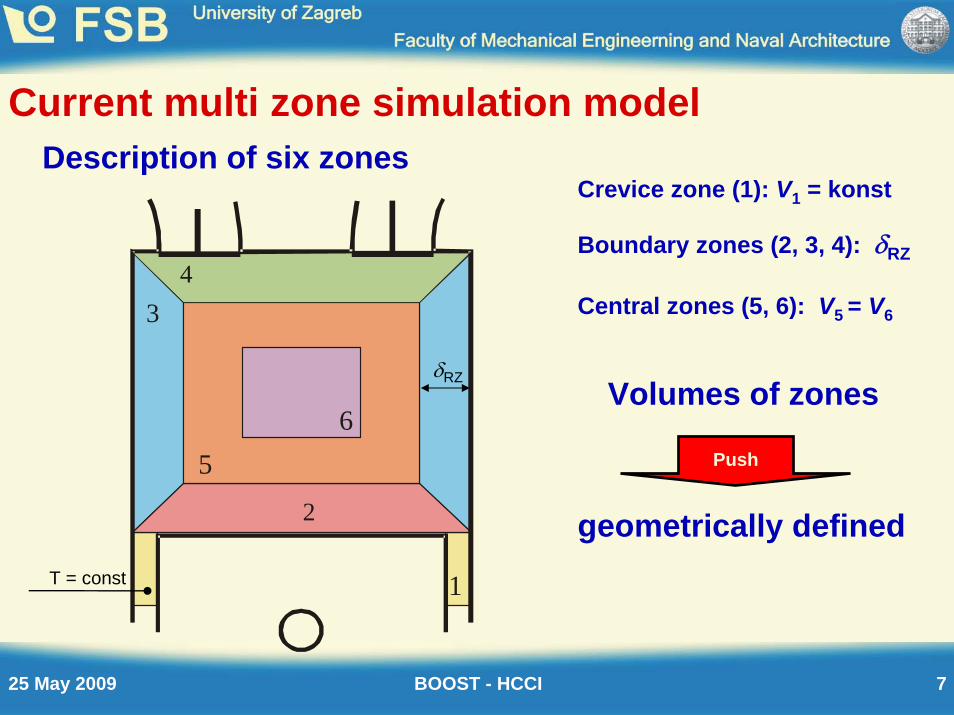
Current multi zone simulation model
Comprehensive chemical kinetics
Cylinder is divided into six zones
Heat transfer between wall and boundary zones
Non sequential solverODEs of all zones are calculated simultaneously
Heat transfer between the zones
Possession of crevice zone (iso thermal)
Volumes of the zones are geometrically defined
Mass transfer between the zones
Temperature distribution at IVC
Features:
Connected with cycle simulation software (AVL Boost)
25 May 2009 BOOST - HCCI 7
Description of six zones
1
4
2
3
56
δRZ
T = const
Boundary zones (2, 3, 4): δRZ
Central zones (5, 6): V5 = V6
Crevice zone (1): V1 = konst
Volumes of zones
geometrically defined
Push
Current multi zone simulation model

25 May 2009 BOOST - HCCI 8
ValidationCalculation (1Z, 6Z) vs Experiment
Engine – HCCI converted from Cummins B SAE 2003–01–0752SAE 2004–01–1910
isooctane
Load range: from well below idling
to onset of knockingincrement
Results: Pressure trace
Net Rate of Heat Release
Emissions (CO2, CO, HC)
φ = 0.04φ = 0.26φ = 0.02
Fuel:
Mechanism: Chen’s isooctane oxidation (291 s, 875 r)

25 May 2009 BOOST - HCCI 9
ValidationLoad: φ = 0.24 Calculation constants: Δt=10-3 s, δ=0.9 mm
Heat transfer: Woschni 1990
0
50
100
150
200
250
300
350
400
450
-10 -5 0 5 10Crank angle [deg]
Net
RO
HR
[J/d
eg]
Experiment1Z calculation6Z calculation
0
10
20
30
40
50
60
70
80
90
100
300 330 360 390 420Crank angle [deg]
Pres
sure
[bar
]
Experiment1Z calculation6Z calculation
ηc= 95.0 %ηc= 99.2 %ηc= 96.7 %

25 May 2009 BOOST - HCCI 10
Validation
20
25
30
35
40
45
50
55
60
65
330 340 350 360 370 380 390Crank angle [°]
Net
RO
HR
[J/°]
Experiment
1Z calculation
6Z calculation
-10
0
10
20
30
40
50
60
330 340 350 360 370 380 390Crank angle [°]
Net
RO
HR
[J/°]
Experiment
1Z calculation
6Z calculation
Heat transfer: Woschni 1990ηc= 62.5 %ηc= 73.4 %ηc= 70.0 %
Load: φ = 0.14 Calculation constants: Δt=10-3 s, δ=0.9 mm

25 May 2009 BOOST - HCCI 11
ValidationLoad: φ = 0.04 Calculation constants: Δt=10-3 s, δ=0.9 mm
Heat transfer: Woschni 1990
20
25
30
35
40
45
50
55
330 340 350 360 370 380 390Crank angle [°]
Net
RO
HR
[J/°]
Experiment
1Z calculation
6Z calculation
-4
-3
-2
-1
0
1
2
3
330 340 350 360 370 380 390Crank angle [°]
Net
RO
HR
[J/°]
Experiment
1Z calculation
6Z calculation
ηc = 31 %ηc= 20.2 %ηc= 29.2 %

25 May 2009 BOOST - HCCI 12
0102030405060708090
100
0 0.04 0.08 0.12 0.16 0.2 0.24 0.28
Fuel
C in
to e
mis
sion
[%] Experiment
1Z calculation6Z calculation
CO2
0
10
20
30
40
50
60
70
0 0.04 0.08 0.12 0.16 0.2 0.24 0.28
Fuel
C in
to e
mis
sion
[%] Experiment
1Z calculation6Z calculation
CO
0
10
20
30
40
50
60
70
80
0 0.04 0.08 0.12 0.16 0.2 0.24 0.28
Fuel
C in
to e
mis
sion
[%] Experiment
1Z calculation6Z calculation
HC
0102030405060708090
100
0 0.04 0.08 0.12 0.16 0.2 0.24 0.28
com
bust
ion
effic
ienc
y [%
]
Experiment1Z calculation6Z calculation
eqivalence ratio φ [-] eqivalence ratio φ [-]
eqivalence ratio φ [-] eqivalence ratio φ [-]
Validation
25 May 2009 BOOST - HCCI 13
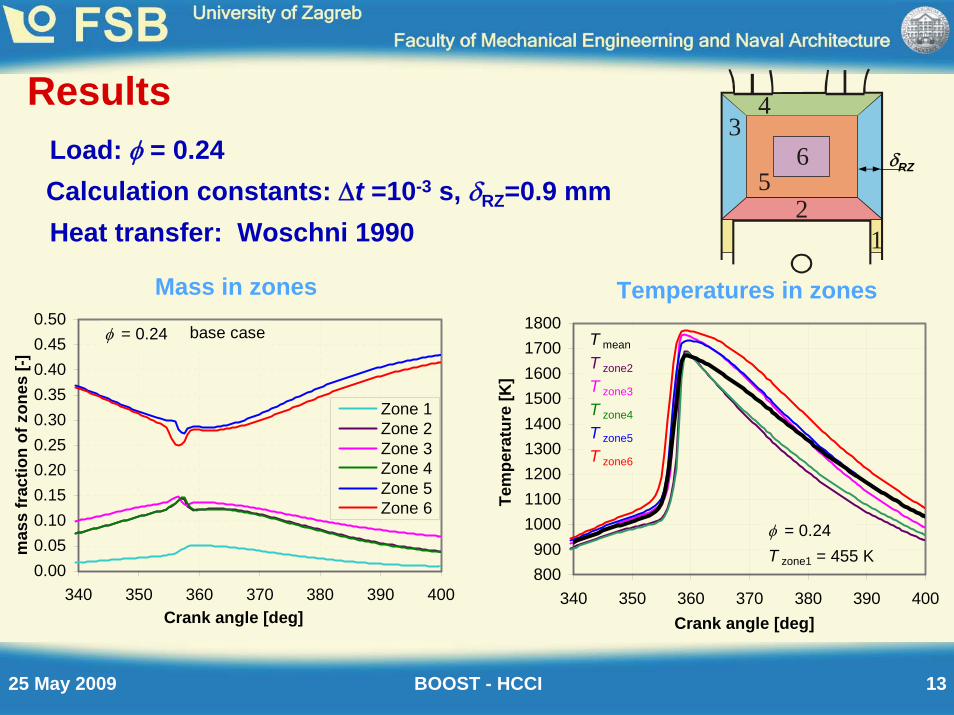
Load: φ = 0.24
Heat transfer: Woschni 1990
Mass in zones Temperatures in zones
0.000.050.100.150.200.250.300.350.400.450.50
340 350 360 370 380 390 400Crank angle [deg]
mas
s fr
actio
n of
zon
es [-
]
Zone 1Zone 2Zone 3Zone 4Zone 5Zone 6
φ = 0.24 base case
800900
100011001200130014001500160017001800
340 350 360 370 380 390 400Crank angle [deg]
Tem
pera
ture
[K]
φ = 0.24
T mean
T zone2
T zone3
T zone4
T zone5
T zone6
T zone1 = 455 K
1
4
2
3
56 δRZ
Calculation constants: Δt =10-3 s, δRZ=0.9 mm
Results

25 May 2009 BOOST - HCCI 14
Load: φ = 0.24
Heat transfer: Woschni 1990
0
100
200
300
400
500
600
700
340 350 360 370 380 390 400Crank angle [deg]
mas
s fr
actio
n of
HC
[ppm
]
Zone 1Zone 2Zone 3Zone 4Zone 5Zone 6All zones
φ = 0.24base case
050
100150200250300350400450500
340 350 360 370 380 390 400Crank angle [deg]
mas
s fr
actio
n of
CO
[ppm
]
Zone 1Zone 2Zone 3Zone 4Zone 5Zone 6All zones
= 0.24base case
Mass fraction of HC species in cylinder Mass fraction of CO in cylinder
1
4
2
3
56
φ = 0.24
Calculation constants: Δt =10-3 s, δRZ=0.9 mmδRZ
Results

25 May 2009 BOOST - HCCI 15
Results EthanolBoundary conditions Iso-octane Ethanol BC1 Ethanol BC 2
Tintake 428 428 450
Fuel mass fraction 0.0171 0.0285 0.0285
0
10
20
30
40
50
60
70
80
90
340 350 360 370 380Crank angle [deg]
Pres
sure
[bar
]
Iso-octaneEthanol BC 1Ethanol BC 2 600
700800900
1000110012001300140015001600170018001900
340 350 360 370 380Crank angle [deg]
Tem
pera
ture
[K]
Comparison with isoocaneLoad: φ = 0.26

25 May 2009 BOOST - HCCI 16
0
0.1
0.2
0.3
0.4
0.5
0.6
0.7
0.8
0.9
1
350 355 360 365 370Crank angle [deg]
Com
bust
ion
effic
ienc
y [-]
Iso-octaneEthanol BC 1Ethanol BC 2
0
50
100
150
200
250
300
350
350 355 360 365 370Crank angle [deg]
RO
HR
[J/d
eg]
Results EthanolComparison with isoocane

25 May 2009 BOOST - HCCI 17
Results Ethanol – performance mapsMaps (SOC, CD, IMEP, BSFC vs EGR & Tintake)
Load: φ =0.22
355
356
357
358
359
360
440 450 460 470 480 490 500 510
Intake temperature [K]
Star
t of c
ombu
stio
n (S
OC
)
0
2
4
6
8
10
12
14
16
18
440 450 460 470 480 490 500 510 Intake temperature [K]
Com
bust
ion
dura
tion
[deg
]
2.4
2.5
2.6
2.7
2.8
440 450 460 470 480 490 500 510 Intake temperature [K]
IMEP
[bar
]
380
385
390
395
400
405
410
415
420
440 450 460 470 480 490 500 510 Intake temperature [K]
BSFC
[g/k
Wh]
EGR 20
EGR 30
EGR 40
EGR 50
EGR 60
EGR 70
EGR 0

25 May 2009 BOOST - HCCI 18
ConclusionsNew calculation model represent a good progress in combustion modeling of HCCI combustion Correspondance of pressure and NetROHR is very good
Calibrated model enables an insight in sources of emissions especially emissions from crevice volumes
Partial possibility of predicting and analysis of emissions
Further development of HCCI model
Use of the model for R&D of HCCI engines
Future
Increasing number of zonesMaking simulations faster
Introducing more in-homogeneity

25 May 2009 BOOST - HCCI 19
THE END
Thank you for your attentionQUESTIONS

25 May 2009 BOOST - HCCI 20
Description of the simulation model

25 May 2009 BOOST - HCCI 21
Chemical kineticsSimulation of HCCI combustion
Combustion is a sequence of chemical reactions
All chemical reactions take place at definite rate
Description of chemical reactions
Reaction mechanism(n species and m reactions)
7 16 2 7 15 2C H O C H HO∗ ∗+ → +
7 16 7 15C H X C H XH∗ ∗+ → +
7 15 2 7 15C H O C H OO∗ ∗+ →
7 15 7 14C H OO C H OOH∗ ∗→species production rates
ω [mol/(cm3 sec)]

25 May 2009 BOOST - HCCI 22
Chemical kineticsSimulation of HCCI combustion
Detailed~(10000 reactions, 1000 species)
Comprehensive~(1000 reactions, 100 species)
Reaction mechanisms:
Skeletal~ (50 reactions, 10 species)
Curran iso-octane
Examples
~(3606 reactions, 857 species)
Chen iso-octane~(875 reactions, 291 species)
Tanaka PRF(55 reactions, 32 species)

25 May 2009 BOOST - HCCI 23
Temperature distribution
model
Coupling with engine cycle simulation code – AVL BoostGas Exchange Boost
(single zone)High pressure cycle HCCI
(1Z or 6Z model)
Current multi zone simulation model