Embed Size (px)
Citation preview
NIGERIAN ELECTRICITY REGULATORY COMMISSION
MULTI-YEAR TARIFF ORDER (MYTO)
FOR THE DETERMINATION OF CHARGES
AND
TARIFFS FOR ELECTRICITY GENERATION,
TRANSMISSION AND RETAIL TARIFFS
FOR THE PERIOD 1 JULY 2008 TO 30 JUNE 2013
Multi-Year Tariff Order (July 2008- June 2013)
ii
ORDER NO: NERC/GL059
ORDER on the establishment of a MULTI-YEAR TARIFF
PREAMBLE:
One of the primary functions of NERC as contained in Section 32 (d) of the Electric Power
Sector Reform (EPSR) Act, 2005 is to ensure that the prices charged by licensees are fair to
consumers and sufficient to allow the licensees to finance their activities and to allow for
reasonable earnings for efficient operation. Section 76 of the EPSR Act further empowers the
Commission to establish one or more tariff methodologies for regulating electricity prices.
In consultation with industry stakeholders and consumers, NERC adopted a holistic and
scientific approach to correct pricing of electricity to ensure a fair and cost-reflective tariff
regime which will sustain the present operators while at the same time attract investment into
the sector. The key principles of cost reflectivity and affordability were taken into
consideration in evolving the new tariff regime.
This forms the basis of the Multi-Year Tariff Order (MYTO) methodology. The MYTO further
provides for continuous reduction in transmission and distribution/retail loses. Revenue
earned by operators is made dependent on achieving these performance improvements.
The process for adoption of this methodology was transparent as consultations took place
with government, several customers, customer groups, other major stakeholders and
industry practitioners who contributed to the proposed methodology at various public fora
and through written representations.
The Order is divided into six parts; Introduction, Legal and Regulatory Framework, Pricing
Methodology, Tariff Rates, Procedures for Annual Review, and Tariff Schedules.
By virtue of the powers conferred by S. 76 of the Electric Power Sector Reform Act, NERC
hereby, makes the following ORDER:

Multi-Year Tariff Order (July 2008- June 2013)
iii
Table of Contents
1 Introduction 1
1.1 Background 1
1.2 Electricity pricing in Nigeria 2
1.3 Rationale for Tariff Review 3
2 Legal and Regulatory requirements 5
2.1 The Methodology and Guiding Principles 6
2.2 Tariff Formulation and Development 8
2.3 Inputs and Outputs of the Electricity Pricing Model 9
2.3.1 Inputs 9
2.3.2 Output 9
2.4 Application of Tariff Order 9
2.5 Appropriate Pricing and Rate Design 9
2.6 Tariff Options and Appropriate Path 10
3 Pricing Methodology 11
3.1 Pricing of Generation 11
3.1.1 Generation Plant Characteristics 13
3.1.2 Wholesale Price 13
3.1.3 Existing Power Purchase Agreements 13
3.2 Pricing of Transmission and Distribution 14
3.2.1 Transmission Prices 15
3.2.2 The Connection Charge 15
3.2.3 Transmission Use of System (TUOS) Charges 16
3.2.4 Transmission Line Losses 16
3.3 Distribution/Retail Prices 16
3.4 The Treatment of Capital Expenditure 17
3.4.1 The Weighted Average Cost of Capital (WACC) 18
3.4.2 Estimating the WACC components 19
3.5 The Rate of Depreciation 21
4 Orders on Tariff Rates 23
4.1 Wholesale Generation Prices 23
4.2 Transmission Revenue Requirement and Tariff 23
4.2.1 Assest Value and Capital Expenditure 23
4.2.2 TUOS Charges 24
4.3 Distribution and Retail 25
4.3.1 Assest Value and Capital Expenditure 25
Multi-Year Tariff Order (July 2008- June 2013)
iv
4.3.2 Operating and Maintenance Expenditure 26
4.3.3 Institutional Charges 27
4.3.4 Aggregated Distribution Costs – The Annual Revenue Requirement 27
4.3.5 Performance of Operators 28
4.3.6 Tariff Equalisation 29
4.3.7 FGN Subsidy 30
5 Procedure For Annual review 31
5.1 Generation Prices 31
5.2 TUOS Charges 32
5.3 Retail Tariffs 32
6 Retail Tariff Schedules 33
7 Appendix- 1
8 Appendix- 2
Tables
Table 1 Technical characteristics of the OCGT new entrant plant 12
Table 2 WACC estimate for Transmission and Distribution 20
Table 3 WACC estimate for Generation 21
Table 4 Asset lives used depreciation 22
Table 5 Wholesale generation prices 23
Table 6 Capital expenditure included in the TUOS calculation (nominal N billion, years
commencing 1 July) 23
Table 7 Transmission Revenue Requirement (N'000) and TUOS charges per MWh 25
Table 8 Regulated asset value and forecast capital expenditures (nominal N billion) 26
Table9 Annual allowance for operation, maintenance, administration, metering and
billing (nominal N'000) 27
Table 10 Aggregated regulated costs for distributor/retailers (N'000) 28
Table 11 Technical and non-technical losses allowed for in the Tariff Order 29
Table 12 Equalisation payments to be collected and paid (N/kWh) 30
Table 13 Average cost of supply, FGN subsidy and effective average tariff (N/kWh) 30
Table 14 Inflation rate, exchange rate and delivered gas price used in the calculation
of generation price 31
Table 15 Inputs to the retail price subject to annual review 32
Table 16 Regulated revenue requirement 33
Table 17 Tariff schedule for the year starting 1ST July 2008 34
Table 18 Tariff schedule for the year starting 1ST July 2009 35
Table 19 Tariff schedule for the year starting 1ST July 2010 36
Table 20 Tariff schedule for the year starting 1ST July 2011 37
Table 21 Tariff schedule for the year starting 1ST July 2012 38
Multi-Year Tariff Order (July 2008- June 2013)
v
APPENDIXES
1: List of parties consulted on MYTO methodology and tariff
2: Comments and Observations on MYTO methodology
Glossary of Terms
ARR Annual Revenue Requirement
BPE Bureau of Public Enterprises
CAPM Capital Asset Pricing Model
CCGT Combined Cycle Gas Turbine
CPI Consumer Price Index
DISCO Distribution and marketing company
DUOS Distribution Use of Service
EPSR Electric Power Sector Reform
FGN Federal Government of Nigeria
GENCO Generator Company
HQ Head Quarters
IFC International Finance Corporation
IMF International Monetary Fund
IPP Independent Power Producer
KWh 1000 watt hours of electrical energy
LRMC Long Run Marginal Cost
MAR Maximum Allowable Revenue
MLF Marginal Loss Factor
MO Market Operator
MWh 1 million watt hours of electrical energy
MYTO Multi Year Tariff Order
N/KWh Naira per Kilo Watts Hour
NEPA National Electric Power Authority
NEPP National Electric Power Policy
NERA National Economic Research Associates
Multi-Year Tariff Order (July 2008- June 2013)
vi
NERC Nigerian Electricity Regulatory Commission
NESI Nigerian Electricity Supply Industry
NTB Nigerian Treasury Bonds
NUT National Uniform Tariff
OCGT Open Cycle Gas Turbine
ODRC Optimised Depreciated Replacement Cost
PHCN Power Holding Company Of Nigeria
PI Price Index
PPA Power Purchase Agreement
RAB Regulatory Asset Base
ROE Return on Equity
ROT Rehabilitate, Operate, and Transfer
SO System Operator
SPE Special Purpose Entity
SPV Special Purpose Vehicle
TSO Transmission System Operation
TCN Transmission Company Of Nigeria
TUOS Transmission Use of System
WACC Weighted Average Cost of Capital

Multi-Year Tariff Order (July 2008- June 2013)
1
1 Introduction By these presents the Nigerian Electricity Regulatory Commission (NERC)
establishes the schedule of tariffs to be paid each year for the following Nigerian
Electricity Supply Industry (NESI) charges over the period 1 July 2008 to 30 June
2013:
• The Wholesale price of generated electricity sold to national grid ;
• Transmission charges;
• Retail tariff schedules;
• The Transmission System Operator ( SO and MO) charge;
• The PHCN Headquarters charge;
• The regulatory charge; and
• The payment and level of tariff equalisation payments between distributors in
order to continue to maintain a national uniform tariff.
The tariff path set for the next 5 years is derived from a regulatory model of the NESI
which has been developed from historical industry data and forecasts provided by
Power Holding Company of Nigeria (PHCN) and its predecessor and adopted by
NERC. This approach forms the basis for a Multi Year Tariff Order (MYTO) based on
an industry wide determination of current and future costs.
These regulated charges are established for the period 1 July 2008 to 30 June 2013
pursuant to the authority given under Section 76 of the Electric Power Sector Reform
Act (2005).
Retail tariff schedules will be reviewed each year and changes made to the
regulated charges if there are material variations greater than plus or minus 5% (in
magnitude) in the rate of inflation, exchange rate and cost of gas.
A major review of all inputs to the tariff calculation will be undertaken in 2012 as the
basis for a new Multi Year Tariff Order (MYTO) to commence for 5 years from 1 July
2013.
1.1 Background
NERC’s commitment and mission is to ensure that electricity is adequate, safe,
reliable and affordable.
In January 2006, PHCN requested an average increase in its tariff by 60% from the
tariff that had been operative since 2002. The Commission considered this along with
the industry’s performance over recent years.
The Commission found it necessary to adopt a holistic and scientific approach to
correct pricing of electricity over time to ensure gradual sector development through
the instrument of a cost reflective and fair tariff regime. The process took into
Multi-Year Tariff Order (July 2008- June 2013)
2
consideration the interest of consumers and investors simultaneously in addressing
the problem of electricity supply and proper pricing of power in Nigeria.
Central to the resolution of the problems of the power sector in Nigeria is the issue of
commercial viability of the industry. The industry is barely able to generate enough
revenue to cover its operating costs let alone meet its considerable capital
expenditure needs. Therefore, the industry is not in a position to attract private sector
investment, which is much needed if the twin problems of inadequate and unreliable
electricity services are to be tackled.
To this end, the Commission developed a new tariff order for the industry predicated
on revenue requirement and sustainability of the incumbent operators and new
entrants. While cost-reflectivity is a key consideration in the new tariff order, the
Commission is mindful of the impact of any tariff review on consumers.
At the centre of the new tariff order is a multi-year tariff model, which calculates
electricity prices based on revenue requirements of the whole industry. This
approach is aimed at ensuring the necessary support for operating and capital
expenditures of the various sub-sectors i.e. generation, transmission and distribution.
The Commission is introducing a tariff methodology that will aid pricing of electricity in
the most reasonable and equitable manner. MYTO will set electricity tariffs for
consumers over the 15-year path (1 July 2008 to 30 June 2023). The tariffs are set at
levels that support the viability and growth of the Nigerian Electricity Supply Industry
(NESI).
To avoid rate shock, the tariffs paid by consumers will be less than cost reflective
values over the first three years of the introduction of MYTO. However, Federal
Government support will be provided in the form of subsidy to make up the shortfall
caused by the difference between actual and cost reflective tariffs over this period,
while the tariff moves gradually towards viable levels.
The subsidy is also intended to ensure that the shortfall that arises as a consequence
of tariffs being below costs is provided for. Allowing the tariff to reach viable levels
over a period of time is expected to lessen the burden on consumers while allowing
them to adjust to the new price level overtime. Power availability is also expected to
increase during this time. The subsidy is intended to sunset when price reaches the
cost reflective level (i.e. in the 4th year).
1.2 Electricity Pricing in Nigeria
In Nigeria, electricity prices are generally lower than the production cost. The tariff
was last reviewed in February 2002 (from an average of N4.50/kWh to about
N6/kWh) where it has remained to date. In the intervening years inflation in labour
and fuel costs and increases in the cost of capital equipment have increased the unit
cost of electricity production significantly.
Multi-Year Tariff Order (July 2008- June 2013)
3
The new tariff order is intended to provide financial incentives for increased
investments in the industry and for improvements in plant availability, enhanced
metering, billing, and collection performance.
The Commission has over the last one year carried wide consultation with the
industry operators, labour unions, consumer advocacy groups, the legislature and
relevant Government departments on both the MYTO methodology and tariff. (See
Appendix 1 for the list of stakeholders consulted)
1.3 Rationale for Tariff Review
Electricity is similar to any other manufactured product. Its costs are made up of the
cost of inputs, such as fuel (e.g. gas), and capital items, such as turbines,
switchyards and transformers; and the transmission and distribution networks. The
industry is capital intensive and the plant has a long technical and economic life. It
differs from other products in that it cannot be stored. The implication of
instantaneous supply and consumption is that price has to be sufficient to cover the
cost of production, otherwise supply will be jeopardised.
If electricity is under-priced then supply will not meet demand. At the moment in
Nigeria there is a very high level of unsatisfied demand for electricity. One indicator
of this is the extensive use of diesel generators which typically produce electricity at
price levels that are much higher than the price of grid electricity.
It is imperative that electricity should be priced such that it covers its supply costs if
adequate and reliable electricity is to be produced to meet demand. As with any other
product, it needs to cover, at the minimum, operating and capital costs. If the price is
at a sufficient level to ensure a reasonable return on investment, it will attract new
producers. At present the revenue from electricity tariffs covers about half of the
revenue required to achieve a viable and growing electricity sector. In other words,
the tariff level in the industry can barely fund routine activities and certainly cannot
provide for investment in new generation, transmission and distribution infrastructure.
The pricing regime developed by NERC and embodied in the MYTO approach is
intended to facilitate the industry’s successful passage through a period of significant
performance improvement and growth. The order developed by NERC will:
• Allow for the recovery of an appropriate return on capital invested, depreciation
(and replacement) of capital and recovery of fuel, operation, maintenance and
overhead costs;
• Provide an incentive for new investment in capital equipment.
• Provide incentives for reducing technical and non-technical losses, lowering
forced outages and levels of unsaved energy;
• Provide viable and transparent tariff methodology that will allow NESI’s progress
towards a reformed and market oriented system in which generation and retail
activities are mostly not subject to price regulation while the monopoly activities of
transmission and distribution continue to be under price regulation;
Multi-Year Tariff Order (July 2008- June 2013)
4
• Finally, ensure that the benefits of a reformed NESI are passed through to all
consumers in the form of reliable electricity supply at the lowest possible price
consistent with the above objectives.
The NESI, will in time, move to a market-based system whereby generators and
electricity retailers will be free to contract with each other for the supply of electricity.
Transmission and distribution, as monopoly wires activities, will remain regulated.

Multi-Year Tariff Order (July 2008- June 2013)
5
2 Legal and Regulatory Framework The Electric Power Sector Reform (EPSR) Act of 2005 provides the legal and regulatory framework for the electricity supply industry in Nigeria. The Act empowers the Nigerian Electricity Regulatory Commission (NERC) to regulate the electricity sector in the country, including Generation, Transmission, System Operations and Distribution.
The establishment of the Nigerian Electricity Regulatory Commission (NERC) was the direct result of a genuine desire to transform the electricity supply industry in the country into a market-based industry in line with the government’s reform agenda for the country’s economic, industrial and social development. Thus, the Nigerian Electricity Regulatory Commission (NERC) was established to facilitate the introduction and management of competition in the country’s electricity supply industry.
Pursuant to the above, the objects of the Commission include:
I. to create, promote, and preserve efficient industry and market structures, and to ensure the optimal utilization of resources for the provision of electricity services;
II. to maximize access to electricity services, by promoting and facilitating consumer connections to distribution systems in both rural and urban areas;
III. to ensure that an adequate supply of electricity is available to consumers;
IV. To ensure that the prices charged by licensees are fair to consumers and are sufficient to allow the licensees to finance their activities and to allow for reasonable earnings for efficient operation.
According to Section 76(1) of the Act, the following activities are subject to tariff regulation:
(a) Generation and trading, in respect of which licences are required pursuant to this Act, and where the Commission considers regulation of prices necessary to prevent abuse of market power and
(b) Transmission, distribution and system operation, in respect of which licences are required under this Act.
Section 76(2) provides for the Commission to adopt appropriate tariff methodology within the general principles established in the Act, which:
• Allows recovery of efficient cost including a reasonable rate of return
• Gives incentives to improve efficiency and quality
• Sends efficient signals to customers on costs they impose on the system
• Phases out or reduces cross subsidies
Section 76(7) of the Act provides that in preparing a tariff methodology, the Commission shall:
Multi-Year Tariff Order (July 2008- June 2013)
6
a) Consider any representations made by license applicants, other licensees,
consumers, eligible customers, consumer associations, associations of eligible
customers and such other persons as it considers necessary or desirable;
b) Obtain evidence, information or advice from any person who, in the
Commission’s opinion, possesses expert knowledge which is relevant in the
preparation of the methodology.
Section 76(6) of the Electric Power Sector Reform Act also provides that the
Commission, prior to approving a tariff methodology, shall give notice in the Official
Gazette, and in one or more newspapers with wide circulation, of the proposed
establishment of a tariff methodology, indicating the period within which objections or
representations in connection with the same may be made to the Commission.
In addition, Section 76(8) of the Act provides that the Commission shall fix the date on which the tariff methodology shall come into operation and it shall cause notice to be given in the official gazette of that date.
The Commission issued the final methodology, in the form of a decision which was
published and gazetted.
By virtue of Section 76 (11) of the EPSR Act 2005, Licensees are required to comply
with the provisions of the methodology, under the conditions of their licences.
2.1 The Methodology and Guiding Principles
In describing its methodology, the Commission had adopted three basic principles in
the determination of an appropriate methodology. These principles require that a
regulatory methodology:
• Produces outcomes that are fair;
• Encourages outcomes that are efficient in that it involves the lowest possible costs
to Nigeria and encourages investment in electricity generation; and
• Is simple, transparent and avoids excessive regulatory costs.
The MYTO model was based on a set of pricing principles and cost assumptions and
designed to provide tariffs for each of the generation, transmission, distribution
(including retail) sectors.
The underlying pricing principles that guided the development of the MYTO model
were:
• Cost recovery/financial viability – regulated entities should be permitted to
recover their (efficient) costs, including a reasonable rate of return on capital.
• Signals for investment – prices should encourage an efficient level and nature of
investment (e.g., location) in the industry.
• Certainty and stability of the pricing framework is also important for private
sector investment.
Multi-Year Tariff Order (July 2008- June 2013)
7
• Efficient use of the network – Generally, this requires “efficient” prices that
reflect the marginal costs that users impose on the system and the reduction of
cross-subsidies.
• Allocation of risk – pricing arrangements should allocate risks efficiently
(generally to those who are best placed to manage them).
• Simplicity and cost-effectiveness – the tariff structure and regulatory system
should be easy to understand and not excessively costly to implement (e.g.,
facilitate metering and billing).
• Incentives for improving performance – the way in which prices are regulated
should give appropriate incentives for operators to reduce costs and/or increase
quality of service.
• Transparency/fairness – prices should be non-discriminatory and transparent.
Non-discriminatory access to monopoly networks is also a key prerequisite for
effective competition in the contestable sectors.
• Flexibility/robustness – the pricing framework needs to be able to cater for
unforeseen changes in circumstances.
• Social and political objectives – the pricing framework needs to provide for the
achievement of social policy goals such as user affordability, universal access and
specific policies such as the National Uniform Tariff, etc.
In accordance with Section 76(6) of the EPSR Act, NERC published the Notice of
Proposed Methodology upon which the MYTO was to be based in both Nigerian
national Newspapers on the 14th May 2007 as well as the Federal Government
Official Gazette No 18 of 2007. Comments were invited from Industry participants
and other interested parties. The deadline for the receipt of comments was the 14th of
June 2007 which deadline was further extended for another 14 days. (See attached
copy of MYTO Methodology, which is also available online.)
The review of the comments and observations received (see Appendix 2) indicated
no objection to the MYTO methodology. Therefore, it was adopted as the path to
correct pricing of electricity.
Multi-Year Tariff Order (July 2008- June 2013)
8
2.2 Tariff Formulation and Development
The MYTO lays out the due process to be followed in meeting the statutory
requirement. It provides a 15-year tariff path for the electricity industry with potential
minor adjustments every year and major reviews every five years. The methodology
used by the Commission to determine the MYTO tariff path is the building blocks
approach. Building blocks approach is used extensively in regulated industries. It is
simply a way of bringing together all of the industry’s costs in a consistent accounting
framework.
There are three standard building blocks used in this approach:
• Efficient operating costs and overheads
• The allowed return on capital (to achieve a fair rate of return on the necessary
assets invested in the business)
• The allowed return of capital (depreciation)
The building blocks approach to electricity pricing is based upon a set of pricing
principles and cost assumptions. The ultimate objective is to provide the industry with
a stable and cost reflective pricing structure that provides a modest return on
investments to efficient industry players. At the same time the tariff order will protect
consumers against excessive pricing, since the price is set at the entry level price of
the most efficient generator.
The tariff approach provides regulated prices for each sector and as the industry
develops and becomes more competitive, the scope of tariff regulation will reduce.
The NESI consists of four parts in the electricity supply chain:
• Generation
• Transmission
• Distribution
• Retail
Distribution and retail are often treated together and will be taken as one in the
remainder of this Tariff Order. In the future, when the industry is further opened up to
competition, distribution and retail will be separated with distribution continuing to be
a regulated activity while retail becomes competitive.
Determination of generation pricing is based on a slightly different approach
compared to transmission and distribution. Given that it is the sector that lends itself
readily to competition, its pricing is based on an efficient new entrant model, of an
open-cycle gas turbine given the fact that they offer the lowest cost form of
generation, given current conditions and gas prices in the NESI. At this transition
stage of the industry, generation output pricing will be determined by the Commission
Multi-Year Tariff Order (July 2008- June 2013)
9
to ensure that only prudently incurred costs are recoverable and to protect
consumers.
2.3 Inputs and Outputs of the Electricity Pricing Model
2.3.1 Inputs
The key assumptions that go into the model are predominantly macroeconomic
(inflation, interest rates, exchange rates) and sector specific (load factor, losses, fuel
prices, depreciation, etc). Other key inputs include projections of generation capacity
capital expenditure, operating expenditure, etc.
2.3.2 Outputs
The key outputs from the model are the revenue requirements and tariff Summary for
the first five (5) years of the Tariff Order (July 2008 – to June 2013), which capture
the following information:
• Revenue requirement for generation, transmission, distribution and retailing with
all the cost components, including capital expenditure, fuel costs, labour input,
administration, sales and metering.
• Estimates of the industry’s growth over the coming 5 years, taking into account
the targets for installed capacity, generation output and sales.
• Separation of this average revenue requirement into a tariff schedule for 5 years
for each consumer group taking into account some of the specific costs and
characteristics of supplying these different groups.
• Industry’s billing and collection rates, including a rate of improvement for these
over time. If distributor/retailers can do better than these rates they will collect and
retain more revenue.
2.4 Application of Tariff Order
The tariffs derived from the electricity tariff model applies to all regulated industry
participants. The retail tariff is a composite of generation, transmission, distribution
prices, ancillary and regulatory charges, and charges to the market operator and
PHCN Headquarters (HQ). NERC will enforce the tariff order carrying out annual and
five- year reviews and recalibrate the model.
2.5 Appropriate Pricing and Rate Design
Electricity tariff is the key to cost recovery and underpins the long-term viability of the
industry. Currently, prices charged do not reflect the true cost of providing electricity
services. To achieve an economically efficient allocation of resources in a market
economy, producers and consumers should be paid and pay, respectively, for the full
costs associated with their activities.

Multi-Year Tariff Order (July 2008- June 2013)
10
The tariff order, while focusing on cost-reflectivity, gradually rebalances tariffs
between customer classes to reflect the true cost of supply, reduces cross-subsidies
and sends the right price signals to consumers as an incentive to rationalize their
consumption.
With respect to rate design, the Commission has produced a tariff schedule for the
different categories of customers so that they are charged based on the average
cost, with the exception of lifeline tariff consumers as a safety net provision.
2.6 Tariff Options and Appropriate Path
The Commission considered a number of options for tariff paths for consumers and
approved the option with government subsidy to reach the viable tariff by 2010. The
subsidy make up the difference between the average retail tariff paid and the viable
costs as determined by NERC.

Multi-Year Tariff Order (July 2008- June 2013)
11
3 Pricing Methodology
The price referred to in this section concerns regulated prices by the Commission.
Different approaches are used for generation and transmission, distribution and
retailing. The end state plan for reform of the industry involves the generation sector
becoming unregulated with negotiated generation bilateral contracts.
The regulated wholesale price determined in this Tariff Order for generation is in
place of a spot market price. The Commission considers it important to regulate both
wholesale and retail rates, because the market is not currently competitive with little
supply for free trading of power in open market.
The price determination for transmission and distribution is subject to price regulation
based on a building blocks approach. This approach, explained in more detail below,
provides an accounting framework in which the NESI’s costs can be brought together
in a consistent way to produce a tariff path.
3.1 Pricing of Generation
NERC has determined that the price of electricity to be paid generators will be at the
level required by an efficient new entrant to cover its life cycle costs (including their
short run fuel and operating costs and their long run return on capital invested). Since
demand is in excess of supply the price of electricity should be at the price required
to attract new entrant investors into the market. This price will be paid to all
generators who sell to national grid except those who hold PPAs.
Given current forms of new generation technology and the price of gas in Nigeria,
NERC has determined that the lowest cost new entrant generator is an open cycle
gas turbine (OCGT) using natural gas. OCGT was selected because it was
considered as one of the most efficient power plant, in addition to availability of
natural gas in Nigeria. Therefore, all new entrants are expected to use efficient
technology benchmark for project evaluation and analysis.
3.1.1 Generation Plant Characteristics
The Commission has gathered inputs from a number of industry sources in order to
bring together estimates of plants costs and technical characteristics. The table 1
below shows the assumptions made about the technical characteristics of the power
station. Auxiliary requirements cover the electricity used inside the generation plant
itself which is generated but not available for sale. In the case of OCGTs, this is
typically quite small and has been set here at a maximum of 1%.
Multi-Year Tariff Order (July 2008- June 2013)
12
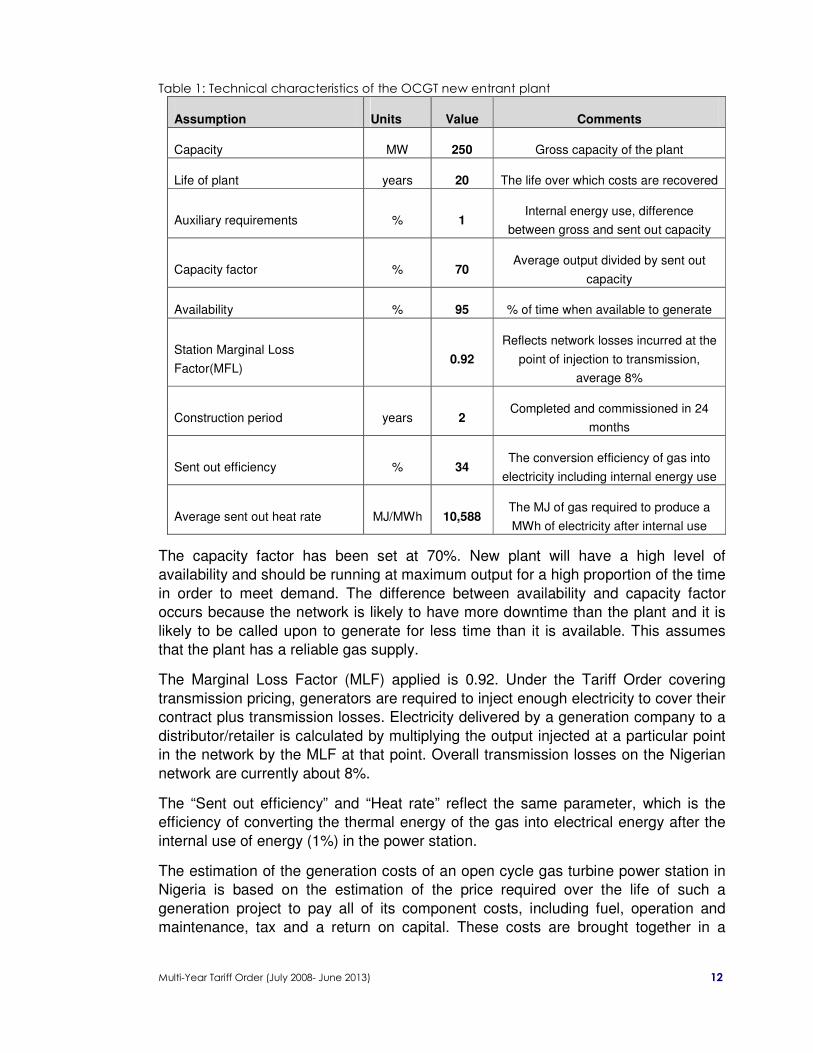
Table 1: Technical characteristics of the OCGT new entrant plant
Assumption Units Value Comments
Capacity MW 250 Gross capacity of the plant
Life of plant years 20 The life over which costs are recovered
Auxiliary requirements % 1 Internal energy use, difference
between gross and sent out capacity
Capacity factor % 70 Average output divided by sent out
capacity
Availability % 95 % of time when available to generate
Station Marginal Loss
Factor(MFL) 0.92
Reflects network losses incurred at the
point of injection to transmission,
average 8%
Construction period years 2 Completed and commissioned in 24
months
Sent out efficiency % 34 The conversion efficiency of gas into
electricity including internal energy use
Average sent out heat rate MJ/MWh 10,588 The MJ of gas required to produce a
MWh of electricity after internal use
The capacity factor has been set at 70%. New plant will have a high level of
availability and should be running at maximum output for a high proportion of the time
in order to meet demand. The difference between availability and capacity factor
occurs because the network is likely to have more downtime than the plant and it is
likely to be called upon to generate for less time than it is available. This assumes
that the plant has a reliable gas supply.
The Marginal Loss Factor (MLF) applied is 0.92. Under the Tariff Order covering
transmission pricing, generators are required to inject enough electricity to cover their
contract plus transmission losses. Electricity delivered by a generation company to a
distributor/retailer is calculated by multiplying the output injected at a particular point
in the network by the MLF at that point. Overall transmission losses on the Nigerian
network are currently about 8%.
The “Sent out efficiency” and “Heat rate” reflect the same parameter, which is the
efficiency of converting the thermal energy of the gas into electrical energy after the
internal use of energy (1%) in the power station.
The estimation of the generation costs of an open cycle gas turbine power station in
Nigeria is based on the estimation of the price required over the life of such a
generation project to pay all of its component costs, including fuel, operation and
maintenance, tax and a return on capital. These costs are brought together in a

Multi-Year Tariff Order (July 2008- June 2013)
13
financial model to determine the average price per unit of output that needs to be
achieved in order for all of the component costs to be met over the project’s life.
The component costs are:
• Fuel
• Capital
• Fixed and variable operation and maintenance
• Company tax
• Transmission costs
Other factors that must be determined in calculating generation cost in this way
include conversion efficiency (heat rate) and internal energy use. The capacity factor
assumed is an important factor as it determines the output over which fixed costs
such as capital can be spread.
Having determined the values to be assigned to these inputs, they are brought
together in a financial model that determines the life cycle price by calculating a price
that makes the net present value of the power station equal to zero.
The financial model used to estimate life cycle cost attempts to broadly simulate the
financial approach taken by a new entrant when making their investment decision. It
includes tax payments, a weighted average cost of capital that reflects generator
risks and the effects of other costs, such as an allowance for transmission losses.
3.1.2 Wholesale Price
The price of electricity provided by generators to distribution and retail companies will
be regulated by NERC. Contracts will be granted to generators and will cover all of
the generators’ output sold to retailer/distributors other than electricity currently
provided under Power Purchase Agreements (PPAs) and for export. Generators
include PHCN and successor PHCN generation assets as well as new Independent
Power Producers (IPPs) who begin generating after 1 July 2008.
Given the NESI’s need for reliable electricity generation NERC would not limit the
level of wholesale contracts that will be available for generation in any year during
this 5 year tariff period (1 July 2008 to 30 June 2013).
3.1.3 Existing Power Purchase Agreements
Existing PPAs with existing Independent Power Producers (IPPs) will be managed by
the Transmission System Operator (TSO) and allocated among distribution
companies. The TSO will assign these contracts among the discos in proportion to
their share of the total Nigerian (system) load.
Multi-Year Tariff Order (July 2008- June 2013)
14
3.2 Pricing of Transmission and Distribution
The building blocks approach was used as a regulatory method to set tariffs and
charges for transmission, distribution and retail activities in the MYTO. The building
blocks approach is simply a way of bringing together all of the industry’s costs in a
consistent accounting framework.
The standard building blocks used in this approach are:
• The allowed return on capital – being the return necessary to achieve a fair
(market based) rate of return on the (necessary) assets invested in the
business;
• The allowed return of capital – associated with recouping the capital over
the useful lives of the assets (depreciation); and
• Efficient operating costs and overheads.
In the MYTO the demand on the NESI as a whole was projected over the next 15
years. The costs incurred in meeting this forecast load were brought together in a
financial model using the building blocks framework to produce a 15-year tariff path
for the generation, transmission, distribution and sale of electricity. Load forecasts,
new capital expenditure, improvements in industry performance with respect to
losses and billing and revenue collection and the required return on capital and
depreciation were projected for the 15 year period for this Tariff Order
In order to calculate a projected annual value for each of the building blocks an
estimate was required for:
• The initial value of transmission and distribution capital assets;
• A particular weighted average cost of capital (WACC) to be achieved each year;
• A capital expenditure program for transmission and distribution/retail as a whole
developed from a forecast of feasible growth;
• An appropriate method of depreciation;
• An efficient level of operating expenditure and overheads; and
• A rate of improvement in industry losses covering transmission, distribution, billing
and revenue collection.
Using the building block approach, the NESI’s overall revenue requirements were
established and used as the basis for calculation of the revenue to be collected per
unit of electricity delivered to distribution from transmission and per unit of final sales.
The annual revenue requirements for transmission were divided by the annual
energy delivered to distribution in order to derive a transmission charge per unit.
Annual revenue requirements for distribution/retail were divided by the forecast level
of energy sold (and paid for) to arrive at an average tariff in Naira per kWh. This
average tariff was then converted into the industry’s standard tariff schedules for
different customer rate classes as well as the steps within each tariff class.
Multi-Year Tariff Order (July 2008- June 2013)
15
3.2.1 Transmission Prices
Transmission network users will be subject to three forms of payment for
transmission services:
• A connection charge- for new generators,
• A transmission use of system charge (TUOS) paid by distributor/retailers, and
• A loss factor applied to generation so that generators provide for transmission
losses.
This pricing structure is intended to assign charges for system use to the user or
group of users who are incurring those costs. Generators are exposed to connection
charges they may wish to choose a location that minimises these charges. Similarly,
if they are exposed to the costs associated with the losses incurred in transmitting
their generation they will have an appropriate incentive to locate so as to minimise
transmission losses. These mechanisms will begin to work more effectively when
Marginal Loss Factors (MLFs) are set for various injection points on the network.
The distributor/retailers will be effectively paying for the fixed costs of the
transmission network, analogous to paying for the power delivery system to be
available to them.
3.2.2 The Connection Charge
This is a one-off charge levied when new power stations are connecting to the
existing transmission network. It is intended to cover the costs associated with the
generator’s connection to the nearest node on the system. This might include
transmission lines and towers, a switch yard and transformer if necessary and any
additional power conditioning equipment required for safe and reliable injection of
power to the network. The connection charge covers only costs incurred between the
generator’s site and the nearest node where it is connecting to the network; costs
incurred elsewhere on the system as a result of the generator’s connection are not
included.
The one-off connection charge will vary according to where generators locate their
new plant with respect to the existing network. The charge for generators will be
calculated by TCN and approved by NERC. TCN can then proceed to build the
connection using the funds from the connection charge but if generators can get their
connection for a lower cost, or in a shorter time, by having it built by an alternative
provider to a standard acceptable to TCN then they may do so. Such a connection
shall be built to the standard required to maintain the integrity of the network at the
lowest cost.

Multi-Year Tariff Order (July 2008- June 2013)
16
3.2.3 Transmission Use of System (TUOS) Charge
The TUOS charge is to be levied on distributor/retailers and charged per unit of
energy metered to them at the bulk supply points. The TUOS charge is constructed
using a building blocks methodology, described above, bringing together existing and
forecast capital costs, an allowance for a return on capital and depreciation and
efficient operating costs
The TUOS charge is comprised of the system’s fixed charges, such as the return on
capital, depreciation and fixed operation and maintenance. The charge will be
uniform throughout Nigeria (sometimes referred to as a postage stamp tariff) and
billed monthly to distributor/retailers.
3.2.4 Transmission Line Losses
Transmission line losses vary with the position of generation with respect to load
centres. They also vary from year to year according to changes that take place
during the year in load growth and the location of new generation.
Each node on the system at which generators connect will have a loss factor
associated with it. The loss factor reflects the average losses incurred each year by
generators connecting at that point. The loss factor is called a Marginal Loss Factor
(MLF) as it is calculated by estimating the losses associated with injecting an
additional, or marginal, unit of electrical energy at that point.
In fulfilling their contracts, generators are required to make an allowance for the rate
of loss at their connection point. For example, if the loss factor at a bulk supply point
is 8% and a generator has contracts over an hour requiring 100 units then the
generator must supply 108.7 units in that hour to meet their contracts and the losses
associated with them.
3.3 Distribution/Retail Prices
Retail tariff reflects the costs of the whole supply chain for the NESI, beginning with
generation and transmission, distribution metering and billing to the final consumer.
The components of cost taken into account in constructing the retail tariff are as
follows:
• Payment for electricity supplied into the transmission network.
• Payment of a Transmission Use of System (TUOS) charge to TCN for each MWh
delivered to the distributor/retailer’s bulk supply point(s).
• The cost of electricity distribution through the local distribution network owned and
operated by the distributor/retailer.
• The cost of marketing, metering, billing and revenue collection (retailing).
• Administration, market operation and regulatory charges collected by the MO.

Multi-Year Tariff Order (July 2008- June 2013)
17
• Payments or distributions, administered through the MO to provide for a national
uniform tariff.
• In the years 2008, 2009 and 2010, payments from the FGN fund for tariff support
allowing for the gradual introduction of viable tariffs over 3 years.
Payments to generators are set out in NERC’s Tariff Order on Wholesale Prices.
TUOS charges are also set by NERC in the Tariff Order on Transmission Pricing.
The distribution charges cover the network component of the cost of distribution and
are calculated according to the building blocks methodology, including allowances for
a return on capital expenditure, depreciation, operation and maintenance of the
network, losses across the distribution networks and metering costs.
Retailing costs are brought into the building blocks framework as on-going operation
and administration costs and added to the costs of distribution companies to provide
an overall cost of distribution/retailing.
The capital expenditure and operation and maintenance allowance included in the
tariff calculation includes an allowance for additional meters and improvements in
metering, billing, revenue collection and human capacity building. As a consequence,
the tariff calculation also includes rates of losses that reduce each year of the Tariff
Order. The three important causes of loss for the distributor/retailers are; non-
technical losses, non-collection of amount billed and distribution technical losses.
Distribution technical losses result from line losses across the distribution network
and although they can be minimised through good management and design, they are
a feature of all distribution networks.
Non-technical losses are described as electricity lost from the system which is not
metered and not paid for. It is the most significant area of loss and a reduction of
these losses represents the single most effective strategy for improving
distributor/retailer revenues Similarly, billing losses, representing sales billed but
whose revenue has not been collected, are also a significant area of loss and a
reduction here will also help improve sales revenues.
3.4 The Treatment of Capital Expenditure
In the building blocks methodology, there are two building blocks base on capital
expenditure. The first is a cost of capital, or rate of return, and the second is a
depreciation charge, representing the decline in the value of capital stock over time.
This section explains how these two building blocks are calculated in the Tariff Order.
The cost of capital, or required rate of return, is calculated slightly differently for
generation compared to the other parts of the NESI. It is also observed as a
consequence the rate of return for this part of the NESI should reflect the somewhat
higher investment risk profile compared to the return on assets for transmission and
distribution.
The cost of capital used is a blended rate, combining the average returns to both
equity and debt. This blended industry return is referred to as the weighted average
Multi-Year Tariff Order (July 2008- June 2013)
18
cost of capital (WACC). This section also sets out the depreciation rates to be
applied to the regulated asset base to determine annual depreciation.
3.4.1 The Weighted Average Cost of Capital (WACC)
The cost of capital included in the MYTO is intended to provide a return on existing
assets and appropriate incentives for future investment. The cost of capital is an
important component of the tariff and is included in the annual revenue requirement
calculation as a return on the value of capital invested. The regulated asset value at
the start of a given year is calculated by taking the depreciated replacement cost of
capital assets at the start of the immediate proceeding twelve months and adding the
investments in new capital assets acquired during the same period.
The Capital Asset Pricing Model (CAPM) is used here to estimate a WACC for the
NESI. While this approach gives a method for estimating the average cost of capital
in a sector and is widely used by regulators, it requires consideration of volatility of
returns in the sector as well as the domestic cost of debt. Even in developed
economies the calculation of a WACC frequently requires estimation of a number of
the inputs. This is the case here and most of the inputs to the WACC calculation are,
necessarily, NERC estimates. The WACC is set at the level that attracts investment
funds to the industry but is not sufficient to produce super profits.
The CAPM provides estimates of the appropriate return on equity and debt and the
returns to equity are measured in relation to the risk premium on the equity market as
a whole.
Thus:
Re = Rf + ße (Rm – Rf) (1)
Where:
Re = equity returns;
Rf = the risk free rate observed in the market;
ße = correlation between the equity asset’s risk and overall market risk;
Rm = the return on the market portfolio, and
Rm – Rf = the market risk premium.
The WACC lies between the cost of equity and the cost of debt. The (WACC) is
calculated as:
WACC = Rd x D/(D+E) + Re x E/(D+E) (2)
Where:
D = total market value of debt;
E = total market value of equity;
Rd = the nominal cost of debt; and
Re = the nominal cost of equity.
Multi-Year Tariff Order (July 2008- June 2013)
19
This formulation does not include the effects of tax. The formulation of the WACC
that allows for the effects of taxation – specifically the corporation tax rate (Tc) – and
used extensively by regulators is as follows:
Nominal post tax WACC (w) = Re x E/V + Rd (1-Tc) x D/V (3)
Where:
Tc = the company tax rate,
V = the total market value of the business, i.e. debt plus equity.
A transformation is applied to derive an estimate of the real pre-tax WACC, as
follows:
Real pre tax WACC (RW) = [(1 + w/(1-Tc)) / (1 + i) ] - 1 (4)
Where:
w = the nominal post tax WACC, as given by equation (3), and
i = the inflation rate.
The company tax rate used is the statutory corporation rate of 32%.
3.4.2 Estimating the WACC Components
This section provides NERC’s estimates of the various components required to
calculate a WACC for the NESI. These estimates are then drawn together in a
description of the process used for the first WACC calculation.
The risk free rate
The yield on government bonds is regarded here as the risk free rate and NERC has
had regard to relevant yields on Nigerian Treasury bonds and has selected a risk free
rate of 14.8%
Many regulators use 10-year bond rates or 10-year (indexed linked) bonds or their
local equivalent. The longer term also ensures consistency with the risk free rate
used to estimate the market risk premium - that is also based on 10-year bonds.
The cost of debt
NERC adopted a nominal cost of debt of 19.29% for generation and 16.5% for
transmission and distribution reflecting current debt levels for business and project
The cost of debt is generally determined by adding a debt premium, and sometimes
a transactions cost, to the risk free rate. Thus:
Rd = Rf + DRP + DIC (5)
Where
DRP is the debt risk premium; and
DIC is the debt issuance cost

Multi-Year Tariff Order (July 2008- June 2013)
20
lending in Nigeria.
Betas
The Commission has selected a beta of 0.5 in the construction of a WACC. This is
based on the assumption that the level of risk in the regulated NESI will have a
similar relationship to market wide risk. It is understood that the electricity sector is an
infant industry where statistically significant Betas would be difficult to derive.
Beta reflects the riskiness of an asset relative to the market as a whole (usually
represented by the stock market). Equity betas will reflect the financial risk carried by
shareholders, which is in turn influenced by the level of gearing since high levels of
debt increase the risk to shareholders.
Gearing
The ratio of equity and debt is used to weight the equity and debt returns in the
WACC calculation. The Commission has selected a gearing ratio of 70:30 in the
development of the WACC for the NESI.
In Table 2 below the Commission’s calculated WACC for transmission and
distribution is shown, along with the inputs to this calculation. In Table 3 the WACC
for generation is presented with slight variations in the input, and the resulting
WACC, to reflect the slightly higher risk profile attached to investment in generation.

Multi-Year Tariff Order (July 2008- June 2013)
21
Table 2: WACC estimate for Transmission and Distribution
NERC's WACC Calculation 2008 2009 2010 2011 2012
Nominal risk free rate 14.80% 14.80% 14.80% 14.80% 13.80%
Nigeria annual inflation (long term assumption) 11.00% 11.00% 11.00% 11.00% 10.00%
Real risk free rate 3.80% 3.80% 3.80% 3.80% 3.80%
Nominal cost of debt 16.56% 16.56% 16.56% 16.56% 17.80%
Gearing (D/(D+E)) 70.00% 70.00% 70.00% 70.00% 50.00%
Asset beta 50.00% 50.00% 50.00% 50.00% 50.00%
Company tax rate 32.00% 32.00% 32.00% 32.00% 32.00%
Nominal market ROR (estimated) 22.80% 22.80% 22.80% 22.80% 21.80%
Nominal post tax WACC 13.42% 13.42% 13.42% 13.42% 14.88%
Nominal pre tax WACC 19.73% 19.73% 19.73% 19.73% 21.88%
Real pre tax WACC 7.87% 7.87% 7.87% 7.87% 10.80%
Table 3: WACC estimate for Generation
NERC’s WACC Calculation %
Nominal risk free rate 14.80
Nigeria annual inflation (long term assumption) 11.00
Real risk free rate 3.80
Nominal cost of debt 19.29
Gearing (D/(D+E)) 70.00
Asset beta 50.00
Company tax rate 32.00
Nominal market ROR (estimated) 27.00
Nominal post tax WACC 17.41
Real post tax WACC 5.84
Nominal pre tax WACC 25.72
Real pre tax WACC 13.26
3.5 The Rate of Depreciation
The optimised depreciated replacement cost (ODRC) is used to calculate the value
of TCN’s and each distributor/retailer’s capital stock and it is this value which is then
depreciated each year to calculate the value of depreciation in the annual revenue
requirement. The ODRC methodology involves:
• Escalating the cost of an asset from the year of its purchase to the year of the
tariff calculation at the inflation rate applying to the asset;
• Optimising its capacity (i.e., assuming it is the size that is needed for the job it is
required to do now); and
• Applying depreciation over the economic life of the individual asset or groups of
assets.
The depreciation schedule for regulatory purposes was applied to each group of
assets so that, to the maximum extent that is reasonable, it reflects the remaining
Multi-Year Tariff Order (July 2008- June 2013)
22
economic life of the asset or group of assets. PHCN and TCN provided capital
expenditure forecasts for distribution and transmission assets respectively and NERC
adopted these forecasts as the capital expenditure required to allow the networks to
do the job required of them in the future.
Within the life of the Tariff Order the Commission does not envisage that any
transmission or distribution assets would be reduced in value (or “optimised”)
because they are found to be in excess of what is required now to do their job. The
rationale for this is that currently there is a severe deficit of reliable network
infrastructure in the NESI and the transmission and distribution networks will be used
to the fullest. While this is the case at present the ODRC approach can help to
prevent expenditure on “gold-plating” (or over spending on) assets to find its way into
the regulated annual revenue requirement and NERC will continue to examine capital
expenditure to make sure that this does not happen.
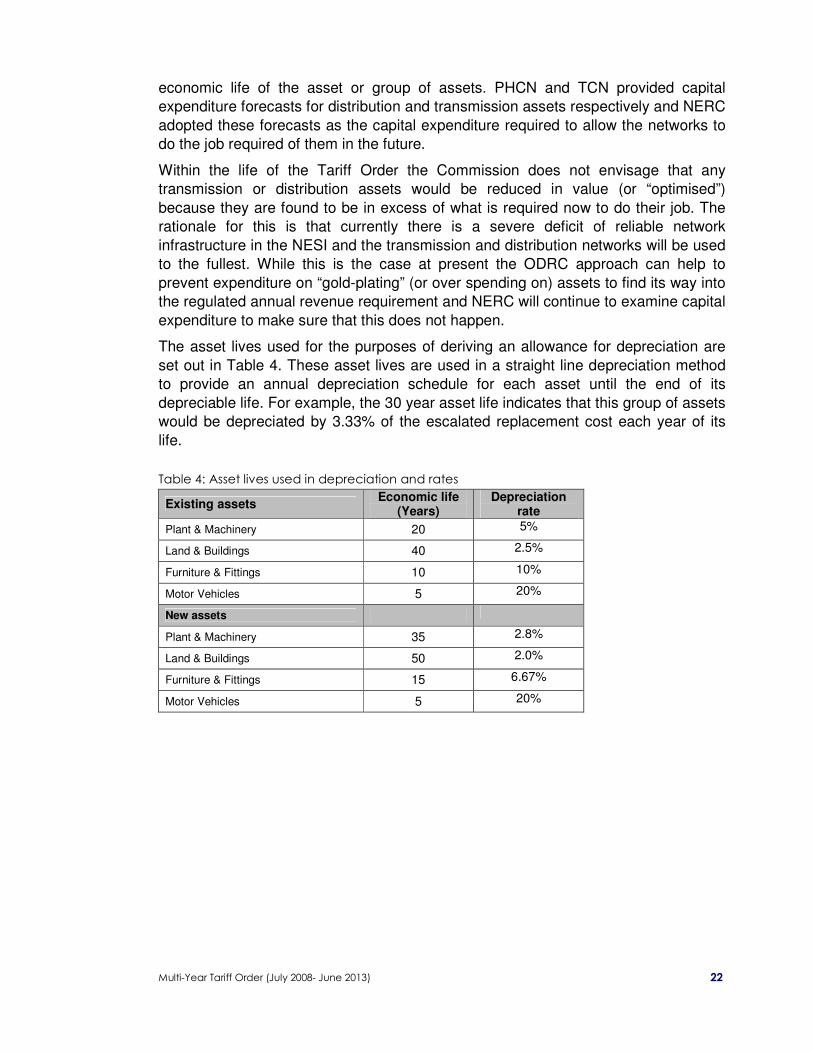
The asset lives used for the purposes of deriving an allowance for depreciation are
set out in Table 4. These asset lives are used in a straight line depreciation method
to provide an annual depreciation schedule for each asset until the end of its
depreciable life. For example, the 30 year asset life indicates that this group of assets
would be depreciated by 3.33% of the escalated replacement cost each year of its
life.
Table 4: Asset lives used in depreciation and rates
Existing assets Economic life
(Years) Depreciation
rate
Plant & Machinery 20 5%
Land & Buildings 40 2.5%
Furniture & Fittings 10 10%
Motor Vehicles 5 20%
New assets
Plant & Machinery 35 2.8%
Land & Buildings 50 2.0%
Furniture & Fittings 15 6.67%
Motor Vehicles 5 20%
Multi-Year Tariff Order (July 2008- June 2013)
23
4 ORDERS ON TARIFF RATES
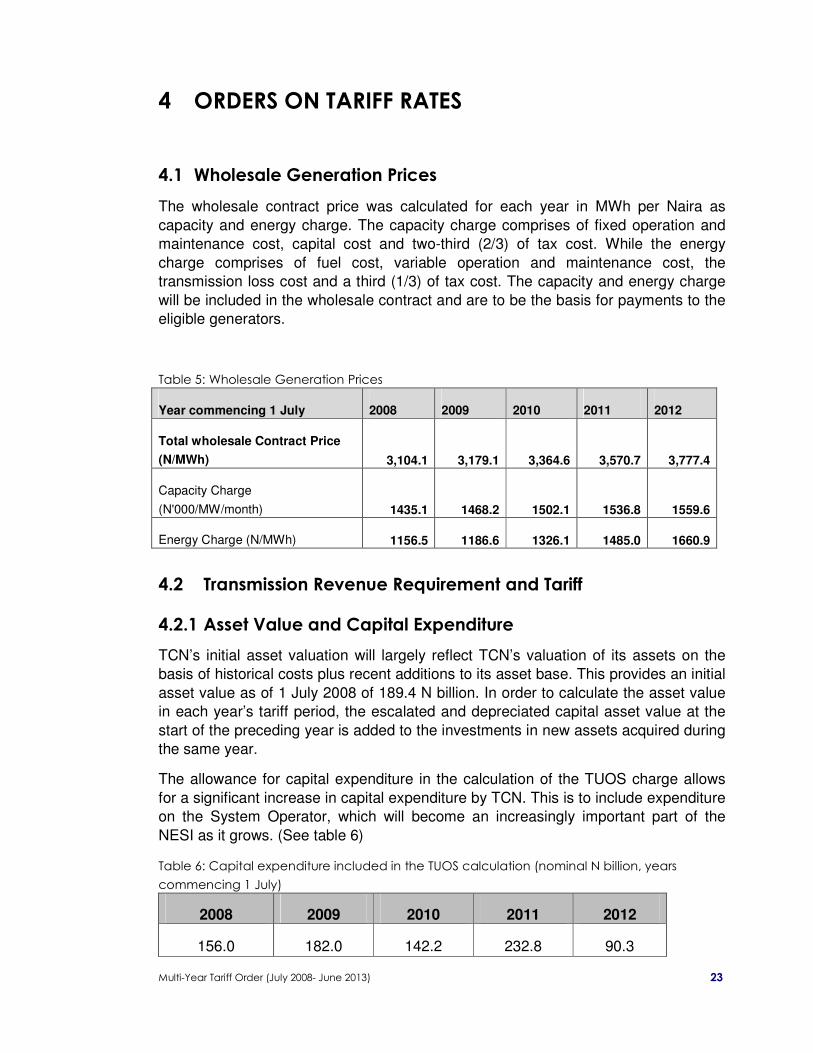
4.1 Wholesale Generation Prices
The wholesale contract price was calculated for each year in MWh per Naira as
capacity and energy charge. The capacity charge comprises of fixed operation and
maintenance cost, capital cost and two-third (2/3) of tax cost. While the energy
charge comprises of fuel cost, variable operation and maintenance cost, the
transmission loss cost and a third (1/3) of tax cost. The capacity and energy charge
will be included in the wholesale contract and are to be the basis for payments to the
eligible generators.
Table 5: Wholesale Generation Prices
Year commencing 1 July 2008 2009 2010 2011 2012
Total wholesale Contract Price
(N/MWh) 3,104.1 3,179.1 3,364.6 3,570.7 3,777.4
Capacity Charge
(N'000/MW/month) 1435.1 1468.2 1502.1 1536.8 1559.6
Energy Charge (N/MWh) 1156.5 1186.6 1326.1 1485.0 1660.9
4.2 Transmission Revenue Requirement and Tariff
4.2.1 Asset Value and Capital Expenditure
TCN’s initial asset valuation will largely reflect TCN’s valuation of its assets on the
basis of historical costs plus recent additions to its asset base. This provides an initial
asset value as of 1 July 2008 of 189.4 N billion. In order to calculate the asset value
in each year’s tariff period, the escalated and depreciated capital asset value at the
start of the preceding year is added to the investments in new assets acquired during
the same year.
The allowance for capital expenditure in the calculation of the TUOS charge allows
for a significant increase in capital expenditure by TCN. This is to include expenditure
on the System Operator, which will become an increasingly important part of the
NESI as it grows. (See table 6)
Table 6: Capital expenditure included in the TUOS calculation (nominal N billion, years
commencing 1 July)
2008 2009 2010 2011 2012
156.0 182.0 142.2 232.8 90.3
Multi-Year Tariff Order (July 2008- June 2013)
24
4.2.2 Transmission Use Of System (TUOS) Charges
TCN will be required to pay a number of institutional charges in order to cover the
cost of industry bodies. These institutional charges are as follows:
• PHCN Headquarters charge, which is intended to cover the temporary staffing
and operations of PHCN during the transition period. The PHCN Headquarters
charges are shown in Table 7 below. It is charged against energy leaving the
transmission system and delivered to the distributor/retailers at their bulk supply
points.
• The Regulatory charge, which for now covers part of the cost of NERC’s
operations in regulating TCN.
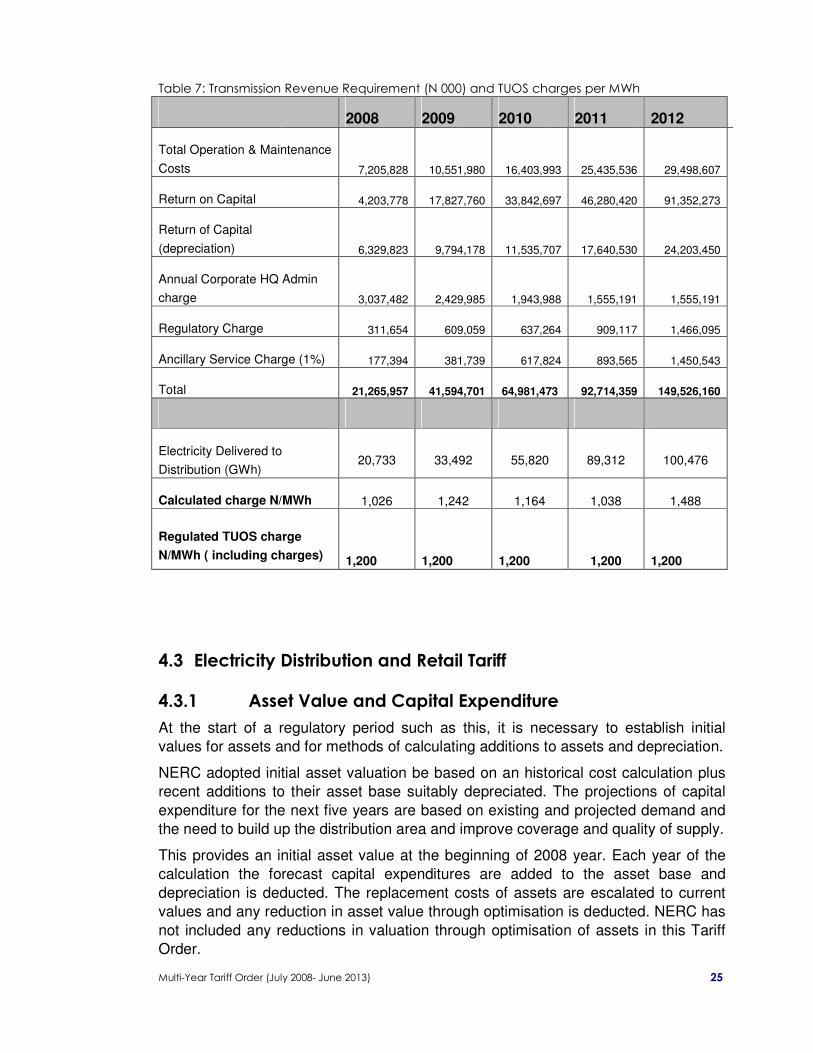
Table 7 below shows the annual costs that have been allowed by NERC for each
year of the TUOS calculation, including the institutional charges set out above. The
table shows the revenue requirement from the 3 building blocks (operation and
maintenance, return on capital and depreciation) plus the costs associated with
institutional charges.
These costs are brought together and aggregated to a total annual revenue
requirement each year. This annual revenue requirement is then divided by the
forecast energy transmitted through the transmission network and delivered to
distributor/retailers each year to produce the estimated costs per unit of transmission.
At the transmission stage an additional levy of 1% is collected for payment to the MO
to contract for ancillary services. This will be paid through the TUOS charge and
collected by the MO for use in purchasing these services only. If this fund proves too
much the MO will allow the fund to accumulate over time and the rate of payment can
be adjusted at the next major review in 2012.
This cost is high in the first 2 years of the tariff order and then declines to 2011 and
increases again in 2012. These variations in the estimated cost per unit over time
reflect the different capital expenditures and the growth in energy transmitted each
year. NERC has determined that this charge will be averaged across the 5 year
period and set at a constant level each year of 1,200 N/MWh, which is NERC’s
determined TUOS charge for the period 1 July 2008 to 30 June 2013, including an
allowance for regulatory and HQ charges.
Multi-Year Tariff Order (July 2008- June 2013)
25
Table 7: Transmission Revenue Requirement (N 000) and TUOS charges per MWh
2008 2009 2010 2011 2012
Total Operation & Maintenance
Costs 7,205,828 10,551,980 16,403,993 25,435,536 29,498,607
Return on Capital 4,203,778 17,827,760 33,842,697 46,280,420 91,352,273
Return of Capital
(depreciation) 6,329,823 9,794,178 11,535,707 17,640,530 24,203,450
Annual Corporate HQ Admin
charge 3,037,482 2,429,985 1,943,988 1,555,191 1,555,191
Regulatory Charge 311,654 609,059 637,264 909,117 1,466,095
Ancillary Service Charge (1%) 177,394 381,739 617,824 893,565 1,450,543
Total 21,265,957 41,594,701 64,981,473 92,714,359 149,526,160
Electricity Delivered to
Distribution (GWh) 20,733 33,492 55,820 89,312 100,476
Calculated charge N/MWh 1,026 1,242 1,164 1,038 1,488
Regulated TUOS charge
N/MWh ( including charges)
1,200
1,200
1,200
1,200
1,200
4.3 Electricity Distribution and Retail Tariff
4.3.1 Asset Value and Capital Expenditure
At the start of a regulatory period such as this, it is necessary to establish initial
values for assets and for methods of calculating additions to assets and depreciation.
NERC adopted initial asset valuation be based on an historical cost calculation plus
recent additions to their asset base suitably depreciated. The projections of capital
expenditure for the next five years are based on existing and projected demand and
the need to build up the distribution area and improve coverage and quality of supply.
This provides an initial asset value at the beginning of 2008 year. Each year of the
calculation the forecast capital expenditures are added to the asset base and
depreciation is deducted. The replacement costs of assets are escalated to current
values and any reduction in asset value through optimisation is deducted. NERC has
not included any reductions in valuation through optimisation of assets in this Tariff
Order.
Multi-Year Tariff Order (July 2008- June 2013)
26
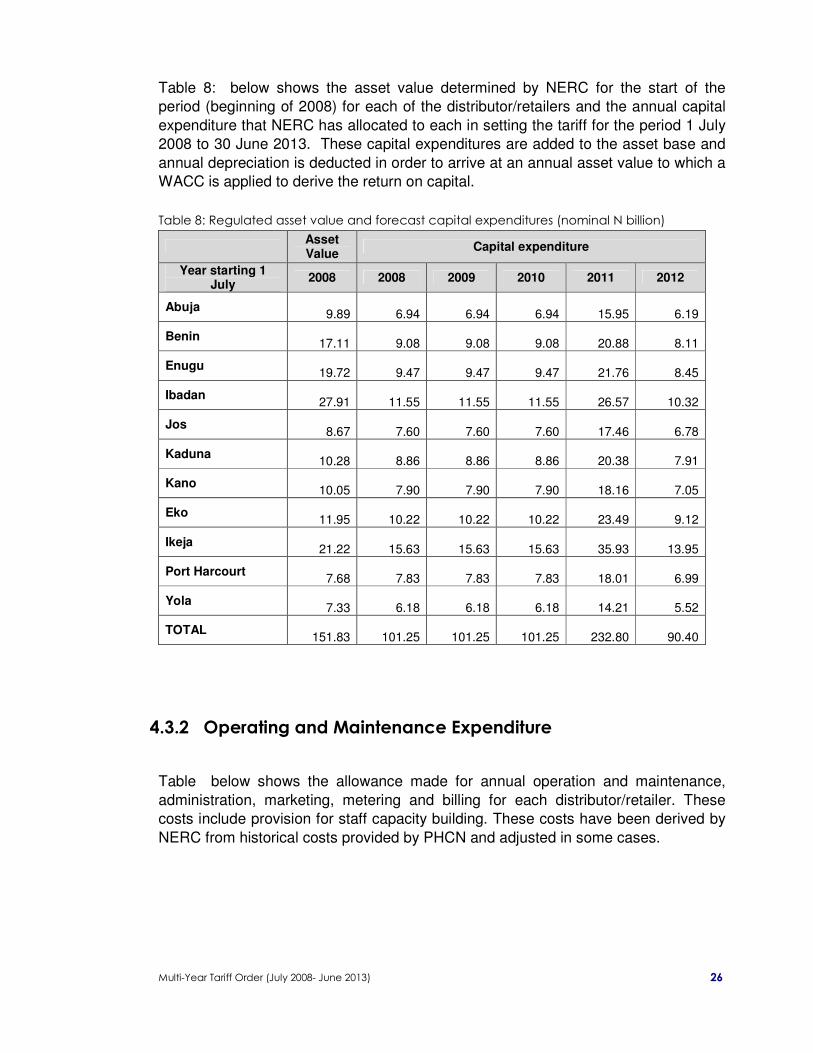
Table 8: below shows the asset value determined by NERC for the start of the
period (beginning of 2008) for each of the distributor/retailers and the annual capital
expenditure that NERC has allocated to each in setting the tariff for the period 1 July
2008 to 30 June 2013. These capital expenditures are added to the asset base and
annual depreciation is deducted in order to arrive at an annual asset value to which a
WACC is applied to derive the return on capital.
Table 8: Regulated asset value and forecast capital expenditures (nominal N billion)
Asset Value
Capital expenditure
Year starting 1 July
2008 2008 2009 2010 2011 2012
Abuja 9.89
6.94
6.94
6.94
15.95
6.19
Benin 17.11
9.08
9.08
9.08
20.88
8.11
Enugu 19.72
9.47
9.47
9.47
21.76
8.45
Ibadan 27.91
11.55
11.55
11.55
26.57
10.32
Jos 8.67
7.60
7.60
7.60
17.46
6.78
Kaduna 10.28
8.86
8.86
8.86
20.38
7.91
Kano 10.05
7.90
7.90
7.90
18.16
7.05
Eko 11.95
10.22
10.22
10.22
23.49
9.12
Ikeja 21.22
15.63
15.63
15.63
35.93
13.95
Port Harcourt 7.68
7.83
7.83
7.83
18.01
6.99
Yola 7.33
6.18
6.18
6.18
14.21
5.52
TOTAL 151.83
101.25
101.25
101.25
232.80
90.40
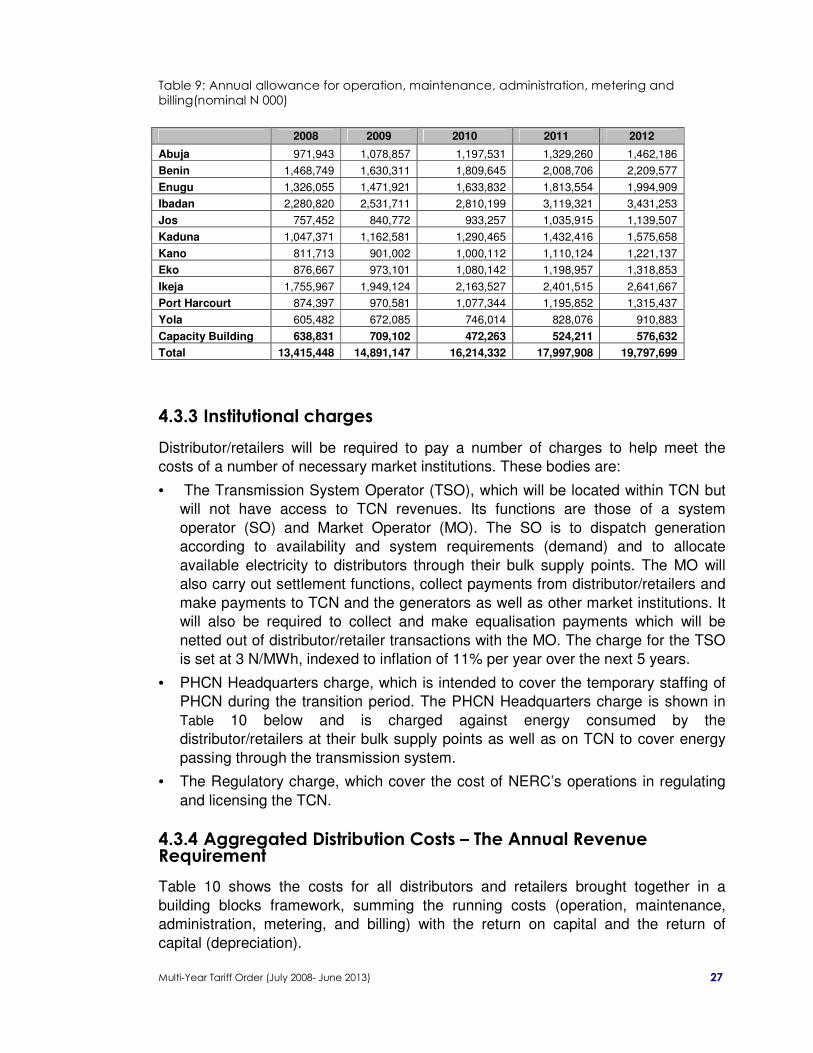
4.3.2 Operating and Maintenance Expenditure
Table below shows the allowance made for annual operation and maintenance,
administration, marketing, metering and billing for each distributor/retailer. These
costs include provision for staff capacity building. These costs have been derived by
NERC from historical costs provided by PHCN and adjusted in some cases.
Multi-Year Tariff Order (July 2008- June 2013)
27
Table 9: Annual allowance for operation, maintenance, administration, metering and billing(nominal N 000)
4.3.3 Institutional charges
Distributor/retailers will be required to pay a number of charges to help meet the
costs of a number of necessary market institutions. These bodies are:
• The Transmission System Operator (TSO), which will be located within TCN but
will not have access to TCN revenues. Its functions are those of a system
operator (SO) and Market Operator (MO). The SO is to dispatch generation
according to availability and system requirements (demand) and to allocate
available electricity to distributors through their bulk supply points. The MO will
also carry out settlement functions, collect payments from distributor/retailers and
make payments to TCN and the generators as well as other market institutions. It
will also be required to collect and make equalisation payments which will be
netted out of distributor/retailer transactions with the MO. The charge for the TSO
is set at 3 N/MWh, indexed to inflation of 11% per year over the next 5 years.
• PHCN Headquarters charge, which is intended to cover the temporary staffing of
PHCN during the transition period. The PHCN Headquarters charge is shown in
Table 10 below and is charged against energy consumed by the
distributor/retailers at their bulk supply points as well as on TCN to cover energy
passing through the transmission system.
• The Regulatory charge, which cover the cost of NERC’s operations in regulating
and licensing the TCN.
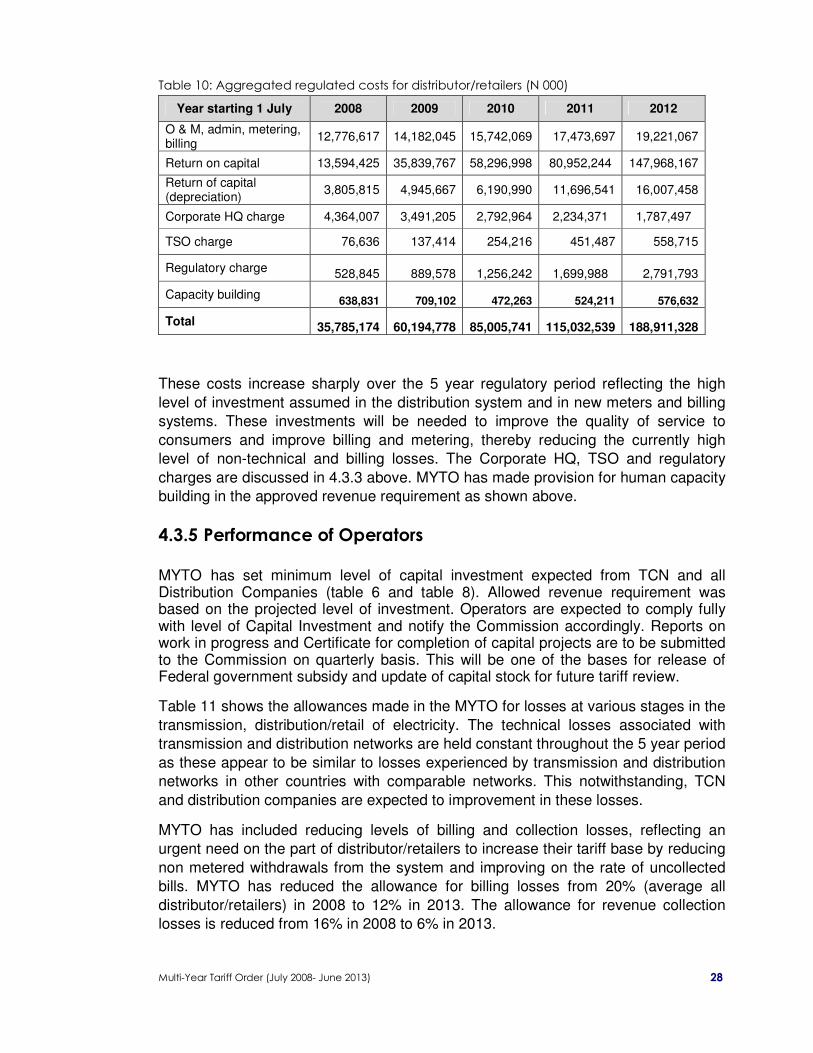
4.3.4 Aggregated Distribution Costs – The Annual Revenue Requirement
Table 10 shows the costs for all distributors and retailers brought together in a
building blocks framework, summing the running costs (operation, maintenance,
administration, metering, and billing) with the return on capital and the return of
capital (depreciation).
2008 2009 2010 2011 2012
Abuja 971,943 1,078,857 1,197,531 1,329,260 1,462,186
Benin 1,468,749 1,630,311 1,809,645 2,008,706 2,209,577
Enugu 1,326,055 1,471,921 1,633,832 1,813,554 1,994,909
Ibadan 2,280,820 2,531,711 2,810,199 3,119,321 3,431,253
Jos 757,452 840,772 933,257 1,035,915 1,139,507
Kaduna 1,047,371 1,162,581 1,290,465 1,432,416 1,575,658
Kano 811,713 901,002 1,000,112 1,110,124 1,221,137
Eko 876,667 973,101 1,080,142 1,198,957 1,318,853
Ikeja 1,755,967 1,949,124 2,163,527 2,401,515 2,641,667
Port Harcourt 874,397 970,581 1,077,344 1,195,852 1,315,437
Yola 605,482 672,085 746,014 828,076 910,883
Capacity Building 638,831 709,102 472,263 524,211 576,632
Total 13,415,448 14,891,147 16,214,332 17,997,908 19,797,699
Multi-Year Tariff Order (July 2008- June 2013)
28
Table 10: Aggregated regulated costs for distributor/retailers (N 000)
Year starting 1 July 2008 2009 2010 2011 2012
O & M, admin, metering, billing
12,776,617 14,182,045 15,742,069 17,473,697 19,221,067
Return on capital 13,594,425 35,839,767 58,296,998 80,952,244 147,968,167
Return of capital (depreciation)
3,805,815 4,945,667 6,190,990 11,696,541 16,007,458
Corporate HQ charge 4,364,007 3,491,205 2,792,964 2,234,371 1,787,497
TSO charge 76,636 137,414 254,216 451,487 558,715
Regulatory charge 528,845 889,578 1,256,242 1,699,988 2,791,793
Capacity building 638,831 709,102 472,263 524,211 576,632
Total 35,785,174 60,194,778 85,005,741 115,032,539 188,911,328
These costs increase sharply over the 5 year regulatory period reflecting the high
level of investment assumed in the distribution system and in new meters and billing
systems. These investments will be needed to improve the quality of service to
consumers and improve billing and metering, thereby reducing the currently high
level of non-technical and billing losses. The Corporate HQ, TSO and regulatory
charges are discussed in 4.3.3 above. MYTO has made provision for human capacity
building in the approved revenue requirement as shown above.
4.3.5 Performance of Operators
MYTO has set minimum level of capital investment expected from TCN and all Distribution Companies (table 6 and table 8). Allowed revenue requirement was based on the projected level of investment. Operators are expected to comply fully with level of Capital Investment and notify the Commission accordingly. Reports on work in progress and Certificate for completion of capital projects are to be submitted to the Commission on quarterly basis. This will be one of the bases for release of Federal government subsidy and update of capital stock for future tariff review.
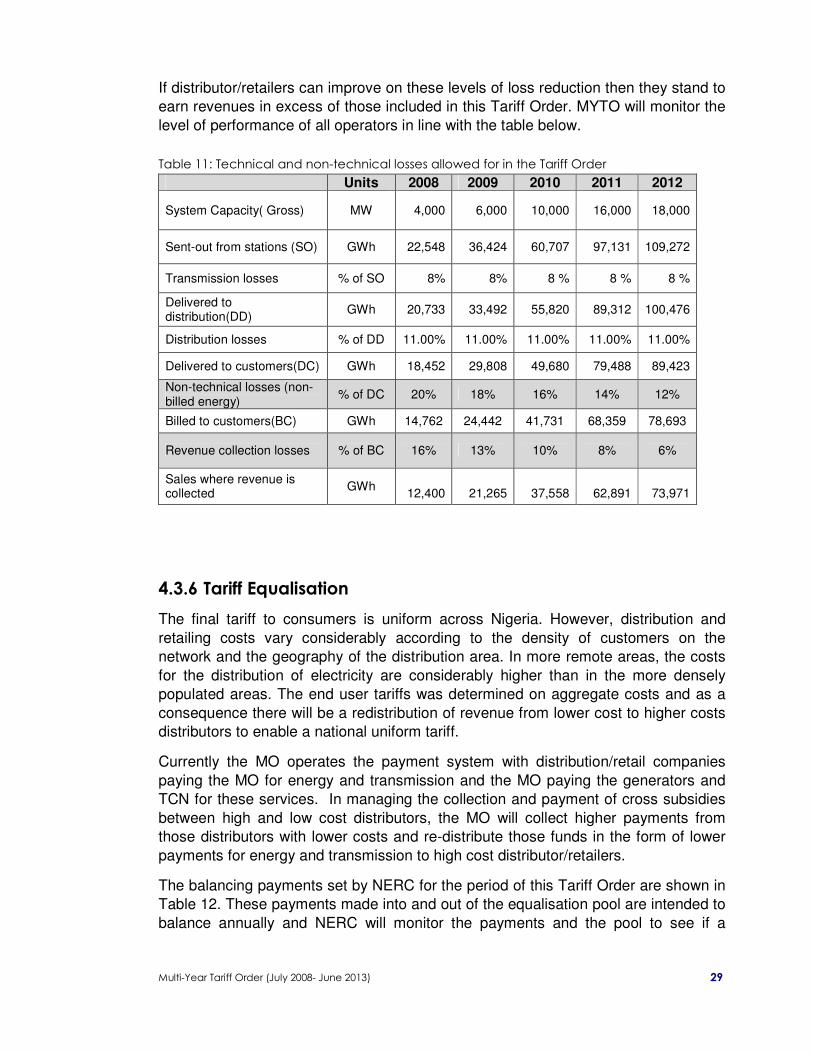
Table 11 shows the allowances made in the MYTO for losses at various stages in the
transmission, distribution/retail of electricity. The technical losses associated with
transmission and distribution networks are held constant throughout the 5 year period
as these appear to be similar to losses experienced by transmission and distribution
networks in other countries with comparable networks. This notwithstanding, TCN
and distribution companies are expected to improvement in these losses.
MYTO has included reducing levels of billing and collection losses, reflecting an
urgent need on the part of distributor/retailers to increase their tariff base by reducing
non metered withdrawals from the system and improving on the rate of uncollected
bills. MYTO has reduced the allowance for billing losses from 20% (average all
distributor/retailers) in 2008 to 12% in 2013. The allowance for revenue collection
losses is reduced from 16% in 2008 to 6% in 2013.
Multi-Year Tariff Order (July 2008- June 2013)
29
If distributor/retailers can improve on these levels of loss reduction then they stand to
earn revenues in excess of those included in this Tariff Order. MYTO will monitor the
level of performance of all operators in line with the table below.
Table 11: Technical and non-technical losses allowed for in the Tariff Order
Units 2008 2009 2010 2011 2012
System Capacity( Gross) MW 4,000 6,000 10,000 16,000 18,000
Sent-out from stations (SO) GWh 22,548 36,424 60,707 97,131 109,272
Transmission losses % of SO 8% 8% 8 % 8 % 8 %
Delivered to distribution(DD)
GWh 20,733 33,492 55,820 89,312 100,476
Distribution losses % of DD 11.00% 11.00% 11.00% 11.00% 11.00%
Delivered to customers(DC) GWh 18,452 29,808 49,680 79,488 89,423
Non-technical losses (non-billed energy)
% of DC 20% 18% 16% 14% 12%
Billed to customers(BC) GWh 14,762 24,442 41,731 68,359 78,693
Revenue collection losses % of BC 16% 13% 10% 8% 6%
Sales where revenue is collected
GWh
12,400
21,265
37,558
62,891
73,971
4.3.6 Tariff Equalisation
The final tariff to consumers is uniform across Nigeria. However, distribution and
retailing costs vary considerably according to the density of customers on the
network and the geography of the distribution area. In more remote areas, the costs
for the distribution of electricity are considerably higher than in the more densely
populated areas. The end user tariffs was determined on aggregate costs and as a
consequence there will be a redistribution of revenue from lower cost to higher costs
distributors to enable a national uniform tariff.
Currently the MO operates the payment system with distribution/retail companies
paying the MO for energy and transmission and the MO paying the generators and
TCN for these services. In managing the collection and payment of cross subsidies
between high and low cost distributors, the MO will collect higher payments from
those distributors with lower costs and re-distribute those funds in the form of lower
payments for energy and transmission to high cost distributor/retailers.
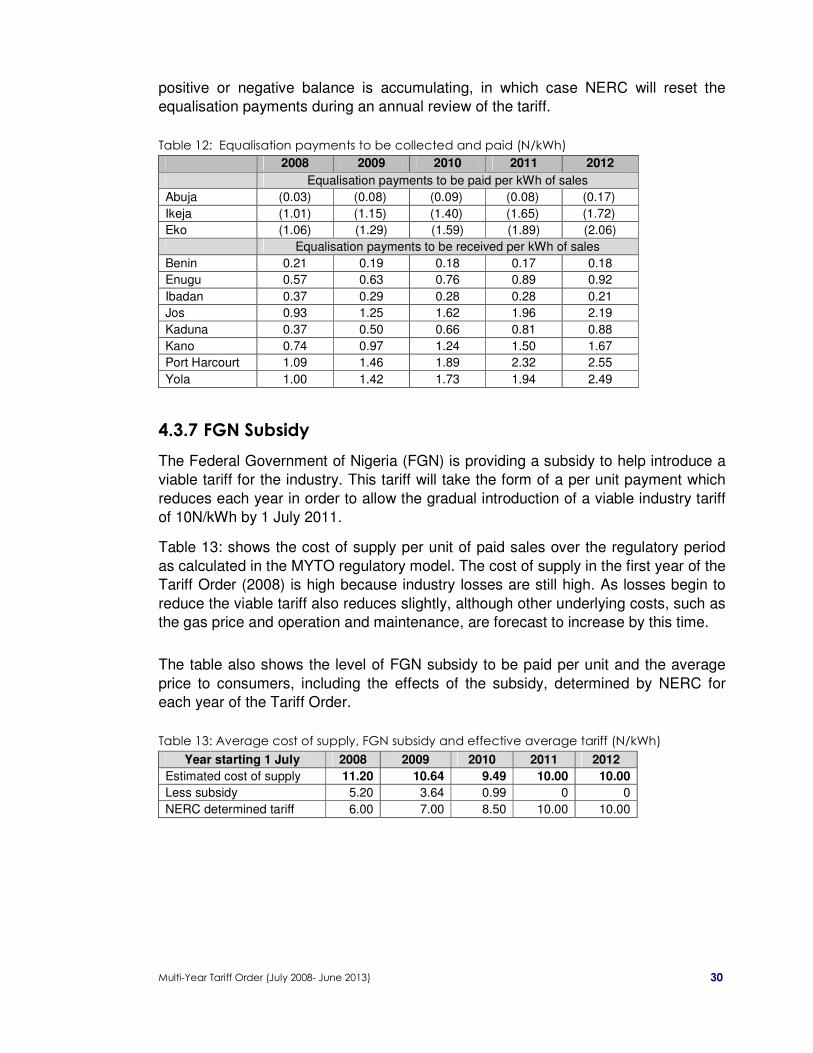
The balancing payments set by NERC for the period of this Tariff Order are shown in
Table 12. These payments made into and out of the equalisation pool are intended to
balance annually and NERC will monitor the payments and the pool to see if a
Multi-Year Tariff Order (July 2008- June 2013)
30
positive or negative balance is accumulating, in which case NERC will reset the
equalisation payments during an annual review of the tariff.
Table 12: Equalisation payments to be collected and paid (N/kWh)
2008 2009 2010 2011 2012
Equalisation payments to be paid per kWh of sales
Abuja (0.03) (0.08) (0.09) (0.08) (0.17)
Ikeja (1.01) (1.15) (1.40) (1.65) (1.72)
Eko (1.06) (1.29) (1.59) (1.89) (2.06)
Equalisation payments to be received per kWh of sales
Benin 0.21 0.19 0.18 0.17 0.18
Enugu 0.57 0.63 0.76 0.89 0.92
Ibadan 0.37 0.29 0.28 0.28 0.21
Jos 0.93 1.25 1.62 1.96 2.19
Kaduna 0.37 0.50 0.66 0.81 0.88
Kano 0.74 0.97 1.24 1.50 1.67
Port Harcourt 1.09 1.46 1.89 2.32 2.55
Yola 1.00 1.42 1.73 1.94 2.49
4.3.7 FGN Subsidy
The Federal Government of Nigeria (FGN) is providing a subsidy to help introduce a
viable tariff for the industry. This tariff will take the form of a per unit payment which
reduces each year in order to allow the gradual introduction of a viable industry tariff
of 10N/kWh by 1 July 2011.
Table 13: shows the cost of supply per unit of paid sales over the regulatory period
as calculated in the MYTO regulatory model. The cost of supply in the first year of the
Tariff Order (2008) is high because industry losses are still high. As losses begin to
reduce the viable tariff also reduces slightly, although other underlying costs, such as
the gas price and operation and maintenance, are forecast to increase by this time.
The table also shows the level of FGN subsidy to be paid per unit and the average
price to consumers, including the effects of the subsidy, determined by NERC for
each year of the Tariff Order.
Table 13: Average cost of supply, FGN subsidy and effective average tariff (N/kWh)
Year starting 1 July 2008 2009 2010 2011 2012
Estimated cost of supply 11.20 10.64 9.49 10.00 10.00
Less subsidy 5.20 3.64 0.99 0 0
NERC determined tariff 6.00 7.00 8.50 10.00 10.00
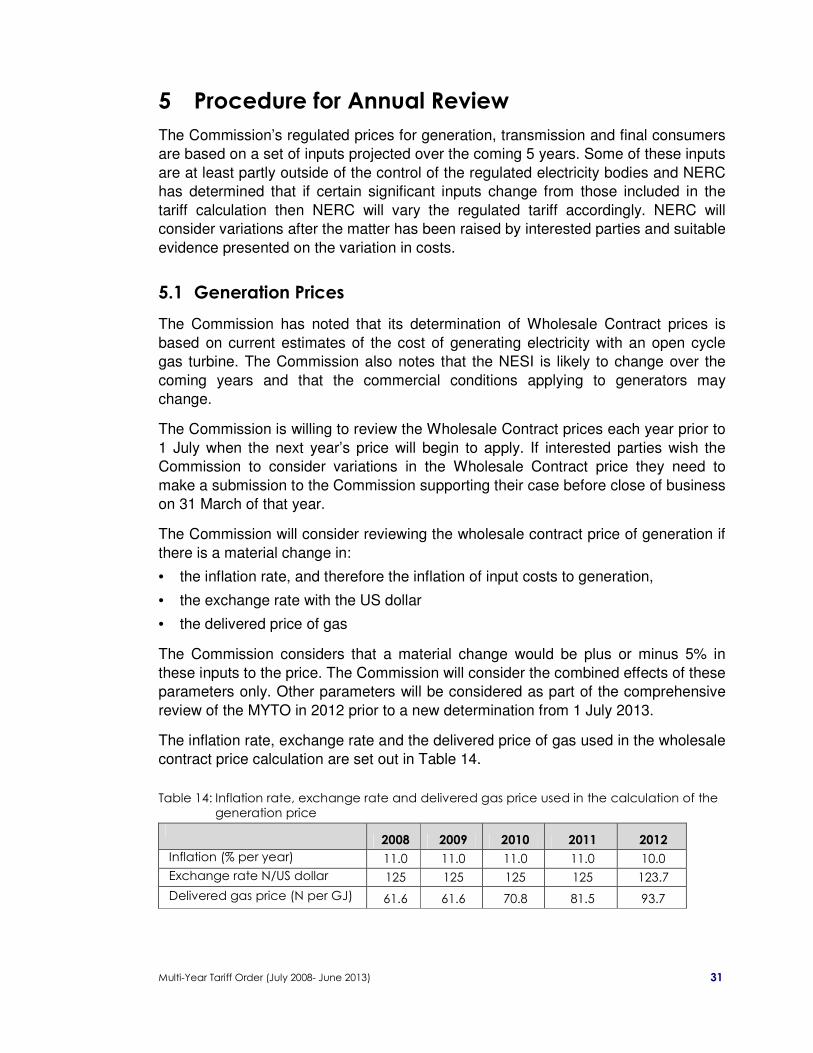
Multi-Year Tariff Order (July 2008- June 2013)
31
5 Procedure for Annual Review
The Commission’s regulated prices for generation, transmission and final consumers
are based on a set of inputs projected over the coming 5 years. Some of these inputs
are at least partly outside of the control of the regulated electricity bodies and NERC
has determined that if certain significant inputs change from those included in the
tariff calculation then NERC will vary the regulated tariff accordingly. NERC will
consider variations after the matter has been raised by interested parties and suitable
evidence presented on the variation in costs.
5.1 Generation Prices
The Commission has noted that its determination of Wholesale Contract prices is
based on current estimates of the cost of generating electricity with an open cycle
gas turbine. The Commission also notes that the NESI is likely to change over the
coming years and that the commercial conditions applying to generators may
change.
The Commission is willing to review the Wholesale Contract prices each year prior to
1 July when the next year’s price will begin to apply. If interested parties wish the
Commission to consider variations in the Wholesale Contract price they need to
make a submission to the Commission supporting their case before close of business
on 31 March of that year.
The Commission will consider reviewing the wholesale contract price of generation if
there is a material change in:
• the inflation rate, and therefore the inflation of input costs to generation,
• the exchange rate with the US dollar
• the delivered price of gas
The Commission considers that a material change would be plus or minus 5% in
these inputs to the price. The Commission will consider the combined effects of these
parameters only. Other parameters will be considered as part of the comprehensive
review of the MYTO in 2012 prior to a new determination from 1 July 2013.
The inflation rate, exchange rate and the delivered price of gas used in the wholesale
contract price calculation are set out in Table 14.
Table 14: Inflation rate, exchange rate and delivered gas price used in the calculation of the generation price
2008 2009 2010 2011 2012
Inflation (% per year) 11.0 11.0 11.0 11.0 10.0
Exchange rate N/US dollar 125 125 125 125 123.7
Delivered gas price (N per GJ) 61.6 61.6 70.8 81.5 93.7
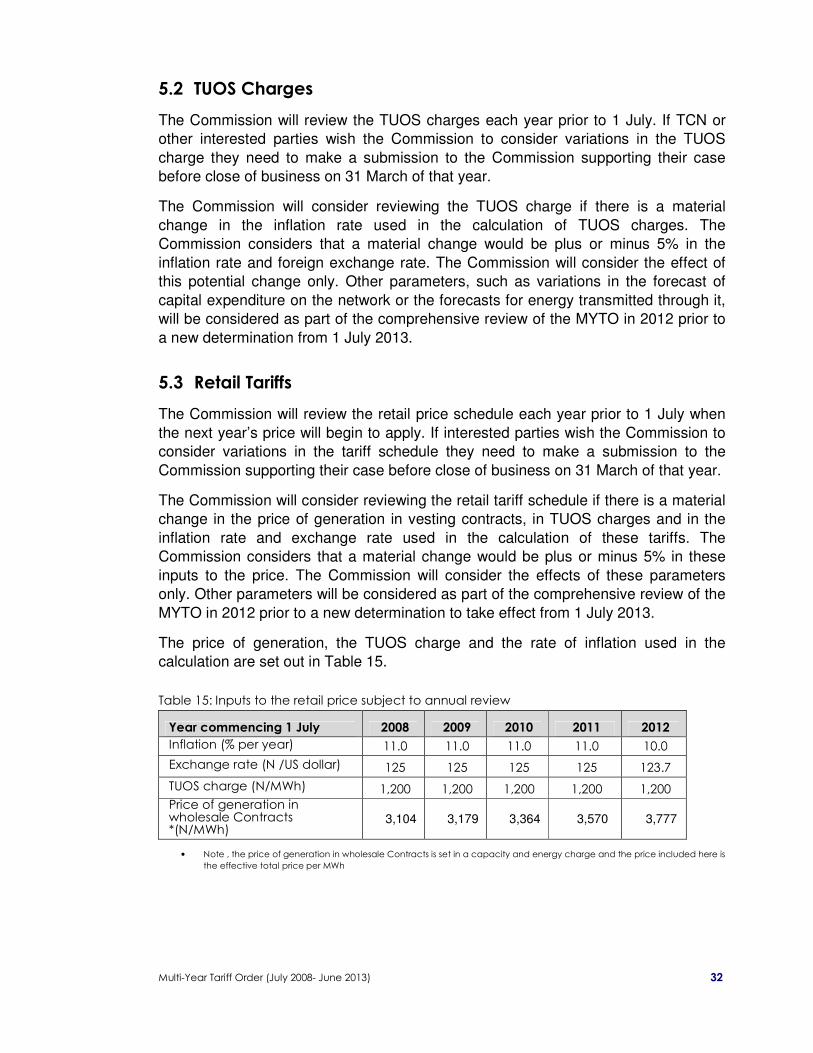
Multi-Year Tariff Order (July 2008- June 2013)
32
5.2 TUOS Charges
The Commission will review the TUOS charges each year prior to 1 July. If TCN or
other interested parties wish the Commission to consider variations in the TUOS
charge they need to make a submission to the Commission supporting their case
before close of business on 31 March of that year.
The Commission will consider reviewing the TUOS charge if there is a material
change in the inflation rate used in the calculation of TUOS charges. The
Commission considers that a material change would be plus or minus 5% in the
inflation rate and foreign exchange rate. The Commission will consider the effect of
this potential change only. Other parameters, such as variations in the forecast of
capital expenditure on the network or the forecasts for energy transmitted through it,
will be considered as part of the comprehensive review of the MYTO in 2012 prior to
a new determination from 1 July 2013.
5.3 Retail Tariffs
The Commission will review the retail price schedule each year prior to 1 July when
the next year’s price will begin to apply. If interested parties wish the Commission to
consider variations in the tariff schedule they need to make a submission to the
Commission supporting their case before close of business on 31 March of that year.
The Commission will consider reviewing the retail tariff schedule if there is a material
change in the price of generation in vesting contracts, in TUOS charges and in the
inflation rate and exchange rate used in the calculation of these tariffs. The
Commission considers that a material change would be plus or minus 5% in these
inputs to the price. The Commission will consider the effects of these parameters
only. Other parameters will be considered as part of the comprehensive review of the
MYTO in 2012 prior to a new determination to take effect from 1 July 2013.
The price of generation, the TUOS charge and the rate of inflation used in the
calculation are set out in Table 15.
Table 15: Inputs to the retail price subject to annual review
Year commencing 1 July 2008 2009 2010 2011 2012
Inflation (% per year) 11.0 11.0 11.0 11.0 10.0
Exchange rate (N /US dollar) 125 125 125 125 123.7
TUOS charge (N/MWh) 1,200 1,200 1,200 1,200 1,200
Price of generation in wholesale Contracts *(N/MWh)
3,104 3,179 3,364 3,570 3,777
• Note , the price of generation in wholesale Contracts is set in a capacity and energy charge and the price included here is
the effective total price per MWh
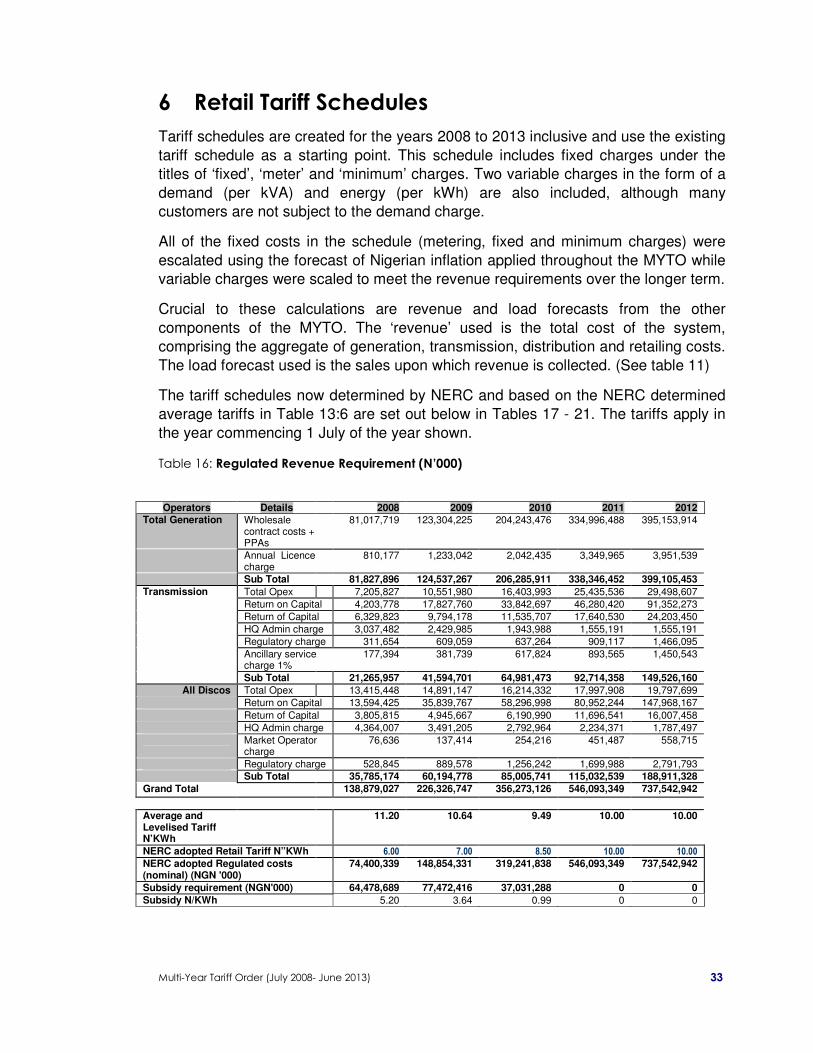
Multi-Year Tariff Order (July 2008- June 2013)
33
6 Retail Tariff Schedules
Tariff schedules are created for the years 2008 to 2013 inclusive and use the existing
tariff schedule as a starting point. This schedule includes fixed charges under the
titles of ‘fixed’, ‘meter’ and ‘minimum’ charges. Two variable charges in the form of a
demand (per kVA) and energy (per kWh) are also included, although many
customers are not subject to the demand charge.
All of the fixed costs in the schedule (metering, fixed and minimum charges) were
escalated using the forecast of Nigerian inflation applied throughout the MYTO while
variable charges were scaled to meet the revenue requirements over the longer term.
Crucial to these calculations are revenue and load forecasts from the other
components of the MYTO. The ‘revenue’ used is the total cost of the system,
comprising the aggregate of generation, transmission, distribution and retailing costs.
The load forecast used is the sales upon which revenue is collected. (See table 11)
The tariff schedules now determined by NERC and based on the NERC determined
average tariffs in Table 13:6 are set out below in Tables 17 - 21. The tariffs apply in
the year commencing 1 July of the year shown.
Table 16: Regulated Revenue Requirement (N’000)
Operators Details 2008 2009 2010 2011 2012
Total Generation Wholesale contract costs + PPAs
81,017,719 123,304,225 204,243,476 334,996,488 395,153,914
Annual Licence charge
810,177 1,233,042 2,042,435 3,349,965 3,951,539
Sub Total 81,827,896 124,537,267 206,285,911 338,346,452 399,105,453
Transmission Total Opex 7,205,827 10,551,980 16,403,993 25,435,536 29,498,607
Return on Capital 4,203,778 17,827,760 33,842,697 46,280,420 91,352,273
Return of Capital 6,329,823 9,794,178 11,535,707 17,640,530 24,203,450
HQ Admin charge 3,037,482 2,429,985 1,943,988 1,555,191 1,555,191
Regulatory charge 311,654 609,059 637,264 909,117 1,466,095
Ancillary service charge 1%
177,394 381,739 617,824 893,565 1,450,543
Sub Total 21,265,957 41,594,701 64,981,473 92,714,358 149,526,160
All Discos Total Opex 13,415,448 14,891,147 16,214,332 17,997,908 19,797,699
Return on Capital 13,594,425 35,839,767 58,296,998 80,952,244 147,968,167
Return of Capital 3,805,815 4,945,667 6,190,990 11,696,541 16,007,458
HQ Admin charge 4,364,007 3,491,205 2,792,964 2,234,371 1,787,497
Market Operator charge
76,636 137,414 254,216 451,487 558,715
Regulatory charge 528,845 889,578 1,256,242 1,699,988 2,791,793
Sub Total 35,785,174 60,194,778 85,005,741 115,032,539 188,911,328
Grand Total 138,879,027 226,326,747 356,273,126 546,093,349 737,542,942
Average and Levelised Tariff N’KWh
11.20 10.64 9.49 10.00 10.00
NERC adopted Retail Tariff N”KWh 6.00 7.00 8.50 10.00 10.00
NERC adopted Regulated costs (nominal) (NGN '000)
74,400,339 148,854,331 319,241,838 546,093,349 737,542,942
Subsidy requirement (NGN'000) 64,478,689 77,472,416 37,031,288 0 0
Subsidy N/KWh 5.20 3.64 0.99 0 0

Multi-Year Tariff Order (July 2008- June 2013)
34
Table 17: Tariff schedule for the year starting 1ST July 2008
Tariff Code Details Year starting 1 July 2008 Tariff Code Fixed Meter Minimum Demand Energy
N/Month N/Month N/Month N/KVA N/KWh
Residential
Residential R1 24 121 24 0.00 1.2
Residential R2 36 121 36 0.00 4.0
Residential R3 145 603 145 0.00 6.0
Residential R4 145 1,930 6,031 0.00 8.5
Residential R5 0 2,654 37,695 0.00 8.5
Commercial
Commercial C1 107 119 107 0.00 6.5
Commercial C2 142 593 142 0.00 8.5
Commercial C3 285 1,897 5,929 202.02 8.5
Commercial C4 0 2,609 37,057 21.96 8.5
Industrial
Industrial D1 106 118 106 0.00 6.5
Industrial D2 141 588 141 0.00 8.5
Industrial D3 282 1,882 5,882 217.20 8.5
Industrial D4 0 2,588 36,761 236.09 8.5
Industrial D5 0 2,588 1,764,505 254.97 8.5
Special
Special A1 143 597 143 0.00 5.7
Special A2 286 1,909 5,966 0.00 5.7
Special A3 0 2,625 37,288 0.00 5.7
Special A4 0 2,625 37,288 0.00 5.7
Street Lighting
Street Lighting S1 0 551 264 0.00 6.5
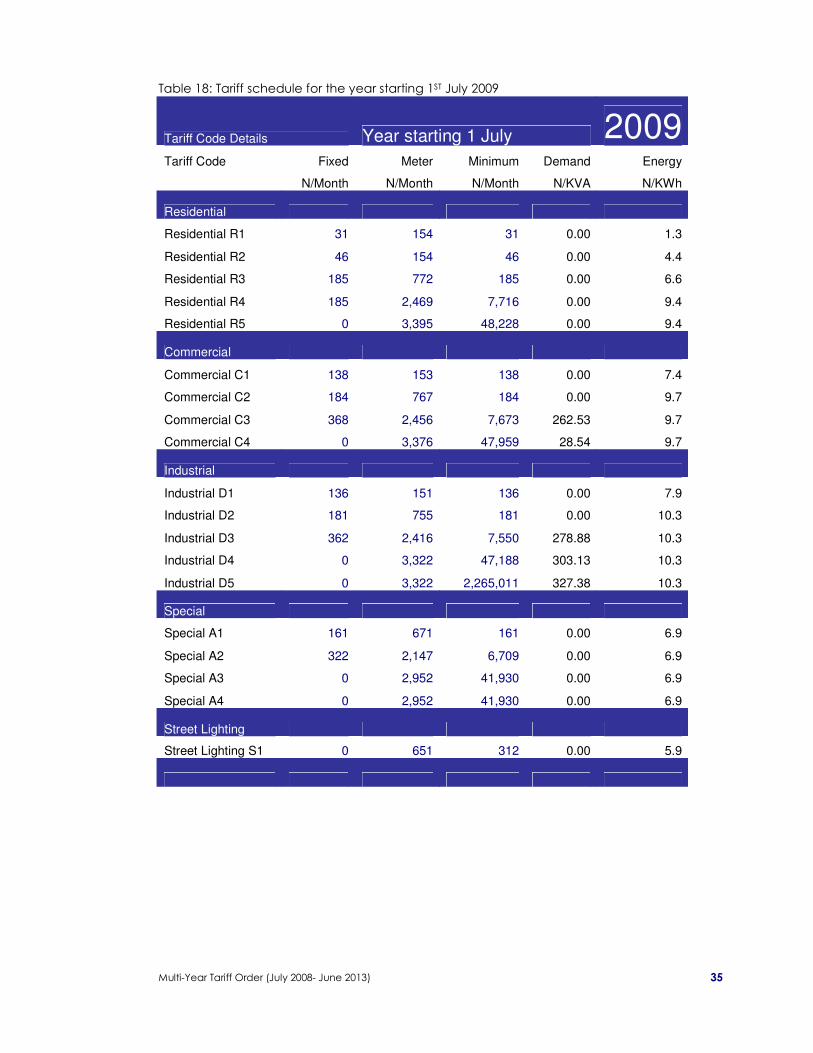
Multi-Year Tariff Order (July 2008- June 2013)
35
Table 18: Tariff schedule for the year starting 1ST July 2009
Tariff Code Details Year starting 1 July 2009 Tariff Code Fixed Meter Minimum Demand Energy
N/Month N/Month N/Month N/KVA N/KWh
Residential
Residential R1 31 154 31 0.00 1.3
Residential R2 46 154 46 0.00 4.4
Residential R3 185 772 185 0.00 6.6
Residential R4 185 2,469 7,716 0.00 9.4
Residential R5 0 3,395 48,228 0.00 9.4
Commercial
Commercial C1 138 153 138 0.00 7.4
Commercial C2 184 767 184 0.00 9.7
Commercial C3 368 2,456 7,673 262.53 9.7
Commercial C4 0 3,376 47,959 28.54 9.7
Industrial
Industrial D1 136 151 136 0.00 7.9
Industrial D2 181 755 181 0.00 10.3
Industrial D3 362 2,416 7,550 278.88 10.3
Industrial D4 0 3,322 47,188 303.13 10.3
Industrial D5 0 3,322 2,265,011 327.38 10.3
Special
Special A1 161 671 161 0.00 6.9
Special A2 322 2,147 6,709 0.00 6.9
Special A3 0 2,952 41,930 0.00 6.9
Special A4 0 2,952 41,930 0.00 6.9
Street Lighting
Street Lighting S1 0 651 312 0.00 5.9

Multi-Year Tariff Order (July 2008- June 2013)
36
Table 19: Tariff schedule for the year starting 1ST July 2010
Tariff Code Details Year starting 1 July 2010 Tariff Code Fixed Meter Minimum Demand Energy
N/Month N/Month N/Month N/KVA N/KWh
Residential
Residential R1 41 204 41 0.00 1.8
Residential R2 61 204 61 0.00 5.9
Residential R3 245 1,019 245 0.00 8.9
Residential R4 245 3,260 10,188 0.00 12.5
Residential R5 0 4,483 63,676 0.00 12.5
Commercial
Commercial C1 174 193 174 0.00 9.4
Commercial C2 232 967 232 0.00 12.3
Commercial C3 464 3,094 9,668 332.10 12.3
Commercial C4 0 4,254 60,426 36.10 12.3
Industrial
Industrial D1 170 189 170 0.00 9.8
Industrial D2 226 943 226 0.00 12.9
Industrial D3 452 3,017 9,427 348.28 12.9
Industrial D4 0 4,148 58,917 378.56 12.9
Industrial D5 0 4,148 2,828,031 408.85 12.9
Special
Special A1 237 986 237 0.00 8.6
Special A2 473 3,154 9,857 0.00 8.6
Special A3 0 4,337 61,606 0.00 8.6
Special A4 0 4,337 61,606 0.00 8.6
Street Lighting
Street Lighting S1 0 751 361 0.00 6.8
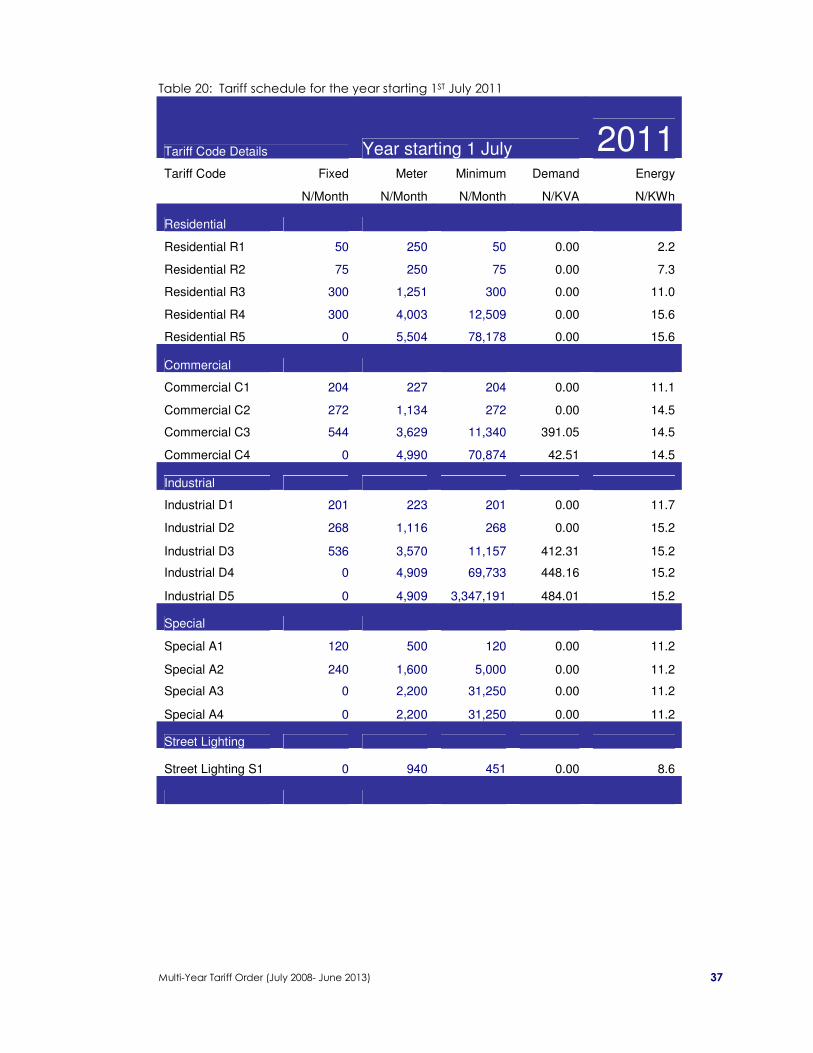
Multi-Year Tariff Order (July 2008- June 2013)
37
Table 20: Tariff schedule for the year starting 1ST July 2011
Tariff Code Details Year starting 1 July 2011 Tariff Code Fixed Meter Minimum Demand Energy
N/Month N/Month N/Month N/KVA N/KWh
Residential
Residential R1 50 250 50 0.00 2.2
Residential R2 75 250 75 0.00 7.3
Residential R3 300 1,251 300 0.00 11.0
Residential R4 300 4,003 12,509 0.00 15.6
Residential R5 0 5,504 78,178 0.00 15.6
Commercial
Commercial C1 204 227 204 0.00 11.1
Commercial C2 272 1,134 272 0.00 14.5
Commercial C3 544 3,629 11,340 391.05 14.5
Commercial C4 0 4,990 70,874 42.51 14.5
Industrial
Industrial D1 201 223 201 0.00 11.7
Industrial D2 268 1,116 268 0.00 15.2
Industrial D3 536 3,570 11,157 412.31 15.2
Industrial D4 0 4,909 69,733 448.16 15.2
Industrial D5 0 4,909 3,347,191 484.01 15.2
Special
Special A1 120 500 120 0.00 11.2
Special A2 240 1,600 5,000 0.00 11.2
Special A3 0 2,200 31,250 0.00 11.2
Special A4 0 2,200 31,250 0.00 11.2
Street Lighting
Street Lighting S1 0 940 451 0.00 8.6

Multi-Year Tariff Order (July 2008- June 2013)
38
Table 21: Tariff schedule for the year starting 1ST July 2012
Tariff Code Details Year starting 1 July 2012 Tariff Code Fixed Meter Minimum Demand Energy
N/Month N/Month N/Month N/KVA N/KWh
Residential
Residential R1 50 250 50 0.00 2.2
Residential R2 75 250 75 0.00 7.4
Residential R3 300 1,251 300 0.00 11.2
Residential R4 300 4,005 12,515 0.00 15.8
Residential R5 0 5,506 78,217 0.00 15.8
Commercial
Commercial C1 208 231 208 0.00 11.3
Commercial C2 277 1,154 277 0.00 14.8
Commercial C3 554 3,692 11,536 399.32 14.8
Commercial C4 0 5,076 72,101 43.40 14.8
Industrial
Industrial D1 208 231 208 0.00 12.1
Industrial D2 277 1,155 277 0.00 15.8
Industrial D3 554 3,696 11,549 426.89 15.8
Industrial D4 0 5,082 72,184 464.01 15.8
Industrial D5 0 5,082 3,464,822 501.13 15.8
Special
Special A1 290 1,208 290 0.00 11.6
Special A2 580 3,864 12,077 0.00 11.6
Special A3 0 5,314 75,478 0.00 11.6
Special A4 0 5,314 75,478 0.00 11.6
Street Lighting
Street Lighting S1 0 1,043 501 0.00 9.6
Multi-Year Tariff Order (July 2008- June 2013)
39
Effective Date: This ORDER shall take effect from 1st July 2008
BY ORDER OF THE COMMISSION
Dated 27th June, 2008
Dr. Ransome Owan
Chairman/CEO

Multi-Year Tariff Order (July 2008- June 2013)
40
7.0 APPENDIX 1
List of parties consulted on MYTO methodology and tariff
1. Senior Staff Association of Electricity and Allied Companies (SSAEAC)
2. National Union of Electricity Employees (NUEE)
3. Independent Power Producers (Operating & Licensed)
4. Geometric Power Ltd.
5. Ethiope Energy Ltd.
6. Supertek Nig. Ltd.
7. Westcom Technologies & Energy Services
8. Anita Energy Ltd.
9. Hudson Power Ltd.
10. Ibafo Power Station Ltd.
11. First Independent Power Co. Ltd.
12. Minaj Holdings Ltd.
13. Lucra Energy Ltd
14. Negris/Encon Ltd
15. Kainji Power Plc
16. Shiroro Hydro Power Plc
17. Sapele Power Station
18. Afam Electric Power Station
19. Egbin Power Plc
20. Jebba Power Plc
21. Ughelli Power Station
22. Kano Electricity Distribution Company
23. Kaduna Electricity Distribution Company
24. Yola Electricity Distribution Company
25. Enugu Electricity Distribution Company
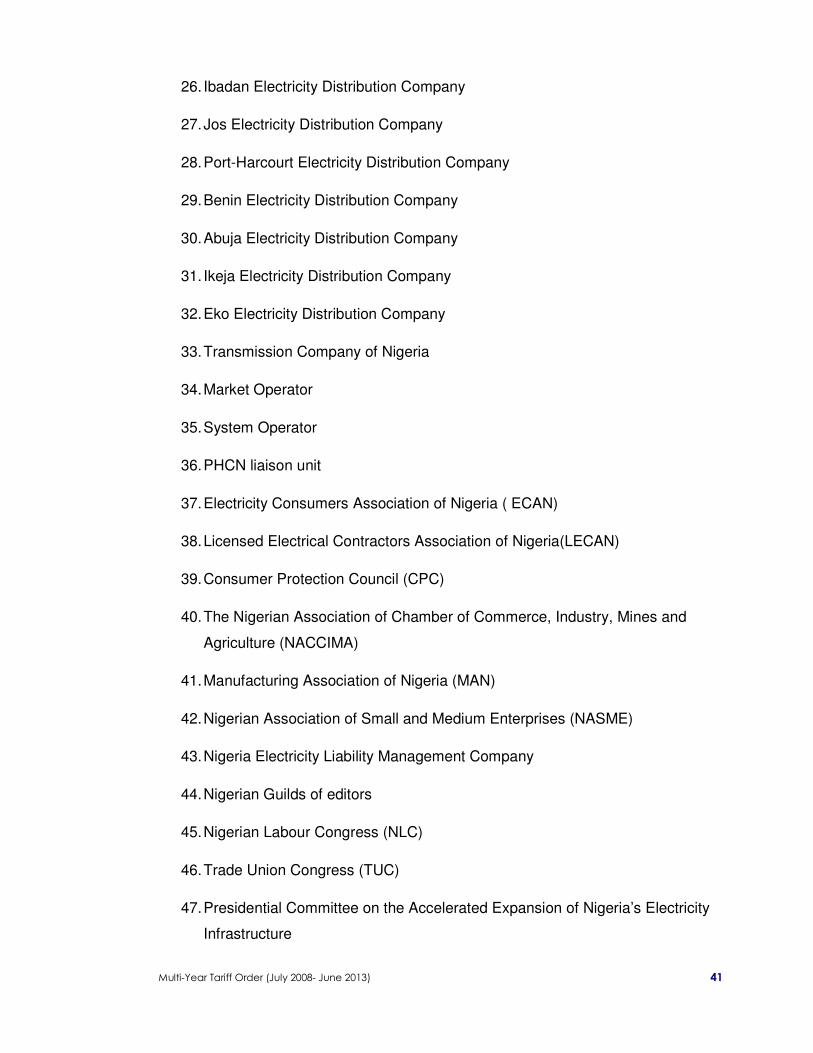
Multi-Year Tariff Order (July 2008- June 2013)
41
26. Ibadan Electricity Distribution Company
27. Jos Electricity Distribution Company
28. Port-Harcourt Electricity Distribution Company
29. Benin Electricity Distribution Company
30. Abuja Electricity Distribution Company
31. Ikeja Electricity Distribution Company
32. Eko Electricity Distribution Company
33. Transmission Company of Nigeria
34. Market Operator
35. System Operator
36. PHCN liaison unit
37. Electricity Consumers Association of Nigeria ( ECAN)
38. Licensed Electrical Contractors Association of Nigeria(LECAN)
39. Consumer Protection Council (CPC)
40. The Nigerian Association of Chamber of Commerce, Industry, Mines and
Agriculture (NACCIMA)
41. Manufacturing Association of Nigeria (MAN)
42. Nigerian Association of Small and Medium Enterprises (NASME)
43. Nigeria Electricity Liability Management Company
44. Nigerian Guilds of editors
45. Nigerian Labour Congress (NLC)
46. Trade Union Congress (TUC)
47. Presidential Committee on the Accelerated Expansion of Nigeria’s Electricity
Infrastructure

Multi-Year Tariff Order (July 2008- June 2013)
42
48. Federal Ministry of Energy
49. Federal Ministry of Finance
50. Economic Management Team (EMT)
51. National Planning Commission
52. Senate Committee on Power
53. House of Representatives Committee on Power
54. The Presidency
55. Federal Executive Council
56. National Economic Council
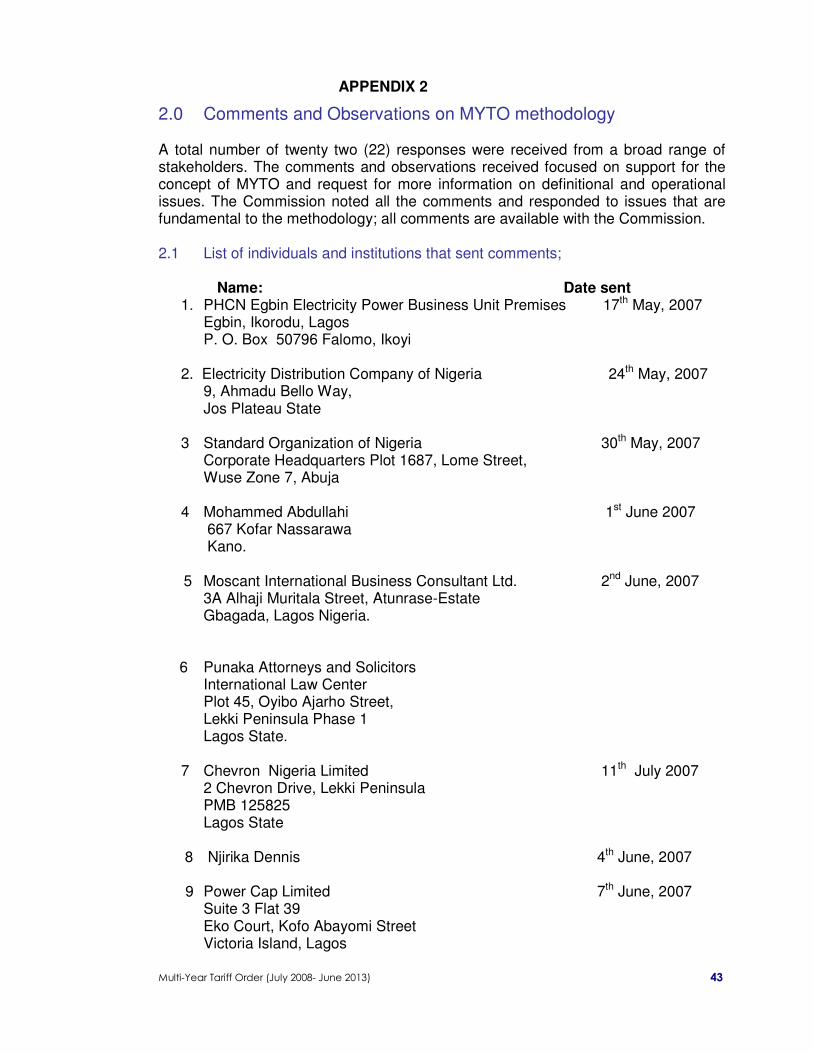
Multi-Year Tariff Order (July 2008- June 2013)
43
APPENDIX 2
2.0 Comments and Observations on MYTO methodology A total number of twenty two (22) responses were received from a broad range of stakeholders. The comments and observations received focused on support for the concept of MYTO and request for more information on definitional and operational issues. The Commission noted all the comments and responded to issues that are fundamental to the methodology; all comments are available with the Commission. 2.1 List of individuals and institutions that sent comments; Name: Date sent
1. PHCN Egbin Electricity Power Business Unit Premises 17th May, 2007 Egbin, Ikorodu, Lagos P. O. Box 50796 Falomo, Ikoyi
2. Electricity Distribution Company of Nigeria 24th May, 2007
9, Ahmadu Bello Way, Jos Plateau State
3 Standard Organization of Nigeria 30th May, 2007
Corporate Headquarters Plot 1687, Lome Street, Wuse Zone 7, Abuja
4 Mohammed Abdullahi 1st June 2007
667 Kofar Nassarawa Kano.
5 Moscant International Business Consultant Ltd. 2nd June, 2007
3A Alhaji Muritala Street, Atunrase-Estate Gbagada, Lagos Nigeria.
6 Punaka Attorneys and Solicitors International Law Center Plot 45, Oyibo Ajarho Street, Lekki Peninsula Phase 1 Lagos State.
7 Chevron Nigeria Limited 11th July 2007
2 Chevron Drive, Lekki Peninsula PMB 125825 Lagos State
8 Njirika Dennis 4th June, 2007 9 Power Cap Limited 7th June, 2007
Suite 3 Flat 39 Eko Court, Kofo Abayomi Street Victoria Island, Lagos
Multi-Year Tariff Order (July 2008- June 2013)
44
10 Mobil Producing Nigeria Unlimited 7th June, 2007
Mobil House, Lekki Expressway Victoria Island, PMB 12054, Lagos.
11 Transmission Company of Nigeria 5th June, 2007 Corporate Headquarters, Plot 441, Zambezi Crescent,
Maitama- Abuja 12 Obi Michael 7th June, 2007
Lagos
13 Aldwych International 8th June, 2007
14 Supertek Nigeria Limited 12th June, 2007
Power Generation Products No2. Misratah Street, Off Parakou Street. Candastral Zone A7, off Amino Kano Crescent Wuse 2 Abuja
15 Globeleq Limited 14th June 2007
16 Genevieve Mbama 14th June, 2007 Access Bank Multinational Group Head Office.
17 Sunil Katial 16th June 2007
Head (Power) Nigerian Operations, Global Infrastructure Nigeria Limited
18 Nigeria Electricity Supply Corporation(Nigeria) Limited 18th May, 2008
P.O.Box 15 Bukuru, Plateau State
19 Larry Holloway, Date not stated. Kansas Corporation Commission
20 Shreline Power 14th June, 2007
Shoreline House 46, Industrial Avenue, Ilepuju PMB 21055, Ikeja Nigeria
Multi-Year Tariff Order (July 2008- June 2013)
45
21 Shell Petroleum Development 7th June, 2007 Company of Nigeria Limited Shell Industrial Area, Rumuobiakani P O Box 263, Port Harcourt. Rivers State
22 AES Nigeria, Ikorodu Lagos

Multi-Year Tariff Order (July 2008- June 2013)
46
This page is left blank deliberately.