Embed Size (px)
Citation preview

Multi-tracer analysis for patient’s following using
multi-observation statistical image fusion :
a feasibility studyS. David1, M. Hatt1, P. Fernandez2, M. Allard2,
O. Barrett2, D. Visvikis1
1. LaTIM, INSERM U650, Brest, France1. LaTIM, INSERM U650, Brest, France
2. Department2. Department of of nuclear medicinenuclear medicine HospitalHospital Pellegrin – CHU Bordeaux Pellegrin – CHU Bordeaux

Outline
Context of oncology• Positron Emission Tomography (PET)• External radiotherapy
Use of PET in clinical application• Multi-tracer analysis for dose-painting• Patient monitoring in PET
Multi-observation fusion• Multiband segmentation of a spectroscopic line data cube• Developed method• Preliminary results
Further work

Context of oncology
Cancer• In 2002 : 11 millions new cases and 7 millions deaths• Foresee in 2030 : 11 millions deaths
Diagnosis• Computed tomography (CT)• Magnetic resonance imaging (MRI)• Emission imaging (PET, SPECT)
Treatment • Surgery• Chemotherapy• Radiotherapy
Focus on the PET imaging and its application :• Radiotherapy planning• Therapy response assessment
Since 2000 : PET / CT combinedGold standard for the diagnosis
Usually combined

Context and motivations
Positron Emission Tomography (PET) : • Functional imaging : visualization of physiological processes• Mainly used for cancer diagnosis and staging
Principle : • Injection of a radiotracer
o Biological tracer targets the tumoro Radionuclide : β- emitter
• Detection of the 2 γ rays
• Image reconstruction by tomography
Drawbacks of the PET imaging : • Blur (spatial resolution)• High noise (acquisition variability)• Low resolution ( >5 mm)
Context and motivations
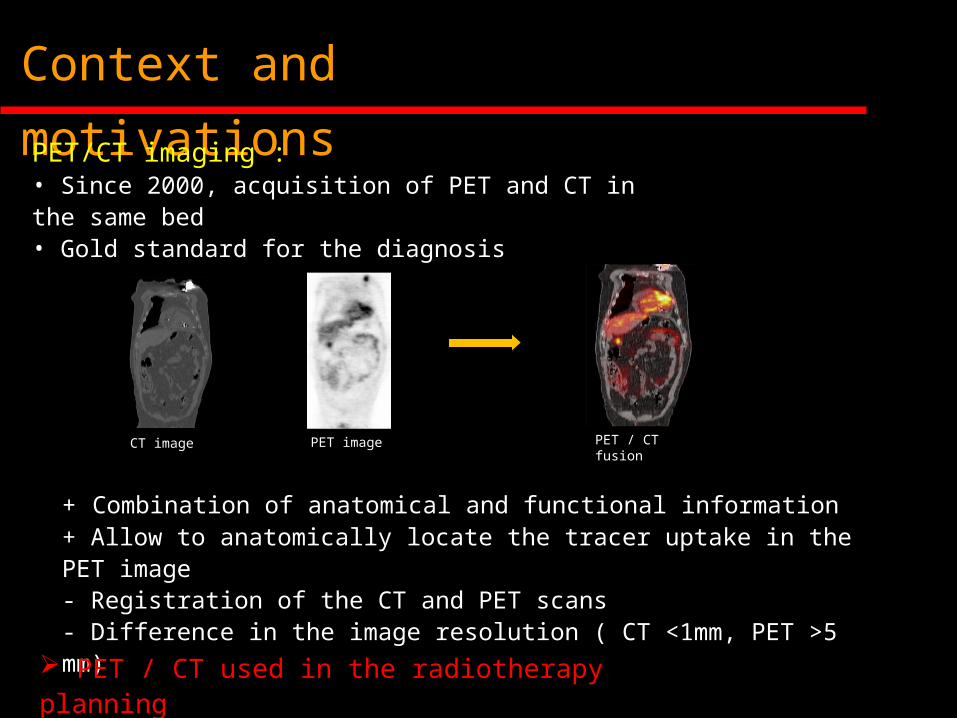
PET/CT imaging : • Since 2000, acquisition of PET and CT in the same bed• Gold standard for the diagnosis
PET imageCT image PET / CT fusion
+ Combination of anatomical and functional information+ Allow to anatomically locate the tracer uptake in the PET image- Registration of the CT and PET scans- Difference in the image resolution ( CT <1mm, PET >5 mm)
PET / CT used in the radiotherapy planning
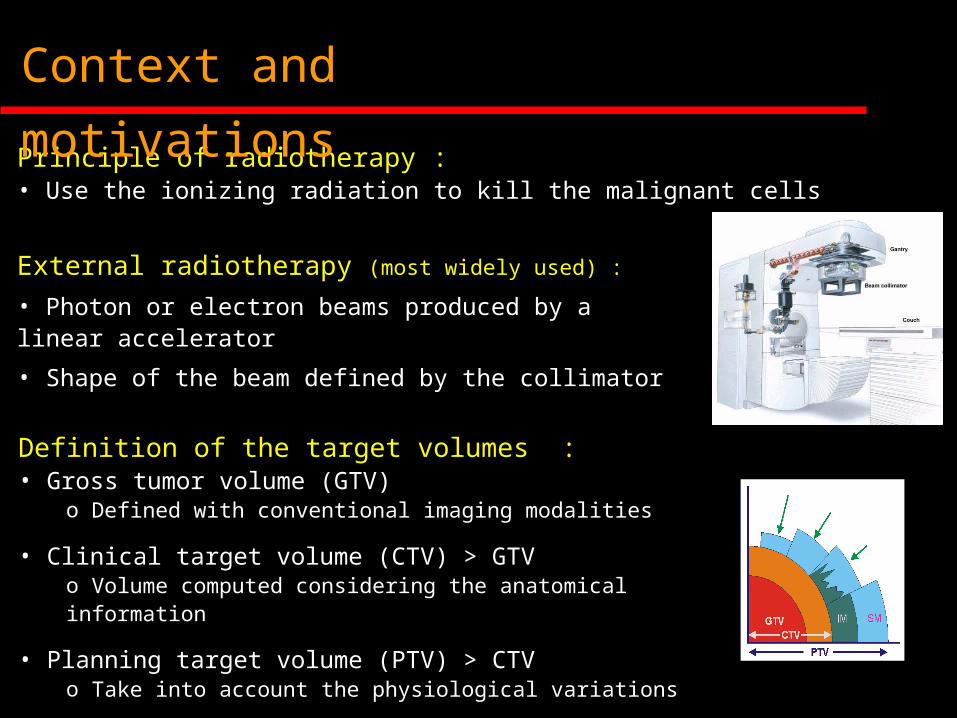
Principle of radiotherapy :• Use the ionizing radiation to kill the malignant cells
Context and motivations
External radiotherapy (most widely used) :
• Photon or electron beams produced by a linear accelerator
• Shape of the beam defined by the collimator
Definition of the target volumes :• Gross tumor volume (GTV)
o Defined with conventional imaging modalities
• Clinical target volume (CTV) > GTV o Volume computed considering the anatomical information
• Planning target volume (PTV) > CTVo Take into account the physiological variations

IMRT planning
Biological image-guided dose escalation • Development of Intensity-modulated radiation therapy (IMRT)
• Administration of a non-uniform doseo Adapt the treatment to the patiento Reduce the irradiation of organ at risk (OAR) and surrounding healthy tissues
• 18F-FDG : Measure the glucose consumption (tumor highly glucose consumer) o Radiotracer the most widely use in PET o Not tumor specific (other physiological processes need glucoses)o Uptake in inflammatory tissues
Use of PET in clinical application
PET / CT : Target volume definition
Improvement of the tumor volume definition with the multi-tracer analysis
Multi-tracer analysis

Development of specific radio-marker measuring ≠ tumor features : • FMISO : measure of the tumor hypoxia (lack of oxygen)
o Hypoxia induces resilience to the radiotherapy
Use of PET in clinical application
FDG coronal PET scan FLT coronal PET scan
• 18F-FLT : measure of the tumor proliferation oTumor specific radio-marker : ≠ FDGo Avoid inflammatory tissueso Lower uptake in the tumor than FDG
Y. Yamamoto et al, European Journal of Nuclear Medicine and Molecular Imaging, 2008
Hypoxic tumors require a dose boosting
• Merging all features measured by the tracers
• Each radiotracer is measuring a specific biologic process o Scans are quantitatively not comparable

Use of PET in clinical applicationPatient follow-up with PET : • Patients underwent chemo / radio-therapy
o Early assessment of the response to the treatment
o Adapt the therapy to the responseo Avoid toxic and costly cares for non-responding patients
PET1 pre-treatment PET2 post-treatment
Tumors
• PET acquisition during the course of the therapyo Estimation of prognosis
Goal of our work
Multi-sensor observation of an objet• Many clinical data available with the multi-modality imaging
Goal :• Fusing all the scans obtained :
o with the ≠ radiotracers Should improve the tumor volume definition
o at different time of the treatment A more accurate assessment of therapy response
Approach : • With the statistical segmentation framework• Model the information of multi-tracer and/or follow-up scans
Analogy with the astronomical framework

Multiband segmentation of a spectroscopic line data cube
• EM algorithm on Gaussian mixture modelo fit the spectrum : assessment of mean and variance
F. Flitti et al, Multiband segmentation of a spectroscopic line data cube : application to the H1 data cube of the spiral galaxy NGC 4254
Segmentation process based on Bayesian inference• Observation with radio interferometers
o 3D data cubes (astronomical coordinates and frequency third axis)
• Choice of the 6 most pertinent Gaussian o K-means
• Computation of weight associated to each classo Levenberg-Marquardt algorithm
Reduction of the dimension (42 channels) of the cube
Maps of the weights of the 6 Gaussian with the NGC 4254 Cube
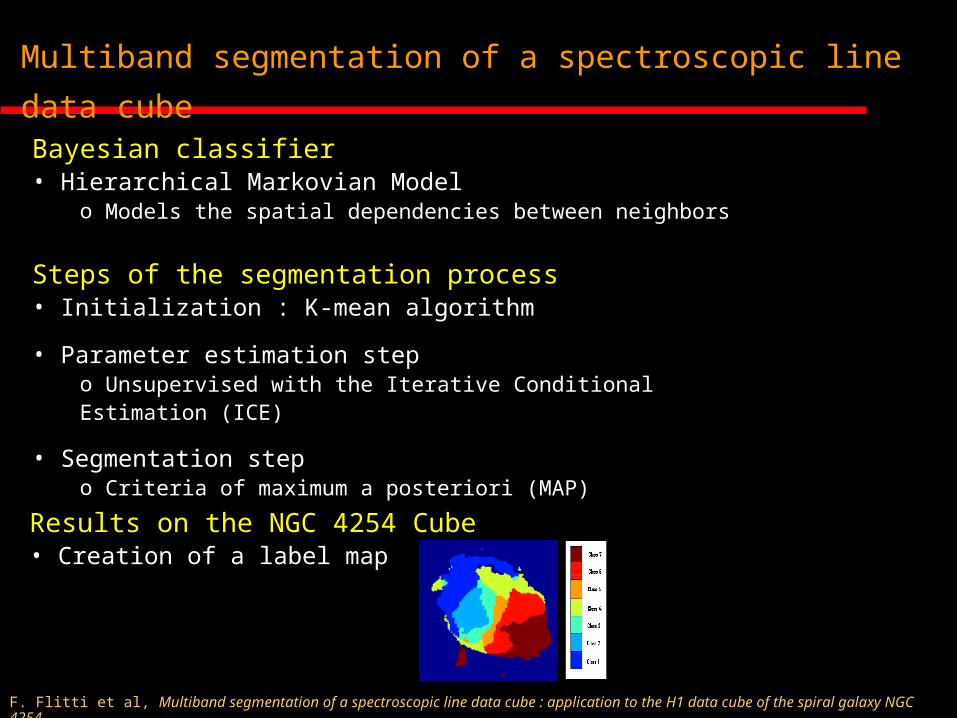
Bayesian classifier • Hierarchical Markovian Model
o Models the spatial dependencies between neighbors
Results on the NGC 4254 Cube• Creation of a label map
Multiband segmentation of a spectroscopic line data cube
Steps of the segmentation process • Initialization : K-mean algorithm
• Parameter estimation stepo Unsupervised with the Iterative Conditional Estimation (ICE)
• Segmentation stepo Criteria of maximum a posteriori (MAP)
F. Flitti et al, Multiband segmentation of a spectroscopic line data cube : application to the H1 data cube of the spiral galaxy NGC 4254
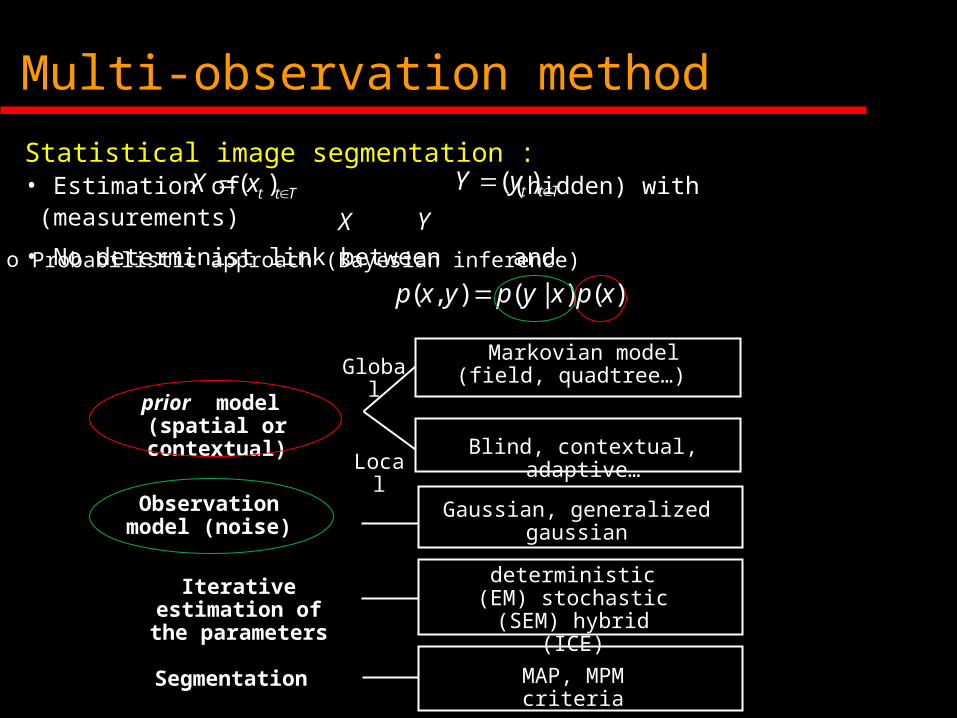
Local
prior model (spatial or contextual) Blind, contextual, adaptive…
( , ) ( | ) ( )p x y p y x p x
Observation model (noise)
Gaussian, generalized gaussian
Iterative estimation of
the parameters
deterministic (EM) stochastic (SEM)
hybrid (ICE)
Segmentation MAP, MPM criteria
Multi-observation method
Statistical image segmentation :• Estimation of (hidden) with (measurements)
• No determinist link between and
( )t t TX x ( )t t TY y
X Y
o Probabilistic approach (Bayesian inference)
Global Markovian model (field, quadtree…)

• X : labels field • Y : measurements field
Multi-observation method
Estimation of the (X,Y) distribution• Mixture defined by θ=(α,β)
o αi : priors of X
o βi=(mi,Гi) : distribution of Y conditional to X
PET Tracer N
Label X
……
Label X
Measures Y
time
PET MISO ...
PET FDG …
……
……
……
...
...
……
……
Multi-tracer analysis
Patient follow-up

Multi-observation method : preliminary work
Estimation of the (X,Y) distribution• Maximization of the log-likelihood• Implementation of EM and SEM algorithm
o Blind and adaptive (AEM,ASEM) version
Initialization : • K-means• Fuzzy K-means
Test on data set : • Synthetic images • Simulated tumors
Decision step • MAP criteria
o Creation of a segmented map
Fusion process :

Preliminary results
Synthetic images : • Map of labels X
o 2 or 3 labels per image
• Measurements Yo Mean discrimination (MD)o Variance discrimination (VD)
Map of labels X
• N = 2 spectral bands• K = 3 labels• Random initialization
AEM segmentation ASEM segmentationVDMD
Segmentation results :
• N = 2 spectral bands• K = 2 labels• Random initialization
VD AEM segmentation ASEM segmentation
Measurement Y
MD
Segmentation map
• Fusion of measurement with the same map of labelso Number of labels in segmentation map = Number of labels per image

Preliminary results
Synthetic images : • 2 or 3 labels per image
• Fusion of measurement with the different map of labelso Additional labels in the segmented map
AEM segmentation ASEM segmentation
• N = 2 spectral bands• K = 3 labels per scan• 5 classes in segmentation map• Fuzzy K-means initialization
AEM segmentation ASEM segmentation
Measurement Y Segmentation mapSegmentation results :
• N = 2 spectral bands• K = 2 and 3 labels• 4 classes in segmentation map• Fuzzy K-means initialization

Preliminary results
Simulated tumors :
• N = 2 tracer scans• K = 2 levels of tracer uptake per scan• Fuzzy-K mean initialization
• N = 3 tracer scans• K = 2 levels of tracer uptake per scan• Fuzzy-K mean initialization
• N = 2 tracer scans• K = 3 levels of tracer uptake per scan• Fuzzy-K mean initialization
The ground truth of each tumor scan will be different The segmentation process should identify the new labels
• Each band : a tracer scan• Label in the scan : uptake of the tracer
3 cases :

Preliminary results
Segmentation results :
AEM segmentation ASEM segmentation
AEM segmentation ASEM segmentation
AEM segmentation ASEM segmentation
• N images = 2 , K tracer uptake =2
• N images = 3 , K tracer uptake =2
• N images = 2 , K tracer uptake =3

Fusion of the synthetic images • In the different situations (N Bands, K classes)
o Supervised, semi-supervised and unsupervised segmentationo Satisfactory classification
Fusion of simulated tumors• Segmentation error depends on :
o The fuzzy K-means initializationo Noise level in the scanso The number of classes in the label map
Limitations :• Segmentation not totally unsupervised :
o Number of labels has to be defined by the user
• Fusion of few spectral bands
Preliminary results

Further work
• Fusion process with more data o Other tracers images and / or follow-up scans
• Segmentation totally unsupervisedo Estimation of the classes number in the label map
• Test the method on simulated data with GATEo More realistic simulated tumorso Computation of classification error
• Application of our method in a radiotherapy planning station

Thank you for your attention