Embed Size (px)
Citation preview
FINAL REPORT Multi-Scale Approach to Understanding Source-Sink Dynamics of
Amphibians
SERDP Project RC-2155
DECEMBER 2015
Lori S. Eggert
Raymond D. Semlitsch
Thomas L. Anderson
Jacob J. Burkhart
Arianne Messerman
Brittany Ousterhout
William E. Peterman
Freya E. Rowland
University of Missouri
Distribution Statement A

Page Intentionally Left Blank

This report was prepared under contract to the Department of Defense Strategic Environmental Research and Development Program (SERDP). The publication of this report does not indicate endorsement by the Department of Defense, nor should the contents be construed as reflecting the official policy or position of the Department of Defense. Reference herein to any specific commercial product, process, or service by trade name, trademark, manufacturer, or otherwise, does not necessarily constitute or imply its endorsement, recommendation, or favoring by the Department of Defense.

Page Intentionally Left Blank

REPORT DOCUMENTATION PAGE Form Approved
OMB No. 0704-0188 Public reporting burden for this collection of information is estimated to average 1 hour per response, including the time for reviewing instructions, searching existing data sources, gathering and maintaining the data needed, and completing and reviewing this collection of information. Send comments regarding this burden estimate or any other aspect of this collection of information, including suggestions for reducing this burden to Department of Defense, Washington Headquarters Services, Directorate for Information Operations and Reports (0704-0188), 1215 Jefferson Davis Highway, Suite 1204, Arlington, VA 22202-4302. Respondents should be aware that notwithstanding any other provision of law, no person shall be subject to any penalty for failing to comply with a collection of information if it does not display a currently valid OMB control number. PLEASE DO NOT RETURN YOUR FORM TO THE ABOVE ADDRESS. 1. REPORT DATE (DD-MM-YYYY) 11/30/2015
2. REPORT TYPE Final Report
3. DATES COVERED (From - To) Sept 2011-Dec 2015
4. TITLE AND SUBTITLE Multi-Scale Approach to Understanding Source-Sink Dynamics of
hibi hi
5a. CONTRACT NUMBER
Amphibians
5b. GRANT NUMBER SERDP-RC2155
5c. PROGRAM ELEMENT NUMBER
6. AUTHOR(S) Lori S. Eggert, PhD., Thomas L. Anderson, Jacob J. Burkhart, Arianne Messerman, Brittany
5d. PROJECT NUMBER SERDP-RC2155
Ousterhout, William E. Peterman, and Freya E. Rowland
5e. TASK NUMBER
5f. WORK UNIT NUMBER 7. PERFORMING ORGANIZATION NAME(S) AND ADDRESS(ES)
The Curators of the University of Missouri
8. PERFORMING ORGANIZATION REPORT NUMBER
Office of Sponsored Projects University of Missouri 310 Jesse Hall Columbia, MO 65211-1230
9. SPONSORING / MONITORING AGENCY NAME(S) AND ADDRESS(ES) 10. SPONSOR/MONITOR’S ACRONYM(S) DEPT OF DEFENSE
SERDP SERDP Office 901 N Stuart St, Suite 303
11. SPONSOR/MONITOR’S REPORT
Arlington, VA 22203-1821 NUMBER(S) 12. DISTRIBUTION / AVAILABILITY STATEMENT U
13. SUPPLEMENTARY NOTES
14. ABSTRACT The objective of this study was to improve our understanding of source-sink dynamics for subpopulations or populations of species of relevance to Department of Defense resource managers. Specifically, this project sought to better understand the impact of landscape heterogeneity on the source-sink dynamics of a species of conservation concern (the ringed salamander, Ambystoma annulatum) and a co-occurring species (the spotted salamander, A. maculatum) at Fort Leonard Wood, Missouri. Investigators sought to (1) define source habitat patches by identifying key environmental conditions associated with varying levels of reproductive success of A. annulatum, (2) determine whether species interactions influence source-sink dynamics, (3) identify habitat features associated with effective dispersal of A. annulatum among populations to define habitat connectivity, and (4) develop models to predict and manage population connectivity for salamanders in heterogeneous landscapes.
15. SUBJECT TERMS
16. SECURITY CLASSIFICATION OF: Unclassified
17. LIMITATION OF ABSTRACT
18. NUMBER OF PAGES
19a. NAME OF RESPONSIBLE PERSON Lori S Eggert
a. REPORT U
b. ABSTRACT U
c. THIS PAGE U
U 59
19b. TELEPHONE NUMBER (include area code) 573-884-3685 Standard Form 298 (Rev. 8-98)
Prescribed by ANSI Std. Z39.18

Page Intentionally Left Blank
ii
Table of Contents
List of Tables..................................................................................................................................iv
List of Figures..................................................................................................................................v
List of Acronyms............................................................................................................................vi
Keywords.......................................................................................................................................vii
Acknowledgements......................................................................................................................viii
Preface............................................................................................................................................ix
Abstract............................................................................................................................................1
Objective..........................................................................................................................................3
Background......................................................................................................................................4
Materials and Methods
Study site..............................................................................................................................7
Occupancy, abundance and fitness of salamanders.............................................................7
Dispersal studies..................................................................................................................8
Landscape studies................................................................................................................9
Within-population genetic analyses.....................................................................................9
Among-population genetic analyses..................................................................................13
Landscape resistance..........................................................................................................14
Source-sink dynamics........................................................................................................14
Species interactions............................................................................................................14
Results and Discussion
Occupancy, abundance, and fitness of salamanders..........................................................16
Dispersal............................................................................................................................17
Landscape studies..............................................................................................................18
Within-population genetic analyses...................................................................................20
Among-population genetic analyses..................................................................................22
Landscape genetics............................................................................................................24
Assessment of source-sink status and pond importance - Demographic network model..26
Identification of optimal sites for habitat creation.............................................................31
Species interactions
Field observations..................................................................................................32
iii
Mesocosm and microcosm experiments................................................................33
Transition plan...................................................................................................................34
Conclusions and implications for future research/implementation...............................................35
Literature cited...............................................................................................................................38
Supplemental Materials
Appendix A. Publications and other products from this project........................................44
Appendix B. Datasets used in the genetic analyses...........................................................49
Appendix C. User guide program 'ssmc'............................................................................50
iv
List of Tables
Table 1. Summary of landscape and pond parameters assessed in this study
(from Peterman et al. 2014)...........................................................................................10
Table 2. Summary of ponds surveyed during egg, larval and metamorph
sampling for the fall-breeding ringed (Ambystoma annulatum)
and spring-breeding spotted (A. maculatum) between 2011 and
2013 at Fort Leonard Wood, Missouri, USA (from Anderson et al. 2015)..................20
Table 3. Population genetic summary statistics for salamander species
sampled at Fort Leonard Wood, MO............................................................................22
v
List of Figures
Figure 1. Overview of Fort Leonard Wood, MO and 7,140 ha focal landscape..........................7
Figure 2. Observed frequency of distance moved (m) by juvenile body size in
laboratory study...........................................................................................................17
Figure 3. Activity in the lab (distance moved) of A. annulatum and A. maculatum...................18
Figure 4. Estimated effects of percentage forest within 300 m, fish presence,
hydroperiod, and pond area on the density of larvae of A. annulatum,
A. opacum, and A. maculatum (larvae/m2)..................................................................19
Figure 5. Scatter plot demonstrating significant isolation-by-distance relationship for
Ambystoma annulatum, A. maculatum, and A. opacum...............................................22
Figure 6. Spatial genetic clustering of A. annulatum (A), A. opacum (B),
A. maculatum (C), and N. viridescens (D) across the focal area.................................24
Figure 7. Network modularity of A. annulatum based on gene flow among ponds... ................25
Figure 8. Rank importance of ponds to gene-flow in relation to within module
strength (A) and between-module strength(B)............................................................26
Figure 9. Frequency of source populations across the FLW focal area for
A. annulatum (A), A. maculatum (B), and A. opacum (C)..........................................28
Figure 10. Rank importance of ponds, determined by the percent change in
metapopulation capacity when a pond was removed from the network
and averaged over 10,000 iterations of the demographic network model
for A. annulatum (A), A. maculatum (B), and A. opacum...........................................29
Figure 11. Sensitivity analysis of demographic network model parameters in affecting
metapopulation capacity..............................................................................................31
Figure 12. Map detailing all potential pond building site output for the ‘ssmc’
package. ......................................................................................................................32

vi
List of Acronyms
Aa Ambystoma annulatum
AMAN Ambystoma annulatum
Am Ambystoma maculatum
AMMA Ambystoma maculatum
Ao Ambustoma opacum
AMOP Ambystoma opacum
FLW Fort Leonard Wood
HWE Hardy-Weinberg equilibrium
IBD Isolation by distance
LD Linkage disequilibrium
NOVI Notophthalmus viridescens
Nv Notophthalmus viridescens
SVL Snout vent length
TL Total length

vii
Keywords
Amphibian
Competition
Demographic modeling
Fort Leonard Wood
Landscape genetics
Landscape resistance
Population structure
Predation
Salamander
Source-sink dynamics
viii
Acknowledgements
This project could not have been done without the assistance of Kenton Lohraff, the Natural
Resources Branch wildlife biologist at Fort Leonard Wood. We are very grateful to Dana Drake,
whose hard work and expertise facilitated field operations for all studies. We thank Jennifer
Heemeyer for her help with fieldwork. We are grateful to the many undergraduate research
students who helped with fieldwork and cattle tank experiments, including: Annelies Brock,
Katelyn Dodson, Sam Doll, Casie Farmer, Zoe Heligman, Lauren Hollis, Adam Koenig, Taylor
Lawson, Cristina Linares, Madelyn Rawlings, Josh Robinson, Sadiqa Saleh, Lauren Smith, and
Amanda Waters. Tanner Leslie helped with enclosure construction and Hannah Claspille,
Tiffany Glasgow, John Hall, Skyler Kramer, and Jena Staggs provided assistance with animal
care. For their assistance with the genetics portion of the project, we are grateful to Emily
Brocato, Chelsey Kroese, Luke Pauley, Kim Romine, Elsa Stuart, and M. Madeline Willis. For
her help with Illumina sequencing and processing, we thank Stacey Lance. We are grateful to
Robert Fletcher for his help with code for our genetic modularity analysis.

ix
Preface
This project was initiated by Dr. Ray Semlitsch as Principal Investigator and Dr. Lori Eggert as
co-Principal Investigator. Dr. Semlitsch brought a wealth of experience in herpetology and land
use effects on amphibians and Dr. Eggert brought years of experience in population and
ecological genetics. Between the initiation of the project in 2011 and the first quarter of 2015,
both Dr. Semlitsch and Dr. Eggert contributed to the management of the project and the
production of results. After the sudden and untimely passing of Dr. Semlitsch on June 10, 2015,
Dr. Eggert became the PI for the project through its completion.
1
Abstract
Objective — The objective of this study was to improve our understanding of source-sink
dynamics for subpopulations or populations of species of relevance to Department of Defense
resource managers. Specifically, this project sought to better understand the impact of landscape
heterogeneity on the source-sink dynamics of a species of conservation concern (the ringed
salamander, Ambystoma annulatum) and a co-occurring species (the spotted salamander, A.
maculatum) at Fort Leonard Wood, Missouri. Investigators sought to (1) define source habitat
patches by identifying key environmental conditions associated with varying levels of
reproductive success of A. annulatum, (2) determine whether species interactions influence
source-sink dynamics, (3) identify habitat features associated with effective dispersal of A.
annulatum among populations to define habitat connectivity, and (4) develop models to predict
and manage population connectivity for salamanders in heterogeneous landscapes.
Technical approach — This study involved a combination of intensive ecological field studies,
genetic analyses, and statistical modeling. Between 2011 and 2014, larvae were surveyed at each
pond for three consecutive days within each sampling period. Field teams recorded the
abundance of each species and that of invertebrate predators, other amphibians, and fish. During
each year, visual encounter surveys and quadrat sampling for egg masses were also conducted.
These surveys involved a single visit to each pond, during which data were recorded for the
number of eggs observed and the number of metamorphs captured, respectively.
To study dispersal, investigators reared salamanders from hatchlings and manipulated larval
densities to generate juveniles that differed in size. The activity level of juvenile salamanders
was repeatedly measured to determine if movement behavior was repeatable, indicative of
dispersers being intrinsically different from residents. Nine morphological traits were measured
and regressed against distance moved. Whether habitat type or the interaction between body size
and habitat affected initial movement distance was tested in a field study using replicated field
enclosures to isolate the effects of natal and juvenile habitat on initial movement behavior.
Investigators measured the surface area and maximum depth of each pond each time it was
sampled. Pond attributes assumed to be constant over time (pond basin area, hydroperiod,
canopy closure, emergent and submergent vegetation) were measured once during 2012.
Species-specific microsatellite loci were developed for A. annulatum and A. maculatum. After
analysis of the 2012 data revealed limited genetic differentiation among ponds for both species,
A. opacum (marbled salamander), a fall-breeding species, was added for comparison to the fall-
breeding A. annulatum. After analysis of the 2013 data, the spring breeding Notophthalmus
viridescens (eastern newt) was also added for comparison to the spring-breeding A. maculatum.
Genotypes for all species were tested for genetic differentiation using traditional measures of
genetic distance (FST and G'ST) as well as Bayesian analyses to infer genetic partitions.
Landscape resistance was assessed using resistance surfaces generated in ArcGIS. The effects of
distance and landscape resistance surfaces were assessed using CIRCUITSCAPE v4 and
optimized using the "ResistanceGA" package for R. Further, pairwise G’ST was used as the
response variable and scaled effective resistance surfaces as the independent variable in a linear
mixed effects model framework implemented in the "lme4" package for R. Model fits were
assessed using AICC calculated from the linear mixed effects models.
2
Results — Habitat features, especially pond hydroperiod, forested habitat surrounding ponds
including canopy cover, and the presence/absence of fish were found to be the strongest
predictors of A. annulatum and A. maculatum distribution and population dynamics. Evidence
was weak for species interactions being important factors in population dynamics in natural
ponds, but strong evidence was observed for density-dependence and food web organization as
critical components in experimental studies. Although the field data do not clearly support an
important role for species interactions in source-sink dynamics in this system, the experimental
data suggest that caution is warranted, and species interactions should not be disregarded as
important contributors to source-sink dynamics.
The results indicate that metamorph size was strongly affected by intraspecific density and field
observations indicated extensive interpond variability in metamorph size. Size affects dispersal
in that intermediate sized metamorphs dispersed the farthest. A better understanding of the
habitat and ecological factors affecting metamorph size in the field is an important next step to
ensuring population viability and connectivity.
The absence of fish is a key characteristic of source ponds, and it is important that ponds be
located within forested habitat. Field observations support a pattern of most ponds having few
larvae. Spatial variation in larval density was four to ten times greater than temporal variation,
suggesting that few source populations likely occur on the landscape, making their conservation
priority even greater. Because growth in salamanders was affected by pond hydroperiod, it is
recommended that ponds with a mosaic of hydroperiod regimes should be maintained.
Although genetic differentiation was limited, no support was found for land cover or topographic
features to affect gene flow in any species, making such connectivity models irrelevant. Isolation
by distance was evident and significant in A. annulatum, A. maculatum, and A. opacum. For both
A. annulatum and A. maculatum, effective dispersal distances were estimated from the genetic
data. The estimated dispersal distances were used to parameterize a demographic network model,
which was used to assess the local importance of a population to maintaining connectivity,
regional connectivity, and global contribution to gene flow of the entire network.
Benefits — This project’s demographic modelling allowed for the simulation of the likely
number of immigrants, emigrants, and philopatric individuals at each pond, determining average
source-sink status, and assessing more integrative measures such as metapopulation capacity.
Modeling results suggest that populations occur on a continuum of source to sink and that most
populations fluctuate in their contributions.
Results from this model can ultimately be used to improve management concerning removal of
anthropogenic stressors, mitigation of habitat loss, or facilitation of terrestrial and pond
restoration for A. annulatum across FLW at the landscape level. The in-depth understanding of
the source-sink dynamics of this representative species can be used to direct management at
FLW to ensure species persistence, link management at this site to regional dynamics within the
adjacent U.S. Forest Service Mark Twain National Forest, and can be applied to other
ambystomatid salamanders of concern at other DOD facilities (e.g., Ambystoma cingulatum and
Ambystoma bishopi at Fort Stewart, GA or Eglin Air Force Base, FL).

3
Objective
The technical objective of this project was to improve our understanding of source-sink
dynamics for subpopulations and populations of species of relevance to Department of Defense
resource managers (SISON-11-04). Specifically, this project sought to better understand the
impact of landscape heterogeneity on the source-sink dynamics of a species of management
concern (the ringed salamander, Ambystoma annulatum) and a co-occurring species (the spotted
salamander, A. maculatum) at Fort Leonard Wood (FLW), Missouri. We used a multi-faceted
approach in which we combined ecological, genetic, and modeling techniques to assess
populations (i.e. ponds) at multiple spatial and temporal scales. This multi-scale approach
allowed us to investigate the dynamic nature of source-sink populations. We sampled the
abundance of A. annulatum and A. maculatum at local populations across seasons to understand
the environmental features and species interactions associated with reproductive success or
failure of ponds. Across a 7,140 hectare focal area within FLW, we used our data to investigate
connectivity and occupancy in relation to dispersal habitat quality and landscape heterogeneity.
Using polymorphic genetic markers, we inferred levels of gene flow among populations across
the landscape over multiple generations to understand inter-pond dispersal and to identify which
populations were providing emigrants.
We developed connectivity models based on occupancy, GIS habitat analysis, measures of
molecular relatedness, and dispersal inferred from genetic analyses. By using a multi-scale
approach to identify habitat features and species interactions associated with reproductive
success at individual ponds, fine-scale genetic analyses, and the temporal dynamics of each of
these processes, we investigated the contribution of individual populations to source-sink
dynamics and species persistence at FLW.
This project had four specific aims: 1) to identify key environmental conditions associated with
varying levels of reproductive success of A. annulatum to define source habitat patches, 2) to
determine whether species interactions influence source-sink dynamics, 3) to identify habitat
features associated with effective dispersal of A. annulatum among populations to define habitat
connectivity, and 4) to develop models based on circuit and graph theory that can be used to
predict and manage population connectivity for salamanders in heterogeneous landscapes.
The demographic modeling framework was used to determine the optimal locations on the
landscape for future pond construction. The demographic network model has been made
available in an R package called "ssmc" and is available with a fully documented user guide at
https://github.com/wpeterman/ssmc. This approach has great potential to be beneficial and
applicable to other systems in which the available population and life history parameters are
uncertain, and where discrete habitat creation/restoration is an effective management strategy.
4
Background
A clear understanding of metapopulation dynamics and connectivity of habitat patches is
essential for conservation and management as natural habitats become lost, altered, and
fragmented due to changes in land use. This is absolutely required for on-the-ground
management of at-risk species to ensure long-term persistence at a regional level. However, the
spatial and temporal dynamics of metapopulations are not well understood for most species,
especially for globally imperiled amphibians.
Two demographic processes are critical to metapopulation dynamics and species persistence.
First, some local populations must exist in high-quality habitat patches (“sources”; Pulliam 1988)
and produce surplus offspring frequently enough to balance losses in populations that occupy
low-quality habitat ("sinks", Pulliam 1988). Second, connectivity among habitat patches on the
landscape must allow successful dispersal and rescue of sink patches or colonization of new
habitat patches. This second process is the result of species vagility, distance between ponds, and
quality of the matrix between patches. Measurement of both these ecological processes in natural
populations has seldom been achieved (but see Harrison et al. 1988, Hanski et al. 2000,
Schtickzelle and Baguette 2004). Many studies focus on either reproduction alone or on dispersal
and connectivity. However, processes such as source-sink population dynamics require
understanding of both local population dynamics as well functional connectivity through
dispersal. Ultimately, effective landscape-scale management of spatially structured
metapopulations is greatly improved when factors affecting local population dynamics as well as
dispersal and connectivity are considered.
Pond-breeding amphibians are distributed patchily across the landscape and are frequently
assumed to exhibit metapopulation dynamics, especially in fragmented landscapes that may limit
connectivity (Semlitsch 2008, Sinsch 2014). Metapopulations of pond breeding amphibians can
be viewed from a “ponds-as-patches” perspective (Marsh and Trenham 2001, Richter-Boix et al.
2007). Patches include both the aquatic breeding habitat and the immediate surrounding
terrestrial core habitat (95% core area usually within 300 meters) where the adult population is
assumed to reside between breeding seasons (Semlitsch 1998, Semlitsch and Bodie 2003,
Rittenhouse and Semlitsch 2007). Although a small number of juvenile individuals may disperse
to non-natal ponds for breeding (Gamble et al. 2007), many amphibians have high site philopatry
and small local population sizes, which can generate fine-scale population structuring (Beebee
2005). Genetic and statistical analyses are needed to effectively determine if pond-patches
represent populations, subpopulations, or metapopulations.
Amphibians with a complex life cycle (both larval and adult stages) use aquatic habitats,(i.e.,
bogs, vernal pools, wildlife ponds) for mating, ovipositing, and larval growth. Aquatic habitats
are highly dynamic, often filling and drying on an annual basis, and amphibians are specifically
adapted to such processes (Wilbur 1980). The contribution of the aquatic habitat to the
production of metamorphosing juveniles from ponds, a measure of local population recruitment
and measure of individuals available for dispersal, are well understood for a number of species
(e.g., Pechmann et al. 1989, Semlitsch et al. 1996, Berven 2009). Field studies have
demonstrated that pond hydroperiod is a primary predictor of amphibian metamorphic success
(Pechmann et al. 1989). In small, shallow, seasonal ponds or during drought years, ponds dry
5
early and few larvae reach a minimum body size to initiate metamorphosis and most die (e.g., in
South Carolina ponds reproductive failure rates were 42-56% for 13 species over 16 years;
Semlitsch et al. 1996). In large, deep, semi-permanent ponds or in wet years, ponds hold water
longer and may produce large numbers of metamorphs of many species. However, ponds that
persist too long can accumulate predators such as dragonfly larvae, crayfish, or fish that prey on
amphibian larvae and drastically reduce survival of all but a few species, such as bullfrogs
(Lithobates catesbeianus), that are resistant to predation (Shulse et al. 2010, 2012). Other pond
features, such as the presence of emergent vegetation or shallow-slope banks, can ameliorate the
effects of predators (Porej and Hetherington 2005, Shulse et al. 2010).
Salamanders (especially Ambystoma) have a life expectancy great enough (5-10 years) to
experience a few "booms" in recruitment that compensate for adult attrition (Semlitsch et al.
1996). Modeling of amphibian populations indicates that long-lived species can "store" recruits
in terrestrial habitats during these infrequent reproductive booms, whereas short-lived species
cannot and depend more directly on larval success in aquatic habitats (Halpern et al. 2005,
Harper et al. 2008). This pattern of "boom or bust" population dynamics contrasts greatly with
the relatively constant level of annual reproductive success exhibited by most mammals and
birds. This characteristic of amphibian populations means that multiple years of reproductive
failure due to unfavorable aquatic conditions such as rapid drying during drought years or from
anthropogenic factors like ditching or introducing fish can result in decline and eventual
extinction of species at the local pond level (e.g., Semlitsch et al. 1996). Because breeding adults
strongly prefer to return to ponds where they first breed (e.g., Oldham 1966, Breden 1987,
Berven and Grudzien 1990), metamorphosing juveniles are likely the primary dispersal stage
(sensu Gill 1978). A high rate of successful metamorphosis is critical to maintain local adult
populations and produce dispersers to reestablish extirpated populations or found new
populations. So, although ponds are especially critical for reproduction in short-lived species,
terrestrial habitats are especially critical for adult populations in long-lived species, and the
connections among pond populations are essential for regional persistence at the metapopulation
level.
Though the existence of metapopulation dynamics is dependent on species dispersal ability,
direct empirical evidence of dispersal rates between ponds (patches) is rare and inherently
difficult to quantify (see results of a 7-year study by Gamble et al. 2007). Amphibians are
generally thought to have low dispersal capabilities because of their small size and susceptibility
to water loss; estimates of dispersal distances range from only 1-2 km (Berven and Grudzien
1990; Gamble et al. 2007). Behaviorally-based data, however, are constrained by measuring
movement distances during rare dispersal events over a single lifetime whereas rescue or
colonization processes are more likely to occur as the result of a series of movements over
multiple stages and/or generations (Semlitsch 2008). However, using highly variable genetic
markers, one can assess populations (ponds) that relate to each other (i.e., network topology)
based on the level of connectedness, as well as pond importance (Dyer and Nason 2004,
Garroway et al. 2008). For species with high dispersal ability, little to no differentiation will exist
between populations (Sereno et al. 2006), whereas species with limited dispersal ability will be
more severely impacted by fragmentation or habitat heterogeneity and patches may become
completely isolated (Johnson et al. 2004, Richter and Broughton 2005). Major barriers to
terrestrial dispersal (e.g., rivers, roads, row-crops) heavily impact gene flow (Noël et al. 2007,

6
Marsh et al. 2008), but effects of lesser barriers are not always obvious. For example, Marsh et al.
(2005) found that even small forest roads limited the dispersal ability of red-backed salamanders
(Plethodon cinereus) and pastures restricted movement of spotted salamanders (Ambystoma
maculatum; Rittenhouse and Semlitsch 2006).
A conservation and management priority is the identification of high quality habitat and the
factors that predict how populations respond to habitat loss or change. Such information is
essential for habitat restoration and mitigation, and becomes critical when designating habitat
patches as sources or sinks for prioritizing management efforts. Molecular approaches allow for
powerful, indirect measures of movement among populations, and can identify populations that
are net contributors “sources” or receivers “sinks” of dispersing individuals (Barson et al. 2009).
7
Materials and Methods
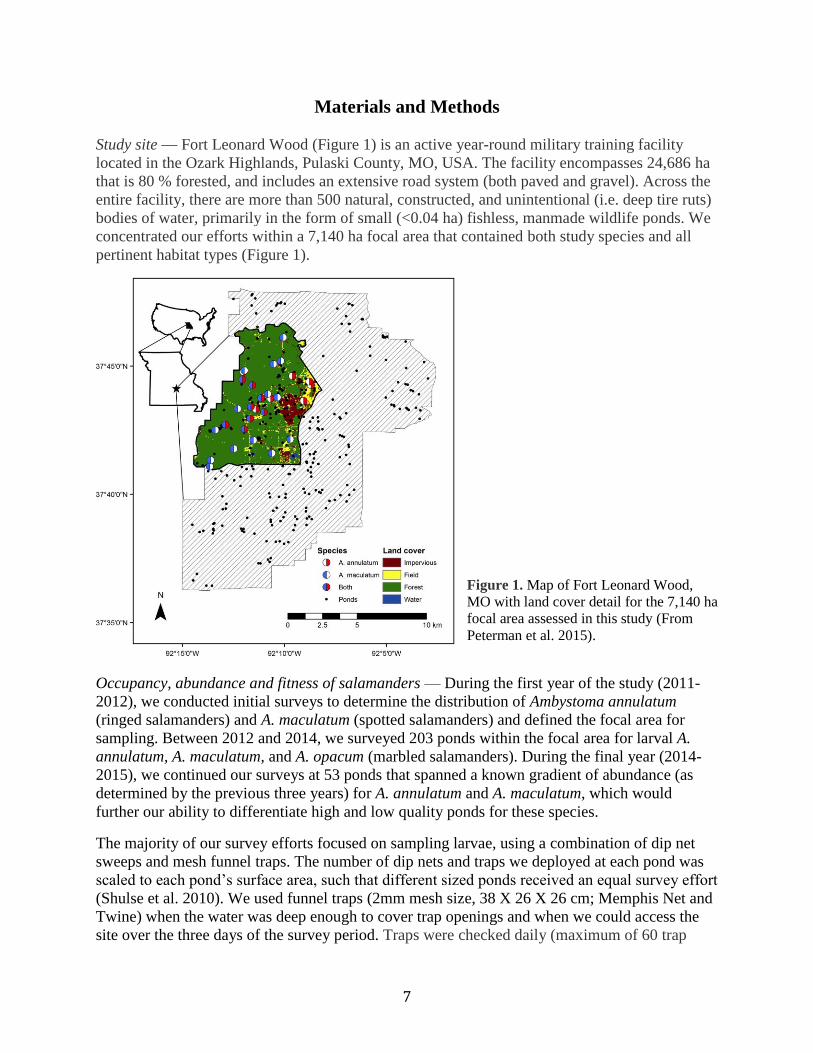
Study site — Fort Leonard Wood (Figure 1) is an active year-round military training facility
located in the Ozark Highlands, Pulaski County, MO, USA. The facility encompasses 24,686 ha
that is 80 % forested, and includes an extensive road system (both paved and gravel). Across the
entire facility, there are more than 500 natural, constructed, and unintentional (i.e. deep tire ruts)
bodies of water, primarily in the form of small (<0.04 ha) fishless, manmade wildlife ponds. We
concentrated our efforts within a 7,140 ha focal area that contained both study species and all
pertinent habitat types (Figure 1).
Figure 1. Map of Fort Leonard Wood,
MO with land cover detail for the 7,140 ha
focal area assessed in this study (From
Peterman et al. 2015).
Occupancy, abundance and fitness of salamanders — During the first year of the study (2011-
2012), we conducted initial surveys to determine the distribution of Ambystoma annulatum
(ringed salamanders) and A. maculatum (spotted salamanders) and defined the focal area for
sampling. Between 2012 and 2014, we surveyed 203 ponds within the focal area for larval A.
annulatum, A. maculatum, and A. opacum (marbled salamanders). During the final year (2014-
2015), we continued our surveys at 53 ponds that spanned a known gradient of abundance (as
determined by the previous three years) for A. annulatum and A. maculatum, which would
further our ability to differentiate high and low quality ponds for these species.
The majority of our survey efforts focused on sampling larvae, using a combination of dip net
sweeps and mesh funnel traps. The number of dip nets and traps we deployed at each pond was
scaled to each pond’s surface area, such that different sized ponds received an equal survey effort
(Shulse et al. 2010). We used funnel traps (2mm mesh size, 38 X 26 X 26 cm; Memphis Net and
Twine) when the water was deep enough to cover trap openings and when we could access the
site over the three days of the survey period. Traps were checked daily (maximum of 60 trap
8
checks per pond over three days). We split our sampling across two time periods within each
year: late February to early April for A. annulatum and A. opacum, and late May and early June
for A. maculatum. These sampling periods occurred at approximately 2/3 of the way through
each species’ larval period. We surveyed each pond for three consecutive days within each
sampling period, and recorded the abundance of each species, as well as the abundance of all
other captured organisms, including invertebrate predators, other amphibians, and fish.
During each year of the study, we also did visual encounter surveys and quadrat sampling for
egg masses (October for A. annulatum and A. opacum; April for A. maculatum), and dip net
surveys for metamorphosing individuals of both species (May for A. annulatum and A. opacum;
June for A. maculatum). Each of these latter surveys involved a single visit to each pond, where
we recorded the number of eggs observed and the number of metamorphs captured, respectively.
Dispersal studies — We measured the repeatability of movement behavior using lab and field
assays. We reared salamanders from hatchlings in 1000 L pond mesocosms and manipulated
larval densities to generate juveniles that differed in size. Animals metamorphosing from low
density mesocosms (hereafter large; mean ± 1 SE: 41.0 mm ± 0.43) were larger than animals
from high density mesocosms (hereafter small; 34.75 mm ± 0.34; ANOVA: F1, 47 = 88.71, P <
0.001). To determine if movement behavior was repeatable, indicative of dispersers being
intrinsically different from residents, we repeatedly measured the activity level of 50 juvenile
salamanders (large: N = 34; small: N = 16) during 10 repeated trials over a three month period (4
June – 9 September 2013). Activity was assayed in circular plastic arenas (8 cm deep x 30.48 cm
diameter) with a moist paper towel substrate. After placing one juvenile in each arena, we
allowed 10 minutes for acclimation and then video recorded behavior for 30 minutes using
camera mounted above the arenas. We analyzed the videos to quantify the distance individuals
moved and their latency to move. To further test intrinsic factors that may predict whether or not
a salamander disperses, we tested the activity of 396 juvenile A. annulatum and 166 juvenile A.
maculatum immediately following metamorphosis by measuring their latency to move and
distance moved in a novel habitat. We then measured nine morphological traits (SVL, head
width and length, tail length and width, humerus and femur length) and regressed the traits
against distance moved.
We also tested whether habitat type or the interaction between body size and habitat affected
initial movement distance in a field study. We used replicated field enclosures to isolate the
effects of natal and juvenile habitat, respectively, on initial movement behavior. Each enclosure
(N = 12; 2 m x 50 m) had plastic weave silt-fencing walls (90 cm tall) buried 15 cm into the
ground. The walls were supported by wooden stakes. At each of the two sites, we constructed
three replicate runways in both closed canopy deciduous forest (i.e. high quality habitat) and
mixed grassland habitat (i.e. low quality habitat). We individually marked each salamander with
a Passive Integrated Transponder (PIT) tag as in Ousterhout and Semlitsch (2014). When used in
tandem with a portable antenna system, PIT tags allow otherwise prohibitively small bodied
animals to be individual tracked from a distance, albeit a small one: 30 cm or less underground;
2499 cm2 in the horizontal plane (the detection field is an ellipse, 24.3 cm in the direction parallel
to the tag (long axis) and 10.6 cm in the direction perpendicular to the tag (short axis); (Connette
and Semlitsch 2012, Ousterhout and Semlitsch 2014). We released cohorts of juvenile
salamander on nights within 24 h of rain, and then tracked their movement daily for seven days
9
using a portable RFID system. We recorded the location of each recapture and calculated total
distance moved.
Landscape studies — We measured pond attributes during sampling each year except in the case
of static variables, which were measured once during the summer of 2012 (Table 1). We
estimated pond area by measuring across the longest and shortest axes using an infrared range
finder (Bushnell Yardage Pro) and multiplying the results. We treated hydroperiod as a
continuous variable in all analyses, but divided it into four categories along a continuum:
ephemeral (dries multiple times every year), seasonal (dries once a year during the summer),
semi-permanent (dries during droughts), and permanent (never dries). Categories were assigned
based on the results of observations made approximately every other month during 2012 and
2013 while conducting other studies, use of temperature loggers to detect drying date (Anderson
et al. 2015), and historical data (K. Lohraff, FLW Wildlife Manager, pers. comm.). We estimated
canopy closure using a spherical densitometer (Forestry Suppliers, Jackson, MS, USA) during
full leaf-out at the four cardinal directions around each pond. We categorized within-pond habitat
variables as emergent vegetation, submerged vegetation, cattails, coarse woody debris,
duckweed, water shield, and lily pads. The percentage of each type was recorded for all ponds in
summer 2012 using quadrat sampling. The slope of the pond basin was quantified by taking
depth measurements at 1- and 2-m distances from the shoreline at multiple locations, calculating
slope, and averaging values for each pond (methods from Semlitsch et al. 2015). Additional
landscape data were gathered from digital orthophotomaps and land cover data layers available
through University of Missouri's Spatial Data Information Center: http://msdis.missouri.edu.
Within-population genetic analyses — We developed species-specific microsatellite loci for A.
annulatum and A. maculatum using a next-generation sequencing approach. During the first year
of the study, we collected tissue samples for each species from FLW, extracted whole genomic
DNA and prepared an Illumina paired-end shotgun library for each species. We analyzed the
data for each species separately, using the program PAL_FINDER v0.02.03 (Castoe et al. 2012)
to extract sequence reads containing microsatellites and developing primers in Primer3 (Rosen
and Skaletsky 2000). We screened candidate loci for each species for amplification and
polymorphism using a panel of seven A. annulatum and seven A. maculatum. From 591
candidate loci for A. maculatum, we screened 68 tetranucleotide loci and selected 18 for use in
the study (Peterman et al. 2013a). From 749 candidate loci, we screened 150 tetra- and
pentanucleotide loci for the A. annulatum and selected 22 for the study (Peterman et al. 2013b).
We collected samples during the field sampling phase of the study between 2012 and 2014. In
March–April, 2012, we collected 12–53 A. annulatum from 20 ponds and 10–54 A. maculatum
from 23 ponds within the focal area. We collected tail clips from late stage larvae of A.
annulatum, and to minimize sampling of siblings, we sampled larvae systematically from the
entire perimeter of the pond. For A. maculatum, we collected one late stage embryo from each
individual egg mass. During spring 2013 for A. maculatum and fall 2013 for A. annulatum, we
collected 332 A. maculatum late stage embryos from 17 ponds and 421 A. annulatum late stage
embryos or larval tail clips from 19 ponds. All samples were collected during the breeding
season to minimize the among year variation. We lumped all individuals sampled in ponds
within 100 m of each other into one group for downstream analysis due to the likelihood of
individuals within these ponds being closely related.
10
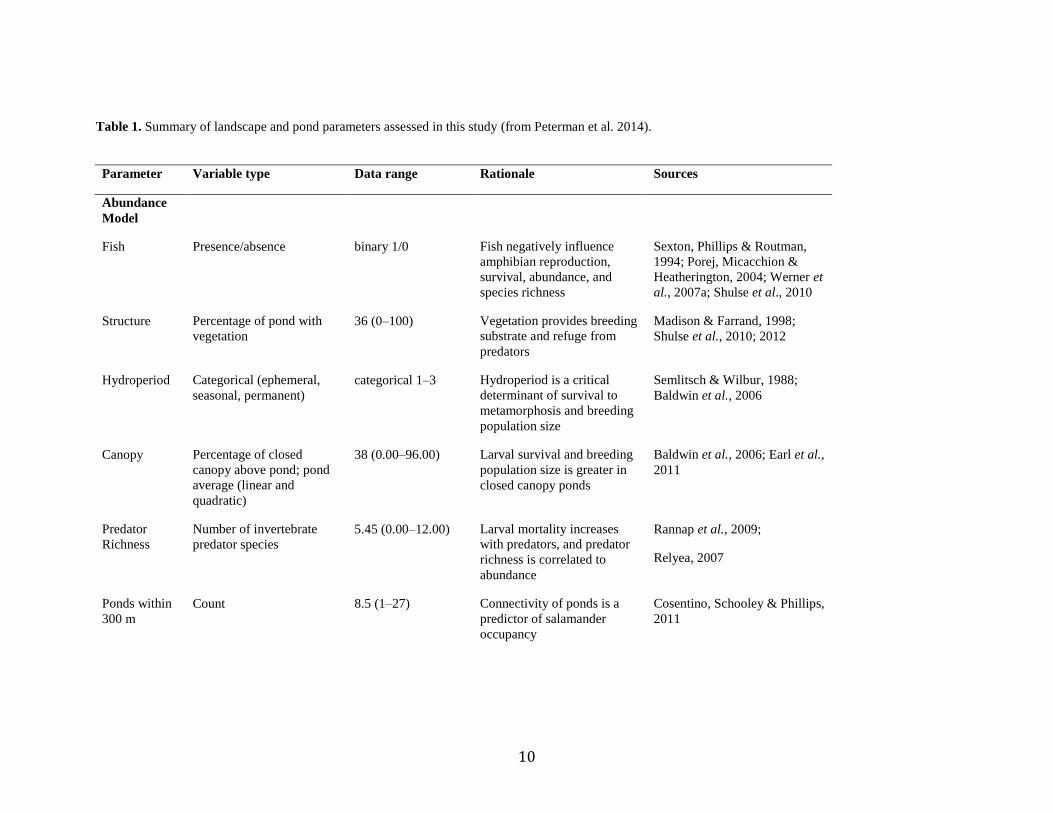
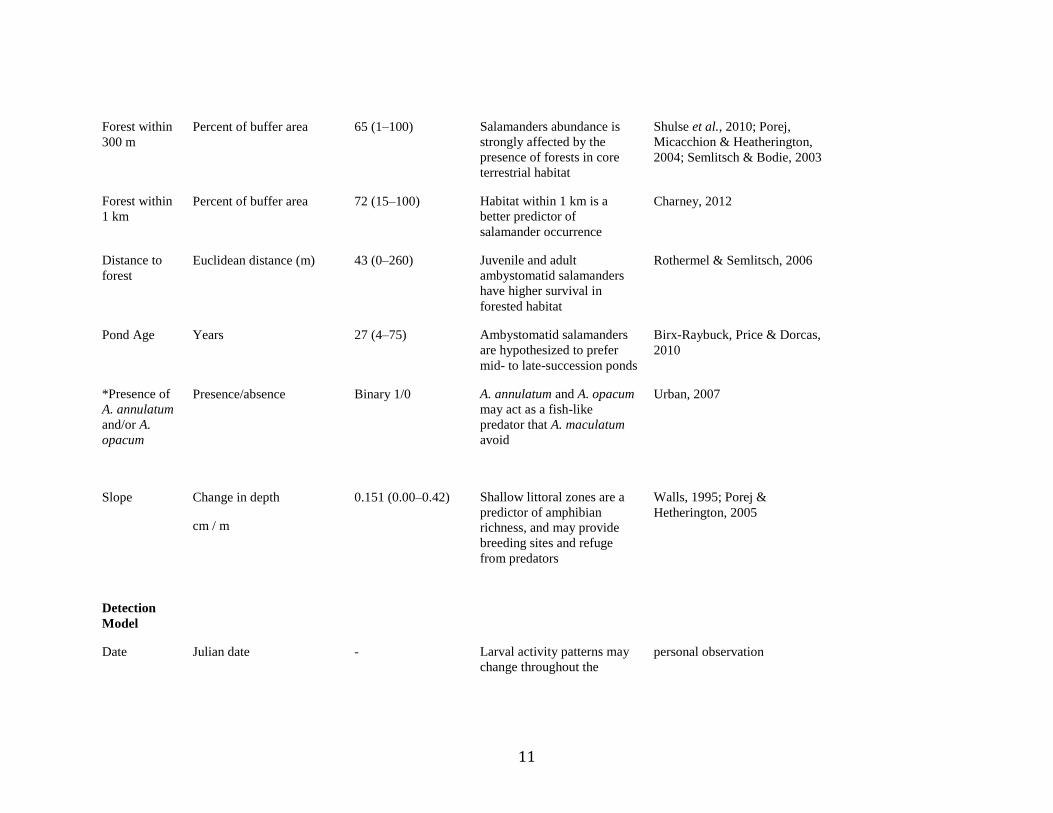
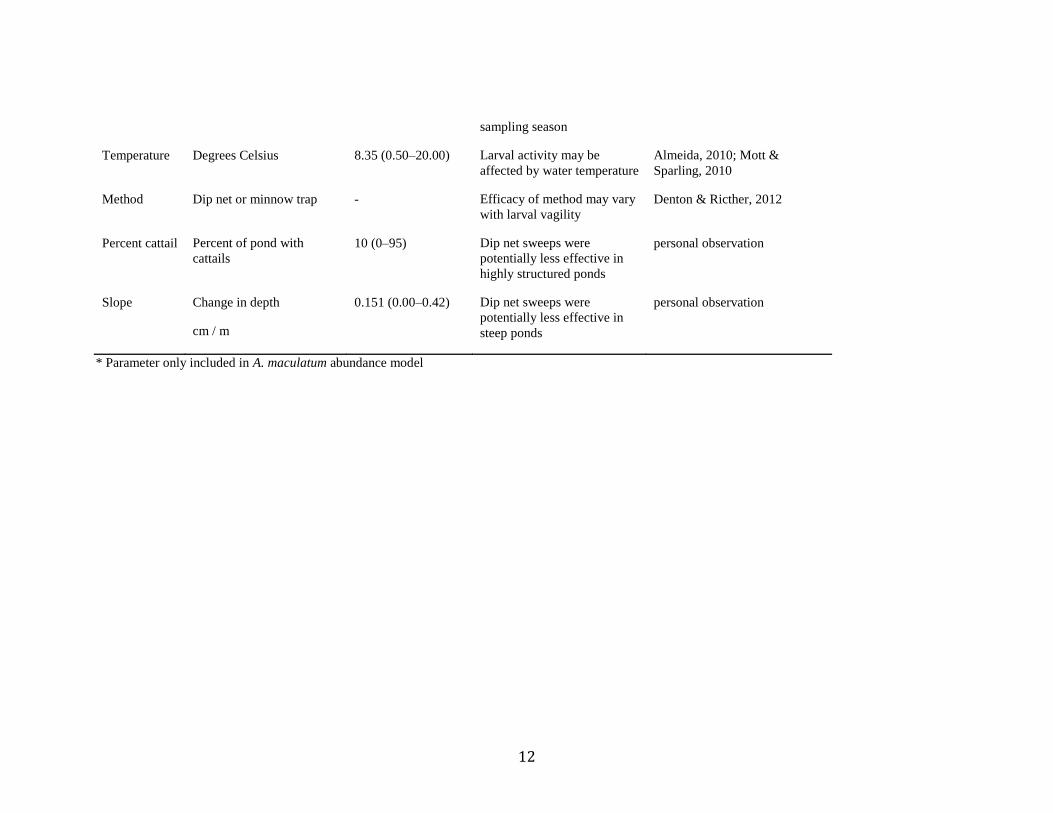
Table 1. Summary of landscape and pond parameters assessed in this study (from Peterman et al. 2014).
Parameter Variable type Data range Rationale Sources
Abundance
Model
Fish Presence/absence binary 1/0 Fish negatively influence
amphibian reproduction,
survival, abundance, and
species richness
Sexton, Phillips & Routman,
1994; Porej, Micacchion &
Heatherington, 2004; Werner et
al., 2007a; Shulse et al., 2010
Structure Percentage of pond with
vegetation
36 (0–100) Vegetation provides breeding
substrate and refuge from
predators
Madison & Farrand, 1998;
Shulse et al., 2010; 2012
Hydroperiod Categorical (ephemeral,
seasonal, permanent)
categorical 1–3 Hydroperiod is a critical
determinant of survival to
metamorphosis and breeding
population size
Semlitsch & Wilbur, 1988;
Baldwin et al., 2006
Canopy Percentage of closed
canopy above pond; pond
average (linear and
quadratic)
38 (0.00–96.00) Larval survival and breeding
population size is greater in
closed canopy ponds
Baldwin et al., 2006; Earl et al.,
2011
Predator
Richness
Number of invertebrate
predator species
5.45 (0.00–12.00) Larval mortality increases
with predators, and predator
richness is correlated to
abundance
Rannap et al., 2009;
Relyea, 2007
Ponds within
300 m
Count 8.5 (1–27) Connectivity of ponds is a
predictor of salamander
occupancy
Cosentino, Schooley & Phillips,
2011
11
Forest within
300 m
Percent of buffer area 65 (1–100) Salamanders abundance is
strongly affected by the
presence of forests in core
terrestrial habitat
Shulse et al., 2010; Porej,
Micacchion & Heatherington,
2004; Semlitsch & Bodie, 2003
Forest within
1 km
Percent of buffer area 72 (15–100) Habitat within 1 km is a
better predictor of
salamander occurrence
Charney, 2012
Distance to
forest
Euclidean distance (m) 43 (0–260) Juvenile and adult
ambystomatid salamanders
have higher survival in
forested habitat
Rothermel & Semlitsch, 2006
Pond Age Years 27 (4–75) Ambystomatid salamanders
are hypothesized to prefer
mid- to late-succession ponds
Birx-Raybuck, Price & Dorcas,
2010
*Presence of
A. annulatum
and/or A.
opacum
Presence/absence Binary 1/0 A. annulatum and A. opacum
may act as a fish-like
predator that A. maculatum
avoid
Urban, 2007
Slope Change in depth
cm / m
0.151 (0.00–0.42) Shallow littoral zones are a
predictor of amphibian
richness, and may provide
breeding sites and refuge
from predators
Walls, 1995; Porej &
Hetherington, 2005
Detection
Model
Date Julian date - Larval activity patterns may
change throughout the
personal observation
12
sampling season
Temperature Degrees Celsius 8.35 (0.50–20.00) Larval activity may be
affected by water temperature
Almeida, 2010; Mott &
Sparling, 2010
Method Dip net or minnow trap - Efficacy of method may vary
with larval vagility
Denton & Ricther, 2012
Percent cattail Percent of pond with
cattails
10 (0–95) Dip net sweeps were
potentially less effective in
highly structured ponds
personal observation
Slope Change in depth
cm / m
0.151 (0.00–0.42) Dip net sweeps were
potentially less effective in
steep ponds
personal observation
* Parameter only included in A. maculatum abundance model
13
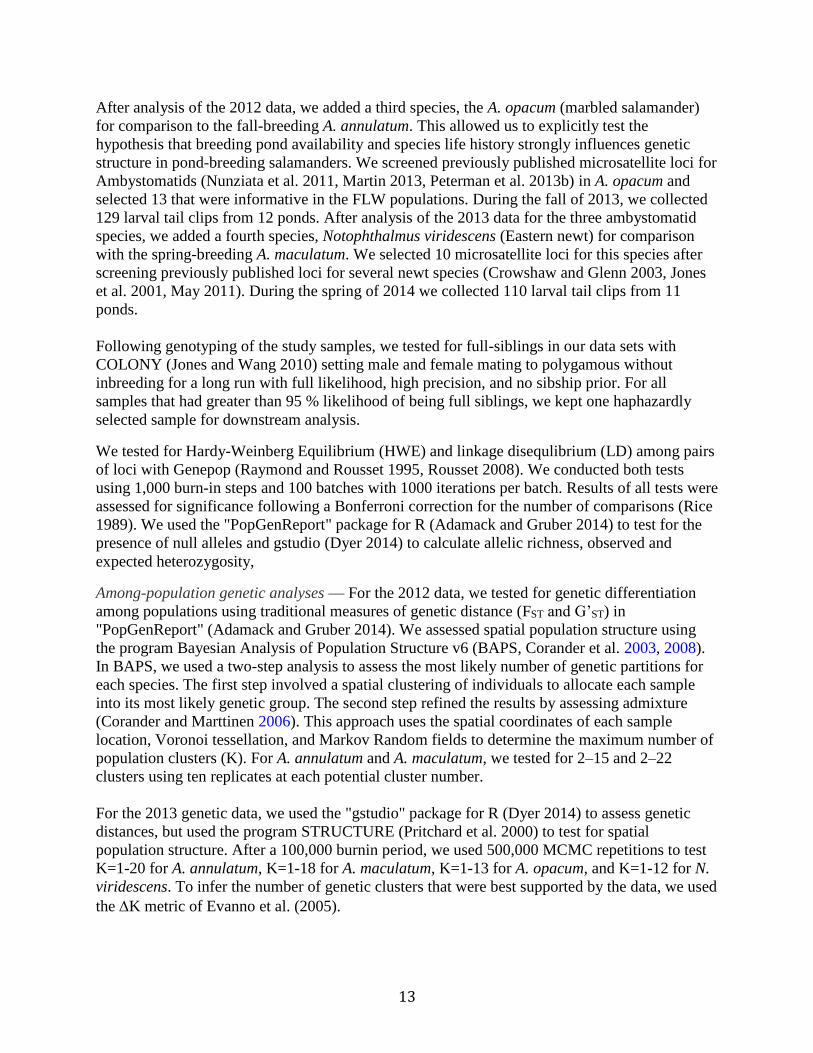
After analysis of the 2012 data, we added a third species, the A. opacum (marbled salamander)
for comparison to the fall-breeding A. annulatum. This allowed us to explicitly test the
hypothesis that breeding pond availability and species life history strongly influences genetic
structure in pond-breeding salamanders. We screened previously published microsatellite loci for
Ambystomatids (Nunziata et al. 2011, Martin 2013, Peterman et al. 2013b) in A. opacum and
selected 13 that were informative in the FLW populations. During the fall of 2013, we collected
129 larval tail clips from 12 ponds. After analysis of the 2013 data for the three ambystomatid
species, we added a fourth species, Notophthalmus viridescens (Eastern newt) for comparison
with the spring-breeding A. maculatum. We selected 10 microsatellite loci for this species after
screening previously published loci for several newt species (Crowshaw and Glenn 2003, Jones
et al. 2001, May 2011). During the spring of 2014 we collected 110 larval tail clips from 11
ponds.
Following genotyping of the study samples, we tested for full-siblings in our data sets with
COLONY (Jones and Wang 2010) setting male and female mating to polygamous without
inbreeding for a long run with full likelihood, high precision, and no sibship prior. For all
samples that had greater than 95 % likelihood of being full siblings, we kept one haphazardly
selected sample for downstream analysis.
We tested for Hardy-Weinberg Equilibrium (HWE) and linkage disequlibrium (LD) among pairs
of loci with Genepop (Raymond and Rousset 1995, Rousset 2008). We conducted both tests
using 1,000 burn-in steps and 100 batches with 1000 iterations per batch. Results of all tests were
assessed for significance following a Bonferroni correction for the number of comparisons (Rice
1989). We used the "PopGenReport" package for R (Adamack and Gruber 2014) to test for the
presence of null alleles and gstudio (Dyer 2014) to calculate allelic richness, observed and
expected heterozygosity,
Among-population genetic analyses — For the 2012 data, we tested for genetic differentiation
among populations using traditional measures of genetic distance (FST and G’ST) in
"PopGenReport" (Adamack and Gruber 2014). We assessed spatial population structure using
the program Bayesian Analysis of Population Structure v6 (BAPS, Corander et al. 2003, 2008).
In BAPS, we used a two-step analysis to assess the most likely number of genetic partitions for
each species. The first step involved a spatial clustering of individuals to allocate each sample
into its most likely genetic group. The second step refined the results by assessing admixture
(Corander and Marttinen 2006). This approach uses the spatial coordinates of each sample
location, Voronoi tessellation, and Markov Random fields to determine the maximum number of
population clusters (K). For A. annulatum and A. maculatum, we tested for 2–15 and 2–22
clusters using ten replicates at each potential cluster number.
For the 2013 genetic data, we used the "gstudio" package for R (Dyer 2014) to assess genetic
distances, but used the program STRUCTURE (Pritchard et al. 2000) to test for spatial
population structure. After a 100,000 burnin period, we used 500,000 MCMC repetitions to test
K=1-20 for A. annulatum, K=1-18 for A. maculatum, K=1-13 for A. opacum, and K=1-12 for N.
viridescens. To infer the number of genetic clusters that were best supported by the data, we used
the K metric of Evanno et al. (2005).
14
Landscape resistance — The main objective of our landscape genetic analyses was to determine
the features of the landscape that most affected dispersal, as measured by genetic differentiation
between pairs of breeding ponds that were sampled in 2012. Additionally, we sought to
determine rate and direction of gene flow through the use assignment tests or coalescent
modeling. We generated landscape resistance surfaces using ArcGIS v10.3 (ESRI, Redlands, CA,
USA) in order to test our hypothesis that the species differ in their response to landscape usage.
Resistance surfaces were as follows: slope, aspect, land cover (forest, open water, field, and
developed), topographic position index (Jenness 2006), topographic wetness index (Theobold
2007), and distance from ravine. With the exception of our land cover data that was downloaded
from the U.S. Geological Survey (USGS, http://view.nationalmap.gov), all other surfaces were
derived from 90 m resolution USGS elevation data following the methods outlined in Peterman
and Semlitsch (2013). We iteratively tested the effects of distance and landscape resistance
surfaces following the methods of Peterman et al. (2014b) within the "ResistanceGA" package
for R (Peterman 2014, R Core Team 2015). We chose to assess landscape resistance using
CIRCUITSCAPE v4.0 (McRae 2006) rather than least cost paths. CIRCUITSCAPE models
random movement between populations across multiple pathways, while least cost path analysis
assumes a single optimal pathway, the former better approximates dispersal and movement
behavior of amphibians (Rittenhouse and Semlitsch 2006). Further, we used pairwise G’ST as the
response variable and centered and scaled effective resistance surfaces as the independent
variable in a linear mixed effects model framework implement in the "lme4" package for R
(Bates et al. 2015). We assessed model fits using AICC calculated from our linear mixed effects
models.
Source-sink dynamics — Ultimately, source-sink dynamics within our system were assessed by
combining pond-level abundance and size data with genetic-based dispersal data in a stochastic
connectivity model. This model probabilistically distributes metamorphs produced from a pond
across the landscape to adjacent ponds as a function of (1) survival, (2) probability of remaining
philopatric to their natal pond, and (3) dispersal ability, which was modeled as a negative
exponential decay. Metamorphs that survive and disperse in the model are distributed among
adjacent ponds as a function of their probability of connectivity. From this model we were able
to identify populations that were net producers (sources) and receivers (sinks) of salamanders.
We were unable to rigorously assess population growth rates because of the longevity and life
history of ambystomatid salamanders. Specifically, ambystomatid salamanders reach sexual
maturity in 2–4 years, can live for up to 10 years, and breeding effort is largely tied to
temperature and precipitation events. As such, assessment of local population growth rates would
require longer-term monitoring and marking of individuals. However, we were able to identify
some populations that were definitive sinks on our landscape. Specifically, when we found eggs
deposited in ponds containing fish (predators of ambystomatid eggs and larvae) or in ephemeral
ponds that dried before metamorphosis could be completed
Species interactions — We assessed interspecific interactions between A. annulatum and A.
maculatum using a combination of outdoor mesocosm and indoor microcosm experiments. The
outdoor mesocosm experiments were conducted in 1000 L cattle water tanks that were designed
to mimic natural pond communities, as we controlled the initial inputs (e.g. leaf litter, planktonic
organisms) but manipulated variables of interest (e.g. larval density). Microcosm experiments
were conducted in aquaria indoors under controlled environmental conditions, which permitted

15
more mechanistic tests of different ecological processes. We analyzed body size and survival of
each species to assess their effect on one another.
16
Results and Discussion
Occupancy, abundance and fitness of salamanders — We found that a combination of abiotic
and biotic factors influenced larval occupancy and abundance of A. annulatum, A. maculatum,
and A. opacum (Peterman et al. 2014, Ousterhout et al. 2015, Anderson et al. 2015). For all
species, the presence of fish, including gamefish (Centrachidae), mosquitofish (Gambusia spp.)
and other minnows (Cyprindae), severely reduced both the probability of occupancy of larval
salamanders and their abundance (see Figure 2 in Anderson et al. 2015). In many cases, breeding
efforts of all species ranged from absent to a single female in ponds with fish; in the few
instances where breeding was attempted, we rarely encountered larvae, suggesting no
recruitment from fish occupied ponds. Ponds with fish act either as unusable habitat or a sink
habitat if salamanders deposit eggs. Therefore, absence of fish is a key characteristic of source
ponds.
Because we repeatedly sampled ponds over three days, we were able to assess how detection
probability varied among our focal species. For A. annulatum, we found that warmer water
temperature (which was strongly correlated with sampling date) resulted in increased detection
probability for occupancy analyses. Sampling for larvae of A. annulatum occurred during the
late-winter and early-spring. During this time, the deeper regions of ponds maintain a more
constant temperature than the shallower edges where we sampled, which more closely mirrored
the air temperature. Detection of larvae may have been higher with warmer temperatures,
because of a shift in habitat use from the more stable, deeper sections of the pond to the more
variable edges of the pond that we sampled. We did not find any covariates that significantly
influenced detection of A. maculatum in either an occupancy or abundance framework (Peterman
et al. 2014, Anderson et al. 2015). In general, there was large variation in captures between days,
indicating that multiple samples at a site will be needed to approximate the true abundance of
animals. Our results indicate that consideration of seasonal effects on sampling procedures will
likely improve detection of animals, leading to less bias in abundance or density estimates.
When comparing populations of A. annulatum over time, we found a strong correlation of
consistently high densities of larvae between years for some ponds. In contrast, other ponds
showed high stochasticity in larval densities, which is consistent with the "hot-spot" model of
spatial demography (Gill 1978). Certain ponds are consistently sources, producing numerous
recruits into the metapopulation, whereas others are either not contributing at all, or acting as
sink habitats. Identification of each type of population is crucial in conservation planning so as to
preserve regional connectivity and promote persistence through protection of the source habitats.
We also observed a pattern of most ponds having few larvae, and only a few ponds have higher
densities; spatial variation in larval density was four to ten times greater than temporal variation.
This would suggest that the number of source habitats is minimal, making their conservation
priority even greater.
Size at metamorphosis is a predictor of eventual fitness in pond breeding amphibians.
Specifically, amphibians that metamorphose at smaller size have an increased risk of desiccation,
depressed immune function, lower lipid levels and survival, later age of first reproduction, and
lower fecundity (Scott 1994, Davis and Maerz 2009, Peterman et al. 2013c). We found a strong
correlation between individual size during the mid-larval and late-larval stages. This indicates
the size of larvae may be a predictor of a pond’s contribution to the metapopulation, i.e. whether
17
it is a source or sink. While we found a strong negative relationship between population density
and size at metamorphosis in mesocosm studies (Ousterhout and Semlitsch unpublished data,
Anderson and Semlitsch 2014), in natural ponds intraspecific density had only a small effect on
body size (Ousterhout et al 2015). From our sampling, fitness, as predicted by larval body size,
was most strongly affected by the density of other Ambystoma salamanders. Both A. annulatum
and A. maculatum were smaller in ponds that had a higher density of A. opacum (Ousterhout et al
2015). Further experiments with A. opacum are necessary to tease apart the mechanism of this
relationship.
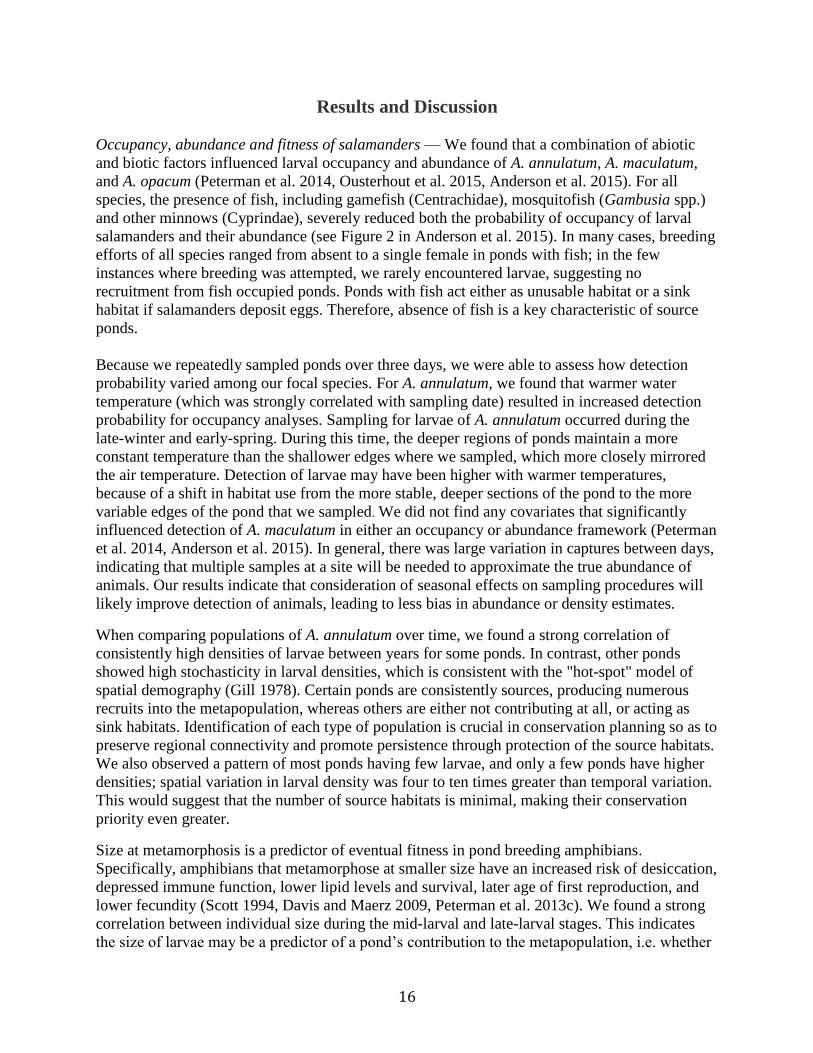
Dispersal — Despite the importance of dispersal to connecting source and sink habitats, there
are significant gaps in our understanding of dispersal processes (Hanski 2004). We
complemented the genetic approaches that sought to describe patterns of dispersal based on gene
flow and the distribution of genotypes across the landscape with a series of laboratory and field
experiments to examine factors affecting the propensity of an individual to disperse. Preliminary
investigations suggest that dispersers differ from residents in a non-random manner. The
movement behavior of individuals was consistent over a three-month period. In addition, we
observed inter-individual variation in the distances moved, with larger bodied animals moving
farther than small juveniles (Figure 2).
Figure 2. Observed frequency of distance moved (m) by juvenile body size in laboratory study. Dashed vertical line
represents the mean from all trials.
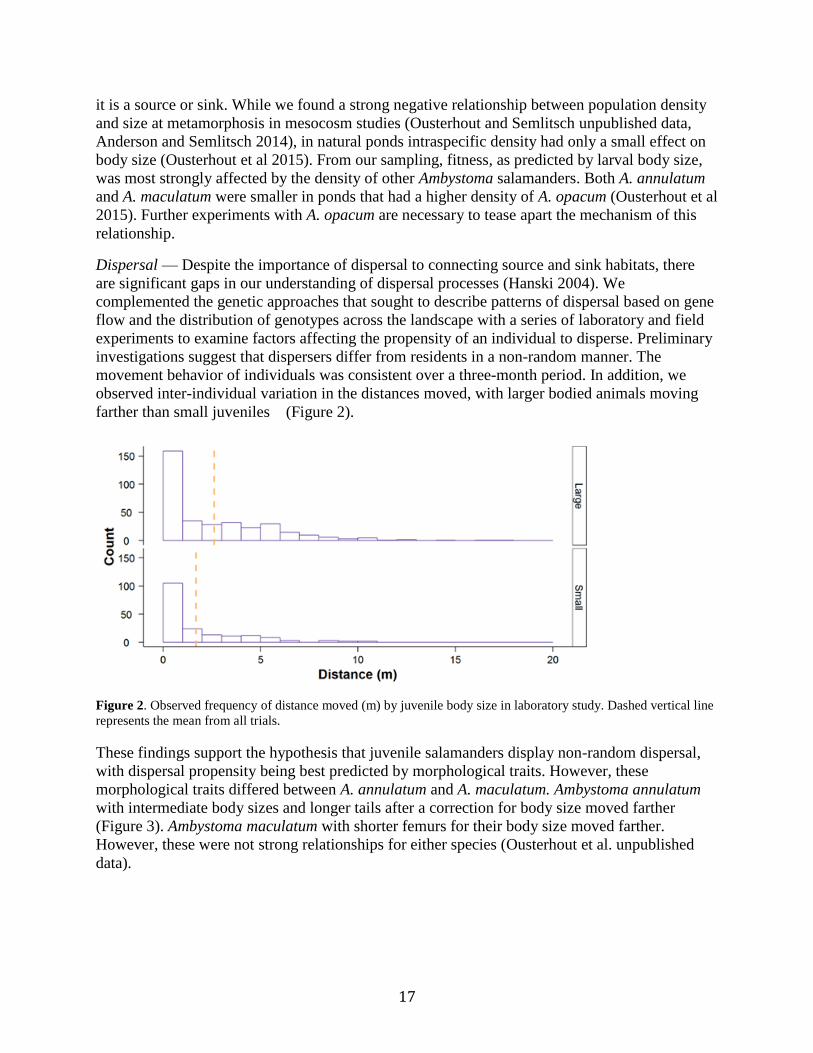
These findings support the hypothesis that juvenile salamanders display non-random dispersal,
with dispersal propensity being best predicted by morphological traits. However, these
morphological traits differed between A. annulatum and A. maculatum. Ambystoma annulatum
with intermediate body sizes and longer tails after a correction for body size moved farther
(Figure 3). Ambystoma maculatum with shorter femurs for their body size moved farther.
However, these were not strong relationships for either species (Ousterhout et al. unpublished
data).
18
Figure 3. Activity in the lab (distance moved) of A. annulatum was predicted by body size (left) and the body size
independent residual of tail length (middle). A. maculatum movement was predicted by femur length (right).
Although we found support for factors intrinsic to the individual predicting whether an
individual is likely to disperse (e.g. body size), 67% of variation in movement behavior was not
specific to the individual. This indicates that factors extrinsic to the individual (e.g. habitat
quality, density dependence) play an important role in moderating movement behavior. Indeed,
in a field assay of juvenile movement, we found that both juvenile body size and habitat quality
affected how far animals moved over a week. Ambystoma annulatum of a medium body size
moved the farthest, mirroring our findings in the activity assay. This finding suggests that ponds
which produce intermediate sized individuals will contribute more individuals with a propensity
to disperse within the metapopulation. Juveniles moved farther in forested habitats, indicating
that high quality habitat may facilitate dispersal between pond populations. Ambystoma
annulatum moved more frequently in grassland habitat, which is low quality for these forest
dependent species (Ousterhout and Semlitsch unpublished data). We interpret this as individuals
minimizing risk by moving quickly through unfavorable areas.
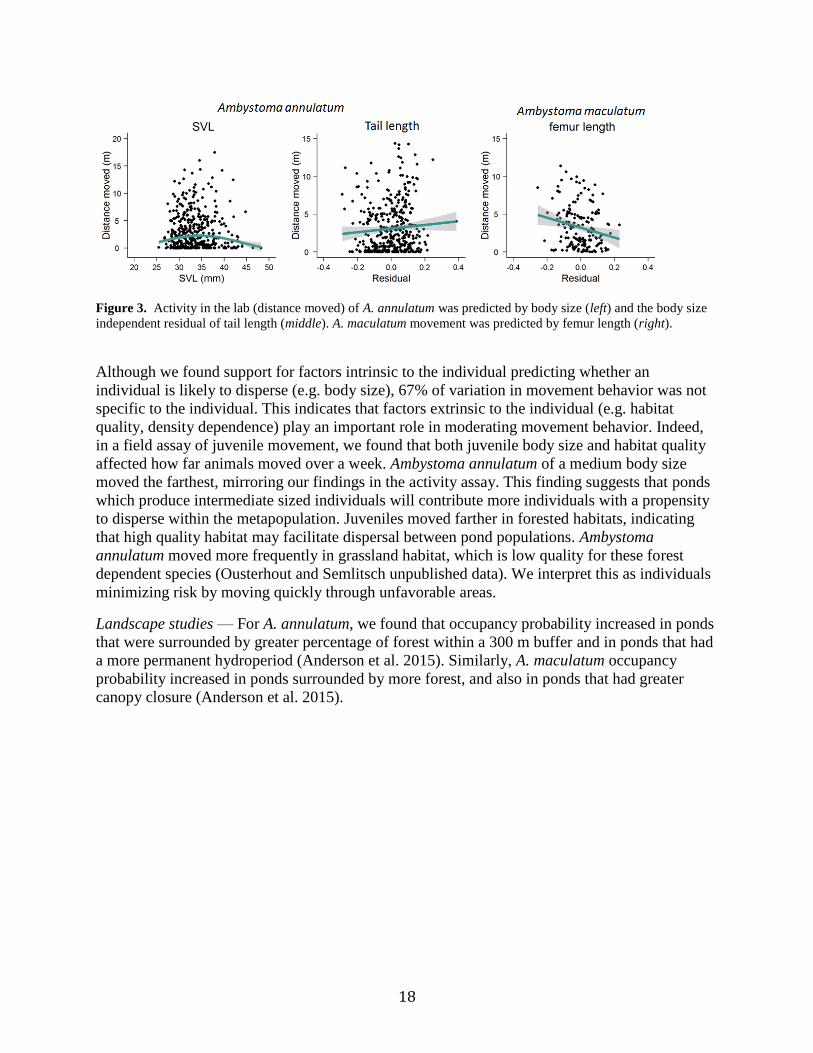
Landscape studies — For A. annulatum, we found that occupancy probability increased in ponds
that were surrounded by greater percentage of forest within a 300 m buffer and in ponds that had
a more permanent hydroperiod (Anderson et al. 2015). Similarly, A. maculatum occupancy
probability increased in ponds surrounded by more forest, and also in ponds that had greater
canopy closure (Anderson et al. 2015).
19
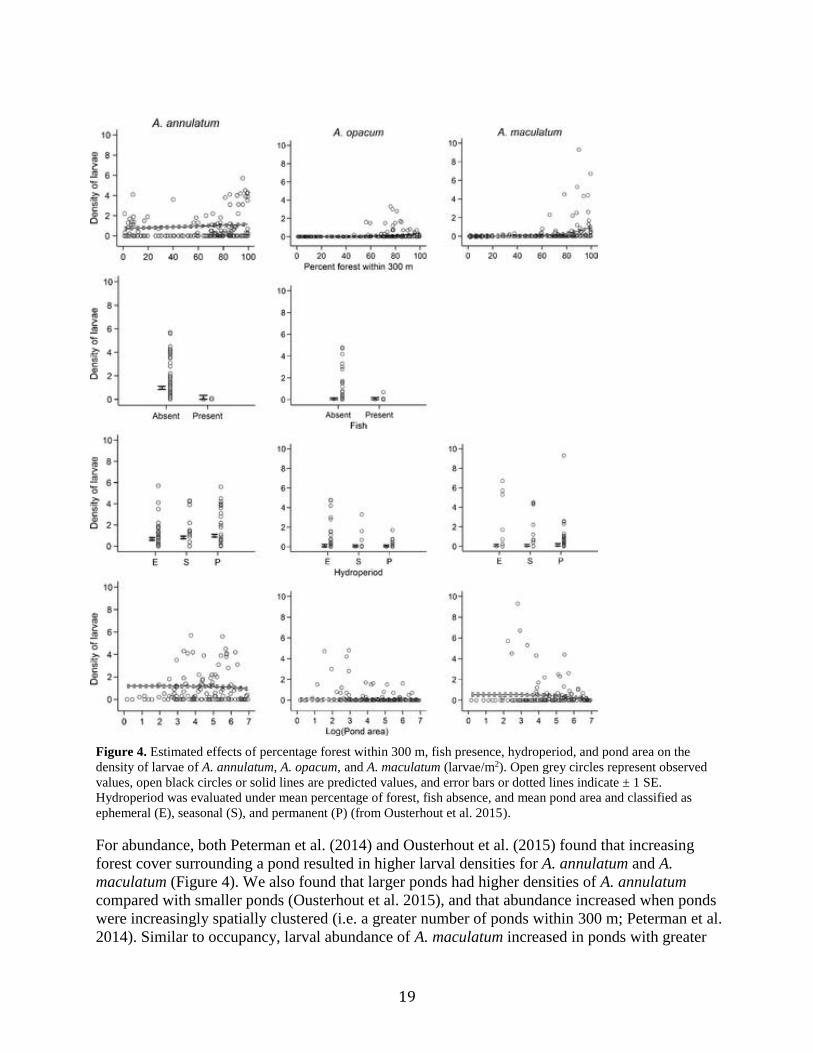
Figure 4. Estimated effects of percentage forest within 300 m, fish presence, hydroperiod, and pond area on the
density of larvae of A. annulatum, A. opacum, and A. maculatum (larvae/m2). Open grey circles represent observed
values, open black circles or solid lines are predicted values, and error bars or dotted lines indicate ± 1 SE.
Hydroperiod was evaluated under mean percentage of forest, fish absence, and mean pond area and classified as
ephemeral (E), seasonal (S), and permanent (P) (from Ousterhout et al. 2015).
For abundance, both Peterman et al. (2014) and Ousterhout et al. (2015) found that increasing
forest cover surrounding a pond resulted in higher larval densities for A. annulatum and A.
maculatum (Figure 4). We also found that larger ponds had higher densities of A. annulatum
compared with smaller ponds (Ousterhout et al. 2015), and that abundance increased when ponds
were increasingly spatially clustered (i.e. a greater number of ponds within 300 m; Peterman et al.
2014). Similar to occupancy, larval abundance of A. maculatum increased in ponds with greater
20
canopy closure (Peterman et al. 2014). Maintaining such habitat features (forested habitat with
high canopy closure) will likely benefit both our focal species, as well as other amphibians.
In addition to pond and landscape traits, climatic factors played a significant role in determining
larval occupancy. Missouri experienced a severe drought that persisted from March to November
2012, and had significant but different consequences for A. annulatum and A. maculatum
(Anderson et al. 2015). The onset of the drought coincided with the breeding period for A.
maculatum; due to the drought, 34% of ponds where A. maculatum bred in 2012 dried prior to
any larvae completing metamorphosis (i.e. complete reproductive failure, Table 2). Because A.
annulatum requires more permanent ponds to complete their life cycle, such reproductive failure
was not observed, as their ponds did not dry. However, the drought continued through the
breeding period of A. annulatum (October), which resulted in a 15% reduction in the number of
available ponds (i.e. ponds dried and did not refill). Identifying and incorporating such
differential responses to environmental factors based on life history differences may be critical in
conservation planning, particularly when evaluating the minimum necessary requirements of
each species as well the factors that promote source versus sink habitat. Specifically, we
recommend that ponds with a mosaic of hydroperiod regimes should be maintained to safeguard
against regional population failure from climatic factors such as drought.
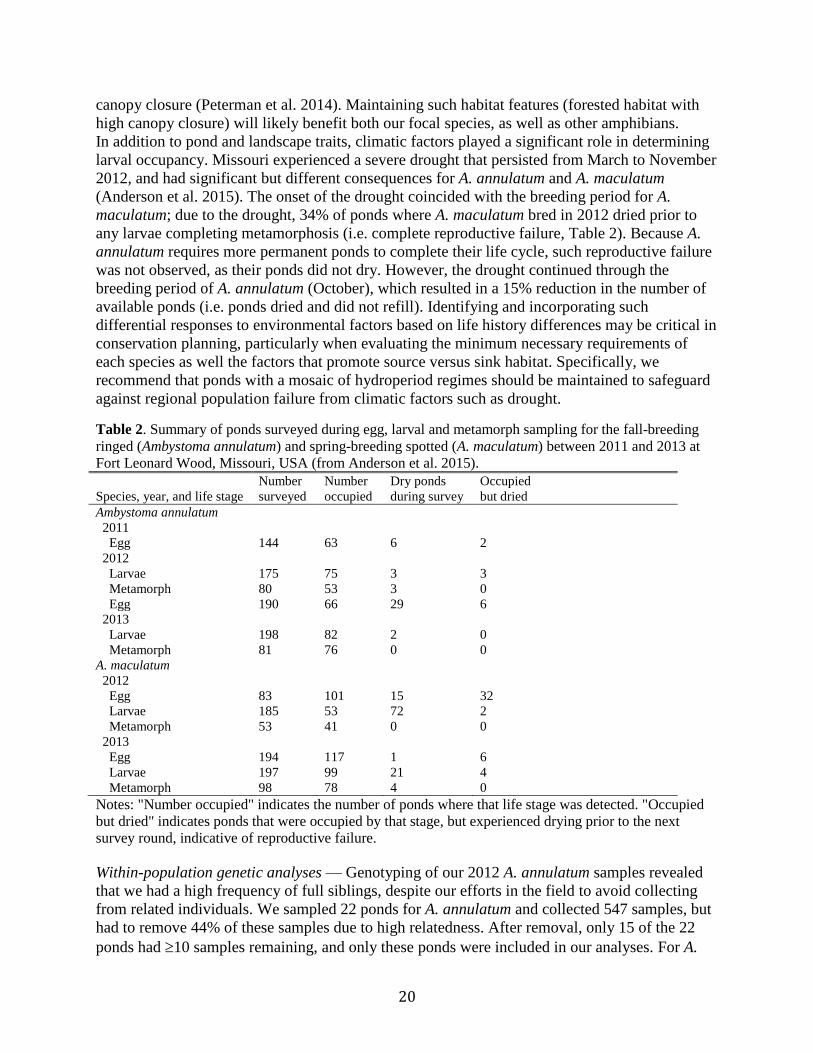
Table 2. Summary of ponds surveyed during egg, larval and metamorph sampling for the fall-breeding
ringed (Ambystoma annulatum) and spring-breeding spotted (A. maculatum) between 2011 and 2013 at
Fort Leonard Wood, Missouri, USA (from Anderson et al. 2015).
Species, year, and life stage
Number
surveyed
Number
occupied
Dry ponds
during survey
Occupied
but dried
Ambystoma annulatum
2011
Egg 144 63 6 2
2012
Larvae 175 75 3 3
Metamorph 80 53 3 0
Egg 190 66 29 6
2013
Larvae 198 82 2 0
Metamorph 81 76 0 0
A. maculatum
2012
Egg 83 101 15 32
Larvae 185 53 72 2
Metamorph 53 41 0 0
2013
Egg 194 117 1 6
Larvae 197 99 21 4
Metamorph 98 78 4 0
Notes: "Number occupied" indicates the number of ponds where that life stage was detected. "Occupied
but dried" indicates ponds that were occupied by that stage, but experienced drying prior to the next
survey round, indicative of reproductive failure.
Within-population genetic analyses — Genotyping of our 2012 A. annulatum samples revealed
that we had a high frequency of full siblings, despite our efforts in the field to avoid collecting
from related individuals. We sampled 22 ponds for A. annulatum and collected 547 samples, but
had to remove 44% of these samples due to high relatedness. After removal, only 15 of the 22
ponds had 10 samples remaining, and only these ponds were included in our analyses. For A.
21
maculatum, we removed 1.5% of the genotyped samples due to high relatedness, and only one of
the 23 ponds from which we collected samples was removed from the analyses due to having
insufficient sample size. We found no evidence of linkage disequilibrium for any pairs of loci in
either species. For A. annulatum, four microsatellite loci (Aa_37, Aa_45, Aa_31, and Aa_4)
deviated significantly from heterozygosity values expected under Hardy-Weinberg equilibrium
(HWE). Further analyses suggested that these loci contained null alleles, thus we removed them
and conducted our final analyses using 15 loci. For A. maculatum, no pond or locus deviated
significantly from expectations under HWE, but one locus (Am_60) was monomorphic; we
conducted our final analyses using 18 loci. We found moderate levels of genetic variability
(Table 3) as defined by allelic richness and observed heterozygosity in both species. The
inbreeding coefficient F'IS values suggest that individual ponds do not contain inbred individuals.
For 2013-2014, we genotyped additional samples from A. annulatum and A. maculatum, as well
as samples from A. opacum and N. viridescens. We found no evidence of linkage disequilibrium
for any pairs of loci in any species. For A. annulatum, we found no evidence of null alleles or
significant deviations from HWE and a low percentage of full siblings; we were able to include
19 microsatellite loci in our final analyses. For A. maculatum, we also found no evidence of null
alleles or significant deviations from HWE and a very low percentage of full siblings. Our
analyses for this species included 17 of the 18 loci used in the 2012 study. For A. opacum, we
found that no locus deviated significantly from HWE, but that two of the 14 we optimized for
this species were monomorphic. Analysis in COLONY suggested that two of the 129 individuals
we genotyped were full siblings, thus our final analyses included 128 individuals from 10 ponds
that were genotyped at 12 loci. For N. viridescens, we found no evidence of null alleles and no
full siblings. Two of the 10 microsatellite loci were excluded from further analyses as one was
monomorphic and the other deviated significantly from HWE. Our final analyses for this species
included 110 individuals from 11 ponds that were genotyped at eight microsatellite loci.
Although allelic richness and F'IS were slightly higher for A. annulatum and A. maculatum in
2013 than in 2012, the differences were not statistically significant (Table 3). Our analysis of A.
opacum in 2013 revealed that this species has significantly lower heterozygosity and allelic
diversity and higher F'IS than either A. maculatum or A. annulatum, likely as a result of smaller
population sizes at FLW. Our 2014 study of N. viridescens found higher allelic richness than any
of the Ambystoma species but similar levels of heterozygosity. This species has a complex life
history, as larvae develop in ponds and after 2-6 months, metamorphose into the terrestrial “eft”
stage known to disperse for up to 7 years over long distances (Gill 1978). After a second
metamorphosis, they become aquatic breeding adults. These life history differences make it
difficult to interpret differences in allelic richness and F'IS.
22
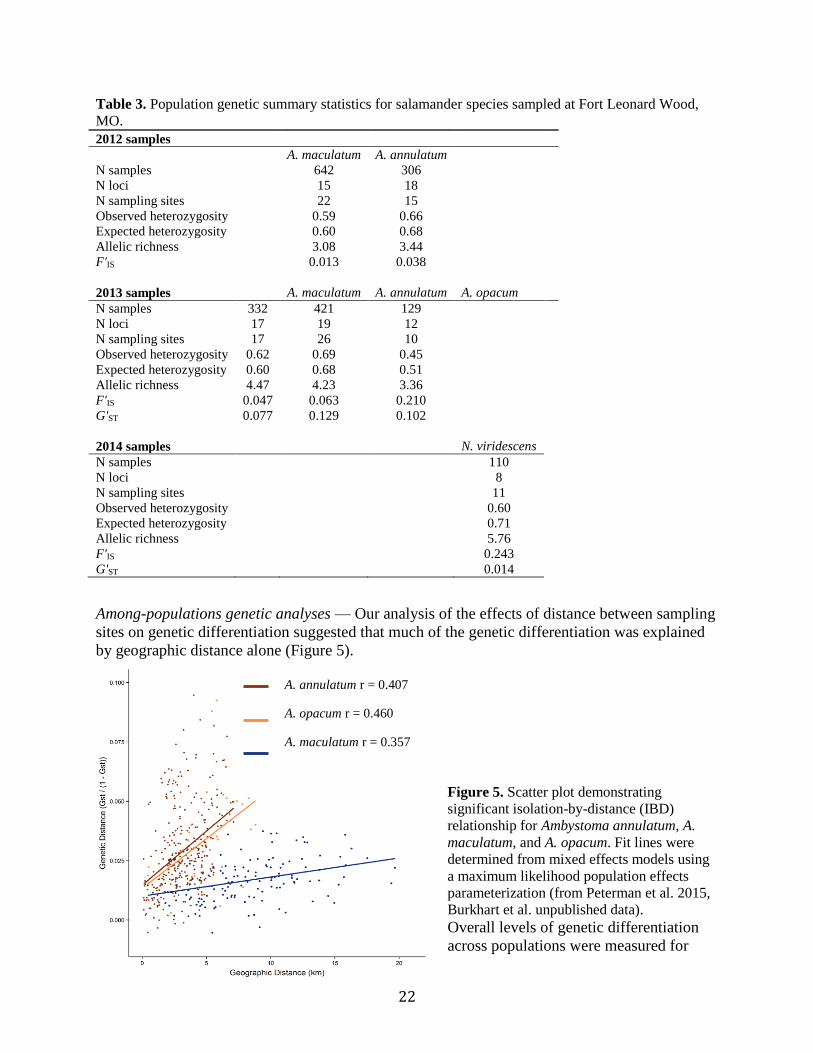
Table 3. Population genetic summary statistics for salamander species sampled at Fort Leonard Wood,
MO.
2012 samples
A. maculatum A. annulatum
N samples 642 306
N loci 15 18
N sampling sites 22 15
Observed heterozygosity 0.59 0.66
Expected heterozygosity 0.60 0.68
Allelic richness 3.08 3.44
F'IS 0.013 0.038
2013 samples A. maculatum A. annulatum A. opacum
N samples 332 421 129
N loci 17 19 12
N sampling sites 17 26 10
Observed heterozygosity 0.62 0.69 0.45
Expected heterozygosity 0.60 0.68 0.51
Allelic richness 4.47 4.23 3.36
F'IS 0.047 0.063 0.210
G'ST 0.077 0.129 0.102
2014 samples N. viridescens
N samples 110
N loci 8
N sampling sites 11
Observed heterozygosity 0.60
Expected heterozygosity 0.71
Allelic richness 5.76
F'IS 0.243
G'ST 0.014
Among-populations genetic analyses — Our analysis of the effects of distance between sampling
sites on genetic differentiation suggested that much of the genetic differentiation was explained
by geographic distance alone (Figure 5).
Figure 5. Scatter plot demonstrating
significant isolation-by-distance (IBD)
relationship for Ambystoma annulatum, A.
maculatum, and A. opacum. Fit lines were
determined from mixed effects models using
a maximum likelihood population effects
parameterization (from Peterman et al. 2015,
Burkhart et al. unpublished data).
Overall levels of genetic differentiation
across populations were measured for
A. annulatum r = 0.407
A. opacum r = 0.460
A. maculatum r = 0.357
23
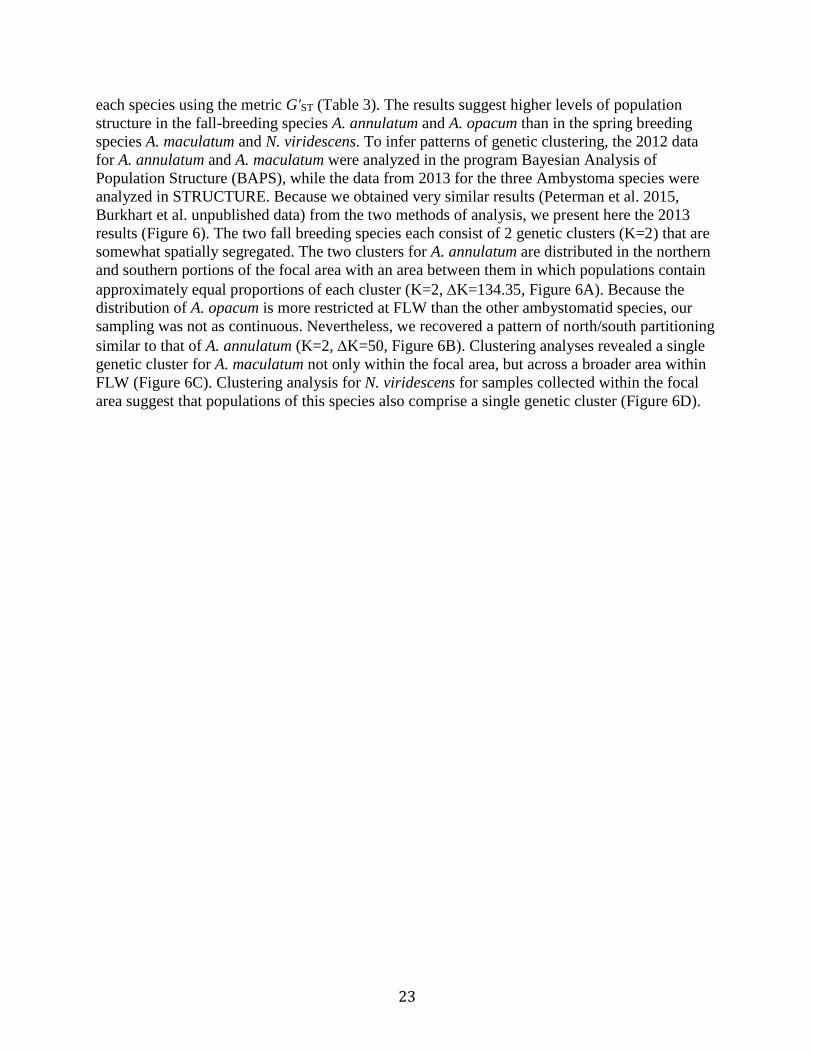
each species using the metric G'ST (Table 3). The results suggest higher levels of population
structure in the fall-breeding species A. annulatum and A. opacum than in the spring breeding
species A. maculatum and N. viridescens. To infer patterns of genetic clustering, the 2012 data
for A. annulatum and A. maculatum were analyzed in the program Bayesian Analysis of
Population Structure (BAPS), while the data from 2013 for the three Ambystoma species were
analyzed in STRUCTURE. Because we obtained very similar results (Peterman et al. 2015,
Burkhart et al. unpublished data) from the two methods of analysis, we present here the 2013
results (Figure 6). The two fall breeding species each consist of 2 genetic clusters (K=2) that are
somewhat spatially segregated. The two clusters for A. annulatum are distributed in the northern
and southern portions of the focal area with an area between them in which populations contain
approximately equal proportions of each cluster (K=2, K=134.35, Figure 6A). Because the
distribution of A. opacum is more restricted at FLW than the other ambystomatid species, our
sampling was not as continuous. Nevertheless, we recovered a pattern of north/south partitioning
similar to that of A. annulatum (K=2, K=50, Figure 6B). Clustering analyses revealed a single
genetic cluster for A. maculatum not only within the focal area, but across a broader area within
FLW (Figure 6C). Clustering analysis for N. viridescens for samples collected within the focal
area suggest that populations of this species also comprise a single genetic cluster (Figure 6D).
24
Landscape genetics — The main objective of our landscape genetic analyses was to determine
what features of the landscape most affected dispersal, as measured by genetic differentiation
between pairs of breeding ponds that were sampled in 2012. Additionally, we sought to
determine rate and direction of gene flow through the use assignment tests or coalescent
modeling. Unexpectedly, we found limited genetic differentiation and no support for land cover
or topographic features that affect gene flow in either A. annulatum or A. maculatum (Peterman
et al. 2015). Rather, genetic differentiation was best explained by Euclidean distance (Figure 3,
in Peterman et al. 2015); A. annulatum showed greater differentiation over shorter distances than
Figure 6. Results of genetic clustering analyses from program STRUCTURE for A.
annulatum from fall 2013 (A), A. opacum from fall 2013 (B), A. maculatum from spring
2013 (C), and N. viridescens from summer 2014 (D).
A
A
B
D
A B
D C
25
A. maculatum. We estimated the mean dispersal distance of A. annulatum to be 1693 m and the
mean dispersal distance of A. maculatum to be 2050 m. The differences in genetic differentiation
and dispersal ability also resulted in differences in spatial population structure. Specifically, A.
annulatum showed substantial spatial structure, with three distinct clusters being identified by a
Bayesian clustering algorithm in 2012 (Peterman et al. 2015) and two clusters being detected in
2013 (Burkhart et al. unpublished data). In contrast, no spatial structure was evident in A.
maculatum. Because of the overall low genetic differentiation, we were unable to conduct
analyses to determine rate and direction of gene flow. However, this comparative analysis
emphasizes the importance of importance of considering variability in species dispersal ability
when developing management criteria to better account for differences in dispersal ability.
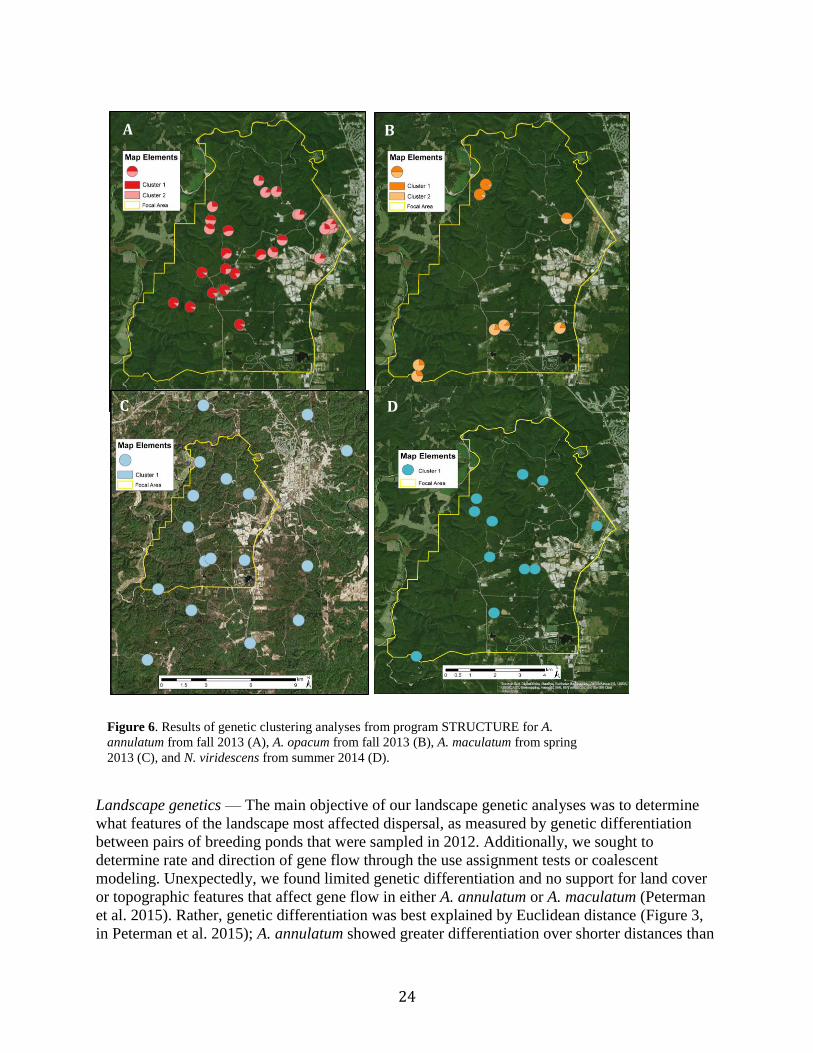
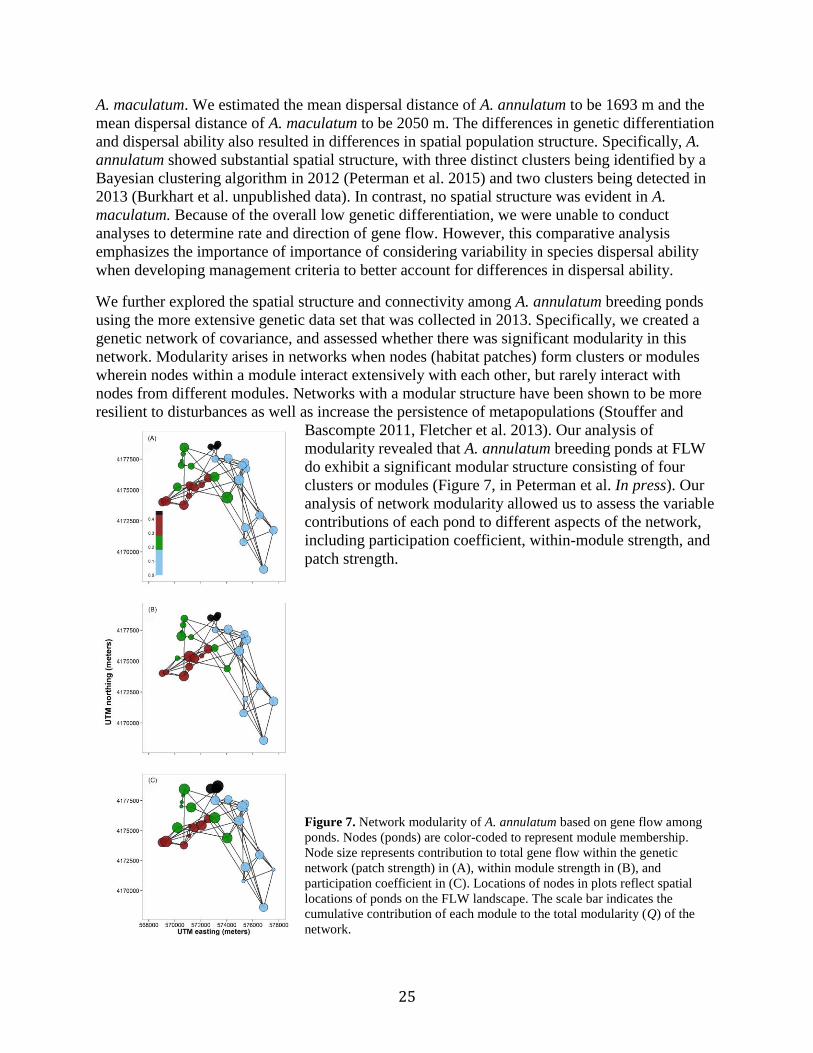
We further explored the spatial structure and connectivity among A. annulatum breeding ponds
using the more extensive genetic data set that was collected in 2013. Specifically, we created a
genetic network of covariance, and assessed whether there was significant modularity in this
network. Modularity arises in networks when nodes (habitat patches) form clusters or modules
wherein nodes within a module interact extensively with each other, but rarely interact with
nodes from different modules. Networks with a modular structure have been shown to be more
resilient to disturbances as well as increase the persistence of metapopulations (Stouffer and
Bascompte 2011, Fletcher et al. 2013). Our analysis of
modularity revealed that A. annulatum breeding ponds at FLW
do exhibit a significant modular structure consisting of four
clusters or modules (Figure 7, in Peterman et al. In press). Our
analysis of network modularity allowed us to assess the variable
contributions of each pond to different aspects of the network,
including participation coefficient, within-module strength, and
patch strength.
Figure 7. Network modularity of A. annulatum based on gene flow among
ponds. Nodes (ponds) are color-coded to represent module membership.
Node size represents contribution to total gene flow within the genetic
network (patch strength) in (A), within module strength in (B), and
participation coefficient in (C). Locations of nodes in plots reflect spatial
locations of ponds on the FLW landscape. The scale bar indicates the
cumulative contribution of each module to the total modularity (Q) of the
network.
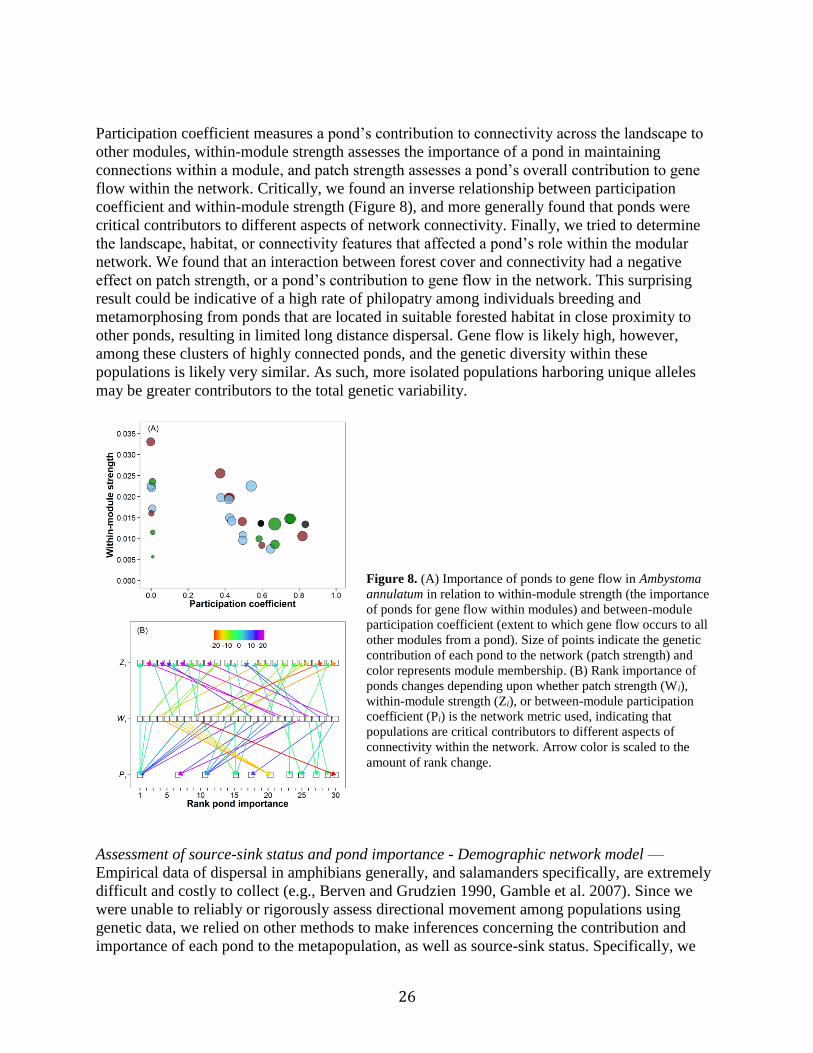
26
Participation coefficient measures a pond’s contribution to connectivity across the landscape to
other modules, within-module strength assesses the importance of a pond in maintaining
connections within a module, and patch strength assesses a pond’s overall contribution to gene
flow within the network. Critically, we found an inverse relationship between participation
coefficient and within-module strength (Figure 8), and more generally found that ponds were
critical contributors to different aspects of network connectivity. Finally, we tried to determine
the landscape, habitat, or connectivity features that affected a pond’s role within the modular
network. We found that an interaction between forest cover and connectivity had a negative
effect on patch strength, or a pond’s contribution to gene flow in the network. This surprising
result could be indicative of a high rate of philopatry among individuals breeding and
metamorphosing from ponds that are located in suitable forested habitat in close proximity to
other ponds, resulting in limited long distance dispersal. Gene flow is likely high, however,
among these clusters of highly connected ponds, and the genetic diversity within these
populations is likely very similar. As such, more isolated populations harboring unique alleles
may be greater contributors to the total genetic variability.
Figure 8. (A) Importance of ponds to gene flow in Ambystoma
annulatum in relation to within-module strength (the importance
of ponds for gene flow within modules) and between-module
participation coefficient (extent to which gene flow occurs to all
other modules from a pond). Size of points indicate the genetic
contribution of each pond to the network (patch strength) and
color represents module membership. (B) Rank importance of
ponds changes depending upon whether patch strength (Wi),
within-module strength (Zi), or between-module participation
coefficient (Pi) is the network metric used, indicating that
populations are critical contributors to different aspects of
connectivity within the network. Arrow color is scaled to the
amount of rank change.
Assessment of source-sink status and pond importance - Demographic network model —
Empirical data of dispersal in amphibians generally, and salamanders specifically, are extremely
difficult and costly to collect (e.g., Berven and Grudzien 1990, Gamble et al. 2007). Since we
were unable to reliably or rigorously assess directional movement among populations using
genetic data, we relied on other methods to make inferences concerning the contribution and
importance of each pond to the metapopulation, as well as source-sink status. Specifically, we
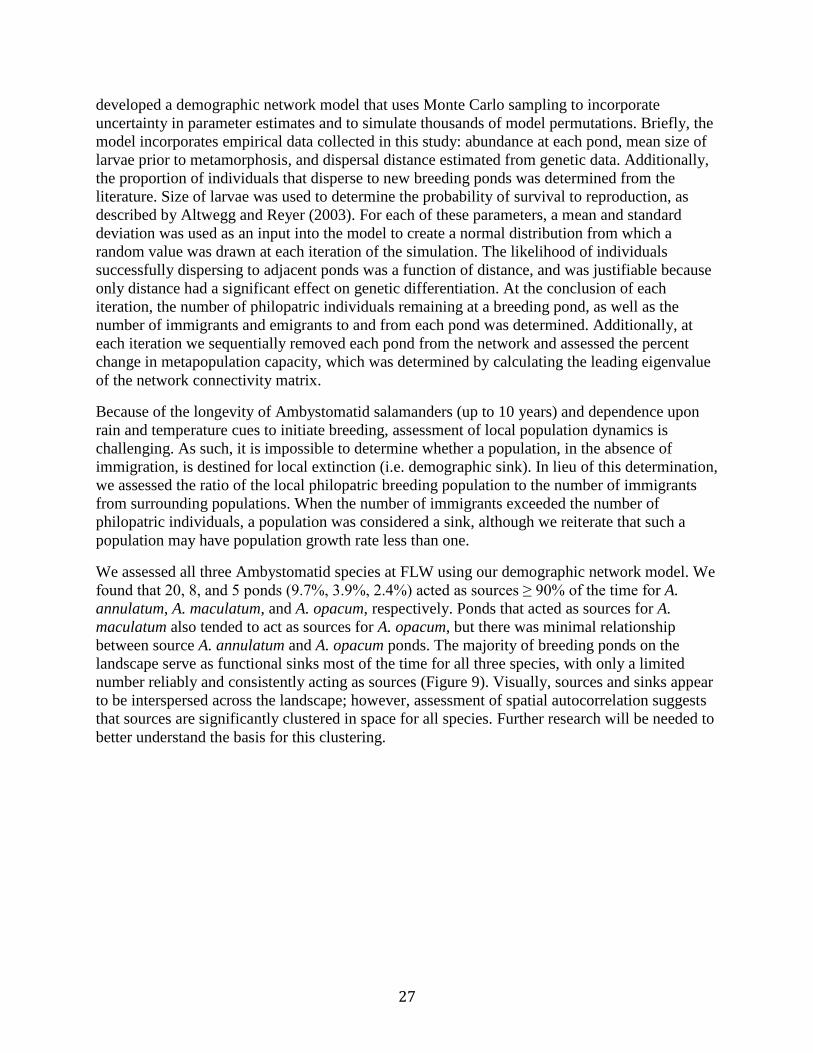
27
developed a demographic network model that uses Monte Carlo sampling to incorporate
uncertainty in parameter estimates and to simulate thousands of model permutations. Briefly, the
model incorporates empirical data collected in this study: abundance at each pond, mean size of
larvae prior to metamorphosis, and dispersal distance estimated from genetic data. Additionally,
the proportion of individuals that disperse to new breeding ponds was determined from the
literature. Size of larvae was used to determine the probability of survival to reproduction, as
described by Altwegg and Reyer (2003). For each of these parameters, a mean and standard
deviation was used as an input into the model to create a normal distribution from which a
random value was drawn at each iteration of the simulation. The likelihood of individuals
successfully dispersing to adjacent ponds was a function of distance, and was justifiable because
only distance had a significant effect on genetic differentiation. At the conclusion of each
iteration, the number of philopatric individuals remaining at a breeding pond, as well as the
number of immigrants and emigrants to and from each pond was determined. Additionally, at
each iteration we sequentially removed each pond from the network and assessed the percent
change in metapopulation capacity, which was determined by calculating the leading eigenvalue
of the network connectivity matrix.
Because of the longevity of Ambystomatid salamanders (up to 10 years) and dependence upon
rain and temperature cues to initiate breeding, assessment of local population dynamics is
challenging. As such, it is impossible to determine whether a population, in the absence of
immigration, is destined for local extinction (i.e. demographic sink). In lieu of this determination,
we assessed the ratio of the local philopatric breeding population to the number of immigrants
from surrounding populations. When the number of immigrants exceeded the number of
philopatric individuals, a population was considered a sink, although we reiterate that such a
population may have population growth rate less than one.
We assessed all three Ambystomatid species at FLW using our demographic network model. We
found that 20, 8, and 5 ponds (9.7%, 3.9%, 2.4%) acted as sources ≥ 90% of the time for A.
annulatum, A. maculatum, and A. opacum, respectively. Ponds that acted as sources for A.
maculatum also tended to act as sources for A. opacum, but there was minimal relationship
between source A. annulatum and A. opacum ponds. The majority of breeding ponds on the
landscape serve as functional sinks most of the time for all three species, with only a limited
number reliably and consistently acting as sources (Figure 9). Visually, sources and sinks appear
to be interspersed across the landscape; however, assessment of spatial autocorrelation suggests
that sources are significantly clustered in space for all species. Further research will be needed to
better understand the basis for this clustering.
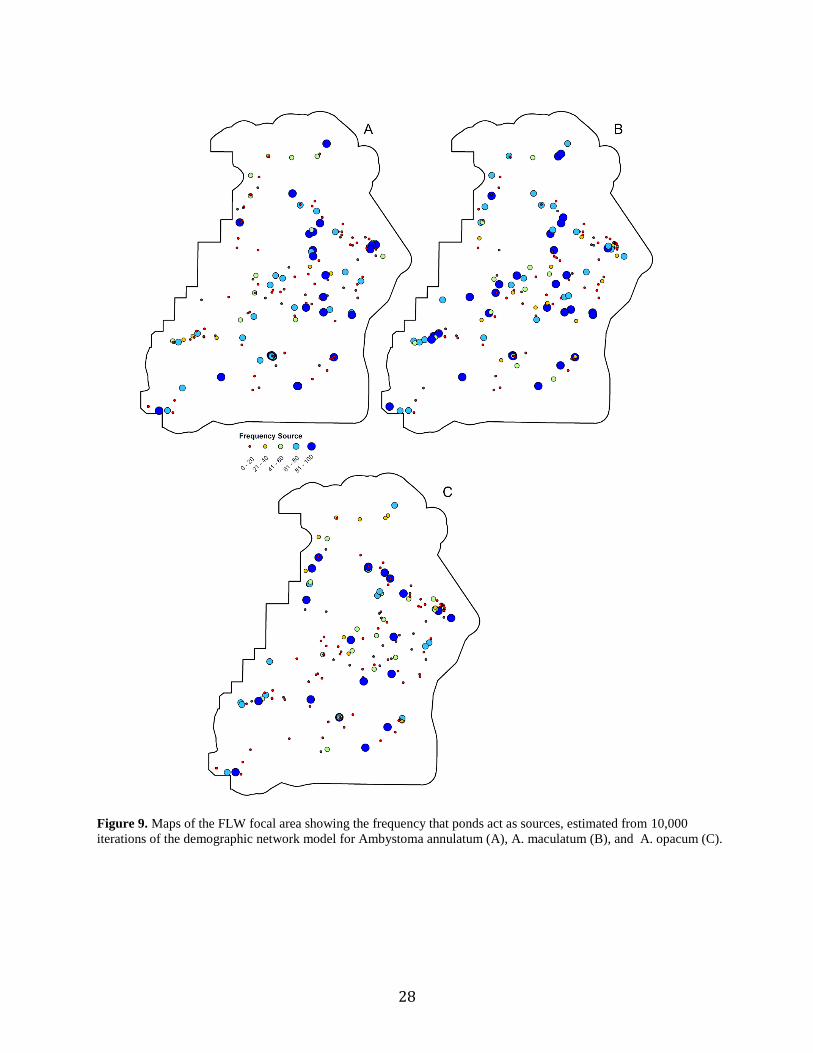
28
Figure 9. Maps of the FLW focal area showing the frequency that ponds act as sources, estimated from 10,000
iterations of the demographic network model for Ambystoma annulatum (A), A. maculatum (B), and A. opacum (C).
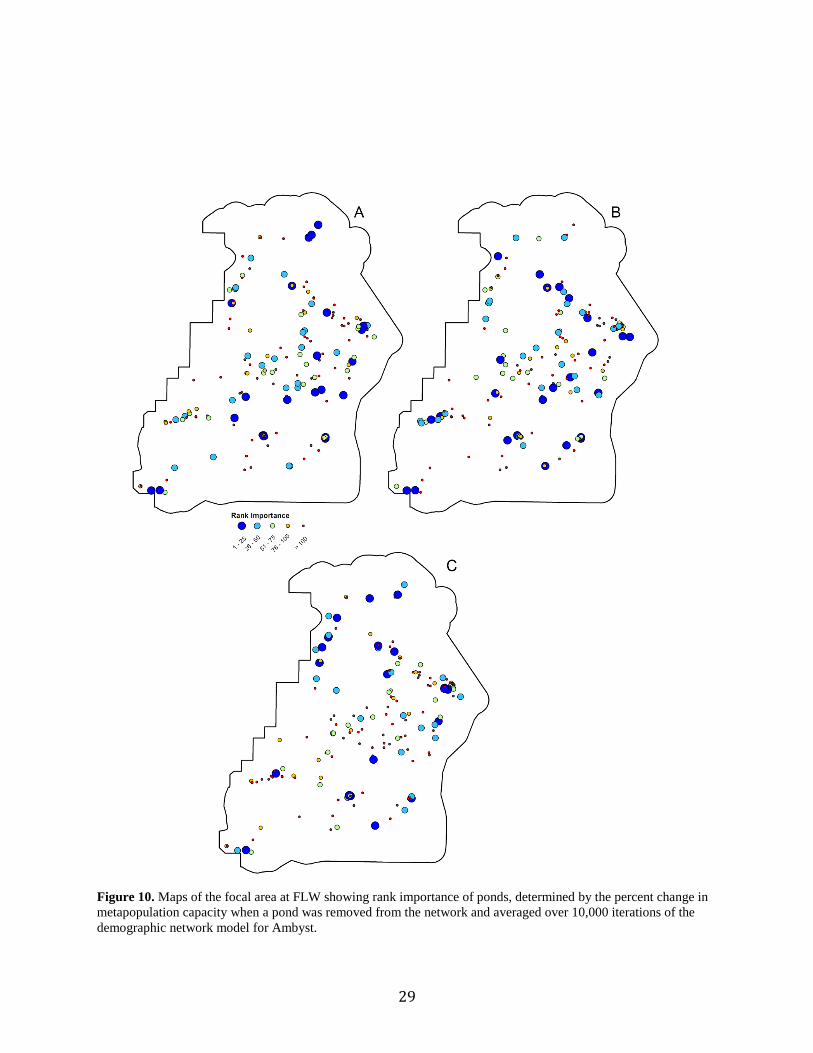
29
Figure 10. Maps of the focal area at FLW showing rank importance of ponds, determined by the percent change in
metapopulation capacity when a pond was removed from the network and averaged over 10,000 iterations of the
demographic network model for Ambyst.
30
In assessing the rank importance of each pond in contributing to the persistence of the
metapopulation (i.e. metapopulation capacity), it is clear that different ponds on the landscape
are most critical to different species (Figure 10). This finding corroborates previous analyses that
found different pond features and habitat characteristics to be important predictors of larval
abundance of A. annulatum, A. maculatum, and A, opacum and that overlap in use of breeding
ponds by all three species is infrequent (Peterman et al. 2014).
In further assessing factors affecting the frequency that a pond acted as a source or sink, we
found no indications that any species inhibited another. Specifically, the frequency that a pond
was a source population in our demographic network simulations was not negatively affected by
that pond acting as a source population for another species. In fact, ponds that were more
frequently sources for A. annulatum also tended to be sources for A. maculatum, and vice versa.
However, only source A. maculatum ponds tended to act as source ponds for A. opacum. For A.
annulatum, increasing the canopy cover over a pond tended to increase the frequency a pond
acted as a source, while increasing the hydroperiod (duration that a pond holds water) tended to
have a negative effect. Canopy cover did not affect the frequency that A. maculatum populations
were sources, but the amount of forest cover within 300 m of a pond and increasing hydroperiod
both tended to decrease the source frequency. However, the effect of forest cover was three times
less important than hydroperiod. Finally, only increasing hydroperiod had a negative effect on
the source population frequency for A. opacum. Consistent among all three species is the fact
that increasing hydroperiod tends to have a negative effect on the frequency at which a pond acts
as a source. Hydroperiod has also been found to have significant effects on species richness,
abundance, and invertebrate predator density (Peterman et al. 2014, Ousterhout et al. 2015,
Semlitsch et al. 2015).
In addition to environmental and interspecific factors affecting the frequency a pond acts a
source, we also assessed the effects of mean abundance and size of larvae. For each species we
fit linear models with source frequency as the dependent variable and mean abundance and larval
size as independent variables. In all three species, mean abundance and larval size were
significant predictors of a pond acting as a source. However, abundance tended to be 3–5 times
more important than size. For each species, these linear models explained >90% of the variance.
These results indicate the single most important factor in a population acting as a source is the
number of individuals that successfully metamorphose from a pond. In contrast, mean abundance,
larval size, frequency of being source, nor any environmental variables were meaningful
predictors of a ponds contribution to metapopulation capacity.
To determine the relative effect of each parameter in the demographic network model, we
conducted a sensitivity analysis (Figure 11). This analysis highlighted that dispersal from the
natal pond is critical to maintaining connectivity and increasing the likelihood of the
metapopulation persisting. Additionally, a higher survival rate results in more salamanders
available to disperse. In our model, survival probability is determined by the average size of
larvae prior to metamorphosis, with larger individuals having a greater probability of surviving
to maturity. Surprisingly, mean dispersal distance had a very minimal effect on metapopulation
capacity. On the FLW landscape, these results may in part be a result of landscape that is densely
covered with ponds and the landscape is relatively homogenous, making successful dispersal less
dependent on the ability to traverse large distances through matrix habitat.
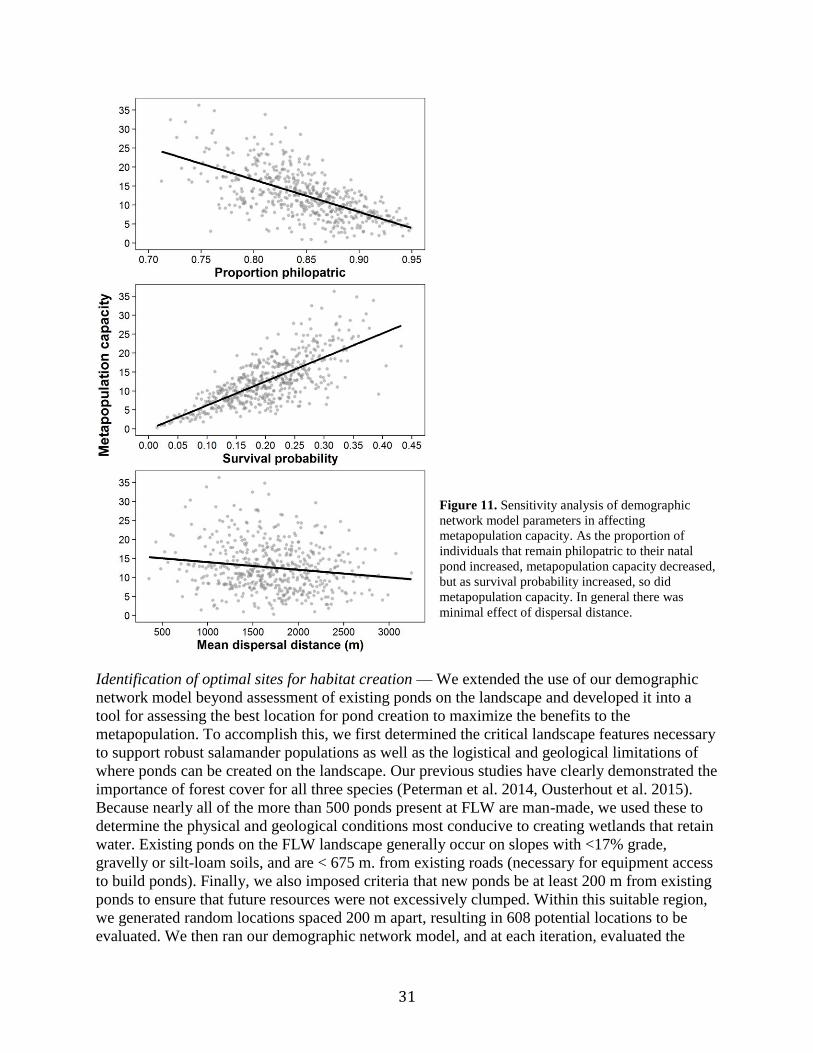
31
Figure 11. Sensitivity analysis of demographic
network model parameters in affecting
metapopulation capacity. As the proportion of
individuals that remain philopatric to their natal
pond increased, metapopulation capacity decreased,
but as survival probability increased, so did
metapopulation capacity. In general there was
minimal effect of dispersal distance.
Identification of optimal sites for habitat creation — We extended the use of our demographic
network model beyond assessment of existing ponds on the landscape and developed it into a
tool for assessing the best location for pond creation to maximize the benefits to the
metapopulation. To accomplish this, we first determined the critical landscape features necessary
to support robust salamander populations as well as the logistical and geological limitations of
where ponds can be created on the landscape. Our previous studies have clearly demonstrated the
importance of forest cover for all three species (Peterman et al. 2014, Ousterhout et al. 2015).
Because nearly all of the more than 500 ponds present at FLW are man-made, we used these to
determine the physical and geological conditions most conducive to creating wetlands that retain
water. Existing ponds on the FLW landscape generally occur on slopes with <17% grade,
gravelly or silt-loam soils, and are < 675 m. from existing roads (necessary for equipment access
to build ponds). Finally, we also imposed criteria that new ponds be at least 200 m from existing
ponds to ensure that future resources were not excessively clumped. Within this suitable region,
we generated random locations spaced 200 m apart, resulting in 608 potential locations to be
evaluated. We then ran our demographic network model, and at each iteration, evaluated the
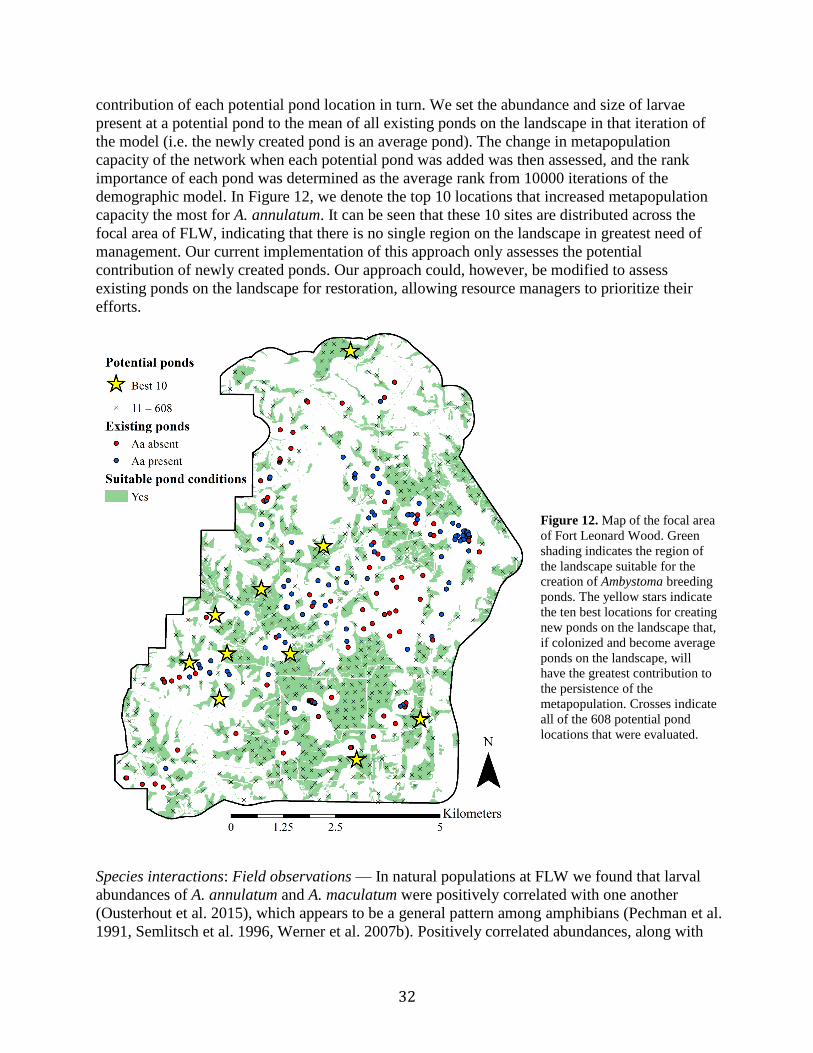
32
contribution of each potential pond location in turn. We set the abundance and size of larvae
present at a potential pond to the mean of all existing ponds on the landscape in that iteration of
the model (i.e. the newly created pond is an average pond). The change in metapopulation
capacity of the network when each potential pond was added was then assessed, and the rank
importance of each pond was determined as the average rank from 10000 iterations of the
demographic model. In Figure 12, we denote the top 10 locations that increased metapopulation
capacity the most for A. annulatum. It can be seen that these 10 sites are distributed across the
focal area of FLW, indicating that there is no single region on the landscape in greatest need of
management. Our current implementation of this approach only assesses the potential
contribution of newly created ponds. Our approach could, however, be modified to assess
existing ponds on the landscape for restoration, allowing resource managers to prioritize their
efforts.
Figure 12. Map of the focal area
of Fort Leonard Wood. Green
shading indicates the region of
the landscape suitable for the
creation of Ambystoma breeding
ponds. The yellow stars indicate
the ten best locations for creating
new ponds on the landscape that,
if colonized and become average
ponds on the landscape, will
have the greatest contribution to
the persistence of the
metapopulation. Crosses indicate
all of the 608 potential pond
locations that were evaluated.
Species interactions: Field observations — In natural populations at FLW we found that larval
abundances of A. annulatum and A. maculatum were positively correlated with one another
(Ousterhout et al. 2015), which appears to be a general pattern among amphibians (Pechman et al.
1991, Semlitsch et al. 1996, Werner et al. 2007b). Positively correlated abundances, along with
33
the evidence that certain habitat traits are strong predictors of density and abundance of both
species, indicate that features associated with a high quality pond for one species may be
similarly good for other amphibians. This positive association among congeneric species also
suggests that habitat features may be stronger predictors of density rather than interspecific
associations (i.e. competition or non-fish predation) in regulating larval abundance. We have
begun to investigate whether habitat traits have interactive effects with competitor and
invertebrate predator densities to assess any context-dependent relationships, but as of yet have
found no strong covariance among such predictors for either A. maculatum or A. annulatum
(Anderson et al. unpublished data).
Species interactions: Mesocosm and microcosm experiments — In contrast to the patterns
observed in natural populations, we observed strong interspecific interactions from several
mesocosm experiments conducted on A. annulatum and A. maculatum. We observed no effects
of intraspecific density on survival of either species (Anderson and Semlitsch 2014, Ousterhout
and Semlitsch unpublished data), except in one experiment where severe winter temperatures in
2013-2014, in conjunction with high larval densities, resulted in low survival of A. annulatum.
We did observe a strong negative relationship of A. annulatum density and A. maculatum
survival, where high densities of A. annulatum resulted in few survivors of A. maculatum
(Anderson and Semlitsch 2014; Anderson and Semlitsch unpublished data). However, the
predation rate of A. annulatum on A. maculatum did not vary with increasing habitat complexity
(Anderson and Semlitsch unpublished data), and the timing of breeding for each species was not
as strong a factor in determining the outcome of interactions as was larval density (Anderson,
unpublished). The presence of other top predators (e.g. dragonfly larvae, N. viridescens, or
mosquitofish) altered the relationship of A. maculatum and A. annulatum, where the strength of
their survival covariance differed depending on what other predators were present in the food
web (Anderson and Semlitsch unpublished data). Of note, survival was lowest for both
salamanders when they coexisted with multiple predators, which likely reflects a more realistic
scenario and would match known survival estimates for larval salamanders (<1%, Semlitsch et al.
2014, Anderson et al. 2015b). We observed that invertebrate predator densities peaked in ponds
with characteristics similar to those in which amphibian densities peaked, suggesting that larvae
persist in the face of numerous predators. One potential mechanism that permits coexistence is
non-consumptive effects among predators of salamanders. In a microcosm experiment, we found
that larval dragonflies, voracious predators of larval amphibians, had reduced foraging rates in
the presence of cannibalistic conspecifics, which resulted in increased survival of their prey (A.
annulatum; TLA, unpublished data).
Using microcosms, we examined the functional response curve of different-sized larval A.
annulatum larvae, and found that larger individuals foraged with a Type I functional response (a
linear increase in consumption rate with increased prey densities) and smaller individuals a Type
II response (an asymptotic increase in consumption rate where predators will reach constant
consumption rate regardless of prey density; Anderson et al. unpublished data). This would
indicate that the relative size of A. annulatum when A. maculatum hatches in the spring time
could influence their effectiveness as a predator. Interestingly, we also found that if
metamorphosis is delayed in A. maculatum such that they persist as larvae into the fall, they can
be effective predators on hatchling A. annulatum (Anderson et al. unpublished data). Such a role
reversal of intraguild predation based on life history differences has not been documented for
ambystomatid salamanders.

34
Transition plan — The data collected to date inspired and supported the preparation of a
conservation assessment and proposed management plan for A. annulatum beginning in the
summer of 2014. This document is in preparation to be submitted for publication, and we have
made a draft of the document available to regional natural resource managers.
The population viability analysis (PVA) we have completed for the A. annulatum will help to
inform the conservation of closely related species, like the federally listed flatwoods salamanders
(A. bishopi [Endangered] and A. cingulatum [Threatened]). This PVA is also in preparation to be
submitted as a stand-alone manuscript, and the model predictions will be applied to flatwoods
salamander recovery planning beginning in October of 2015.
Our findings and recommendations in both documents have already been shared with the team
working to recover these two species through a series of Structured Decision Making Workshops
held by the U.S. Fish and Wildlife Service. The student working on both the proposed
management plan and the PVA has been asked to join both the Flatwoods Salamander Working
Group and Federal Recovery Team, which will collaborate to facilitate the transition plan.
35
Conclusions and implications for future research/implementation
Our objective was to better understand the impact of landscape heterogeneity on the source-sink
dynamics of a species of conservation concern (the ringed salamander, A. annulatum) and a co-
occurring species (the spotted salamander, A. maculatum) at Fort Leonard Wood, Missouri
through a combination of intensive ecological field studies, genetic analyses, and statistical
modeling. Specifically, we sought to (1) identify key environmental conditions associated with
varying levels of A. annulatum reproductive success to define source habitat patches, (2)
determine whether species interactions influence source-sink dynamics, (3) identify habitat
features associated with effective dispersal of A. annulatum among populations to define habitat
connectivity, and (4) develop models to predict and manage population connectivity for
salamanders in heterogeneous landscapes.
Overall, habitat features, especially pond hydroperiod, forested habitat surrounding ponds,
canopy cover, and the presence or absence of fish appear to be the strongest predictors of A.
annulatum and A. maculatum distribution and population dynamics. We found weak evidence for
species interactions being important factors in population dynamics in natural ponds, but strong
evidence of density-dependence and food web organization as critical components in
experimental studies. The discrepancies between field and experimental studies may stem from
imprecise field measures and/or failure of simplified experimental mesocosms to replicate the
complex interactions found in natural systems. Therefore, despite lack of clear support from our
field data, we would caution against disregarding species interactions as important contributors
to source sink dynamics.
One of the most critical predictors of amphibian fitness is size at metamorphosis (e.g., Berven
1990, Scott 1994). In experimental mesocosms, we found that metamorph size was strongly
affected by intraspecific density (Anderson and Semlitsch 2014, Ousterhout and Semlitsch
unpublished data). We also observed extensive variability in metamorph size in field
observations. However, the effects of intraspecific density were much less apparent (Ousterhout
et al. 2015). Previous amphibian research has shown that size at metamorphosis can affect
survival, age at maturity, and fecundity (Berven 1990, Scott 1994), and we found that size also
affects dispersal (Ousterhout and Semlitsch unpublished data). Specifically, we found that
intermediate sized metamorphs dispersed the farthest. A better understanding of the habitat and
ecological factors affecting metamorph size in the field appears to be a critical next step to
ensuring population viability and connectivity.
In this study, we went to great lengths to survey and study >200 ponds across a large landscape.
The extent of these surveys necessitated some tradeoffs in survey intensity at each individual
pond. Because of the brief period that adults are present in the breeding ponds and the challenges
of effectively surveying egg masses, we invested our efforts in understanding environmental and
ecological factors affecting larval salamanders. While the larval life stage is undoubtedly critical
to future fitness and population persistence, it will likely be insightful for future research to more
intensively monitor all life stages in populations at a smaller number of sites and to begin to
understand how terrestrial habitat quality surrounding ponds affects survival and fecundity.
The clearest and most unsurprising result from our study was that ponds with fish act either as
unusable habitat or a sink habitat if salamanders deposit eggs as fish are voracious predators of
36
amphibian embryos and larvae (Drake et al. 2014, Shulse 2012, 2013). Therefore, absence of fish
is a key characteristic of source ponds. Further, we found that it is important for all of our studied
ambystomatid species that ponds be located within forested habitat and that pond hydroperiod
plays critically into the larval abundance and size. In general, we observed a pattern of most
ponds having few larvae, and only a few ponds supporting large populations with higher
densities; spatial variation in larval density was four to ten times greater than temporal variation.
This suggests that there are likely few source populations on the landscape, making their
conservation priority even greater. We also observed differential success and growth in
salamanders that was affected by pond hydroperiod. Therefore, to gain the maximum benefit for
the most species and to buffer against regional population failure from climatic factors such as
drought, we recommend that ponds with a mosaic of hydroperiod regimes should be maintained.
One of our initial objectives was to develop connectivity models based on network circuit theory.
Unfortunately, we found limited genetic differentiation and no support for land cover or
topographic features that affected gene flow in A. annulatum, A. maculatum, A. opacum, or N.
viridescens (Peterman et al. 2015, Burkhart et al. unpublished data), making such connectivity
models irrelevant. The lack of genetic differentiation also precluded our use of coalescent models
or assignment tests to effectively quantify directional dispersal among populations. However, our
genetic data allowed us to assess effective dispersal distances for both A. annulatum and A.
maculatum, which was essential to parameterizing our demographic network model.
Modularity analyses based on a network of genetic covariance for A. annulatum allowed us to
assess the role and contribution of populations to different aspects of connectivity. Specifically,
we assessed the local importance of a population to maintaining connectivity within modules,
regional connectivity among modules, and global contribution to gene flow of the entire network.
From these analyses, we found that, in general, no population was universally the most critical to
all aspects of connectivity. While none of these measures are directly relatable to source or sink
population designation, our findings suggest that management for a single type of population
may not be the most beneficial to connectivity and gene flow across the landscape.
Ultimately, our most robust assessment of population source-sink status came from our
demographic network model. This stochastic model incorporated dispersal distances derived
from population genetic analyses conducted in this study as well as three years of population
abundance and size estimates from field surveys. From this approach we were able to simulate
the likely number of immigrants, emigrants, and philopatric individuals at each pond, determine
average source-sink status, as well as assess more integrative measures such as metapopulation
capacity. As an integrative measure assessing connectivity and amount of contribution,
metapopulation capacity intuitively seems like a more holistic measure by which to evaluate a
population’s role and contribution. While creation and maintenance of sink populations on the
landscape is certainly undesirable, our modeling suggests populations occur on a continuum of
source to sink and that most populations fluctuate in their contributions. A singular focus on
sources or sinks, at least in our pond breeding amphibian system, actually does very little to
maintain connectivity and ensure metapopulation persistence. As such, we feel it is important to
manage for large, robust population sizes, but also to critically evaluate the spatial location of
populations on the landscape as well as local habitat features to maximize growth and survival.
Finally, we used our demographic modeling framework to determine the optimal locations on the
landscape for future pond construction. We have found that abundance of larvae increases with
37
increasing forest cover and number of ponds within 300 m of a pond (Peterman et al. 2014).
Additionally, hydroperiod and slope of the pond basin are important considerations in how ponds
are constructed. Of greatest importance to successful amphibian breeding and recruitment is the
exclusion of fish. Once fish are present, a pond is no longer suitable for amphibian reproduction.
Therefore, future ponds at FLW should be constructed in forested habitat on slopes with <17%
grade with gravelly or silt-loam soils. We provide no concrete recommendations regarding a
target surface area or depth when constructing ponds, but emphasize that the maintenance of
ponds of varying size and hydroperiod on the landscape is likely to have the greatest benefit for
the greatest number of amphibian species, including A. annulatum (Semlitsch et al. 2015). Our
demographic network model has been made available in an R package called "ssmc" and is
available with a fully documented user guide at https://github.com/wpeterman/ssmc. We feel this
approach has great potential to be beneficial and applicable to other systems where the available
population and life history parameters are uncertain, and where discrete habitat
creation/restoration is an effective management strategy.
38
Literature cited
Adamack, A. T., and B. Gruber. 2014. PopGenReport: simplifying basic population genetic
analyses in R. Methods in Ecology and Evolution 5:384-387.
Almeida, D. 2010. The Effects of Environmental Temperature on Locomotor Performance and
Growth Patterns in Spotted Salamander, Ambystoma maculatum. University of
Massachusetts-Amherst.
Altwegg, R., and H.-U. Reyer. 2003. Patterns of natural selection on size at metamorphosis in
water frogs. Evolution 57:872–882.
Anderson, T. L., Ousterhout, B. H., Peterman, W. E., Drake, D. L., and R. D. Semlitsch. 2015.
Life history differences influence the impacts of drought on two pond breeding
salamanders. Ecological Applications:10.1890/14-2096.1
Anderson, T. L., and R. D. Semlitsch. 2014. High intraguild predator density induces thinning
effects on and increases temporal overlap with prey populations. Population Ecology
56:265–273.
Baldwin, R. F., Calhoun, A. J. K. and P. G. deMaynadier. 2006. The significance of hydroperiod
and stand maturity for pool-breeding amphibians in forested landscapes. Canadian
Journal of Zoology 84:1604–1615.
Barson, N.J., J. Cable, and C. Van Oosterhout. 2009. Population genetic analysis of
microsatellite variation of guppies (Poecilia reticulata) in Trinidad and Tobago:
Evidence for a dynamic source-sink metapopulation structure, founder events and
population bottlenecks. Journal of Evolutionary Biology 22:485–497.
Bates, D., M. Maechler, B. M. Bolker, and S. Walker. 2015. lme4: Linear mixed-effects models
using Eigen and S4. R package version 1.1-9, https://CRAN.R-
project.org/package=lme4.
Beebee, T.J.C. 2005. Conservation genetics of amphibians. Heredity 95:423-427.
Berven, K.A. 2009. Density dependence in the terrestrial stage of wood frogs: evidence from a
21-year population study. Copeia 2009:328-338.
Berven, K. A., and T. A. Grudzien. 1990. Dispersal in the wood frog (Rana sylvatica):
Implications for genetic population structure. Evolution 44:2047–2056.
Birx-Raybuck, D., Price, S. and M. Dorcas. 2010. Pond age and riparian zone proximity
influence anuran occupancy of urban retention ponds. Urban Ecosystems 13:181–190.
Breden, F. 1987. The effect of post-metamorphic dispersal on the population genetic structure of
Fowler’s toad, Bufo woodhousei fowleri. Copeia 1987:386-395.
Castoe, T. A., Poole, A. W., de Koning, A. P. J., Jones, K. L., Tomback, D. F., Oyler-McCance,
S. J., Fike, J. A., Lance, S. L., Streicher, J. W., Smith, E. N., and D. D. Pollock. 2012.
Rapid microsatellite identification from Illumina paired-end genomic sequencing in two
birds and a snake. PLoS ONE 7:e30953.
Charney, N. D. 2012. Evaluating expert opinion and spatial scale in an amphibian model.
Ecological Modelling 242:37–45.
Connette, G. M., and R. D. Semlitsch. 2012. Successful use of a passive integrated transponder
(PIT) system for below-ground detection of plethodontid salamanders. Wildlife Research
39:1-6.
Corander, J., and P. Marttinen. 2006. Bayesian identification of admixture events using
multilocus molecular markers. Molecular Ecology 15:2833–2843
39
Corander, J., Sire´n, J., and E. Arjas. 2008. Bayesian spatial modeling of genetic population
structure. Computational Statistics 23:111–129
Corander, J., Waldmann, P., and M. J. Sillanpaa. 2003. Bayesian analysis of genetic
differentiation between populations. Genetics 163:367–374
Cosentino, B. J., Schooley, R. L. and C. A. Phillips. 2011. Spatial connectivity moderates the
effect of predatory fish on salamander metapopulation dynamics. Ecosphere 2:art95.
Crowshaw, D.A. and T.C. Glenn 2003. Seven polymorphic microsatellite loci from the red-
spotted newt (Notopthalmus viridescens). Molecular Ecology Notes 3:514-516.
Davis, A. K., and J. C. Maerz. 2009. Effects of larval density on hematological stress indices in
salamanders. Journal of Experimental Zoology 311A:697–704.
Denton, R. D. and S. C. Richter. 2012. A quantitative comparison of two common amphibian
sampling techniques for wetlands. Herpetological Review 43:44–47.
Drake, D. L., T. L. Anderson, L. M. Smith, K. M. Lohraff, and R. D. Semlitsch. 2014. Predation
of Eggs and Recently Hatched Larvae of Endemic Ringed Salamanders (Ambystoma
annulatum) by Native and Introduced Aquatic Predators. Herpetologica 70:378-387.
Dyer, R. J. 2014. gstudio: Analyses and functions related to the spatial analysis of genetic marker
data. R package version 1.3.
Dyer, R. J., and J. D. Nason. 2004. Population Graphs: the graph theoretic chape of genetic
structure. Molecular Ecology 13:1713-1727.
Earl, J. E., Luhring, T. M., Williams, B. K. and R. D. Semlitsch. 2011. Biomass export of
salamanders and anurans from ponds is affected differentially by changes in canopy
cover. Freshwater Biology 56:2473–2482.
Evanno, G., Regnaut, S., and J. Goudet. 2005. Detecting the number of clusters of individuals
using the software STRUCTURE: a simulation study. Molecular Ecology 14:2611-2620.
Fletcher, R. J., Jr., A. Revell, B. E. Reichert, W. M. Kitchens, J. D. Dixon, and J. D. Austin.
2013. Network modularity reveals critical scales for connectivity in ecology and
evolution. Nature Communications 4:2572.
Gamble, L. R., K. McGarigal, and B. W. Compton. 2007. Fidelity and dispersal in the pond-
breeding amphibian, Ambystoma opacum: implications for spatio-temporal population
dynamics and conservation. Biological Conservation 139:247–257.
Garroway, C. J., Bowman, J., Carr, D., and P. J. Wilson. 2008. Applications of graph theory to
landscape genetics. Evolutionary Applications 1:620-630.
Gill, D. E. 1978. The metapopulation ecology of the red-spotted newt, Notophthalmus
viridescens (Rafinesque). Ecological Monograph 48: 145–166.
Halpern, B.S., S.D. Gaines, and R.R. Warner. 2005. Habitat size, recruitment, and
longevity as factors limiting population size in stage-structured species.
American Naturalist 165:82-94.
Hanski, I., J. Alho, and A. Moilanen. 2000. Estimating parameters of survival and
migration ofindividuals in metapopulations. Ecology 81:239-251.
Harper, E.B., T.A.G. Rittenhouse and R.D. Semlitsch. 2008. Demographic consequences of
terrestrial habitat loss for pool-breeding amphibians: predicting extinction risks
associated with inadequate size of buffer zones. Conservation Biology 22:1205-1215.
Harrison, S., D.D. Murphy, and P.R. Ehrlich. 1988. Distribution of the bay checkerspot butterfly,
Euphydryas editha bayensis: evidence for a metapopulation model. American Naturalist
132:360-382.
40
Jenness, J. 2006. Topographic Position Index (tpi_jen. avx) extension for ArcView 3. x, v. 1.3 a.
Jenness Enterprises. URL: http://www.jennessent.com/arcview/tpi.htm.
Johnson, J.A., M.R. Bellinger, J.E. Toepfer, and P. Dunn. 2004. Temporal changes in allele
frequencies and low effective population size in greater prairie chickens. Molecular
Ecology 13:2617-2630.
Jones, A.G., M.S. Blouton and S.J. Arnold 2001. Genetic variation in two populations of the
rough-skinned newt (Taricha granulosa) assessed using novel tetranucleotide microsatellite
loci. Molecular Ecology Notes 1:293-296.
Jones, O. and J. Wang. 2010. COLONY: a program for parentage and sibship inference from
multilocus genotype data. Molecular Ecology Resources 10:551–555.
Madison, D. M. and L. Farrand III. 1998. Habitat use during breeding and emigration in radio-
implanted tiger salamanders, Ambystoma tigrinum. Copeia 1998:402–410.
Marsh, D.M., G.S. Milam, N.P. Gorham, and N.G. Beckman. 2005. Forest roads as partial
barriers to terrestrial salamander movement. Conservation Biology 19:2004-2008.
Marsh, D.M., R.B. Page, T.J. Hanlon, R. Corritone, E.C. Little, D.E. Seifert, and P.R. Cabe.
2008. Effects of roads on patterns of genetic differentiation in red-backed salamanders,
Plethodon cinereus. Conservation Genetics 9:603-613.
Marsh, D.M., and P.C. Trenham. 2001. Metapopulation dynamics and amphibian conservation.
Conservation Biology 15:40-49.
Martin, J. K. 2013. Landscape genetics of the marbled salamander (Ambystoma opacum) at
Mammoth Cave National Park. Master of Science thesis, Western Kentucky University.
May, S.E. 2011. Indirect estimates of gene flow and its conservation implications in the striped
newt (Notopthalmus peristriatus). Department of Biology, University of Central Florida.
Master of Science. 85 pgs.
McRae, B. H. 2006. Isolation by resistance. Evolution 60:1551-1561.
Mott, C. L. and D. W. Sparling. 2010. Seasonal trends in aggression among sympatric larval
salamanders: the roles of habitat-mediation and behavioural conservatism. Behaviour
147:1327–1353.
Noël, S., M. Oullet, P. Galois, and F.-J. Lapointe. 2007. Impact of urban fragmentation on the
genetic structure of the eastern red-backed salamander. Conservation Genetics 8:599-606.
Nunziata, S. O., Scott, D. E., Jones, K. L., Hagen, C., and S. L. Lance. 2011. Twelve novel
microsatellite markers for the marbled salamander, Ambystoma opacum. Conservation
Genetics Resources 3:773-775.
Oldham, R. S. 1966. Spring movement in the American toad, Bufo americanus. Canadian
Journal of Zoology 44:63–100.
Ousterhout, B. H., T. L. Anderson, D. L. Drake, W. E. Peterman, and R. D. Semlitsch. 2015.
Habitat traits and species interactions differentially affect abundance and body size in
pond-breeding amphibians. Journal of Animal Ecology 84:914-924.
Ousterhout, B. H., and R. D. Semlitsch. 2014. Measuring terrestrial movement behavior using
passive integrated transponder (PIT) tags: Effects of tag size on detection, movement,
survival, and growth. Behavioral Ecology and Sociobiology 68:343-350.
Pechmann, J.H.K., D.E. Scott, J.W. Gibbons, and R.D. Semlitsch. 1989. Influence of wetland
hydroperiod on diversity and abundance of metamorphosing juvenile amphibians.
Wetland Ecology and Management 1:3-11.
41
Pechmann, J. H. K., D. E. Scott, R. D. Semlitsch, J. P. Caldwell, L. J. Vitt and J. W. Gibbons.
1991. Declining amphibian populations: The problem of separating human impacts from
natural fluctuations. Science 253:892-895.
Peterman, W. E. 2014. ResistanceGA: An R package for the optimization of resistance surfaces
using genetic algorithms.
Peterman, W. E., T. L. Anderson, D. L. Drake, B. H. Ousterhout, and R. D. Semlitsch. 2014.
Maximizing pond biodiversity across the landscape: a case study of larval ambystomatid
salamanders. Animal Conservation 17:275–285.
Peterman, W. E., T. L. Anderson, B. H. Ousterhout, D. L. Drake, R. D. Semlitsch, and L. S.
Eggert. 2015. Differential dispersal shapes population structure and patterns of genetic
differentiation in two sympatric pond breeding salamanders. Conservation Genetics
16:59–69.
Peterman, W.E., Brocato, E.R., Pauley, L.R., Stuart, E. C., Semlitsch, R.D., and L.S. Eggert.
2013a. Development and characterization of 18 microsatellite loci for the spotted
salamander (Ambystoma maculatum) using paired-end Illumina shotgun sequencing.
Conservation Genetics Resources 5:989-991.
Peterman, W. E., Earl, J. E., Rittenhouse, T. A. G., and R. D. Semlitsch. 2013c. Demographic
network and multi-season occupancy modeling of Rana sylvatica reveal spatial and
temporal patterns of population connectivity and persistence. Landscape Ecology
28:1601–1613.
Peterman, W. E., B. H. Ousterhout, T. A. Anderson, D. L. Drake, R. D. Semlitsch, and L. S.
Eggert. In press. Assessing modularity in genetic networks to manage spatially structured
metapopulations. Ecosphere.
Peterman, W.E., Pauley, L.R., Brocato, E.R., Stuart, E.C., Semlitsch, R.D., and L.S. Eggert.
2013b. Development and characterization of 22 microsatellite loci for the ringed
salamander (Ambystoma annulatum) using paired-end Illumina shotgun sequencing.
Conservation Genetics Resources 5:993-995.
Peterman, W. E., and R. D. Semlitsch. 2013. Fine-scale habitat associations of a terrestrial
salamander: the role of environmental gradients and implications for population
dynamics. PLoS One 8:e62184.
Porej, D., Micacchion, M. and T. E. Hetherington. 2004. Core terrestrial habitat for conservation
of local populations of salamanders and wood frogs in agricultural landscapes. Biological
Conservation 120:399–409.
Porej, D. and Hetherington, T.E. 2005. Designing wetlands for amphibians: the importance of
predatory fish and shallow littoral zones in structuring amphibian communities. Wetlands
Ecology and Management 13:445-455.
Pritchard, J. K., Stephens, M., and P. Donnelly. 2000 Inference of population structure using
multilocus genotype data. Genetics 155:945–959
Pulliam, H.R. 1988. Sources, sinks, and population regulation. American Naturalist 132:652-661.
Rannap, R., Lõhmus, A. and L. Briggs. 2009. Niche position, but not niche breadth, differs in
two coexisting amphibians having contrasting trends in Europe. Diversity and
Distributions 15:692–700.
Raymond, M., and F. Rousset. 1995. GENEPOP (version 1.2): population genetics software for
exact tests and ecumenicism. Journal of Heredity 86:248-249.
Relyea, R. A. 2007. Getting out alive: how predators affect the decision to metamorphose.
Oecologia 152:389–400.
42
Rice, W. R. 1989. Analyzing Tables of Statistical Tests. Evolution 43:223-225.
Richter, S.C., and R.E. Broughton. 2005. Development and characterization of polymorphic
microsatellite DNA loci for the endangered Dusky Gopher Frog (Rana sevosa) and two
closely related species, Rana capito and Rana areolata. Molecular Ecology Notes 5:436-
438.
Richter-Boix, A., G.A. Llorente, and A. Montori. 2007. Structure and dynamics of an amphibian
metacommunity in two regions. Journal of Animal Ecology 76:607-618.
Rittenhouse, T.A.G., and R.D. Semlitsch. 2006. Grasslands as movement barriers for a
forest associated salamander: migration behavior of adult and juvenile salamanders at a
distinct habitat edge. Biological Conservation 131:14-22.
Rittenhouse, T.A.G., and R.D. Semlitsch. 2007. Distribution of amphibians in terrestrial habitat
surrounding wetlands. Wetlands 27:153-161.
Rothermel, B. B. and R. D. Semlitsch. 2006. Consequences of forest fragmentation for juvenile
survival in spotted (Ambystoma maculatum) and marbled (Ambystoma opacum)
salamanders. Canadian Journal of Zoology 84:797–807.
Rousset, F. 2008. Genepop'007: a complete reimplementation of the Genepop software for
Windows and Linux. Molecular Ecology Resources 8:103-106.
Rozen, S., and H. Skaletsky. 2000. Primer3 on the WWW for general users and for biologist
programmers. Methods in Molecular Biology 132:365-386.
Schtickzelle, N., and M. Baguette. 2004. Metapopulation viability analysis of the bog fritillary
butterfly using RAMAS/GIS. Oikos 104:277-290.
Scott, D.E. 1994. The effect of larval density on adult demographic traits in Ambystoma opacum.
Ecology 75:1383–1396.
Semlitsch, R.D. 1998. Biological delineation of terrestrial buffer zones for pond-breeding
salamanders. Conservation Biology 12:1113-1119.
Semlitsch, R.D. 2008. Differentiating migration and dispersal processes for pond-breeding
amphibians. Journal of Wildlife Management 72:260-267.
Semlitsch, R. D. and J. R. Bodie. 2003. Biological criteria for buffer zones around wetlands and
riparian habitats for amphibians and reptiles. Conservation Biology 17:1219-1228.
Semlitsch, R. D., W. E. Peterman, T. L. Anderson, D. L. Drake, and B. H. Ousterhout. 2015.
Intermediate pond sizes contain the highest density, richness, and diversity of pond-
breeding amphibians. PLoS ONE 10:e0123055.
Semlitsch, R. D., D. E. Scott, J. H. K. Pechmann, and J. W. Gibbons. 1996. Structure and
dynamics of an amphibian community: evidence from a 16-year study of a natural pond.
Pp. 217-248. Long-Term Studies of Vertebrate Communities. Academic Press, Inc.,
Burlington, MA.
Semlitsch, R. D. and H. M. Wilbur. 1988. Effects of pond drying time on metamorphosis and
survival in the salamander Ambystoma talpoideum. Copeia 1988, 978–983.
Sereno, M. L., P. S. B. Albuquerque, R. Vencovsky, and A. Figueira. 2006. Genetic diversity and
natural population structure of cacao (Theobroma cacao L.) from the Brazilian Amazon
evaluated by microsatellite markers. Conservation Genetics 7:13-24.
Sexton, O. J., Phillips, C. A. and E. Routman. 1994. The response of naive breeding adults of the
spotted salamander to fish. Behaviour 130:113–121.
Shulse, C. D., Semlitsch, R. D., Trauth, K. M. and J. E. Gardner. 2012. Testing wetland features
to increase amphibian reproductive success and species richness for mitigation and
restoration. Ecological Applications 22:1675–1688.
43
Shulse, C. D., R. D. Semlitsch, K. M. Trauth, and A. D. Williams. 2010. Influences of design
and landscape placement parameters on amphibian abundance in constructed wetlands.
Wetlands 30:915-926.
Shulse, C.D., R. D. Semlitsch, K. M. Trauth, M. Cadotte, 2013. Mosquitofish dominate
amphibian and invertebrate community development in experimental wetlands. Journal of
Applied Ecology 50(5):1244-1256.
Sinsch, U. 2014. Movement ecology of amphibians: From individual migratory behaviour to
spatially structured populations in heterogeneous landscapes1,2. Canadian Journal of
Zoology 92:491-502.
Stouffer, D. B., and J. Bascompte. 2011. Compartmentalization increases food-web persistence.
Proceedings of the National Academy of Sciences 108:3648–3652.
Team, R. C. 2014. R: A language and environment for statistical computing. Vienna, Austria;
http://www.R-project.org.
Theobold, D. 2007. LCap v1.0: Landscape Connectivity and Pattern tools for ArcGIS. Colorado
State University, Fort Collins, CO.
Urban, M. C. 2007. Predator size and phenology shape prey survival in temporary ponds.
Oecologia 154:571–580.
Walls, S. 1995. Differential vulnerability to predation and refuge use in competing larval
salamanders. Oecologia 101:86–93.
Werner, E. E., Skelly, D. K., Relyea, R. A. and K. L. Yurewicz. 2007a. Amphibian species
richness across environmental gradients. Oikos 116:1697–1712.
Werner, E. E., Yurewicz, K. L., Skelly, D. K., and R. A. Relyea. 2007b. Turnover in an
amphibian metacommunity: The role of local and regional factors. Oikos 116:1713-1725.
Wilbur, H. M. 1980. Complex life cycles. Annual Review of Ecology and Systematics 11:67-93.
44
Appendix A: Scientific/Technical Publications and Presentations
Publications in preparation:
Burkhart, J. J, Peterman, W. E., Brocato, E., Romine, K. R., Willis, M. M., Anderson, T.
L., Ousterhout, B. H., Drake, D. L., Semlitsch, R. D., and Eggert, L. S. Small-
scale landscape genetic analysis of four co-occurring salamander species at
multiple spatial scales. Landscape Ecology.
Burkhart, J. J., Shulse, C. D., and R.D. Semlitsch. Teasing apart the variation in the
relationship of metamorph export and larval density estimates for pond breeding
anurans. Copeia.
Heligman, Z.E., B.H. Ousterhout, C. Farmer, and R.D. Semlitsch. Behavior consistent
with non-random dispersal in a juvenile salamander.
Messerman, A., and R. D. Semlitsch. A conservation assessment and proposed
management plan for the ringed salamander (Ambystoma annulatum).
Messerman, A., and R. D. Semlitsch. A population viability analysis for the ringed
salamander (Ambystoma annulatum).
Peterman, W.E., T.L. Anderson, D.L. Drake, B.H. Ousterhout, and R.D. Semlitsch. Using
spatial demographic networks to identify optimal locations for wetland
construction and restoration. Ecological Applications.
Walls, S. C., Ball, L. C., Enge, K M., Gorman, T. A., Palis, J. G., and R. D. Semlitsch.
Overcoming roadblocks to recovery of declining amphibian populations in the
United States. Bioscience.
Publications in review/revision:
Nussbaum, S. E., Ousterhout, B. H., and R. D. Semlitsch. Agonistic behaviour suggestive
or territoriality among sympatric juvenile pond-breeding salamanders.
Ousterhout, B.H., and R. D. Semlitsch. Non-additive response of larval ringed
salamanders to intraspecific density.
Semlitsch, R. D., Ousterhout, B. H., Anderson, T. L., Drake, D. L, Burkhart, J. J.,
Rowland, F. E., and W. E. Peterman. Are hot-spots consistent" Spatiotemporal
variation and annual synchrony in larval abundance of pond-breeding
salamanders.
Journal articles:
Anderson, T. L., B. H. Ousterhout, W. E. Peterman, D. L. Drake and R. D. Semlitsch. In
Press. Life history differences influence the impacts of drought on two pond-
breeding salamanders. Ecological Applications doi:10.1890/14-2096.1
Anderson, T.L., J. L. Heemeyer, W. E. Peterman, M. J. Everson, B. H. Ousterhout, D. L.
Drake, and R. D. Semlitsch. 2015. Automated analysis of temperature dataloggers
to determine inundation state of wetlands. Wetlands Ecology and Management.
doi:10.1007/s11273-015-9439-x
Anderson, T. L., Hocking, D. J., Conner, C. A., Earl, J. E., Harper, E. B., Osbourn, M. S.,
Peterman, W. E., Rittenhouse, T. A. G., and R. D. Semlitsch. 2014. Abundance
and phenology patterns of two pond-breeding salamanders determine species
interactions in natural populations. Oecologia. doi:10.1007/s0042-014-3151-z.
45
Anderson, T. L. and R. D. Semlitsch. 2014. High intraguild predator density induces
thinning effects on and increases temporal overlap with prey populations.
Population Ecology 56: 265-273 *Editors Choice*
Drake, D. L., T. L. Anderson, L. M. Smith, K. L. Lohraff, and R. D. Semlitsch. 2014.
Predation of eggs and hatchlings of the Ringed Salamander (Ambystoma
annulatum) by native and non-native predators. Herpetologica 70: 378-387.
Drake, D. L., Ousterhout, B. H., Shulse, C. D., Hocking, D. J., Peterman, W. E.,
Anderson, T. L., Lohraff, K. L., Conner, C. A., Harper, E. H., Johnson, J. R.,
Rittenhouse, T. A. G., Rothermel, B. B., Eggert, L. S., and R. D. Semlitsch. 2015.
Pond-breeding amphibian community composition in Missouri. American
Midland Naturalist 174:180-187.
Ousterhout, B. H., and R. D. Semlitsch. 2014. Measuring terrestrial movement behavior
using Passive Integrated Transponder (PIT) tags: effects of tag size on detection,
survival, and growth. Behavioral Ecology and Sociobiology 68:343-350.
Ousterhout, B. H., Anderson, T. L., Drake, D. L., Peterman, W. E., and R. D. Semlitsch.
2015. Habitat traits and species interactions differentially affect abundance and
body size in pond-breeding amphibians. Journal of Animal Ecology 84:914-924.
Peterman, W. E., T. L. Anderson, D. L. Drake, B. H. Ousterhout, and R. D. Semlitsch.
2014. Maximizing pond biodiversity across the landscape: a case study of larval
ambystomatid salamanders. Animal Conservation 17:275–285.
Peterman, W. E., T. L. Anderson, B. H. Ousterhout, D. L. Drake, R. D. Semlitsch, and L.
S. Eggert. 2015. Differential dispersal shapes population structure and patterns of
genetic differentiation in two sympatric pond breeding salamanders. Conservation
Genetics 16:59–69.
Peterman, W.E., Brocato, E.R., Pauley, L.R., Stuart, E. C., Semlitsch, R.D., and L.S.
Eggert. 2013a. Development and characterization of 18 microsatellite loci for the
spotted salamander (Ambystoma maculatum) using paired-end Illumina shotgun
sequencing. Conservation Genetics Resources 5:989-991.
Peterman, W. E., Connette, G. M., Spatola, B., Eggert, L. S., and R. D. Semlitsch. 2014.
Identification of polymorphic loci in Ambystoma annulatum and review of cross-
species microsatellite use in the genus Ambystoma. Copeia 2012:570-577.
Peterman, W. E., Earl, J. E., Rittenhouse, T. A., and R. D. Semlitsch. 2013. Demographic
network and multi-season occupancy modeling of Rana sylvatica reveal spatial
and temporal patterns of connectivity. Landscape Ecology 28:1601-1613.
Peterman, W. E., Feist, S. M., Semlitsch, R. D., and L. S. Eggert. 2013. Conservation and
management of peripheral populations: spatial and temporal influences on the
genetic structure of wood frog (Rana sylvatica) populations. Biological
Conservation 158:351-358.
Peterman, W. E., Locke, J. L., and R. D. Semlitsch. 2013. Spatial and temporal patterns
of water loss in heterogeneous landscapes: Using plaster models as amphibian
analogues. Canadian Journal of Zoology 91:135-140.
Peterman, W. E., B. H. Ousterhout, T. A. Anderson, D. L. Drake, R. D. Semlitsch, and L.
S. Eggert. In press. Assessing modularity in genetic networks to manage spatially
structured metapopulations. Ecosphere.
46
Peterman, W.E., Pauley, L.R., Brocato, E.R., Stuart, E.C., Semlitsch, R.D., and L.S.
Eggert. 2013b. Development and characterization of 22 microsatellite loci for the
ringed salamander (Ambystoma annulatum) using paired-end Illumina shotgun
sequencing. Conservation Genetics Resources 5:993-995.
Pittman, S. E., Osbourn, M. S., and R. D. Semlitsch. Movement ecology of amphibians:
A missing component for understanding population declines. Biological
Conservation 169:44-53.
Semlitsch, R. D., Anderson, T. L., Osbourn, M. S., and B. H. Ousterhout. 2014. Structure
and dynamics of ringed salamander (Ambystoma annulatum) populations in
Missouri. Herpetologica 70: 14-22.
Semlitsch, R. D., W. E. Peterman, T. L. Anderson, D. L. Drake, and B. H. Ousterhout.
2015. Intermediate pond sizes contain the highest density, richness, and diversity
of pond-breeding amphibians. PLoS ONE 10:e0123055.
Other publications:
Peterman, W. E. 2014. ResistanceGA: An R package for the optimization of resistance
surfaces using genetic algorithms.
Semlitsch, R. D, W. E. Peterman, L. S. Eggert. 2014. Understanding the complex spatial
and temporal variation in source-sink dynamics of salamanders. Natural
Selections: Department of Defense Natural Resources Programs, Fall 2014.
Semlitsch, R. D., T. L. Anderson, D. L. Drake, B. H. Ousterhout, W. E. Peterman, and C.
D. Shulse. 2013. Small, clustered wetlands promote amphibian persistence.
National Wetlands Newsletter, volume 35, number 5
Oral presentations:
Anderson, F. E. Rowland, and R. D. Semlitsch. 2015. Phenology and density influence
intraguild predation between larval salamanders. Ecological Society of America
Annual Meeting, Baltimore, MD. 2015.
Anderson, F. E. Rowland, and R. D. Semlitsch. Phenology and density influence
intraguild predation between larval salamanders. Society for the Study of Reptiles
and Amphibians. Lawrence, KS, 2015
Anderson, T. L. et al. Biotic and abiotic influences on larval salamander occupancy,
abundance and body size. Missouri Herpetological Association, Branson, MO,
2014.
Anderson, T. L. and R. D. Semlitsch. Top predators and habitat complexity alter a larval
salamander intraguild predation module. Ecological Society of America Annual
Meeting, Sacramento, CA. 2014.
Anderson, T. L. and R. D. Semlitsch. Top predators and habitat complexity alter a larval
salamander intraguild predation module. Joint Meeting of Ichthyologists and
Herpetologists, Chattanooga, TN. 2014.
Burkhart, J. J. Small scale landscape genetic analysis of three co-occurring salamander
species at multiple spatial scales. Society for the Study of Amphibians and
Reptiles. Lawrence, KS. 2015.
Burkhart, J. J. Population genetics at multiple spatial scales. University of Missouri Eco-
lunch seminar series. Columbia, MO. 2015.
47
Burkhart, J. J. Investigation of source-sink dynamics in Ambystoma salamanders on Fort
Leonard Wood Military Training Facility. Symposium: Using genetic tools to
enhance natural resources on DoD lands. Omaha, NE. 2015.
Eggert, L. S., Burkhart, J. J., Peterman, W. E., and R. D. Semlitsch. Landscape genetics
of co-occurring Ambystomatid salamanders at Fort Leonard Wood, MO. Missouri
University of Science and Technology. Rolla, MO. 2015.
Peterman, W.E., R.D. Semlitsch, T.L. Anderson, B.H. Ousterhout, and D.
Drake Implementing source-sink models for management recommendations.
Ecological Society of America; Baltimore, MD (Ignite format). 2015.
Peterman, W.E. Maximizing genetic and demographic connectivity of ringed
salamanders. Ringed Salamander Symposium, University of Missouri, Columbia,
MO. 2014.
Peterman, W.E. Using spatial demographic networks to identify optimal locations for
wetland construction and restoration. Symposium on Concepts and Applications
of Network Analysis in Wildlife Science, The Wildlife Society, Winnipeg,
Manitoba. 2015
Poster presentations:
Anderson, T. L., and R. D. Semlitsch. The effects of predators and habitat complexity on
detection probability and abundance of larval ringed salamanders (Ambystoma
annulatum). Ecological Society of America, Minneapolis, MN. 2013.
Anderson, T.L., and R. D. Semlitsch. 2013. High intraguild predator density induces
thinning effects on and increases temporal overlap with prey populations. Joint
Meeting of Ichthyologists and Herpetologists, Albuquerque, NM. 2013.*ASIH
Storer Award, Best Poster*
Brocato, E., Peterman, B., Eggert, L., and R. Semlitsch. Reducing bias in population
genetic inferences and effective population size estimation: The effects of
sampling different life stages. Summer Undergraduate Research and Creative
Achievements Forum, University of Missouri, Columbia, 2013.
Doll, S., B.H. Ousterhout, and R.D. Semlitsch. Marbled salamander (Ambystoma
opacum) larvae behavioral response to ringed salamander larvae (Ambystoma
annulatum) cues. MU Undergraduate Research & Creative Achievements Forum,
Columbia, MO. 2014.
Heligman, Z., B. H. Ousterhout, C. Farmer, and R.D. Semlitsch. An activity behavioral
syndrome in juvenile ringed salamanders (Ambystoma annulatum). MU
Undergraduate Research & Creative Achievements Forums, Columbia, MO. 2013.
Koenig, A.M. and B.H. Ousterhout. Repeatability of behavior across salamander life
history. Meeting of the Society for the Study of Amphibians and Reptiles, Kansas
University, Lawrence, KS. 2015.
Kroese, C., Burkhart, J. J., Semlitsch, R. D., and L. S. Eggert. Range-wide genetic
assessment of ringed salamanders (Ambystoma annulatum). Summer
Undergraduate Research and Creative Achievements Forum, University of
Missouri, Columbia, 2014.
Nussbaum, S.E., B.H. Ousterhout, and R.D. Semlitsch. Competition and aggression in
juvenile Ambystoma salamanders. MU Undergraduate Research & Creative
Achievements Forums, Columbia, MO. 2014.

48
Willis, M. M., Burkhart, J. J., Messerman, A. F., Semlitsch, R. D., and L. S. Eggert.
Influence of life history on genetic diversity in salamanders. Summer
Undergraduate Research and Creative Achievements Forum, University of
Missouri, Columbia, 2015.

49
Appendix B: Datasets Used in the Genetic Analyses (online
attachments)
From Burkhart et al. (unpublished data):
Aa_FLW_Fa2013* A. annulatum (embryos coll. Fall, 2013)
Am_FLW_Sp2013 A. maculatum
Ao_FLW_Fa2013 A. opacum
Nv_FLW_Su2014 N. viridescens
From Peterman et al. 2015
Aa_GenePop_2012 A. annulatum
Am_GenePop_2012 A. maculatum
From Peterman et al. (In Press, Ecosphere)
Aa_Genepop_2013 A. annulatum (embryos coll. Fall 2012, would metamorphose
2013)
*All genetic files are in GenePop format

50
Appendix C. User Guide Program 'ssmc' (online attachment)
ssmc: An R Package for assessing source-sink population status and contribution
of populations to the metapopulation using demographic connectivity networks
and Monte Carlo simulation