Embed Size (px)
Citation preview
polymers
Article
Multi-Response Optimization of Tensile CreepBehavior of PLA 3D Printed Parts Using CategoricalResponse Surface Methodology
Muhammad Waseem 1 , Bashir Salah 2 , Tufail Habib 1 , Waqas Saleem 3 ,Muhammad Abas 1,* , Razaullah Khan 4,* , Usman Ghani 5 and Muftooh Ur Rehman Siddiqi 6
1 Department of Industrial Engineering, University of Engineering & Technology, Peshawar 25100, Pakistan;[email protected] (M.W.); [email protected] (T.H.)
2 Industrial Engineering Department, College of Engineering, King Saud University, P.O. Box 800,Riyadh 11421, Saudi Arabia; [email protected]
3 Department of Mechanical and Manufacturing Engineering, Institute of Technology, F91 YW50 Sligo, Ireland;[email protected]
4 Department of Mechanical Engineering Technology, University of Technology, Nowshera 24100, Pakistan5 Department of Mechanical Engineering, University of Engineering and Technology, Peshawar,
Jalozai Campus 24240, Pakistan; [email protected] Department of Mechanical Engineering, CECOS University of IT and Emerging Sciences,
Peshawar 25100, Pakistan; [email protected]* Correspondence: [email protected] (M.A.); [email protected] (R.K.)
Received: 21 November 2020; Accepted: 8 December 2020; Published: 11 December 2020 �����������������
Abstract: Three-dimensional printed plastic products developed through fused deposition modeling(FDM) endure long-term loading in most of the applications. The tensile creep behavior of suchproducts is one of the imperative benchmarks to ensure dimensional stability under cyclic anddynamic loads. This research dealt with the optimization of the tensile creep behavior of 3D printedparts produced through fused deposition modeling (FDM) using polylactic acid (PLA) material.The geometry of creep test specimens follows the American Society for Testing and Materials (ASTMD2990) standards. Three-dimensional printing is performed on an open-source MakerBot desktop 3Dprinter. The Response Surface Methodology (RSM) is employed to predict the creep rate and rupturetime by undertaking the layer height, infill percentage, and infill pattern type (linear, hexagonal, anddiamond) as input process parameters. A total of 39 experimental runs were planned by means of acategorical central composite design. The analysis of variance (ANOVA) results revealed that the mostinfluencing factors for creep rate were layer height, infill percentage, and infill patterns, whereas, forrupture time, infill pattern was found significant. The optimized levels obtained for both responsesfor hexagonal pattern were 0.1 mm layer height and 100% infill percentage. Some verification testswere performed to evaluate the effectiveness of the adopted RSM technique. The implementedresearch is believed to be a comprehensive guide for the additive manufacturing users to determinethe optimum process parameters of FDM which influence the product creep rate and rupture time.
Keywords: fused deposition modeling; polylactic acid; tensile creep behavior; modeling polymermanufacturing; design for additive manufacturing
1. Introduction
With the advent of reliable polymeric materials and advanced printing techniques, additivemanufacturing (AM) has emerged an indispensable pillar in the fabrication of simple to complexproducts [1–3]. Among various additive manufacturing technologies, fused deposition modeling
Polymers 2020, 12, 2962; doi:10.3390/polym12122962 www.mdpi.com/journal/polymers
Polymers 2020, 12, 2962 2 of 16
(FDM) outweighs the other techniques due to its simple processing and economical applications [1–4].FDM printer uses thermoplastics filaments which are fed into an extruder and subsequently melted bythe heater. The molten material is then extruded through a nozzle to develop a multi-layer platformin the form of the desired shape. The commonly used thermoplastics are acrylonitrile butadienestyrene (ABS), polylactic acid (PLA), nylon, and fiber-reinforced composites [1,5]. These materials areeconomical, lightweight, and exhibit excellent properties.
There are four major crystalline forms (α, β, γ, and δ) which are mostly exhibited by PLA [6–10].The common α crystallite form is obtained from the melt in a slow cooling procedure which allows thePLA chain to rotate into the confirmation with lower potential energy. The β crystalline phase arisesfrom a deformation of the crystals and is usually obtained by drawing the PLA at elevated temperatures;the γ form is obtained by epitaxial crystallization on a single substrate, such as hexamethylbenzene [10].Due to the similarity in the crystalline structure, δ form is also called α’, or imperfect α form [11]. The δ
form (or α’ form) is observed in samples processed from the melt with a fast-cooling procedure [12].The crystallization of PLA at high super cooling of the melt leads to the formation of the disorderedconformation, i.e., δ crystals. These crystals are metastable both at the temperature of their formationand below. From the melt, the polymer tends to crystallize in α form but actually also partiallycrystallizes in α’ form at lower temperatures. In this case, the PLA has higher internal stresses andpresents a lower thermal and mechanical stability. Considering the effect of the printing pathway, aswell, the printed part is always anisotropic.
Cicala et al. [13] tested three commercial PLA filaments and compared their properties usingthermos gravimetric analysis (TGA) and scanning electron microscopy (SEM) analysis. Two filaments(White and Black) showed better results in terms of rheology, while the other one (Green) resultedin poor rheological properties. Overall, the filament filled with mineral fillers showed the bestthermomechanical performance and printing quality. Cicala et al. [13] prepared two blends ofPolyetherimide (PEI) by modification with Polycarbonate (PC) and polyethylene terephthalateglycol-modified (PETG). They compared the blends with Ultem 9085, a standard grade for FDMprinting, and analyzed different properties like tensile and thermomechanical properties. The PC blendshowed good results with low PC content, but the properties were not satisfactory with higher PCcontent. On the other hand, the PETG blend showed significant results with almost similar propertiesto the Ultem 9085.
Olaiya et al. [14] analyzed the mechanical, thermal, and microstructural properties of PLA byblending it with chitin. The percentage weight of the chitin was kept from 2 to 8 percent. From thetensile strength, yield strength, Young’s modulus, and impact tests, it was analyzed that the PLA–chitinblend shows excellent mechanical properties. Subramaniam et al. [15] investigated the tensile propertyof PLA to determine the optimum printing parameter. Tensile specimens were printed according toASTM D638 type 1 standard and varying the infill density. Three important mechanical propertieswere investigated, namely ultimate tensile strength, elastic modulus, and yield strength, and it wasinferred that the tensile property increases with the infill density.
Getme et al. [16] evaluated that the fragility of PLA can be reduced by reinforcing with otherbiodegradable products, and it is an effective way to produce completely biodegradable composites.By reducing the brittleness of PLA, it can be used in a broad variety of applications. Cobos et al. [17]proposed PLA as an alternative to nanocomposites in fusion deposition modeling. The workinvolved describing thermal and rheological conditions of the PLA with multi-wall carbon nanotube(PLA/MWCNT) and halloysite nanotube (PLA/HNT) composites. The research was accomplishedby employing differential scanning calorimetry (DSC) and capillary rheometry to characterize theseproducts and analyze the melt flow index (MFI).
PLA applications are also common in pharmaceuticals and healthcare. Juan et al. [18] workedon coating PLA pellets with lignin (LIG) powder and biocompatible oil. The PLA filaments wereproduced with an extruder at 200 ◦C. It was found that LIG content affected the mechanical andsurface properties of the material and lowered the resistance to fracture. In addition, the resulting
Polymers 2020, 12, 2962 3 of 16
3D printed materials demonstrated antioxidant capabilities. Likewise, DeStefano et al. [19] carriedout a detailed study to explain the important applications of PLA in the medical sector, such as tissueengineering, cardiovascular implants, dental implants, orthopedic intercession, tendon healing, andmedical equipment. The authors descried that it is a versatile biopolymer and synthesized with easefrom abundant renewable resources. Moreover, PLA has successfully used in personal protectiveequipment (PPE) and ventilator modifications.
Luchian-Lupu et al. [20] evaluated the stability qualification of PLA and styrene-isoprene-styrenetriblock polymers (SIS) blend. Samples were prepared with three SIS loadings (10, 20, and 30 percentweight) in the PLA matrix. It was revealed that the concentration effect of minor component revealsthe higher stability for the lower amounts of SIS. It was reported that SIS promote material aging.Camargo et al. [21] studied the mechanical properties of 3D-printed parts produced by PLA-graphene,such as tensile strength, flexural strength, and impact energy. The parts were manufactured withFDM technology with varying the infill and layer thickness parameters. It was investigated that themechanical properties improve as the linear layer thickness parameter increases, whereas the tensilestrength and flexural strength increased with an increase in the infill increased.
Parameters setting in FDM play a significant role in the development of products with desiredproperties. According to Casavola et al. [22], the optimal set of parameters is a serious challenge inFDM, as several significant factors contribute to the mechanical properties. Some of the importantparameters are infill percentage, raster angle, layer thickness, infill pattern, raster width, and air gap.Since poor material properties in 3D printing pose major problems, therefore, the effect of mechanicalproperties should be investigated. Baich et al. [23] studied the effect of infill design on production costand mechanical strength of ABS 3D-printed parts. They concluded that a solid fill design providesa higher strength (tensile, compression, and bending) compared to a high-density infill design withthe same cost of production. Farbman and McCoy [24] studied the effect of infill percentage, infillgeometries, and load orientation on the ultimate tensile strength of PLA and ABS 3D-printed parts.They compared the strength to weight ratios of different infill geometries and concluded that theultimate strength decreases with a decrease in infill percentage, while hexagonal infill patterns arestiffer and stronger than rectilinear infill patterns. According to Caminero et al. [25], the structuralproperties of FDM are significantly affected by build orientation. Build orientation represents thedirections in which the sample is placed on the 3D printer bed surface. They identified that thestrongest printing orientation is obtained when the fused fifilament deposition coincided with thepull direction.
Kamoonaet al. [26] studied the effect of build orientation, layer thickness, raster angle, air gap,and raster width on tensile, impact, and flexural strength of FDM-printed parts. They concludedthat smaller layer thickness increases the number of layers to fabricate the part; hence it improvesthe strength of the parts. However, smaller raster angle results in weak bonding layers; therefore, itreduced the strength of the part, while thick raster and zero air gaps result in strong bond formation.Tymrak et al. [27] observed the highest tensile strength for the lowest thickness of L = [0.2, 0.4] mm.However, the authors observed greater variability among parameters for PLA specimens. Pei et al. [28]inferred that increasing the number of shell perimeters improves the relation of tensile strength andlayer thickness for PLA specimens. Vaezi et al. [29] reported that, for flflat oriented samples, a decreasein layer height from 0.1 mm to 0.087 mm increased the tensile strength and decreased flflexural strength.According to Lovo et al. [30], optimal build surface orientation is also important to maximize the tensilestrength of FDM printed parts.
There are a very limited numbers of publications on creep behavior of PLA parts produced throughFDM. This area needs meticulous research efforts in the form of numerical modeling, simulation studies,and experimental validation. Mohamed et al. [31] investigated the flexural creep stiffness behavior ofPolycarbonate-ABS (PC-ABS) through definitive screening design. They developed a model with ahigh coefficient of determination, but this model does not apply to PLA parts; however, it works wellwith ABS and PC-ABS parts. An et al. [32] predicted the creep behavior of ABS polymeric material
Polymers 2020, 12, 2962 4 of 16
using finite element analysis. The numerical outcomes were compared with the experimental andsimulation results and found in close approximation with the real-time environment. Lim et al. [33]presented a method for prediction of long term creep behavior using a short term creep experimentaldata. The experiments were performed on ABS, PC-ABS, and long fiber reinforced thermoplastics(LFT). It was suggested that the method developed for these materials is also applicable to otherplastics, like PLA, but the scope of work was very limited. Tezel et al. [34] studied the creep behaviorof PLA and PLA composites 3D-printed parts. They concluded that samples built at 90◦ orientationwith a layer thickness of 0.1 mm provide good creep strength. However, it was inferred that the creepbehavior can further be explored for possible combinations of printing parameters.
From the presented literature review, it is clear that no comprehensive study is available whichshows the creep behavior of PLA 3D-printed parts through FDM. The authors could find only onepublished research by Tezel et al. [34]. The research was focused on the creep behavior of PLA byundertaking the effect of printing orientation and layer thickness. However, the parameters, suchas infill percentage and infill pattern type, were not considered. Moreover, no specific optimizationtechnique was applied to identify the best combination of printing parameters. To fill this gap, thepresented research characterizes and optimizes the creep behavior (creep rate and rupture time) ofFDM-printed parts under different printing parameters, such as the infill percentage, infill patterntype, and layer thickness. For this aim, response surface methodology is applied to the optimization ofprinting parameters of creep behavior to predict creep rate and rupture time. Subsequently, ANOVA isapplied to study the effect of printing parameters on creep rate and rupture time. The regression modelsuccessfully established the relationship between printing parameters and responses. Finally, importantconfirmation tests are performed to evaluate the adequacy and effectiveness of optimized parameters.
The presented study also provides a comprehensive insight into the influence of FDM processparameters on creep rate and rupture time for the PLA 3D-printed products. This work is particularlyinteresting for small and medium enterprises in developing countries that are underpinned to adoptadditive manufacturing by means of small-scale desktop 3D printers.
2. Materials and Methods
2.1. Experimental Setup
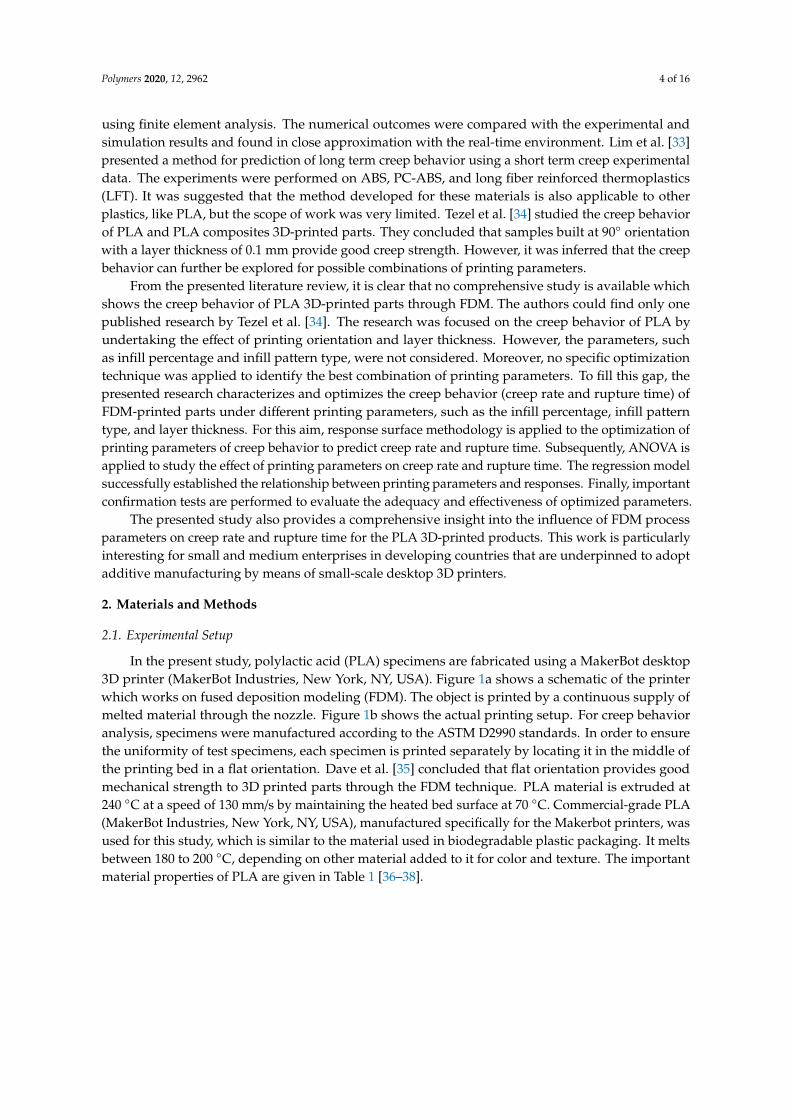
In the present study, polylactic acid (PLA) specimens are fabricated using a MakerBot desktop3D printer (MakerBot Industries, New York, NY, USA). Figure 1a shows a schematic of the printerwhich works on fused deposition modeling (FDM). The object is printed by a continuous supply ofmelted material through the nozzle. Figure 1b shows the actual printing setup. For creep behavioranalysis, specimens were manufactured according to the ASTM D2990 standards. In order to ensurethe uniformity of test specimens, each specimen is printed separately by locating it in the middle ofthe printing bed in a flat orientation. Dave et al. [35] concluded that flat orientation provides goodmechanical strength to 3D printed parts through the FDM technique. PLA material is extruded at240 ◦C at a speed of 130 mm/s by maintaining the heated bed surface at 70 ◦C. Commercial-grade PLA(MakerBot Industries, New York, NY, USA), manufactured specifically for the Makerbot printers, wasused for this study, which is similar to the material used in biodegradable plastic packaging. It meltsbetween 180 to 200 ◦C, depending on other material added to it for color and texture. The importantmaterial properties of PLA are given in Table 1 [36–38].
Polymers 2020, 12, 2962 5 of 16Polymers 2020, 12, x 5 of 17
(a) (b)
Figure 1. (a) Schematic of fused deposition modeling. (b) Actual 3D printing setup of fused deposition
modeling (FDM).
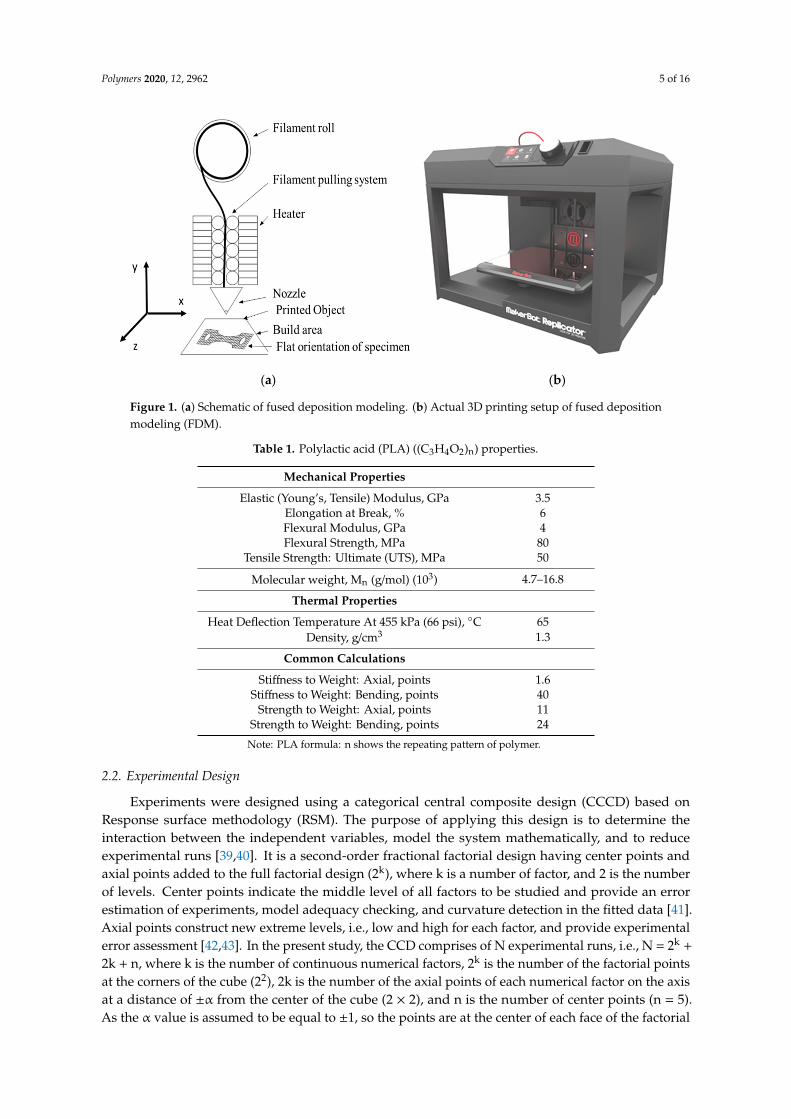
Table 1. Polylactic acid (PLA) ((C3H4O2)n) properties.
Mechanical Properties
Elastic (Young’s, Tensile) Modulus, GPa 3.5
Elongation at Break, % 6
Flexural Modulus, GPa 4
Flexural Strength, MPa 80
Tensile Strength: Ultimate (UTS), MPa 50
Molecular weight, Mn (g/mol) (103) 4.7–16.8
Thermal Properties
Heat Deflection Temperature At 455 kPa (66 psi), °C 65
Density, g/cm3 1.3
Common Calculations
Stiffness to Weight: Axial, points 1.6
Stiffness to Weight: Bending, points 40
Strength to Weight: Axial, points 11
Strength to Weight: Bending, points 24
Note: PLA formula: n shows the repeating pattern of polymer.
2.2. Experimental Design
Experiments were designed using a categorical central composite design (CCCD) based on
Response surface methodology (RSM). The purpose of applying this design is to determine the
interaction between the independent variables, model the system mathematically, and to reduce
experimental runs [39,40]. It is a second‐order fractional factorial design having center points and
axial points added to the full factorial design (2k), where k is a number of factor, and 2 is the number
of levels. Center points indicate the middle level of all factors to be studied and provide an error
estimation of experiments, model adequacy checking, and curvature detection in the fitted data [41].
Axial points construct new extreme levels, i.e., low and high for each factor, and provide
experimental error assessment [42,43]. In the present study, the CCD comprises of N experimental
runs, i.e., N = 2k + 2k + n, where k is the number of continuous numerical factors, 2k is the number of
the factorial points at the corners of the cube (22), 2k is the number of the axial points of each numerical
factor on the axis at a distance of ±α from the center of the cube (2 × 2), and n is the number of center
points (n = 5). As the α value is assumed to be equal to ±1, so the points are at the center of each face
of the factorial space, and this type of central composite design is called face‐centered central
Figure 1. (a) Schematic of fused deposition modeling. (b) Actual 3D printing setup of fused depositionmodeling (FDM).
Table 1. Polylactic acid (PLA) ((C3H4O2)n) properties.
Mechanical Properties
Elastic (Young’s, Tensile) Modulus, GPa 3.5Elongation at Break, % 6Flexural Modulus, GPa 4Flexural Strength, MPa 80
Tensile Strength: Ultimate (UTS), MPa 50
Molecular weight, Mn (g/mol) (103) 4.7–16.8
Thermal Properties
Heat Deflection Temperature At 455 kPa (66 psi), ◦C 65Density, g/cm3 1.3
Common Calculations
Stiffness to Weight: Axial, points 1.6Stiffness to Weight: Bending, points 40
Strength to Weight: Axial, points 11Strength to Weight: Bending, points 24
Note: PLA formula: n shows the repeating pattern of polymer.
2.2. Experimental Design
Experiments were designed using a categorical central composite design (CCCD) based onResponse surface methodology (RSM). The purpose of applying this design is to determine theinteraction between the independent variables, model the system mathematically, and to reduceexperimental runs [39,40]. It is a second-order fractional factorial design having center points andaxial points added to the full factorial design (2k), where k is a number of factor, and 2 is the numberof levels. Center points indicate the middle level of all factors to be studied and provide an errorestimation of experiments, model adequacy checking, and curvature detection in the fitted data [41].Axial points construct new extreme levels, i.e., low and high for each factor, and provide experimentalerror assessment [42,43]. In the present study, the CCD comprises of N experimental runs, i.e., N = 2k +
2k + n, where k is the number of continuous numerical factors, 2k is the number of the factorial pointsat the corners of the cube (22), 2k is the number of the axial points of each numerical factor on the axisat a distance of ±α from the center of the cube (2 × 2), and n is the number of center points (n = 5).As the α value is assumed to be equal to ±1, so the points are at the center of each face of the factorial
Polymers 2020, 12, 2962 6 of 16
space, and this type of central composite design is called face-centered central composite design. Forone level of a categorical factor, there are 13 experimental runs (N = 22 + (2 × 2) + 5); hence, for threecategorical factors, the total experimental runs are 3N (3 × 13 = 39). The continuous factors are layerheight (L) and infill percentage (I). The categorical factor is the infill pattern type, i.e., linear, hexagonal,and diamond. Their levels used in the design of experiments are summarized in Table 2. The layerheight and the infill percentage varied from 0.1 to 0.3 mm and 10 to 100%, respectively.
Table 2. Factors with their levels.
Factors Levels
Symbols −1 0 1Continuous
Layer height (mm) L 0.1 0.2 0.3Infill percentage I 10 55 100
Categorical 1 2 3Infill Pattern Pt Linear Hexagonal Diamond
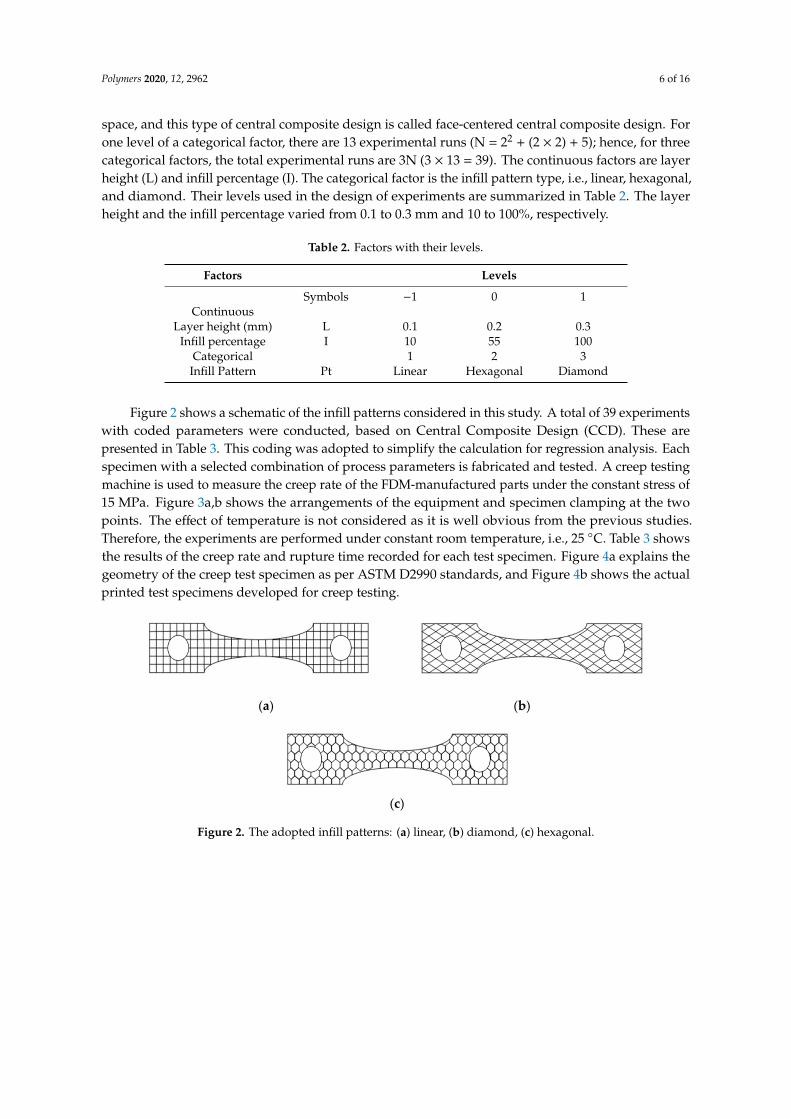
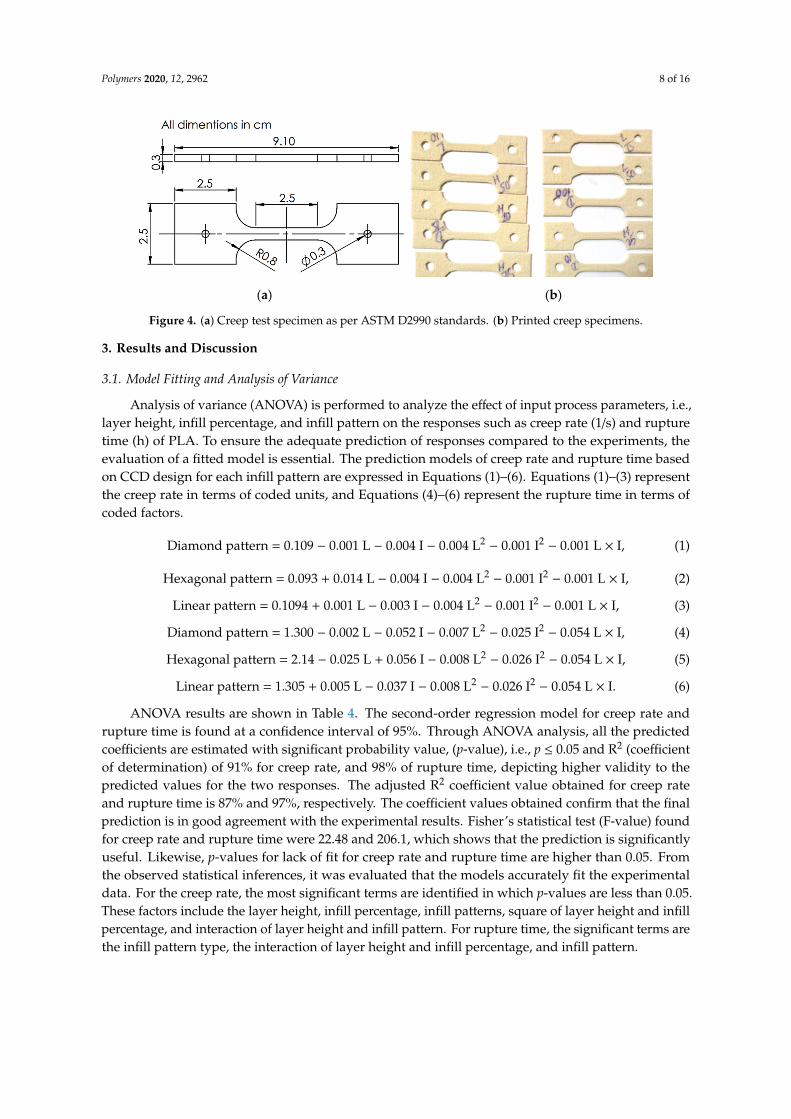
Figure 2 shows a schematic of the infill patterns considered in this study. A total of 39 experimentswith coded parameters were conducted, based on Central Composite Design (CCD). These arepresented in Table 3. This coding was adopted to simplify the calculation for regression analysis. Eachspecimen with a selected combination of process parameters is fabricated and tested. A creep testingmachine is used to measure the creep rate of the FDM-manufactured parts under the constant stress of15 MPa. Figure 3a,b shows the arrangements of the equipment and specimen clamping at the twopoints. The effect of temperature is not considered as it is well obvious from the previous studies.Therefore, the experiments are performed under constant room temperature, i.e., 25 ◦C. Table 3 showsthe results of the creep rate and rupture time recorded for each test specimen. Figure 4a explains thegeometry of the creep test specimen as per ASTM D2990 standards, and Figure 4b shows the actualprinted test specimens developed for creep testing.
Polymers 2020, 12, x 6 of 17
composite design. For one level of a categorical factor, there are 13 experimental runs (N = 22 + (2 × 2)
+ 5); hence, for three categorical factors, the total experimental runs are 3N (3 × 13 = 39). The
continuous factors are layer height (L) and infill percentage (I). The categorical factor is the infill
pattern type, i.e., linear, hexagonal, and diamond. Their levels used in the design of experiments are
summarized in Table 2. The layer height and the infill percentage varied from 0.1 to 0.3 mm and 10
to 100%, respectively.
Table 2. Factors with their levels.
Factors Levels
Symbols −1 0 1
Continuous
Layer height (mm) L 0.1 0.2 0.3
Infill percentage I 10 55 100
Categorical 1 2 3
Infill Pattern Pt Linear Hexagonal Diamond
Figure 2 shows a schematic of the infill patterns considered in this study. A total of 39
experiments with coded parameters were conducted, based on Central Composite Design (CCD).
These are presented in Table 3. This coding was adopted to simplify the calculation for regression
analysis. Each specimen with a selected combination of process parameters is fabricated and tested.
A creep testing machine is used to measure the creep rate of the FDM‐manufactured parts under the
constant stress of 15 MPa. Figure 3a,b shows the arrangements of the equipment and specimen
clamping at the two points. The effect of temperature is not considered as it is well obvious from the
previous studies. Therefore, the experiments are performed under constant room temperature, i.e.,
25 °C. Table 3 shows the results of the creep rate and rupture time recorded for each test specimen.
Figure 4a explains the geometry of the creep test specimen as per ASTM D2990 standards, and Figure
4b shows the actual printed test specimens developed for creep testing.
(a) (b)
(c)
Figure 2. The adopted infill patterns: (a) linear, (b) diamond, (c) hexagonal.
Figure 2. The adopted infill patterns: (a) linear, (b) diamond, (c) hexagonal.
Polymers 2020, 12, 2962 7 of 16
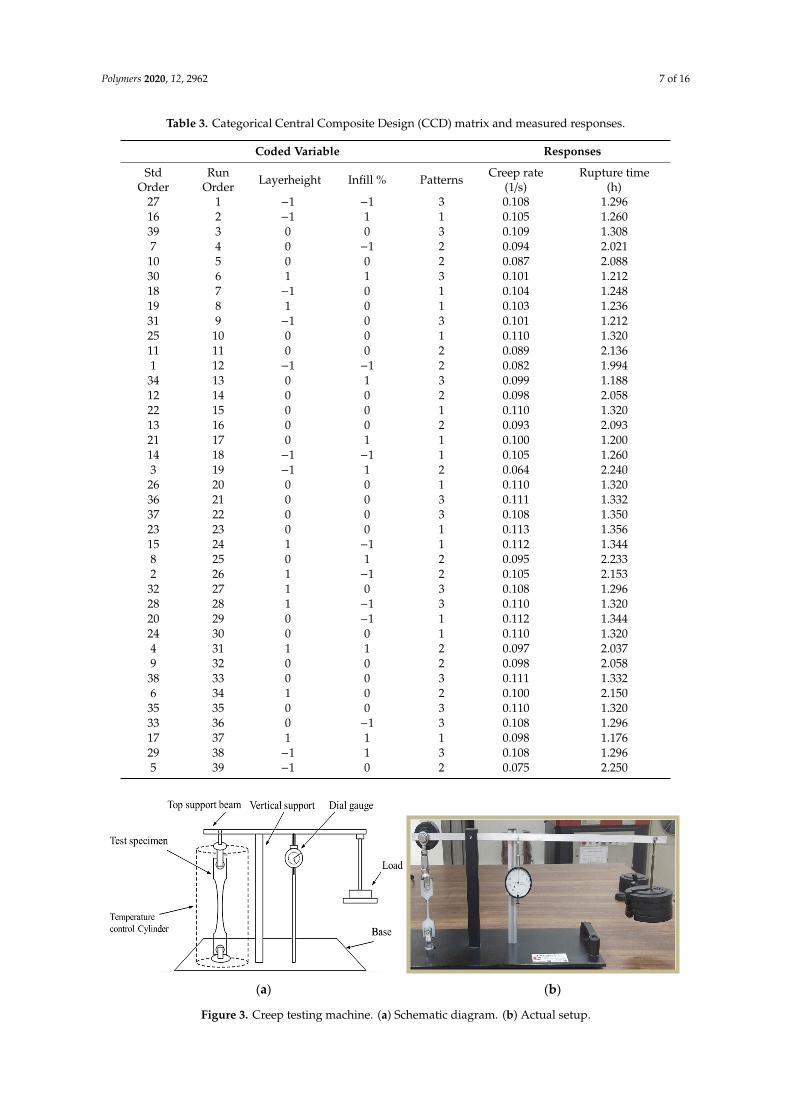
Table 3. Categorical Central Composite Design (CCD) matrix and measured responses.
Coded Variable Responses
StdOrder
RunOrder Layerheight Infill % Patterns Creep rate
(1/s)Rupture time
(h)27 1 −1 −1 3 0.108 1.29616 2 −1 1 1 0.105 1.26039 3 0 0 3 0.109 1.3087 4 0 −1 2 0.094 2.021
10 5 0 0 2 0.087 2.08830 6 1 1 3 0.101 1.21218 7 −1 0 1 0.104 1.24819 8 1 0 1 0.103 1.23631 9 −1 0 3 0.101 1.21225 10 0 0 1 0.110 1.32011 11 0 0 2 0.089 2.1361 12 −1 −1 2 0.082 1.994
34 13 0 1 3 0.099 1.18812 14 0 0 2 0.098 2.05822 15 0 0 1 0.110 1.32013 16 0 0 2 0.093 2.09321 17 0 1 1 0.100 1.20014 18 −1 −1 1 0.105 1.2603 19 −1 1 2 0.064 2.240
26 20 0 0 1 0.110 1.32036 21 0 0 3 0.111 1.33237 22 0 0 3 0.108 1.35023 23 0 0 1 0.113 1.35615 24 1 −1 1 0.112 1.3448 25 0 1 2 0.095 2.2332 26 1 −1 2 0.105 2.153
32 27 1 0 3 0.108 1.29628 28 1 −1 3 0.110 1.32020 29 0 −1 1 0.112 1.34424 30 0 0 1 0.110 1.3204 31 1 1 2 0.097 2.0379 32 0 0 2 0.098 2.058
38 33 0 0 3 0.111 1.3326 34 1 0 2 0.100 2.150
35 35 0 0 3 0.110 1.32033 36 0 −1 3 0.108 1.29617 37 1 1 1 0.098 1.17629 38 −1 1 3 0.108 1.2965 39 −1 0 2 0.075 2.250Polymers 2020, 12, x 8 of 17
(a) (b)
Figure 3. Creep testing machine. (a) Schematic diagram. (b) Actual setup.
(a) (b)
Figure 4. (a) Creep test specimen as per ASTM D2990 standards. (b) Printed creep specimens.
3. Results and Discussion
3.1. Model fitting and Analysis of Variance
Analysis of variance (ANOVA) is performed to analyze the effect of input process parameters,
i.e., layer height, infill percentage, and infill pattern on the responses such as creep rate (1/s) and
rupture time (h) of PLA. To ensure the adequate prediction of responses compared to the
experiments, the evaluation of a fitted model is essential. The prediction models of creep rate and
rupture time based on CCD design for each infill pattern are expressed in Equations (1)–(6). Equations
(1)–(3) represent the creep rate in terms of coded units, and Equations (4)–(6) represent the rupture
time in terms of coded factors.
Diamond pattern = 0.109 − 0.001 L − 0.004 I − 0.004 L2 − 0.001 I2 − 0.001 L × I, (1)
Hexagonal pattern = 0.093 + 0.014 L − 0.004 I − 0.004 L2 − 0.001 I2 − 0.001 L × I, (2)
Linear pattern = 0.1094 + 0.001 L − 0.003 I − 0.004 L2 − 0.001 I2 − 0.001 L × I, (3)
Diamond pattern = 1.300 − 0.002 L − 0.052 I − 0.007 L2 − 0.025 I2 − 0.054 L × I, (4)
Hexagonal pattern = 2.14 − 0.025 L + 0.056 I − 0.008 L2 − 0.026 I2 − 0.054 L × I, (5)
Linear pattern = 1.305 + 0.005 L − 0.037 I − 0.008 L2 − 0.026 I2 − 0.054 L × I. (6)
ANOVA results are shown in Table 4. The second‐order regression model for creep rate and
rupture time is found at a confidence interval of 95%. Through ANOVA analysis, all the predicted
coefficients are estimated with significant probability value, (P‐value), i.e., P ≤ 0.05 and R2 (coefficient
of determination) of 91% for creep rate, and 98% of rupture time, depicting higher validity to the
predicted values for the two responses. The adjusted R2 coefficient value obtained for creep rate and
rupture time is 87% and 97%, respectively. The coefficient values obtained confirm that the final
prediction is in good agreement with the experimental results. Fisher’s statistical test (F‐value) found
Figure 3. Creep testing machine. (a) Schematic diagram. (b) Actual setup.
Polymers 2020, 12, 2962 8 of 16
Polymers 2020, 12, x 8 of 17
(a) (b)
Figure 3. Creep testing machine. (a) Schematic diagram. (b) Actual setup.
(a) (b)
Figure 4. (a) Creep test specimen as per ASTM D2990 standards. (b) Printed creep specimens.
3. Results and Discussion
3.1. Model fitting and Analysis of Variance
Analysis of variance (ANOVA) is performed to analyze the effect of input process parameters,
i.e., layer height, infill percentage, and infill pattern on the responses such as creep rate (1/s) and
rupture time (h) of PLA. To ensure the adequate prediction of responses compared to the
experiments, the evaluation of a fitted model is essential. The prediction models of creep rate and
rupture time based on CCD design for each infill pattern are expressed in Equations (1)–(6). Equations
(1)–(3) represent the creep rate in terms of coded units, and Equations (4)–(6) represent the rupture
time in terms of coded factors.
Diamond pattern = 0.109 − 0.001 L − 0.004 I − 0.004 L2 − 0.001 I2 − 0.001 L × I, (1)
Hexagonal pattern = 0.093 + 0.014 L − 0.004 I − 0.004 L2 − 0.001 I2 − 0.001 L × I, (2)
Linear pattern = 0.1094 + 0.001 L − 0.003 I − 0.004 L2 − 0.001 I2 − 0.001 L × I, (3)
Diamond pattern = 1.300 − 0.002 L − 0.052 I − 0.007 L2 − 0.025 I2 − 0.054 L × I, (4)
Hexagonal pattern = 2.14 − 0.025 L + 0.056 I − 0.008 L2 − 0.026 I2 − 0.054 L × I, (5)
Linear pattern = 1.305 + 0.005 L − 0.037 I − 0.008 L2 − 0.026 I2 − 0.054 L × I. (6)
ANOVA results are shown in Table 4. The second‐order regression model for creep rate and
rupture time is found at a confidence interval of 95%. Through ANOVA analysis, all the predicted
coefficients are estimated with significant probability value, (P‐value), i.e., P ≤ 0.05 and R2 (coefficient
of determination) of 91% for creep rate, and 98% of rupture time, depicting higher validity to the
predicted values for the two responses. The adjusted R2 coefficient value obtained for creep rate and
rupture time is 87% and 97%, respectively. The coefficient values obtained confirm that the final
prediction is in good agreement with the experimental results. Fisher’s statistical test (F‐value) found
Figure 4. (a) Creep test specimen as per ASTM D2990 standards. (b) Printed creep specimens.
3. Results and Discussion
3.1. Model Fitting and Analysis of Variance
Analysis of variance (ANOVA) is performed to analyze the effect of input process parameters, i.e.,layer height, infill percentage, and infill pattern on the responses such as creep rate (1/s) and rupturetime (h) of PLA. To ensure the adequate prediction of responses compared to the experiments, theevaluation of a fitted model is essential. The prediction models of creep rate and rupture time basedon CCD design for each infill pattern are expressed in Equations (1)–(6). Equations (1)–(3) representthe creep rate in terms of coded units, and Equations (4)–(6) represent the rupture time in terms ofcoded factors.
Diamond pattern = 0.109 − 0.001 L − 0.004 I − 0.004 L2− 0.001 I2
− 0.001 L × I, (1)
Hexagonal pattern = 0.093 + 0.014 L − 0.004 I − 0.004 L2− 0.001 I2
− 0.001 L × I, (2)
Linear pattern = 0.1094 + 0.001 L − 0.003 I − 0.004 L2− 0.001 I2
− 0.001 L × I, (3)
Diamond pattern = 1.300 − 0.002 L − 0.052 I − 0.007 L2− 0.025 I2
− 0.054 L × I, (4)
Hexagonal pattern = 2.14 − 0.025 L + 0.056 I − 0.008 L2− 0.026 I2
− 0.054 L × I, (5)
Linear pattern = 1.305 + 0.005 L − 0.037 I − 0.008 L2− 0.026 I2
− 0.054 L × I. (6)
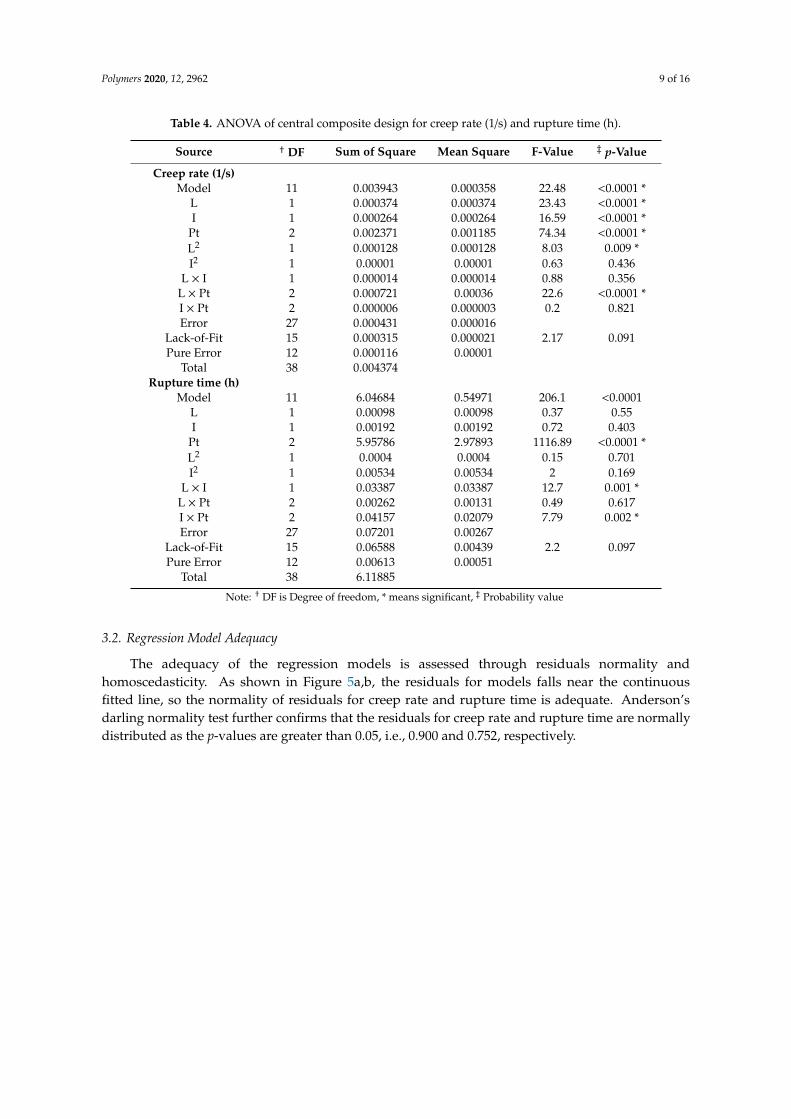
ANOVA results are shown in Table 4. The second-order regression model for creep rate andrupture time is found at a confidence interval of 95%. Through ANOVA analysis, all the predictedcoefficients are estimated with significant probability value, (p-value), i.e., p ≤ 0.05 and R2 (coefficientof determination) of 91% for creep rate, and 98% of rupture time, depicting higher validity to thepredicted values for the two responses. The adjusted R2 coefficient value obtained for creep rateand rupture time is 87% and 97%, respectively. The coefficient values obtained confirm that the finalprediction is in good agreement with the experimental results. Fisher’s statistical test (F-value) foundfor creep rate and rupture time were 22.48 and 206.1, which shows that the prediction is significantlyuseful. Likewise, p-values for lack of fit for creep rate and rupture time are higher than 0.05. Fromthe observed statistical inferences, it was evaluated that the models accurately fit the experimentaldata. For the creep rate, the most significant terms are identified in which p-values are less than 0.05.These factors include the layer height, infill percentage, infill patterns, square of layer height and infillpercentage, and interaction of layer height and infill pattern. For rupture time, the significant terms arethe infill pattern type, the interaction of layer height and infill percentage, and infill pattern.
Polymers 2020, 12, 2962 9 of 16
Table 4. ANOVA of central composite design for creep rate (1/s) and rupture time (h).
Source † DF Sum of Square Mean Square F-Value ‡ p-Value
Creep rate (1/s)Model 11 0.003943 0.000358 22.48 <0.0001 *
L 1 0.000374 0.000374 23.43 <0.0001 *I 1 0.000264 0.000264 16.59 <0.0001 *
Pt 2 0.002371 0.001185 74.34 <0.0001 *L2 1 0.000128 0.000128 8.03 0.009 *I2 1 0.00001 0.00001 0.63 0.436
L × I 1 0.000014 0.000014 0.88 0.356L × Pt 2 0.000721 0.00036 22.6 <0.0001 *I × Pt 2 0.000006 0.000003 0.2 0.821Error 27 0.000431 0.000016
Lack-of-Fit 15 0.000315 0.000021 2.17 0.091Pure Error 12 0.000116 0.00001
Total 38 0.004374Rupture time (h)
Model 11 6.04684 0.54971 206.1 <0.0001L 1 0.00098 0.00098 0.37 0.55I 1 0.00192 0.00192 0.72 0.403
Pt 2 5.95786 2.97893 1116.89 <0.0001 *L2 1 0.0004 0.0004 0.15 0.701I2 1 0.00534 0.00534 2 0.169
L × I 1 0.03387 0.03387 12.7 0.001 *L × Pt 2 0.00262 0.00131 0.49 0.617I × Pt 2 0.04157 0.02079 7.79 0.002 *Error 27 0.07201 0.00267
Lack-of-Fit 15 0.06588 0.00439 2.2 0.097Pure Error 12 0.00613 0.00051
Total 38 6.11885
Note: † DF is Degree of freedom, * means significant, ‡ Probability value
3.2. Regression Model Adequacy
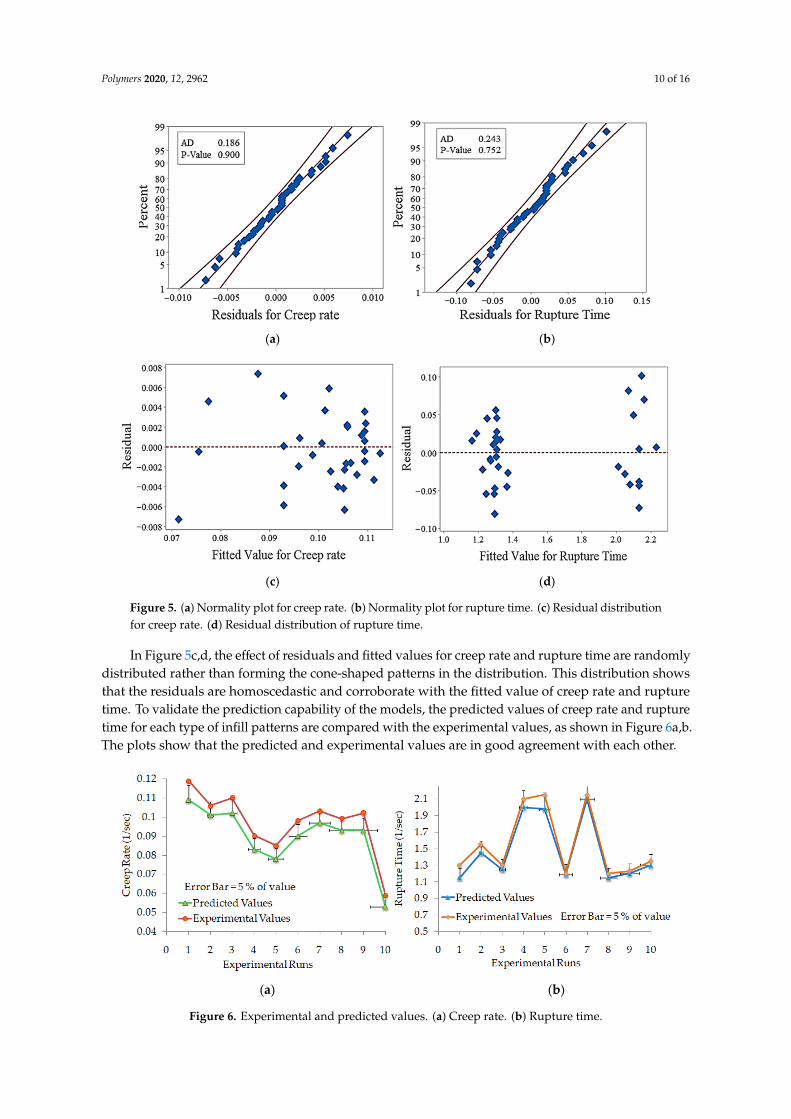
The adequacy of the regression models is assessed through residuals normality andhomoscedasticity. As shown in Figure 5a,b, the residuals for models falls near the continuousfitted line, so the normality of residuals for creep rate and rupture time is adequate. Anderson’sdarling normality test further confirms that the residuals for creep rate and rupture time are normallydistributed as the p-values are greater than 0.05, i.e., 0.900 and 0.752, respectively.
Polymers 2020, 12, 2962 10 of 16
Polymers 2020, 12, x 10 of 17
(a) (b)
(c) (d)
Figure 5. (a) Normality plot for creep rate. (b) Normality plot for rupture time. (c) Residual
distribution for creep rate. (d) Residual distribution of rupture time.
In Figure 5c,d, the effect of residuals and fitted values for creep rate and rupture time are
randomly distributed rather than forming the cone‐shaped patterns in the distribution. This
distribution shows that the residuals are homoscedastic and corroborate with the fitted value of creep
rate and rupture time. To validate the prediction capability of the models, the predicted values of
creep rate and rupture time for each type of infill patterns are compared with the experimental values,
as shown in Figure 6a,b. The plots show that the predicted and experimental values are in good
agreement with each other.
Figure 5. (a) Normality plot for creep rate. (b) Normality plot for rupture time. (c) Residual distributionfor creep rate. (d) Residual distribution of rupture time.
In Figure 5c,d, the effect of residuals and fitted values for creep rate and rupture time are randomlydistributed rather than forming the cone-shaped patterns in the distribution. This distribution showsthat the residuals are homoscedastic and corroborate with the fitted value of creep rate and rupturetime. To validate the prediction capability of the models, the predicted values of creep rate and rupturetime for each type of infill patterns are compared with the experimental values, as shown in Figure 6a,b.The plots show that the predicted and experimental values are in good agreement with each other.Polymers 2020, 12, x 11 of 17
(a) (b)
Figure 6. Experimental and predicted values. (a) Creep rate. (b) Rupture time.
3.3. Effect of Process Parameters on Creep Rate and Rupture Time as 3D Surface Plots
The effect of process parameters on creep rate and rupture time is observed in Figure 7 using 3D
surface plots for linear, hexagonal, and diamond patterns. In Figure 7a, the creep rate for linear
patterns increases as layer height increase from low level to the medium level, while it decreases as
the layer height increase from a medium level to a high level.
Figure 6. Experimental and predicted values. (a) Creep rate. (b) Rupture time.
Polymers 2020, 12, 2962 11 of 16
3.3. Effect of Process Parameters on Creep Rate and Rupture Time as 3D Surface Plots
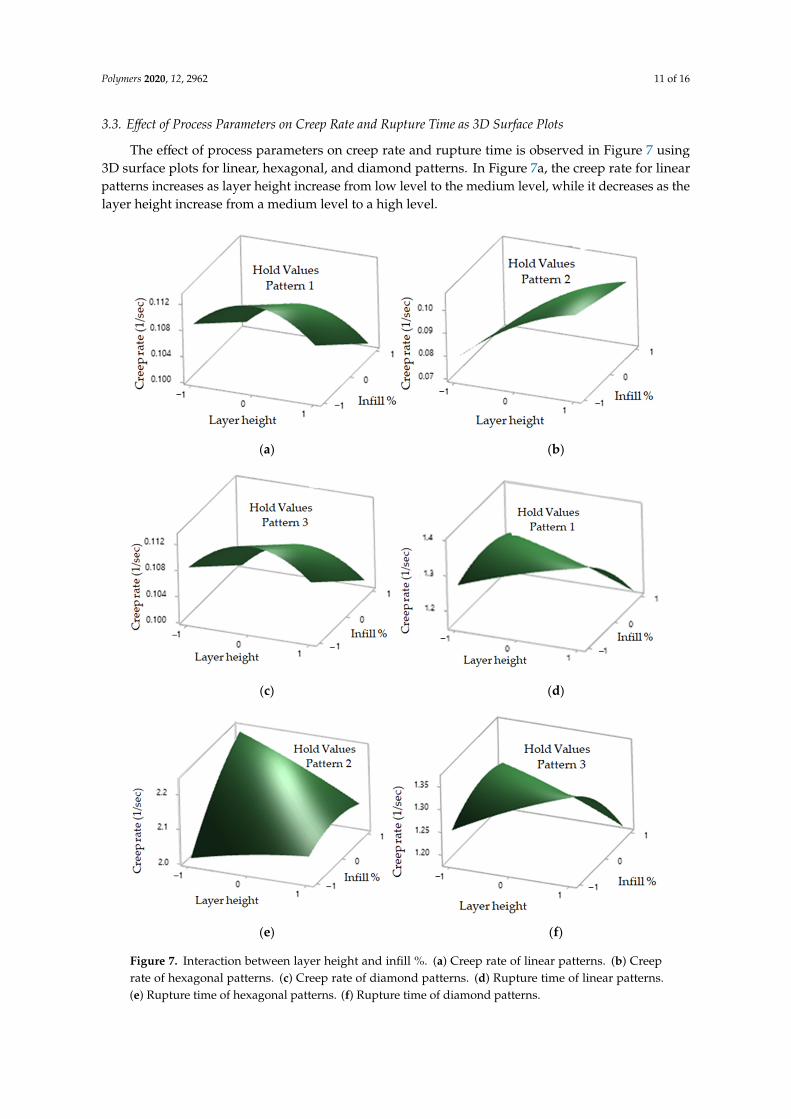
The effect of process parameters on creep rate and rupture time is observed in Figure 7 using3D surface plots for linear, hexagonal, and diamond patterns. In Figure 7a, the creep rate for linearpatterns increases as layer height increase from low level to the medium level, while it decreases as thelayer height increase from a medium level to a high level.Polymers 2020, 12, x 12 of 17
(a) (b)
(c) (d)
(e) (f)
Figure 7. Interaction between layer height and infill %. (a) Creep rate of linear patterns. (b) Creep rate
of hexagonal patterns. (c) Creep rate of diamond patterns. (d) Rupture time of linear patterns. (e)
Rupture time of hexagonal patterns. (f) Rupture time of diamond patterns.
The creep rate decreases with increasing the infill % from low level to high level. In Figure 7b,
the creep rate for hexagonal patterns increases with an increase in layer height; however, for infill %,
the creep rate decreases slightly from a low to a high level. In Figure 7c, similar results for the creep
rate are observed in the diamond pattern. In Figure 7d, the rupture time for linear pattern increases
slightly with an increase in layer height, while it decreases with an increase in the infill percentage
from a low level to a high level. In Figure 7e, the rupture time for hexagonal pattern increases both
in layer height and infill percentage. In Figure 7f, the rupture time for the diamond pattern shows
similar plots for the linear pattern.
Figure 7. Interaction between layer height and infill %. (a) Creep rate of linear patterns. (b) Creeprate of hexagonal patterns. (c) Creep rate of diamond patterns. (d) Rupture time of linear patterns.(e) Rupture time of hexagonal patterns. (f) Rupture time of diamond patterns.
Polymers 2020, 12, 2962 12 of 16
The creep rate decreases with increasing the infill % from low level to high level. In Figure 7b, thecreep rate for hexagonal patterns increases with an increase in layer height; however, for infill %, thecreep rate decreases slightly from a low to a high level. In Figure 7c, similar results for the creep rateare observed in the diamond pattern. In Figure 7d, the rupture time for linear pattern increases slightlywith an increase in layer height, while it decreases with an increase in the infill percentage from a lowlevel to a high level. In Figure 7e, the rupture time for hexagonal pattern increases both in layer heightand infill percentage. In Figure 7f, the rupture time for the diamond pattern shows similar plots for thelinear pattern.
These results are in line with the published literature. Lower layer height provides good mechanicalstrength. As the layer height decreases, the bonding between the layers is strengthened and resultsin an improved mechanical performance [36,44]. A similar effect is observed for the infill percentage(the quantity of build material), where the mechanical strength improves with an increase in materialdensity [45,46]. According to Dave et al. [35], the infill percentage of 100% results in strong bondformation between each layer, thus making the structure dense and stronger. However, with a decreasein infill %, the gap between printed layers becomes broader and reduces bonding strength. Strongbonding on six sides of the hexagonal pattern provides a strong contact with the neighbor moleculesand, therefore, improves its tensile strength [47].
3.4. Multi-Response Optimization
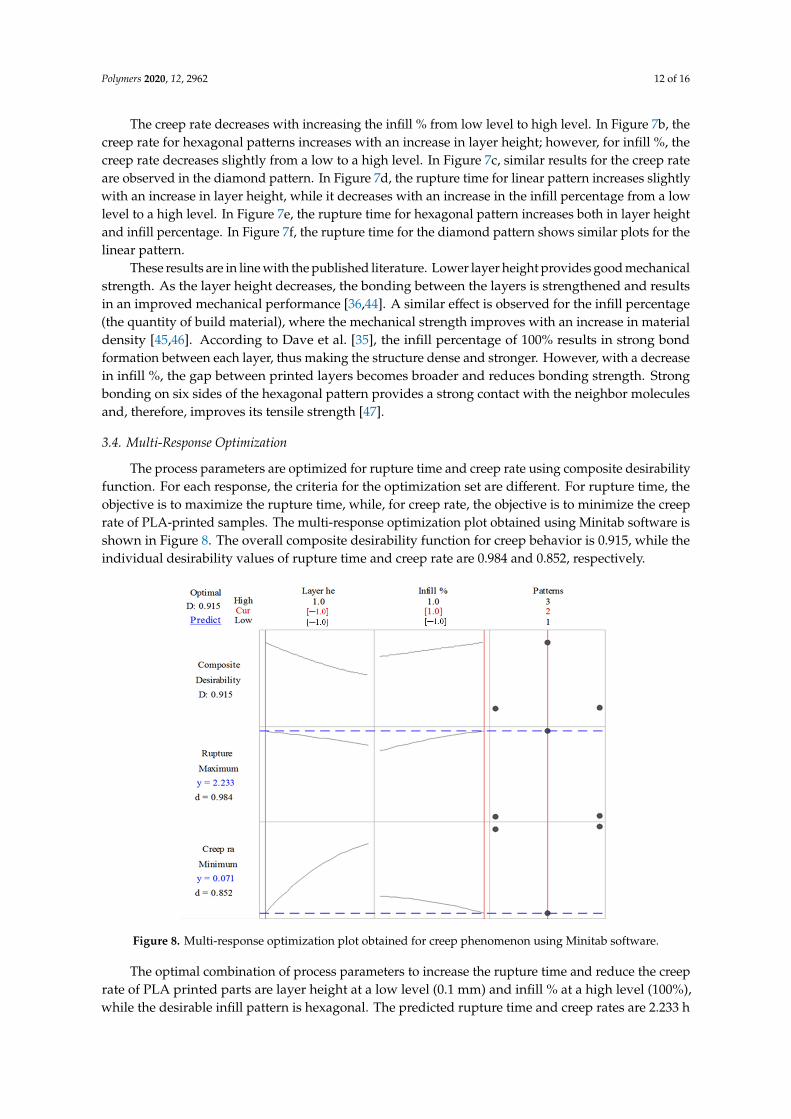
The process parameters are optimized for rupture time and creep rate using composite desirabilityfunction. For each response, the criteria for the optimization set are different. For rupture time, theobjective is to maximize the rupture time, while, for creep rate, the objective is to minimize the creeprate of PLA-printed samples. The multi-response optimization plot obtained using Minitab software isshown in Figure 8. The overall composite desirability function for creep behavior is 0.915, while theindividual desirability values of rupture time and creep rate are 0.984 and 0.852, respectively.
Polymers 2020, 12, x 13 of 17
These results are in line with the published literature. Lower layer height provides good
mechanical strength. As the layer height decreases, the bonding between the layers is strengthened
and results in an improved mechanical performance [36,44]. A similar effect is observed for the infill
percentage (the quantity of build material), where the mechanical strength improves with an increase
in material density [45,46]. According to Dave et al. [35], the infill percentage of 100% results in strong
bond formation between each layer, thus making the structure dense and stronger. However, with a
decrease in infill %, the gap between printed layers becomes broader and reduces bonding strength.
Strong bonding on six sides of the hexagonal pattern provides a strong contact with the neighbor
molecules and, therefore, improves its tensile strength [47].
3.4. Multi‐Response Optimization
The process parameters are optimized for rupture time and creep rate using composite
desirability function. For each response, the criteria for the optimization set are different. For rupture
time, the objective is to maximize the rupture time, while, for creep rate, the objective is to minimize
the creep rate of PLA‐printed samples. The multi‐response optimization plot obtained using Minitab
software is shown in Figure 8. The overall composite desirability function for creep behavior is 0.915,
while the individual desirability values of rupture time and creep rate are 0.984 and 0.852,
respectively.
Figure 8. Multi‐response optimization plot obtained for creep phenomenon using Minitab software.
The optimal combination of process parameters to increase the rupture time and reduce the
creep rate of PLA printed parts are layer height at a low level (0.1 mm) and infill % at a high level
(100%), while the desirable infill pattern is hexagonal. The predicted rupture time and creep rates are
2.233 h and 0.0712/s, respectively. Additionally, the plot shows that, by selecting the pattern type
either 1 or 2, i.e., linear or diamond, the rupture time decreases, while the creep rate increases, which
are both undesirable.
To validate the performance of optimal parameters, confirmation tests were replicated five
times. On average, the experimental values of rupture time and creep rate were 2.103 h and 0.0605
(1/s), respectively. The simulated values are close to the experimental results. Based on the
experimental and statistical investigations, it can be concluded that the presented research provides
a good guideline for the selection of categorical central composite design to analyze the creep
behavior of PLA printed samples. Finally, the creep strain versus time is analyzed as shown in Figure
Figure 8. Multi-response optimization plot obtained for creep phenomenon using Minitab software.
The optimal combination of process parameters to increase the rupture time and reduce the creeprate of PLA printed parts are layer height at a low level (0.1 mm) and infill % at a high level (100%),while the desirable infill pattern is hexagonal. The predicted rupture time and creep rates are 2.233 h
Polymers 2020, 12, 2962 13 of 16
and 0.0712/s, respectively. Additionally, the plot shows that, by selecting the pattern type either 1or 2, i.e., linear or diamond, the rupture time decreases, while the creep rate increases, which areboth undesirable.
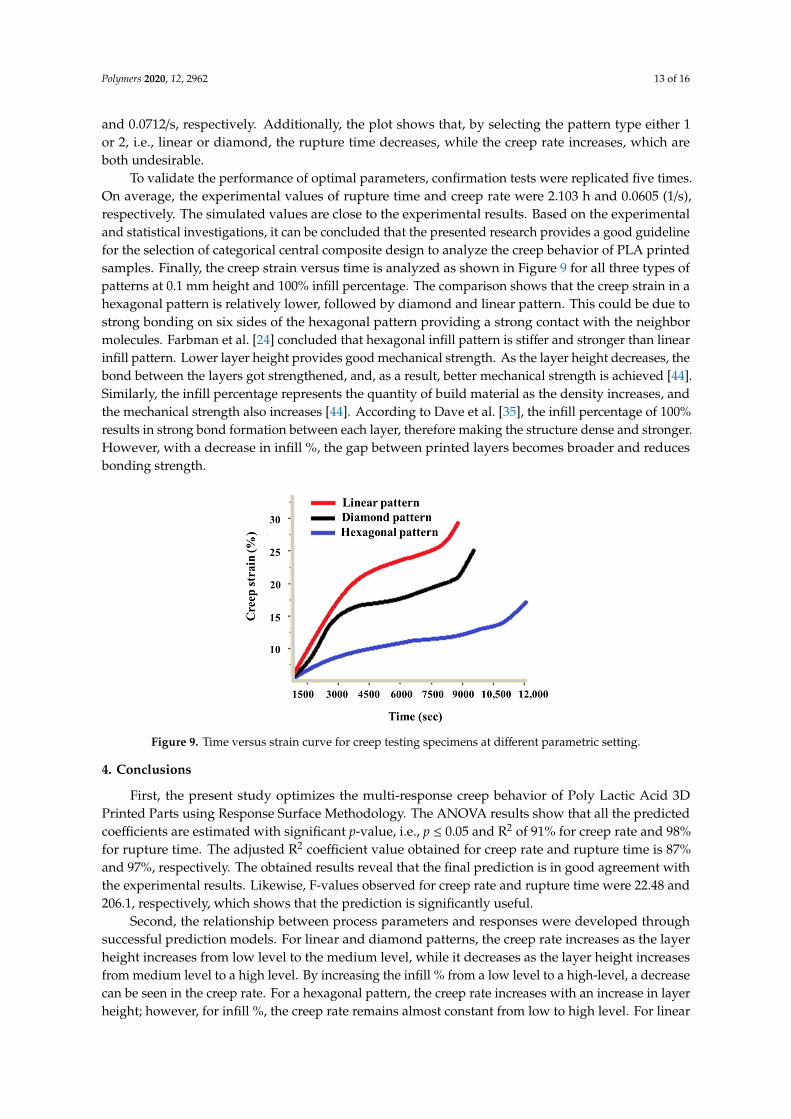
To validate the performance of optimal parameters, confirmation tests were replicated five times.On average, the experimental values of rupture time and creep rate were 2.103 h and 0.0605 (1/s),respectively. The simulated values are close to the experimental results. Based on the experimentaland statistical investigations, it can be concluded that the presented research provides a good guidelinefor the selection of categorical central composite design to analyze the creep behavior of PLA printedsamples. Finally, the creep strain versus time is analyzed as shown in Figure 9 for all three types ofpatterns at 0.1 mm height and 100% infill percentage. The comparison shows that the creep strain in ahexagonal pattern is relatively lower, followed by diamond and linear pattern. This could be due tostrong bonding on six sides of the hexagonal pattern providing a strong contact with the neighbormolecules. Farbman et al. [24] concluded that hexagonal infill pattern is stiffer and stronger than linearinfill pattern. Lower layer height provides good mechanical strength. As the layer height decreases, thebond between the layers got strengthened, and, as a result, better mechanical strength is achieved [44].Similarly, the infill percentage represents the quantity of build material as the density increases, andthe mechanical strength also increases [44]. According to Dave et al. [35], the infill percentage of 100%results in strong bond formation between each layer, therefore making the structure dense and stronger.However, with a decrease in infill %, the gap between printed layers becomes broader and reducesbonding strength.
Polymers 2020, 12, x 14 of 17
9 for all three types of patterns at 0.1 mm height and 100% infill percentage. The comparison shows
that the creep strain in a hexagonal pattern is relatively lower, followed by diamond and linear
pattern. This could be due to strong bonding on six sides of the hexagonal pattern providing a strong
contact with the neighbor molecules. Farbman et al. [24] concluded that hexagonal infill pattern is
stiffer and stronger than linear infill pattern. Lower layer height provides good mechanical strength.
As the layer height decreases, the bond between the layers got strengthened, and, as a result, better
mechanical strength is achieved [44]. Similarly, the infill percentage represents the quantity of build
material as the density increases, and the mechanical strength also increases [44]. According to Dave
et al. [35], the infill percentage of 100% results in strong bond formation between each layer, therefore
making the structure dense and stronger. However, with a decrease in infill %, the gap between
printed layers becomes broader and reduces bonding strength.
Figure 9. Time versus strain curve for creep testing specimens at different parametric setting.
4. Conclusions
First, the present study optimizes the multi‐response creep behavior of Poly Lactic Acid 3D
Printed Parts using Response Surface Methodology. The ANOVA results show that all the predicted
coefficients are estimated with significant P‐value, i.e., P ≤ 0.05 and R2 of 91% for creep rate and 98%
for rupture time. The adjusted R2 coefficient value obtained for creep rate and rupture time is 87%
and 97%, respectively. The obtained results reveal that the final prediction is in good agreement with
the experimental results. Likewise, F‐values observed for creep rate and rupture time were 22.48 and
206.1, respectively, which shows that the prediction is significantly useful.
Second, the relationship between process parameters and responses were developed through
successful prediction models. For linear and diamond patterns, the creep rate increases as the layer
height increases from low level to the medium level, while it decreases as the layer height increases
from medium level to a high level. By increasing the infill % from a low level to a high‐level, a
decrease can be seen in the creep rate. For a hexagonal pattern, the creep rate increases with an
increase in layer height; however, for infill %, the creep rate remains almost constant from low to
high level. For linear and diamond patterns, rupture time increases slightly with an increase in the
layer height, while it decreases with an increase in infill % from a low level to a high level. For a
hexagonal pattern, the rupture time decreases with an increase in infill% and layer height from a low
level to a high level.
Third, the optimal combination of process parameters to increase the rupture time and reduce
the creep rate of PLA printed parts are layer height at a low level (0.1 mm), infill % at a high level
(100%), while the desirable infill pattern is hexagonal.
Fourth, the predicted rupture time and creep rates are 2.233 h and 0.071/s, respectively. To
validate the performance of optimal parameters, confirmation tests are replicated five times. On
Figure 9. Time versus strain curve for creep testing specimens at different parametric setting.
4. Conclusions
First, the present study optimizes the multi-response creep behavior of Poly Lactic Acid 3DPrinted Parts using Response Surface Methodology. The ANOVA results show that all the predictedcoefficients are estimated with significant p-value, i.e., p ≤ 0.05 and R2 of 91% for creep rate and 98%for rupture time. The adjusted R2 coefficient value obtained for creep rate and rupture time is 87%and 97%, respectively. The obtained results reveal that the final prediction is in good agreement withthe experimental results. Likewise, F-values observed for creep rate and rupture time were 22.48 and206.1, respectively, which shows that the prediction is significantly useful.
Second, the relationship between process parameters and responses were developed throughsuccessful prediction models. For linear and diamond patterns, the creep rate increases as the layerheight increases from low level to the medium level, while it decreases as the layer height increasesfrom medium level to a high level. By increasing the infill % from a low level to a high-level, a decreasecan be seen in the creep rate. For a hexagonal pattern, the creep rate increases with an increase in layerheight; however, for infill %, the creep rate remains almost constant from low to high level. For linear
Polymers 2020, 12, 2962 14 of 16
and diamond patterns, rupture time increases slightly with an increase in the layer height, while itdecreases with an increase in infill % from a low level to a high level. For a hexagonal pattern, therupture time decreases with an increase in infill% and layer height from a low level to a high level.
Third, the optimal combination of process parameters to increase the rupture time and reduce thecreep rate of PLA printed parts are layer height at a low level (0.1 mm), infill % at a high level (100%),while the desirable infill pattern is hexagonal.
Fourth, the predicted rupture time and creep rates are 2.233 h and 0.071/s, respectively. To validatethe performance of optimal parameters, confirmation tests are replicated five times. On average, theexperimental values of rupture time and creep rate were observed as 2.103 h and 0.060 (1/s), respectively.The obtained results are close to the predicted values through statistical means. The experimental andstatistical investigations provide good guidelines for the selection of categorical central compositedesign to analyze the creep behavior of PLA-printed parts (Figure 9).
Finally, the presented study also provides a comprehensive insight into the influence of FDMprocess parameters on creep rate and rupture time for the PLA 3D-printed products. This work isparticularly interesting for small and medium enterprises in developing countries that are underpinnedto adopt additive manufacturing by means of small-scale desktop 3D printers.
Author Contributions: M.W. conceived and designed the creep testing scheme. B.S. supported in drafting thecomplete manuscript and statistical analysis. T.H. edited and proofread the first draft, W.S. supervised thecomplete research project, M.A. worked on the experimental findings and suggested necessary improvements.R.K. contributed in the bibliography and compiling the results. U.G. and M.U.R.S. proofread the manuscript andmade significant changes to improve the quality of the paper. All authors have read and agreed to the publishedversion of the manuscript.
Funding: This study received funding from King Saud University, Saudi Arabia through researchers supportingproject number (RSP-2020/145). And the APCs were funded by King Saud University, Saudi Arabia throughresearchers supporting project number (RSP-2020/145).
Acknowledgments: The authors extend their appreciation to King Saud University, Saudi Arabia for funding thiswork through researchers supporting project number (RSP-2020/145).
Conflicts of Interest: The authors declare no conflict of interest.
References
1. Ngo, T.D.; Kashani, A.; Imbalzano, G.; Nguyen, K.T.; Hui, D. Additive manufacturing (3D printing): A reviewof materials, methods, applications and challenges. Compos. Part. B Eng. 2018, 143, 172–196. [CrossRef]
2. Sheoran, A.J.; Kumar, H. Fused Deposition modeling process parameters optimization and effect onmechanical properties and part quality: Review and reflection on present research. Mater. Today Proc. 2020,21, 1659–1672. [CrossRef]
3. Huang, B.; Singamneni, S. Adaptive slicing and speed- and time-dependent consolidation mechanisms infused deposition modeling. Proc. Inst. Mech. Eng. Part. B J. Eng. Manuf. 2013, 228, 111–126. [CrossRef]
4. Li, Y.; Lou, Y. Tensile and Bending Strength Improvements in PEEK Parts Using Fused Deposition Modelling3D Printing Considering Multi-Factor Coupling. Polymer 2020, 12, 2497. [CrossRef] [PubMed]
5. Parandoush, P.; Lin, D. A review on additive manufacturing of polymer-fiber composites. Compos. Struct.2017, 182, 36–53. [CrossRef]
6. Wasanasuk, K.; Tashiro, K. Crystal structure and disorder in Poly(l-lactic acid) δ form (α′ form) and thephase transition mechanism to the ordered α form. Polymer 2011, 52, 6097–6109. [CrossRef]
7. Di Lorenzo, M.L. Crystallization behavior of poly(l-lactic acid). Eur. Polym. J. 2005, 41, 569–575. [CrossRef]8. Marubayashi, H.; Asai, S.; Sumita, M. Complex Crystal Formation of Poly(l-lactide) with Solvent Molecules.
Macromolecules 2012, 45, 1384–1397. [CrossRef]9. Bao, R.-Y.; Yangb, W.; Jiang, W.-R.; Liu, Z.-Y.; Xie, B.-H.; Yang, M.-B. Polymorphism of Racemic
Poly(l-lactide)/Poly(d-lactide) Blend: Effect of Melt and Cold Crystallization. J. Phys. Chem. B 2013,117, 3667–3674. [CrossRef]
10. Cartier, L.; Okihara, T.; Ikada, Y.; Tsuji, H.; Puiggali, J.; Lotz, B. Epitaxial crystallization and crystallinepolymorphism of polylactides. Polymer 2000, 41, 8909–8919. [CrossRef]
Polymers 2020, 12, 2962 15 of 16
11. Kalish, J.P.; Aou, K.; Yang, X.; Hsu, S.L. Spectroscopic and thermal analyses of α′ and α crystalline forms ofpoly(l-lactic acid). Polymer 2011, 52, 814–821. [CrossRef]
12. Ahn, S.; Montero, M.; Odell, D.; Roundy, S.; Wright, P.K. Anisotropic material properties of fused depositionmodeling ABS. Rapid Prototyp. J. 2002, 8, 248–257. [CrossRef]
13. Cicala, G.; Giordano, D.; Tosto, C.; Filippone, G.; Recca, A.; Blanco, I. Polylactide (PLA) Filaments a BiobasedSolution for Additive Manufacturing: Correlating Rheology and Thermomechanical Properties with PrintingQuality. Materials 2018, 11, 1191. [CrossRef] [PubMed]
14. Olaiya, N.G.; Surya, I.; Oke, P.K.; Rizal, S.; Sadiku, E.R.; Ray, S.S.; Farayibi, P.K.; Hossain, S.; Khalil, H.P.S.A.Properties and Characterization of a PLA–Chitin–Starch Biodegradable Polymer Composite. Polymer 2019,11, 1656. [CrossRef] [PubMed]
15. Subramaniam, S.R.; Samykano, M.; Selvamani, S.K.; Ngui, W.K.; Kadirgama, K.; Sudhakar, K.; Idris, M.S.Preliminary investigations of polylactic acid (PLA) properties. In Proceedings of the AIP Conference Proceedings;AIP Publishing: Melville, NY, USA, 2019; Volume 2059, p. 020038.
16. Getme, A.S.; Patel, B. A Review: Bio-fiber’s as reinforcement in composites of polylactic acid (PLA). InProceedings of the Materials Today: Proceedings; Elsevier BV: Amsterdam, The Netherlands, 2020; Volume 26,pp. 2116–2122.
17. Cobos, C.M.; Garzón, L.; López-Martínez, J.; Fenollar, O.; Ferrandiz, S. Study of thermal and rheologicalproperties of PLA loaded with carbon and halloysite nanotubes for additive manufacturing. Rapid Prototyp.J. 2019, 25, 738–743. [CrossRef]
18. Domínguez-Robles, J.; Martin, N.K.; Fong, M.L.; Stewart, S.A.; Irwin, N.J.; Rial-Hermida, M.I.; Donnelly, R.F.;Larrañeta, E. Antioxidant PLA Composites Containing Lignin for 3D Printing Applications: A PotentialMaterial for Healthcare Applications. Pharmaceutics 2019, 11, 165. [CrossRef]
19. DeStefano, V.; Khan, S.; Tabada, A. Applications of PLA in Modern Medicine. Eng. Regen. 2020, 1, 76–87.[CrossRef]
20. Luchian-Lupu, A.-M.; Zaharescu, T.; Lungulescu, E.-M.; Râpă, M.; Iovu, H. Availability of PLA/SIS blendsfor packaging and medical applications. Radiat. Phys. Chem. 2020, 172, 108696. [CrossRef]
21. Camargo, J.C.; Machado, Á.R.; Almeida, E.C.; Silva, E.F.M.S. Mechanical properties of PLA-graphene filamentfor FDM 3D printing. Int. J. Adv. Manuf. Technol. 2019, 103, 2423–2443. [CrossRef]
22. Casavola, C.; Cazzato, A.; Moramarco, V.; Pappalettere, C. Orthotropic mechanical properties of fuseddeposition modelling parts described by classical laminate theory. Mater. Des. 2016, 90, 453–458. [CrossRef]
23. Baich, L.; Manogharan, G.; Marie, H. Study of infill print design on production cost-time of 3D printed ABSparts. Int. J. Rapid Manuf. 2015, 5, 308. [CrossRef]
24. Farbman, D.; McCoy, C. Materials Testing of 3D Printed ABS and PLA Samples to Guide Mechanical Design.In Proceedings of the 11th International Manufacturing Science and Engineering Conference, Blacksburg,VA, USA, 27 June 2016. [CrossRef]
25. Caminero, M.; Rodríguez, G.; Muñoz, V. Effect of stacking sequence on Charpy impact and flexural damagebehavior of composite laminates. Compos. Struct. 2016, 136, 345–357. [CrossRef]
26. Kamoona, S.N.; Masood, S.H.; Mohamed, O.A. Experimental investigation on flexural properties of FDMprocessed Nylon 12 parts using RSM. In Proceedings of the IOP Conference Series: Materials Science andEngineering; IOP Publishing: Bristol, UK, 2018; Volume 377, p. 12137.
27. Tymrak, B.M.; Kreiger, M.; Pearce, J.M. Mechanical properties of components fabricated with open-source3-D printers under realistic environmental conditions. Mater. Des. 2014, 58, 242–246. [CrossRef]
28. Lanzotti, A.; Grasso, M.; Staiano, G.; Martorelli, M. The impact of process parameters on mechanicalproperties of parts fabricated in PLA with an open-source 3-D printer. Rapid Prototyp. J. 2015, 21, 604–617.[CrossRef]
29. Vaezi, M.; Chua, C.K. Effects of layer thickness and binder saturation level parameters on 3D printing process.Int. J. Adv. Manuf. Technol. 2010, 53, 275–284. [CrossRef]
30. Lovo, J.F.P.; Fortulan, C.A.; Da Silva, M.M.M. Optimal deposition orientation in fused deposition modelingfor maximizing the strength of three-dimensional printed truss-like structures. Proc. Inst. Mech. Eng. Part. BJ. Eng. Manuf. 2018, 233, 1206–1215. [CrossRef]
31. Mohamed, O.A.; Masood, S.; Bhowmik, J.L. Investigation on the Flexural Creep Stiffness Behavior of PC–ABSMaterial Processed by Fused Deposition Modeling Using Response Surface Definitive Screening Design.JOM 2016, 69, 498–505. [CrossRef]
Polymers 2020, 12, 2962 16 of 16
32. An, T.; Selvaraj, R.; Hong, S.; Kim, N. Creep Behavior of ABS Polymer in Temperature–Humidity Conditions.J. Mater. Eng. Perform. 2017, 29494, 304–2762. [CrossRef]
33. Lim, S.D.; Rhee, J.M.; Nah, C.; Lee, S.-H.; Lyu, M.-Y. Predicting the Long-term Creep Behavior of PlasticsUsing the Short-term Creep Test. Int. Polym. Process. 2004, 19, 313–319. [CrossRef]
34. Tezel, T.; Kovan, V.; Topal, E.S. Effects of the printing parameters on short-term creep behaviors ofthree-dimensional printed polymers. J. Appl. Polym. Sci. 2019, 136, 136. [CrossRef]
35. Dave, H.K.; Patadiya, N.H.; Prajapati, A.R.; Rajpurohit, S.R. Effect of infill pattern and infill density at varyingpart orientation on tensile properties of fused deposition modeling-printed poly-lactic acid part. Proc. Inst.Mech. Eng. Part. C J. Mech. Eng. Sci. 2019. [CrossRef]
36. Prasong, W.; Muanchan, P.; Ishigami, A.; Thumsorn, S.; Kurose, T.; Ito, H. Properties of 3D PrintablePoly(lactic acid)/Poly(butylene adipate-co-terephthalate) Blends and Nano Talc Composites. J. Nanomater.2020, 2020, 1–16. [CrossRef]
37. Lanzotti, A.; Martorelli, M.; Maietta, S.; Gerbino, S.; Penta, F.; Gloria, A. A comparison between mechanicalproperties of specimens 3D printed with virgin and recycled PLA. Procedia CIRP 2019, 79, 143–146. [CrossRef]
38. Raj, S.A.; Muthukumaran, E.; Jayakrishna, K. A Case Study of 3D Printed PLA and Its Mechanical Properties.Mater. Today Proc. 2018, 5, 11219–11226. [CrossRef]
39. Hassan, W.N.F.W.; Ismail, M.A.; Lee, H.-S.; Meddah, M.S.; Singh, J.K.; Hussin, M.W.; Ismail, M. Mixtureoptimization of high-strength blended concrete using central composite design. Constr. Build. Mater. 2020,243, 118251. [CrossRef]
40. Abas, M.; Salman, Q.; Khan, A.M.; Rahman, K. Direct ink writing of flexible electronic circuits and theircharacterization. J. Braz. Soc. Mech. Sci. Eng. 2019, 41, 563. [CrossRef]
41. Coleman, D.E.; Montgomery, D.C. A Systematic Approach to Planning for a Designed Industrial Experiment.Technometrics 1993, 35, 1–12. [CrossRef]
42. Ait-Amir, B.; Pougnet, P.; El Hami, A. Meta-Model Development. In Embedded Mechatronic Systems 2; ElsevierBV: Amsterdam, The Netherlands, 2015; pp. 151–179.
43. Sood, A.K.; Ohdar, R.; Mahapatra, S. Parametric appraisal of mechanical property of fused depositionmodelling processed parts. Mater. Des. 2010, 31, 287–295. [CrossRef]
44. Kovan, V.; Altan, G.; Topal, E.S. Effect of layer thickness and print orientation on strength of 3D printed andadhesively bonded single lap joints. J. Mech. Sci. Technol. 2017, 31, 2197–2201. [CrossRef]
45. Abeykoon, C.; Sri-Amphorn, P.; Fernando, A. Optimization of fused deposition modeling parameters forimproved PLA and ABS 3D printed structures. Int. J. Lightweight Mater. Manuf. 2020, 3, 284–297. [CrossRef]
46. Wang, K.; Xie, X.; Wang, J.; Zhao, A.; Peng, Y.; Rao, Y. Effects of infill characteristics and strain rate onthe deformation and failure properties of additively manufactured polyamide-based composite structures.Results Phys. 2020, 18, 103346. [CrossRef]
47. Alafaghani, A.; Qattawi, A. Investigating the effect of fused deposition modeling processing parametersusing Taguchi design of experiment method. J. Manuf. Process. 2018, 36, 164–174. [CrossRef]
Publisher’s Note: MDPI stays neutral with regard to jurisdictional claims in published maps and institutionalaffiliations.
© 2020 by the authors. Licensee MDPI, Basel, Switzerland. This article is an open accessarticle distributed under the terms and conditions of the Creative Commons Attribution(CC BY) license (http://creativecommons.org/licenses/by/4.0/).


![Research Article Brittle Creep Failure, Critical Behavior ...downloads.hindawi.com/journals/amse/2015/101035.pdf · ] on creep failure of concrete focus mainly on tensile and exural](https://img.pdfslide.us/doc/110x75/5f452273e03bcb5bf076190b/research-article-brittle-creep-failure-critical-behavior-on-creep-failure.jpg)