Embed Size (px)
Citation preview
ORNL/TM-2006/609
Tensile and Creep-Rupture Evaluation of a New Heat of Haynes Alloy 25
February 2007 Prepared by John P. Shingledecker, Principal Investigator with Darryl B. Glanton, Ralph L. Martin, Brian L. Sparks, and Robert W. Swindeman
DOCUMENT AVAILABILITY
Reports produced after January 1, 1996, are generally available free via the U.S. Department of Energy (DOE) Information Bridge:
Web site: http://www.osti.gov/bridge
Reports produced before January 1 , 1996, may be purchased by members of the public from the following source:
National Technical Information Service 5285 Port Royal Road Springfield, VA 22161 Telephone: 703-605-6000 (1-800-553-6847) TDD: 703-487-4639 Fax: 703-605-6900 E-mail: [email protected] Web site: http://www.ntis.gov/support/ordernowabout.htm
Reports are available to DOE employees, DOE contractors, Energy Technology Data Exchange (ETDE) representatives, and International Nuclear Information System (INIS) representatives from the following source:
Office of Scientific and Technical Information P.O. Box 62 Oak Ridge, TN 37831 Telephone: 865-576-8401 Fax: 865-576-5728 E-mail: [email protected] Web site: http://www.osti.gov/contact.html
This report was prepared as an account of work sponsored by an agency of the United States Government. Neither the United States government nor any agency thereof, nor any of their employees, makes any warranty, express or implied, or assumes any legal liability or responsibility for the accuracy, completeness, or usefulness of any information, apparatus, product, or process disclosed, or represents that its use would not infringe privately owned rights. Reference herein to any specific commercial product, process, or service by trade name, trademark, manufacturer, or otherwise, does not necessarily constitute or imply its endorsement, recommendation, or favoring by the United States Government or any agency thereof. The views and opinions of authors expressed herein do not necessarily state or reflect those of the United States Government or any agency thereof.
ORNL/TM-2006/609
Tensile and Creep-Rupture Evaluation of a New Heat of Haynes Alloy 25
John P. Shingledecker1, Principal Investigator with
Darryl B. Glanton1, Ralph L. Martin1, Brian L. Sparks1, Robert W. Swindeman2
1Oak Ridge National Laboratory, Materials Science and Technology Division, Oak Ridge, TN, USA 2Retired, Oak Ridge National Laboratory, Metals & Ceramics Division, Oak Ridge, TN, USA
February 2007
Prepared by OAK RIDGE NATIONAL LABORATORY
P.O. Box 2008 Oak Ridge, Tennessee 37831-6285
managed by UT-Battelle, LLC
for the U.S. DEPARTMENT OF ENERGY
under contract DE-AC05-00OR22725

CONTENTS
Page
LIST OF FIGURES v
LIST OF TABLES ix
ACKNOWLEDGMENTS xi
ABSTRACT xiii
1. INTRODUCTION 1
2. BACKGROUND 2
3. MATERIALS AND SPECIMENS 3
4. EXPERIMENTAL DETAILS 9 4.1 ELASTIC PROPERTY MEASUREMENTS 9 4.2 TENSILE TESTING 9 4.3 CREEP-RUPTURE TESTING 10 4.4 POST-TEST ANALYSIS 13
5. ELASTIC PROPERTIES RESULTS AND DISCUSSION 14
6. TENSILE PROPERTIES RESULTS AND DISCUSSION 19
7. CREEP PROPERTIES RESULTS AND DISCUSSION 31 7.1 UNIAXIAL RUPTURE RESULTS 31 7.2 PRESSURIZED TUBE RUPTURE RESULTS 35 7.3 SUMMARY OF ALL RUPTURE RESULTS 41 7.4 CREEP-RATE ANALYSIS 44
8. CONCLUSIONS 48
REFERENCES 49
APPENDIX A. DATA TABLES AND FIGURES 51 A.1 TABULAR ELASTIC PROPERTIES 51 A.2 TABULAR TENSILE PROPERTIES 52 A.3 TABULAR UNIAXIAL CREEP AND CREEP-RUPTURE DATA 54 A.4 TABULAR PRESSURIZED TUBE RUPTURE DATA 57 A.5 STRESS-STRAIN CURVES 58 A.6 CREEP STRAIN VS. TIME CURVES 123 A.7 HISTORICAL SUMMARY OF HAYNES 25 TENSILE DATA 179 A.8 HISTORICAL SUMMARY OF HAYNES 25 CREEP-RUPTURE DATA 188
iii

LIST OF FIGURES
Figure Page
3.1 Metallographic images of the alloy 25 as-received material 4
3.2 Specimen drawing for alloy 25 plate creep and tensile specimens 5
3.3 Example cutting plan for alloy 25 weldment specimens 6
3.4 Uniaxial weldment specimens taken from tubular machined bar 7
3.5 RUS alloy 25 specimen 8
4.3.1. Schematic of pressurization and control system for high-temperature pressurized creep testing of tubular specimens.. 11
4.3.2 Furnace detail for high-temperature pressurized creep testing showing the tubular specimen, the thermocouple placement, the stainless steel canister, the gas inlet and outlet, and the pressure stem 12
5.1 Plot of elastic modulus vs. temperature for this heat of alloy 25(aged = aged at 675ºC for 6,000 hours) and compared to the Haynes Datasheet data [15] 15
5.2 Plot of shear (G) and bulk (K) modulus vs. temperature for this heat of alloy 25 (aged = aged at 675ºC for 6,000 hours) 16
5.3 Plot of Poisson’s ratio vs. temperature for this heat of alloy 25 (aged = aged at 675ºC for 6,000 hours) 17
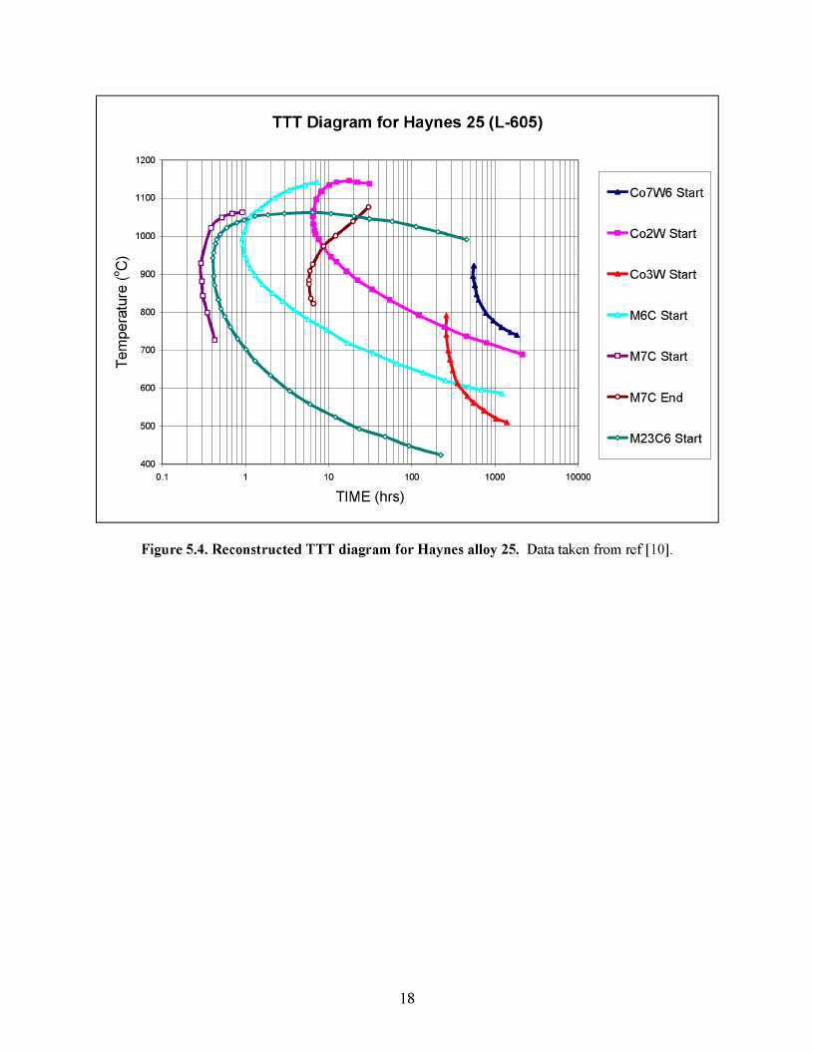
5.4 Reconstructed TTT diagram for Haynes alloy 25 18
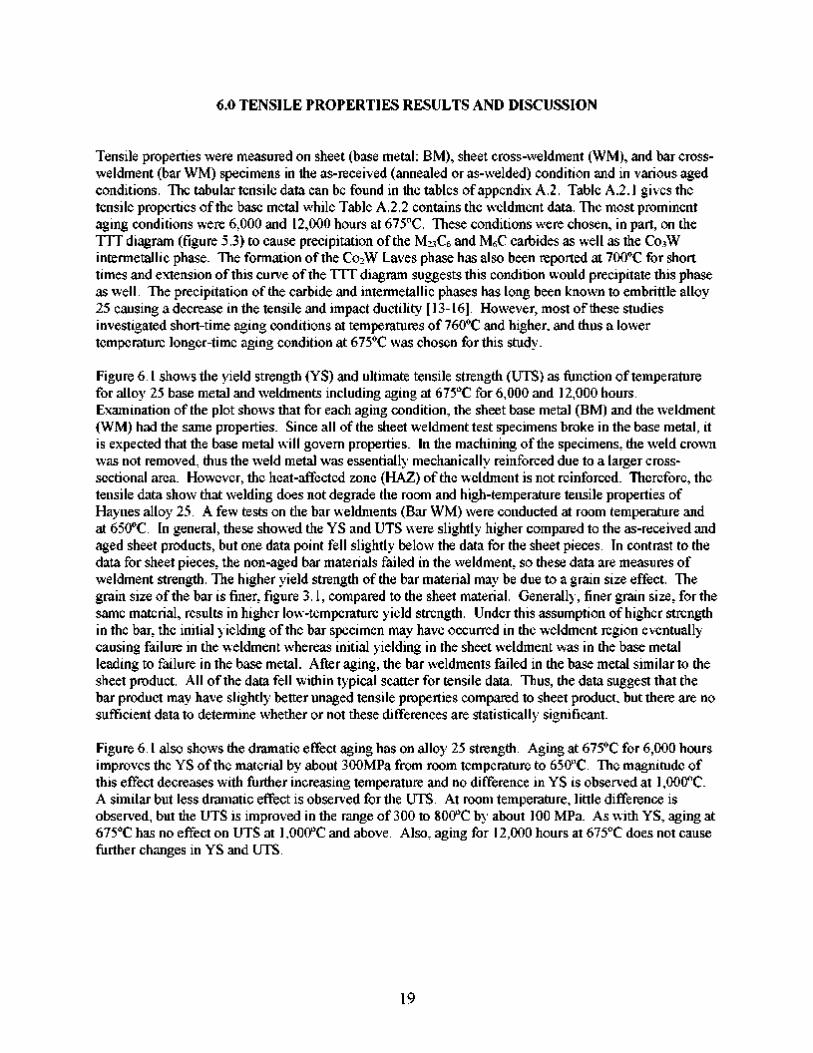
6.1 Measured Yield Strength (YS) and Ultimate Tensile Strength (UTS) as a function of temperature for base metal (BM) and weldments (WM) of Haynes alloy 25 sheet and cross-weldments of Haynes alloy 25 bar product in the as-received condition and after aging at 675ºC for 6,000 and 12,000 hours 20
6.2 Measured ductility, elongation (EL) and reduction of area (RA), as a function of temperature for base metal (BM) and weldments (WM) of Haynes alloy 25 sheet and cross-weldments of Haynes alloy 25 bar product in the as-received condition and after aging at 675ºC for 6,000 and 12,000 hours 21
6.3 Tensile Elongation and the difference in Uniform Elongation and Elongation as a function of temperature for alloy 25 unaged and aged sheet and bar products. . 22
6.4 Room temperature strength and ductility as a function of aging time at 675ºC for alloy 25 24
6.5 Strength and ductility at 650º C, as a function of aging time at 675ºC for alloy 25 25
6.6 Room temperature tensile properties as a function of 1,000 hour aging temperature 26
V
6.7 Measured Yield Strength (YS) and Ultimate Tensile Strength (UTS) for Haynes alloy 25 sheet (as-received, no aging) as a function of temperature compared to the historical database for annealed alloy 25 27
6.8 Measured ductility for Haynes alloy 25 sheet (as-received, no aging) as a function of temperature compared to the historical database for annealed alloy 25 28
6.9 Measured Yield Strength (YS) and Ultimate Tensile Strength (UTS) for Haynes alloy 25 sheet weldments (no aging) as a function of temperature compared to the historical database for alloy 25 weldments 29
6.10 Measured ductility for Haynes alloy 25 sheet weldments (no aging) as a function of temperature compared to the historical database for alloy 25 weldments 30
7.1 Larson-Miller Parameter (LMP) vs. Stress (log scale) for all material conditions 31
7.2 Larson-Miller Parameter (LMP) vs. Stress (log scale) for all material conditions and the historical database 32
7.3 Actual life versus predicted life (LMP analysis) 33
7.4 Rupture ductility as a function of rupture time for all material conditions compared to the historical database 34
7.5 Creep curves (time vs. creep strain) for the four material conditions tested at 800˚C and 103 MPa (15 ksi) 35
7.6 Actual vs. predicted life for pressurized tube creep-rupture tests analyzed using the Von Mises (VM) stress criterion for the inner (ID) and outer (OD) diameter elastic (Lame) and steady-state creep (Bailey) solutions 38
7.7 Actual vs. predicted life for pressurized tube creep-rupture tests analyzed using the stress intensity (SI) stress criterion (Tresca) for the inner (ID) and outer (OD) diameter steady-state creep (Bailey) solutions and for the reference stress solution (Tresca) 39
7.8 Typical micrograph of a region near the creep fracture of a pressurized tubular creep specimen 41
7.9 Quantitative metallographic results for crack depth (left) and crack spacing (right) as a function of test temperature and location (ID and OD) for selected tubular specimens 41
7.10 Plots of isothermal rupture data from 650 to 750ºC 42
7.11 Plots of isothermal rupture data from 800 to 900ºC 43
7.12 Plots of isothermal rupture data at 925 and 950ºC 44
7.13 Minimum creep rate versus stress for various temperatures 45
vi
7.14 Activation energy determination plot of inverse absolute temperature versus minimum creep rate divided by stress^n (n=8) 46
7.15 Stress versus diffusion compensated minimum creep rate (min. creep rate / Doexp (-Q/RT) for all material conditions 47
vii

LIST OF TABLES
Table Page
1. Composition of Haynes alloy 25 used in this study 3
2. Calculated kinetic constants for alloy 25 strength and ductility aged at 675ºC 23
3. Standard error of estimate* (SEE) for tube rupture results 40
A.1.1 Elastic properties of Haynes alloy 25 (Heat # 1860-8-1391) before and after aging at
675ºC for 6,000 hours 51
A.2.1 Tensile properties of Haynes alloy 25 (Heat # 1860-8-1391) 52
A.2.2 Tensile properties of Haynes alloy 25 GTA weldments 53
A.3.1 Creep and stress-rupture data for Haynes alloy 25 (Heat # 1860-8-1391) 54
A.3.2 Creep and stress-rupture data for Haynes alloy 25 weldments (Heat # 1860-8-1391) 56
A.4.1 Rupture data for Haynes alloy 25 pressurized creep tests on tubes 57
A.7.1 Alloy 25 (L-605) historical tensile data for annealed material 179
A.7.2 Alloy 25 (L-605) historical tensile data for welded material 183
A.7.3 Alloy 25 (L-605) historical tensile data for aged material 185
A.8.1 Alloy 25 (L-605) historical creep and stress-rupture data 188
A.8.2 Alloy 25 (L-605) historical creep and stress-rupture data for weldments 194
ix

ACKNOWLEDGEMENTS
The authors would like to acknowledge the contributions of James F. King for his leadership on the program, Peyton Moore for his past leadership of the program, Roger Miller and Edgar Lara-Curzio for reviewing this report, Tim McGreevy for helpful discussions, Tom Geer for his assistance with metallography, Chris Stevens for performing some of the tensile tests, personnel from INL and LANL for providing the materials used in this study, Laura Riester for help with the elastic property measurements, and Christine Goudy for spending countless hours formatting this report.
xi

ABSTRACT
From 1999 to 2006, a program was undertaken within the Materials Science and Technology Division, formerly the Metals and Ceramics Division, of Oak Ridge National Laboratory to characterize the tensile and creep-rupture properties of a newly produced heat of Haynes alloy 25 (L-605). Tensile properties from room temperature to 1100ºC were evaluated for base material and welded joints aged up to 12,000 hours at 675ºC. Creep and creep-rupture tests were conducted on base metal and cross-weldments from 650 to 950ºC. Pressurized tubular creep tests were conducted to evaluate multiaxial creep-rupture response of the material. Over 800,000 hours of creep test data were generated during the test program with the longest rupture tests extending beyond 38,000 hours, and the longest creep-rate experiments exceeding 40,000 hours.
xiii

1. INTRODUCTION
Haynes alloy 25 (alloy 25), originally referenced as L-605, is a cobalt-based superalloy with good fabricability, high-temperature strength, and corrosion resistance. Most of the high-temperature data required for design of Haynes alloy 25 components, creep and tensile properties of base material and weldments, were summarized in 1970 by Swindeman [1]. All of the available literature was again reviewed by Swindeman in 1998 [2], and it was concluded that additional long-term data on a new heat of material would be needed for improved design and material analysis. Furthermore, it was recognized that new data on multiaxial creep effects would be useful, and therefore it was proposed that internally pressurized creep tests on tubular specimens of varying wall thicknesses be conducted. Based upon these recommendations, a test program to evaluate the tensile and creep properties of a new heat of alloy 25 was started. This report summarizes the results of this program, and an appendix containing the historical data (based largely on the summaries by Swindeman) and the data produced on this program is included.
1
2. BACKGROUND
A summary of the historical database for alloy 25 is provided in appendix subsections A.7 and A.8. Section A.7 contains the tensile data and section A.8 contains the stress and creep-rupture data. The tensile data are taken from the review of Slunder [3]. The data from Slunder’s work includes references [1, 4, 14, 15, 16]. The stress and creep-rupture data are taken from Simmons and Cross [4], Baughman [5], Green et al. [6], Sandrock et al. [7], Conrad et al. [8], Flagella and McCullough [9], Yukawa and Sato [10], and Widmer et al. [11,12]. Stress-rupture data for weldments were included in some of the references: [1,4,5, and 8]. In general, the stress and creep-rupture data were of short duration. Only Widmer provided creep data beyond 10,000 hours. Over 200 tests are included in the historical database, but the total test durations for these tests are less than 200,000 hours.
A new heat of alloy 25 material was obtained for this study (details in section 3.0). Plate and bar product were evaluated. Dynamic elastic properties from room temperature to 1100ºC were measured for the heat in the as-received mill-annealed condition and after aging at 675ºC. Tensile tests from room temperature to 1100ºC were performed on base metal and weldments aged up to 12,000 hours at 675ºC. Creep and stress-rupture tests were conducted on base metal and weldments; this included aged material in addition to material in the as-received mill annealed condition. Creep-rupture test temperatures ranged from 650ºC to 950ºC for times in excess of 38,000 hours. Pressurized creep-rupture tests on tubular specimens were also conducted for two sizes of tubes at similar creep conditions.
2
3. MATERIAL AND SPECIMENS
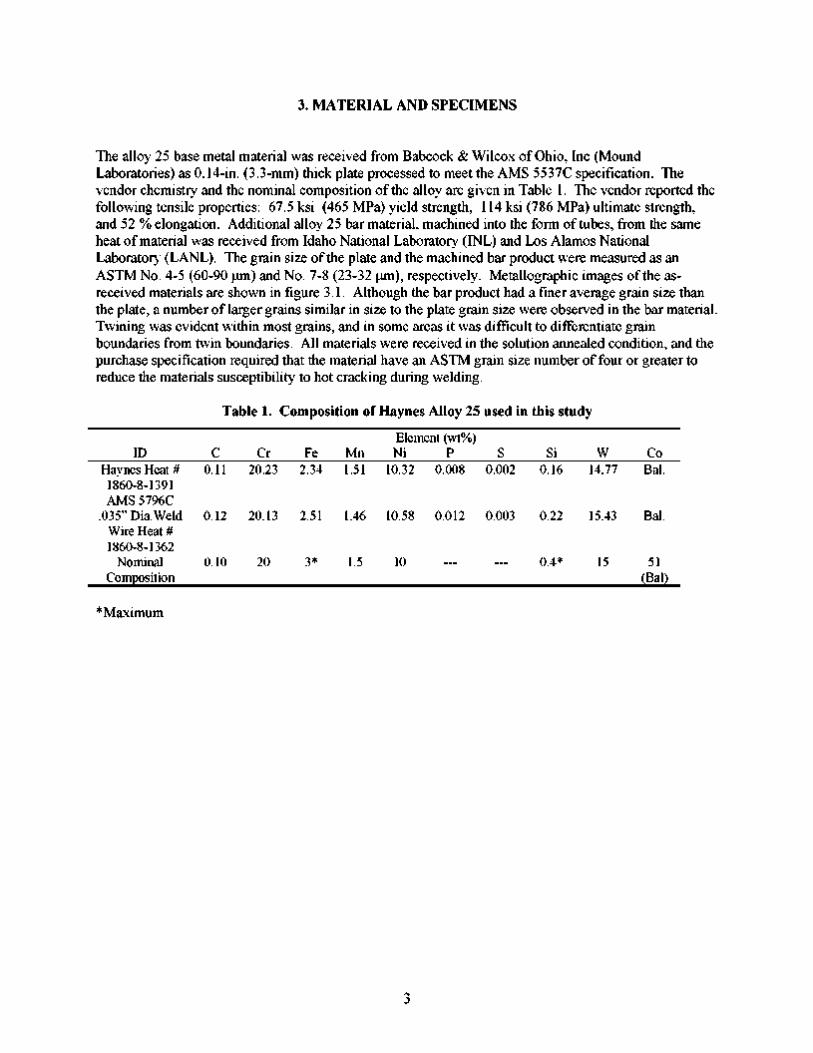
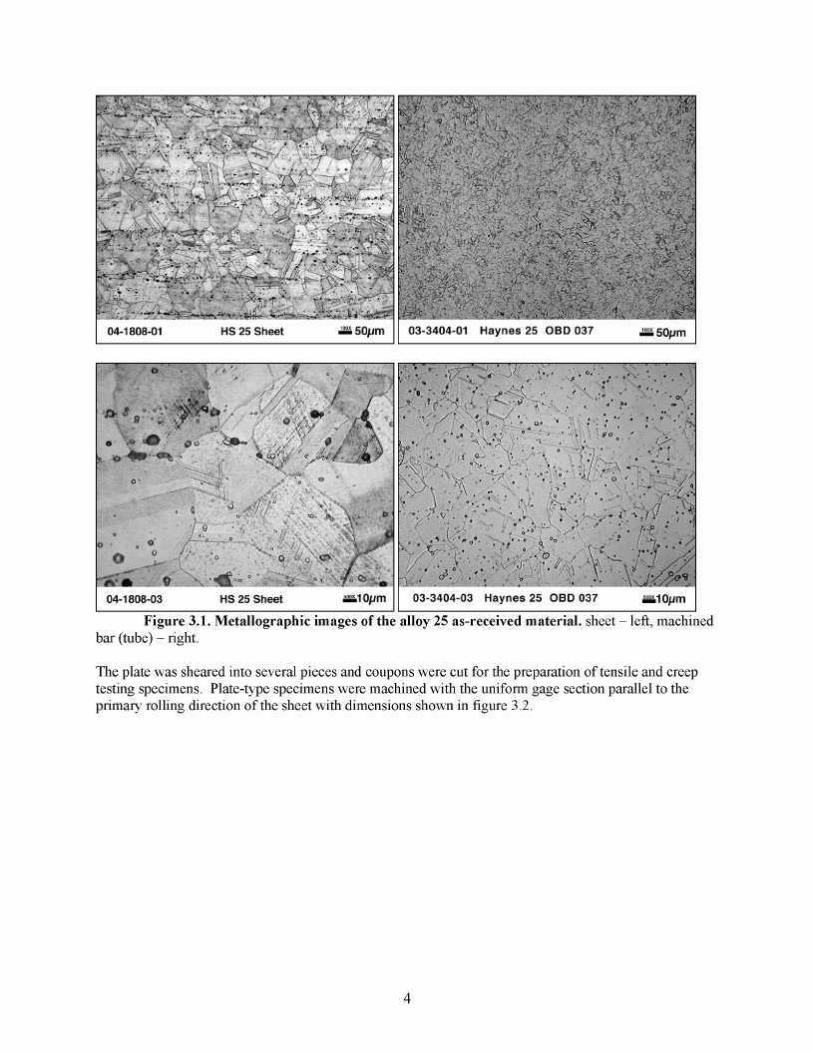
The alloy 25 base metal material was received from Babcock & Wilcox of Ohio, Inc (Mound Laboratories) as 0.14-in. (3.3-mm) thick plate processed to meet the AMS 5537C specification. The vendor chemistry and the nominal composition of the alloy are given in Table 1. The vendor reported the following tensile properties: 67.5 ksi (465 MPa) yield strength, 114 ksi (786 MPa) ultimate strength, and 52 % elongation. Additional alloy 25 bar material, machined into the form of tubes, from the same heat of material was received from Idaho National Laboratory (INL) and Los Alamos National Laboratory (LANL). The grain size of the plate and the machined bar product were measured as an ASTM No. 4-5 (60-90 µm) and No. 7-8 (23-32 µm), respectively. Metallographic images of the as-received materials are shown in figure 3.1. Although the bar product had a finer average grain size than the plate, a number of larger grains similar in size to the plate grain size were observed in the bar material. Twining was evident within most grains, and in some areas it was difficult to differentiate grain boundaries from twin boundaries. All materials were received in the solution annealed condition, and the purchase specification required that the material have an ASTM grain size number of four or greater to reduce the materials susceptibility to hot cracking during welding.
Table 1. Composition of Haynes Alloy 25 used in this study
Element (wt%) ID C Cr Fe Mn Ni P S Si W Co
Haynes Heat # 0.11 20.23 2.34 1.51 10.32 0.008 0.002 0.16 14.77 Bal. 1860-8-1391 AMS 5796C
.035” Dia.Weld 0.12 20.13 2.51 1.46 10.58 0.012 0.003 0.22 15.43 Bal. Wire Heat # 1860-8-1362
Nominal 0.10 20 3* 1.5 10 --- --- 0.4* 15 51 Composition (Bal)
*Maximum
3
' ■'■
•°« J°
> >
w
*. #;r^u*.; -. j. ■'.
' u
V*t.
••"•' ':\\.-V \'°
IS i " '
. * ■ ■ ■ ' * < , < ■ ■
03-3404-03
' - " • ^ # ■ • ' •
• * ' i"
'•'• $'*'%• ',':
f ' -l , . • ■ . . .
a. •' ; • • . . )s>t
, , V . \ ■. .
Haynes25 OBD 037
• ■ ■ ' . • - '
- ■? ' • . . /
•: • v • ■:> •. .- r > V
.-. ■ M '
^SM HlO/Jtn
Figure 3.1. Metallographic images of the alloy 25 as-received material. sheet – left, machined bar (tube) – right.
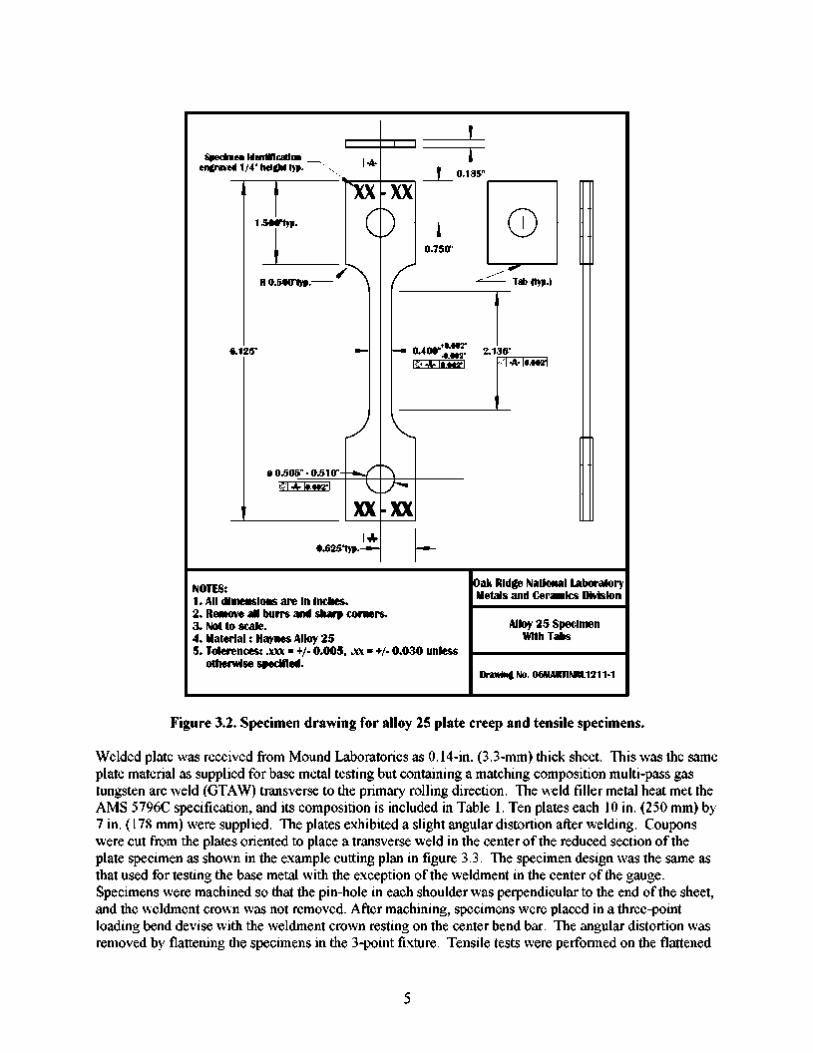
The plate was sheared into several pieces and coupons were cut for the preparation of tensile and creep testing specimens. Plate-type specimens were machined with the uniform gage section parallel to the primary rolling direction of the sheet with dimensions shown in figure 3.2.
4
Specimen Identification engraved 1/4" height typ.
NOTES: 1. All dimensions are in inches. 2. Remove all burrs and sharp corners. 3. Not to scale. 4. Material : Haynes Alloy 25 5. Tolerences: .xxx = +/- 0.005, .xx = +/- 0.030 unless
otherwise specified.
Oak Ridge National Laboratory Metals and Ceramics Division
Alloy 25 Specimen With Tabs
Drawing No. 06MARTINRL1211-1
Figure 3.2. Specimen drawing for alloy 25 plate creep and tensile specimens.
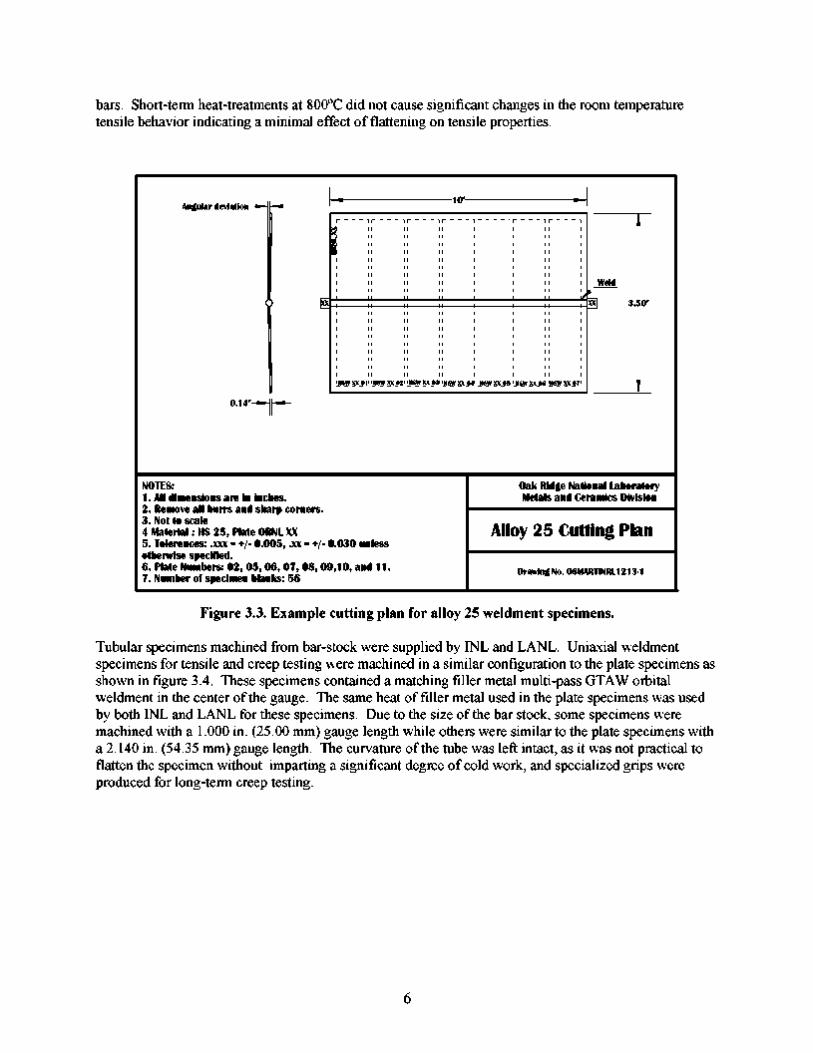
Welded plate was received from Mound Laboratories as 0.14-in. (3.3-mm) thick sheet. This was the same plate material as supplied for base metal testing but containing a matching composition multi-pass gas tungsten arc weld (GTAW) transverse to the primary rolling direction. The weld filler metal heat met the AMS 5796C specification, and its composition is included in Table 1. Ten plates each 10 in. (250 mm) by 7 in. (178 mm) were supplied. The plates exhibited a slight angular distortion after welding. Coupons were cut from the plates oriented to place a transverse weld in the center of the reduced section of the plate specimen as shown in the example cutting plan in figure 3.3. The specimen design was the same as that used for testing the base metal with the exception of the weldment in the center of the gauge. Specimens were machined so that the pin-hole in each shoulder was perpendicular to the end of the sheet, and the weldment crown was not removed. After machining, specimens were placed in a three-point loading bend devise with the weldment crown resting on the center bend bar. The angular distortion was removed by flattening the specimens in the 3-point fixture. Tensile tests were performed on the flattened
5
bars. Short-term heat-treatments at 800ºC did not cause significant changes in the room temperature tensile behavior indicating a minimal effect of flattening on tensile properties.
Angular deviation k 10" - I
XX|
_HSW XX_01 HSW XX 02 HSW XX 03 HSW XX 0 4 _HSW XX 0 5 HSW XX 0 6 HSW XX 07
Weld
XX 3.50
0.14" » II ■
NOTES: 1 . All dimensions are in inches. 2. Remove all burrs and sharp corners. 3. Not to scale 4 Material : HS 25, Plate ORNL XX 5. Tolerences: .xxx = +/- 0.005, .xx = +/- 0.030 unless otherwise specified. 6. Plate Numbers: 02, 05, 06, 07, 08, 09,10, and 11. 7. Number of specimen blanks: 56
Oak Ridge National Laboratory Metals and Ceramics Division
Alloy 25 Cutting Plan
Drawing No. 06MARTINRL1213-1
Figure 3.3. Example cutting plan for alloy 25 weldment specimens.
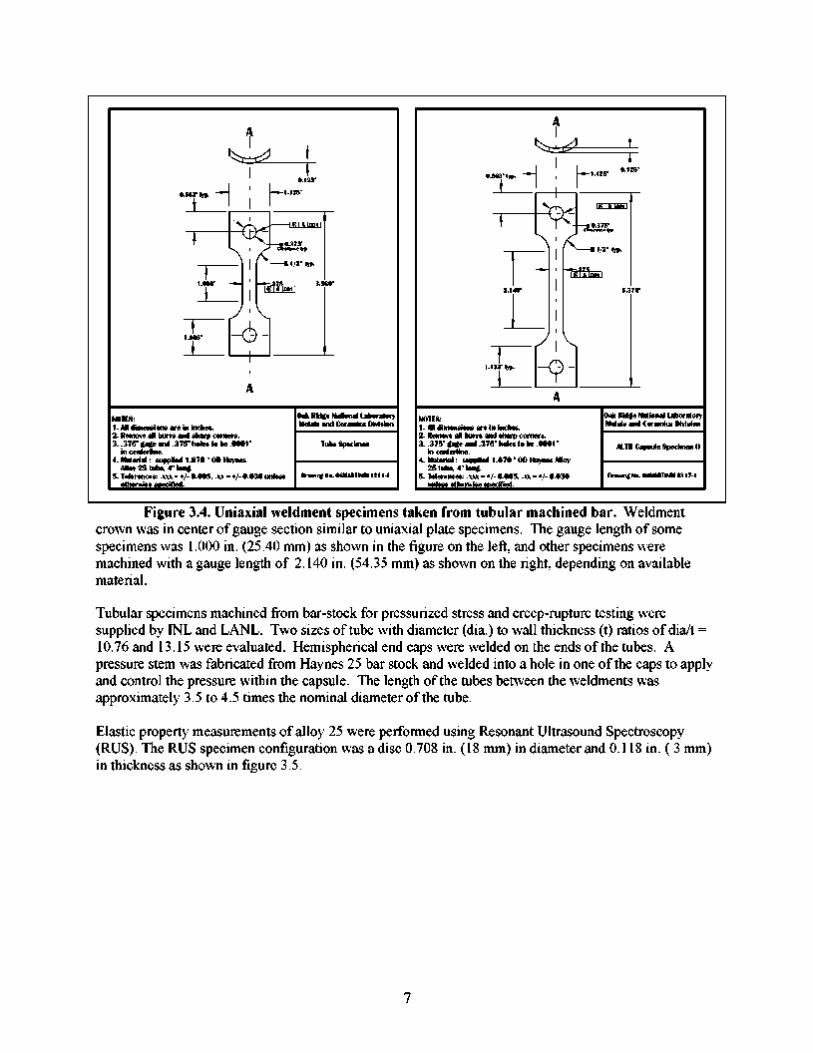
Tubular specimens machined from bar-stock were supplied by INL and LANL. Uniaxial weldment specimens for tensile and creep testing were machined in a similar configuration to the plate specimens as shown in figure 3.4. These specimens contained a matching filler metal multi-pass GTAW orbital weldment in the center of the gauge. The same heat of filler metal used in the plate specimens was used by both INL and LANL for these specimens. Due to the size of the bar stock, some specimens were machined with a 1.000 in. (25.00 mm) gauge length while others were similar to the plate specimens with a 2.140 in. (54.35 mm) gauge length. The curvature of the tube was left intact, as it was not practical to flatten the specimen without imparting a significant degree of cold work, and specialized grips were produced for long-term creep testing.
6
0.563" typ.
0.125"
1—1.125"
NOTES: 1. All dimensions are in inches. 2. Remove all burrs and sharp corners. 3. .375" gage and .375" holes to be .0001"
in centerline. 4. Material : supplied 1.670 " OD Haynes
Alloy 25 tube, 4" long. 5. Tolerences: .xxx = +/- 0.005, .xx = +/- 0.030 unless
otherwise specified.
Oak Ridge National Laboratory Metals and Ceramics Division
Tube Specimen
Drawing No. 06MARTINRL1211-1
0.563" typ.
i
NOTES: 1. All dimensions are in inches. 2. Remove all burrs and sharp corners. 3. .375" gage and .375" holes to be .0001"
in centerline. 4. Material : supplied 1.670 " OD Haynes Alloy
25 tube, 4" long. 5. Tolerences: .xxx = +/- 0.005, .xx = +/- 0.030
unless otherwise specified.
Oak Ridge National Laboratory Metals and Ceramics Division
ALTB Capsule Specimen II
Drawing No. 04MARTINRL0317-1
Figure 3.4. Uniaxial weldment specimens taken from tubular machined bar. Weldment crown was in center of gauge section similar to uniaxial plate specimens. The gauge length of some specimens was 1.000 in. (25.40 mm) as shown in the figure on the left, and other specimens were machined with a gauge length of 2.140 in. (54.35 mm) as shown on the right, depending on available material.
Tubular specimens machined from bar-stock for pressurized stress and creep-rupture testing were supplied by INL and LANL. Two sizes of tube with diameter (dia.) to wall thickness (t) ratios of dia/t = 10.76 and 13.15 were evaluated. Hemispherical end caps were welded on the ends of the tubes. A pressure stem was fabricated from Haynes 25 bar stock and welded into a hole in one of the caps to apply and control the pressure within the capsule. The length of the tubes between the weldments was approximately 3.5 to 4.5 times the nominal diameter of the tube.
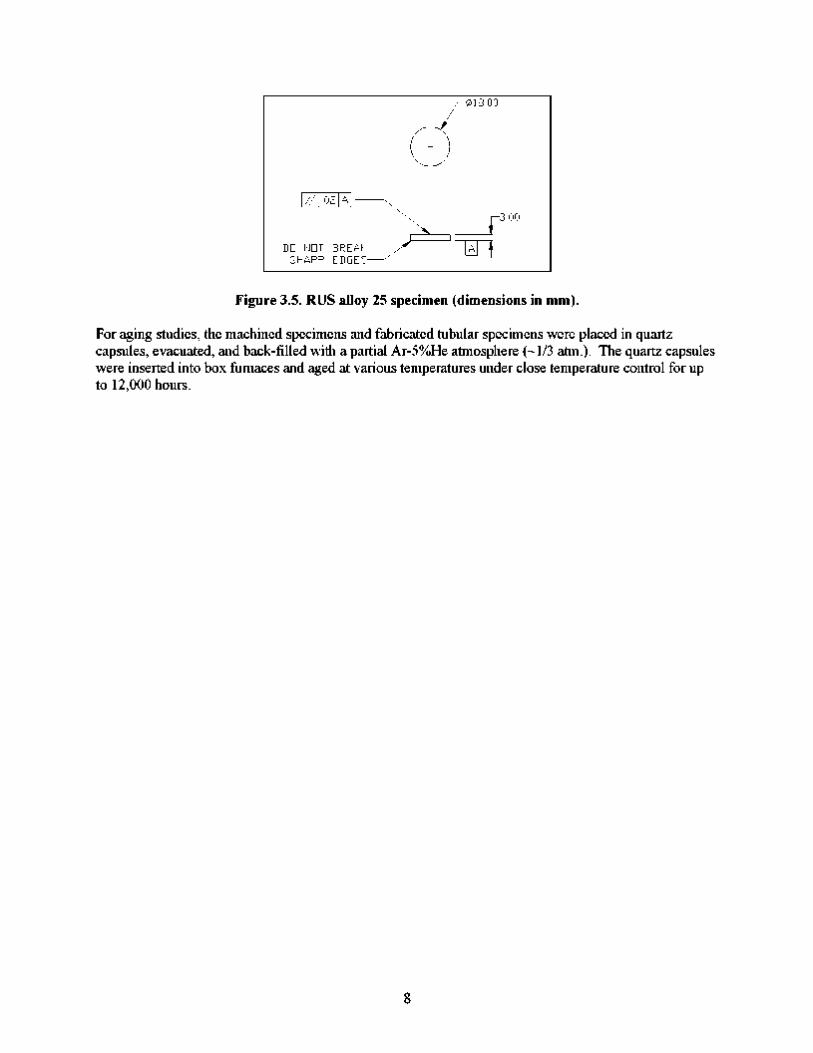
Elastic property measurements of alloy 25 were performed using Resonant Ultrasound Spectroscopy (RUS). The RUS specimen configuration was a disc 0.708 in. (18 mm) in diameter and 0.118 in. ( 3 mm) in thickness as shown in figure 3.5.
A
CL I A .001
R 1/2 typ.
1.000 3.980 CL I A .001
1.008
A A
7
/ / 02 A \
DD NDT BREAK / " SHARP EDGES y
r^\c6 00
+ )
p-3 00
Ld !
Figure 3.5. RUS alloy 25 specimen (dimensions in mm).
For aging studies, the machined specimens and fabricated tubular specimens were placed in quartz capsules, evacuated, and back-filled with a partial Ar-5%He atmosphere (~1/3 atm.). The quartz capsules were inserted into box furnaces and aged at various temperatures under close temperature control for up to 12,000 hours.
8
4. EXPERIMENTAL DETAILS
4.1 ELASTIC PROPERTY MEASUREMENTS
To determine the elastic constants (elastic modulus, shear modulus, and Poisson’s ration) for this heat of alloy 25, Resonant Ultrasound Spectroscopy (RUS) testing was performed in an Argon atmosphere starting at room temperature (25°C) and at isothermal conditions at the following temperatures: 150, 300, 500, 650, 800, 900, 1000, and 1100°C for specimens removed from the as-received plate and plate aged for 6,000 hours at 675ºC [17]. For each test, the specimen was heated to the desired temperature and a spectrum was obtained after soaking at that temperature for 30 minutes. The temperature was then raised and the process repeated. After completing the entire temperature range, the specimen was cooled to 25°C and another spectrum was obtained. The peak-fitting routine used to analyze the RUS spectrum determines a best-fit value for the elastic modulus (E) and the shear modulus (G) [18]. From these values, Poisson’s ratio (v) was determined by the relationship:
E = 2G(1 + v) equation 1
Although the atmosphere was inert, a small oxide layer was visible after testing. Depending on its thickness, an oxide layer may affect the elastic measurements. Calculating the elastic constants after cooling (when the oxide layer is present) and comparing it to the initial room temperature constant is a standard method for determining the extent of an oxide layer effect. The difference between the pre- and post-test calculated elastic moduli were 2.2 and 1.0 percent for the unaged and aged material respectively, and no change was observed for Poisson’s ratio. This indicates that the oxide layer had a negligible effect on the determined constants.
4.2 TENSILE TESTING
Tensile tests were performed on alloy 25 base metal (plate and bar product forms/specimens) and weldments in the as-received condition and after aging for various times and temperatures. The room temperature and elevated temperature tensile tests conformed to ASTM E8-00 and E 21-92, respectively. Tests were performed in electromechanical tensile machines equipped with digital data acquisition. All tests on the plate and plate weldment specimens were performed in extension control mode with an extension rate of 0.107 in/min, which corresponded to a nominal strain rate of 0.05/min on the specimen gauge section. For the bar cross-weldments, the tensile tests were performed in extension control with a nominal strain rate of 0.005/min. After yielding (one to two percent strain), the extension rate was increased to give a nominal strain rate of 0.05/min, and the test specimen was taken to failure. An ASTM class B1 or B2 extensometer was attached to the gauge section of the specimens for accurate measurement of strain. Yield strength (YS) was determined using the 0.2% offset method, the proportional limit was calculated by visual inspection of the tensile curve, ultimate tensile strength (UTS) and ultimate strain (strain at UTS) were calculated by the computer data acquisition system, and final elongation (EL) and reduction of area (RA) were determined by post-test measurements.
9
4.3 CREEP-RUPTURE TESTING
The creep-rupture testing procedures conformed to ASTM practice E139. For creep-rupture testing, dead-load and lever-arm machines were used with a maximum capacity of 22 kN (5,000 lbs). For temperatures of 800˚C and lower, type K (Chromel-Alumel) thermocouples were used for temperature control and readout. For temperatures above 800˚C, type S (Platinum-Platinum/Rhodium) thermocouples were used for control but type K thermocouples were sometimes used for set-up at the start of the test. Load cells were used to set and maintain the load within 0.5% of the target load for all creep-rupture and creep tests. Machine loads were adjusted when needed to accommodate potential changes due to the effect of lever arm travel. An extensometer was attached to the center 2 inches (50 mm) of the reduced section of the specimens. Depending on the test requirements, the ASTM extensometer type ranged from Class B-1 to Class C (ASTM E 83). Most testing was performed with extensometers calibrated to the Class B-2 category. The Class C extensometer was sometimes used for the weldment samples since the influence of the cross weld in the gage length produced some uncertainty as to the significance of the measured displacement. For tests above 900ºC, oxidation of the specimen may have a significant influence on the creep-rupture properties, so testing at these conditions was performed in a flowing 99.99% purity Argon atmosphere. After testing, the specimen surfaces were tinted a light-green in color, which is indicative of a thin chromia based oxide scale typical in this alloy system. In contrast, the specimens tested in air all exhibited a dark black oxide layer after creep testing, which is evidence of a thicker oxide layer. For testing in Argon gas, the retort system excluded the use of typical creep extensometers for strain measurement and the high-temperature precluded the use of other strain measurement options. Thus, load-line displacement readings were taken manually at 48 to 72 hour increments and used to estimate the creep strain.
Several types of extension sensors were used on the extensometers. All were electronic and provided signals that could be read by a data acquisition system. For most tests, load and extension data were collected on a computer data acquisition system. Manual dial gage readings of the load line displacement were made on a weekly basis. Generally, these readings indicated larger displacements than readings from extensometers. The difference was attributed to creep strains accumulated in the shoulders of the specimens and displacement of the loading pins. Post test readings of the displacement on the specimen reduced sections generally confirmed the accuracy of the extension measurements.
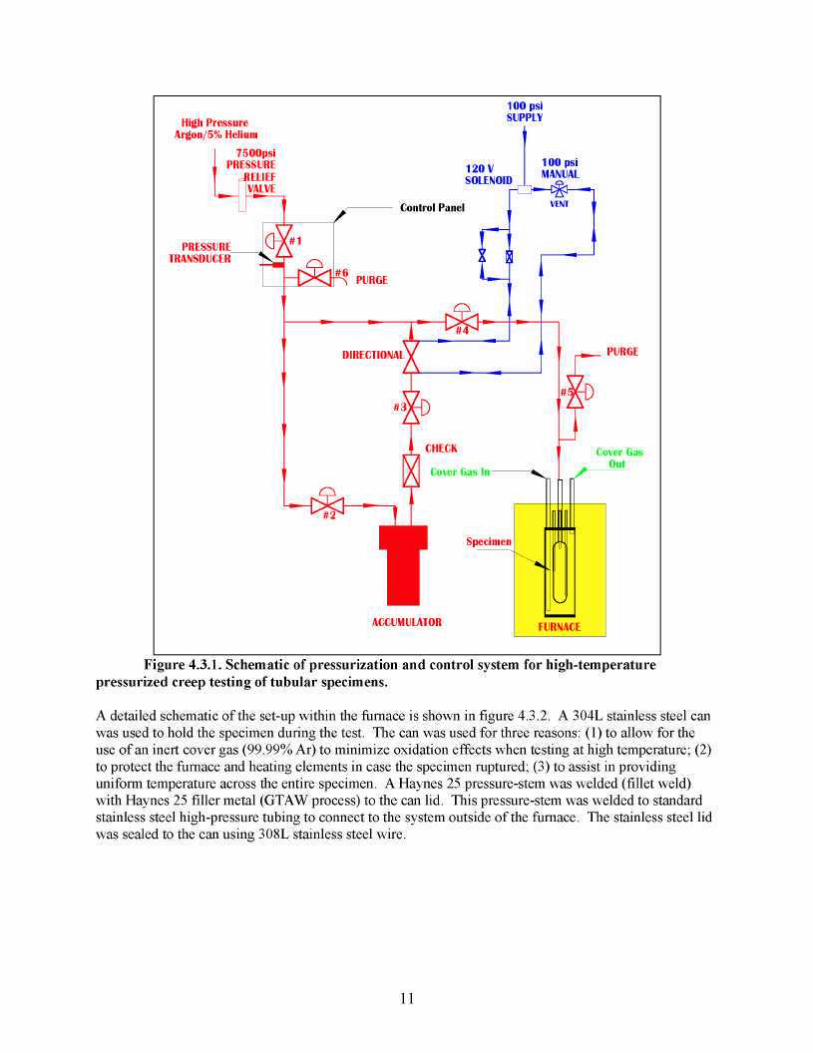
For pressurized creep testing of the tubular specimens (removed from bar stock), the ORNL pressure-
burst facility was used. Figure 4.3.1 shows a schematic representation of one test rig in the facility. A high-pressure oil-less pump supplied Ar-0.5%He gas to the test facility. A 7,500 psi safety pressure relief valve was used to limit pressure in case of an emergency. Specimen pressure was controlled manually using a series of valves. A digital pressure transducer, in line with the specimen, was used to monitor pressure at all times. In order to maintain a constant pressure within the capsule throughout the test, an accumulator was used so the system could be isolated from the supply pump. The main pump was only used during the test when the pressure deviated from the target pressure by more than +/- 50 psi. Generally, this was not needed because the accumulator had sufficient volume to keep the tube pressure within the specified range. Fluctuations in room temperature could also cause increases or decreases in the test system pressure. Insulating the accumulators reduced these fluctuations, and only in the case of the very long-term tests were one or two manual changes in pressure to the accumulators required.
10
High Pressure Argon/5% Helium
7500psi PRESSURE
RELIEF VALVE
100 psi SUPPLY
120 V SOLENOID
PRESSURE TRANSDUCER * V ^
Control Panel
#1
p»0^1 #6
100 psi MANUAL
VENT
PURGE
DIRECTIONAL
#3
,.
—$£— v # 2 ^
CHECK
Cover Gas In
Specimen
ACCUMULATOR
PURGE
Cover Gas Out
FURNACE
Figure 4.3.1. Schematic of pressurization and control system for high-temperature pressurized creep testing of tubular specimens.
A detailed schematic of the set-up within the furnace is shown in figure 4.3.2. A 304L stainless steel can was used to hold the specimen during the test. The can was used for three reasons: (1) to allow for the use of an inert cover gas (99.99% Ar) to minimize oxidation effects when testing at high temperature; (2) to protect the furnace and heating elements in case the specimen ruptured; (3) to assist in providing uniform temperature across the entire specimen. A Haynes 25 pressure-stem was welded (fillet weld) with Haynes 25 filler metal (GTAW process) to the can lid. This pressure-stem was welded to standard stainless steel high-pressure tubing to connect to the system outside of the furnace. The stainless steel lid was sealed to the can using 308L stainless steel wire.
11
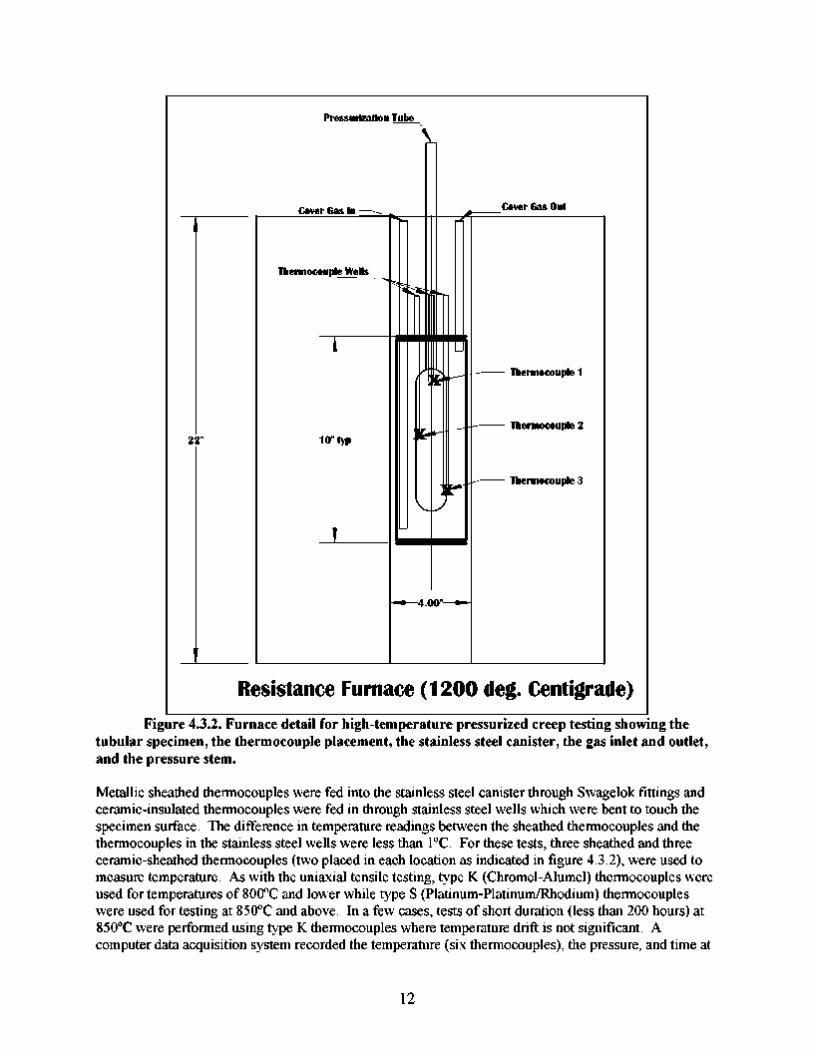
Figure 4.3.2. Furnace detail for high-temperature pressurized creep testing showing the tubular specimen, the thermocouple placement, the stainless steel canister, the gas inlet and outlet, and the pressure stem.
Metallic sheathed thermocouples were fed into the stainless steel canister through Swagelok fittings and ceramic-insulated thermocouples were fed in through stainless steel wells which were bent to touch the specimen surface. The difference in temperature readings between the sheathed thermocouples and the thermocouples in the stainless steel wells were less than 1ºC. For these tests, three sheathed and three ceramic-sheathed thermocouples (two placed in each location as indicated in figure 4.3.2), were used to measure temperature. As with the uniaxial tensile testing, type K (Chromel-Alumel) thermocouples were used for temperatures of 800ºC and lower while type S (Platinum-Platinum/Rhodium) thermocouples were used for testing at 850ºC and above. In a few cases, tests of short duration (less than 200 hours) at 850ºC were performed using type K thermocouples where temperature drift is not significant. A computer data acquisition system recorded the temperature (six thermocouples), the pressure, and time at
12
0.1 hr intervals. This data collection rate was increased when the pressure dropped below a predetermined value to record the rupture or leak rate. An accumulator shut-off valve was closed at this point so the entire gas volume of the accumulator did not leak through the specimen on rupture. When these events happened, the system sent an alarm to a staff member to manually check the system for specimen rupture.
The test procedure used was as follows. After the specimen was welded to the can top, the specimen was pressurized at room temperature to the test pressure and held for 24 hours to check for leaks. If a leak was detected, the welds and fittings were evaluated for leaks, the problem was corrected, and the process was repeated. After successful pressurization, the specimen was de-pressurized and the can lid was welded onto the can sealing the specimen inside the canister. The system was purged and the specimen was pressurized with Ar-0.5%He gas again for 24 hours. During this time, flowing Argon gas was introduced into the can. After 24 hours, the pressure in the capsule was lowered a minimum of 1000 psi below the intended test pressure, the data acquisition system was started, and the furnace was started. The temperature was gradually raised and the pressure adjusted to stay a minimum of 1000 psi below the test pressure. Once the capsule had reached the test temperature and the total temperature gradient was less than 5ºC (< +/- 2.5ºC intended test temperature), the pressure was raised to the test pressure and the test was started. In addition to the computer data acquisition system, the data was also recorded on a chart recorder and periodic manual readings were made. The pressure drop limit was set at 50psi; that is when the pressure dropped 50psi below the test pressure, the data acquisition rate was increased, the supply from the accumulator was stopped, and an alarm was sent out. If the pressure continued to decrease, then this point was taken as the rupture time.
To measure the rupture strain of the tubular specimens, the diameter of the specimen was measured after testing. This worked well for small longitudinal ruptures along the tube axis, but in some cases the specimen had a ‘fishmouth’ type rupture with a large opening. In these cases, the largest circumference was measured and the final diameter was calculated.
4.4 POST-TEST ANALYSIS
A select number of specimens (sheet and tubes) were visually examined using a digital stereo microscope. Others were sectioned and areas of interest were prepared metallographically by mounting the sectioned
samples in epoxy, grinding using 220 and 600 SiC grit sandpaper, and polishing using 6, 3, and 1 µm diamond paste. Samples were etched for metallographic examination using glyceregia.
13
5. ELASTIC PROPERTIES RESULTS AND DISCUSSION
The measured elastic constants as a function of temperature for alloy 25 before and after aging at 675ºC for 6,000 hour are tabulated in the appendix (A.1). The elastic modulus (E) for these two material conditions is plotted along with the dynamic modulus data from the Haynes 25 product brochure [19] in figure 5.1. The shear modulus (G) and bulk modulus (K) are plotted as a function of temperature in figure 5.2, and Poisson’s ratio (ν) values for the two conditions are plotted in figure 5.3.
The RUS measured elastic moduli are slightly higher than the Haynes data over the entire temperature range. The difference in modulus is generally less than 4%, which is small considering a different measurement technique and/or product form was likely used for generating the Haynes data. The plot also shows that the elastic modulus for aged material is 2 to 3 percent higher below 650°C compared to the unaged material. This difference is smaller above 800°C. The small change in elastic modulus for the aged material at the lower temperatures may be due to a change in the matrix composition between the unaged and aged material. Examination of the TTT diagram, figure 5.3, for Haynes 25 shows that aging for 6,000 hours at 675°C results in the precipitation of the Co3W and Co2W phases in addition to carbide phases. Precipitation of the intermetallic phases may appreciable change the bulk composition of the Co matrix resulting in a slight change in elastic properties. In addition to differences in elastic modulus, some small differences are observed in Poisson’s ratio at the lower temperatures. Above the aging temperature, especially at 900 to 1100°C, both the elastic modulus and Poisson’s ratio do not show noticeable differences. Closer examination of figure 5.2 shows that the differences in Poisson’s ratio and elastic modulus below 800ºC are the result of small changes in the shear modulus, which is consistently higher for the aged material at low temperatures. No trends are observed for bulk modulus for the unaged and aged conditions. This indicates that any possible aging effect on elastic properties (due to long-term exposure at 675°C) is small and restricted to temperatures below 650°C.
14
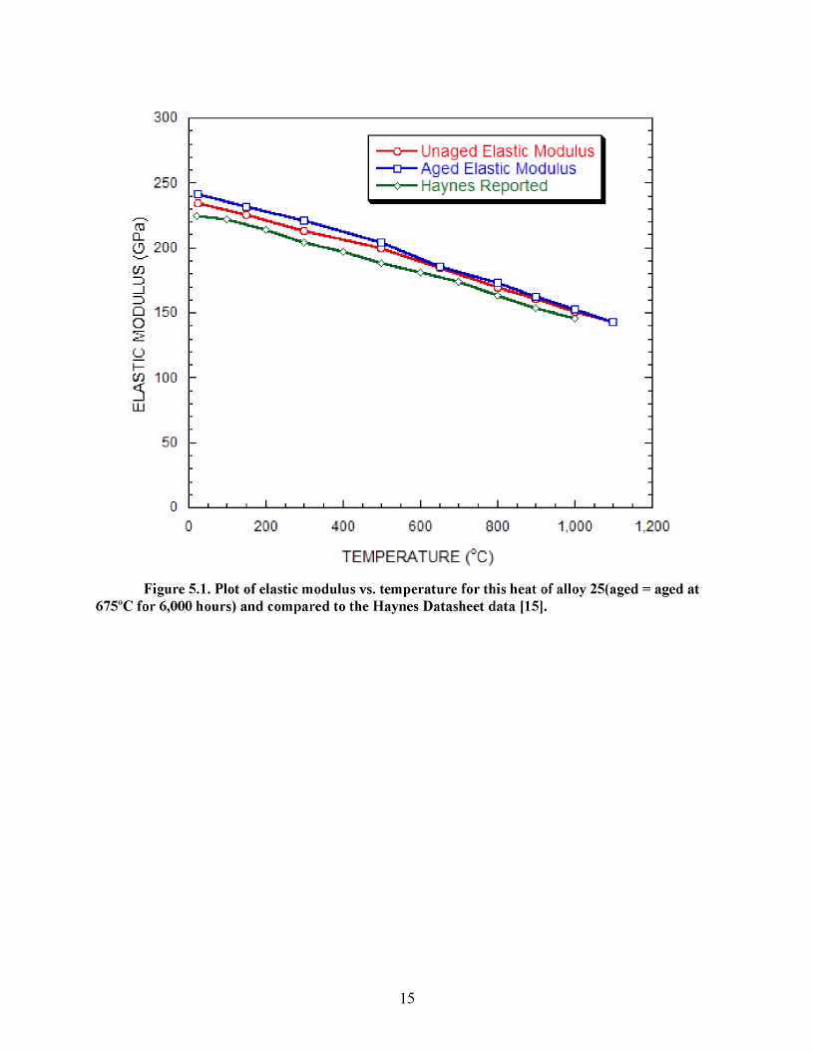
Figure 5.1. Plot of elastic modulus vs. temperature for this heat of alloy 25(aged = aged at 675ºC for 6,000 hours) and compared to the Haynes Datasheet data [15].
15
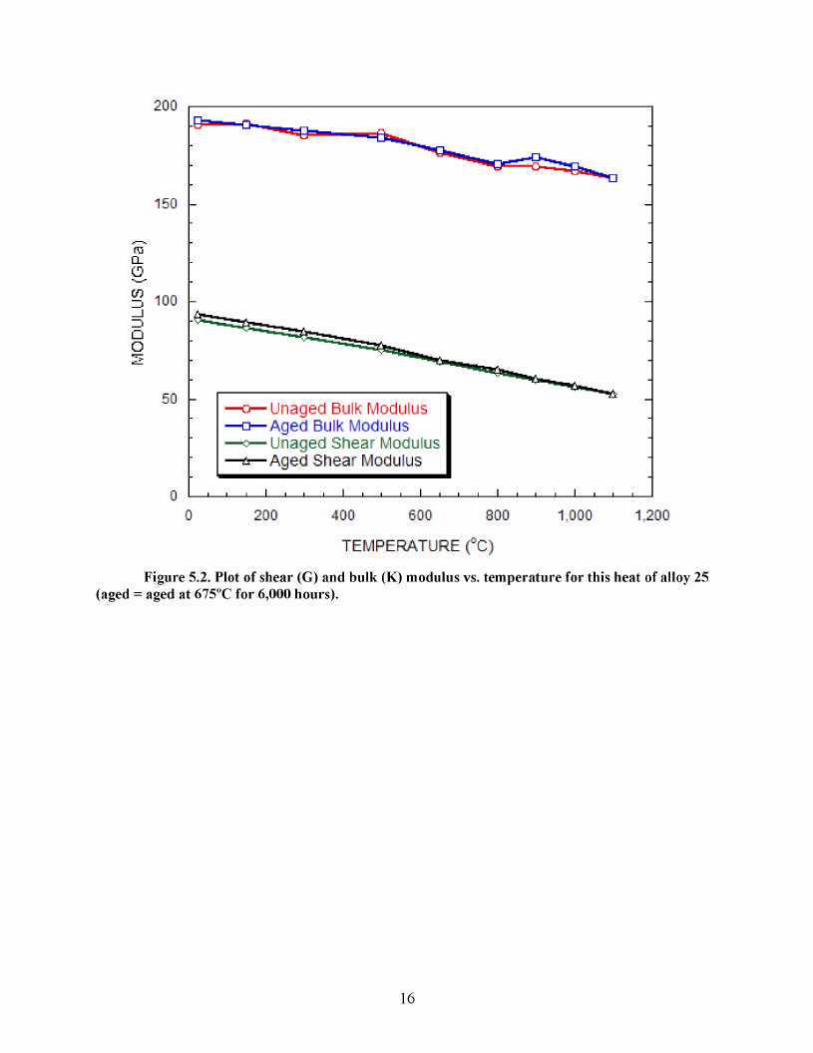
Figure 5.2. Plot of shear (G) and bulk (K) modulus vs. temperature for this heat of alloy 25 (aged = aged at 675ºC for 6,000 hours).
16
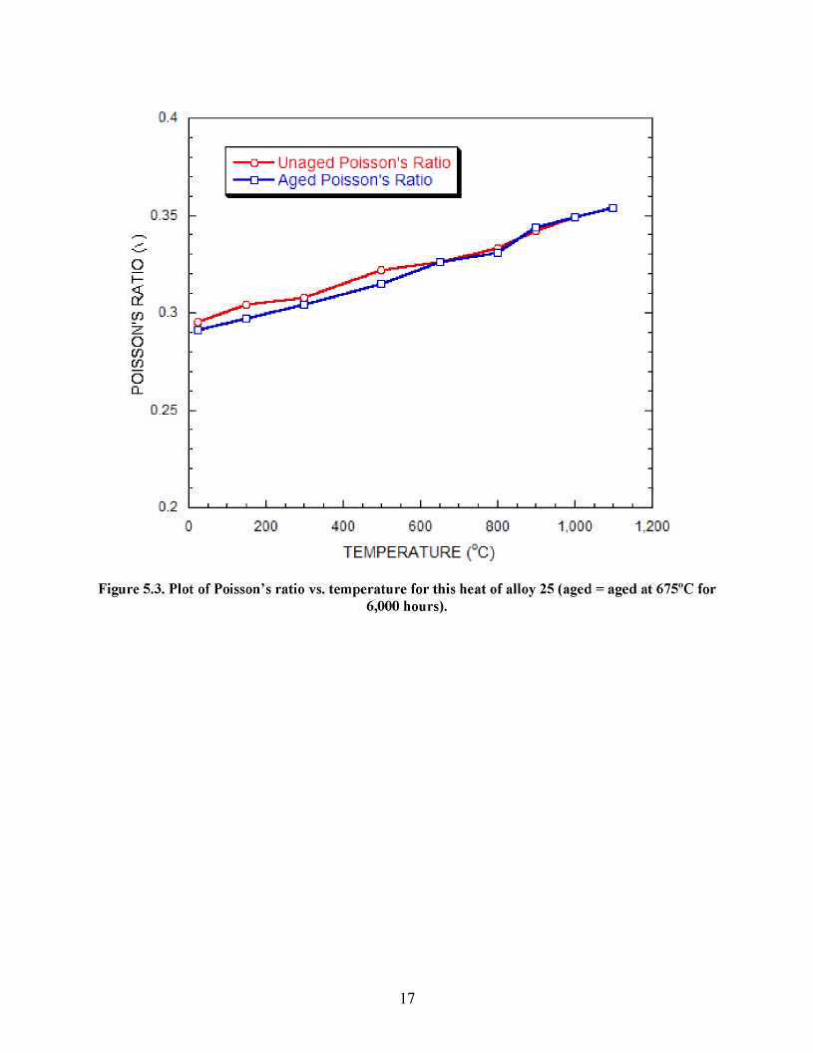
Figure 5.3. Plot of Poisson’s ratio vs. temperature for this heat of alloy 25 (aged = aged at 675ºC for 6,000 hours).
17
TTT Diagram for Haynes 25 (L-605)
1200
1100
1000
800
700
600
500
400 0.1 10 100
TIME (hrs) 1000
Co7W6 Start
Co2W Start
Co3W Start
M6C Start
M7C Start
M7C End
M23C6 Start
10000
Figure 5.4. Reconstructed TTT diagram for Haynes alloy 25. Data taken from ref [10].
18
6.0 TENSILE PROPERTIES RESULTS AND DISCUSSION
Tensile properties were measured on sheet (base metal: BM), sheet cross-weldment (WM), and bar cross-weldment (bar WM) specimens in the as-received (annealed or as-welded) condition and in various aged conditions. The tabular tensile data can be found in the tables of appendix A.2. Table A.2.1 gives the tensile properties of the base metal while Table A.2.2 contains the weldment data. The most prominent aging conditions were 6,000 and 12,000 hours at 675ºC. These conditions were chosen, in part, on the TTT diagram (figure 5.3) to cause precipitation of the M23C6 and M6C carbides as well as the Co3W intermetallic phase. The formation of the Co2W Laves phase has also been reported at 700ºC for short times and extension of this curve of the TTT diagram suggests this condition would precipitate this phase as well. The precipitation of the carbide and intermetallic phases has long been known to embrittle alloy 25 causing a decrease in the tensile and impact ductility [13-16]. However, most of these studies investigated short-time aging conditions at temperatures of 760ºC and higher, and thus a lower temperature longer-time aging condition at 675ºC was chosen for this study.
Figure 6.1 shows the yield strength (YS) and ultimate tensile strength (UTS) as function of temperature for alloy 25 base metal and weldments including aging at 675ºC for 6,000 and 12,000 hours. Examination of the plot shows that for each aging condition, the sheet base metal (BM) and the weldment (WM) had the same properties. Since all of the sheet weldment test specimens broke in the base metal, it is expected that the base metal will govern properties. In the machining of the specimens, the weld crown was not removed, thus the weld metal was essentially mechanically reinforced due to a larger cross-sectional area. However, the heat-affected zone (HAZ) of the weldment is not reinforced. Therefore, the tensile data show that welding does not degrade the room and high-temperature tensile properties of Haynes alloy 25. A few tests on the bar weldments (Bar WM) were conducted at room temperature and at 650ºC. In general, these showed the YS and UTS were slightly higher compared to the as-received and aged sheet products, but one data point fell slightly below the data for the sheet pieces. In contrast to the data for sheet pieces, the non-aged bar materials failed in the weldment, so these data are measures of weldment strength. The higher yield strength of the bar material may be due to a grain size effect. The grain size of the bar is finer, figure 3.1, compared to the sheet material. Generally, finer grain size, for the same material, results in higher low-temperature yield strength. Under this assumption of higher strength in the bar, the initial yielding of the bar specimen may have occurred in the weldment region eventually causing failure in the weldment whereas initial yielding in the sheet weldment was in the base metal leading to failure in the base metal. After aging, the bar weldments failed in the base metal similar to the sheet product. All of the data fell within typical scatter for tensile data. Thus, the data suggest that the bar product may have slightly better unaged tensile properties compared to sheet product, but there are no sufficient data to determine whether or not these differences are statistically significant.
Figure 6.1 also shows the dramatic effect aging has on alloy 25 strength. Aging at 675ºC for 6,000 hours improves the YS of the material by about 300MPa from room temperature to 650ºC. The magnitude of this effect decreases with further increasing temperature and no difference in YS is observed at 1,000ºC. A similar but less dramatic effect is observed for the UTS. At room temperature, little difference is observed, but the UTS is improved in the range of 300 to 800ºC by about 100 MPa. As with YS, aging at 675ºC has no effect on UTS at 1,000ºC and above. Also, aging for 12,000 hours at 675ºC does not cause further changes in YS and UTS.
19
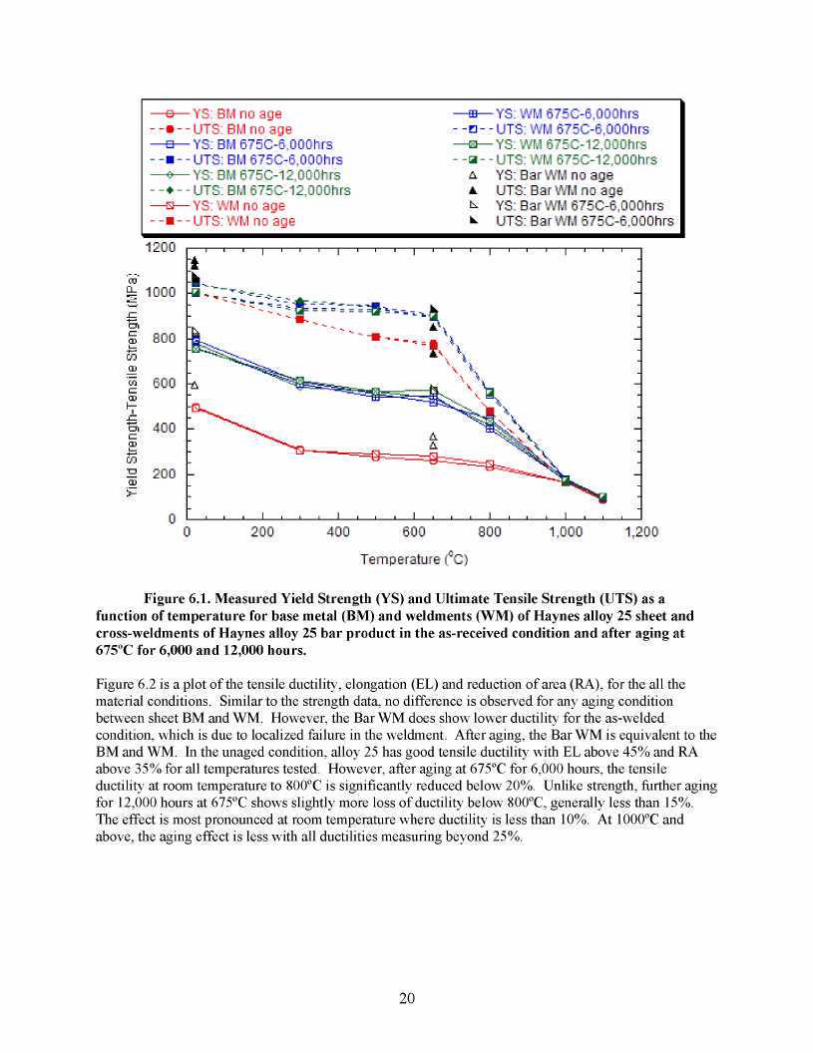
Figure 6.1. Measured Yield Strength (YS) and Ultimate Tensile Strength (UTS) as a function of temperature for base metal (BM) and weldments (WM) of Haynes alloy 25 sheet and cross-weldments of Haynes alloy 25 bar product in the as-received condition and after aging at 675ºC for 6,000 and 12,000 hours.
Figure 6.2 is a plot of the tensile ductility, elongation (EL) and reduction of area (RA), for the all the material conditions. Similar to the strength data, no difference is observed for any aging condition between sheet BM and WM. However, the Bar WM does show lower ductility for the as-welded condition, which is due to localized failure in the weldment. After aging, the Bar WM is equivalent to the BM and WM. In the unaged condition, alloy 25 has good tensile ductility with EL above 45% and RA above 35% for all temperatures tested. However, after aging at 675ºC for 6,000 hours, the tensile ductility at room temperature to 800ºC is significantly reduced below 20%. Unlike strength, further aging for 12,000 hours at 675ºC shows slightly more loss of ductility below 800ºC, generally less than 15%. The effect is most pronounced at room temperature where ductility is less than 10%. At 1000ºC and above, the aging effect is less with all ductilities measuring beyond 25%.
20
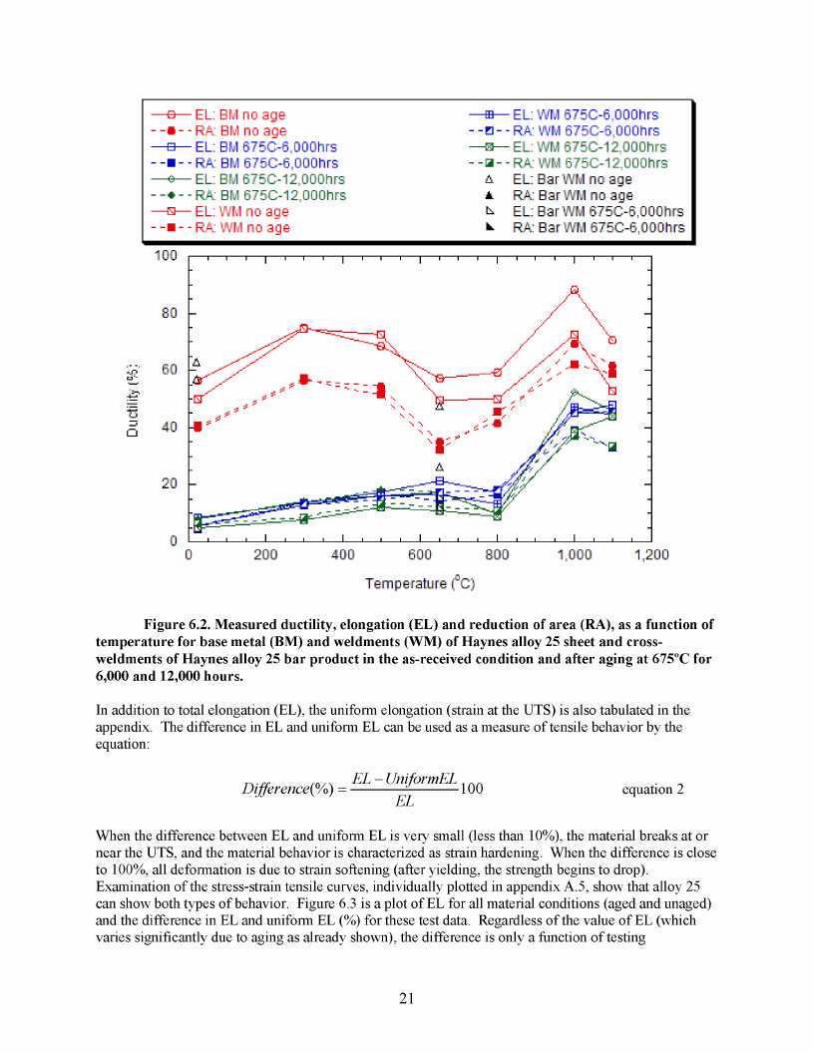
Figure 6.2. Measured ductility, elongation (EL) and reduction of area (RA), as a function of temperature for base metal (BM) and weldments (WM) of Haynes alloy 25 sheet and cross-weldments of Haynes alloy 25 bar product in the as-received condition and after aging at 675ºC for 6,000 and 12,000 hours.
In addition to total elongation (EL), the uniform elongation (strain at the UTS) is also tabulated in the appendix. The difference in EL and uniform EL can be used as a measure of tensile behavior by the equation:
Difference(%) EL -UniformEL
100 EL
equation 2
When the difference between EL and uniform EL is very small (less than 10%), the material breaks at or near the UTS, and the material behavior is characterized as strain hardening. When the difference is close to 100%, all deformation is due to strain softening (after yielding, the strength begins to drop). Examination of the stress-strain tensile curves, individually plotted in appendix A.5, show that alloy 25 can show both types of behavior. Figure 6.3 is a plot of EL for all material conditions (aged and unaged) and the difference in EL and uniform EL (%) for these test data. Regardless of the value of EL (which varies significantly due to aging as already shown), the difference is only a function of testing
21
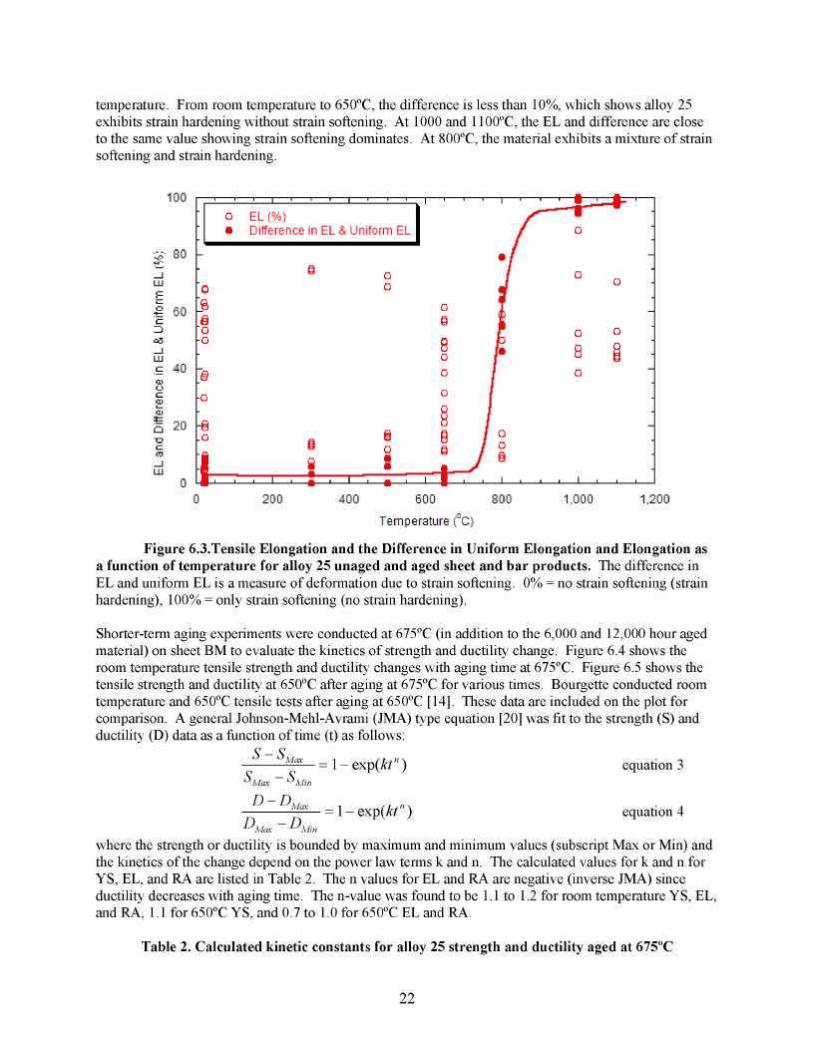
temperature. From room temperature to 650ºC, the difference is less than 10%, which shows alloy 25 exhibits strain hardening without strain softening. At 1000 and 1100ºC, the EL and difference are close to the same value showing strain softening dominates. At 800ºC, the material exhibits a mixture of strain softening and strain hardening.
Figure 6.3.Tensile Elongation and the Difference in Uniform Elongation and Elongation as a function of temperature for alloy 25 unaged and aged sheet and bar products. The difference in EL and uniform EL is a measure of deformation due to strain softening. 0% = no strain softening (strain hardening), 100% = only strain softening (no strain hardening).
Shorter-term aging experiments were conducted at 675ºC (in addition to the 6,000 and 12,000 hour aged material) on sheet BM to evaluate the kinetics of strength and ductility change. Figure 6.4 shows the room temperature tensile strength and ductility changes with aging time at 675ºC. Figure 6.5 shows the tensile strength and ductility at 650ºC after aging at 675ºC for various times. Bourgette conducted room temperature and 650ºC tensile tests after aging at 650ºC [14]. These data are included on the plot for comparison. A general Johnson-Mehl-Avrami (JMA) type equation [20] was fit to the strength (S) and ductility (D) data as a function of time (t) as follows:
s-s SMax - S
D-D
D D
= 1-exp(fo")
= 1-exp(fo")
equation 3
equation 4
where the strength or ductility is bounded by maximum and minimum values (subscript Max or Min) and the kinetics of the change depend on the power law terms k and n. The calculated values for k and n for YS, EL, and RA are listed in Table 2. The n values for EL and RA are negative (inverse JMA) since ductility decreases with aging time. The n-value was found to be 1.1 to 1.2 for room temperature YS, EL, and RA, 1.1 for 650ºC YS, and 0.7 to 1.0 for 650ºC EL and RA.
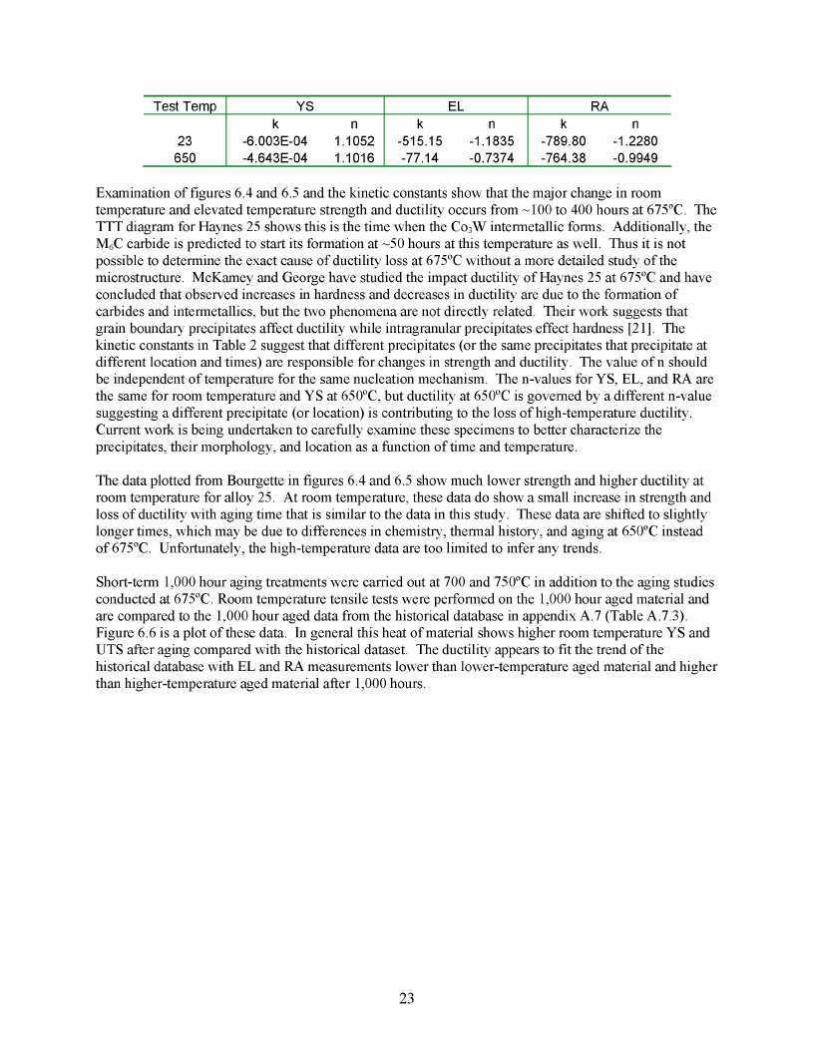
Table 2. Calculated kinetic constants for alloy 25 strength and ductility aged at 675ºC
Max
22
Test Temp
23 650
YS k n
-6.003E-04 1.1052 -4.643E-04 1.1016
EL k n
-515.15 -1.1835 -77.14 -0.7374
RA k n
-789.80 -1.2280 -764.38 -0.9949
Examination of figures 6.4 and 6.5 and the kinetic constants show that the major change in room temperature and elevated temperature strength and ductility occurs from ~100 to 400 hours at 675ºC. The TTT diagram for Haynes 25 shows this is the time when the Co3W intermetallic forms. Additionally, the M6C carbide is predicted to start its formation at ~50 hours at this temperature as well. Thus it is not possible to determine the exact cause of ductility loss at 675ºC without a more detailed study of the microstructure. McKamey and George have studied the impact ductility of Haynes 25 at 675ºC and have concluded that observed increases in hardness and decreases in ductility are due to the formation of carbides and intermetallics, but the two phenomena are not directly related. Their work suggests that grain boundary precipitates affect ductility while intragranular precipitates effect hardness [21]. The kinetic constants in Table 2 suggest that different precipitates (or the same precipitates that precipitate at different location and times) are responsible for changes in strength and ductility. The value of n should be independent of temperature for the same nucleation mechanism. The n-values for YS, EL, and RA are the same for room temperature and YS at 650ºC, but ductility at 650ºC is governed by a different n-value suggesting a different precipitate (or location) is contributing to the loss of high-temperature ductility. Current work is being undertaken to carefully examine these specimens to better characterize the precipitates, their morphology, and location as a function of time and temperature.
The data plotted from Bourgette in figures 6.4 and 6.5 show much lower strength and higher ductility at room temperature for alloy 25. At room temperature, these data do show a small increase in strength and loss of ductility with aging time that is similar to the data in this study. These data are shifted to slightly longer times, which may be due to differences in chemistry, thermal history, and aging at 650ºC instead of 675ºC. Unfortunately, the high-temperature data are too limited to infer any trends.
Short-term 1,000 hour aging treatments were carried out at 700 and 750ºC in addition to the aging studies conducted at 675ºC. Room temperature tensile tests were performed on the 1,000 hour aged material and are compared to the 1,000 hour aged data from the historical database in appendix A.7 (Table A.7.3). Figure 6.6 is a plot of these data. In general this heat of material shows higher room temperature YS and UTS after aging compared with the historical dataset. The ductility appears to fit the trend of the historical database with EL and RA measurements lower than lower-temperature aged material and higher than higher-temperature aged material after 1,000 hours.
23
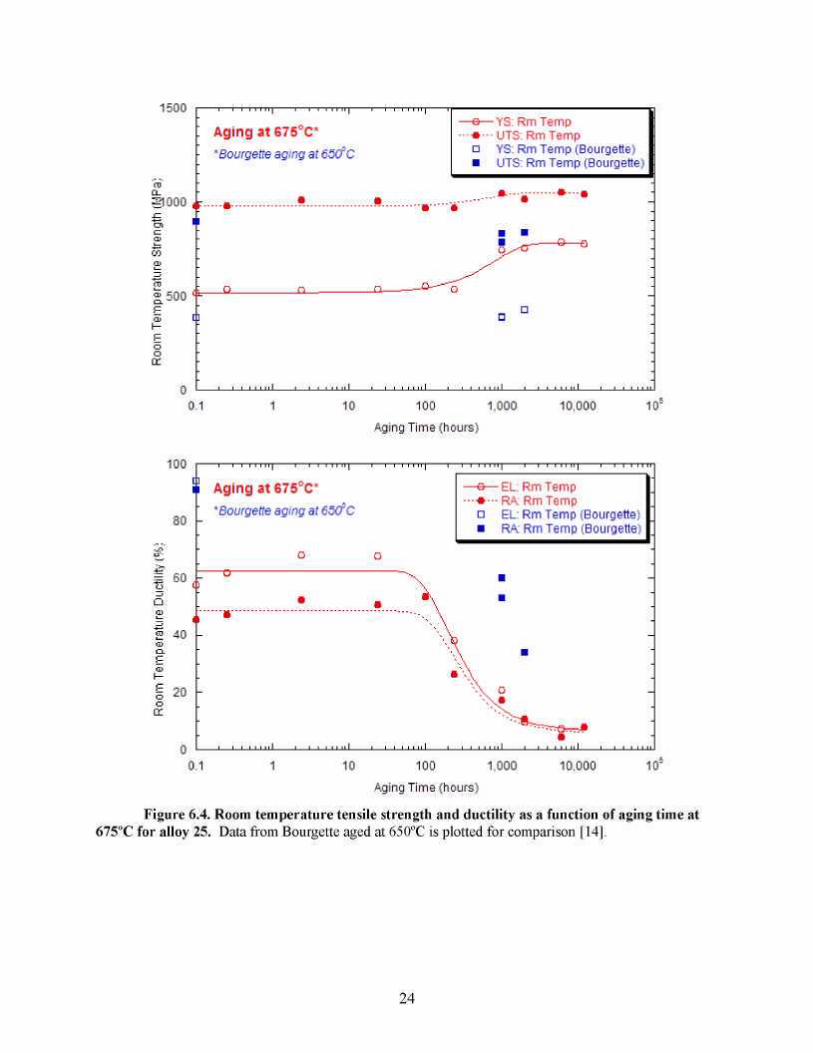
Figure 6.4. Room temperature tensile strength and ductility as a function of aging time at 675ºC for alloy 25. Data from Bourgette aged at 650ºC is plotted for comparison [14].
24
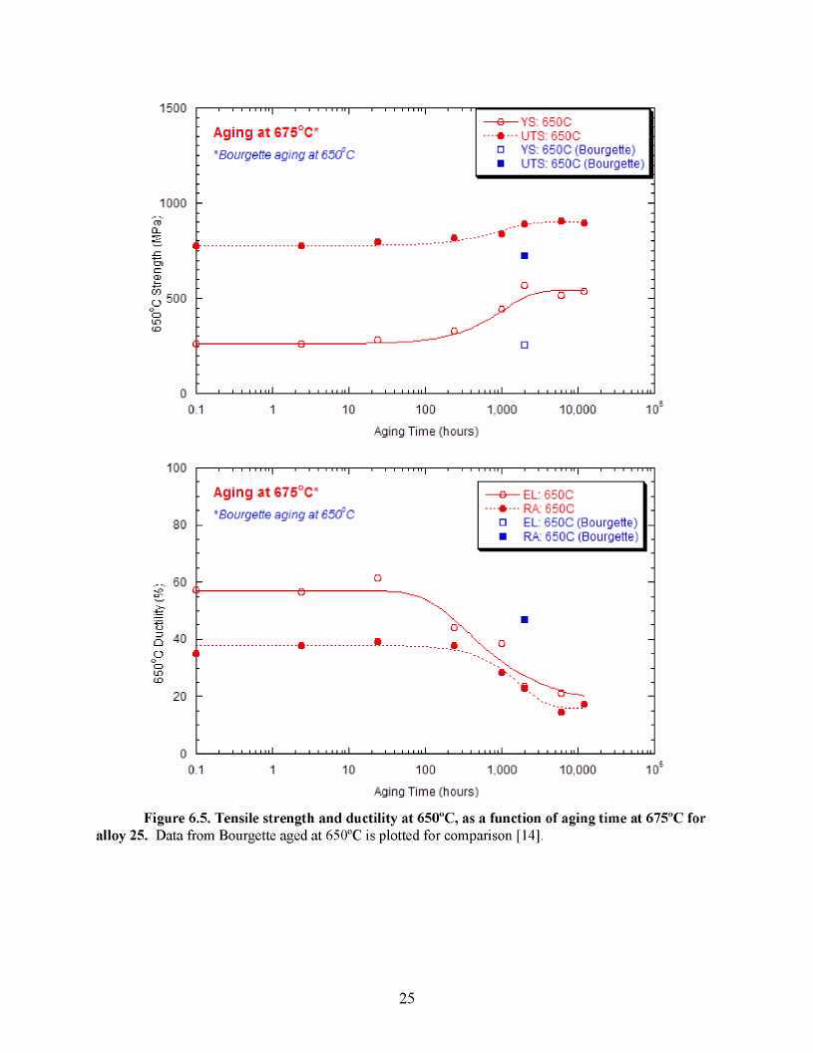
Figure 6.5. Tensile strength and ductility at 650°C, as a function of aging time at 675°C for alloy 25. Data from Bourgette aged at 650ºC is plotted for comparison [14].
25
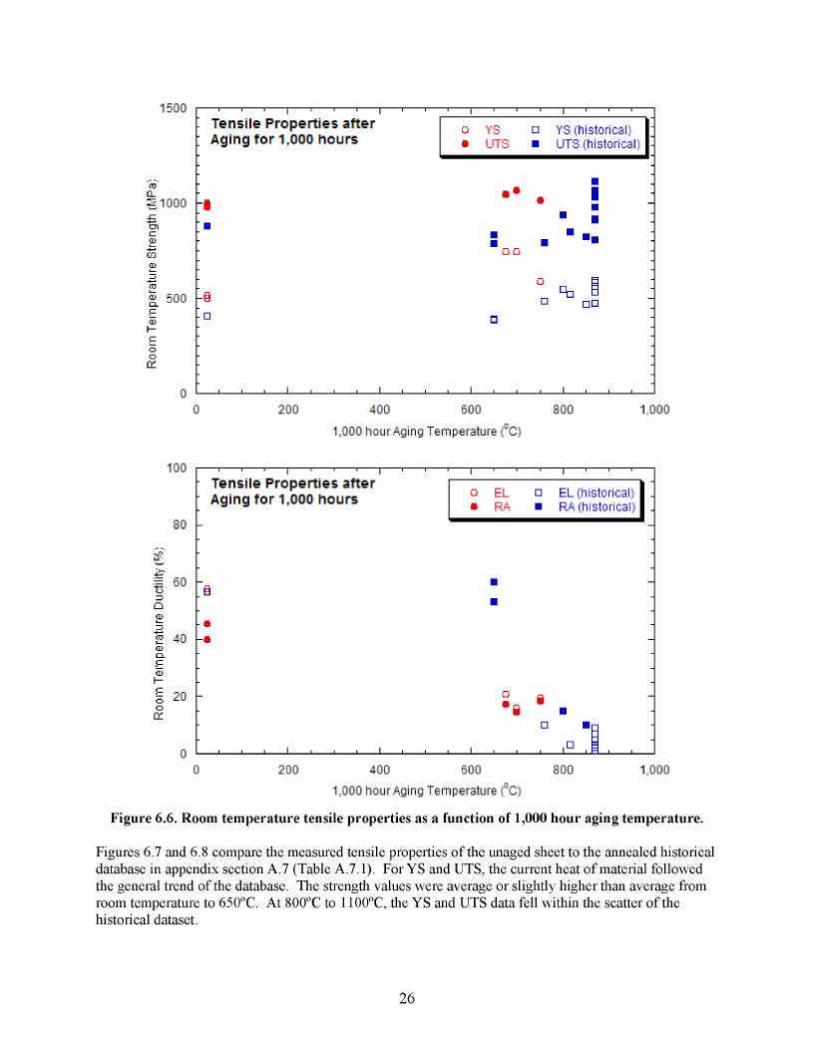
Figure 6.6. Room temperature tensile properties as a function of 1,000 hour aging temperature.
Figures 6.7 and 6.8 compare the measured tensile properties of the unaged sheet to the annealed historical database in appendix section A.7 (Table A.7.1). For YS and UTS, the current heat of material followed the general trend of the database. The strength values were average or slightly higher than average from room temperature to 650ºC. At 800ºC to 1100ºC, the YS and UTS data fell within the scatter of the historical dataset.
26
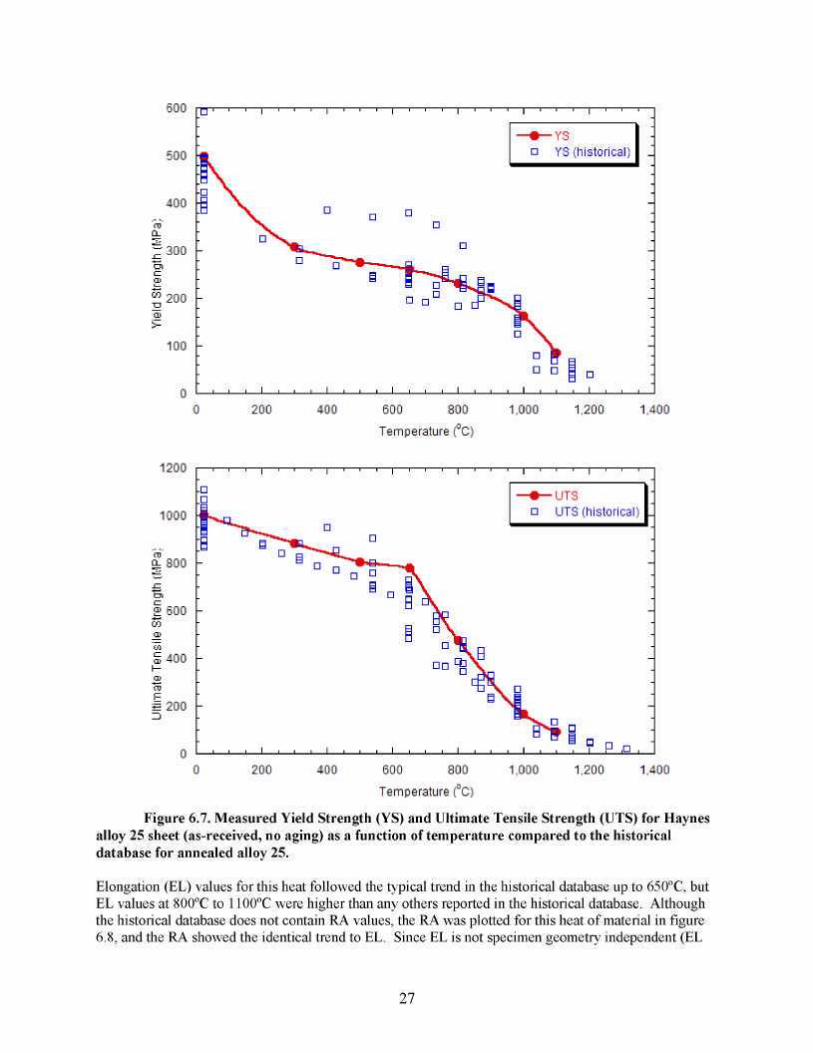
Figure 6.7. Measured Yield Strength (YS) and Ultimate Tensile Strength (UTS) for Haynes alloy 25 sheet (as-received, no aging) as a function of temperature compared to the historical database for annealed alloy 25.
Elongation (EL) values for this heat followed the typical trend in the historical database up to 650ºC, but EL values at 800ºC to 1100ºC were higher than any others reported in the historical database. Although the historical database does not contain RA values, the RA was plotted for this heat of material in figure 6.8, and the RA showed the identical trend to EL. Since EL is not specimen geometry independent (EL
27
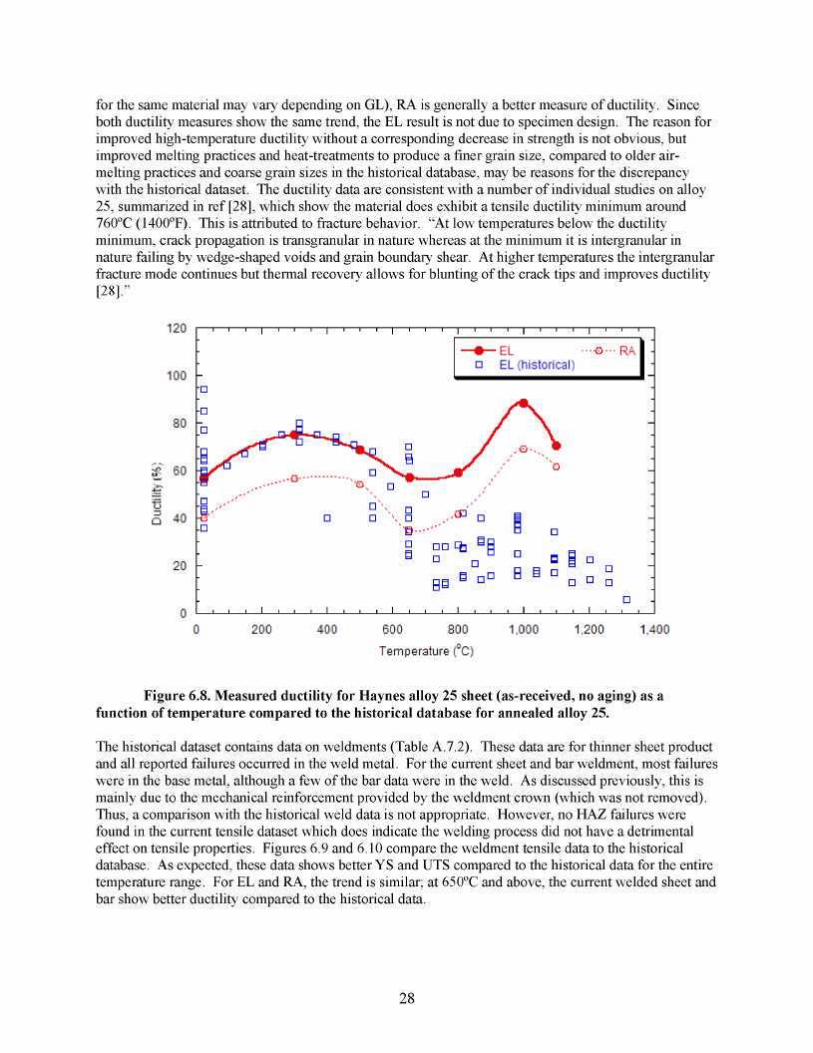
for the same material may vary depending on GL), RA is generally a better measure of ductility. Since both ductility measures show the same trend, the EL result is not due to specimen design. The reason for improved high-temperature ductility without a corresponding decrease in strength is not obvious, but improved melting practices and heat-treatments to produce a finer grain size, compared to older air-melting practices and coarse grain sizes in the historical database, may be reasons for the discrepancy with the historical dataset. The ductility data are consistent with a number of individual studies on alloy 25, summarized in ref [28], which show the material does exhibit a tensile ductility minimum around 760ºC (1400ºF). This is attributed to fracture behavior. “At low temperatures below the ductility minimum, crack propagation is transgranular in nature whereas at the minimum it is intergranular in nature failing by wedge-shaped voids and grain boundary shear. At higher temperatures the intergranular fracture mode continues but thermal recovery allows for blunting of the crack tips and improves ductility [28].”
Figure 6.8. Measured ductility for Haynes alloy 25 sheet (as-received, no aging) as a function of temperature compared to the historical database for annealed alloy 25.
The historical dataset contains data on weldments (Table A.7.2). These data are for thinner sheet product and all reported failures occurred in the weld metal. For the current sheet and bar weldment, most failures were in the base metal, although a few of the bar data were in the weld. As discussed previously, this is mainly due to the mechanical reinforcement provided by the weldment crown (which was not removed). Thus, a comparison with the historical weld data is not appropriate. However, no HAZ failures were found in the current tensile dataset which does indicate the welding process did not have a detrimental effect on tensile properties. Figures 6.9 and 6.10 compare the weldment tensile data to the historical database. As expected, these data shows better YS and UTS compared to the historical data for the entire temperature range. For EL and RA, the trend is similar; at 650ºC and above, the current welded sheet and bar show better ductility compared to the historical data.
28
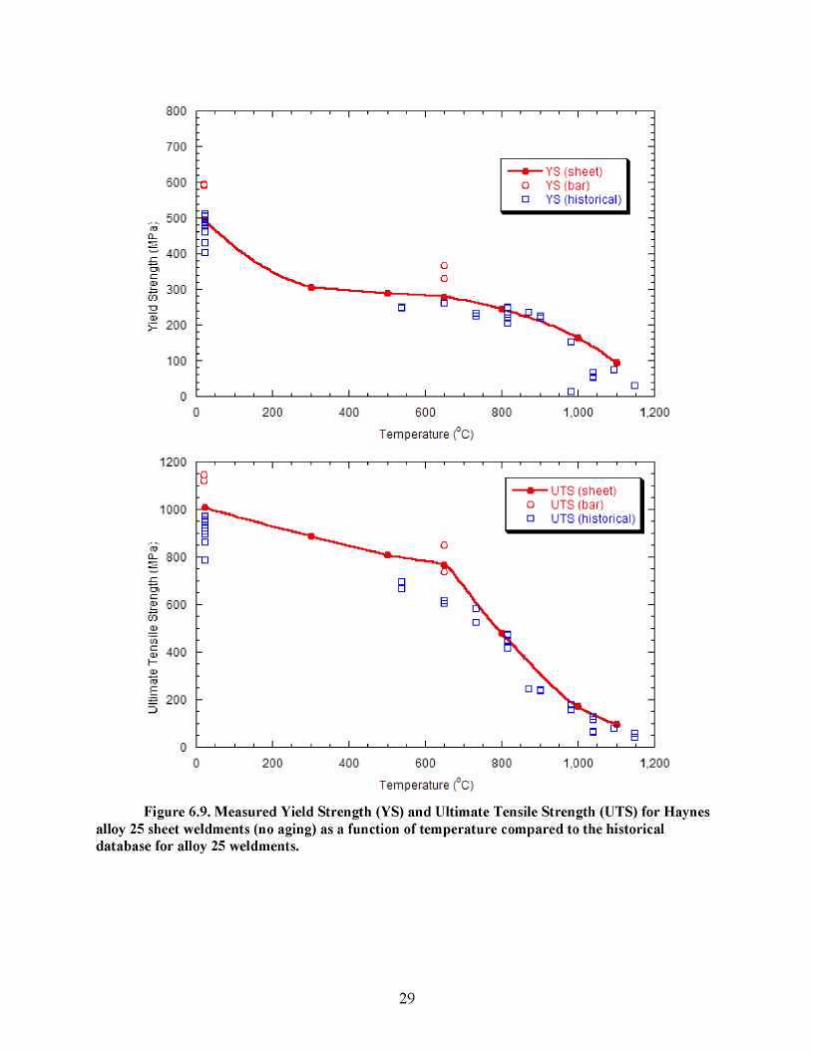
Figure 6.9. Measured Yield Strength (YS) and Ultimate Tensile Strength (UTS) for Haynes alloy 25 sheet weldments (no aging) as a function of temperature compared to the historical database for alloy 25 weldments.
29
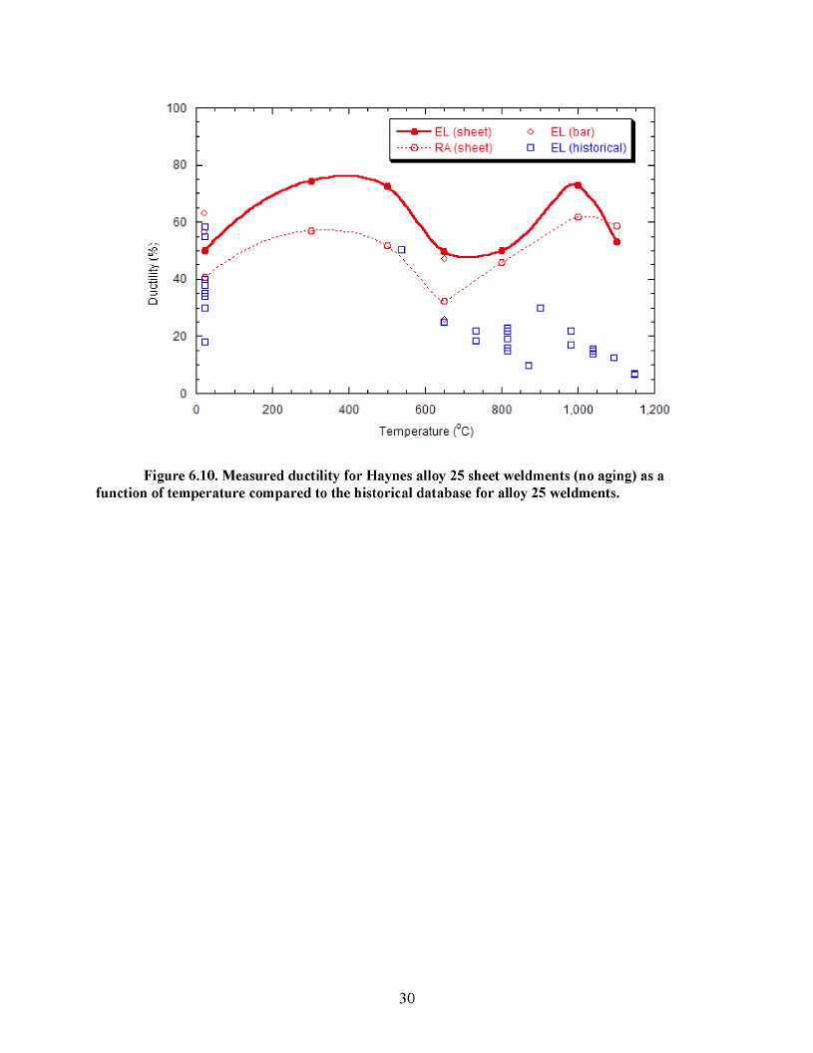
Figure 6.10. Measured ductility for Haynes alloy 25 sheet weldments (no aging) as a function of temperature compared to the historical database for alloy 25 weldments.
30
7. CREEP PROPERTIES RESULTS AND DISCUSSION
Uniaxial creep and creep-rupture tests were performed on alloy 25 sheet and weldments in the unaged and aged for 6,000 hour at 675ºC condition and alloy 25 bar weldments in the unaged condition. Tests were conducted from 600ºC to 950ºC for times exceeding 40,000 hours. The results of these tests are presented in tabular form in appendix section A.3 (Tables A.3.1 and A.3.2). The corresponding creep strain versus time curves are included in appendix A.6. Tubular creep-rupture tests (internally pressurized tubular specimens machined from bar stock) were conducted from 675ºC to 950ºC for times exceeding 22,000 hours. Internal pressures ranged from 8.3 to 42.7 MPa (1,200 to 6,200 psi).
7.1 UNIAXIAL RUPTURE RESULTS
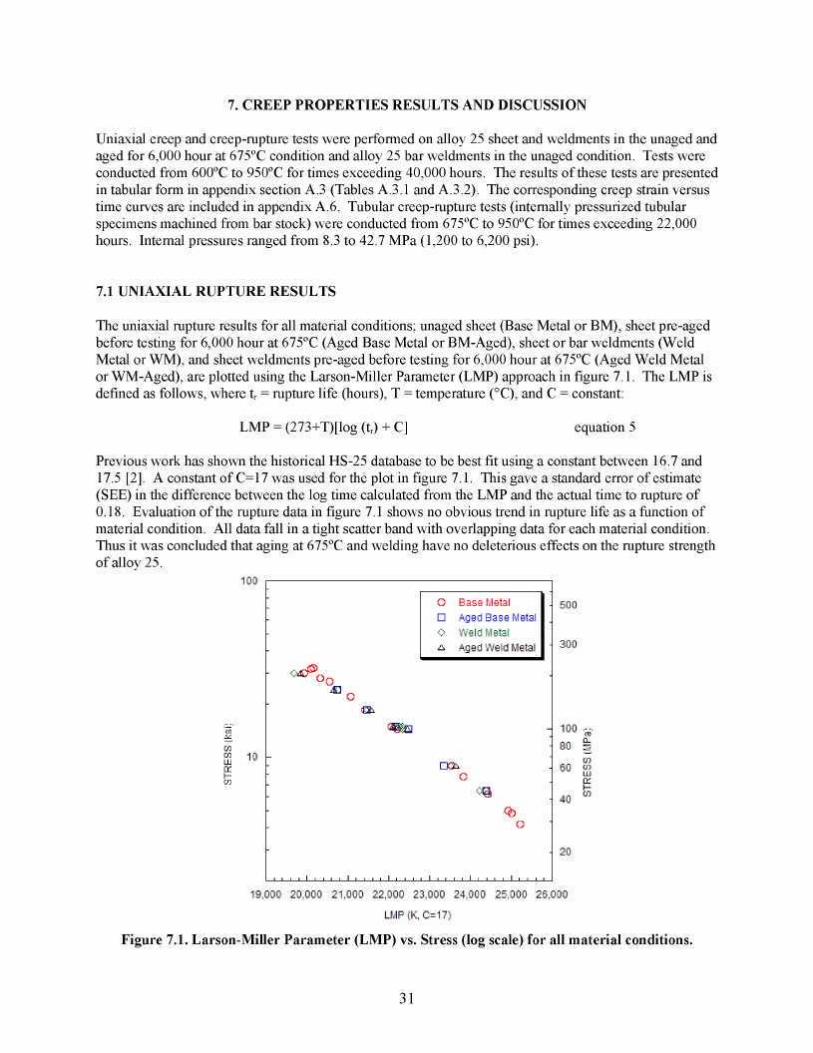
The uniaxial rupture results for all material conditions; unaged sheet (Base Metal or BM), sheet pre-aged before testing for 6,000 hour at 675ºC (Aged Base Metal or BM-Aged), sheet or bar weldments (Weld Metal or WM), and sheet weldments pre-aged before testing for 6,000 hour at 675ºC (Aged Weld Metal or WM-Aged), are plotted using the Larson-Miller Parameter (LMP) approach in figure 7.1. The LMP is defined as follows, where tr = rupture life (hours), T = temperature (°C), and C = constant:
LMP = (273+T)[log (tr) + C] equation 5
Previous work has shown the historical HS-25 database to be best fit using a constant between 16.7 and 17.5 [2]. A constant of C=17 was used for the plot in figure 7.1. This gave a standard error of estimate (SEE) in the difference between the log time calculated from the LMP and the actual time to rupture of 0.18. Evaluation of the rupture data in figure 7.1 shows no obvious trend in rupture life as a function of material condition. All data fall in a tight scatter band with overlapping data for each material condition. Thus it was concluded that aging at 675ºC and welding have no deleterious effects on the rupture strength of alloy 25.
Figure 7.1. Larson-Miller Parameter (LMP) vs. Stress (log scale) for all material conditions.
31
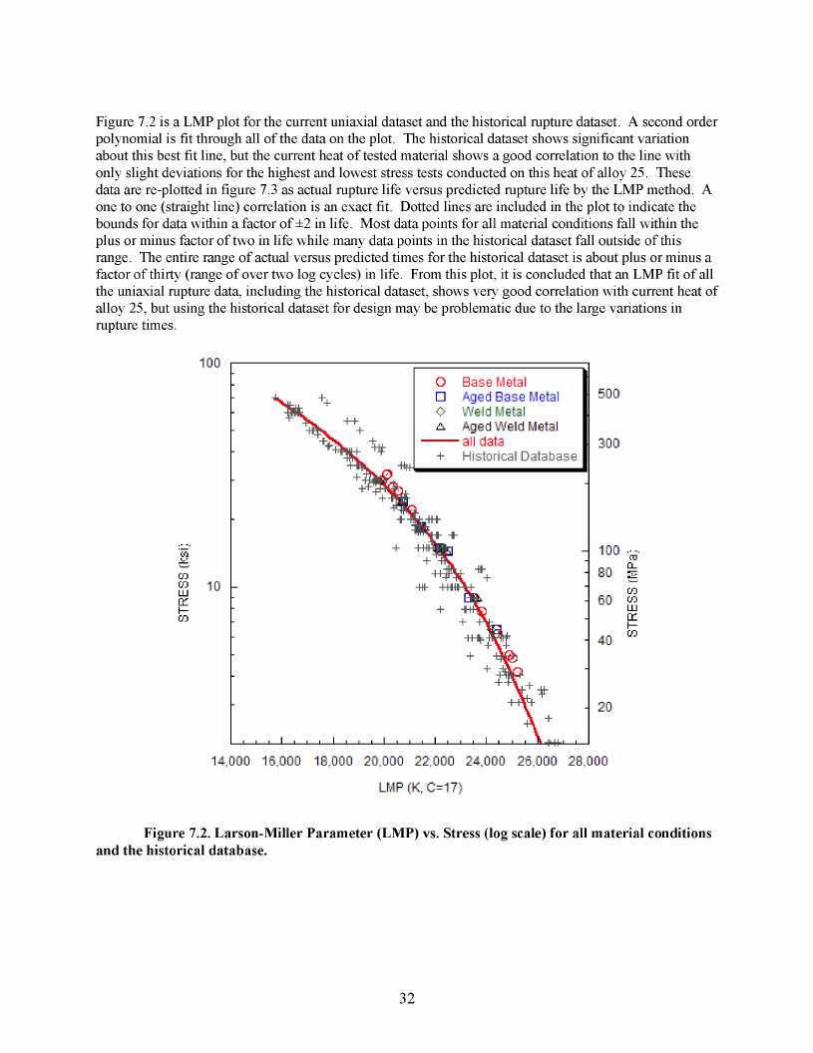
Figure 7.2 is a LMP plot for the current uniaxial dataset and the historical rupture dataset. A second order polynomial is fit through all of the data on the plot. The historical dataset shows significant variation about this best fit line, but the current heat of tested material shows a good correlation to the line with only slight deviations for the highest and lowest stress tests conducted on this heat of alloy 25. These data are re-plotted in figure 7.3 as actual rupture life versus predicted rupture life by the LMP method. A one to one (straight line) correlation is an exact fit. Dotted lines are included in the plot to indicate the bounds for data within a factor of ±2 in life. Most data points for all material conditions fall within the plus or minus factor of two in life while many data points in the historical dataset fall outside of this range. The entire range of actual versus predicted times for the historical dataset is about plus or minus a factor of thirty (range of over two log cycles) in life. From this plot, it is concluded that an LMP fit of all the uniaxial rupture data, including the historical dataset, shows very good correlation with current heat of alloy 25, but using the historical dataset for design may be problematic due to the large variations in rupture times.
Figure 7.2. Larson-Miller Parameter (LMP) vs. Stress (log scale) for all material conditions and the historical database.
32
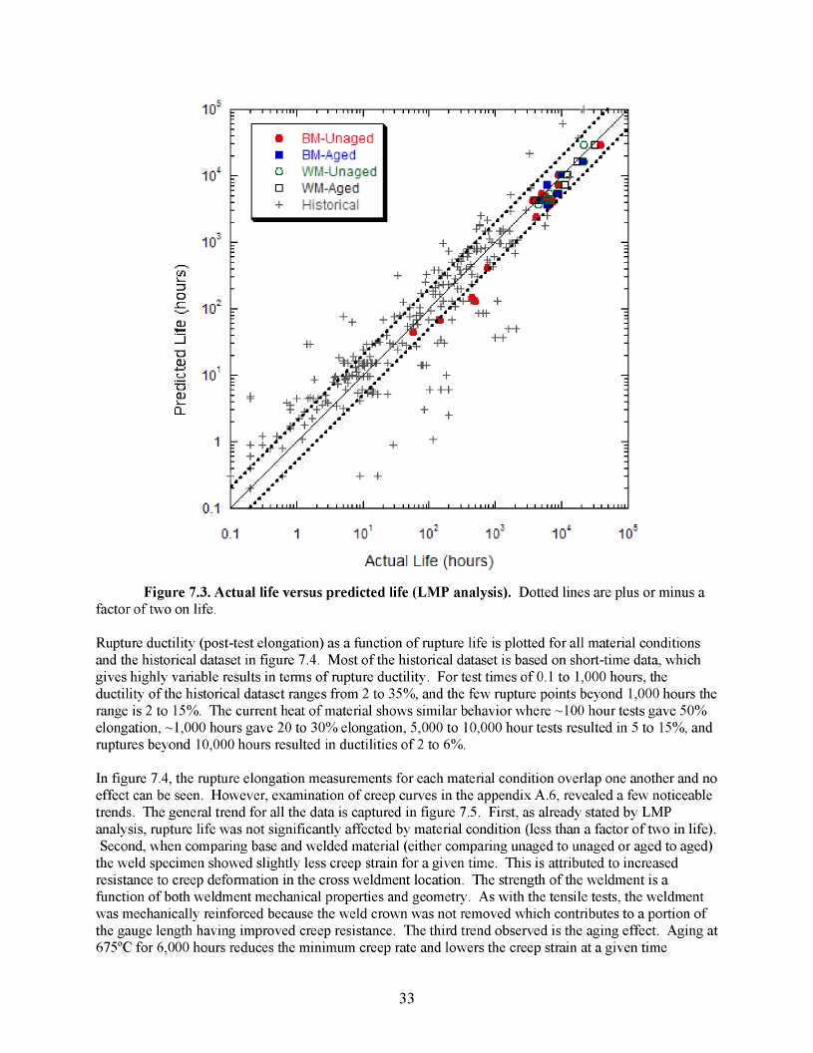
Figure 7.3. Actual life versus predicted life (LMP analysis). Dotted lines are plus or minus a factor of two on life.
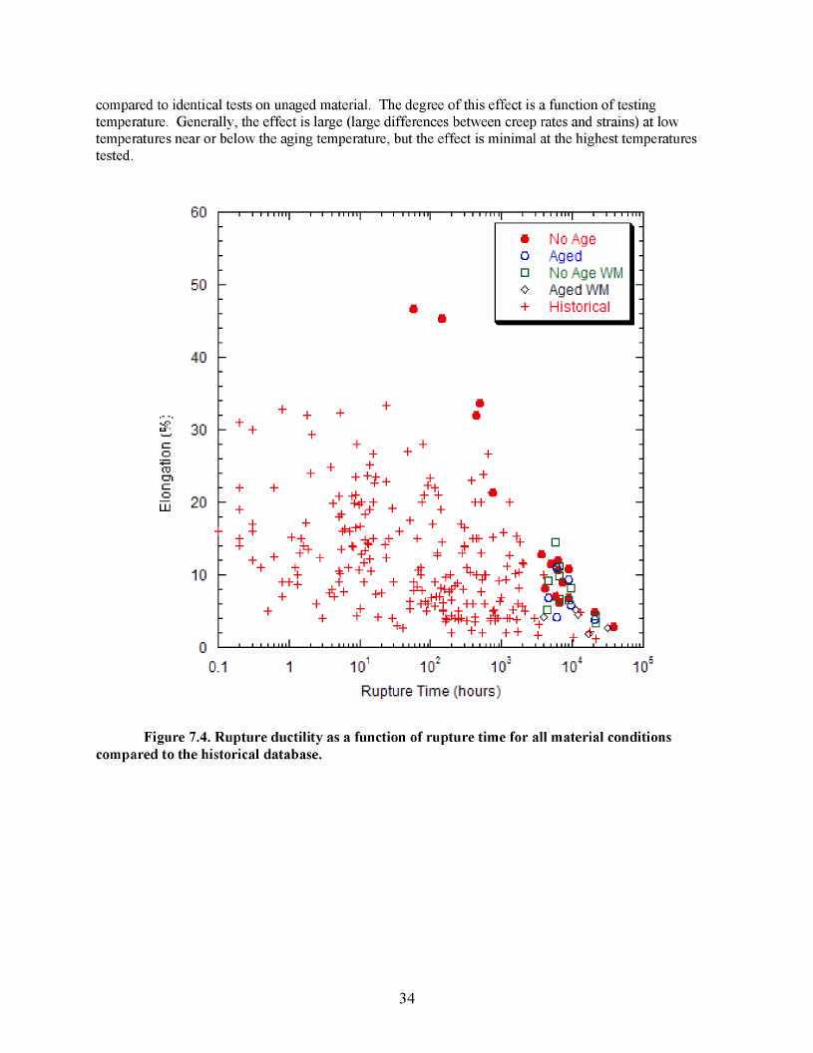
Rupture ductility (post-test elongation) as a function of rupture life is plotted for all material conditions and the historical dataset in figure 7.4. Most of the historical dataset is based on short-time data, which gives highly variable results in terms of rupture ductility. For test times of 0.1 to 1,000 hours, the ductility of the historical dataset ranges from 2 to 35%, and the few rupture points beyond 1,000 hours the range is 2 to 15%. The current heat of material shows similar behavior where ~100 hour tests gave 50% elongation, ~1,000 hours gave 20 to 30% elongation, 5,000 to 10,000 hour tests resulted in 5 to 15%, and ruptures beyond 10,000 hours resulted in ductilities of 2 to 6%.
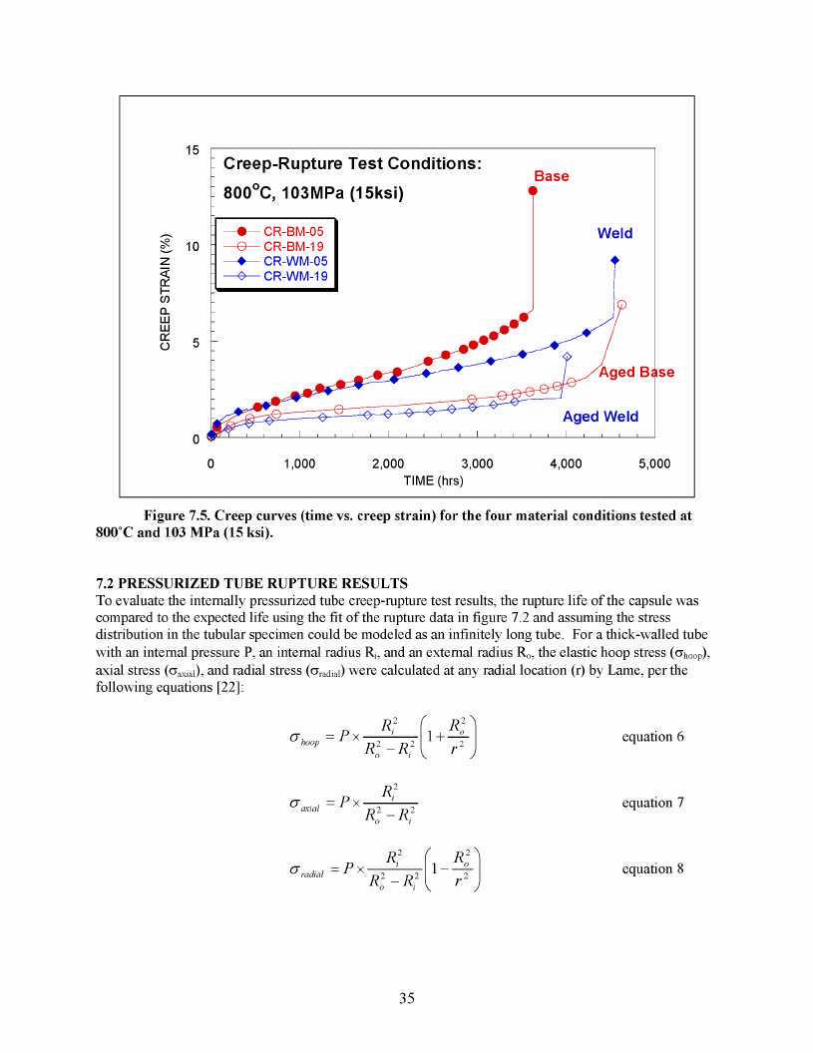
In figure 7.4, the rupture elongation measurements for each material condition overlap one another and no effect can be seen. However, examination of creep curves in the appendix A.6, revealed a few noticeable trends. The general trend for all the data is captured in figure 7.5. First, as already stated by LMP analysis, rupture life was not significantly affected by material condition (less than a factor of two in life). Second, when comparing base and welded material (either comparing unaged to unaged or aged to aged)
the weld specimen showed slightly less creep strain for a given time. This is attributed to increased resistance to creep deformation in the cross weldment location. The strength of the weldment is a function of both weldment mechanical properties and geometry. As with the tensile tests, the weldment was mechanically reinforced because the weld crown was not removed which contributes to a portion of the gauge length having improved creep resistance. The third trend observed is the aging effect. Aging at 675ºC for 6,000 hours reduces the minimum creep rate and lowers the creep strain at a given time
33
compared to identical tests on unaged material. The degree of this effect is a function of testing temperature. Generally, the effect is large (large differences between creep rates and strains) at low temperatures near or below the aging temperature, but the effect is minimal at the highest temperatures tested.
Figure 7.4. Rupture ductility as a function of rupture time for all material conditions compared to the historical database.
34
15
10
Creep-Rupture Test Conditions: 800 C, 103MPa (15ksi)
Base
-% CR-BM-05 -0— CR-BM-19 -♦— CR-WM-05 -0— CR-WM-19
Weld ♦
Aged Base
Aged Weld
1,000 2,000 3,000 TIME (hrs)
4,000 5,000
Figure 7.5. Creep curves (time vs. creep strain) for the four material conditions tested at 800˚C and 103 MPa (15 ksi).
7.2 PRESSURIZED TUBE RUPTURE RESULTS To evaluate the internally pressurized tube creep-rupture test results, the rupture life of the capsule was compared to the expected life using the fit of the rupture data in figure 7.2 and assuming the stress distribution in the tubular specimen could be modeled as an infinitely long tube. For a thick-walled tube with an internal pressure P, an internal radius R, and an external radius Ro, the elastic hoop stress (ahoop), axial stress (aaxial), and radial stress (aradial) were calculated at any radial location (r) by Lame, per the following equations [22]:
°h hoop Px R2
R2 -R
2
1-3̂ v r 2 J
equation 6
R axial 2 2
R-R equation 7
Px R2 ^radial 2 2
Ro-Ri V 1-K 2
equation 8
5
0
0
2
r
35
When creep deformation is considered, the Lame equations may not be applicable depending on the wall thickness. During creep, high stresses can relax. When this happens, the stresses are transferred to lower stress areas within the structure. The speed and the degree at which this happens are governed by the creep properties of the material. For simplicity, Bailey assumed the material’s creep behavior could be modeled using only steady-state creep with a power-law dependence. Using this assumption, for a power-law exponent of n, the stress distribution is described as follows [22]:
[(2-n)/n(R /r)2/n+1 Gh =Px A o equation 9
oop (Ro/R 2/n -1
a = P x ^ '^)-—- equation 10 axial (Ro/Rif'n-1
(R /r)2/n - 1 a = - P x o equation 11
radial (Ro / R 2 / n - 1
When n equals 1, i.e. when the creep-rate has a linear stress dependence, then the Bailey solution becomes the Lame solution.
In order to evaluate the internally pressurized tube rupture data using the Lame and Bailey equations, a single stress value for each test is needed. Two criteria (yield surfaces) were used; the Von Mises (VM) and the Stress Intensity (SI). The VM takes into account all three stresses (radial, axial, and hoop):
(cr, -a2)2 +(a2 - c O 2 +(cr3 - c O 2
OVM = J 1 - — ^ — equation 12
The SI is simply two times the Tresca stress or the maximum principal stress minus the minimum principal stress:
GSI = crmax - crmin equation 13
An alternative approach to evaluating rupture in structures is the reference stress approach [23]. The reference stress approach is based on a limit load analysis of a perfectly plastic material. The basis assumption in this approach is that there are similarities between creep and plasticity. For a structure subjected to complex loading in creep, after sufficient time, internal stresses will redistribute and reach a steady-state condition that can be described by the plastic solution (limit load) for the structure. The result of the limit load analysis for a given geometry combined with a yield criteria (typically Tresca) is a single reference stress (areference), which governs the creep deformation in the structure and is independent of material (as long as the material is not creep brittle) [24]. For an infinitely long tube, the reference stress (Tresca) is [24]:
(7r = equation 14 reference l n ( Ro / Ri )
36
This equation has been shown to give the best correlation with available experimental data compared to various ASME Boiler and Pressure Vessel (B&PV) Code rules for cylindrical sections with varying wall thickness that have crept under internal pressure [25]. The use of the equation was recently (2005) accepted in the ASME B&PV Code Section I as an alternative method for determining wall thickness of tubes and pipe in boilers.
The VM criterion was applied to the inner diameter (ID) and outer diameter (OD) stresses calculated for both the Lame and Bailey solutions. A value of n=8 was used for the creep calculations. This value was determined by evaluating the creep data for this heat of alloy 25 (discussed later in this section) and is consistent with other observations of creep in the alloy [29, 30]. Furthermore, the analysis is very sensitive to n only in the range of n=1 to n=4. Changing n from 6 to 10 has little effect on calculated stresses. The SI was applied to the ID and OD for the Bailey creep solution, and the reference stress was also evaluated. The rupture time for each stress calculated by each method was then compared with the predicted rupture life for that stress value by evaluation of the LMP fit of the uniaxial data. Figures 7.6 and 7.7 show the results for each analysis as actual life versus predicted life. A one-to-one correlation is a perfect fit of the data, and dashed lines at a factor of plus or minus two in life are included on each plot. Several ruptures are identified in each plot. For the standard tube without any pre-aging and exhibiting a longitudinal rupture originating in the tube, the identification is No Age. For a standard tube without pre-aging that had a rupture initiate in the tubular specimen weldment, the identification is No Age-WM. For a standard tube without pre-aging that had a rupture in the tubular specimen cap, the identification is “No Age – Cap”. For the tube specimens pre-aged for 6,000 hours at 675ºC, the identification is “Aged”.
Each plot also includes a fit of a straight line (power-law fit on log-log plot) to see how well each model followed a one-to-one correlation. This line was fit to a censored dataset. To censor the dataset, the non-typical ruptures were removed (No Age-WM and No Age-Cap) and the rupture results on aged capsule test conducted at 750ºC were also removed due to observed aging effects in creep deformation. The aged capsules tested at 850 to 950ºC were included in the censored dataset along with the typical ruptures of unaged material because it was judged that aging at 675ºC had little effect on creep behavior at and above 850ºC. This was based on experimental observations of creep deformation of aged material in uniaxial creep tests where creep rates were similar at the highest testing temperatures (850ºC and above) regardless of aging condition. A comparison of the tube ruptures, later in this section, with the uniaxial data shows that the 750ºC test on aged material exhibited consistently longer life than expected compared to the aged tubes tested at 850ºC and above which were within the scatter of the data.
37
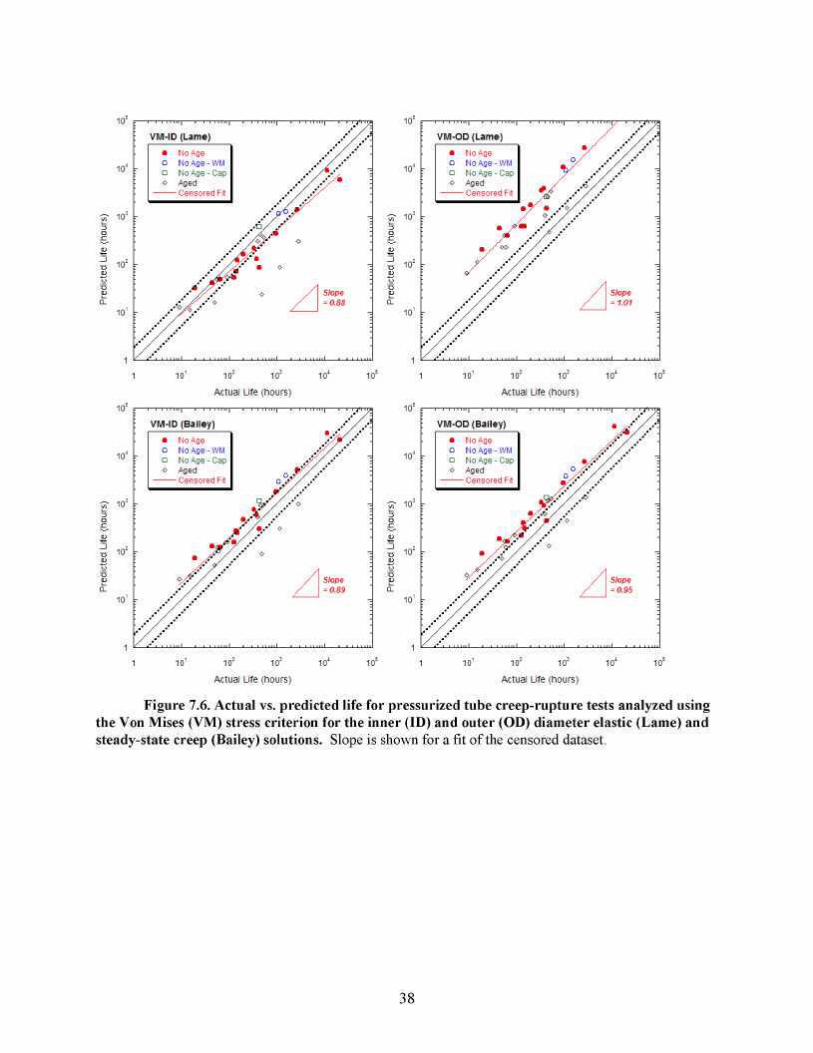
Figure 7.6. Actual vs. predicted life for pressurized tube creep-rupture tests analyzed using the Von Mises (VM) stress criterion for the inner (ID) and outer (OD) diameter elastic (Lame) and steady-state creep (Bailey) solutions. Slope is shown for a fit of the censored dataset.
38
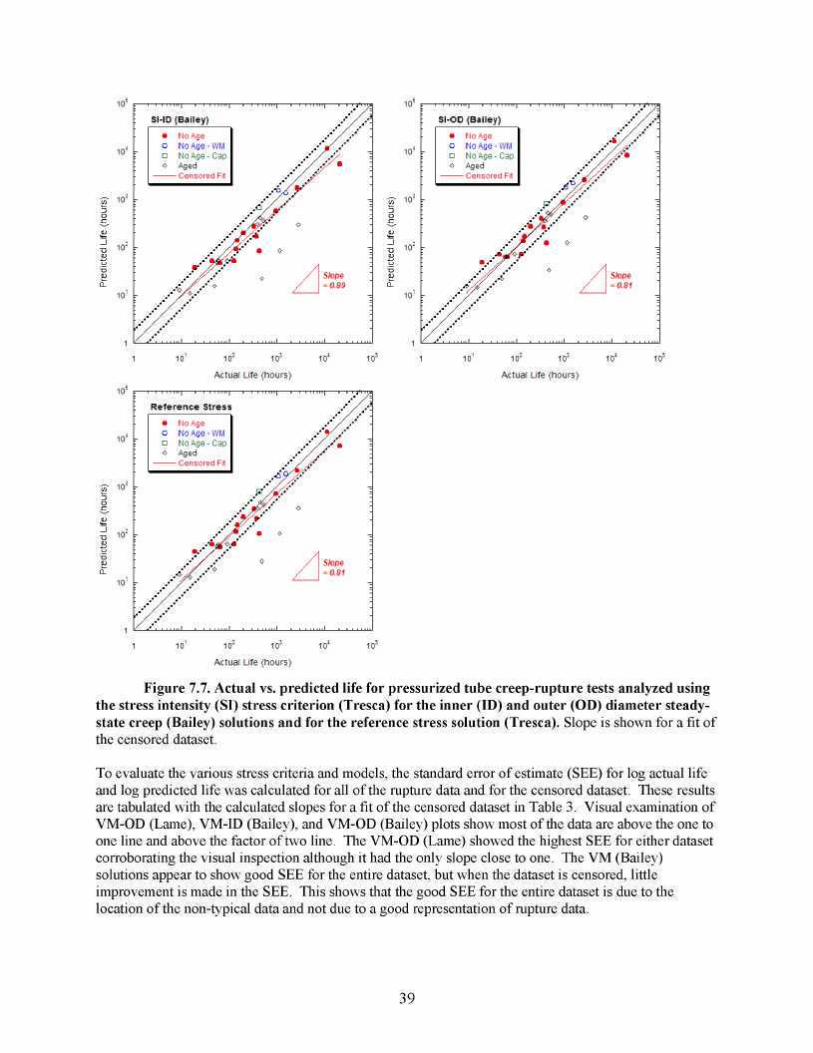
Figure 7.7. Actual vs. predicted life for pressurized tube creep-rupture tests analyzed using the stress intensity (SI) stress criterion (Tresca) for the inner (ID) and outer (OD) diameter steady-state creep (Bailey) solutions and for the reference stress solution (Tresca). Slope is shown for a fit of the censored dataset.
To evaluate the various stress criteria and models, the standard error of estimate (SEE) for log actual life and log predicted life was calculated for all of the rupture data and for the censored dataset. These results are tabulated with the calculated slopes for a fit of the censored dataset in Table 3. Visual examination of VM-OD (Lame), VM-ID (Bailey), and VM-OD (Bailey) plots show most of the data are above the one to one line and above the factor of two line. The VM-OD (Lame) showed the highest SEE for either dataset corroborating the visual inspection although it had the only slope close to one. The VM (Bailey) solutions appear to show good SEE for the entire dataset, but when the dataset is censored, little improvement is made in the SEE. This shows that the good SEE for the entire dataset is due to the location of the non-typical data and not due to a good representation of rupture data.
39
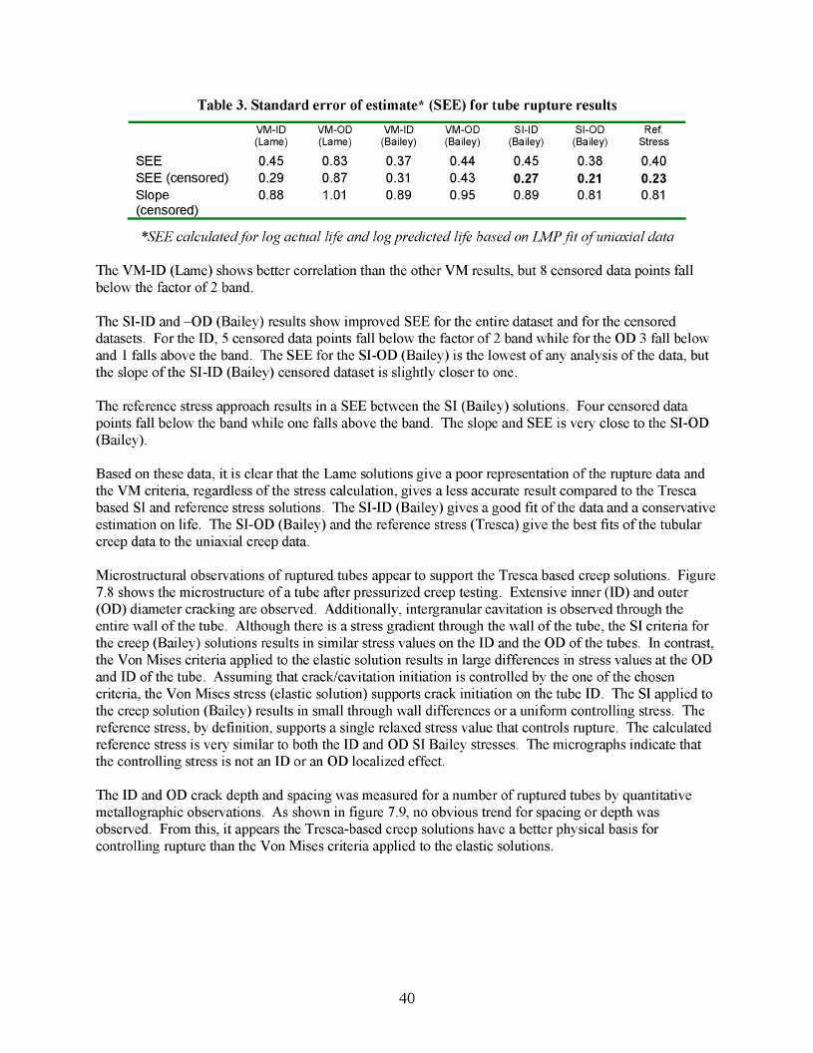
Table 3. Standard error of estimate* (SEE) for tube rupture results
SEE SEE (censored) Slope (censored)
VM-ID (Lame)
0.45 0.29 0.88
VM-OD (Lame)
0.83 0.87 1.01
VM-ID (Bailey)
0.37 0.31 0.89
VM-OD (Bailey)
0.44 0.43 0.95
SI-ID (Bailey)
0.45 0.27 0.89
SI-OD (Bailey)
0.38 0.21 0.81
Ref. Stress
0.40 0.23 0.81
*SEE calculated for log actual life and log predicted life based on LMP fit of uniaxial data
The VM-ID (Lame) shows better correlation than the other VM results, but 8 censored data points fall below the factor of 2 band.
The SI-ID and –OD (Bailey) results show improved SEE for the entire dataset and for the censored datasets. For the ID, 5 censored data points fall below the factor of 2 band while for the OD 3 fall below and 1 falls above the band. The SEE for the SI-OD (Bailey) is the lowest of any analysis of the data, but the slope of the SI-ID (Bailey) censored dataset is slightly closer to one.
The reference stress approach results in a SEE between the SI (Bailey) solutions. Four censored data points fall below the band while one falls above the band. The slope and SEE is very close to the SI-OD (Bailey).
Based on these data, it is clear that the Lame solutions give a poor representation of the rupture data and the VM criteria, regardless of the stress calculation, gives a less accurate result compared to the Tresca based SI and reference stress solutions. The SI-ID (Bailey) gives a good fit of the data and a conservative estimation on life. The SI-OD (Bailey) and the reference stress (Tresca) give the best fits of the tubular creep data to the uniaxial creep data.
Microstructural observations of ruptured tubes appear to support the Tresca based creep solutions. Figure 7.8 shows the microstructure of a tube after pressurized creep testing. Extensive inner (ID) and outer (OD) diameter cracking are observed. Additionally, intergranular cavitation is observed through the entire wall of the tube. Although there is a stress gradient through the wall of the tube, the SI criteria for the creep (Bailey) solutions results in similar stress values on the ID and the OD of the tubes. In contrast, the Von Mises criteria applied to the elastic solution results in large differences in stress values at the OD and ID of the tube. Assuming that crack/cavitation initiation is controlled by the one of the chosen criteria, the Von Mises stress (elastic solution) supports crack initiation on the tube ID. The SI applied to the creep solution (Bailey) results in small through wall differences or a uniform controlling stress. The reference stress, by definition, supports a single relaxed stress value that controls rupture. The calculated reference stress is very similar to both the ID and OD SI Bailey stresses. The micrographs indicate that the controlling stress is not an ID or an OD localized effect.
The ID and OD crack depth and spacing was measured for a number of ruptured tubes by quantitative metallographic observations. As shown in figure 7.9, no obvious trend for spacing or depth was observed. From this, it appears the Tresca-based creep solutions have a better physical basis for controlling rupture than the Von Mises criteria applied to the elastic solutions.
40
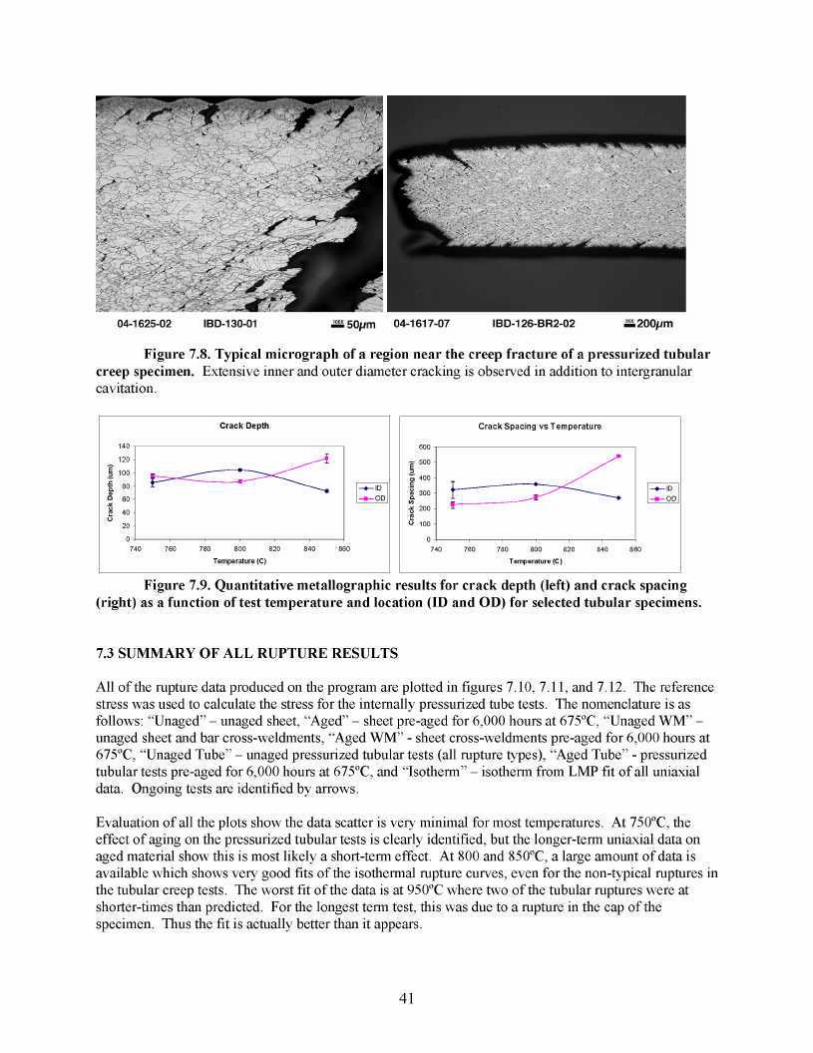
Figure 7.8. Typical micrograph of a region near the creep fracture of a pressurized tubular creep specimen. Extensive inner and outer diameter cracking is observed in addition to intergranular cavitation.
Crack Depth
140
120
100
80
60
40
20 -0
780 800 820
Temperature (C)
Crack Spacing vs Temperature
400
300
200
ID OD
780 800 820
Temperature (C)
Figure 7.9. Quantitative metallographic results for crack depth (left) and crack spacing (right) as a function of test temperature and location (ID and OD) for selected tubular specimens.
7.3 SUMMARY OF ALL RUPTURE RESULTS
All of the rupture data produced on the program are plotted in figures 7.10, 7.11, and 7.12. The reference stress was used to calculate the stress for the internally pressurized tube tests. The nomenclature is as follows: “Unaged” – unaged sheet, “Aged” – sheet pre-aged for 6,000 hours at 675ºC, “Unaged WM” – unaged sheet and bar cross-weldments, “Aged WM” - sheet cross-weldments pre-aged for 6,000 hours at 675ºC, “Unaged Tube” – unaged pressurized tubular tests (all rupture types), “Aged Tube” - pressurized tubular tests pre-aged for 6,000 hours at 675ºC, and “Isotherm” – isotherm from LMP fit of all uniaxial data. Ongoing tests are identified by arrows.
Evaluation of all the plots show the data scatter is very minimal for most temperatures. At 750ºC, the effect of aging on the pressurized tubular tests is clearly identified, but the longer-term uniaxial data on aged material show this is most likely a short-term effect. At 800 and 850ºC, a large amount of data is available which shows very good fits of the isothermal rupture curves, even for the non-typical ruptures in the tubular creep tests. The worst fit of the data is at 950ºC where two of the tubular ruptures were at shorter-times than predicted. For the longest term test, this was due to a rupture in the cap of the specimen. Thus the fit is actually better than it appears.
600
500
100 -
0 740 760 840 860 740 760 840 860
41
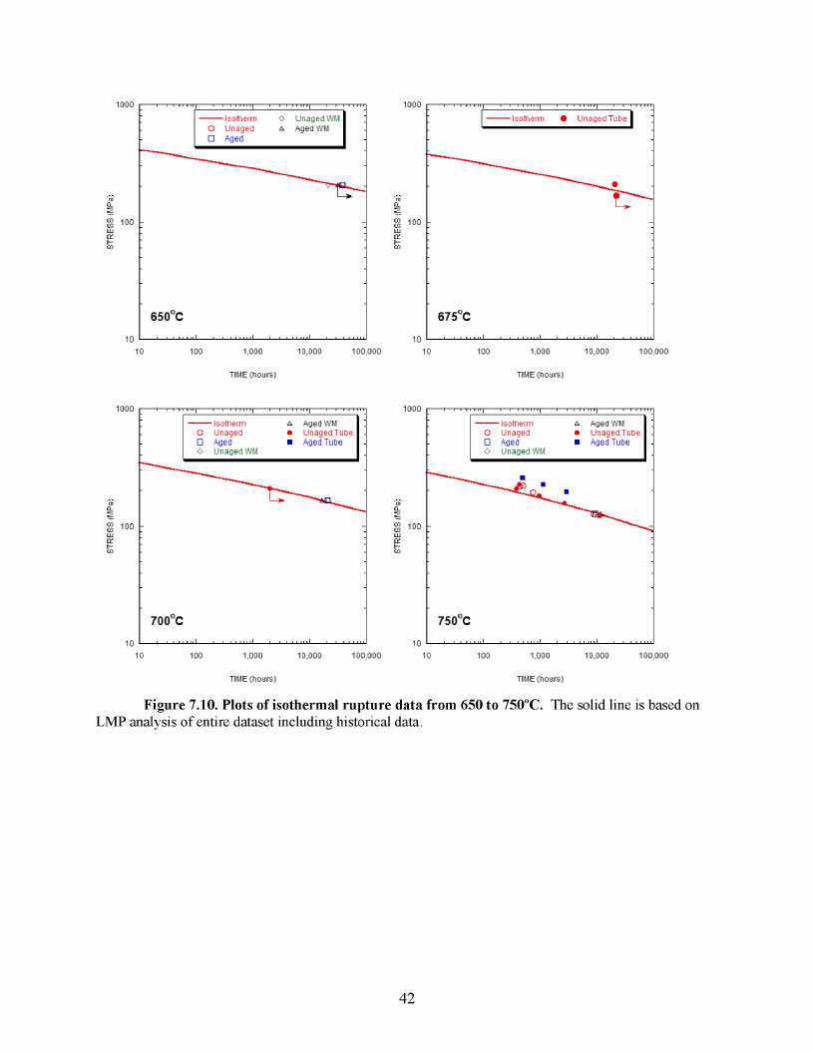
Figure 7.10. Plots of isothermal rupture data from 650 to 750ºC. The solid line is based on LMP analysis of entire dataset including historical data.
42
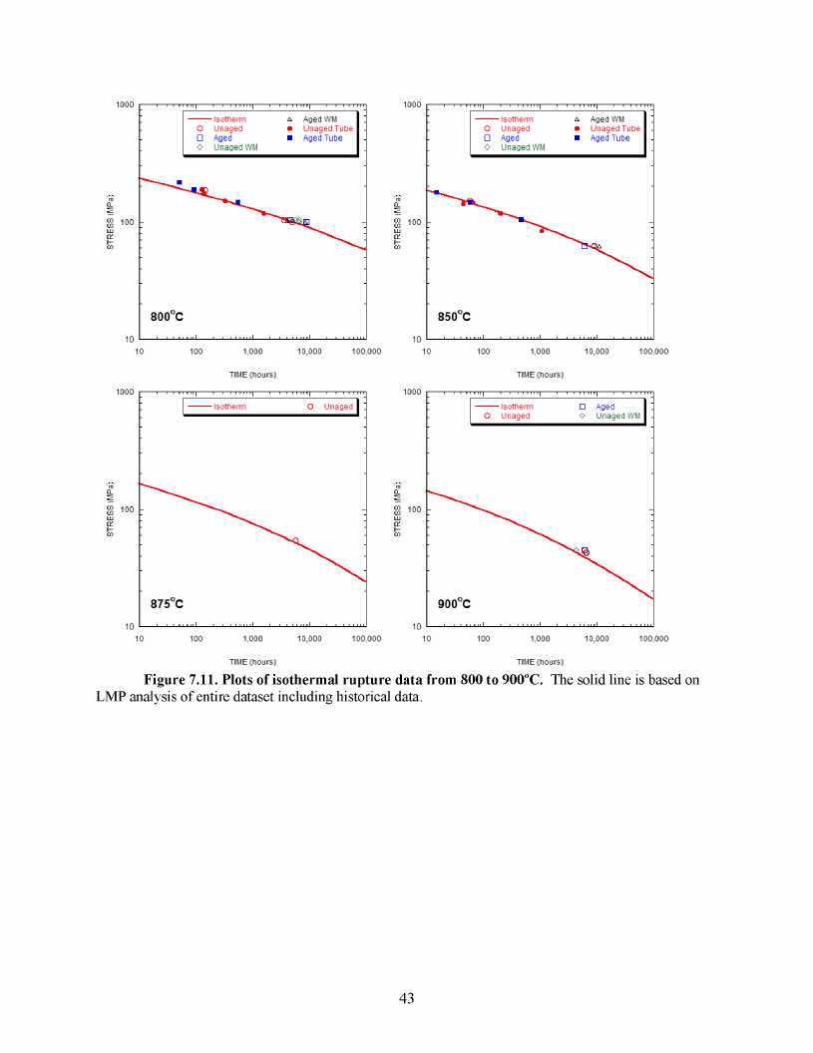
Figure 7.11. Plots of isothermal rupture data from 800 to 900ºC. The solid line is based on LMP analysis of entire dataset including historical data.
43
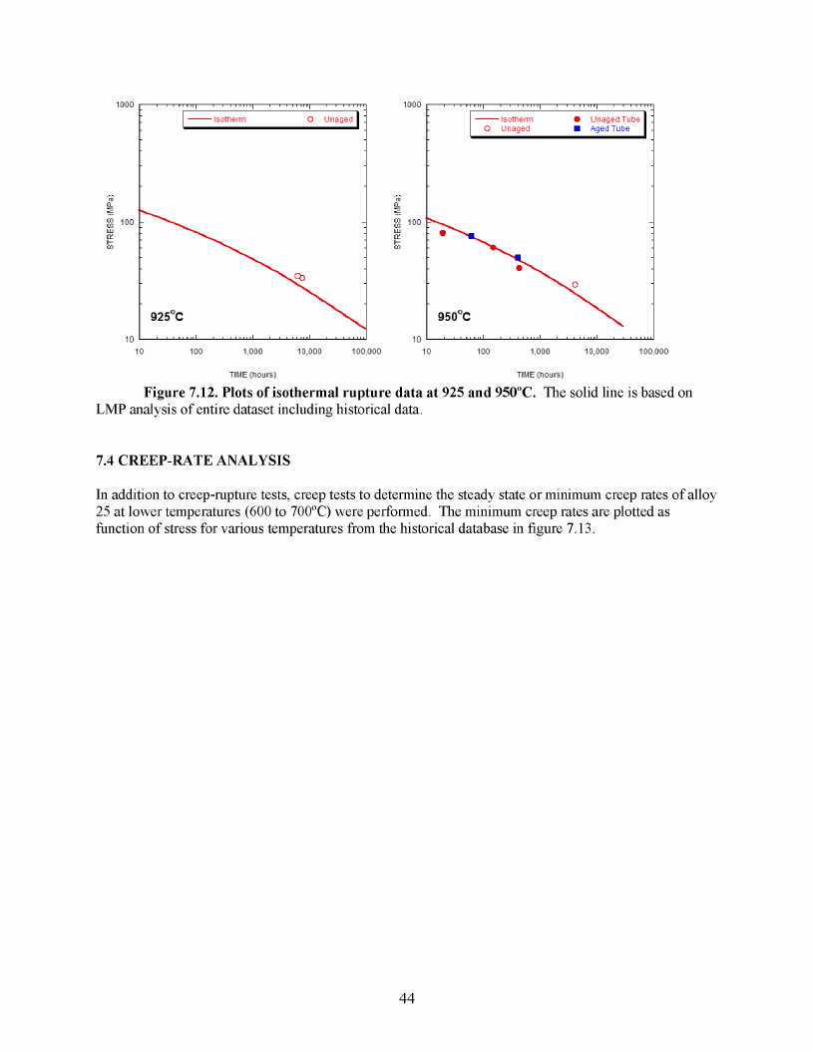
Figure 7.12. Plots of isothermal rupture data at 925 and 950ºC. The solid line is based on LMP analysis of entire dataset including historical data.
7.4 CREEP-RATE ANALYSIS
In addition to creep-rupture tests, creep tests to determine the steady state or minimum creep rates of alloy 25 at lower temperatures (600 to 700ºC) were performed. The minimum creep rates are plotted as function of stress for various temperatures from the historical database in figure 7.13.
44
1.00E+03
1.00E+02
1.00E+01
1.00E+00
1.00E-01
1.00E-02
1.00E-03
1.00E-04
1.00E-05
1.00E-06 10 100
Stress (MPa)
TEMPERATURE
4
A
0
•
4
0
A
649
691
704
732
760
816
871
899
927
982
1093
1149
Power
Power
Power
Power
Power
Power
(649)
(816)
(982)
(1093)
(899)
(732)
1000
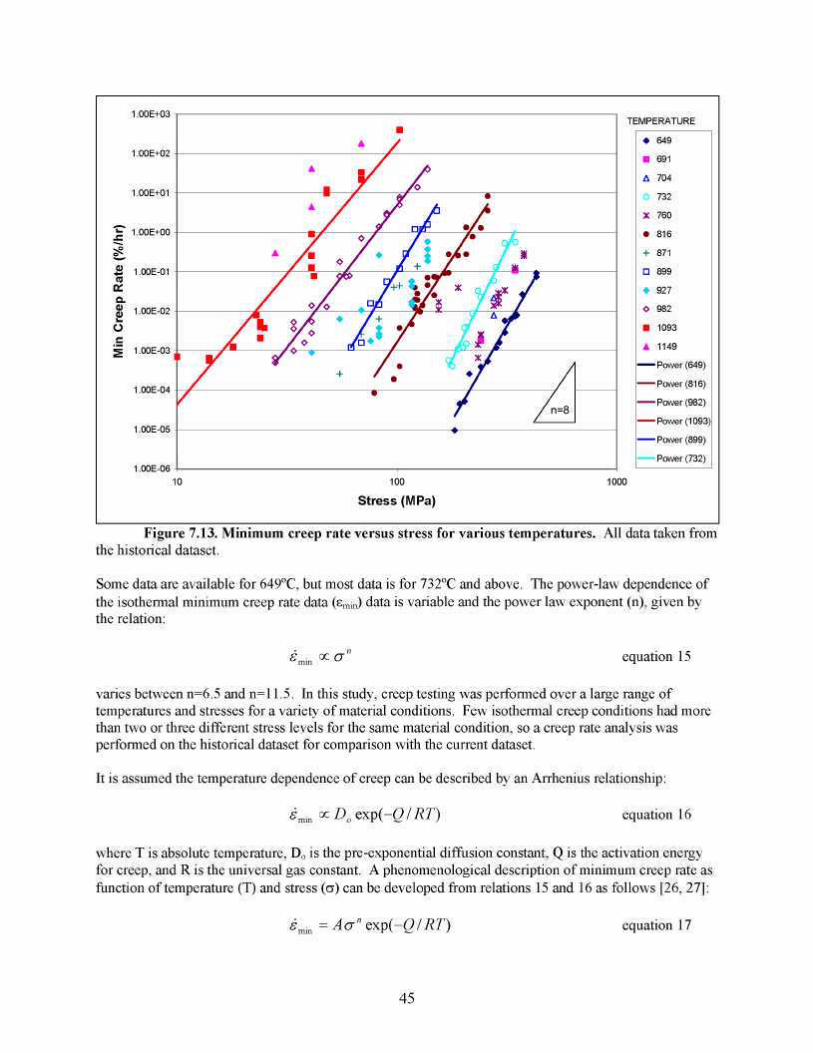
Figure 7.13. Minimum creep rate versus stress for various temperatures. All data taken from the historical dataset.
Some data are available for 649ºC, but most data is for 732ºC and above. The power-law dependence of the isothermal minimum creep rate data (εmin) data is variable and the power law exponent (n), given by the relation:
oca" equation 15
varies between n=6.5 and n=11.5. In this study, creep testing was performed over a large range of temperatures and stresses for a variety of material conditions. Few isothermal creep conditions had more than two or three different stress levels for the same material condition, so a creep rate analysis was performed on the historical dataset for comparison with the current dataset.
It is assumed the temperature dependence of creep can be described by an Arrhenius relationship:
smin ozD0exp(-Q/RT) equation 16
where T is absolute temperature, Do is the pre-exponential diffusion constant, Q is the activation energy for creep, and R is the universal gas constant. A phenomenological description of minimum creep rate as function of temperature (T) and stress (σ) can be developed from relations 15 and 16 as follows [26, 27]:
s = min
Aa"exp(-Q/RT) equation 17
min
45
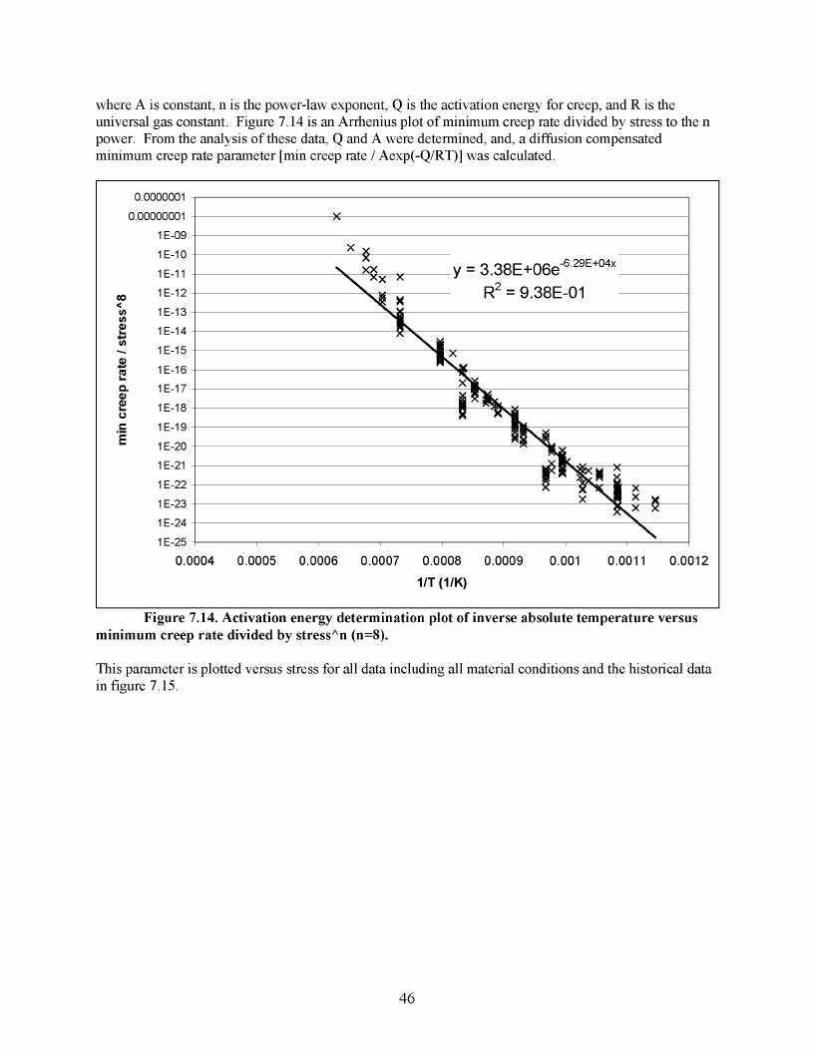
where A is constant, n is the power-law exponent, Q is the activation energy for creep, and R is the universal gas constant. Figure 7.14 is an Arrhenius plot of minimum creep rate divided by stress to the n power. From the analysis of these data, Q and A were determined, and, a diffusion compensated minimum creep rate parameter [min creep rate / Aexp(-Q/RT)] was calculated.
0.0000001
0.00000001
1E-09 -
1E-10 -
1E-11 -
1E-12 -
1E-13 -
1E-14 -
1E-15 -
1E-16 -
1E-17 -
1E-18 -
1E-19 -
1E-20
1E-21 -
1E-22 -
1E-23
1E-24
1E-25
0.0
x X
N. xx V = 3 38E+06e" + x X * X X J
\ i g ^ r\ c/.OOC-U 1
)L ^ 1
*N* xS*
HL **i>L »<8^«x x x
x XX. 1 x
X ^ X y x \ * x
X D04 0.0005 0.0006 0.0007 0.0008 0.0009 0.001 0.0011
1/T (1/K) 0.0012
Figure 7.14. Activation energy determination plot of inverse absolute temperature versus minimum creep rate divided by stress^n (n=8).
This parameter is plotted versus stress for all data including all material conditions and the historical data in figure 7.15.
46
1.0E+23 -f
1.0E+22 -r
1.0E+21 4
1.0E+20 4
1.0E+19 -r
1 OE+18 -r
1.0E+17 4
1.0E+16 -[
1.0E+15 4
1.0E+14
1.0E+13 -r
1.0E+12 -r
1.0E+11 -r
1.0E+10 -r
1 OE+09 10 100
Stress (MPa) - Log Scale
1000
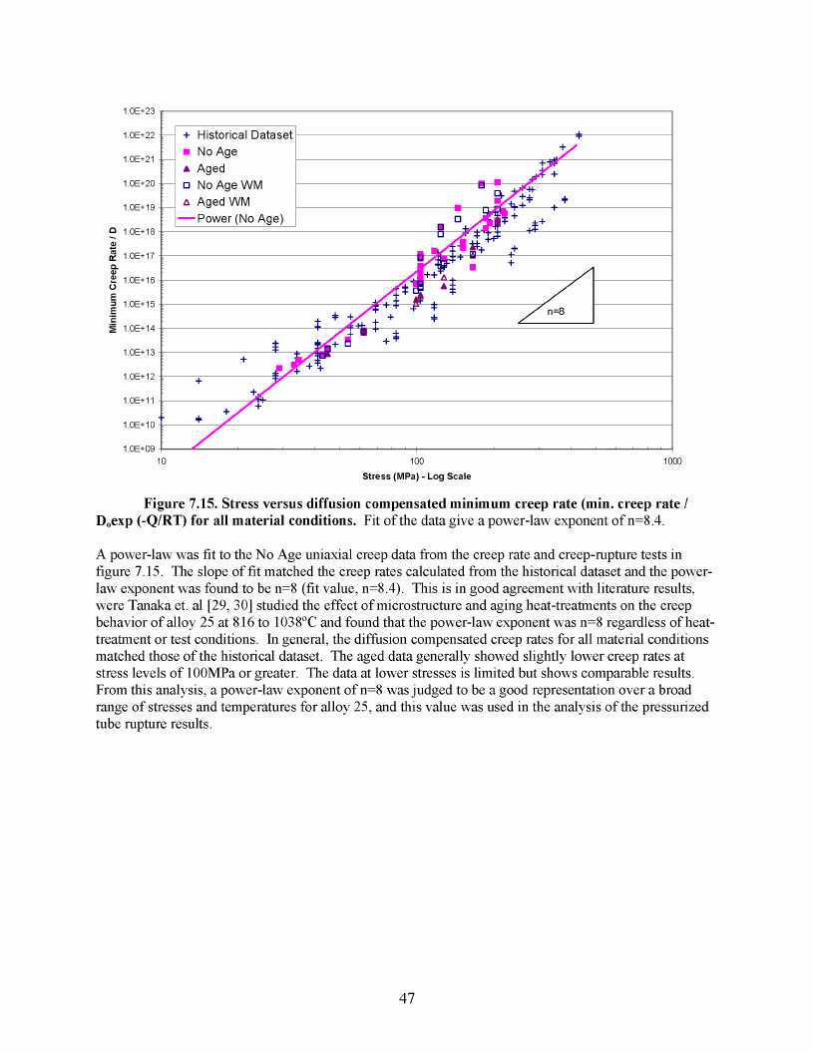
Figure 7.15. Stress versus diffusion compensated minimum creep rate (min. creep rate / Doexp (-Q/RT) for all material conditions. Fit of the data give a power-law exponent of n=8.4.
A power-law was fit to the No Age uniaxial creep data from the creep rate and creep-rupture tests in figure 7.15. The slope of fit matched the creep rates calculated from the historical dataset and the power-law exponent was found to be n=8 (fit value, n=8.4). This is in good agreement with literature results, were Tanaka et. al [29, 30] studied the effect of microstructure and aging heat-treatments on the creep behavior of alloy 25 at 816 to 1038ºC and found that the power-law exponent was n=8 regardless of heat-treatment or test conditions. In general, the diffusion compensated creep rates for all material conditions matched those of the historical dataset. The aged data generally showed slightly lower creep rates at stress levels of 100MPa or greater. The data at lower stresses is limited but shows comparable results. From this analysis, a power-law exponent of n=8 was judged to be a good representation over a broad range of stresses and temperatures for alloy 25, and this value was used in the analysis of the pressurized tube rupture results.
47
8. CONCLUSIONS
An extensive tensile and creep study has produced a large database of high-temperature mechanical properties for a new heat of Haynes alloy 25. The database contains properties for sheet and bar products including material with GTAW weldments and material aged at 675 to 850ºC for times up to 12,000 hours. An appendix is included in the report with all the data generated throughout the program as well as a collection of historical creep and tensile data on the alloy
Tensile results show this heat of alloy 25 to have yield strength and ultimate tensile strength values comparable to those reported in the historical database. Tensile ductility was comparable for lower temperatures and appears better than the historical database at 800ºC and above. Welding did not cause a reduction in tensile properties (strength or ductility). Aging at 675ºC caused a dramatic increase in yield strength, a modest increase in ultimate tensile strength, and a significant decrease in tensile ductility at both room temperature and at 650ºC. The strength and ductility changes with time were accurately described by a Johnson-Mehl-Avarmi (JMA) type equation, which indicated different phases and/or location of phases may be the source of changes in strength and ductility.
Creep-rupture tests showed welding and aging at 675ºC for 6,000 hours did not effect uniaxial rupture life for tests conducted from 650ºC to 950ºC. The Larson-Miller Parameter (LMP) was used to accurately describe the rupture strength for all material conditions. This heat showed much less scatter in rupture time compared to the historical database. The rupture ductility data matched the historical dataset where at long times ductility decreased. Tubular creep tests were conducted by internally pressurizing tubes of varying wall thicknesses. The rupture lives of these tests were evaluated by a number of methods which showed the steady-state creep analysis (Bailey) of I.D. and O.D. stresses and the reference stress solution for an infinitely long cylinder gave very good correlation with predicted life. Microstructural evaluation of ruptured tubes showed these fits have a physical basis. Evaluation of the creep-rates showed that for the broad range of stresses and temperatures, a power-law exponent of n=8 described the minimum creep rate behavior of the alloy. Overall, over 800,000 hours of creep data, with the longest test times exceeding 40,000 hours, were produced to augment the historical database which had less than 200,000 hours of creep data.
48
REFERENCES
[I] R.W. Swindeman, “Some Creep-Rupture Data for Newer Heats of Haynes Alloy No. 25 (L-605),” ORNL-TM-3028, Oak Ridge National Laboratory, Oak Ridge, TN, 1970.
[2] R. W. Swindeman, “Review of the Mechanical Behavior of Haynes Alloy No. 25,” Attachment to Letter to J. P. Moore, Oak Ridge National Laboratory, July 1998.
[3] C. S. Slunder, “Short-Time Tensile Properties of the Co-20Cr-15W-10Ni Cobalt-Base Alloy (L-605),” DMIC-Memo-179, September, 1963.
[4] W.F. Simmons and H.C. Cross, “Report on The Elevated-Temperature Properties of Selected Super-Strength Alloys,” Spec. Tech. Publ. No. 160, American Society for Testing and Materials, Philadelphia, 1954.
[5] B.A. Baughman, “Gas Atmosphere Effects on Materials,” WASC-TR-59-511 (PB-161980), May 1960.
[6] A. Greene, H. Sieber, D. Wells, and T. Wolfe, “Research Investigations on Mechanical Properties of Nickel and Cobalt-Base Alloys for Inclusion in Military Handbook-5,” AD-418639, March 1963.
[7] G. D. Sandrock, R.L. Ashbrook, and J.C. Freche, “Effect of Variations in Silicon and Iron Content on Embrittlement of a Cobalt-Base Alloy (L-605),” NASA-TN-D-2989, September 1965.
[8] H. Conrad, E. Barnett, and J. White, “Correlation and Interpretation of High Temperature Mechanical Properties of Certain Superalloys,” pp. 1-9 to 1-29 in Joint International Conference on Creep, The Institute of Mechanical Engineers, London, 1963.
[9] P. N. Flagella and W. L. McCullough, “Stress-Rupture and Creep Behavior of Haynes Alloy No. 25 at 1440, 1700, and 2000ºF in Air,” TID-24045 (GE-NMP-67-181 AD-468683), June 1965.
[10] N. Yukawa and K. Sato, “The Correlation between Microstructure and Stress-Rupture Properties of a Co-Cr-Ni-W (HS-25) Alloy,” pp. 680-686 in Proceedings of the International Conference on the Strength of Metals and Alloys, The Japan Institute of Metals, Omachi, Japan, 1968.
[II] R. Widmer, J. M. Dhosi, A Mullendore, and N. J. Grant, “Mechanisms Associated with Long Time Creep Phenomena,” Part I, AFML-TR-65-181 (AD-468683), June 1965.
[12] R. Widmer, J.M. Dhosi, and N.J. Grant, “Mechanisms Associated with Long Time Creep Phenomena,” Part II, AFML-TR-65-181 (AD-815679), March 1967.
[13] S.T. Wlodek, “Embrittlement of a Co-Cr-W (L-605) Alloy,” Trans. ASM, American Society for Metals, 56, 287-303, 1963.
[14] D.T. Bourgette, “Effect of Aging Time and Temperature on the Impact and Tensile Behavior of L-605 – A Cobalt Base Alloy,” ORNL-TM-3734, Oak Ridge National Laboratory, Oak Ridge, TN, 1973.
[15] H.E. McCoy and D.T. Bourgette, “Influence of Aging on the Impact Properties of Hastelloy N, Haynes Alloy No. 25, and Haynes Alloy No. 188,” ORNL-TM-4380, Oak Ridge National Laboratory, Oak Ridge, TN, 1973.
49
[16] J. P. Hammond, “Effect of Long-Term Aging at 815°C on the Tensile Properties and Microstructural Stability of Four Cobalt- and Nickel-Base Superalloys,” ORNL-5174, Oak Ridge National Laboratory, Oak Ridge, TN, 1976.
[17] J. P. Shingledecker, L. Riester. ORNL/CF-05/10, Oak Ridge National Laboratory, Oak Ridge, TN, 2005.
[18] M. Radovic, E. Lara-Curzio, L. Riester. “Comparison of different experimental techniques for determination of elastic properties of solids.” Materials Science and Engineering A, A386 (2004) 56-70.
[19] “Haynes® 25 alloy Product Brochure.” H-3057D, 2004 Haynes, Intl., www.haynesintl.com.
[20] D. A Porter, K. E. Easterling. Phase Transformations in Metals and Alloys. Chapman & Hall, London, 1992.
[21] C. McKamey, E. George. “Mechanical Properties of Haynes Alloy 25 Before and After Aging at 550-850°C.” Attachment to letter No. 0706-14-05, J.F.King to John Dowicki, July 8, 2005.
[22] I.Finnie and W. R. Heller. Creep of Engineering Materials. McGraw-Hill 1959. 182-184.
[23] R. K. Penny, D .L. Marriott. Design for Creep. 1995 Chapman & Hall, London, UK.
[24] Boiler Materials for Ultrasupercritical Coal Power Plants – Task 8, An Overview of Reference Stress Approach, NETL/DOE/OCDO, 2003. USC T-6.
[25] J. D. Fishburn. “A Single Technically Consistent Design Formula for the Thickness of Cylindrical Sections Under Internal Pressure.” Proceedings of 2005 ASME Pressure Vessels and Piping Division Conference, July 17-21, Denver, CO USA. PVP2005-71026.
[26] T. H. Courtney. Mechanical Behavior of Materials. 2nd Ed. McGraw-Hill 2000.
[27] F. R. N. Nabarro, H. L. deVilliers. The Physics of Creep. Taylor & Francis Ltd 1995.
[28] W.D. Klopp. Aerospace Structural Metals Handbook. L-605, CODE 4302, March 1986. 1-37.
[29] M. Tanaka, H. Iizuka, M. Tagami. “Effects of grain-boundary configuration on the high-temperature creep strength of cobalt-base L-605 alloys.” Journal of Materials Science 24 (1989) 2421-2428.
[30] M. Tanaka, H. Iizuka “Effects of high-temperature ageing on the creep-rupture properties of cobalt-base L-605 alloys.” Journal of Materials Science 25 (1990) 5199-5206.
50
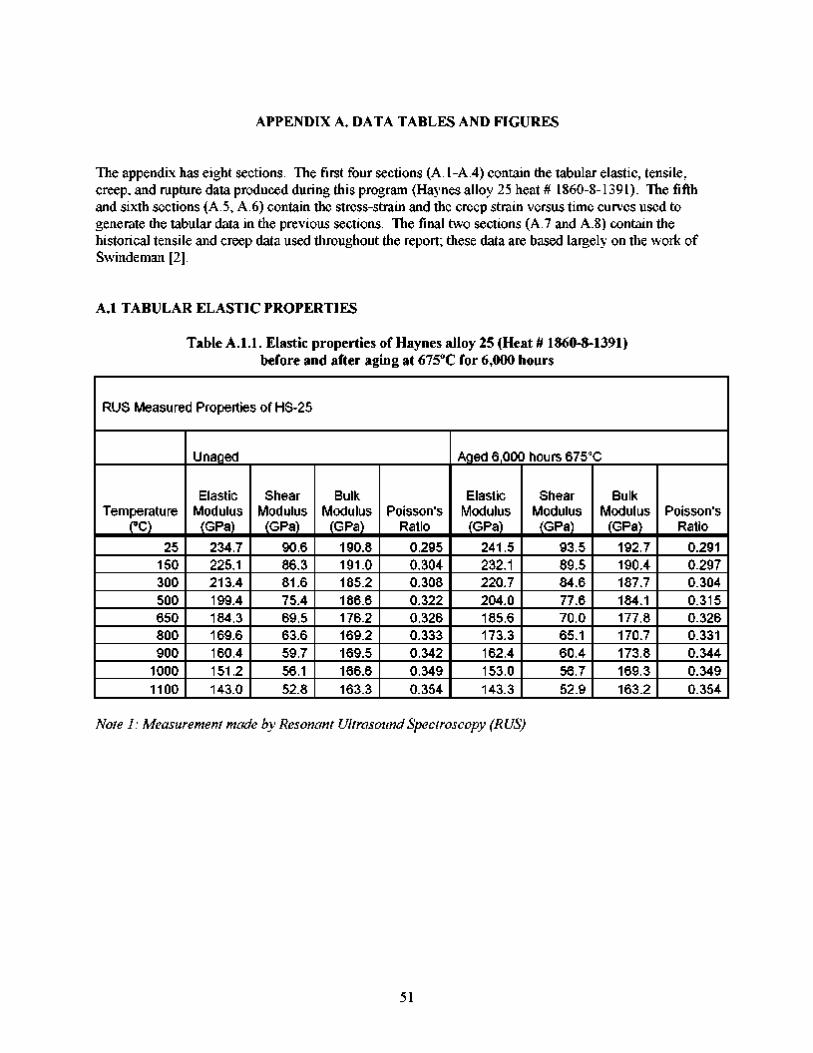
APPENDIX A. DATA TABLES AND FIGURES
The appendix has eight sections. The first four sections (A.1-A.4) contain the tabular elastic, tensile, creep, and rupture data produced during this program (Haynes alloy 25 heat # 1860-8-1391). The fifth and sixth sections (A.5, A.6) contain the stress-strain and the creep strain versus time curves used to generate the tabular data in the previous sections. The final two sections (A.7 and A.8) contain the historical tensile and creep data used throughout the report; these data are based largely on the work of Swindeman [2].
A.1 TABULAR ELASTIC PROPERTIES
Table A.1.1. Elastic properties of Haynes alloy 25 (Heat # 1860-8-1391) before and after aging at 675ºC for 6,000 hours
RUS Measured Properties of HS-25
Temperature (ºC)
25 150 300 500 650 800 900
1000 1100
Unaged
Elastic Modulus
(GPa) 234.7 225.1 213.4 199.4 184.3 169.6 160.4 151.2 143.0
Shear Modulus
(GPa) 90.6 86.3 81.6 75.4 69.5 63.6 59.7 56.1 52.8
Bulk Modulus
(GPa) 190.8 191.0 185.2 186.6 176.2 169.2 169.5 166.6 163.3
Poisson's Ratio
0.295 0.304 0.308 0.322 0.326 0.333 0.342 0.349 0.354
Aged 6,000 hours 675°C
Elastic Modulus
(GPa) 241.5 232.1 220.7 204.0 185.6 173.3 162.4 153.0 143.3
Shear Modulus
(GPa) 93.5 89.5 84.6 77.6 70.0 65.1 60.4 56.7 52.9
Bulk Modulus
(GPa) 192.7 190.4 187.7 184.1 177.8 170.7 173.8 169.3 163.2
Poisson's Ratio
0.291 0.297 0.304 0.315 0.326 0.331 0.344 0.349 0.354
Note 1: Measurement made by Resonant Ultrasound Spectroscopy (RUS)
51
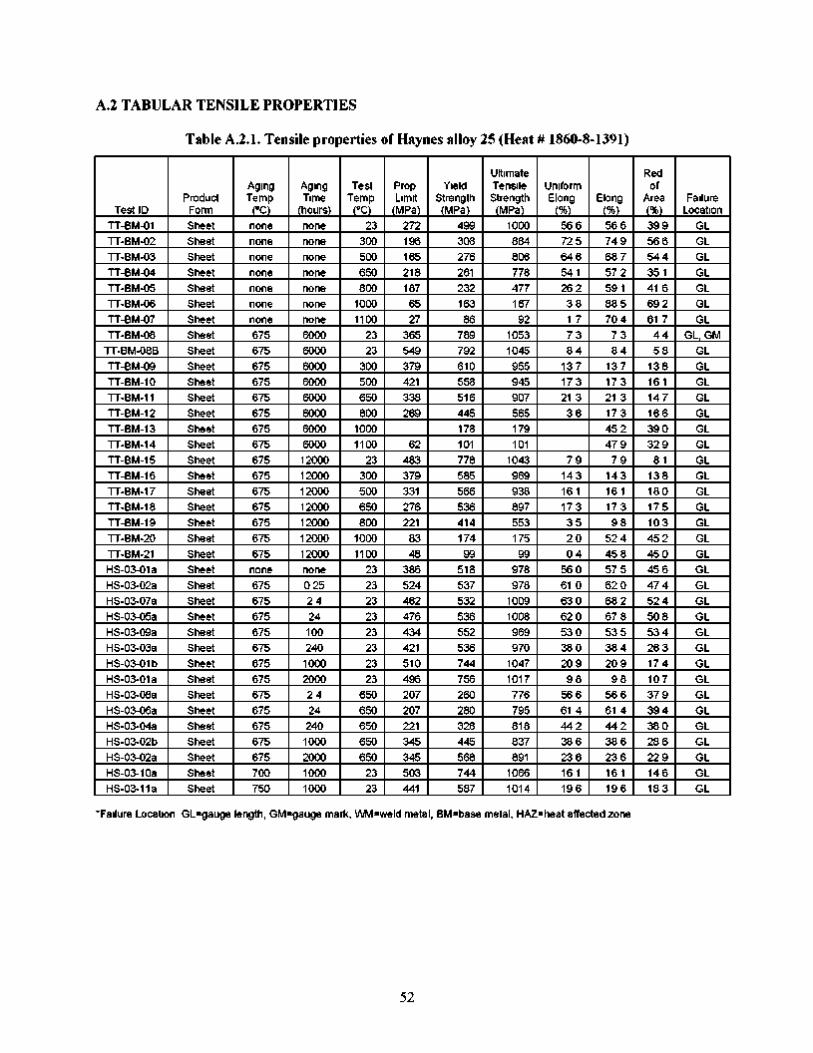
A.2 TABULAR TENSILE PROPERTIES
Table A.2.1. Tensile properties of Haynes alloy 25 (Heat # 1860-8-1391)
Test ID TT-BM-01 TT-BM-02 TT-BM-03 TT-BM-04 TT-BM-05 TT-BM-06 TT-BM-07 TT-BM-08
TT-BM-08B TT-BM-09 TT-BM-10 TT-BM-11 TT-BM-12 TT-BM-13 TT-BM-14 TT-BM-15 TT-BM-16 TT-BM-17 TT-BM-18 TT-BM-19 TT-BM-20 TT-BM-21 HS-03-01a HS-03-02a HS-03-07a HS-03-05a HS-03-09a HS-03-03a HS-03-01b HS-03-01a HS-03-08a HS-03-06a HS-03-04a HS-03-02b HS-03-02a HS-03-10a HS-03-11a
Product Form Sheet Sheet Sheet Sheet Sheet Sheet Sheet Sheet Sheet Sheet Sheet Sheet Sheet Sheet Sheet Sheet Sheet Sheet Sheet Sheet Sheet Sheet Sheet Sheet Sheet Sheet Sheet Sheet Sheet Sheet Sheet Sheet Sheet Sheet Sheet Sheet Sheet
Aging Temp
(°C) none none none none none none none 675 675 675 675 675 675 675 675 675 675 675 675 675 675 675
none 675 675 675 675 675 675 675 675 675 675 675 675 700 750
Aging Time
(hours) none none none none none none none 6000 6000 6000 6000 6000 6000 6000 6000 12000 12000 12000 12000 12000 12000 12000 none 0 25 2 4 24 100 240 1000 2000 2 4 24 240 1000 2000 1000 1000
Test Temp
(°C) 23
300 500 650 800
1000 1100
23 23
300 500 650 800
1000 1100
23 300 500 650 800
1000 1100
23 23 23 23 23 23 23 23
650 650 650 650 650
23 23
Prop. Limit
(MPa) 272 196 165 218 187 65 27
365 549 379 421 338 269
62 483 379 331 276 221
83 48
386 524 462 476 434 421 510 496 207 207 221 345 345 503 441
Yield Strength (MPa)
499 308 276 261 232 163 86
789 792 610 558 516 445 178 101 778 585 566 536 414 174 99
518 537 532 536 552 536 744 756 260 280 328 445 568 744 587
Ultimate Tensile Strength (MPa)
1000 884 806 778 477 167 92
1053 1045 955 945 907 565 179 101
1043 969 938 897 553 175 99
978 978
1009 1008 969 970
1047 1017 776 795 818 837 891
1066 1014
Uniform Elong.
(%) 56 6 72 5 64 6 54 1 26 2 3 8 1 7 7 3 8 4
13 7 17 3 21 3 3 6
7 9 14 3 16 1 17 3 3 5 2 0 0 4
56 0 61 0 63 0 62 0 53 0 38 0 20 9 9 8
56 6 61 4 44 2 38 6 23 6 16 1 19 6
Elong (%) 56 6 74 9 68 7 57 2 59 1 88 5 70 4
7 3 8 4
13 7 17 3 21 3 17 3 45 2 47 9
7 9 14 3 16 1 17 3 9 8
52 4 45 8 57 5 62 0 68 2 67 8 53 5 38 4 20 9
9 8 56 6 61 4 44 2 38 6 23 6 16 1 19 6
Red. of
Area (%) 39 9 56 6 54 4 35 1 41 6 69 2 61 7
44 5 8
13 8 16 1 147 16 6 39 0 32 9
8 1 13 8 18 0 17 5 10 3 45 2 45 0 45 6 47 4 52 4 50 8 53 4 26 3 17 4 10 7 37 9 39 4 38 0 28 6 22 9 14 6 18 3
Failure Location
GL GL GL GL GL GL GL
GL, GM GL GL GL GL GL GL GL GL GL GL GL GL GL GL GL GL GL GL GL GL GL GL GL GL GL GL GL GL GL
*Failure Location: GL=gauge length, GM=gauge mark, WM=weld metal, BM=base metal, HAZ=heat affected zone
52
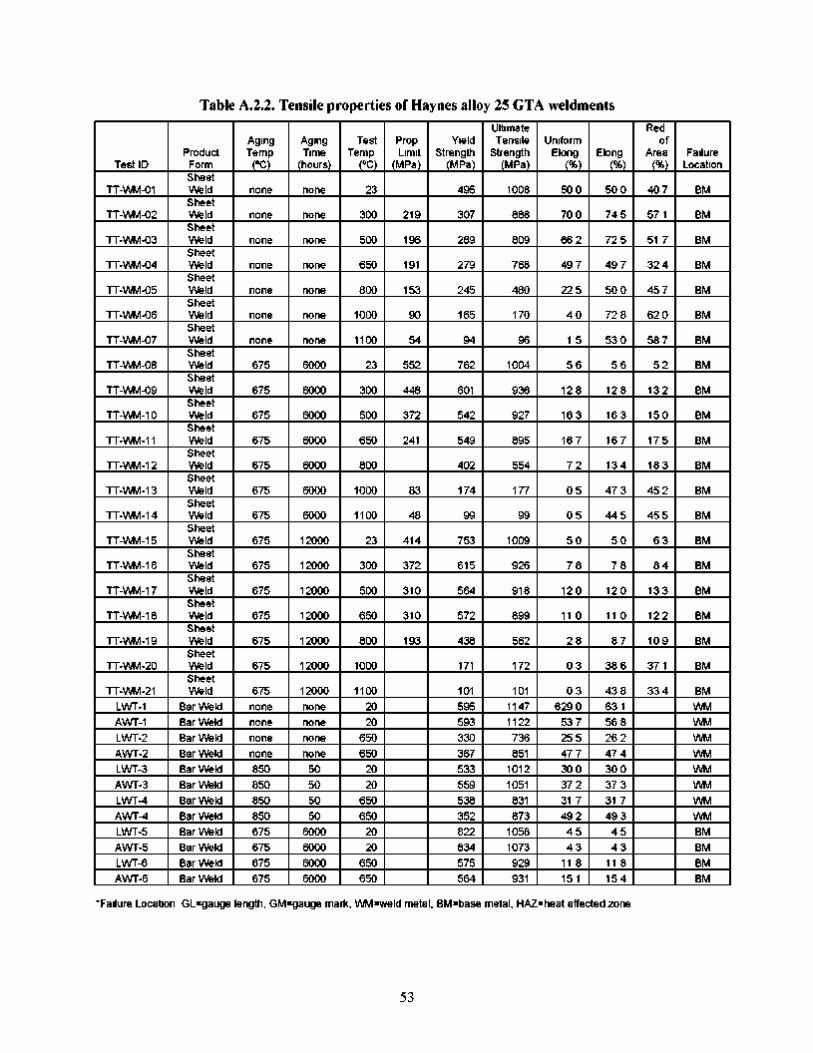
Table A.2.2. Tensile properties of Haynes alloy 25 GTA weldments
Test ID
TT-WM-01
TT-WM-02
TT-WM-03
TT-WM-04
TT-WM-05
TT-WM-06
TT-WM-07
TT-WM-08
TT-WM-09
TT-WM-10
TT-WM-11
TT-WM-12
TT-WM-13
TT-WM-14
TT-WM-15
TT-WM-16
TT-WM-17
TT-WM-18
TT-WM-19
TT-WM-20
TT-WM-21 LWT-1 AWT-1 LWT-2 AWT-2 LWT-3 AWT-3 LWT-4 AWT-4 LWT-5 AWT-5 LWT-6 AWT-6
Product Form Sheet Weld Sheet Weld Sheet Weld Sheet Weld Sheet Weld Sheet Weld Sheet Weld Sheet Weld Sheet Weld Sheet Weld Sheet Weld Sheet Weld Sheet Weld Sheet Weld Sheet Weld Sheet Weld Sheet Weld Sheet Weld Sheet Weld Sheet Weld Sheet Weld
Bar Weld Bar Weld Bar Weld Bar Weld Bar Weld Bar Weld Bar Weld Bar Weld Bar Weld Bar Weld Bar Weld Bar Weld
Aging Temp
(°C)
none
none
none
none
none
none
none
675
675
675
675
675
675
675
675
675
675
675
675
675
675 none none none none 850 850 850 850 675 675 675 675
Aging Time
(hours)
none
none
none
none
none
none
none
6000
6000
6000
6000
6000
6000
6000
12000
12000
12000
12000
12000
12000
12000 none none none none
50 50 50 50
6000 6000 6000 6000
Test Temp
(°C)
23
300
500
650
800
1000
1100
23
300
500
650
800
1000
1100
23
300
500
650
800
1000
1100 20 20
650 650
20 20
650 650
20 20
650 650
Prop. Limit
(MPa)
219
196
191
153
90
54
552
448
372
241
83
48
414
372
310
310
193
Yield Strength
(MPa)
495
307
289
279
245
165
94
762
601
542
549
402
174
99
753
615
564
572
438
171
101 595 593 330 367 533 559 538 352 822 834 575 564
Ultimate Tensile
Strength (MPa)
1008
888
809
768
480
170
96
1004
936
927
895
554
177
99
1009
926
918
899
562
172
101 1147 1122 736 851
1012 1051 831 873
1058 1073 929 931
Uniform Elong.
(%)
50 0
70 0
66 2
49 7
22 5
4 0
1 5
5 6
12 8
16 3
16 7
7 2
0 5
0 5
5 0
7 8
12 0
11 0
2 8
0 3
0 3 629 0
53 7 25 5 47 7 30 0 37 2 31 7 49 2 4 5 4 3
11 8 15 1
Elong (%)
50 0
74 5
72 5
49 7
50 0
72 8
53 0
5 6
12 8
16 3
16 7
13 4
47 3
44 5
5 0
7 8
12 0
11 0
8 7
38 6
43 8 63 1 56 8 26 2 47 4 30 0 37 3 31 7 49 3
4 5 4 3
11 8 15 4
Red. of
Area (%)
40 7
57 1
51 7
32 4
45 7
62 0
58 7
5 2
13 2
15 0
17 5
18 3
45 2
45 5
6 3
8 4
13 3
12 2
10 9
37 1
33 4
Failure Location
BM
BM
BM
BM
BM
BM
BM
BM
BM
BM
BM
BM
BM
BM
BM
BM
BM
BM
BM
BM
BM WM WM WM WM WM WM WM WM BM BM BM BM
*Failure Location: GL=gauge length, GM=gauge mark, WM=weld metal, BM=base metal, HAZ=heat affected zone
53
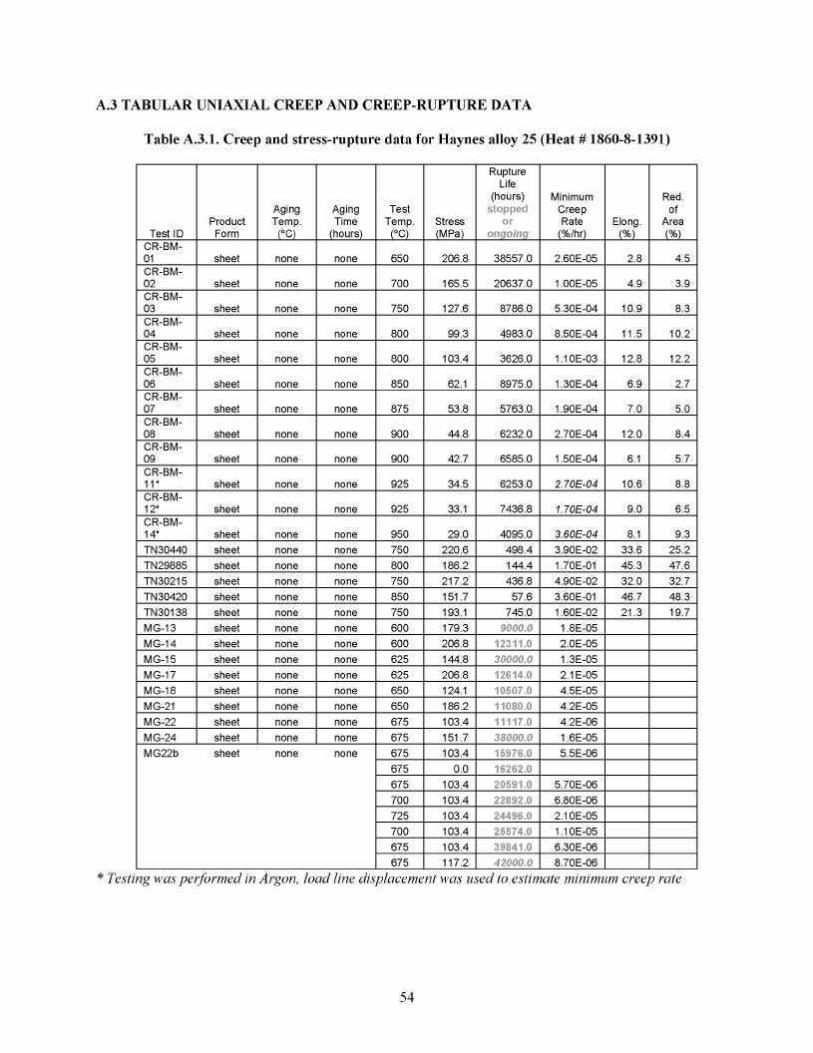
A.3 TABULAR UNIAXIAL CREEP AND CREEP-RUPTURE DATA
Table A.3.1. Creep and stress-rupture data for Haynes alloy 25 (Heat # 1860-8-1391)
Test ID CR-BM-01 CR-BM-02 CR-BM-03 CR-BM-04 CR-BM-05 CR-BM-06 CR-BM-07 CR-BM-08 CR-BM-09 CR-BM-11* CR-BM-12* CR-BM-14* TN30440 TN29885 TN30215 TN30420 TN30138 MG-13 MG-14 MG-15 MG-17 MG-18 MG-21 MG-22 MG-24 MG22b
Product Form
sheet
sheet
sheet
sheet
sheet
sheet
sheet
sheet
sheet
sheet
sheet
sheet sheet sheet sheet sheet sheet sheet sheet sheet sheet sheet sheet sheet sheet sheet
Aging Temp.
(°C)
none
none
none
none
none
none
none
none
none
none
none
none none none none none none none none none none none none none none none
Aging Time
(hours)
none
none
none
none
none
none
none
none
none
none
none
none none none none none none none none none none none none none none none
Test Temp.
(°C)
650
700
750
800
800
850
875
900
900
925
925
950 750 800 750 850 750 600 600 625 625 650 650 675 675 675 675 675 700 725 700 675 675
Stress (MPa)
206.8
165.5
127.6
99.3
103.4
62.1
53.8
44.8
42.7
34.5
33.1
29.0 220.6 186.2 217.2 151.7 193.1 179.3 206.8 144.8 206.8 124.1 186.2 103.4 151.7 103.4
0.0 103.4 103.4 103.4 103.4 103.4 117.2
Rupture Life
(hours) stopped
or ongoing
38557.0
20637.0
8786.0
4983.0
3626.0
8975.0
5763.0
6232.0
6585.0
6253.0
7436.8
4095.0 498.4 144.4 436.8
57.6 745.0
Minimum Creep Rate
(%/hr)
2.60E-05
1.00E-05
5.30E-04
8.50E-04
1.10E-03
1.30E-04
1.90E-04
2.70E-04
1.50E-04
2.70E-04
1.70E-04
3 60E-04 3.90E-02 1.70E-01 4.90E-02 3.60E-01 1.60E-02 1.8E-05 2.0E-05 1.3E-05 2.1E-05 4.5E-05 4.2E-05 4.2E-06 1.6E-05 5.5E-06
5.70E-06 6.80E-06 2.10E-05 1.10E-05 6.30E-06 8.70E-06
Elong. (%)
2.8
4.9
10.9
11.5
12.8
6.9
7.0
12.0
6.1
10.6
9.0
8.1 33.6 45.3 32.0 46.7 21.3
Red. of
Area (%)
4.5
3.9
8.3
10.2
12.2
2.7
5.0
8.4
5.7
8.8
6.5
9.3 25.2 47.6 32.7 48.3 19.7
Testing was performed in Argon, load line displacement was used to estimate minimum creep rate
54
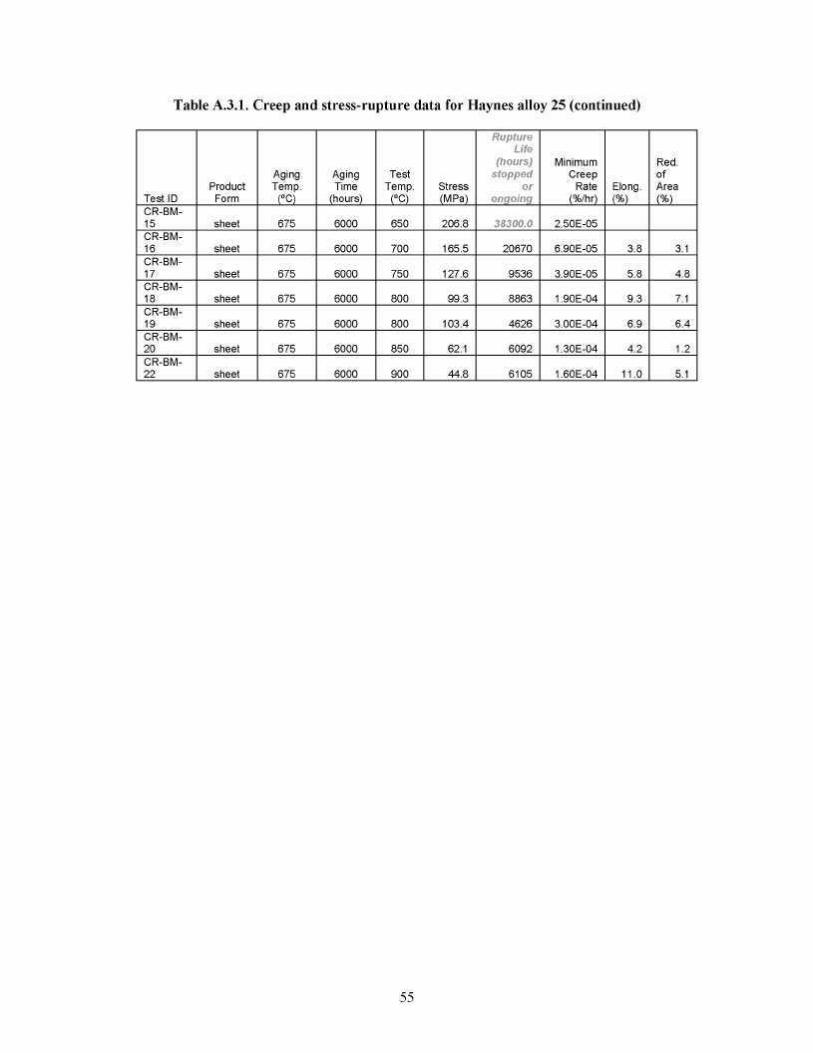
Table A.3.1. Creep and stress-rupture data for Haynes alloy 25 (continued)
Test ID CR-BM-15 CR-BM-16 CR-BM-17 CR-BM-18 CR-BM-19 CR-BM-20 CR-BM-22
Product Form
sheet
sheet
sheet
sheet
sheet
sheet
sheet
Aging Temp.
(ºC)
675
675
675
675
675
675
675
Aging Time
(hours)
6000
6000
6000
6000
6000
6000
6000
Test Temp.
(ºC)
650
700
750
800
800
850
900
Stress (MPa)
206.8
165.5
127.6
99.3
103.4
62.1
44.8
Rupture Life
(hours) stopped
or ongoing
20670
9536
8863
4626
6092
6105
Minimum Creep
Rate (%/hr)
2.50E-05
6.90E-05
3.90E-05
1.90E-04
3.00E-04
1.30E-04
1.60E-04
Elong. (%)
3.8
5.8
9.3
6.9
4.2
11.0
Red. of Area (%)
3.1
4.8
7.1
6.4
1.2
5.1
55
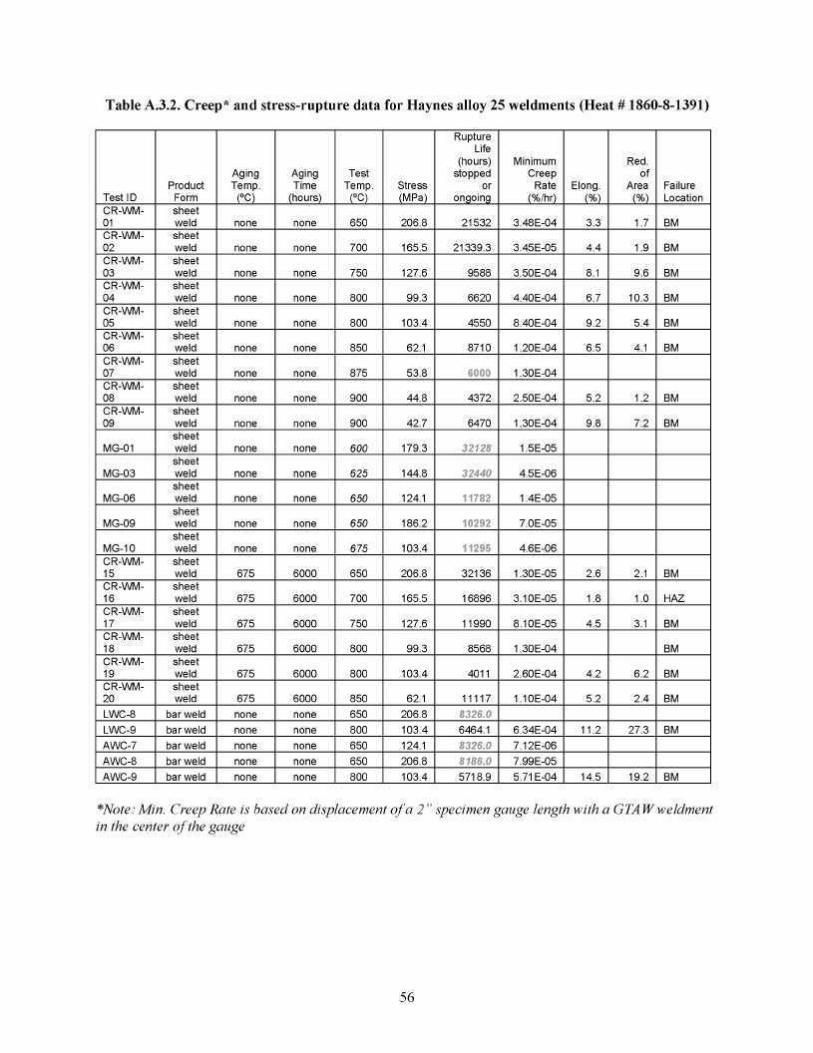
Table A.3.2. Creep* and stress-rupture data for Haynes alloy 25 weldments (Heat # 1860-8-1391)
Test ID CR-WM-01 CR-WM-02 CR-WM-03 CR-WM-04 CR-WM-05 CR-WM-06 CR-WM-07 CR-WM-08 CR-WM-09
MG-01
MG-03
MG-06
MG-09
MG-10 CR-WM-15 CR-WM-16 CR-WM-17 CR-WM-18 CR-WM-19 CR-WM-20 LWC-8 LWC-9 AWC-7 AWC-8 AWC-9
Product Form sheet weld sheet weld sheet weld sheet weld sheet weld sheet weld sheet weld sheet weld sheet weld sheet weld sheet weld sheet weld sheet weld sheet weld sheet weld sheet weld sheet weld sheet weld sheet weld sheet weld
bar weld bar weld bar weld bar weld bar weld
Aging Temp.
(°C)
none
none
none
none
none
none
none
none
none
none
none
none
none
none
675
675
675
675
675
675 none none none none none
Aging Time
(hours)
none
none
none
none
none
none
none
none
none
none
none
none
none
none
6000
6000
6000
6000
6000
6000 none none none none none
Test Temp.
(°C)
650
700
750
800
800
850
875
900
900
600
625
650
650
675
650
700
750
800
800
850 650 800 650 650 800
Stress (MPa)
206.8
165.5
127.6
99.3
103.4
62.1
53.8
44.8
42.7
179.3
144.8
124.1
186.2
103.4
206.8
165.5
127.6
99.3
103.4
62.1 206.8 103.4 124.1 206.8 103.4
Rupture Life
(hours) stopped
or ongoing
21532
21339.3
9588
6620
4550
8710
4372
6470
32136
16896
11990
8568
4011
11117
6464.1
5718.9
Minimum Creep
Rate (%/hr)
3.48E-04
3.45E-05
3.50E-04
4.40E-04
8.40E-04
1.20E-04
1.30E-04
2.50E-04
1.30E-04
1.5E-05
4.5E-06
1.4E-05
7.0E-05
4.6E-06
1.30E-05
3.10E-05
8.10E-05
1.30E-04
2.60E-04
1.10E-04
6.34E-04 7.12E-06 7.99E-05 5.71E-04
Elong. (%)
3.3
4.4
8.1
6.7
9.2
6.5
5.2
9.8
2.6
1.8
4.5
4.2
5.2
11.2
14.5
Red. of
Area (%)
1.7
1.9
9.6
10.3
5.4
4.1
1.2
7.2
2.1
1.0
3.1
6.2
2.4
27.3
19.2
Failure Location
BM
BM
BM
BM
BM
BM
BM
BM
BM
HAZ
BM
BM
BM
BM
BM
BM
*Note: Min. Creep Rate is based on displacement of a 2” specimen gauge length with a GTAW weldment in the center of the gauge
56
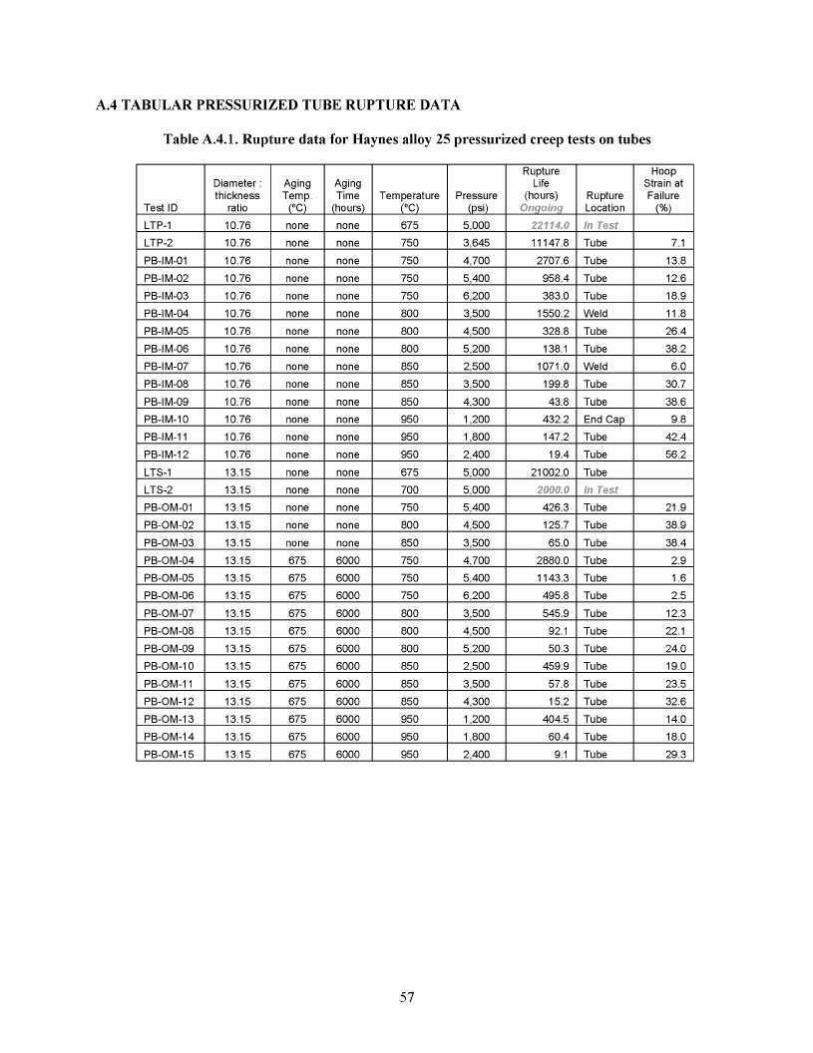
A.4 TABULAR PRESSURIZED TUBE RUPTURE DATA
Table A.4.1. Rupture data for Haynes alloy 25 pressurized creep tests on tubes
Test ID LTP-1 LTP-2
PB-IM-01 PB-IM-02 PB-IM-03 PB-IM-04
PB-IM-05 PB-IM-06 PB-IM-07 PB-IM-08
PB-IM-09 PB-IM-10 PB-IM-11 PB-IM-12
LTS-1 LTS-2 PB-OM-01 PB-OM-02
PB-OM-03 PB-OM-04 PB-OM-05 PB-OM-06
PB-OM-07 PB-OM-08 PB-OM-09 PB-OM-10
PB-OM-11 PB-OM-12 PB-OM-13 PB-OM-14
PB-OM-15
Diameter : thickness
ratio 10.76 10.76
10.76 10.76 10.76 10.76
10.76 10.76 10.76 10.76
10.76 10.76 10.76 10.76
13.15 13.15 13.15 13.15
13.15 13.15 13.15 13.15
13.15 13.15 13.15 13.15
13.15 13.15 13.15 13.15
13.15
Aging Temp.
(°C) none none
none none none none
none none none
none none none none none
none none none
none none 675 675 675
675 675 675 675
675 675 675 675
675
Aging Time
(hours) none none
none none none none
none none none
none none none none none
none none none
none none 6000 6000 6000
6000 6000 6000 6000
6000 6000 6000 6000
6000
Temperature (°C) 675 750
750 750 750 800
800 800 850 850
850 950 950 950
675 700 750 800
850 750 750 750
800 800 800 850
850 850 950 950
950
Pressure (psi)
5,000 3,645
4,700 5,400 6,200 3,500
4,500 5,200 2,500 3,500
4,300 1,200 1,800 2,400
5,000 5,000 5,400 4,500
3,500 4,700 5,400 6,200
3,500 4,500 5,200 2,500
3,500 4,300 1,200 1,800
2,400
Rupture Life
(hours) Ongoing
11147.8
2707.6 958.4 383.0
1550.2
328.8 138.1
1071.0 199.8
43.8 432.2 147.2 19.4
21002.0
426.3 125.7
65.0 2880.0 1143.3 495.8
545.9 92.1 50.3
459.9
57.8 15.2
404.5 60.4
9.1
Rupture Location In Test Tube
Tube Tube Tube Weld
Tube Tube Weld
Tube Tube End Cap Tube Tube
Tube In Test Tube
Tube Tube Tube Tube Tube
Tube Tube Tube Tube
Tube Tube Tube Tube
Tube
Hoop Strain at Failure
(%)
7.1
13.8 12.6 18.9 11.8
26.4 38.2 6.0
30.7
38.6 9.8
42.4 56.2
21.9 38.9
38.4 2.9 1.6 2.5
12.3 22.1 24.0 19.0
23.5 32.6 14.0 18.0
29.3
57
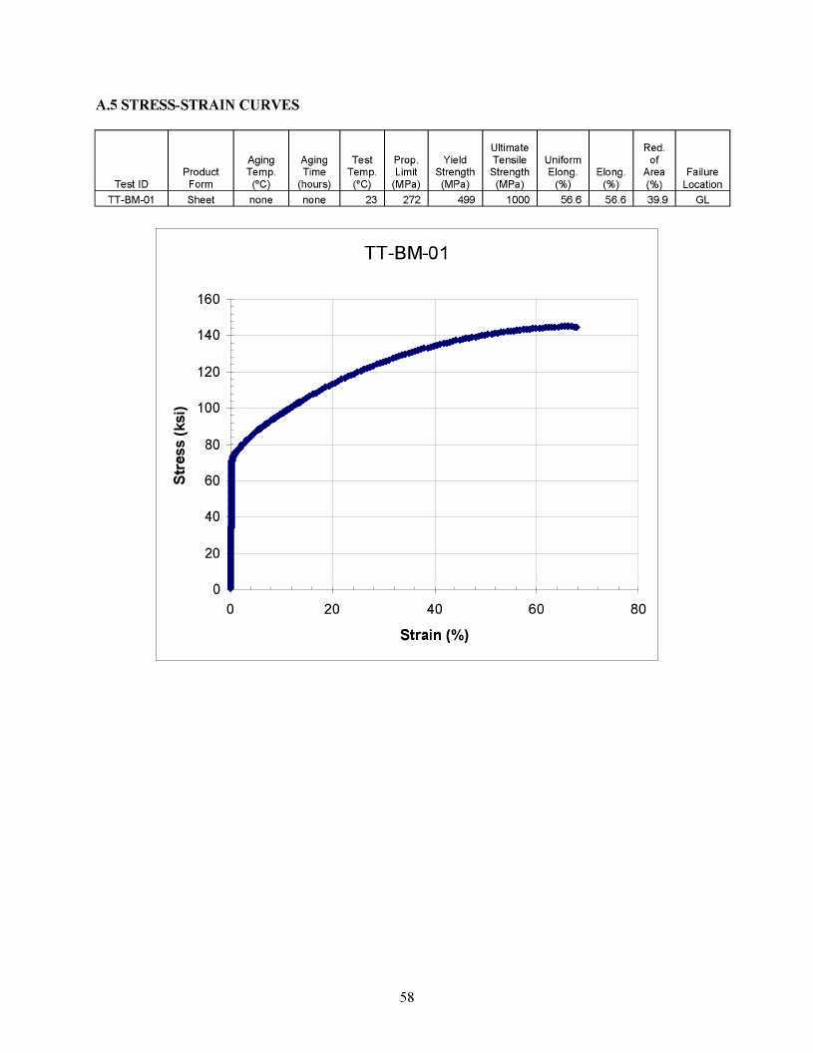
A.5 STRESS-STRAIN CURVES
Test ID Product Form
Aging Temp.
(ºC)
Aging Time
(hours)
Test Temp.
(ºC)
Prop. Limit (MPa)
Yield Strength
(MPa)
Ultimate Tensile Strength
(MPa)
Uniform Elong. (%)
Elong. (%)
Red. of
Area (%)
Failure Location
TT-BM-01 Sheet none none 23 272 499 1000 56.6 56.6 39.9 GL
58
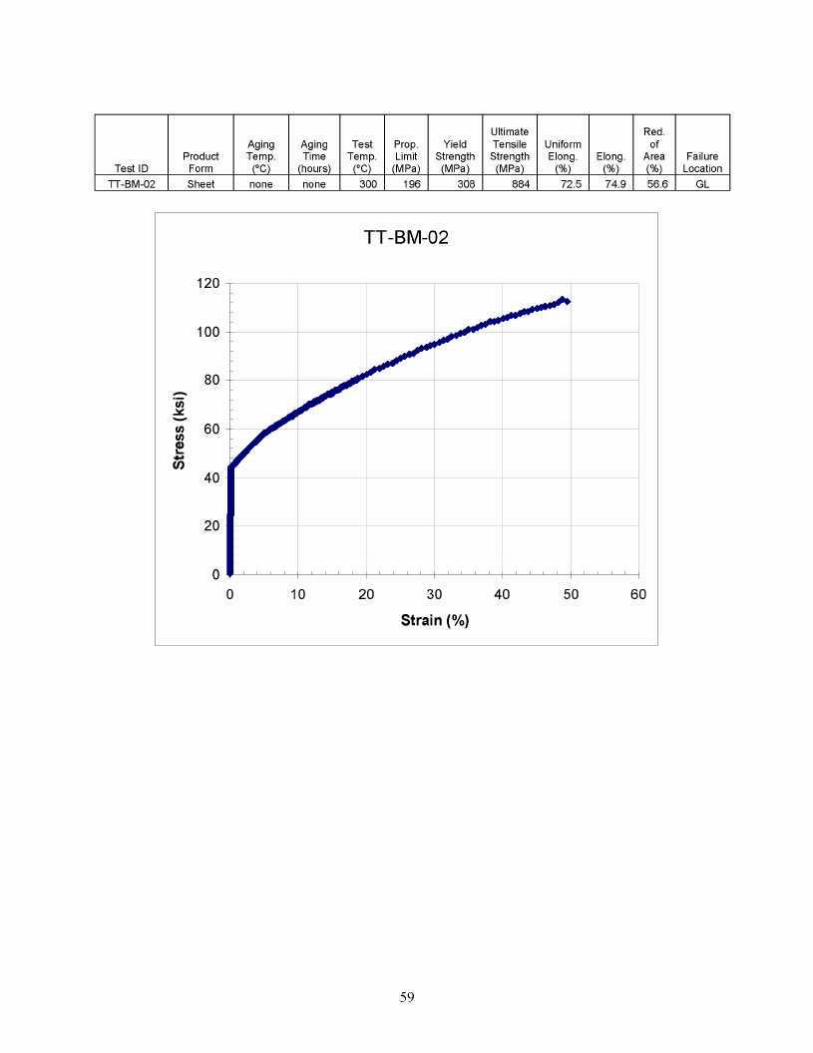
Test ID Product Form
Aging Temp.
(ºC)
Aging Time
(hours)
Test Temp.
(ºC)
Prop. Limit (MPa)
Yield Strength
(MPa)
Ultimate Tensile Strength
(MPa)
Uniform Elong. (%)
Elong. (%)
Red. of
Area (%)
Failure Location
TT-BM-02 Sheet none none 300 196 308 884 72.5 74.9 56.6 GL
59
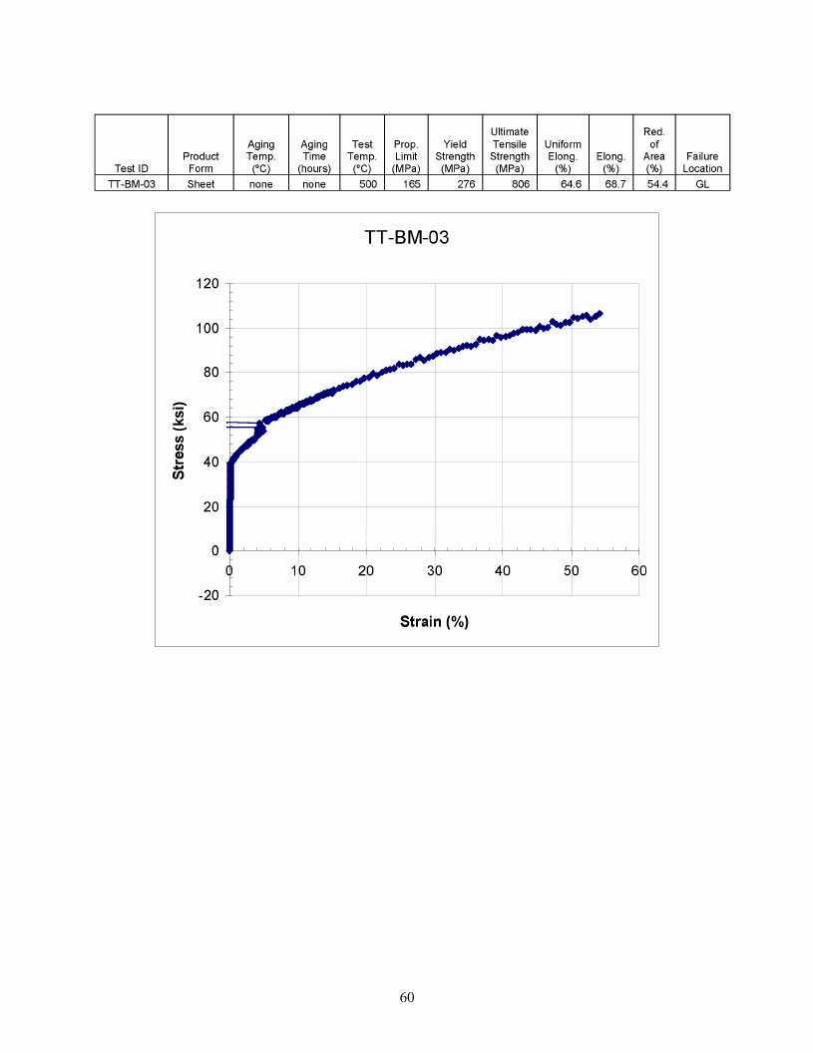
Test ID Product Form
Aging Temp.
(ºC)
Aging Time
(hours)
Test Temp.
(ºC)
Prop. Limit (MPa)
Yield Strength
(MPa)
Ultimate Tensile Strength
(MPa)
Uniform Elong. (%)
Elong. (%)
Red. of
Area (%)
Failure Location
60
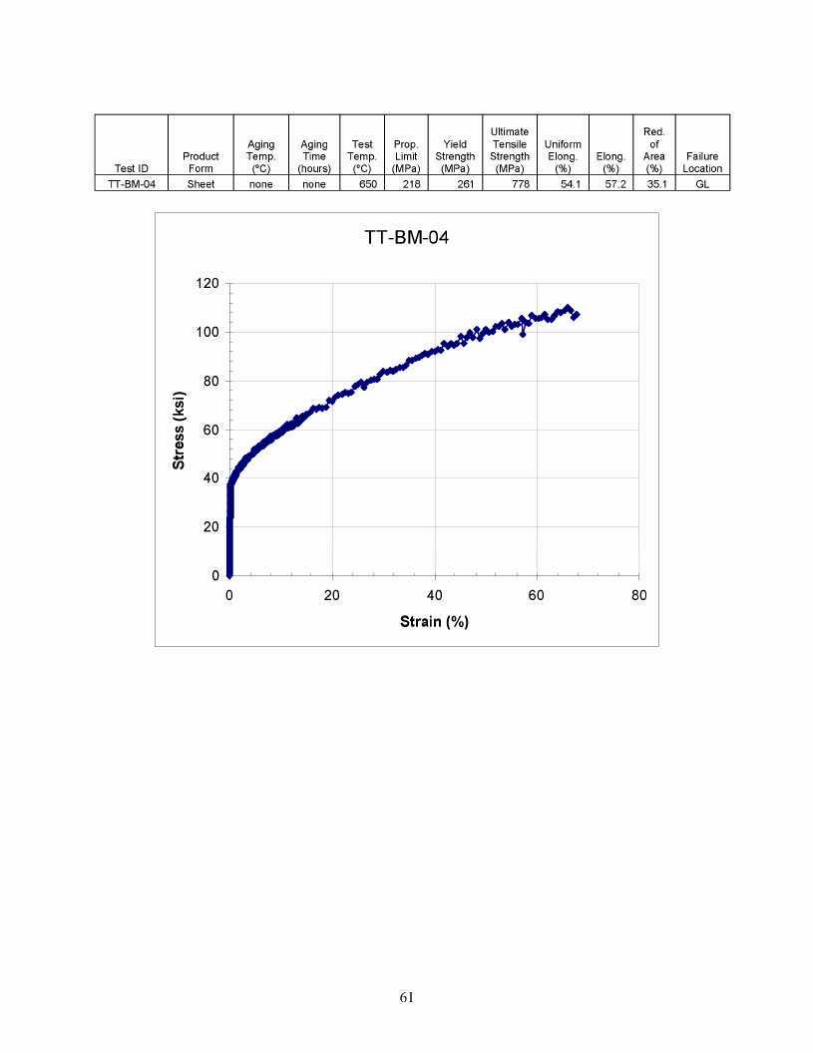
Test ID Product Form
Aging Temp.
(ºC)
Aging Time
(hours)
Test Temp.
(ºC)
Prop. Limit (MPa)
Yield Strength
(MPa)
Ultimate Tensile Strength
(MPa)
Uniform Elong. (%)
Elong. (%)
Red. of
Area (%)
Failure Location
TT-BM-04 Sheet none none 650 218 261 778 54.1 57.2 35.1 GL
61
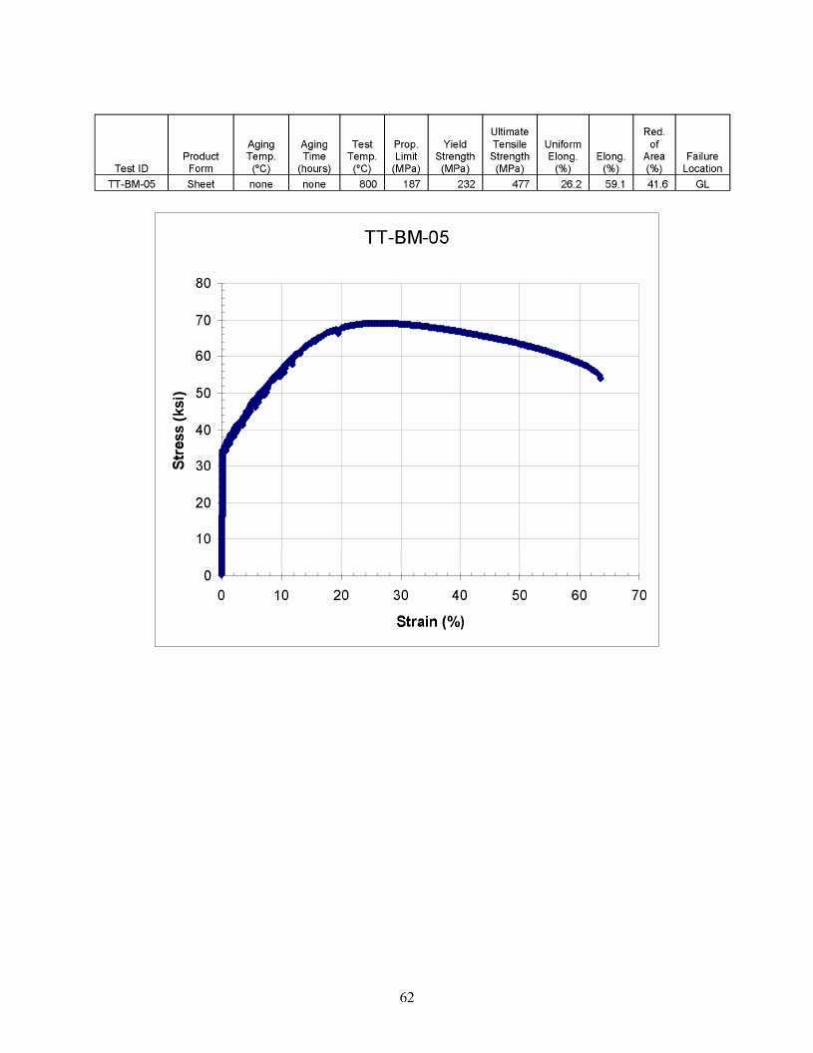
Test ID Product Form
Aging Temp.
(ºC)
Aging Time
(hours)
Test Temp.
(ºC)
Prop. Limit (MPa)
Yield Strength
(MPa)
Ultimate Tensile Strength
(MPa)
Uniform Elong. (%)
Elong. (%)
Red. of
Area (%)
Failure Location
TT-BM-05 Sheet none none 800 187 232 477 26.2 59.1 41.6 GL
62
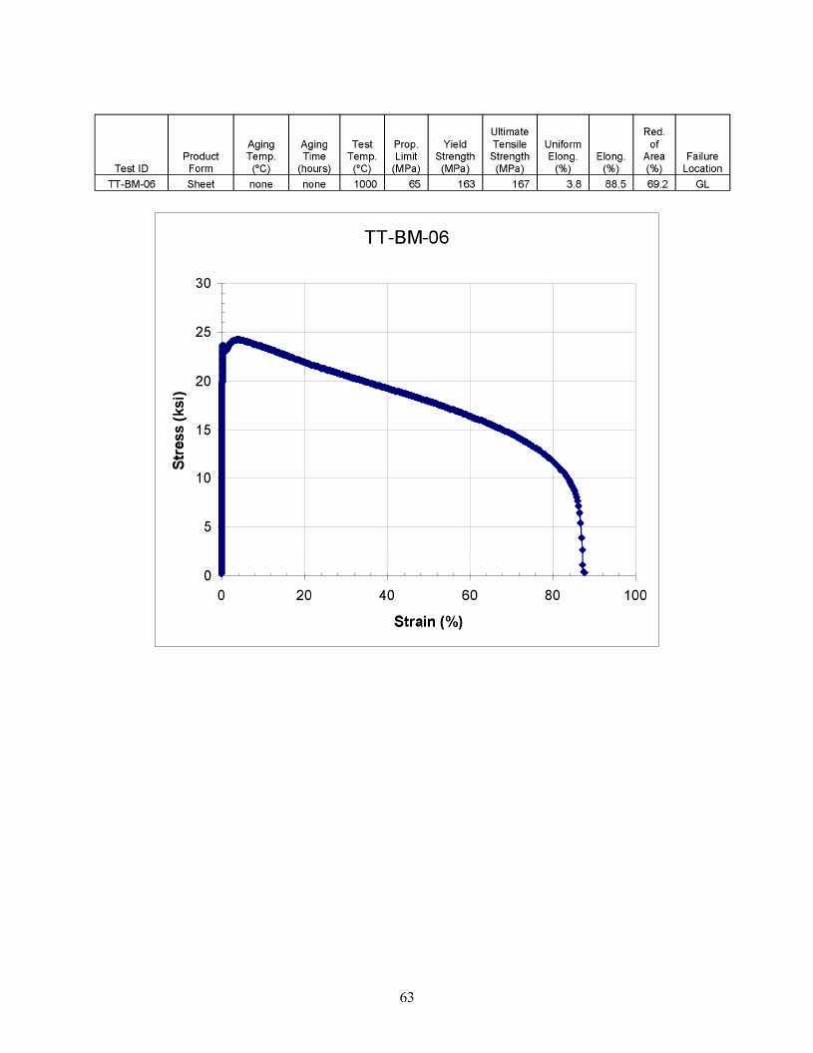
Test ID Product Form
Aging Temp.
(ºC)
Aging Time
(hours)
Test Temp.
(ºC)
Prop. Limit (MPa)
Yield Strength
(MPa)
Ultimate Tensile Strength
(MPa)
Uniform Elong. (%)
Elong. (%)
Red. of
Area (%)
Failure Location
TT-BM-06 Sheet 1000 65 163 167 3.8 88.5 69.2 GL
30
25
20
15
10
5
0 0
TT-BM-06
20 40 60 80 100
Strain (%)
63
none none
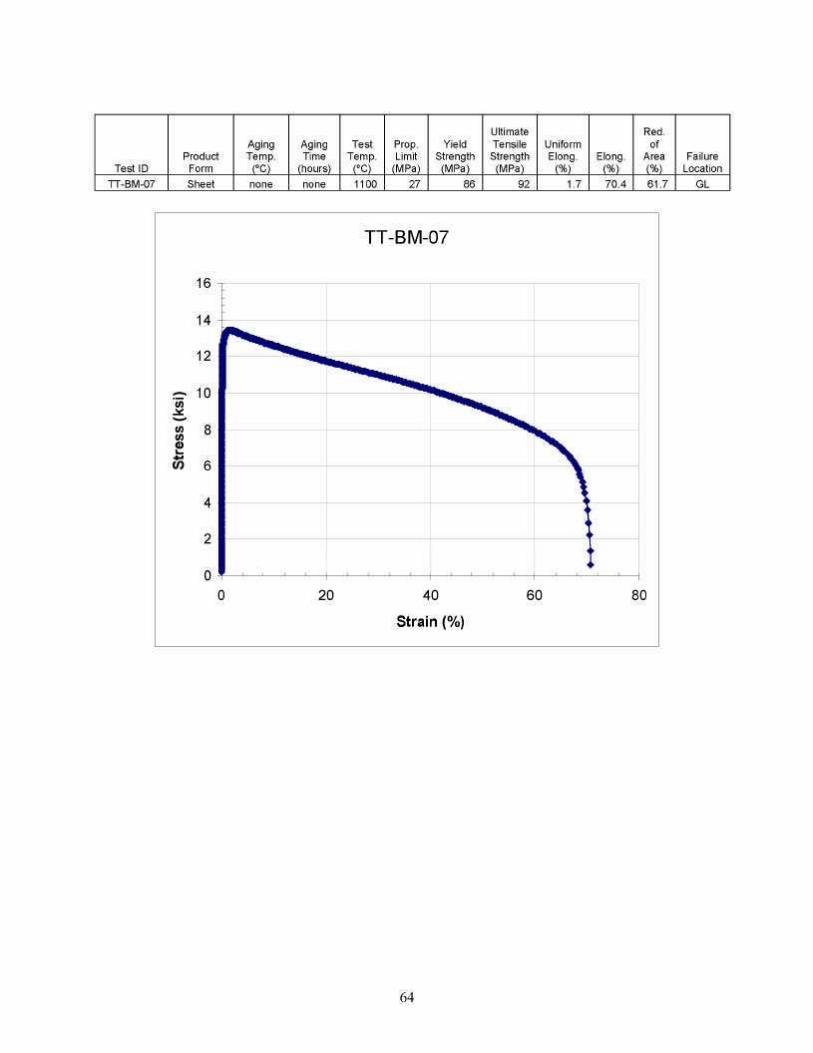
Test ID Product Form
Aging Temp.
(ºC)
Aging Time
(hours)
Test Temp.
(ºC)
Prop. Limit (MPa)
Yield Strength
(MPa)
Ultimate Tensile Strength
(MPa)
Uniform Elong. (%)
Elong. (%)
Red. of
Area (%)
Failure Location
TT-BM-07 Sheet none none 1100 27 86 92 1.7 70.4 61.7 GL
64
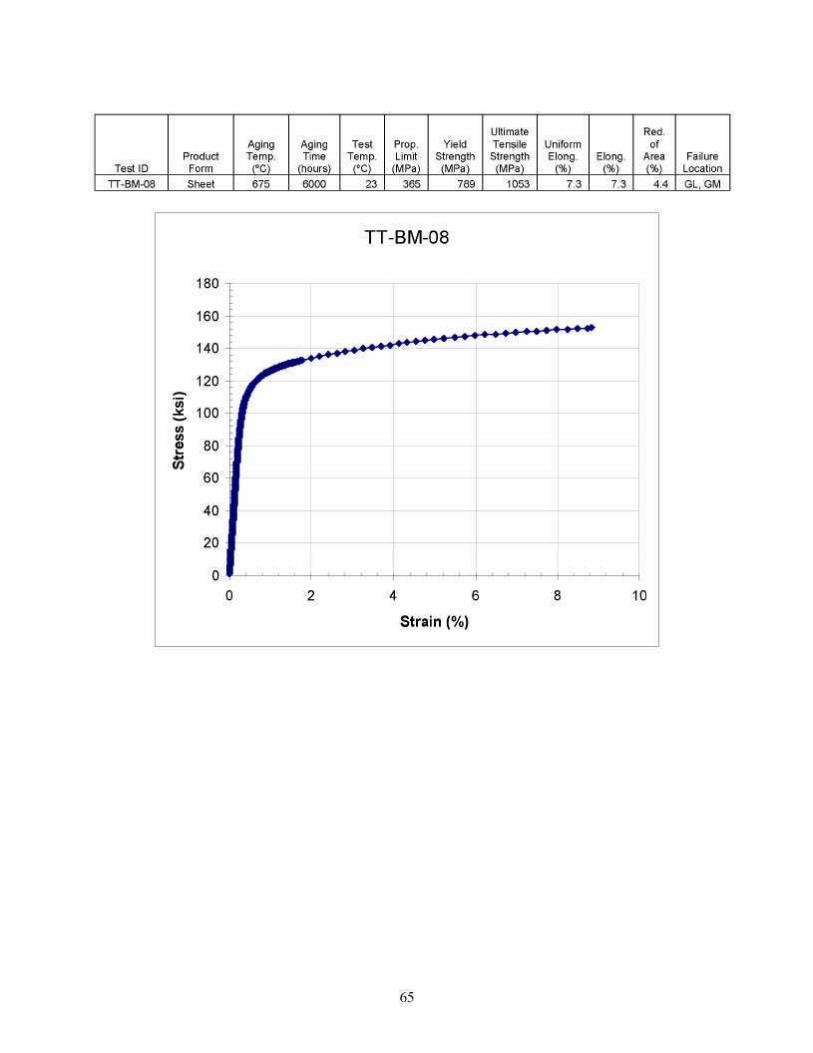
Test ID Product Form
Aging Temp.
(ºC)
Aging Time
(hours)
Test Temp.
(ºC)
Prop. Limit (MPa)
Yield Strength
(MPa)
Ultimate Tensile Strength
(MPa)
Uniform Elong. (%)
Elong. (%)
Red. of
Area (%)
Failure Location
TT-BM-08 Sheet 675 6000 23 365 789 1053 7.3 7.3 4.4 GL, GM
180
160
140
120
100
80
60
40
20
0 ' 0
TT-BM-08
2 4 6 8 10
Strain (%)
65

Test ID Product Form
Aging Temp.
(ºC)
Aging Time
(hours)
Test Temp.
(ºC)
Prop. Limit (MPa)
Yield Strength
(MPa)
Ultimate Tensile Strength
(MPa)
Uniform Elong. (%)
Elong. (%)
Red. of
Area (%)
Failure Location
TT-BM-08B Sheet 675 6000 23 549 792 1045 8.4 8.4 5.8 GL
160
140
120
100
80
60
40
20
0 ' 0
TT-BM-08b
2 4 6 8 10
Strain (%)
66
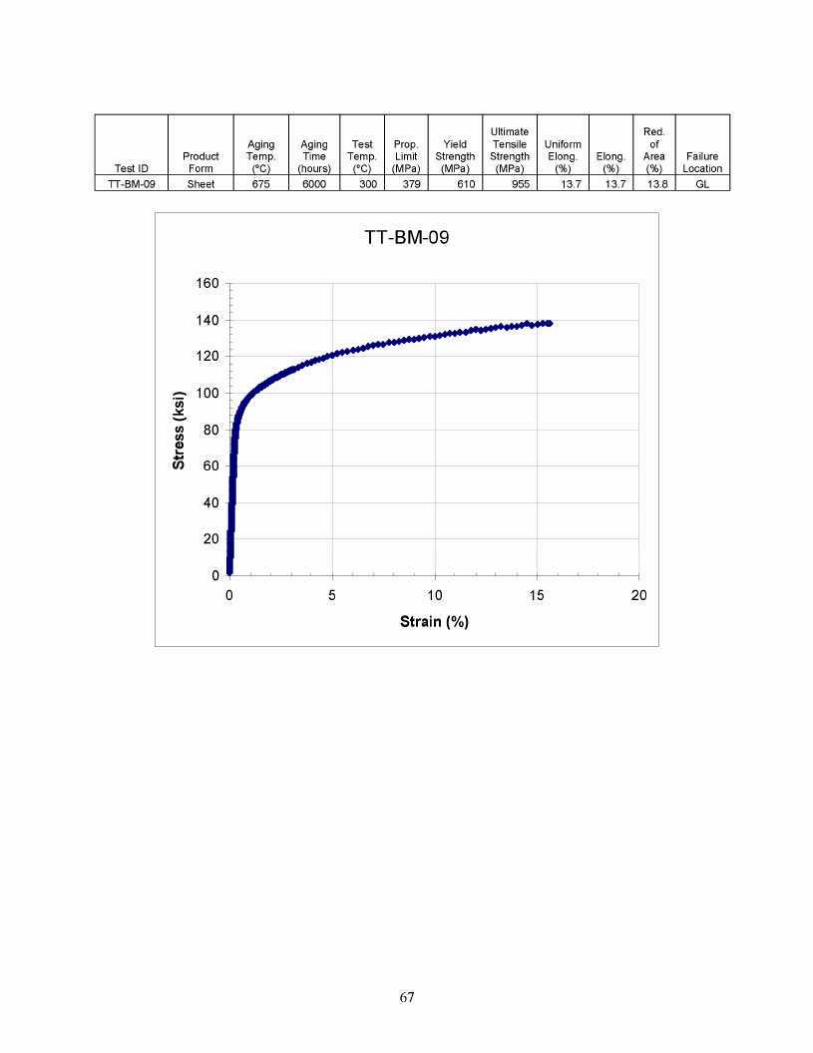
Test ID Product Form
Aging Temp.
(ºC)
Aging Time
(hours)
Test Temp.
(ºC)
Prop. Limit (MPa)
Yield Strength
(MPa)
Ultimate Tensile Strength
(MPa)
Uniform Elong. (%)
Elong. (%)
Red. of
Area (%)
Failure Location
TT-BM-09 Sheet 675 6000 300 379 610 955 13.7 13.7 13.8 GL
160
140
120
100
80
60
40
20 I
0 -0
TT-BM-09
5 10 15 20
Strain (%)
67
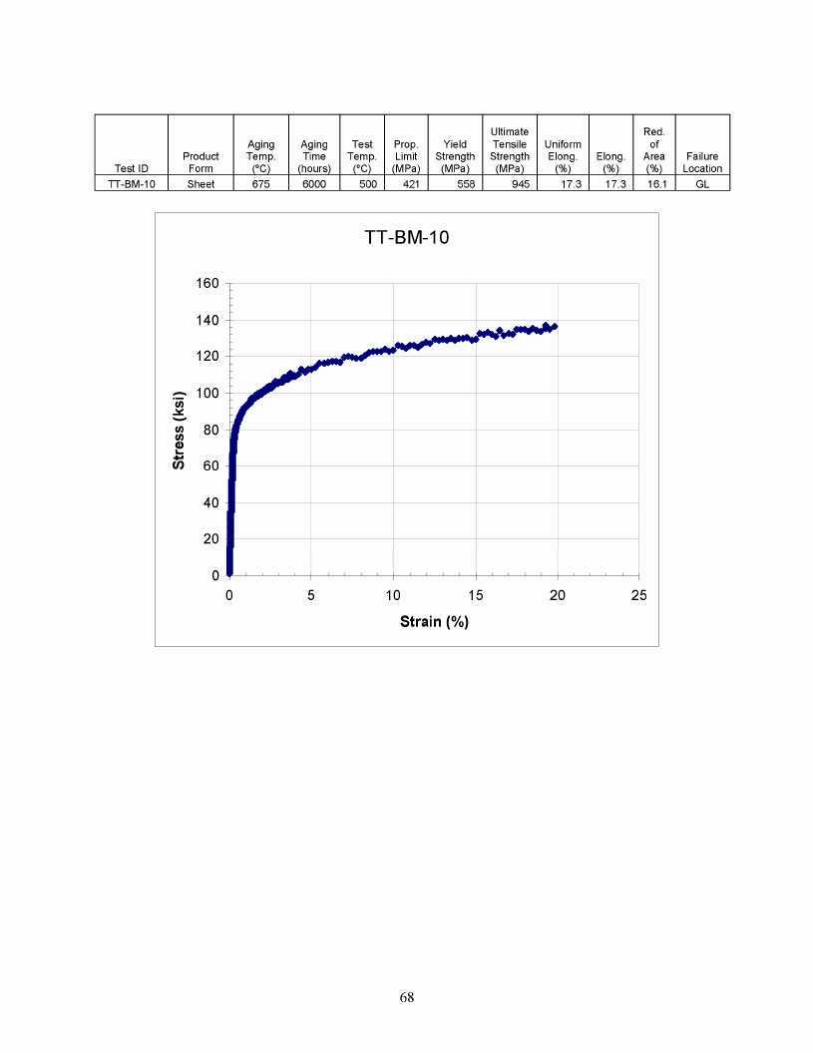
Test ID Product Form
Aging Temp.
(ºC)
Aging Time
(hours)
Test Temp.
(ºC)
Prop. Limit (MPa)
Yield Strength
(MPa)
Ultimate Tensile Strength
(MPa)
Uniform Elong. (%)
Elong. (%)
Red. of
Area (%)
Failure Location
TT-BM-10 Sheet 675 6000 500 421 558 945 17.3 17.3 16.1 GL
160
140
120
100
80
60
40 J
20 j
0 ' 0
TT-BM-10
5 10 15 20 25
Strain (%)
68
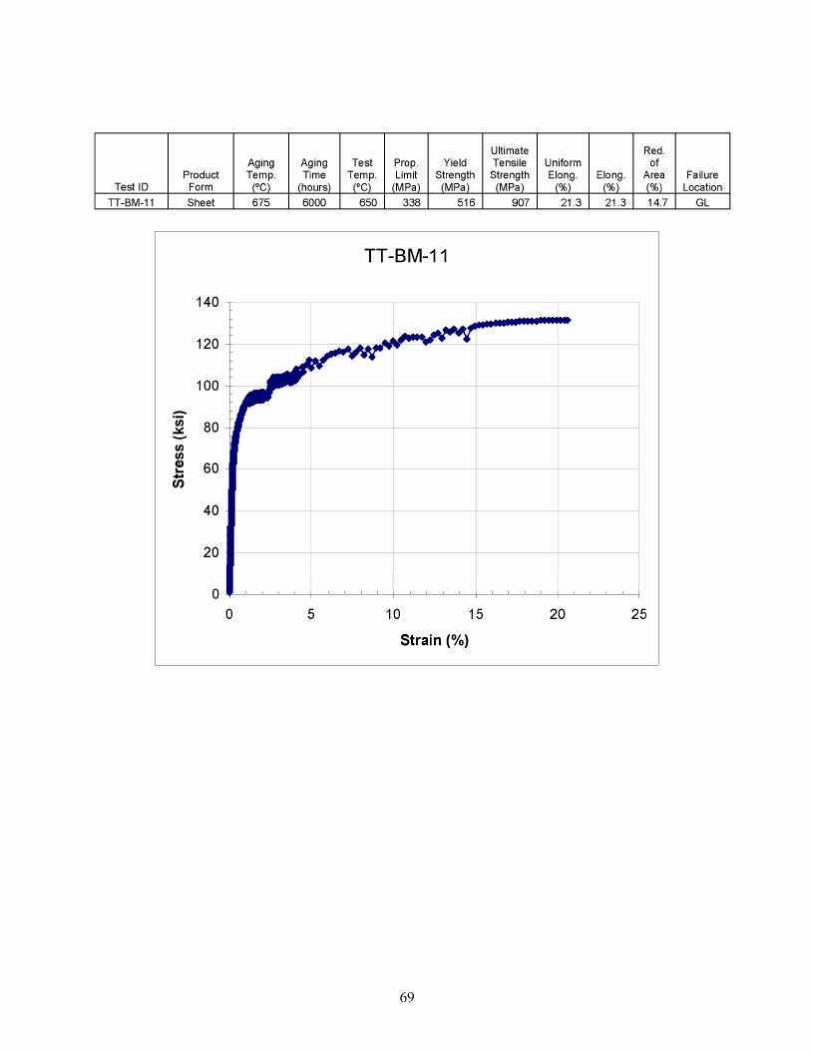
Test ID Product Form
Aging Temp.
(ºC)
Aging Time
(hours)
Test Temp.
(ºC)
Prop. Limit (MPa)
Yield Strength
(MPa)
Ultimate Tensile Strength
(MPa)
Uniform Elong. (%)
Elong. (%)
Red. of
Area (%)
Failure Location
TT-BM-11 Sheet 675 6000 650 338 516 907 21.3 21.3 14.7 GL
69
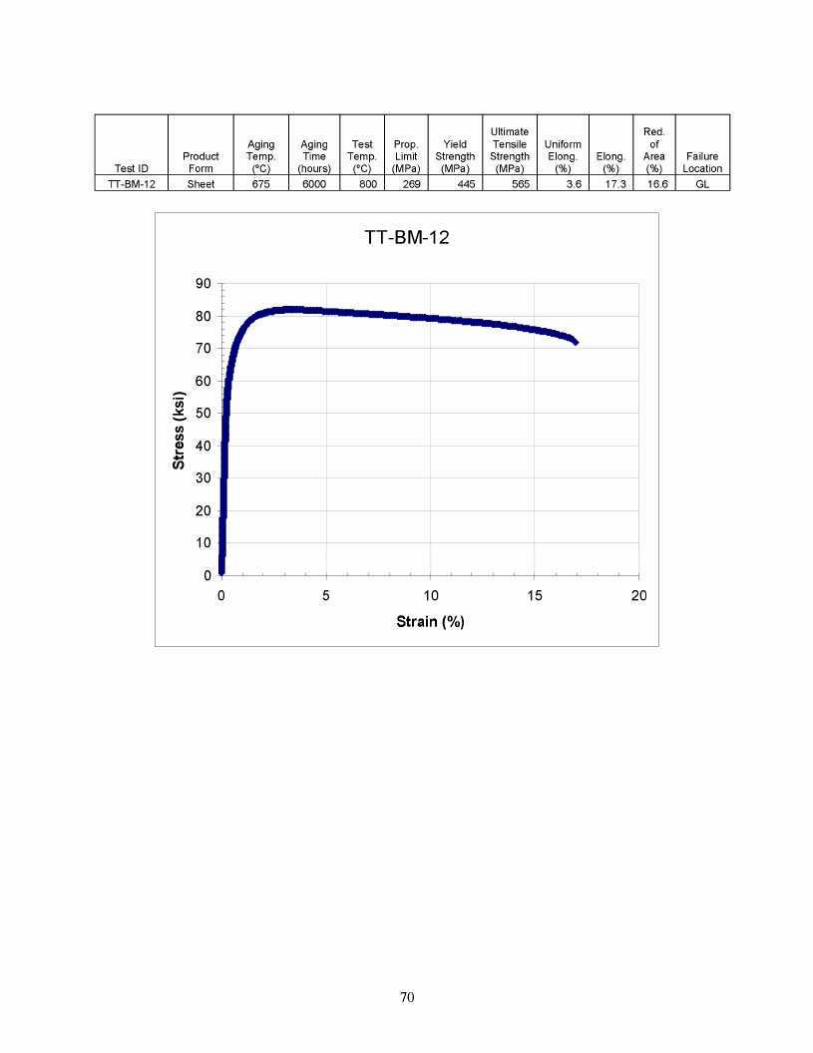
Test ID Product Form
Aging Temp.
(ºC)
Aging Time
(hours)
Test Temp.
(ºC)
Prop. Limit (MPa)
Yield Strength
(MPa)
Ultimate Tensile Strength
(MPa)
Uniform Elong. (%)
Elong. (%)
Red. of
Area (%)
Failure Location
TT-BM-12 Sheet 675 6000 800 269 445 565 3.6 17.3 16.6 GL
70
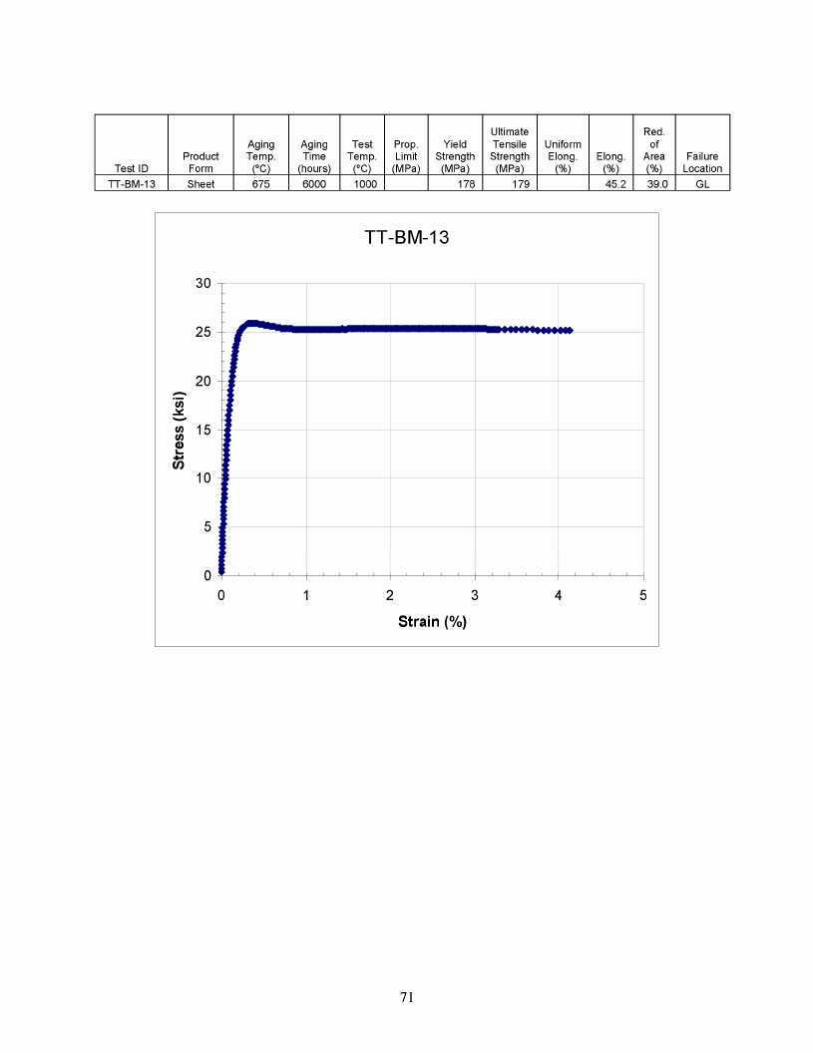
Test ID Product Form
Aging Temp.
(ºC)
Aging Time
(hours)
Test Temp.
(ºC)
Prop. Limit (MPa)
Yield Strength
(MPa)
Ultimate Tensile Strength
(MPa)
Uniform Elong. (%)
Elong. (%)
Red. of
Area (%)
Failure Location
71
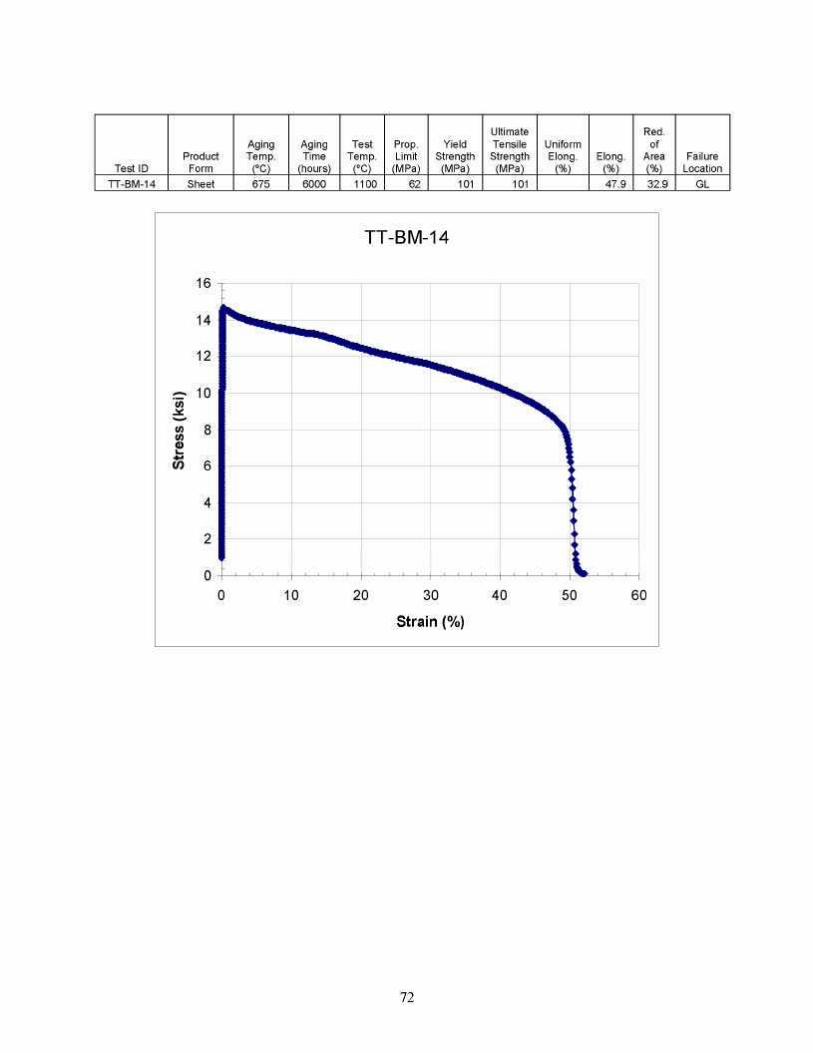
Test ID Product Form
Aging Temp.
(ºC)
Aging Time
(hours)
Test Temp.
(ºC)
Prop. Limit (MPa)
Yield Strength
(MPa)
Ultimate Tensile Strength
(MPa)
Uniform Elong. (%)
Elong. (%)
Red. of
Area (%)
Failure Location
TT-BM-14 Sheet 675 6000 1100 62 101 101 47.9 32.9 GL
16
14
12
10
8
6
4
2
0 0
TT-BM-14
i... 10 20 30 40 50 60
Strain (%)
72
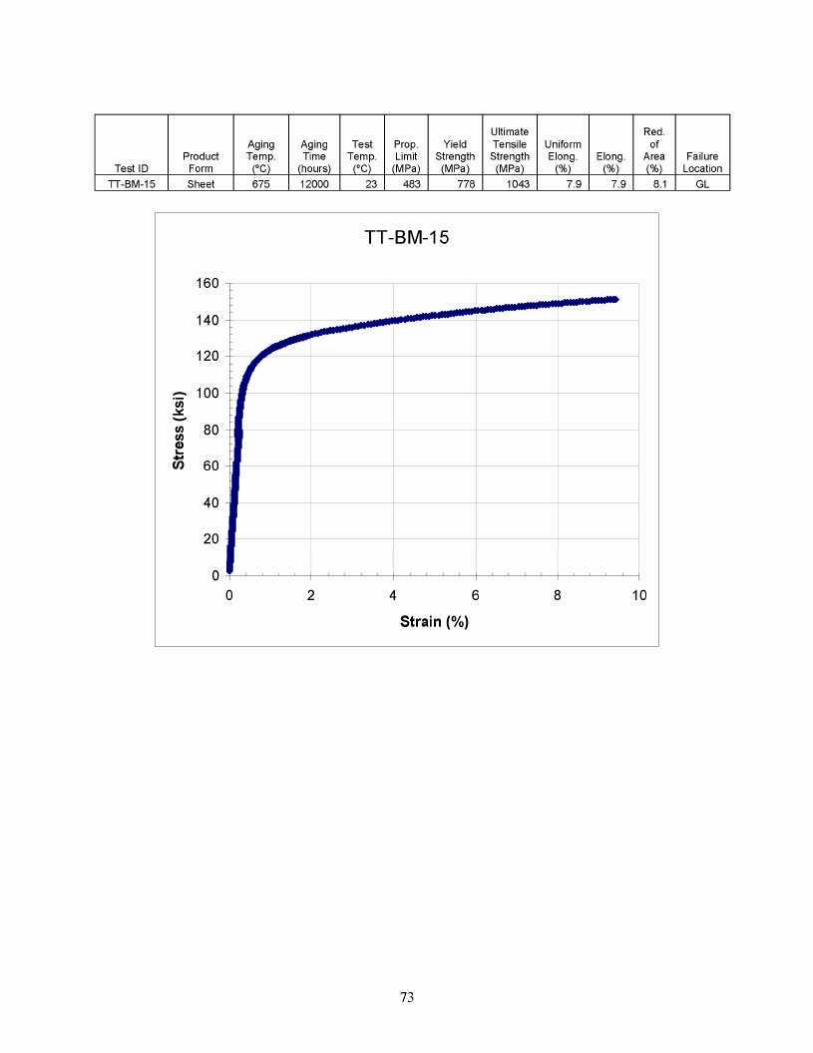
Test ID Product Form
Aging Temp.
(ºC)
Aging Time
(hours)
Test Temp.
(ºC)
Prop. Limit (MPa)
Yield Strength
(MPa)
Ultimate Tensile Strength
(MPa)
Uniform Elong. (%)
Elong. (%)
Red. of
Area (%)
Failure Location
TT-BM-15 Sheet 675 12000 23 483 778 1043 7.9 7.9 8.1 GL
73
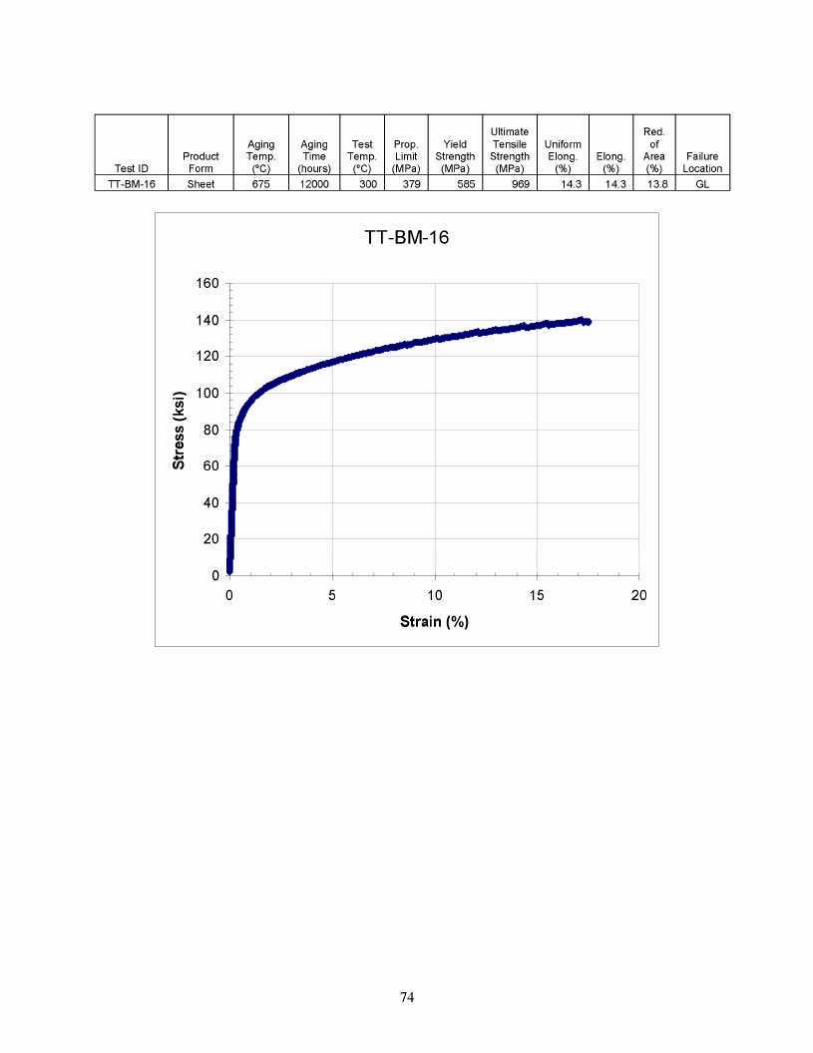
Test ID Product Form
Aging Temp.
(ºC)
Aging Time
(hours)
Test Temp.
(ºC)
Prop. Limit (MPa)
Yield Strength
(MPa)
Ultimate Tensile Strength
(MPa)
Uniform Elong. (%)
Elong. (%)
Red. of
Area (%)
Failure Location
TT-BM-16 Sheet 675 12000 300 379 585 969 14.3 14.3 13.8 GL
TT-BM-16
160
140
120
100
80
60
40
20
0 0 5 10 15 20
Strain (%)
74
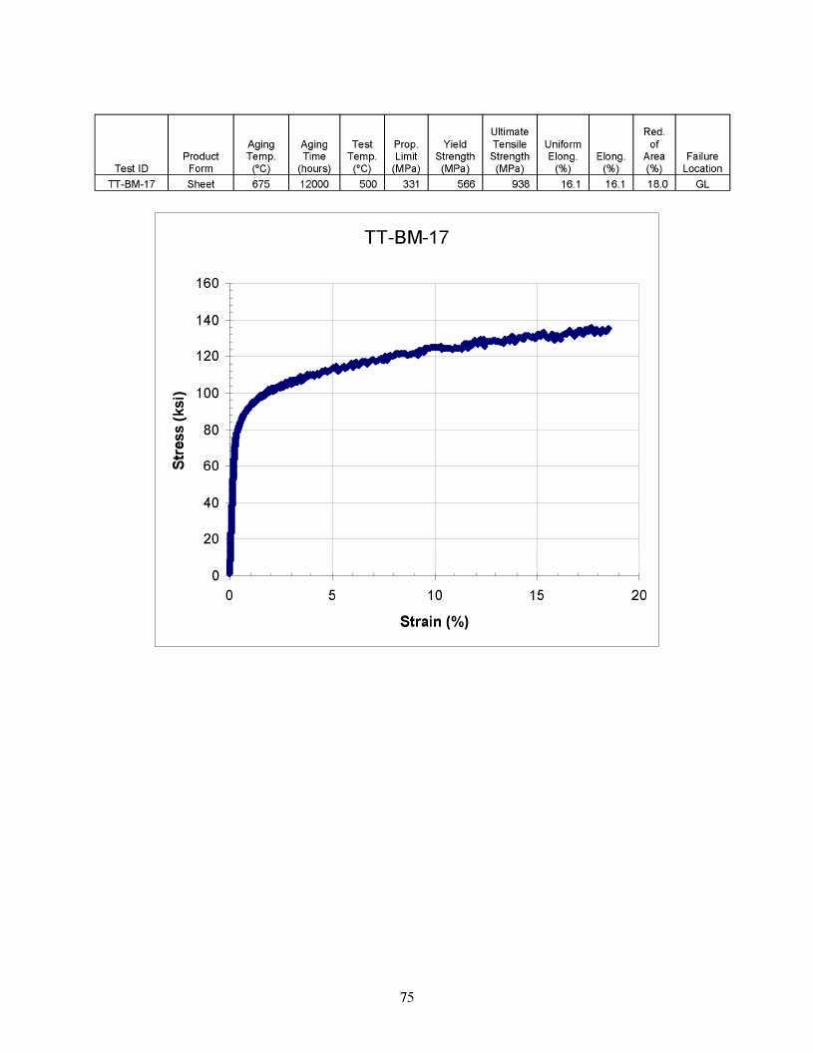
Test ID Product Form
Aging Temp.
(ºC)
Aging Time
(hours)
Test Temp.
(ºC)
Prop. Limit (MPa)
Yield Strength
(MPa)
Ultimate Tensile Strength
(MPa)
Uniform Elong. (%)
Elong. (%)
Red. of
Area (%)
Failure Location
TT-BM-17 Sheet 675 12000 500 331 566 938 16.1 16.1 18.0 GL
75
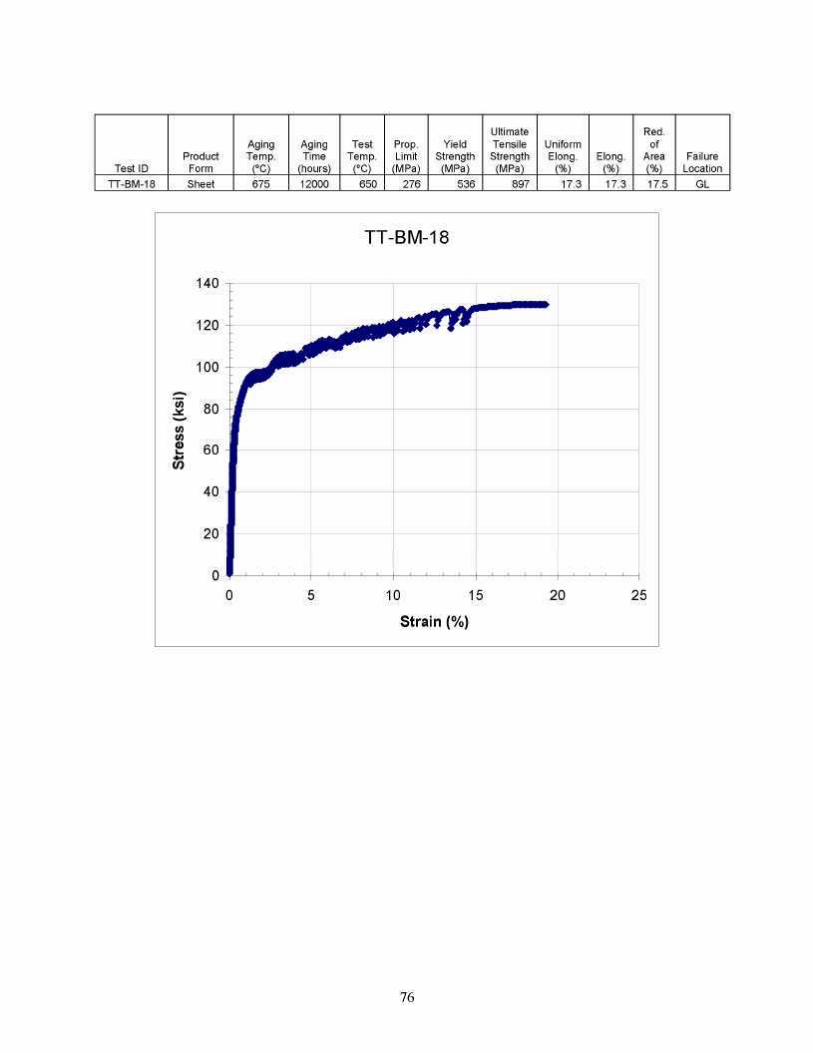
Test ID Product Form
Aging Temp.
(ºC)
Aging Time
(hours)
Test Temp.
(ºC)
Prop. Limit (MPa)
Yield Strength
(MPa)
Ultimate Tensile Strength
(MPa)
Uniform Elong. (%)
Elong. (%)
Red. of
Area (%)
Failure Location
TT-BM-18 Sheet 675 12000 650 276 536 897 17.3 17.3 17.5 GL
140
120
100
80
60
40 i
20 J
0 ' 0
TT-BM-18
5 10 15 20 25
Strain (%)
76

Test ID Product Form
Aging Temp.
(ºC)
Aging Time
(hours)
Test Temp.
(ºC)
Prop. Limit (MPa)
Yield Strength
(MPa)
Ultimate Tensile Strength
(MPa)
Uniform Elong. (%)
Elong. (%)
Red. of
Area (%)
Failure Location
TT-BM-19 Sheet 675 12000 800 221 414 553 3.5 9.8 10.3 GL
90
80
70
60
50
40
30
20
10 |
0 -0
TT-BM-19
2 4 6 8 10 12
Strain (%)
77
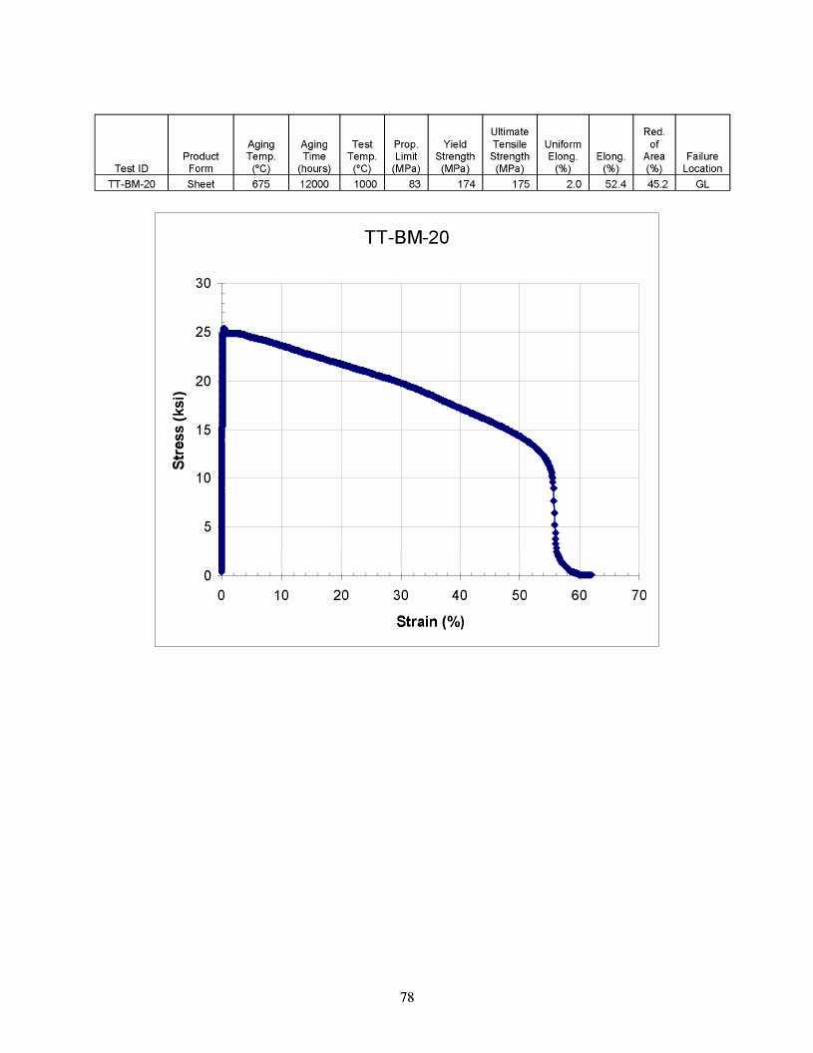
Test ID Product Form
Aging Temp.
(ºC)
Aging Time
(hours)
Test Temp.
(ºC)
Prop. Limit (MPa)
Yield Strength
(MPa)
Ultimate Tensile Strength
(MPa)
Uniform Elong. (%)
Elong. (%)
Red. of
Area (%)
Failure Location
TT-BM-20 Sheet 675 12000 1000 83 174 175 2.0 52.4 45.2 GL
30
25
20
15
10
5
0 0
TT-BM-20
10 20 30 40 50 60 70
Strain (%)
78
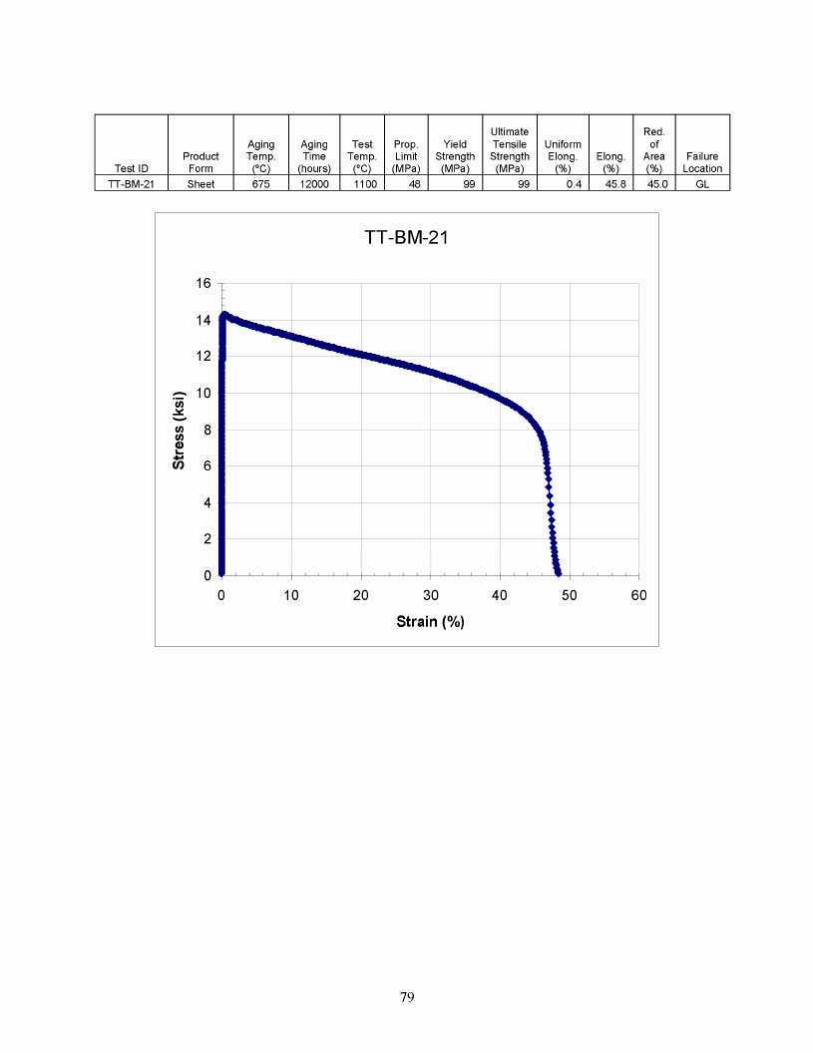
Test ID Product Form
Aging Temp.
(ºC)
Aging Time
(hours)
Test Temp.
(ºC)
Prop. Limit (MPa)
Yield Strength
(MPa)
Ultimate Tensile Strength
(MPa)
Uniform Elong. (%)
Elong. (%)
Red. of
Area (%)
Failure Location
TT-BM-21 Sheet 675 12000 1100 48 99 99 0.4 45.8 45.0 GL
16
14
12
10
8
6
4
2
0 0
TT-BM-21
10 20 30 40 50 60
Strain (%)
79
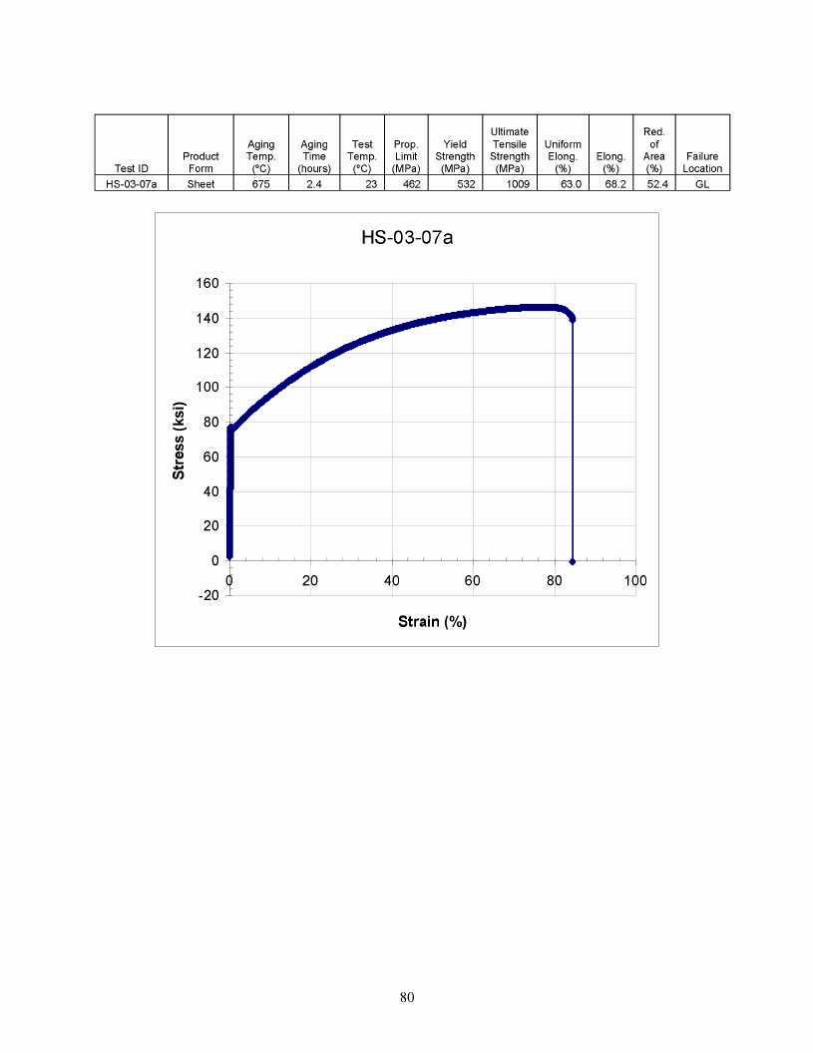
Test ID HS-03-07a
Product Form Sheet
Aging Temp.
(ºC) 675
Aging Time
(hours) 2.4
Test Temp.
(ºC) 23
Prop. Limit (MPa)
462
Yield Strength
(MPa) 532
Ultimate Tensile Strength
(MPa) 1009
Uniform Elong. (%) 63.0
Elong. (%) 68.2
Red. of
Area (%) 52.4
Failure Location
GL
80
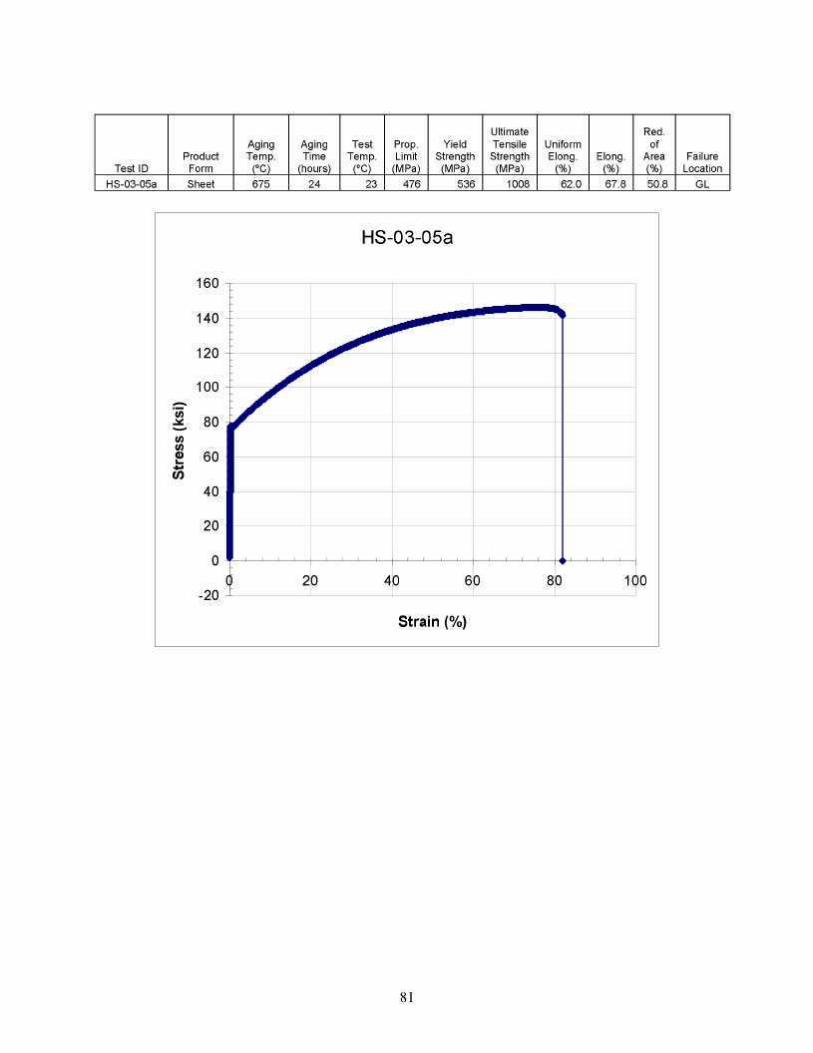
Test ID Product Form
Aging Temp.
(ºC)
Aging Time
(hours)
Test Temp.
(ºC)
Prop. Limit (MPa)
Yield Strength
(MPa)
Ultimate Tensile Strength
(MPa)
Uniform Elong. (%)
Elong. (%)
Red. of
Area (%)
Failure Location
HS-03-05a Sheet 675 24 23 476 536 1008 62.0 67.8 50.8 GL
160
140
120
100
80
60
40
20
0 (
-20 0
HS-03-05a
5 20 40 60 80 10
Strain (%)
,0
81

Test ID Product Form
Aging Temp.
(ºC)
Aging Time
(hours)
Test Temp.
(ºC)
Prop. Limit (MPa)
Yield Strength
(MPa)
Ultimate Tensile Strength
(MPa)
Uniform Elong. (%)
Elong. (%)
Red. of
Area (%)
Failure Location
HS-03-03a Sheet 675 240 23 421 536 970 38.0 38.4 26.3 GL
82
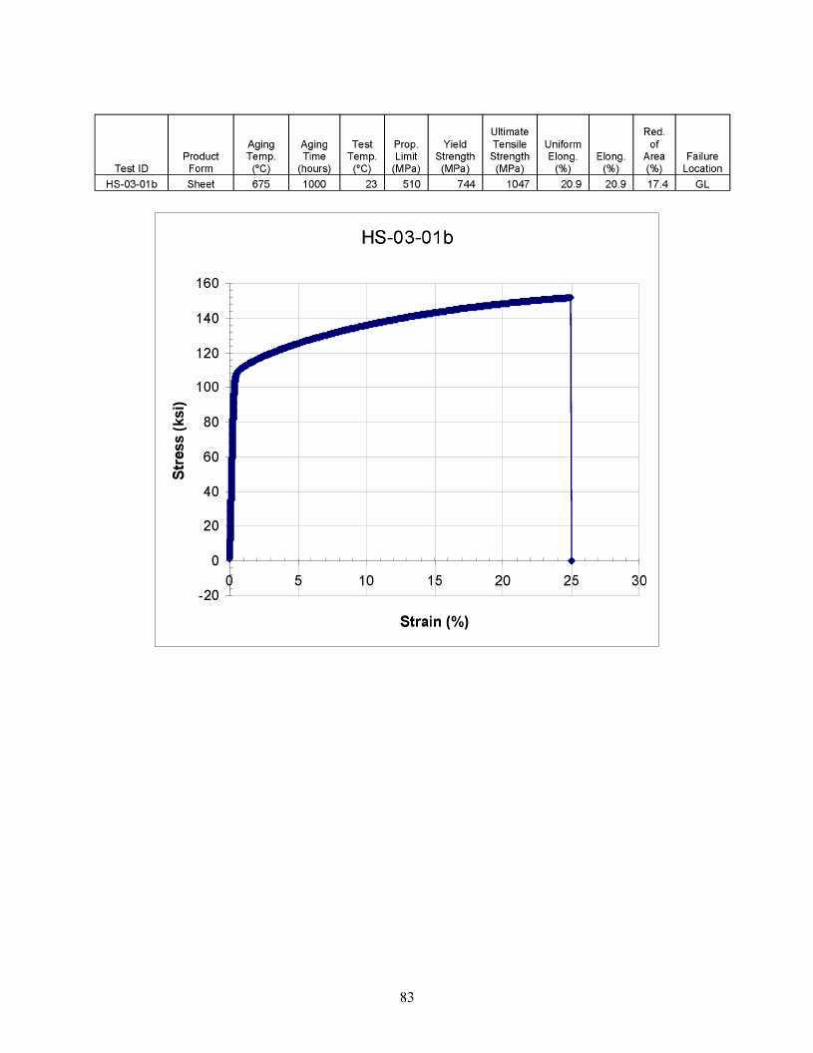
Test ID Product Form
Aging Temp.
(ºC)
Aging Time
(hours)
Test Temp.
(ºC)
Prop. Limit (MPa)
Yield Strength
(MPa)
Ultimate Tensile Strength
(MPa)
Uniform Elong. (%)
Elong. (%)
Red. of
Area (%)
Failure Location
HS-03-01b Sheet 675 1000 23 510 744 1047 20.9 20.9 17.4 GL
83
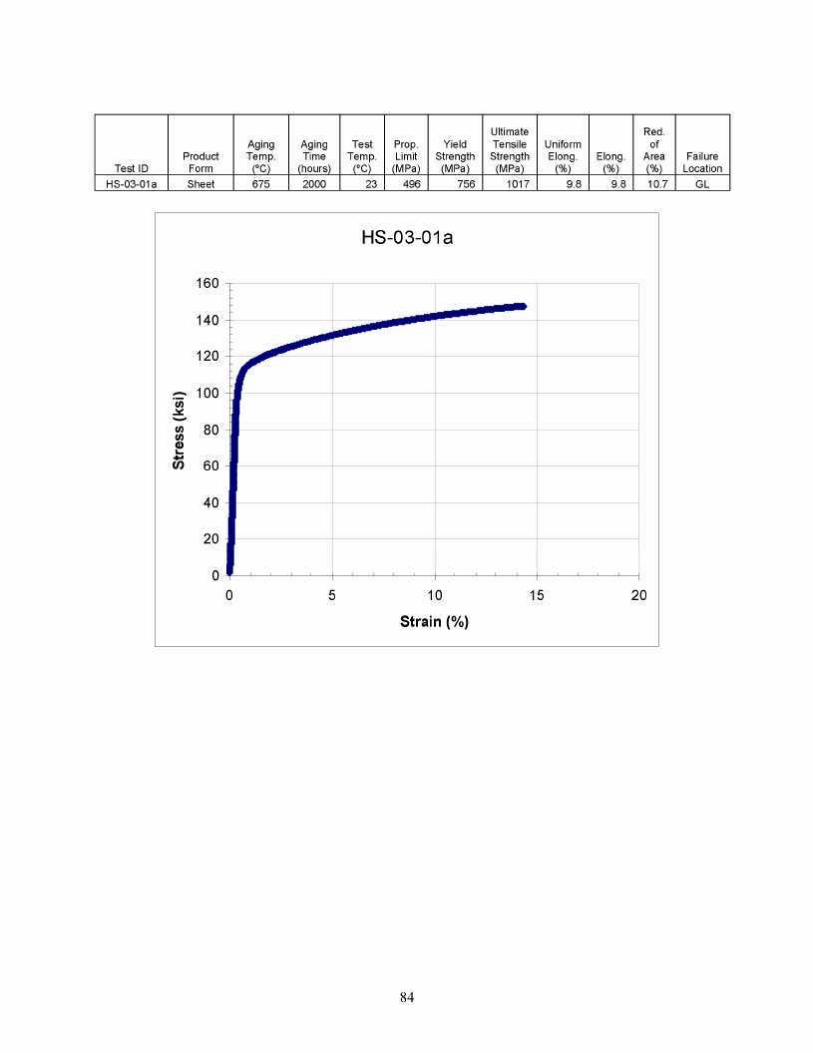
Test ID Product Form
Aging Temp.
(ºC)
Aging Time
(hours)
Test Temp.
(ºC)
Prop. Limit (MPa)
Yield Strength
(MPa)
Ultimate Tensile Strength
(MPa)
Uniform Elong. (%)
Elong. (%)
Red. of
Area (%)
Failure Location
HS-03-01a Sheet 675 2000 23 496 756 1017 9.8 9.8 10.7 GL
160
140
120
100
80
60
40
20 j
0 ' 0
HS-03-01a
5 10 15 20
Strain (%)
84
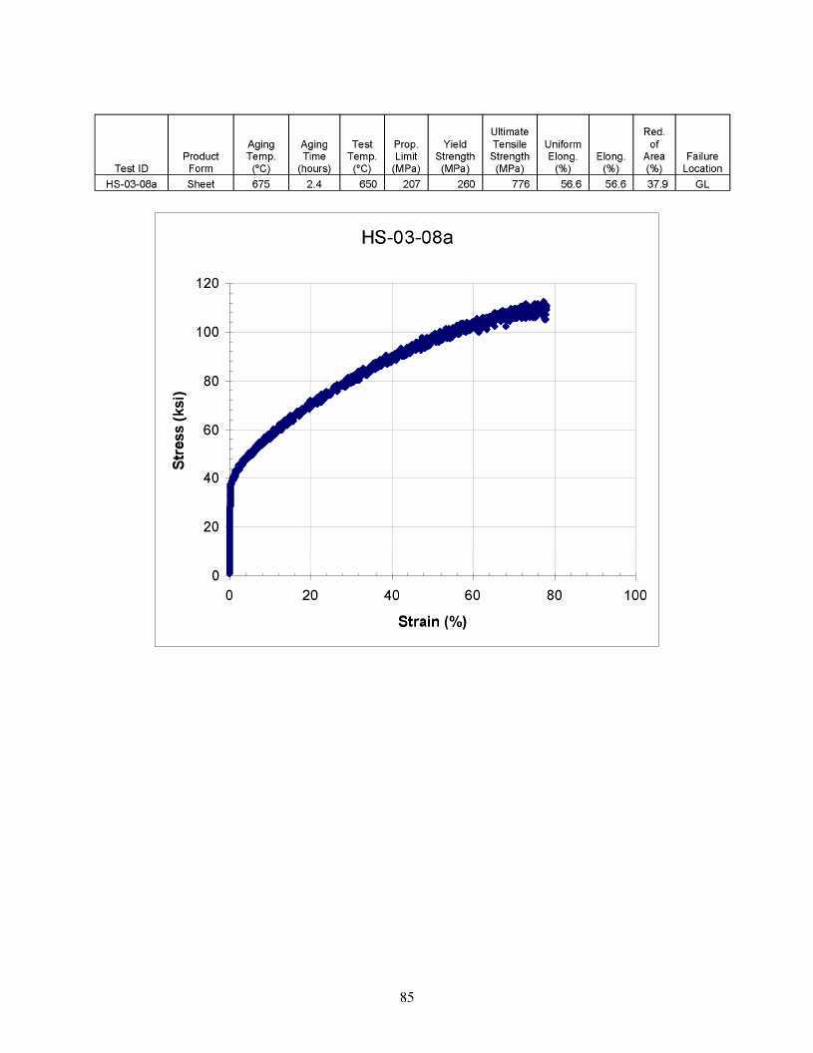
Test ID Product Form
Aging Temp.
(ºC)
Aging Time
(hours)
Test Temp.
(ºC)
Prop. Limit (MPa)
Yield Strength
(MPa)
Ultimate Tensile Strength
(MPa)
Uniform Elong. (%)
Elong. (%)
Red. of
Area (%)
Failure Location
HS-03-08a Sheet 675 2.4 650 207 260 776 56.6 56.6 37.9 GL
120
100 -
80
60
40 -.
20
0 ' 0
HS-03-08a
-
-
j
- ^p
20 40 60 80 100
Strain (%)
85
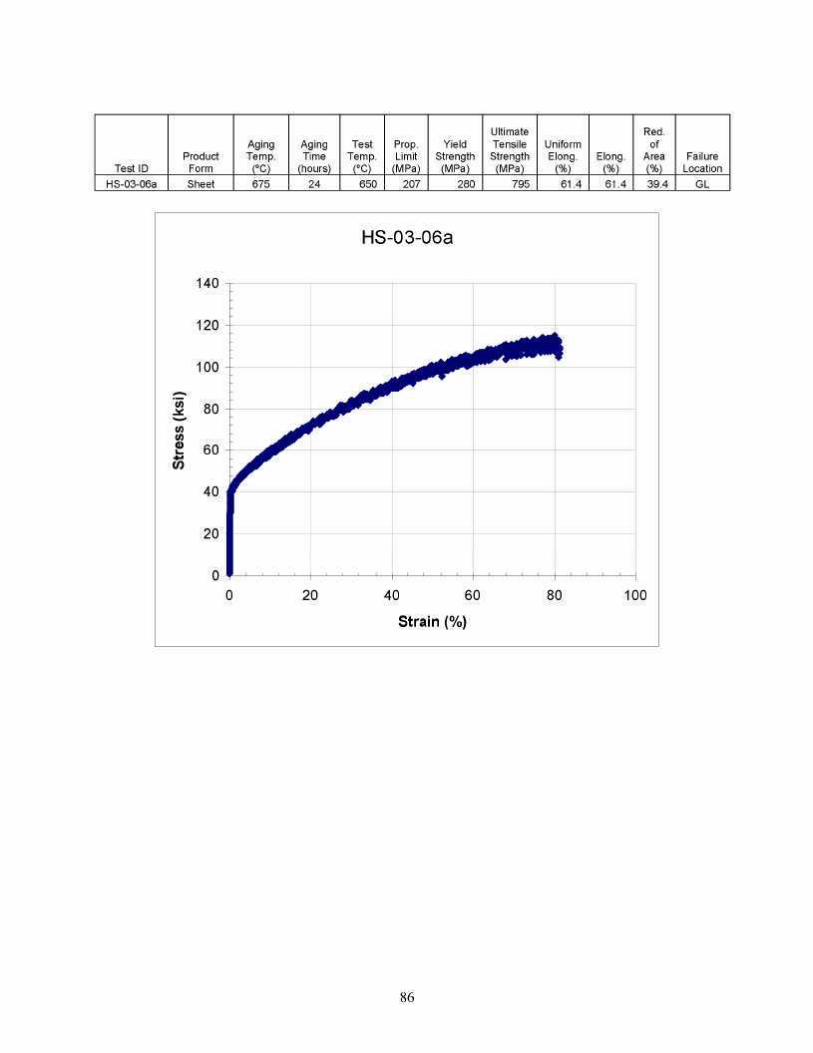
Test ID Product Form
Aging Temp.
(ºC)
Aging Time
(hours)
Test Temp.
(ºC)
Prop. Limit (MPa)
Yield Strength
(MPa)
Ultimate Tensile Strength
(MPa)
Uniform Elong. (%)
Elong. (%)
Red. of
Area (%)
Failure Location
HS-03-06a Sheet 675 24 650 207 280 795 61.4 61.4 39.4 GL
140
120
100 -
80
60
40 i
20
0 ' 0
HS-03-06a
-
-
-
^
- jp
20 40 60 80 100
Strain (%)
86
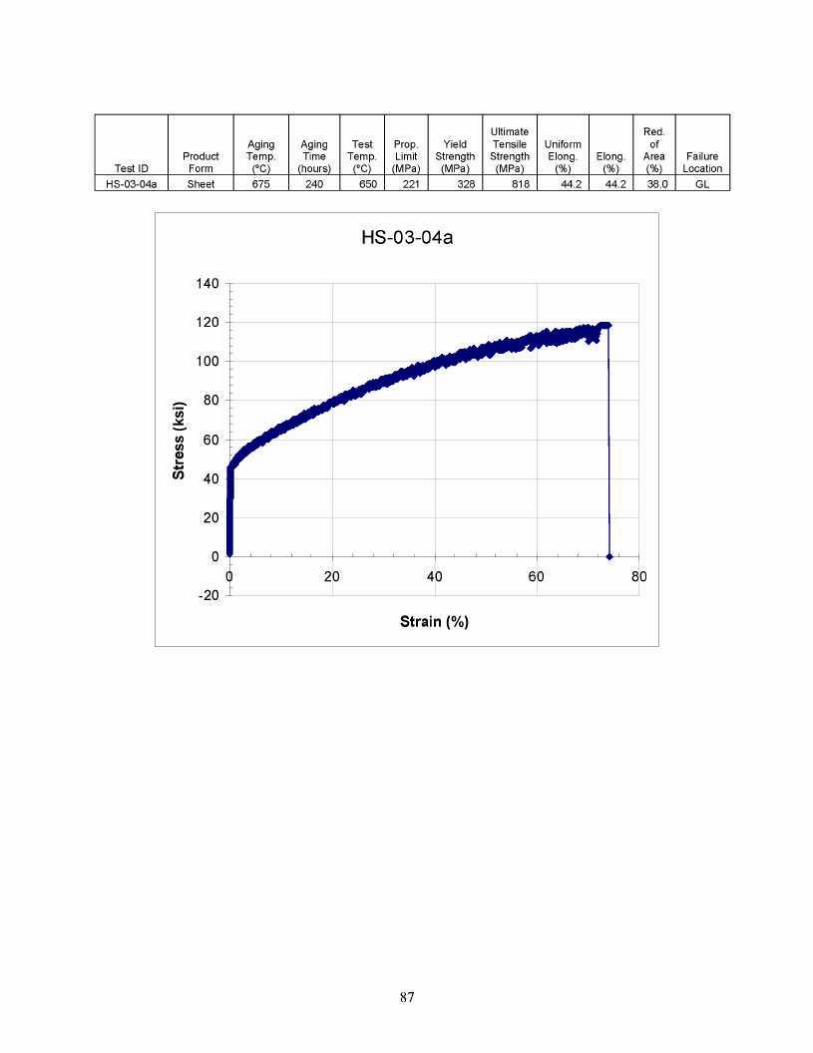
Test ID Product Form
Aging Temp.
(ºC)
Aging Time
(hours)
Test Temp.
(ºC)
Prop. Limit (MPa)
Yield Strength
(MPa)
Ultimate Tensile Strength
(MPa)
Uniform Elong. (%)
Elong. (%)
Red. of
Area (%)
Failure Location
87
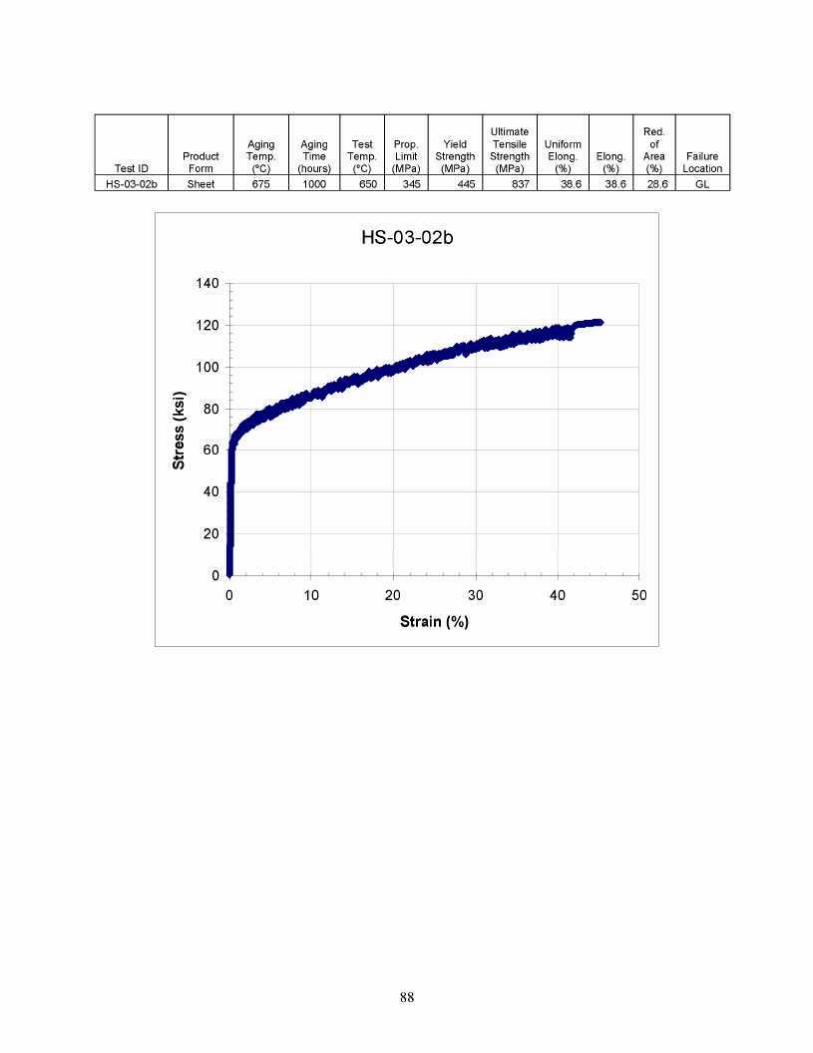
Test ID Product Form
Aging Temp.
(ºC)
Aging Time
(hours)
Test Temp.
(ºC)
Prop. Limit (MPa)
Yield Strength
(MPa)
Ultimate Tensile Strength
(MPa)
Uniform Elong. (%)
Elong. (%)
Red. of
Area (%)
Failure Location
HS-03-02b Sheet 675 1000 650 345 445 837 38.6 38.6 28.6 GL
88
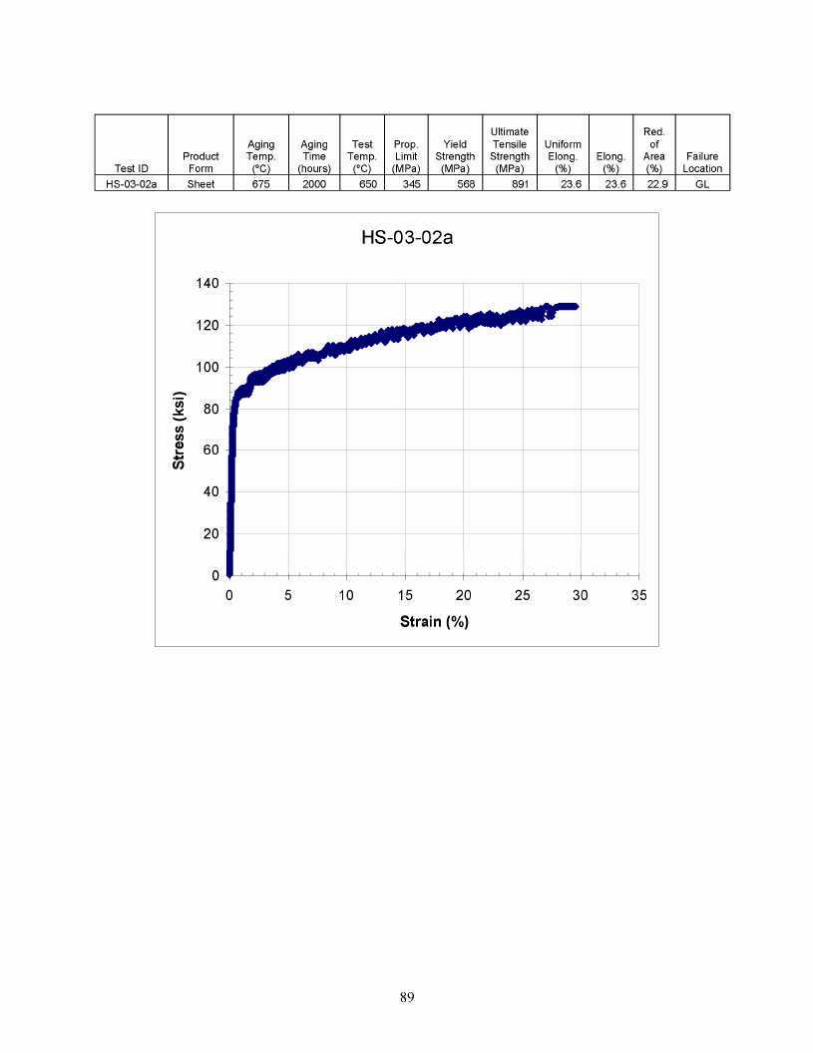
Test ID Product Form
Aging Temp.
(ºC)
Aging Time
(hours)
Test Temp.
(ºC)
Prop. Limit (MPa)
Yield Strength
(MPa)
Ultimate Tensile Strength
(MPa)
Uniform Elong. (%)
Elong. (%)
Red. of
Area (%)
Failure Location
HS-03-02a Sheet 675 2000 650 345 568 891 23.6 23.6 22.9 GL
89
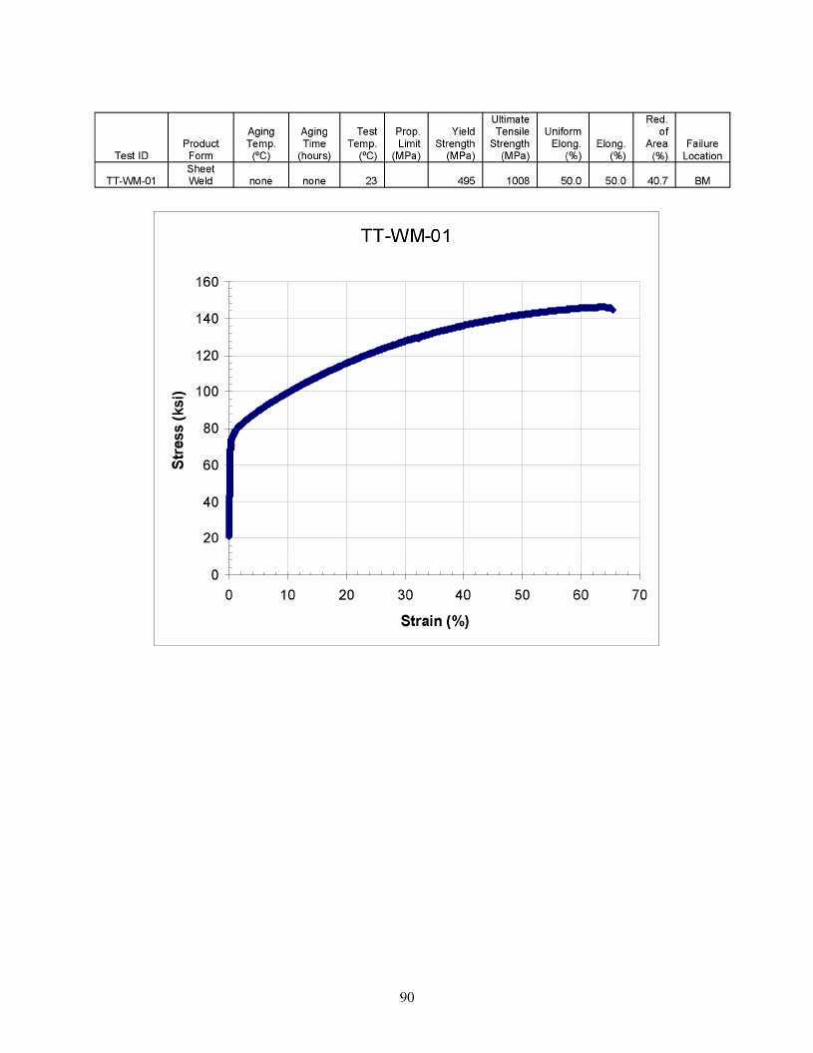
Test ID
TT-WM-01
Product Form Sheet Weld
Aging Temp.
(ºC)
none
Aging Time
(hours)
none
Test Temp.
(ºC)
23
Prop. Limit
(MPa)
Yield Strength
(MPa)
495
Ultimate Tensile
Strength (MPa)
1008
Uniform Elong.
(%)
50.0
Elong. (%)
50.0
Red. of
Area (%)
40.7
Failure Location
BM
90
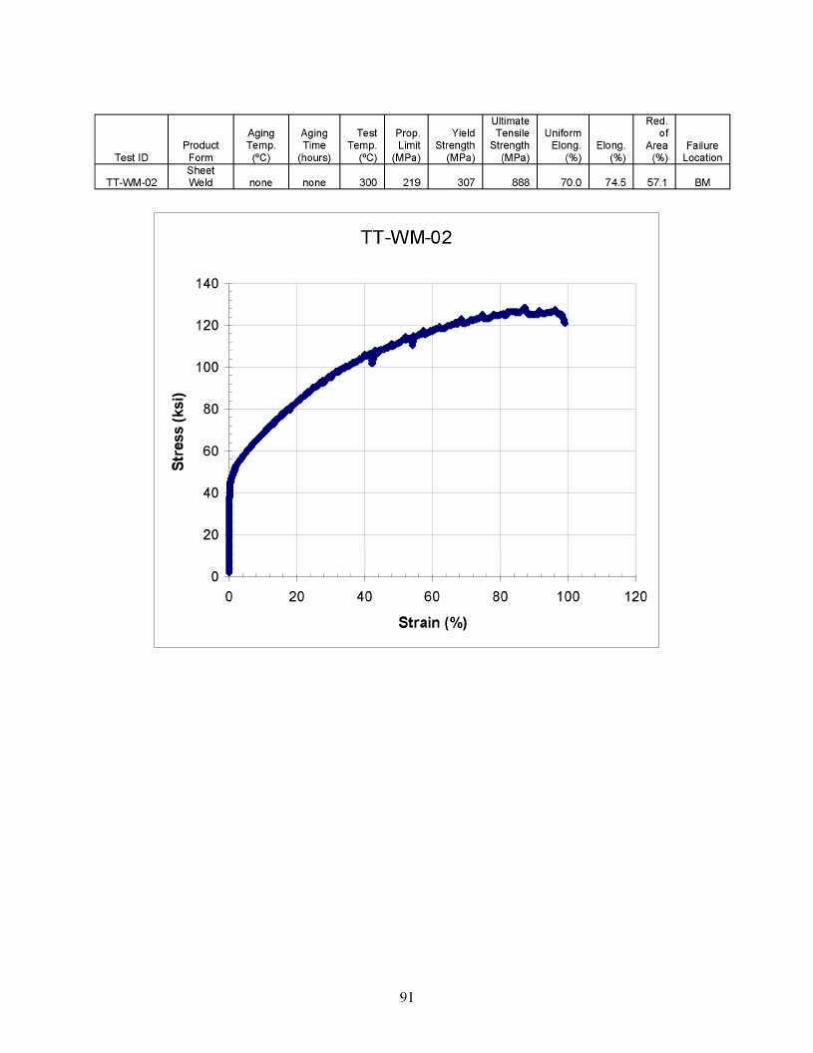
Test ID
TT-WM-02
Product Form Sheet Weld
Aging Temp.
(ºC)
none
Aging Time
(hours)
none
Test Temp.
(ºC)
300
Prop. Limit
(MPa)
219
Yield Strength
(MPa)
307
Ultimate Tensile
Strength (MPa)
888
Uniform Elong.
(%) 70.0
Elong. (%)
74.5
Red. of
Area (%)
57.1
Failure Location
BM
140
120
100
80
60
40 J
20 I
0 -0
TT-WM-02
20 40 60 80 100 120
Strain (%)
91
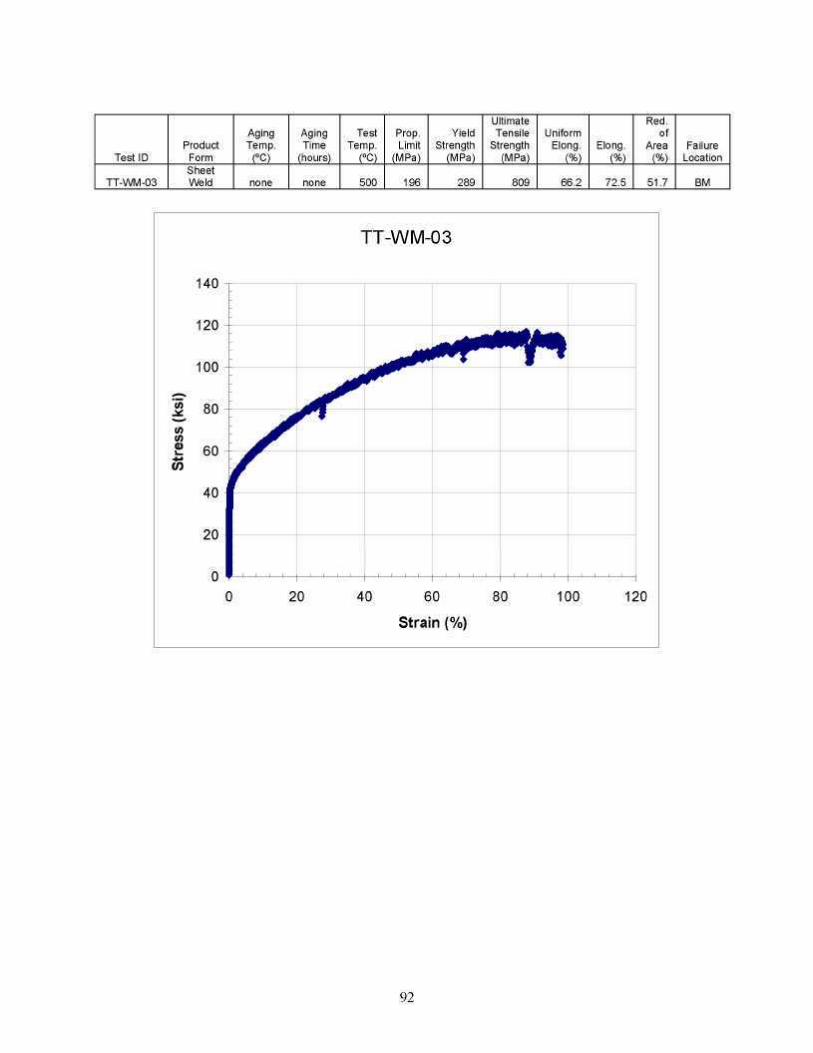
Test ID
TT-WM-03
Product Form Sheet Weld
Aging Temp.
(ºC)
none
Aging Time
(hours)
none
Test Temp.
(ºC)
500
Prop. Limit
(MPa)
196
Yield Strength
(MPa)
289
Ultimate Tensile
Strength (MPa)
809
Uniform Elong.
(%) 66.2
Elong. (%)
72.5
Red. of
Area (%)
51.7
Failure Location
BM
140
120
100
80
60
40 |
20 I
0 ' 0
TT-WM-03
20 40 60 80 100 120
Strain (%)
92
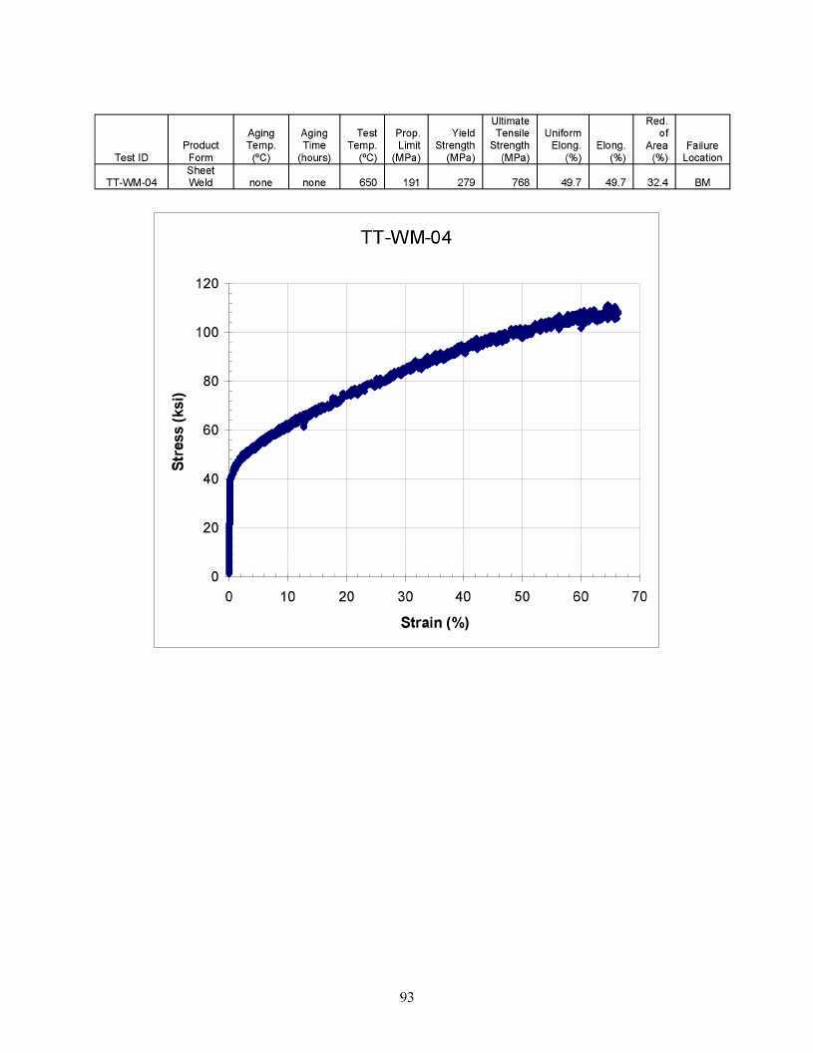
Test ID
TT-WM-04
Product Form Sheet Weld
Aging Temp.
(ºC)
none
Aging Time
(hours)
none
Test Temp.
(ºC)
650
Prop. Limit
(MPa)
191
Yield Strength
(MPa)
279
Ultimate Tensile
Strength (MPa)
768
Uniform Elong.
(%) 49.7
Elong. (%)
49.7
Red. of
Area (%)
32.4
Failure Location
BM
93

Test ID
TT-WM-05
Product Form Sheet Weld
Aging Temp.
(ºC)
none
Aging Time
(hours)
none
Test Temp.
(ºC)
800
Prop. Limit
(MPa)
153
Yield Strength
(MPa)
245
Ultimate Tensile
Strength (MPa)
480
Uniform Elong.
(%) 22.5
Elong. (%)
50.0
Red. of
Area (%)
45.7
Failure Location
BM
80
70
60
50
40
30
20
10
0 0
TT-WM-05
10 20 30 40 50 60 70
Strain (%)
94
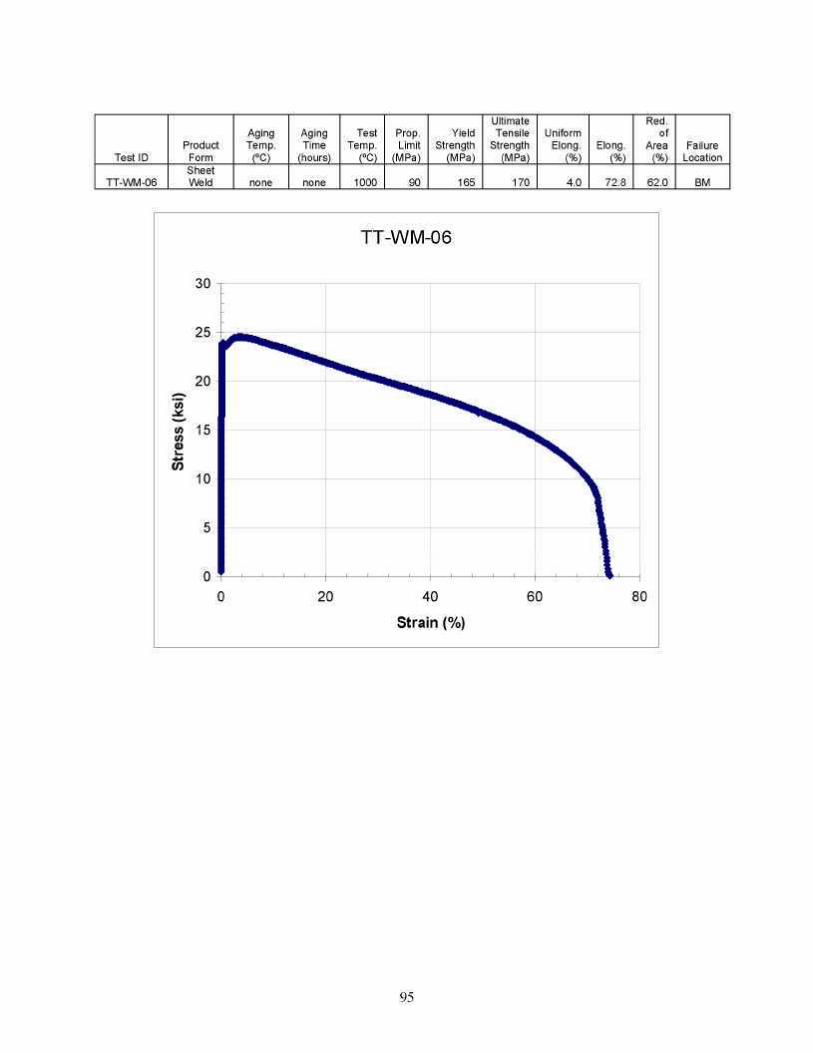
Test ID
TT-WM-06
Product Form Sheet Weld
Aging Temp.
(ºC)
none
Aging Time
(hours)
none
Test Temp.
(ºC)
1000
Prop. Limit
(MPa)
90
Yield Strength
(MPa)
165
Ultimate Tensile
Strength (MPa)
170
Uniform Elong.
(%) 4.0
Elong. (%)
72.8
Red. of
Area (%)
62.0
Failure Location
BM
TT-WM-06
30
25
15
10
-
— I — I — I — I — I — , — , — , — , — I — , — , — , — , — I—'—'—L -*- J—I
20 40
Strain (%)
60 80
95
5
0 0

Test ID
TT-WM-07
Product Form Sheet Weld
Aging Temp.
(ºC)
none
Aging Time
(hours)
none
Test Temp.
(ºC)
1100
Prop. Limit
(MPa)
54
Yield Strength
(MPa)
94
Ultimate Tensile
Strength (MPa)
96
Uniform Elong.
(%) 1.5
Elong. (%)
53.0
Red. of
Area (%)
58.7
Failure Location
BM
16
14
12
10
8
6
4
2
0 0
TT-WM-07
10 20 30
Strain (%)
40 50 60
96
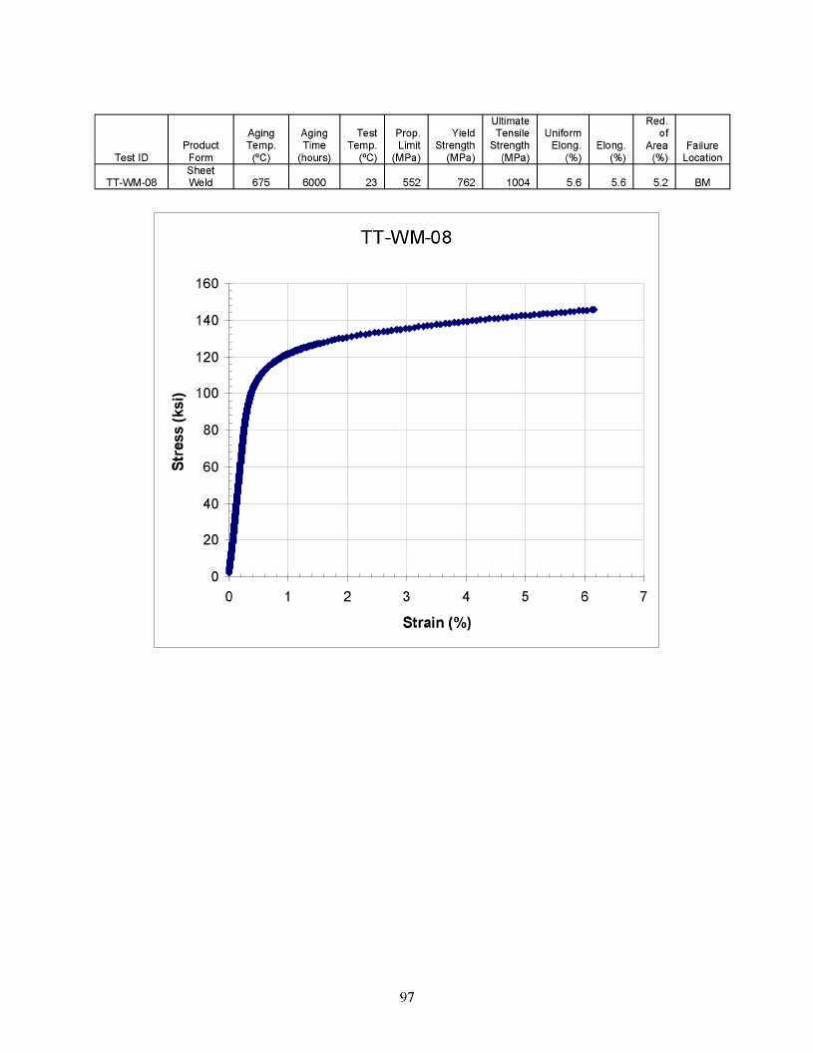
Test ID
TT-WM-08
Product Form Sheet Weld
Aging Temp.
(ºC)
675
Aging Time
(hours)
6000
Test Temp.
(ºC)
23
Prop. Limit
(MPa)
552
Yield Strength
(MPa)
762
Ultimate Tensile
Strength (MPa)
1004
Uniform Elong.
(%) 5.6
Elong. (%) 5.6
Red. of
Area (%) 5.2
Failure Location
BM
97
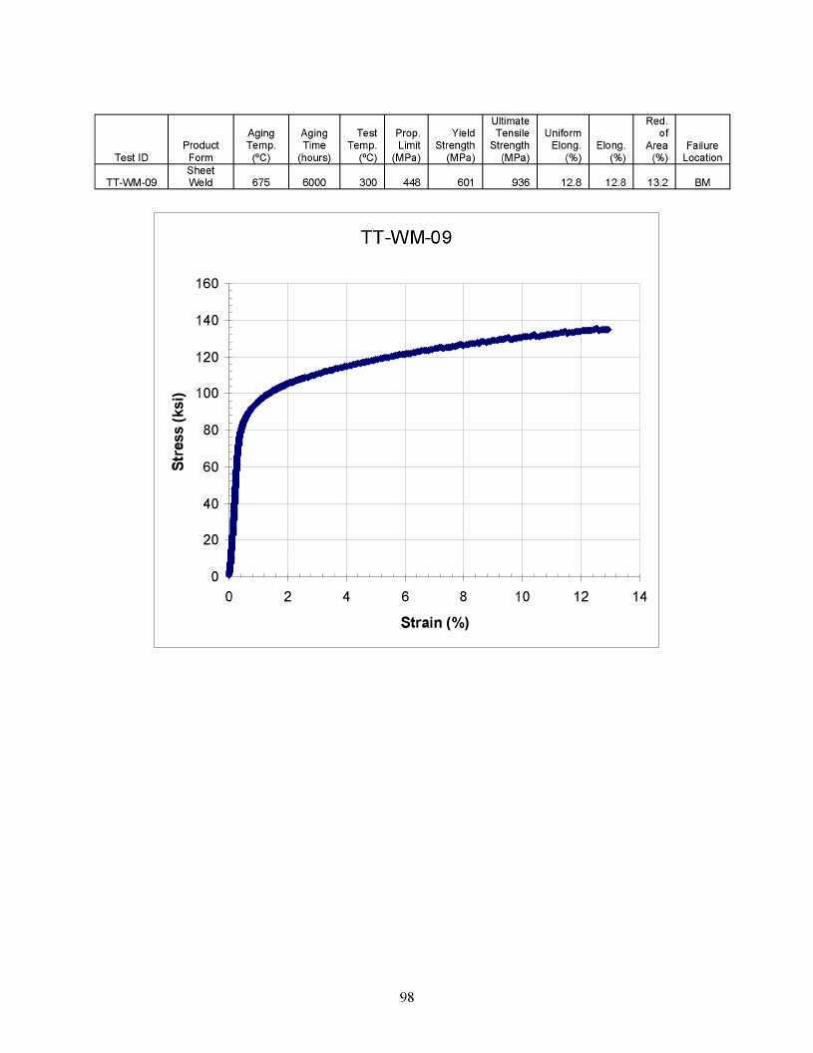
Test ID
TT-WM-09
Product Form Sheet Weld
Aging Temp.
(ºC)
675
Aging Time
(hours)
6000
Test Temp.
(ºC)
300
Prop. Limit
(MPa)
448
Yield Strength
(MPa)
601
Ultimate Tensile
Strength (MPa)
936
Uniform Elong.
(%) 12.8
Elong. (%)
12.8
Red. of
Area (%)
13.2
Failure Location
BM
160
140
120
100 -
80
60
40
20
0 ' 0
TT-WM-09
-
:
:
: ^r
1 1
2 4 6 8 10 12 14
Strain (%)
98
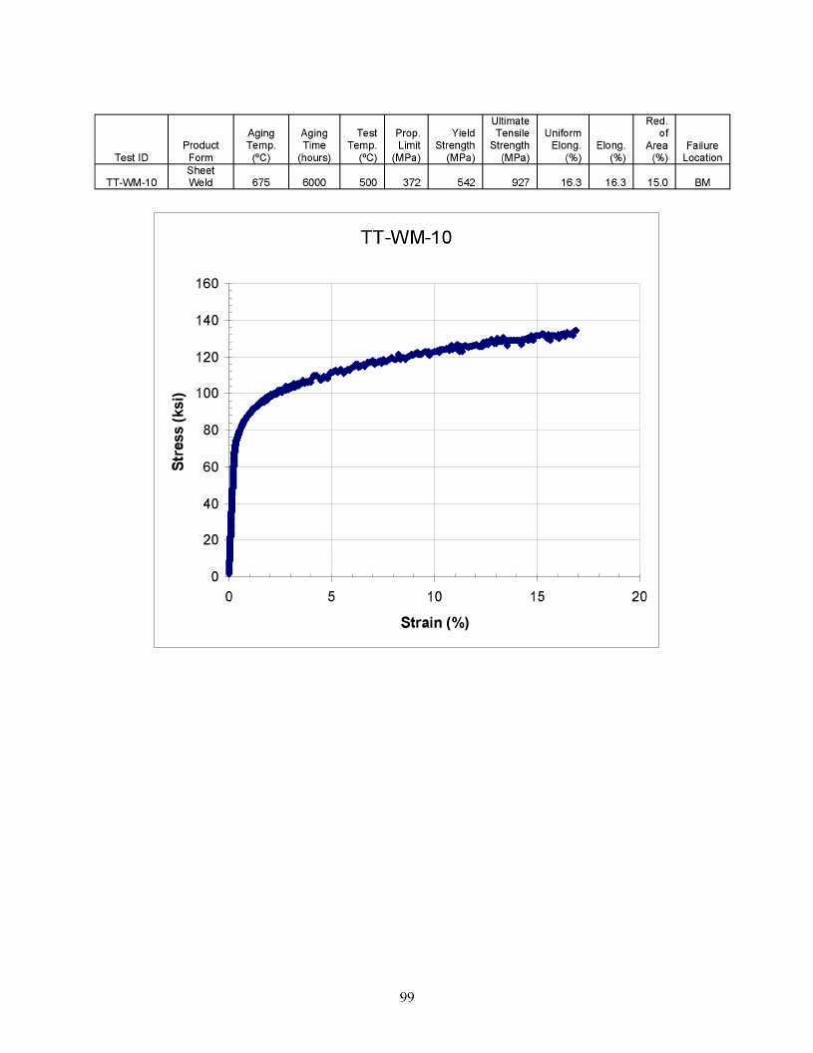
Test ID
TT-WM-10
Product Form Sheet Weld
Aging Temp.
(ºC)
675
Aging Time
(hours)
6000
Test Temp.
(ºC)
500
Prop. Limit
(MPa)
372
Yield Strength
(MPa)
542
Ultimate Tensile
Strength (MPa)
927
Uniform Elong.
(%) 16.3
Elong. (%)
16.3
Red. of
Area (%)
15.0
Failure Location
BM
TT-WM-10
160
140
120
100
80
60
40
20
0 0 5 10 15 20
Strain (%)
99
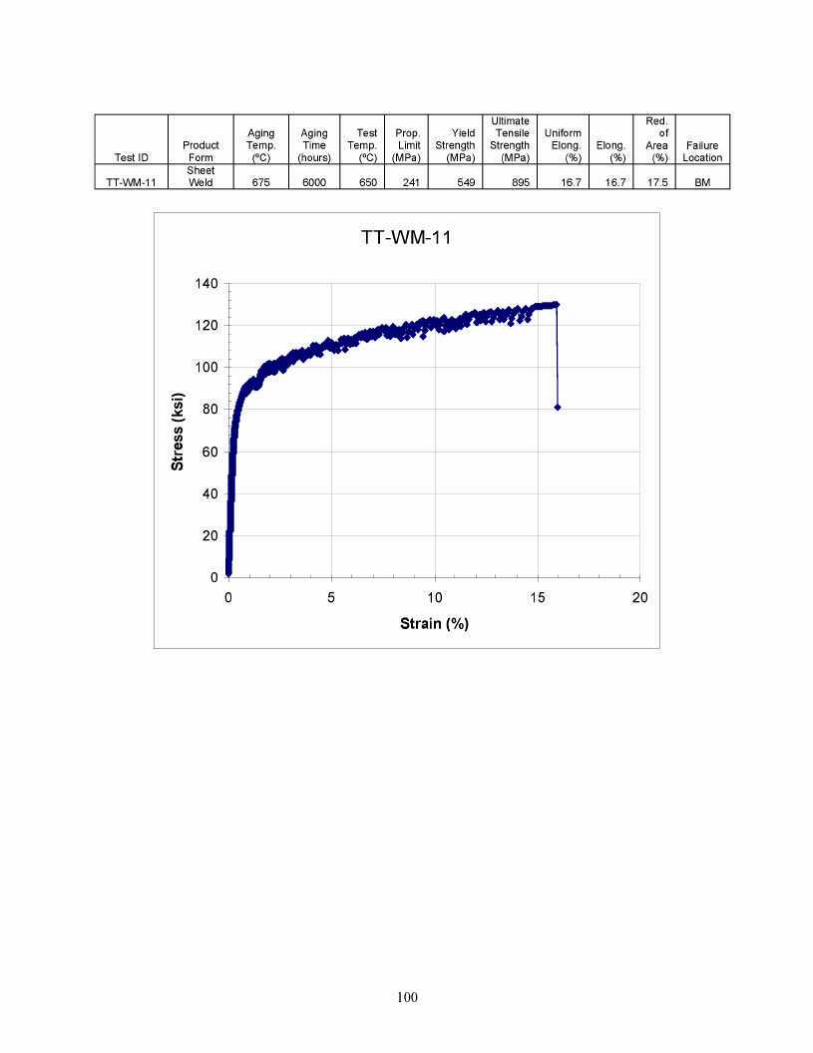
Test ID
TT-WM-11
Product Form Sheet Weld
Aging Temp.
(ºC)
675
Aging Time
(hours)
6000
Test Temp.
(ºC)
650
Prop. Limit
(MPa)
241
Yield Strength
(MPa)
549
Ultimate Tensile
Strength (MPa)
895
Uniform Elong.
(%) 16.7
Elong. (%)
16.7
Red. of
Area (%)
17.5
Failure Location
BM
100

Test ID
TT-WM-12
Product Form Sheet Weld
Aging Temp.
(ºC)
675
Aging Time
(hours)
6000
Test Temp.
(ºC)
800
Prop. Limit
(MPa)
Yield Strength
(MPa)
402
Ultimate Tensile
Strength (MPa)
554
Uniform Elong.
(%) 7.2
Elong. (%)
13.4
Red. of
Area (%)
18.3
Failure Location
BM
90
80
70
60
50
40
30
20 J
10 |
0 -0
TT-WM-12
2 4 6 8 10 12 14
Strain (%)
101
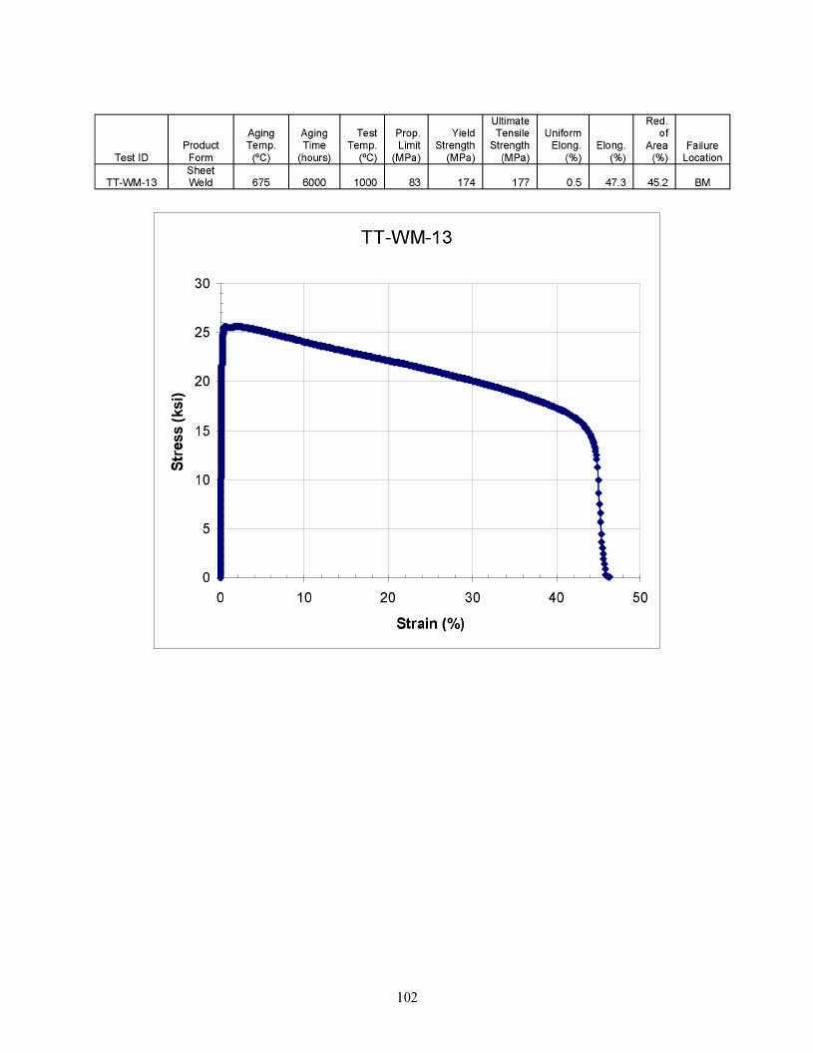
Test ID
TT-WM-13
Product Form Sheet Weld
Aging Temp.
(ºC)
675
Aging Time
(hours)
6000
Test Temp.
(ºC)
1000
Prop. Limit
(MPa)
83
Yield Strength
(MPa)
174
Ultimate Tensile
Strength (MPa)
177
Uniform Elong.
(%) 0.5
Elong. (%)
47.3
Red. of
Area (%)
45.2
Failure Location
BM
30
25
20
15
10
5
0 0
TT-WM-13
10 20 30 40 50
Strain (%)
102
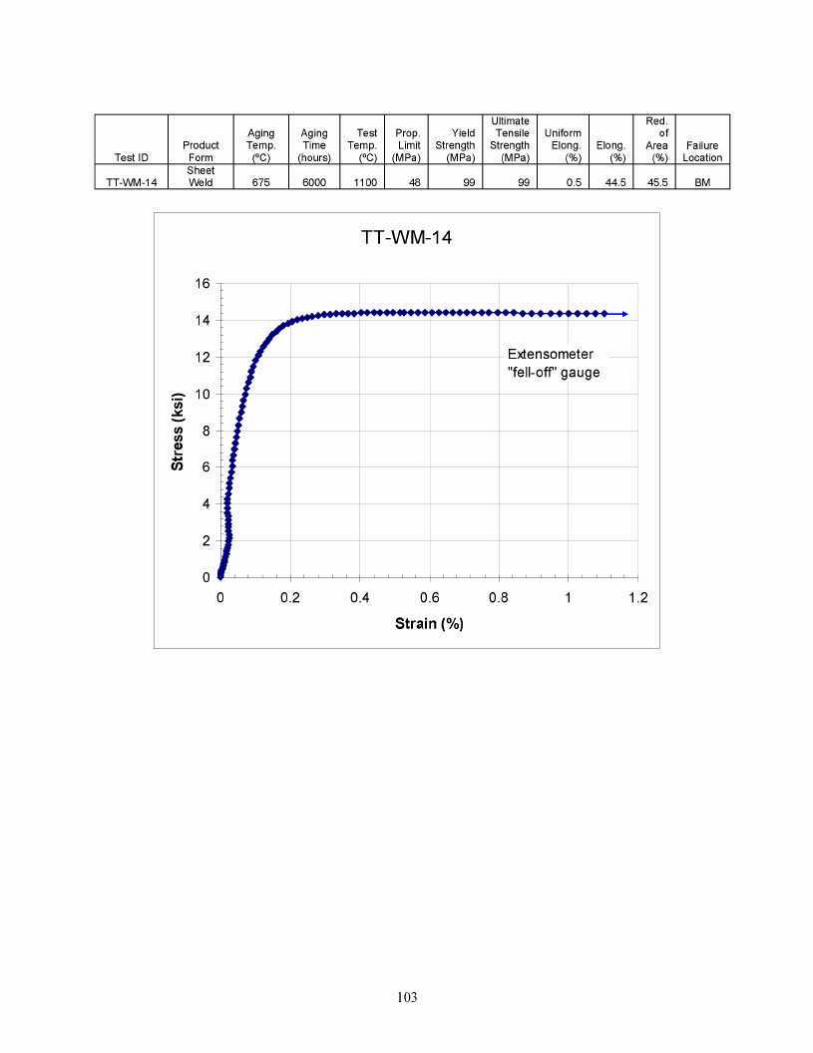
Test ID
TT-WM-14
Product Form Sheet Weld
Aging Temp.
(ºC)
675
Aging Time
(hours)
6000
Test Temp.
(ºC)
1100
Prop. Limit
(MPa)
48
Yield Strength
(MPa)
99
Ultimate Tensile
Strength (MPa)
99
Uniform Elong.
(%) 0.5
Elong. (%)
44.5
Red. of
Area (%)
45.5
Failure Location
BM
TT-WM-14
16
14
12
10
8
6
4
2
0 0 0.2 0.4 0.6 0.8 1 1.2
Strain (%)
103
» ♦♦♦♦♦♦<»♦♦♦>♦♦♦♦♦♦♦♦ < ♦ ♦ ♦ ♦ ♦ ♦ ♦ «>-»-»♦
Extensometer "fell-off" gauge
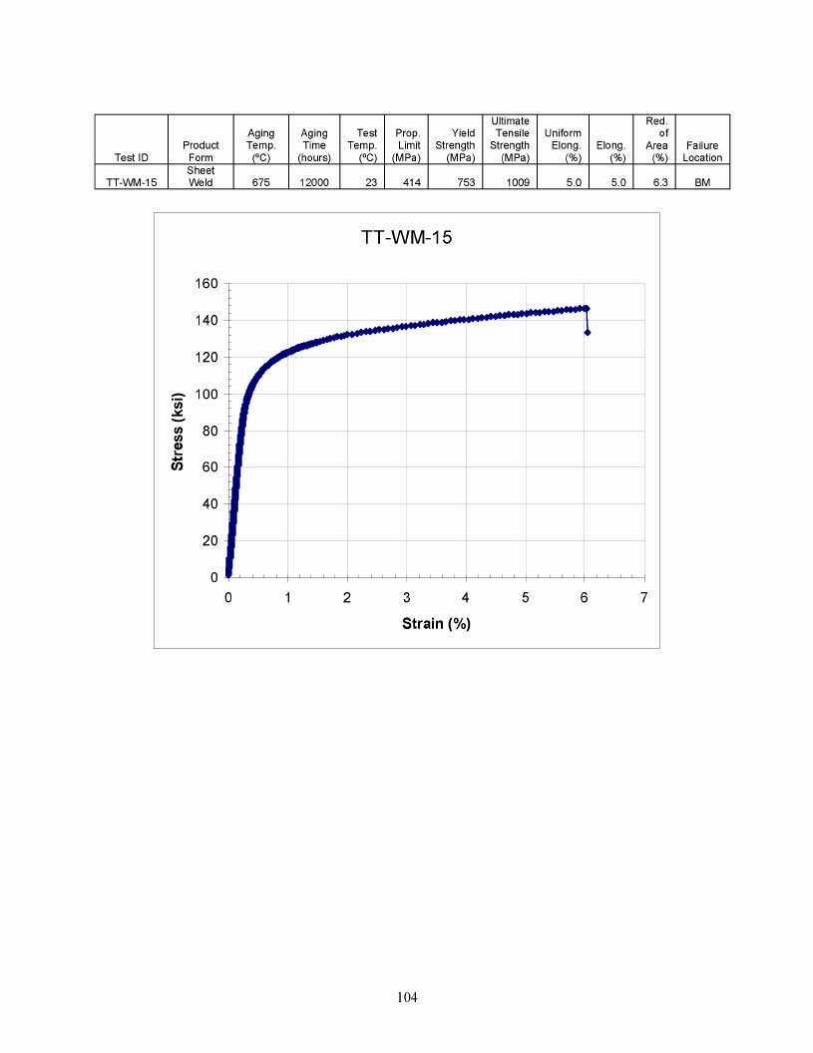
Test ID
TT-WM-15
Product Form Sheet Weld
Aging Temp.
(ºC)
675
Aging Time
(hours)
12000
Test Temp.
(ºC)
23
Prop. Limit
(MPa)
414
Yield Strength
(MPa)
753
Ultimate Tensile
Strength (MPa)
1009
Uniform Elong.
(%) 5.0
Elong. (%) 5.0
Red. of
Area (%) 6.3
Failure Location
BM
104
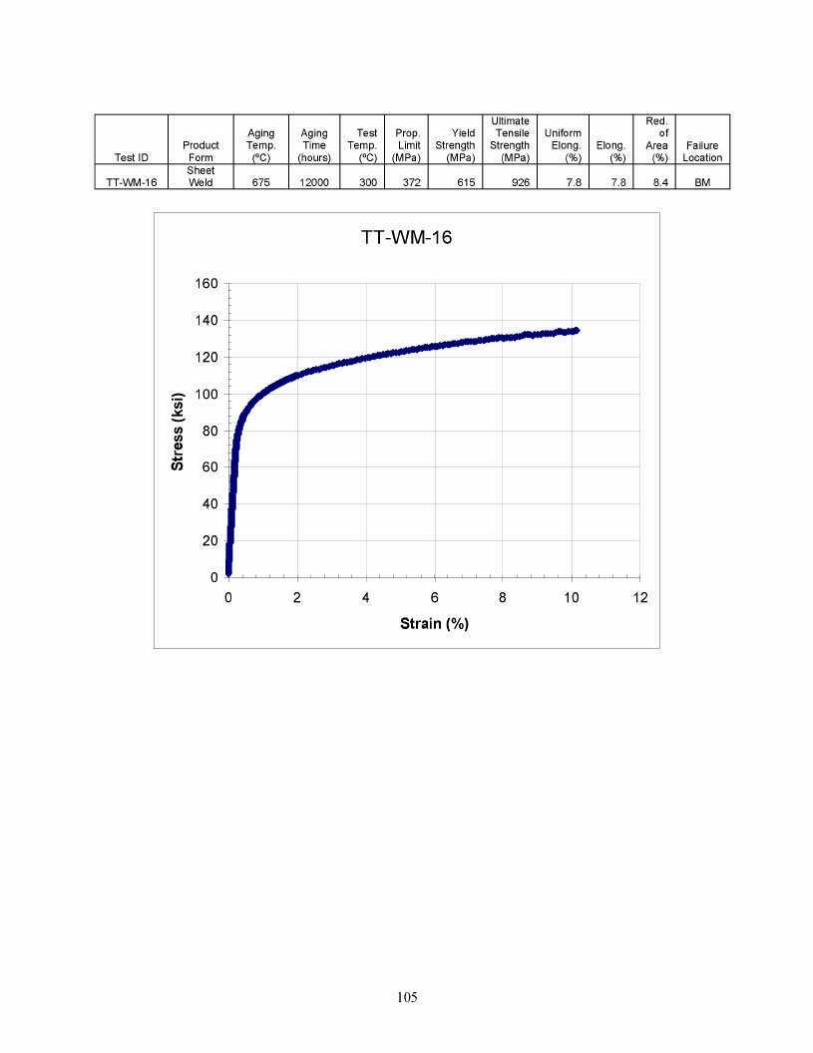
Test ID
TT-WM-16
Product Form Sheet Weld
Aging Temp.
(ºC)
675
Aging Time
(hours)
12000
Test Temp.
(ºC)
300
Prop. Limit
(MPa)
372
Yield Strength
(MPa)
615
Ultimate Tensile
Strength (MPa)
926
Uniform Elong.
(%) 7.8
Elong. (%) 7.8
Red. of
Area (%) 8.4
Failure Location
BM
160
140
120
100
80
60
40
20 -.
0 -0
TT-WM-16
-
-
^
: j
u
2 4 6 8 10 12
Strain (%)
105
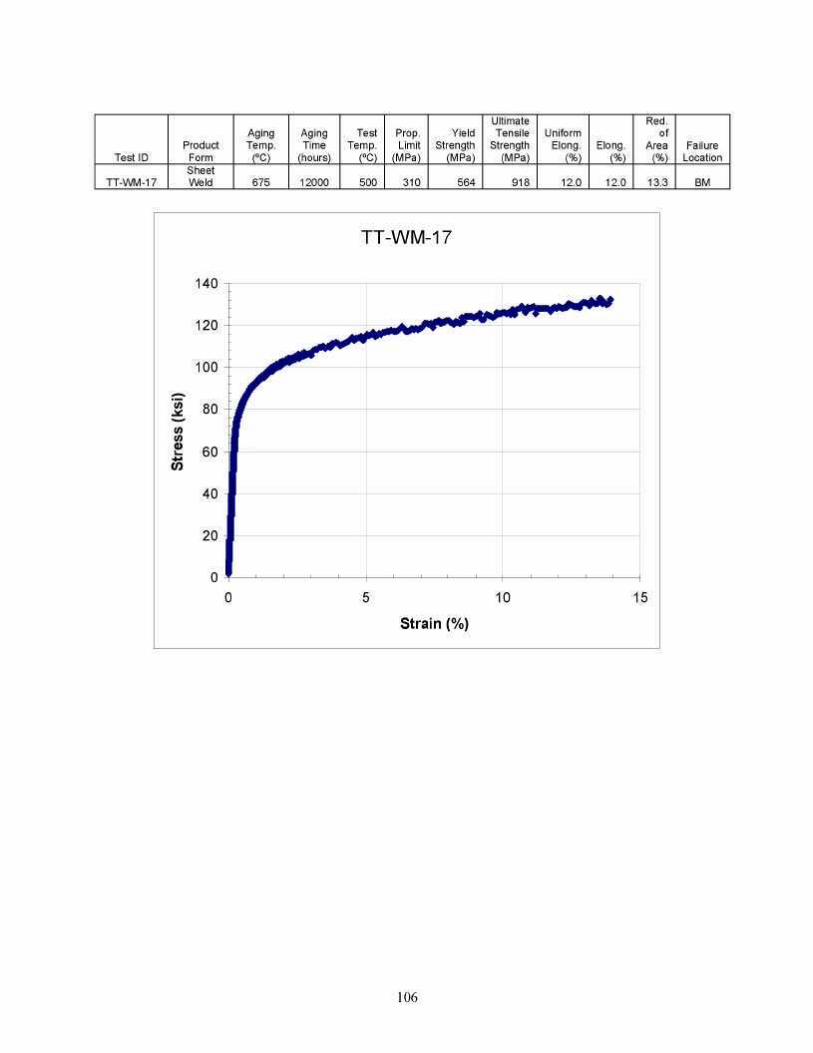
Test ID
TT-WM-17
Product Form Sheet Weld
Aging Temp.
(ºC)
675
Aging Time
(hours)
12000
Test Temp.
(ºC)
500
Prop. Limit
(MPa)
310
Yield Strength
(MPa)
564
Ultimate Tensile
Strength (MPa)
918
Uniform Elong.
(%) 12.0
Elong. (%)
12.0
Red. of
Area (%)
13.3
Failure Location
BM
106
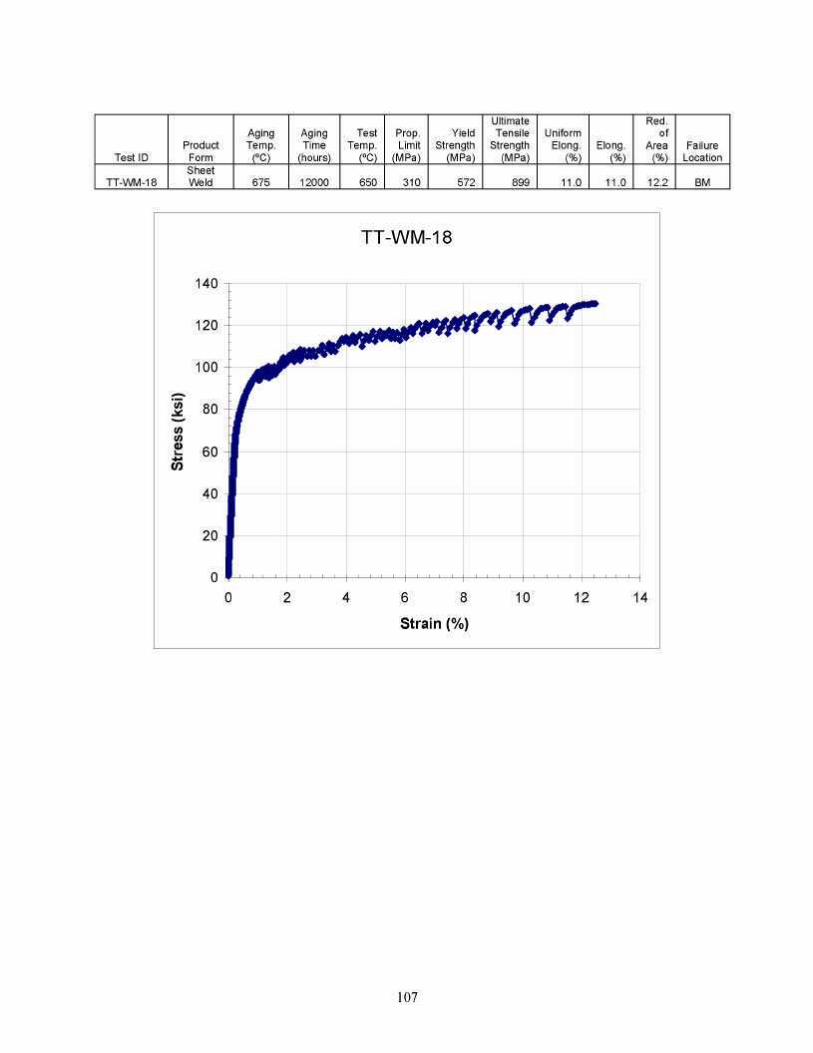
Test ID
TT-WM-18
Product Form Sheet Weld
Aging Temp.
(ºC)
675
Aging Time
(hours)
12000
Test Temp.
(ºC)
650
Prop. Limit
(MPa)
310
Yield Strength
(MPa)
572
Ultimate Tensile
Strength (MPa)
899
Uniform Elong.
(%) 11.0
Elong. (%)
11.0
Red. of
Area (%)
12.2
Failure Location
BM
107
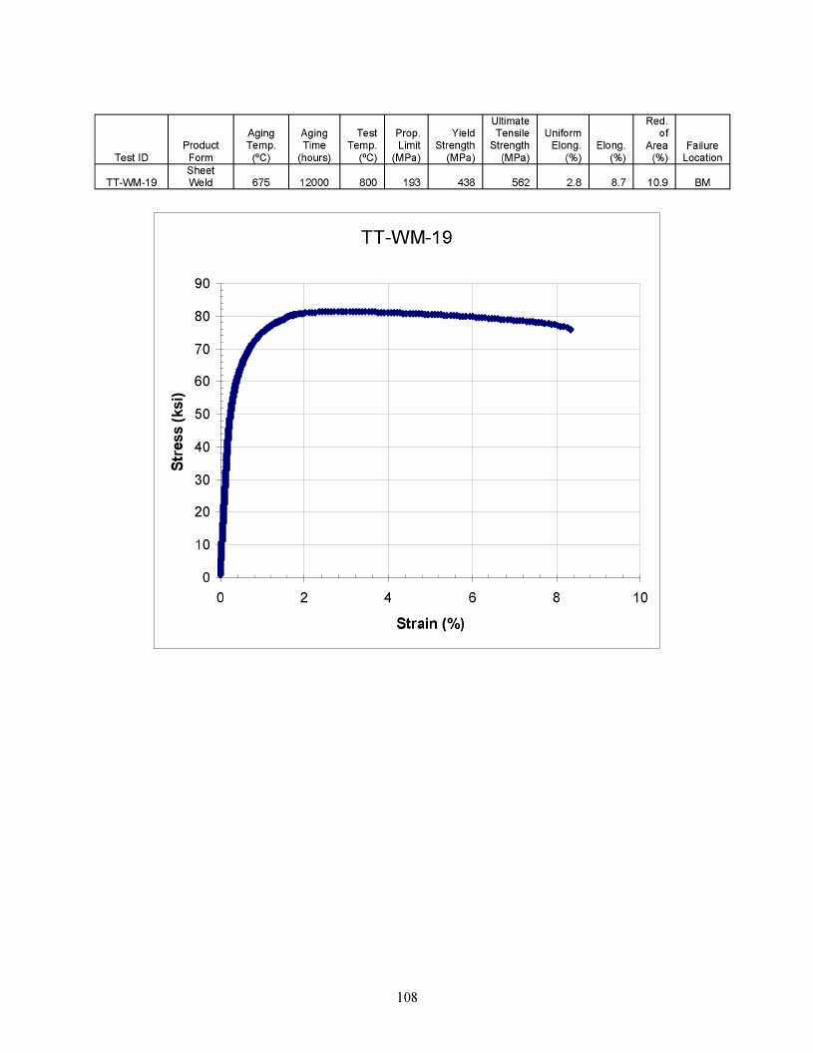
Test ID
TT-WM-19
Product Form Sheet Weld
Aging Temp.
(ºC)
675
Aging Time
(hours)
12000
Test Temp.
(ºC)
800
Prop. Limit
(MPa)
193
Yield Strength
(MPa)
438
Ultimate Tensile
Strength (MPa)
562
Uniform Elong.
(%) 2.8
Elong. (%) 8.7
Red. of
Area (%)
10.9
Failure Location
BM
90
80
70 -
60
50
40
30
20
10 j
0 -0
TT-WM-19
:
Jr
\ m
- M
1
2 4 6 8 10
Strain (%)
108

Test ID
TT-WM-20
Product Form Sheet Weld
Aging Temp.
(ºC)
675
Aging Time
(hours)
12000
Test Temp.
(ºC)
1000
Prop. Limit
(MPa)
Yield Strength
(MPa)
171
Ultimate Tensile
Strength (MPa)
172
Uniform Elong.
(%) 0.3
Elong. (%)
38.6
Red. of
Area (%)
37.1
Failure Location
BM
30
25
20
15
10
5
0 0
TT-WM-20
10 20 30 40 50
Strain (%)
109

Test ID
TT-WM-21
Product Form Sheet Weld
Aging Temp.
(ºC)
675
Aging Time
(hours)
12000
Test Temp.
(ºC)
1100
Prop. Limit
(MPa)
Yield Strength
(MPa)
101
Ultimate Tensile
Strength (MPa)
101
Uniform Elong.
(%) 0.3
Elong. (%)
43.8
Red. of
Area (%)
33.4
Failure Location
BM
110
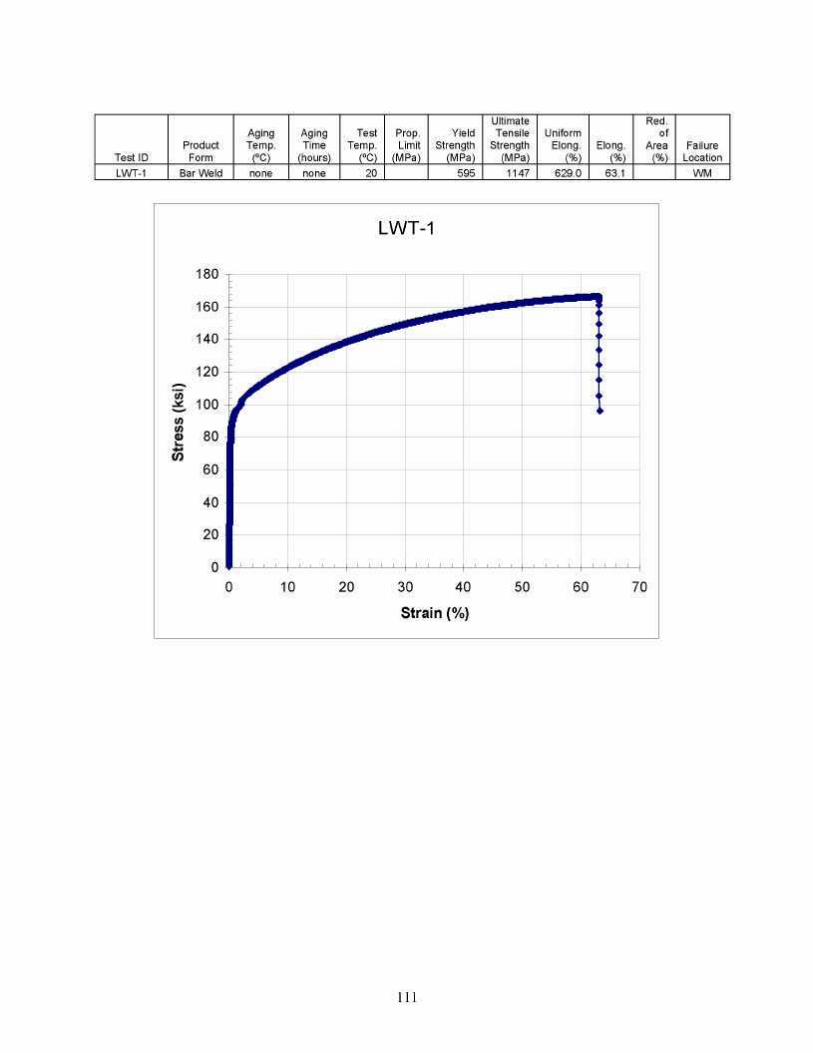
Test ID Product Form
Aging Temp.
(ºC)
Aging Time
(hours)
Test Temp.
(ºC)
Prop. Limit
(MPa)
Yield Strength
(MPa)
Ultimate Tensile
Strength (MPa)
Uniform Elong.
(%) Elong.
(%)
Red. of
Area (%)
Failure Location
LWT-1 Bar Weld none none 20 595 1147 629.0 63.1 WM
111
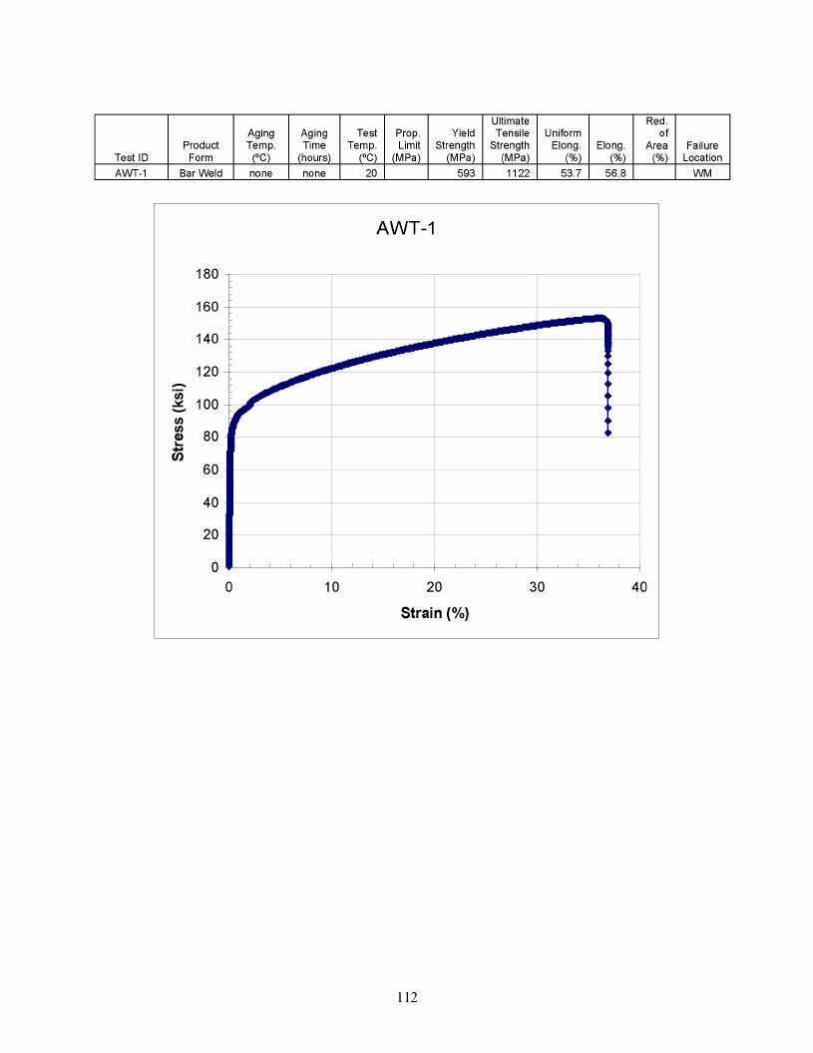
Test ID AWT-1
Product Form
Bar Weld
Aging Temp.
(ºC) none
Aging Time
(hours) none
Test Temp.
(ºC) 20
Prop. Limit
(MPa)
Yield Strength
(MPa) 593
Ultimate Tensile
Strength (MPa) 1122
Uniform Elong.
(%) 53.7
Elong. (%)
56.8
Red. of
Area (%)
Failure Location
WM
112
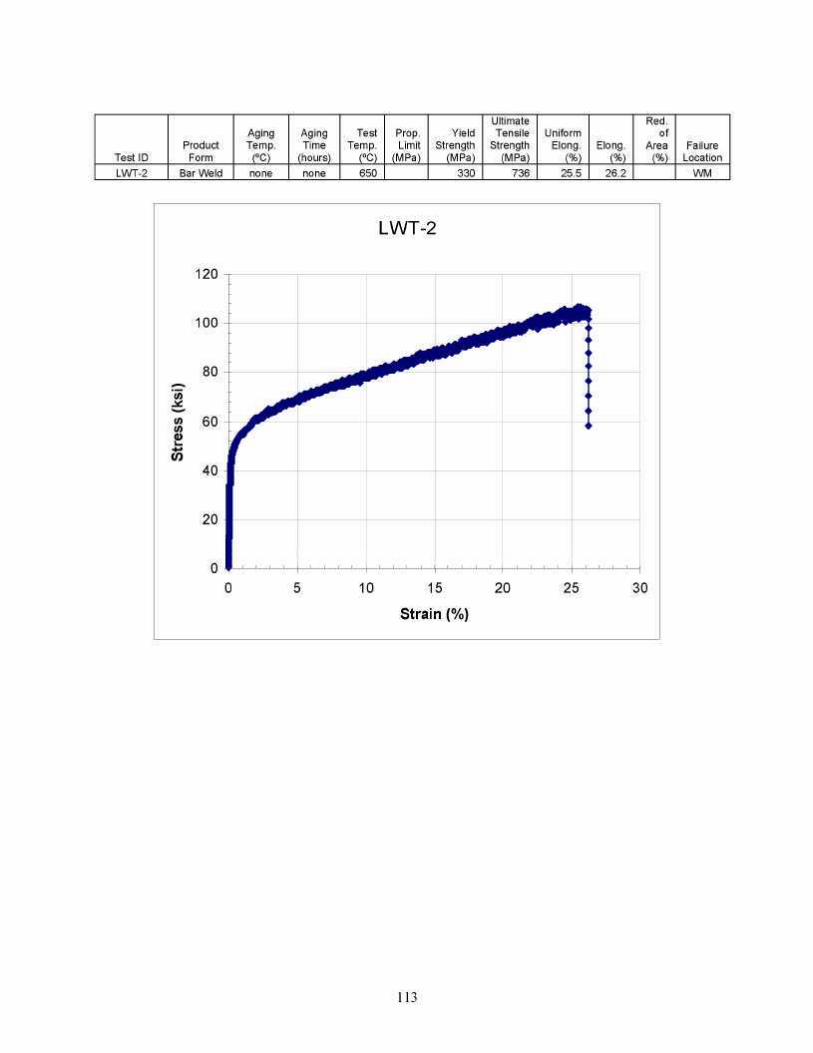
Test ID Product Form
Aging Temp.
(ºC)
Aging Time
(hours)
Test Temp.
(ºC)
Prop. Limit
(MPa)
Yield Strength
(MPa)
Ultimate Tensile
Strength (MPa)
Uniform Elong.
(%) Elong.
(%)
Red. of
Area (%)
Failure Location
LWT-2 Bar Weld 650 330 736 25.5 26.2 WM
LWT-2
120
100 -
80
60
40
20
10 15
Strain (%)
20 25 30
113
none none
0 0 5
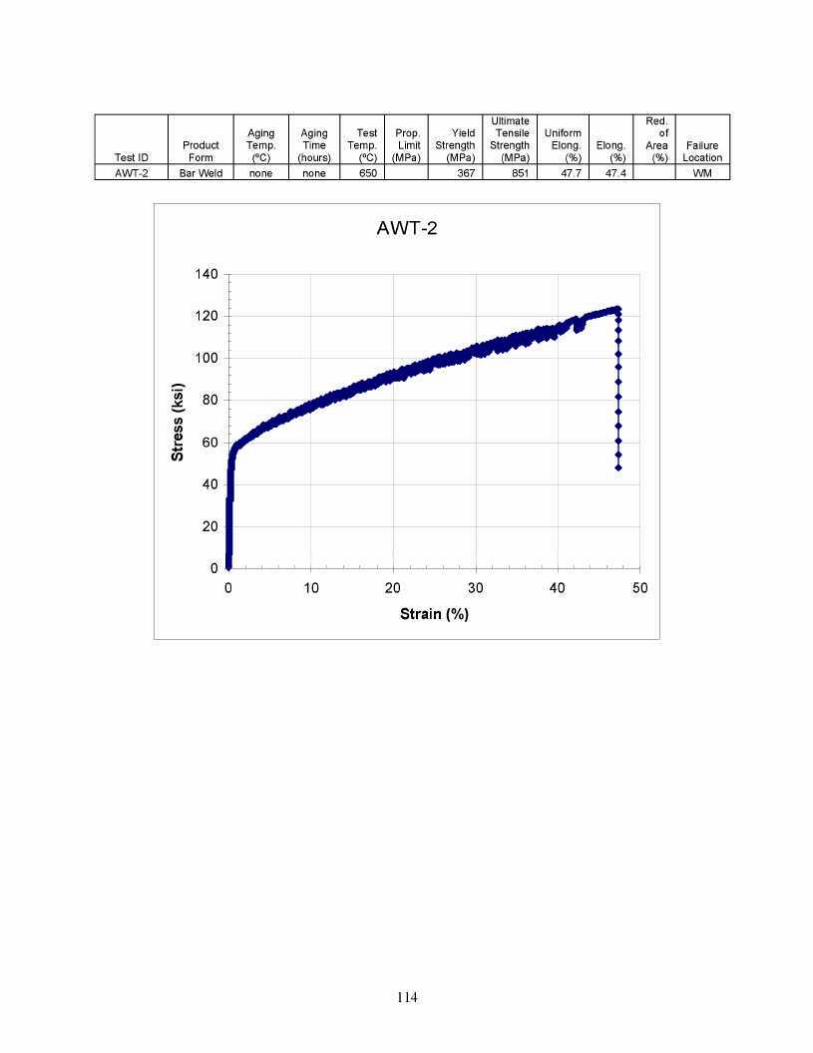
Test ID AWT-2
Product Form
Bar Weld
Aging Temp.
(ºC) none
Aging Time
(hours) none
Test Temp.
(ºC) 650
Prop. Limit
(MPa)
Yield Strength
(MPa) 367
Ultimate Tensile
Strength (MPa)
851
Uniform Elong.
(%) 47.7
Elong. (%)
47.4
Red. of
Area (%)
Failure Location
WM
114
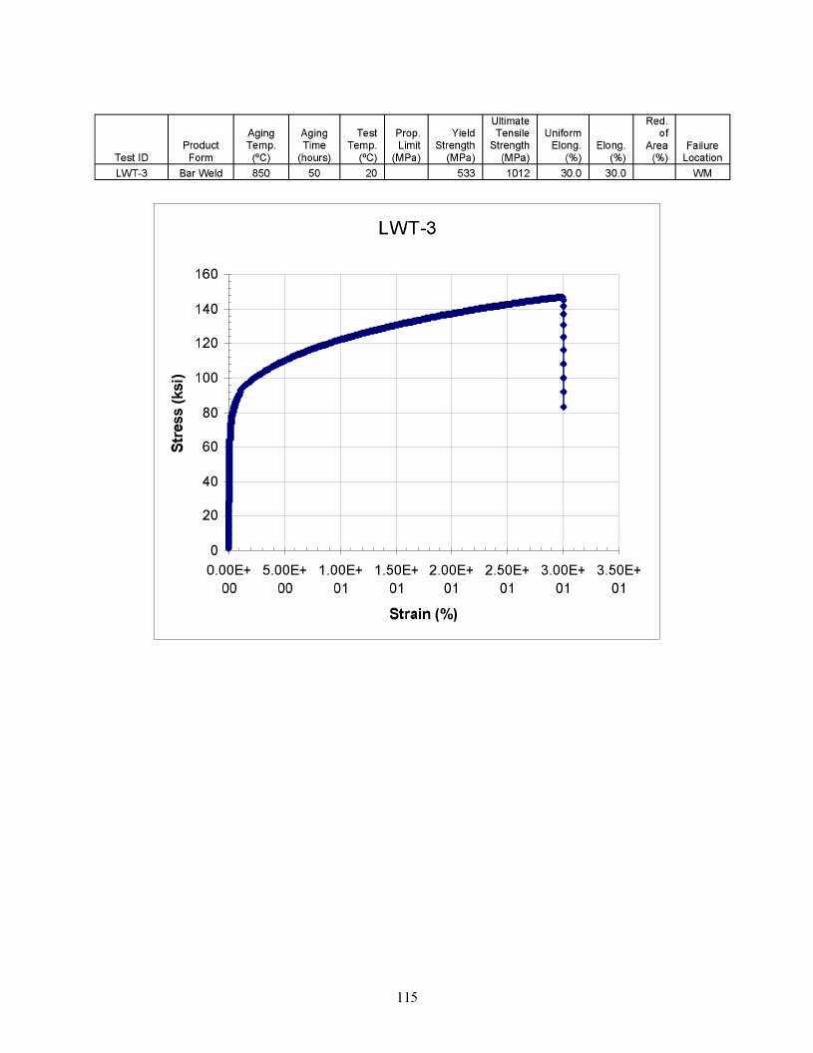
Test ID LWT-3
Product Form
Bar Weld
Aging Temp.
(ºC) 850
Aging Time
(hours) 50
Test Temp.
(ºC) 20
Prop. Limit
(MPa)
Yield Strength
(MPa) 533
Ultimate Tensile
Strength (MPa) 1012
Uniform Elong.
(%) 30.0
Elong. (%)
30.0
Red. of
Area (%)
Failure Location
WM
115
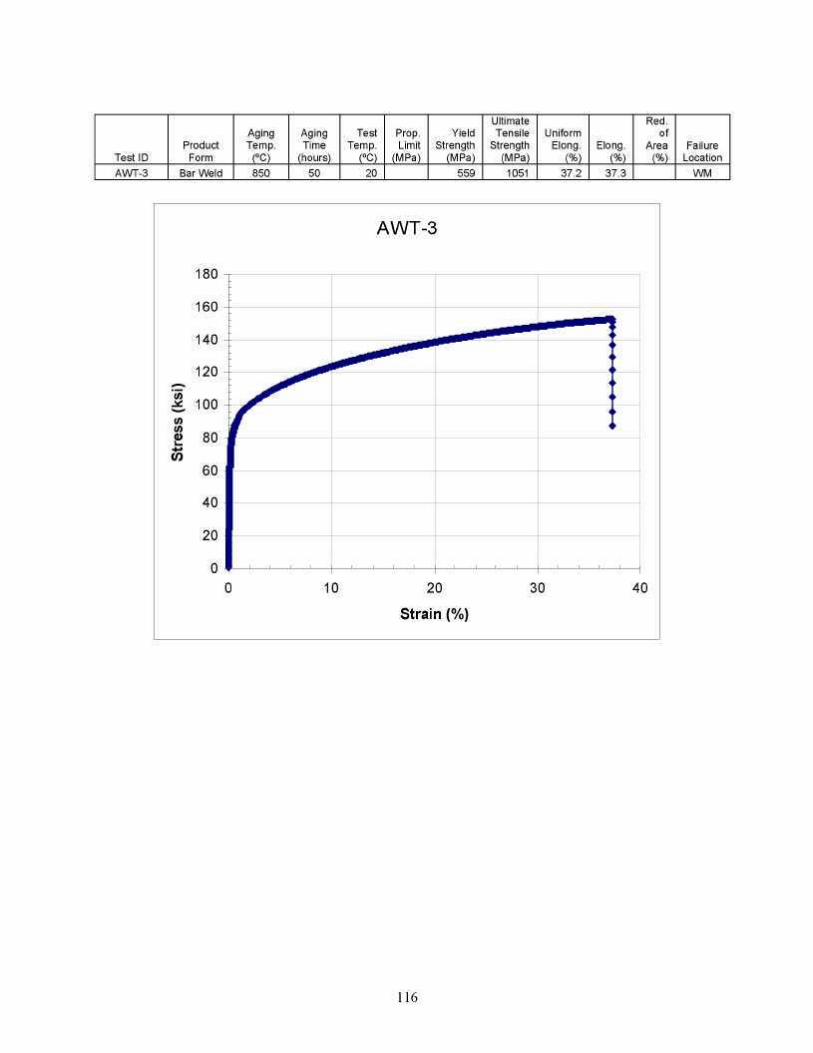
Test ID AWT-3
Product Form
Bar Weld
Aging Temp.
(ºC) 850
Aging Time
(hours) 50
Test Temp.
(ºC) 20
Prop. Limit
(MPa)
Yield Strength
(MPa) 559
Ultimate Tensile
Strength (MPa) 1051
Uniform Elong.
(%) 37.2
Elong. (%)
37.3
Red. of
Area (%)
Failure Location
WM
116
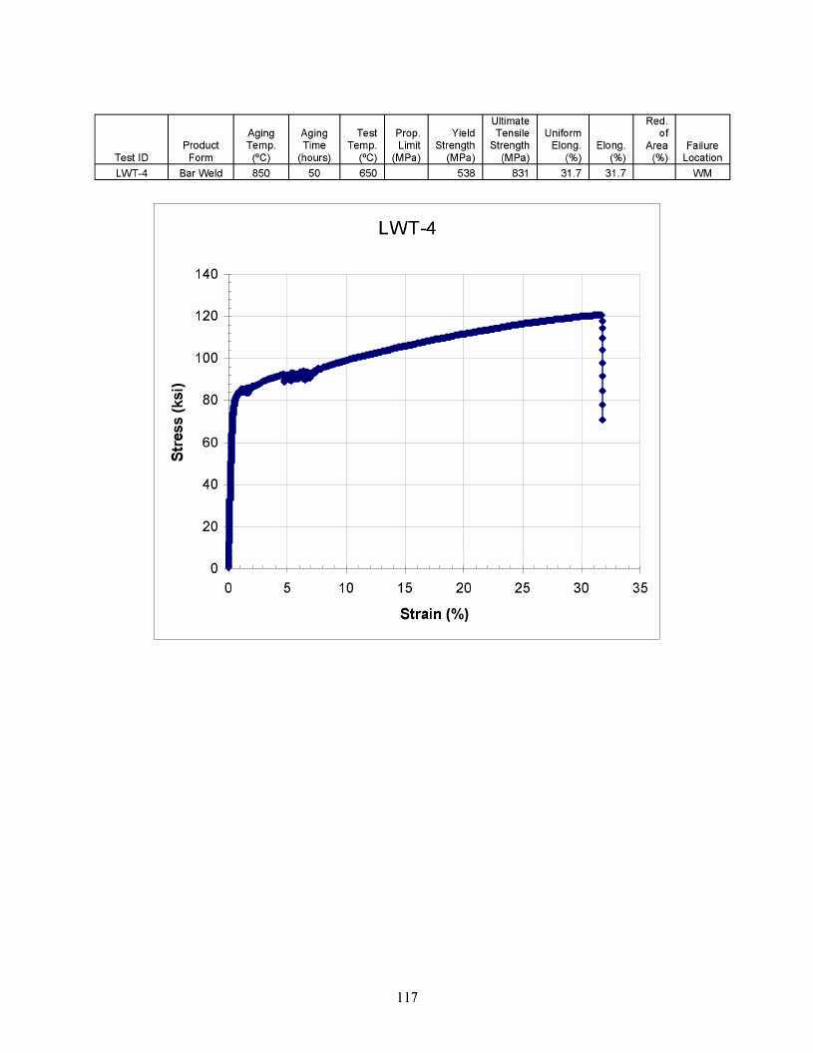
Test ID Product Form
Aging Temp.
(ºC)
Aging Time
(hours)
Test Temp.
(ºC)
Prop. Limit
(MPa)
Yield Strength
(MPa)
Ultimate Tensile
Strength (MPa)
Uniform Elong.
(%) Elong.
(%)
Red. of
Area (%)
Failure Location
LWT-4 Bar Weld 850 50 650 538 831 31.7 31.7 WM
LWT-4
120
100 -
80
60
40 \
20 |
' ' ' ' ' ' '
<►
<►
n <►
<►
<►
1
1 1 1 1
10 15 20
Strain (%)
25 30 35
117
0 5
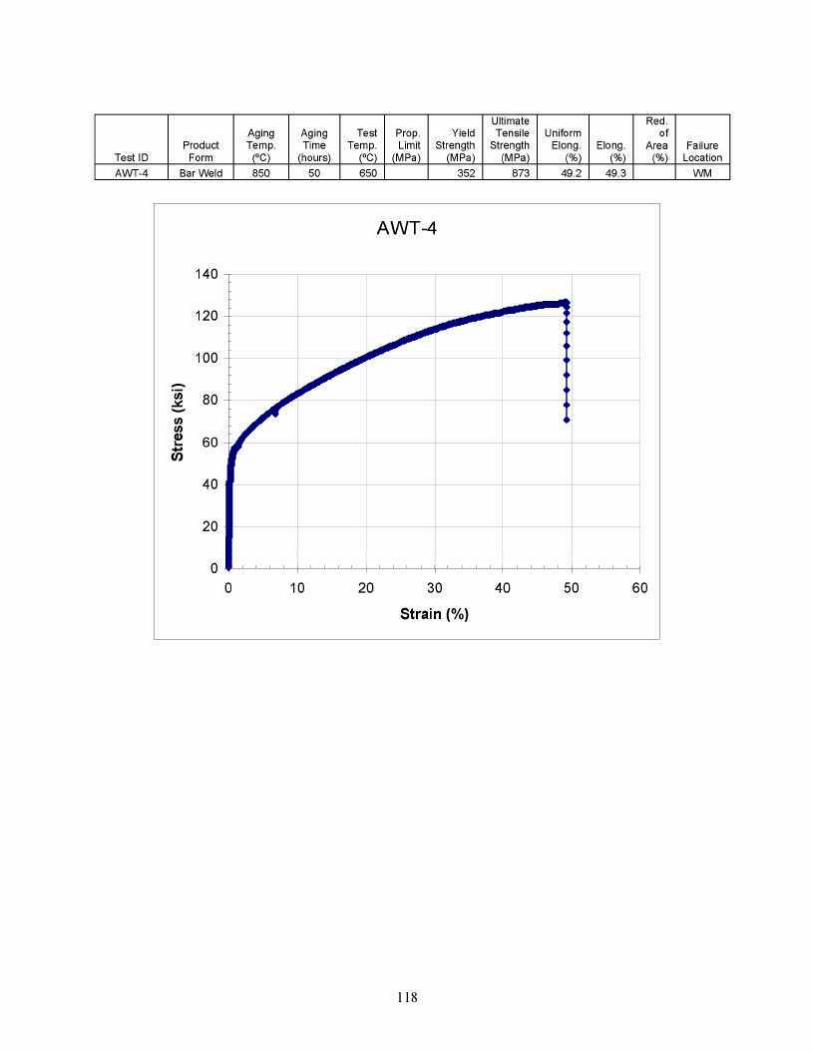
Test ID AWT-4
Product Form
Bar Weld
Aging Temp.
(ºC) 850
Aging Time
(hours) 50
Test Temp.
(ºC) 650
Prop. Limit
(MPa)
Yield Strength
(MPa) 352
Ultimate Tensile
Strength (MPa)
873
Uniform Elong.
(%) 49.2
Elong. (%)
49.3
Red. of
Area (%)
Failure Location
WM
140
120
100
80
60
40 j
20 ]
0 * 0
AWT-4
10 20 30 40 50 60
Strain (%)
118

Test ID Product Form
Aging Temp.
(ºC)
Aging Time
(hours)
Test Temp.
(ºC)
Prop. Limit
(MPa)
Yield Strength
(MPa)
Ultimate Tensile
Strength (MPa)
Uniform Elong.
(%) Elong.
(%)
Red. of
Area (%)
Failure Location
LWT-5 Bar Weld 675 6000 20 822 1058 4.5 4.5 BM
LWT-5
180
160
140
120
100
80
60
40
20
0 0.00E+00 1.00E+00 2.00E+00 3.00E+00 4.00E+00 5.00E+00
Strain (%)
119
; , i f * * * " " * _ _ <►
: m <► -_ m <► : m i
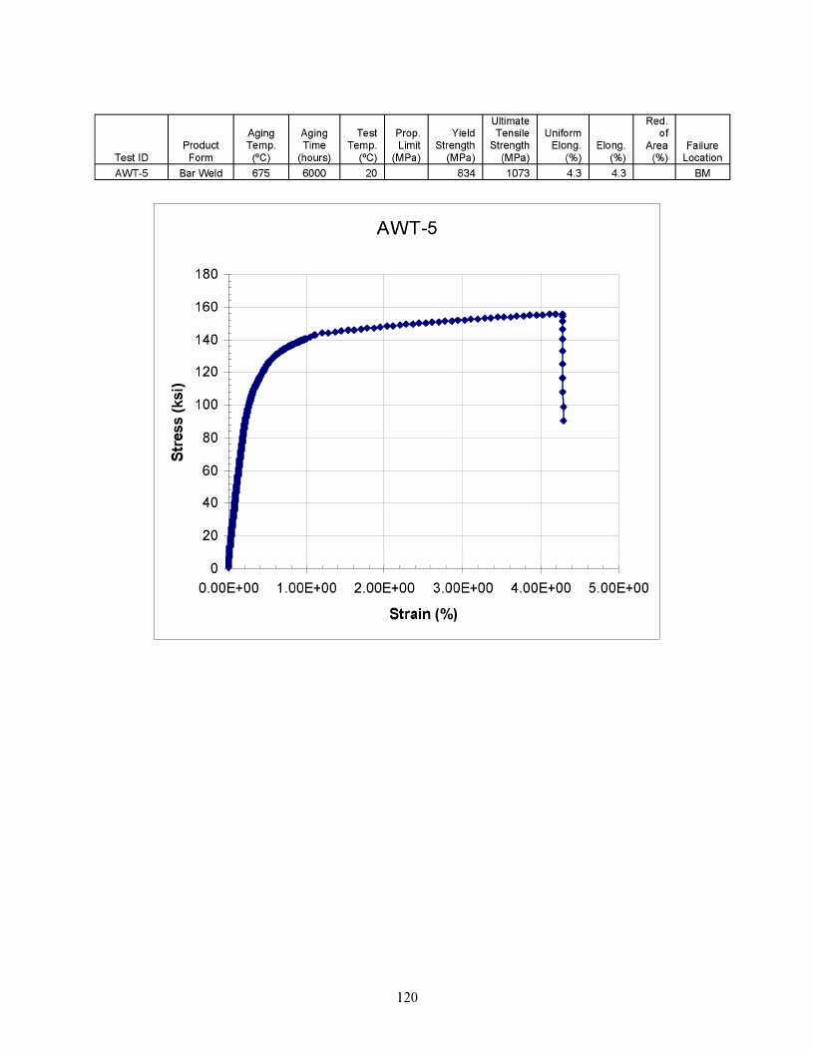
Test ID Product Form
Aging Temp.
(ºC)
Aging Time
(hours)
Test Temp.
(ºC)
Prop. Limit
(MPa)
Yield Strength
(MPa)
Ultimate Tensile
Strength (MPa)
Uniform Elong.
(%) Elong.
(%)
Red. of
Area (%)
Failure Location
AWT-5 Bar Weld 675 6000 20 834 1073 4.3 4.3 BM
AWT-5
180
160
140
120
100
80
60
40
20
0 0.00E+00 1.00E+00 2.00E+00 3.00E+00 4.00E+00 5.00E+00
Strain (%)
120
—
-: w
-~ *
1
1—'—'—'—'—-
<►
<►
t
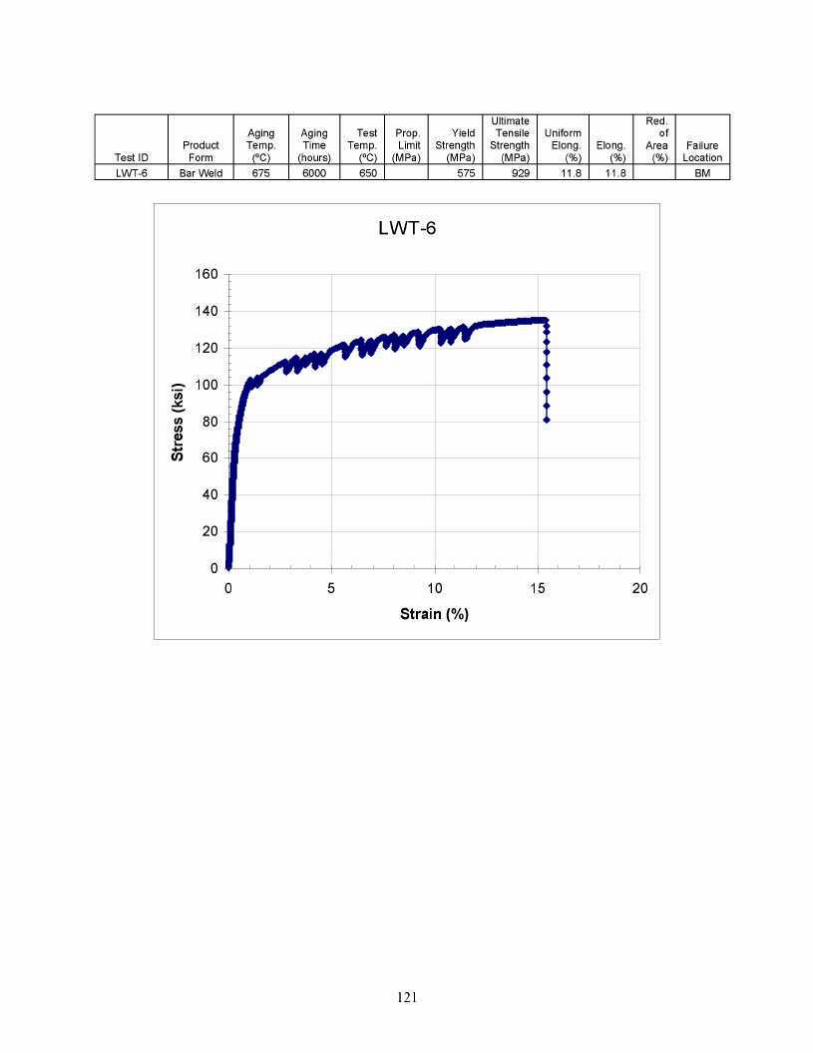
Test ID LWT-6
Product Form
Bar Weld
Aging Temp.
(ºC) 675
Aging Time
(hours) 6000
Test Temp.
(ºC) 650
Prop. Limit
(MPa)
Yield Strength
(MPa) 575
Ultimate Tensile
Strength (MPa)
929
Uniform Elong.
(%) 11.8
Elong. (%)
11.8
Red. of
Area (%)
Failure Location
BM
160
140
120
100
80
60
40
20
0 *
LWT-6
-
-
^AfMffj'r : ¥
ff
<► <►
<►
<►
<►
<►
<>
0 5 10 15 20
Strain (%)
121
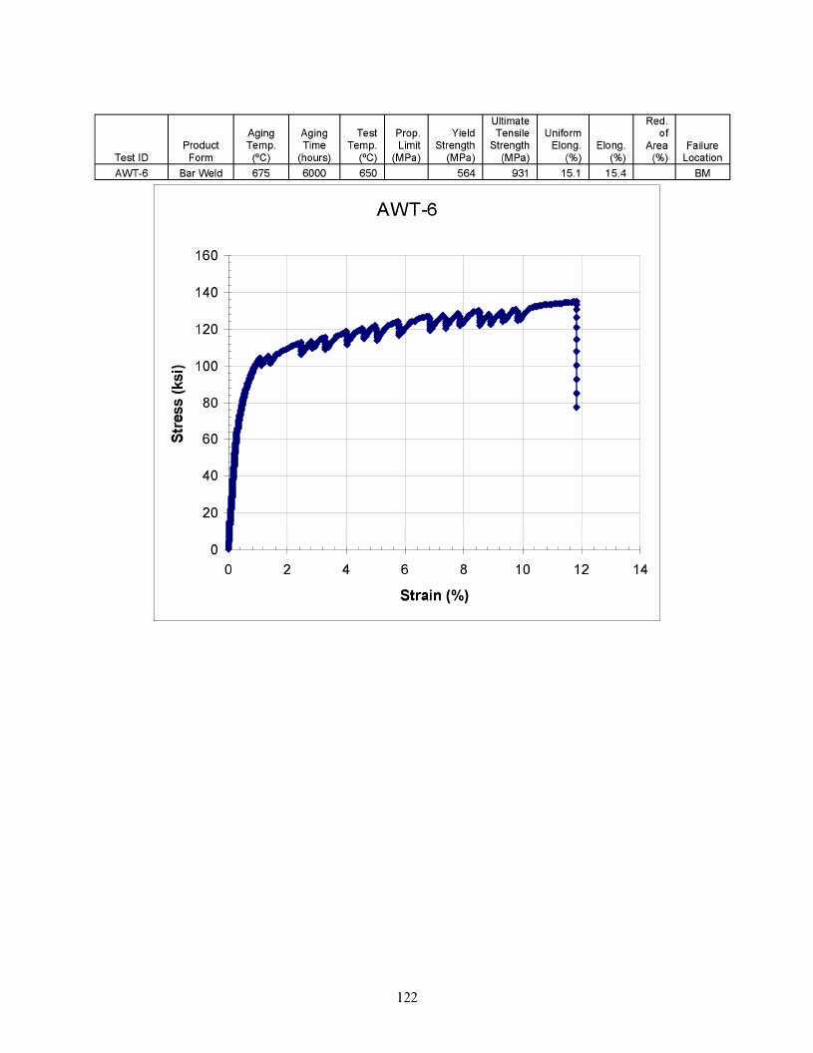
Test ID AWT-6
Product Form
Bar Weld
Aging Temp.
(ºC) 675
Aging Time
(hours) 6000
Test Temp.
(ºC) 650
Prop. Limit
(MPa)
Yield Strength
(MPa) 564
Ultimate Tensile
Strength (MPa)
931
Uniform Elong.
(%) 15.1
Elong. (%)
15.4
Red. of
Area (%)
Failure Location
BM
160
140
120
100
80
60
40
20
0 '
AWT-6
-
-
^
- m
M
0 2 4 6 8 10 12 14
Strain (%)
122
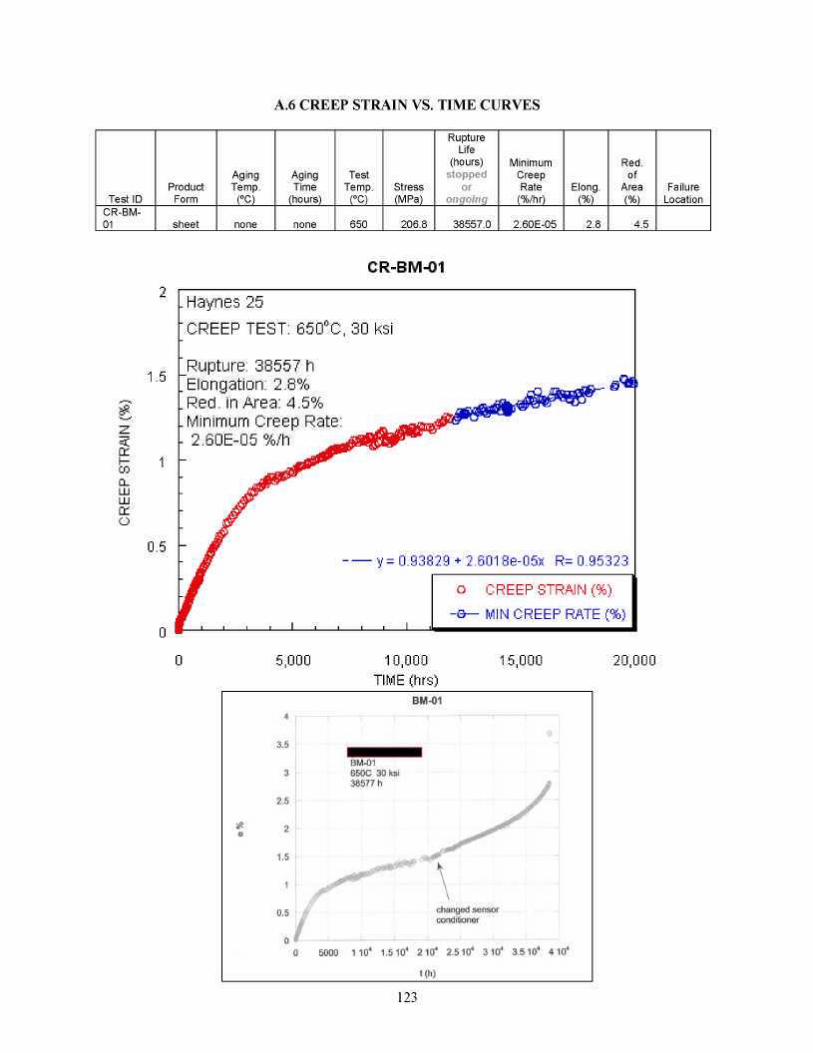
A.6 CREEP STRAIN VS. TIME CURVES
Test ID CR-BM-01
Product Form
sheet
Aging Temp.
(ºC)
none
Aging Time
(hours)
none
Test Temp.
(ºC)
650
Stress (MPa)
206.8
Rupture Life
(hours) stopped
or ongoing
38557.0
Minimum Creep Rate (%/hr)
2.60E-05
Elong. (%)
2.8
Red. of
Area (%)
4.5
Failure Location
123
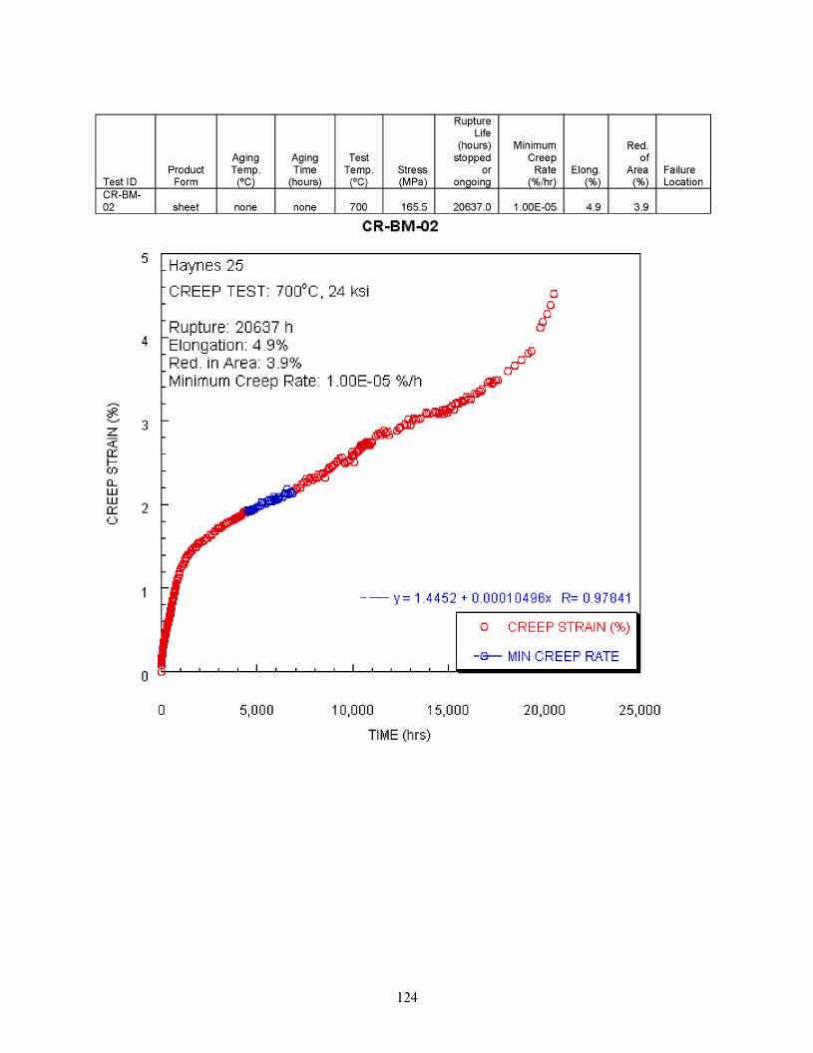
Test ID CR-BM-02
Product Form
sheet
Aging Temp.
(ºC)
none
Aging Time
(hours)
none
Test Temp.
(ºC)
700
Stress (MPa)
165.5
Rupture Life
(hours) stopped
or ongoing
20637.0
Minimum Creep
Rate (%/hr)
1.00E-05
Elong. (%)
4.9
Red. of
Area (%)
3.9
Failure Location
124
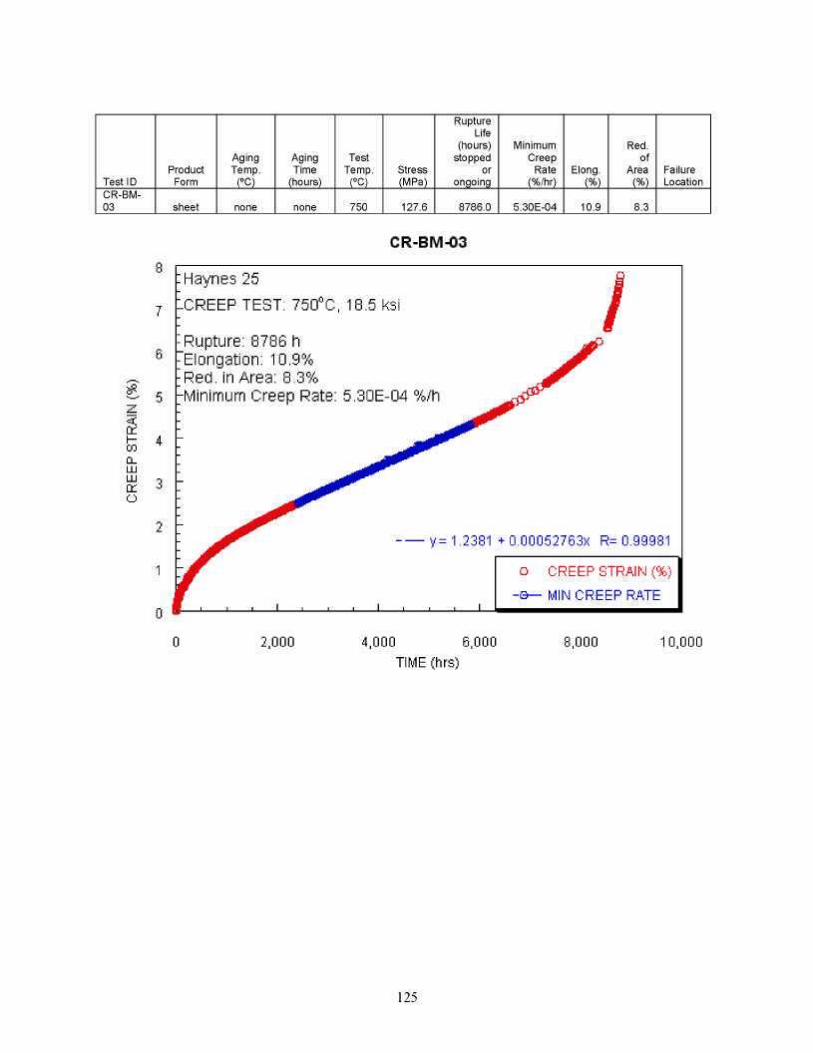
Test ID CR-BM-03
Product Form
sheet
Aging Temp.
(ºC)
none
Aging Time
(hours)
none
Test Temp.
(ºC)
750
Stress (MPa)
127.6
Rupture Life
(hours) stopped
or ongoing
8786.0
Minimum Creep
Rate (%/hr)
5.30E-04
Elong. (%)
10.9
Red. of
Area (%)
8.3
Failure Location
CR-BM-03
#
< i -CD 0_ LU LU
o
Haynes 25 XREEP TEST: 750°C, 18.5 ksi
6 -
3 -
Rupture: 8786 h "Elongation: 10.9% Red. in Area: 8.3% -Minimum Creep Rate: 5.30E-04 %/h
/
■—y= 1.2381 +0.00052763X R= 0.99931
_L _L
o CREEP STRAIN (%) CREEP RATE
2,000 4,000 6,000 TIME (hrs)
,000 10,000
125
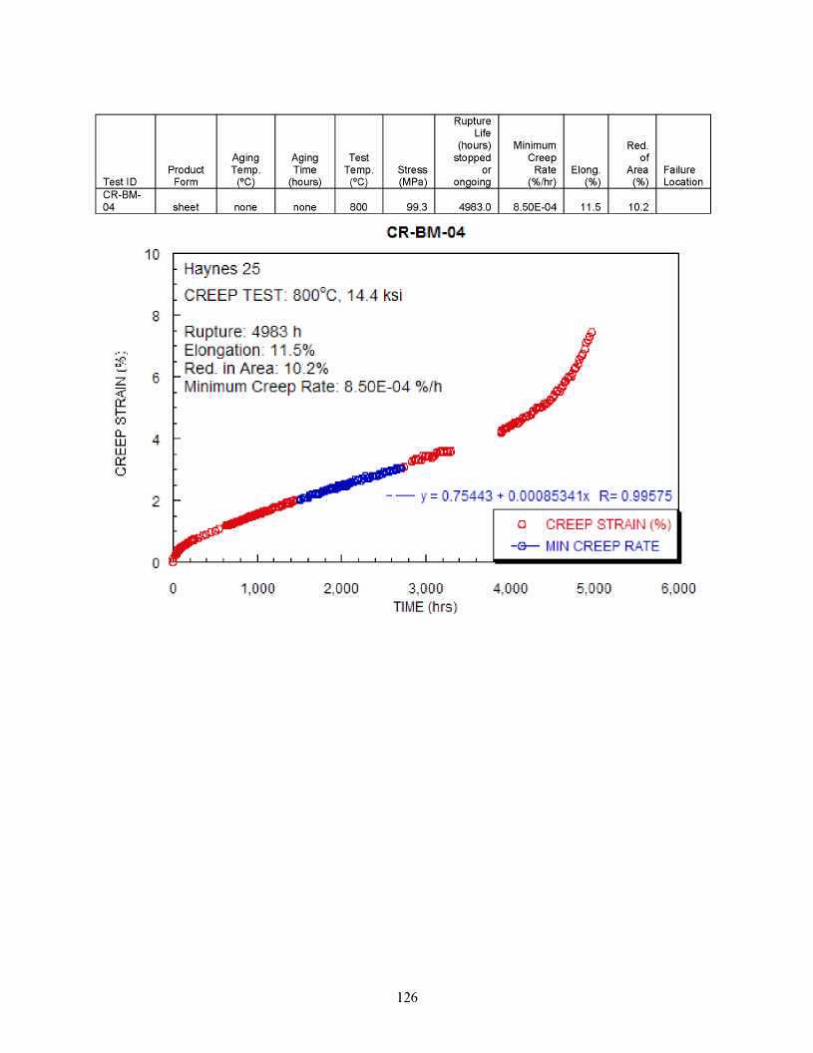
Test ID CR-BM-04
Product Form
sheet
Aging Temp.
(ºC)
none
Aging Time
(hours)
none
Test Temp.
(ºC)
800
Stress (MPa)
99.3
Rupture Life
(hours) stopped
or ongoing
4983.0
Minimum Creep
Rate (%/hr)
8.50E-04
Elong. (%)
11.5
Red. of
Area (%)
10.2
Failure Location
126
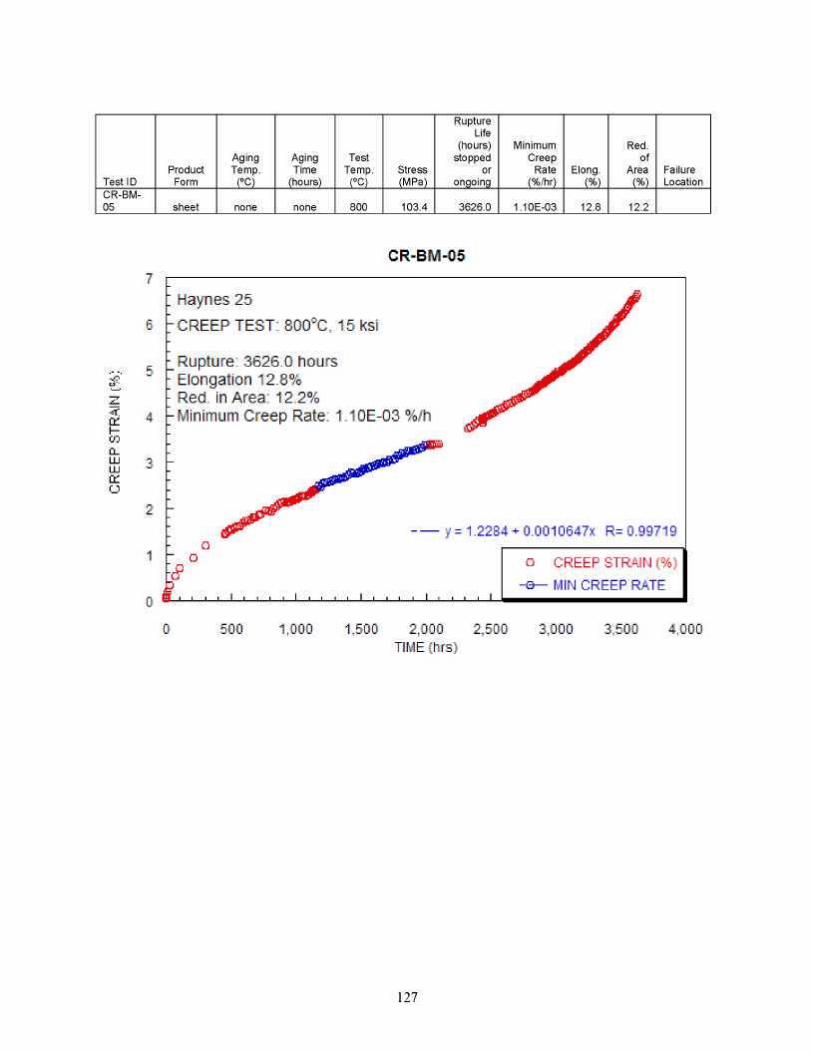
Test ID CR-BM-05
Product Form
sheet
Aging Temp.
(ºC)
none
Aging Time
(hours)
none
Test Temp.
(ºC)
800
Stress (MPa)
103.4
Rupture Life
(hours) stopped
or ongoing
3626.0
Minimum Creep
Rate (%/hr)
1.10E-03
Elong. (%)
12.8
Red. of
Area (%)
12.2
Failure Location
127
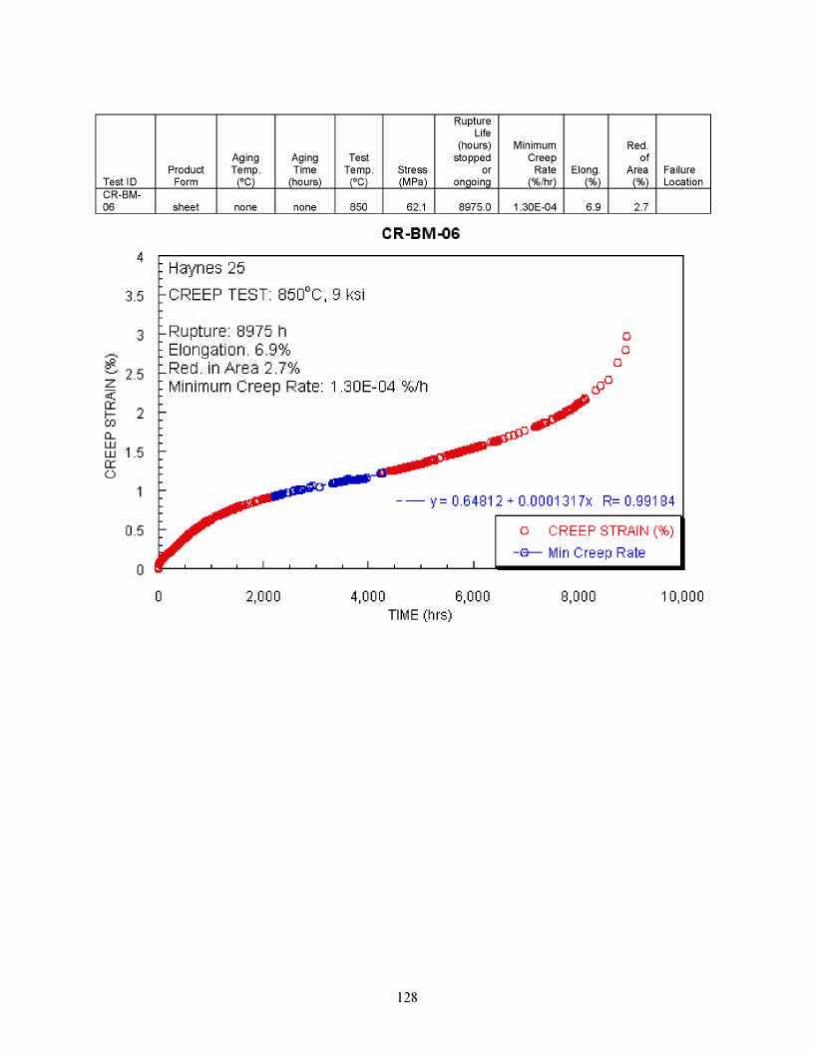
Test ID CR-BM-06
Product Form
sheet
Aging Temp.
(ºC)
none
Aging Time
(hours)
none
Test Temp.
(ºC)
850
Stress (MPa)
62.1
Rupture Life
(hours) stopped
or ongoing
8975.0
Minimum Creep
Rate (%/hr)
1.30E-04
Elong. (%)
6.9
Red. of
Area (%)
2.7
Failure Location
128
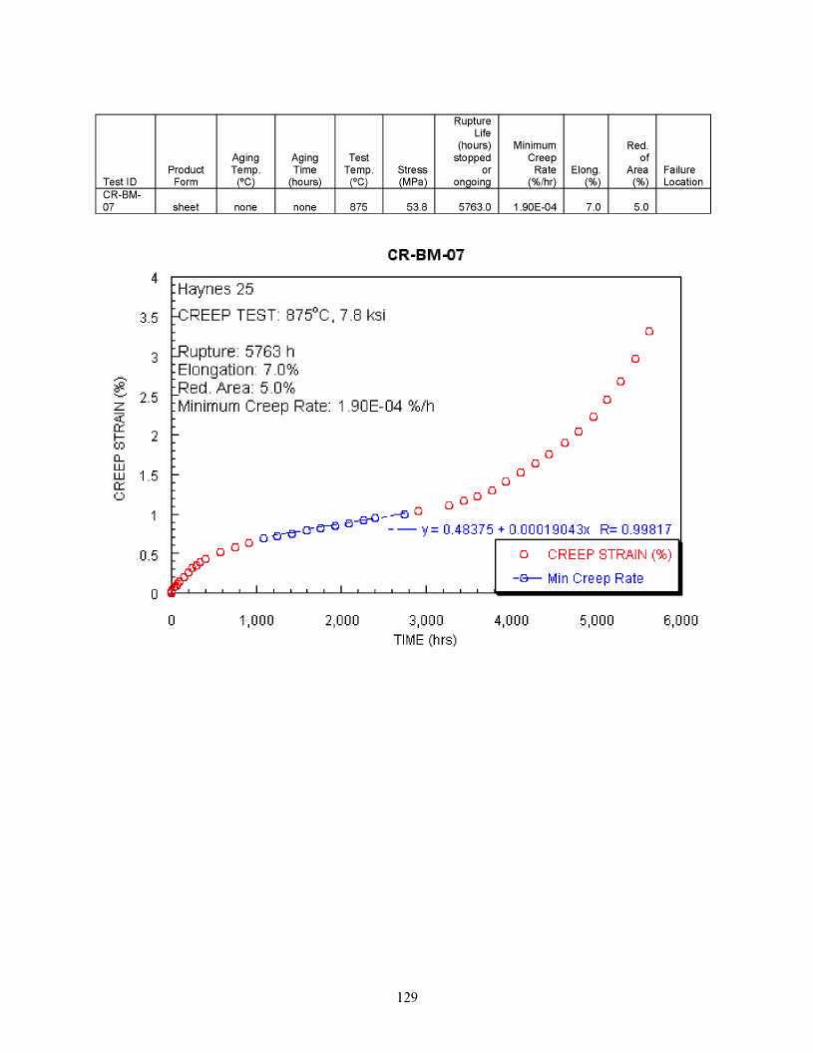
Test ID CR-BM-07
Product Form
sheet
Aging Temp.
(ºC)
none
Aging Time
(hours)
none
Test Temp.
(ºC)
875
Stress (MPa)
53.8
Rupture Life
(hours) stopped
or ongoing
5763.0
Minimum Creep
Rate (%/hr)
1.90E-04
Elong. (%)
7.0
Red. of
Area (%)
5.0
Failure Location
129
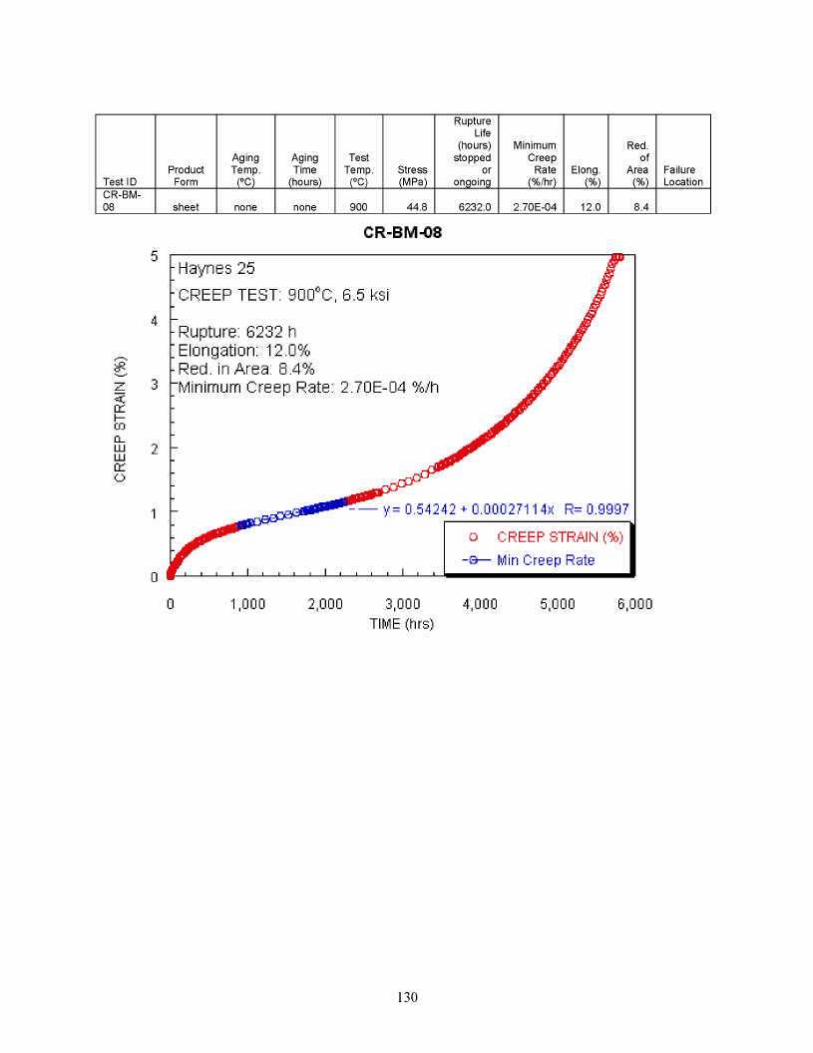
Test ID CR-BM-08
Product Form
sheet
Aging Temp.
(ºC)
none
Aging Time
(hours)
none
Test Temp.
(ºC)
900
Stress (MPa)
44.8
Rupture Life
(hours) stopped
or ongoing
6232.0
Minimum Creep
Rate (%/hr)
2.70E-04
Elong. (%)
12.0
Red. of
Area (%)
8.4
Failure Location
130
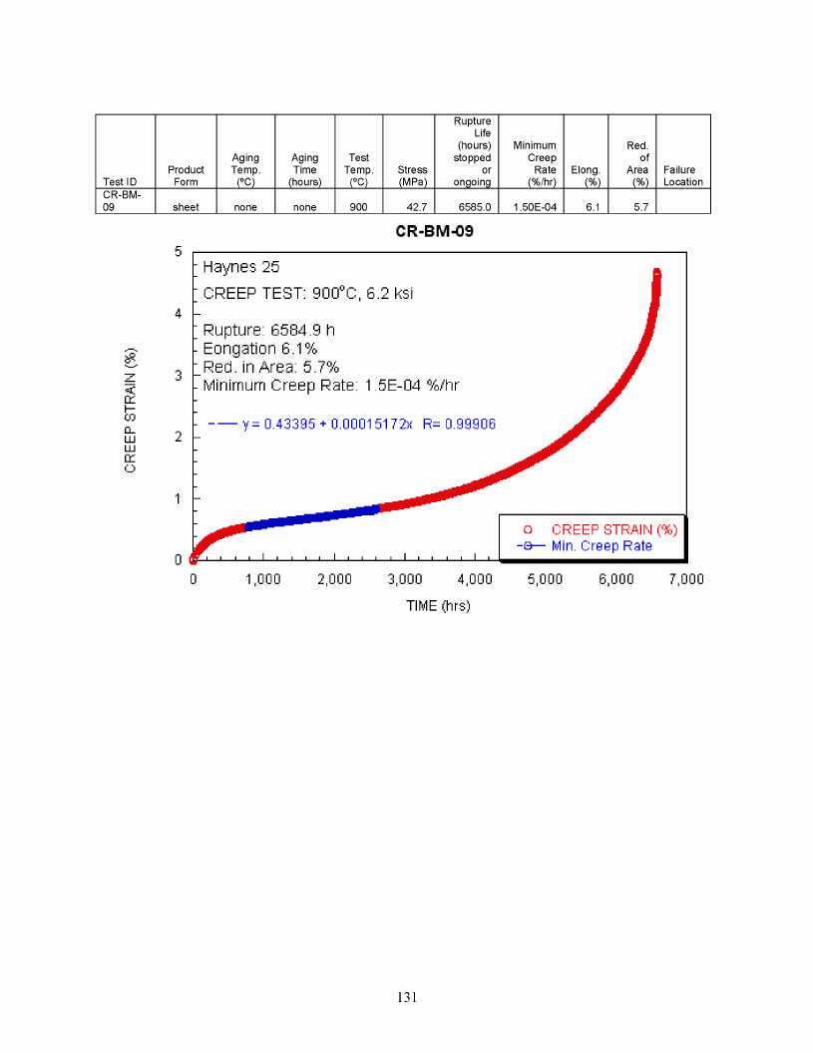
Test ID CR-BM-09
Product Form
sheet
Aging Temp.
(ºC)
none
Aging Time
(hours)
none
Test Temp.
(ºC)
900
Stress (MPa)
42.7
Rupture Life
(hours) stopped
or ongoing
6585.0
Minimum Creep
Rate (%/hr)
1.50E-04
Elong. (%)
6.1
Red. of
Area (%)
5.7
Failure Location
131
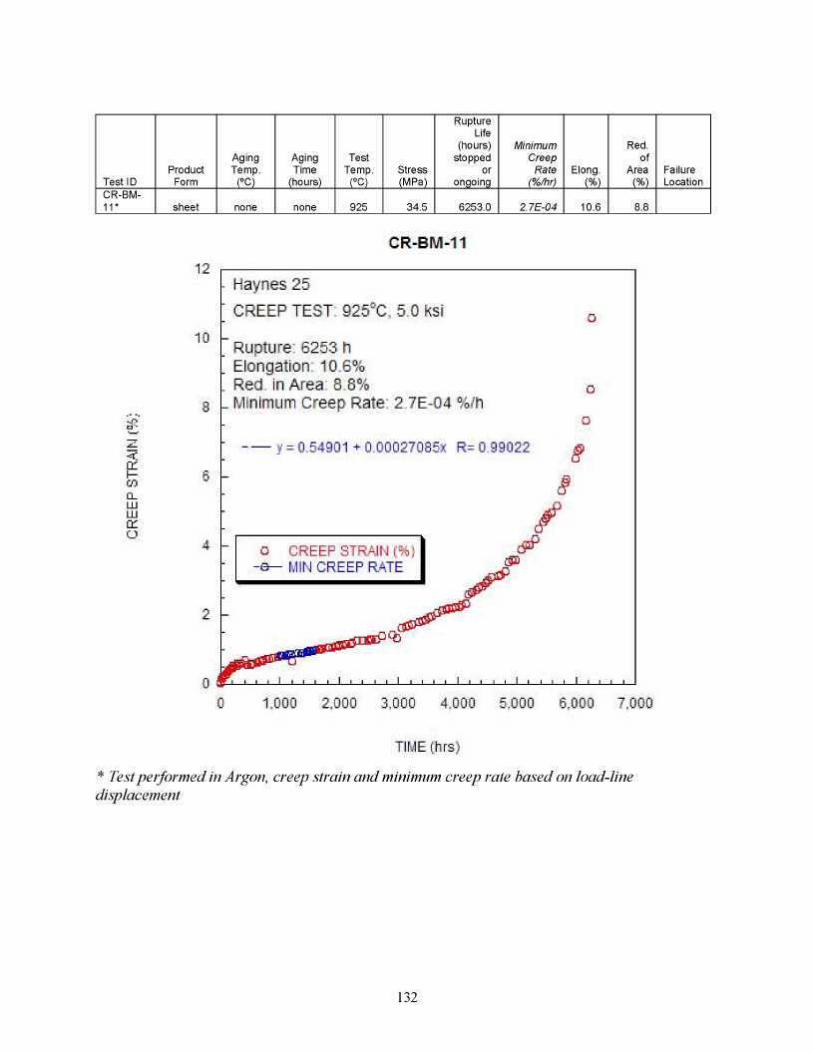
Test ID CR-BM-11*
Product Form
sheet
Aging Temp.
(ºC)
none
Aging Time
(hours)
none
Test Temp.
(ºC)
925
Stress (MPa)
34.5
Rupture Life
(hours) stopped
or ongoing
6253.0
Minimum Creep
Rate (%/hr)
2.7E-04
Elong. (%)
10.6
Red. of
Area (%)
8.8
Failure Location
- * ■
I -
D_ LU LU 01 O
CR-BM-11
12
10 -
6 -
4 -
- Haynes 25
CREEP TEST: 925°C, 5.0 ksi 0
~ Rupture: 6253 h ] Elongation: 10.6% . Red in Area: 6.8% D _ Minimum Creep Rate: 2.7E-04 %/h
o y = 0.54901 *0.000270S5x R= 0.99022 &
: s ■
-
-
Q CREEP STRAIN {%} -e— MIN CREEP RATE
i i i I i i i i 1 i i i l l i i
/ dp
* * *
0 1.000 2.000 3.000 4,000 5,000 6.000 7.000
TIME(rirs)
* Test performed in Argon, creep strain and minimum creep rate based on load-line displacement
132
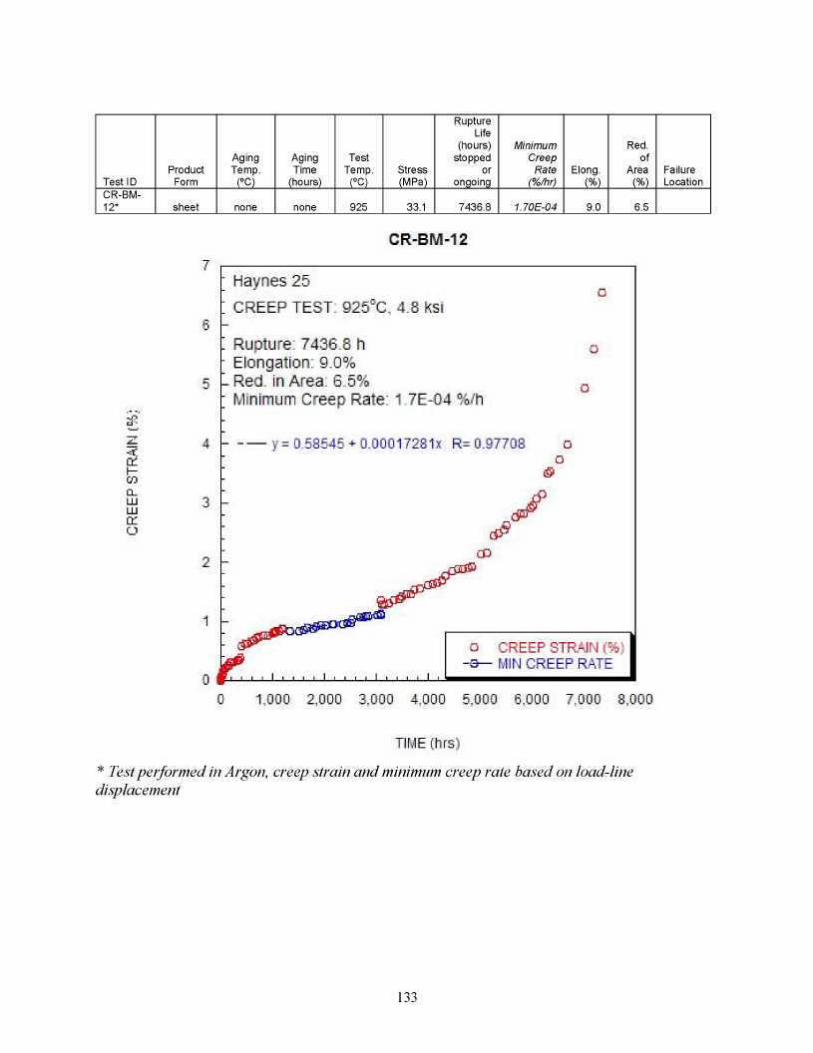
Test ID CR-BM-12*
Product Form
sheet
Aging Temp.
(ºC)
none
Aging Time
(hours)
none
Test Temp.
(ºC)
925
Stress (MPa)
33.1
Rupture Life
(hours) stopped
or ongoing
7436.8
Minimum Creep
Rate (%/hr)
1.70E-04
Elong. (%)
9.0
Red. of
Area (%)
6.5
Failure Location
- * ■
01 F Ul D_ LU LU 01 O
CR-BM-12
3 -
2 -
1 -
Haynes 25 CREEP TEST: 925°C. 4.8 ksi
Rupture: 7436.8 h Elongation: 9.0%
!i |- Red. in Area: 6.5% Minimum Creep Rate: 1.7E-04 %/h
y = 0.53545 + 0.00017281X R= 0.97708 o o
0
o
CP
^ ^
_l I I I I I I I I I I I I I I I I L
o CREEP STRAIN [%) -e— MIN CREEP RATE
0 1,000 2.000 3.000 4,000 5.000 6,000 7,000 3.000
TIME[hrs)
* Test performed in Argon, creep strain and minimum creep rate based on load-line displacement
133
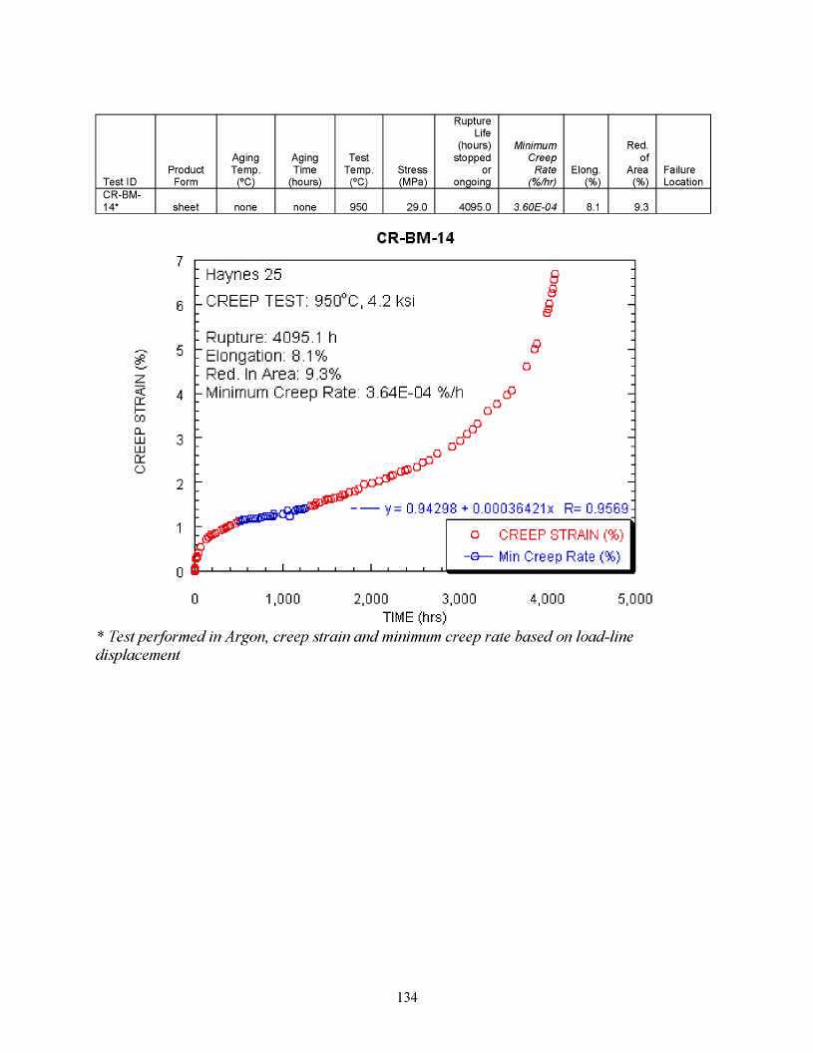
Test ID CR-BM-14*
Product Form
sheet
Aging Temp.
(ºC)
none
Aging Time
(hours)
none
Test Temp.
(ºC)
950
Stress (MPa)
29.0
Rupture Life
(hours) stopped
or ongoing
4095.0
Minimum Creep
Rate (%/hr)
3 60E-04
Elong. (%)
8.1
Red. of
Area (%)
9.3
Failure Location
2.000 3,000 TIME (hrs)
* Test performed in Argon, creep strain and minimum creep rate based on load-line displacement
134
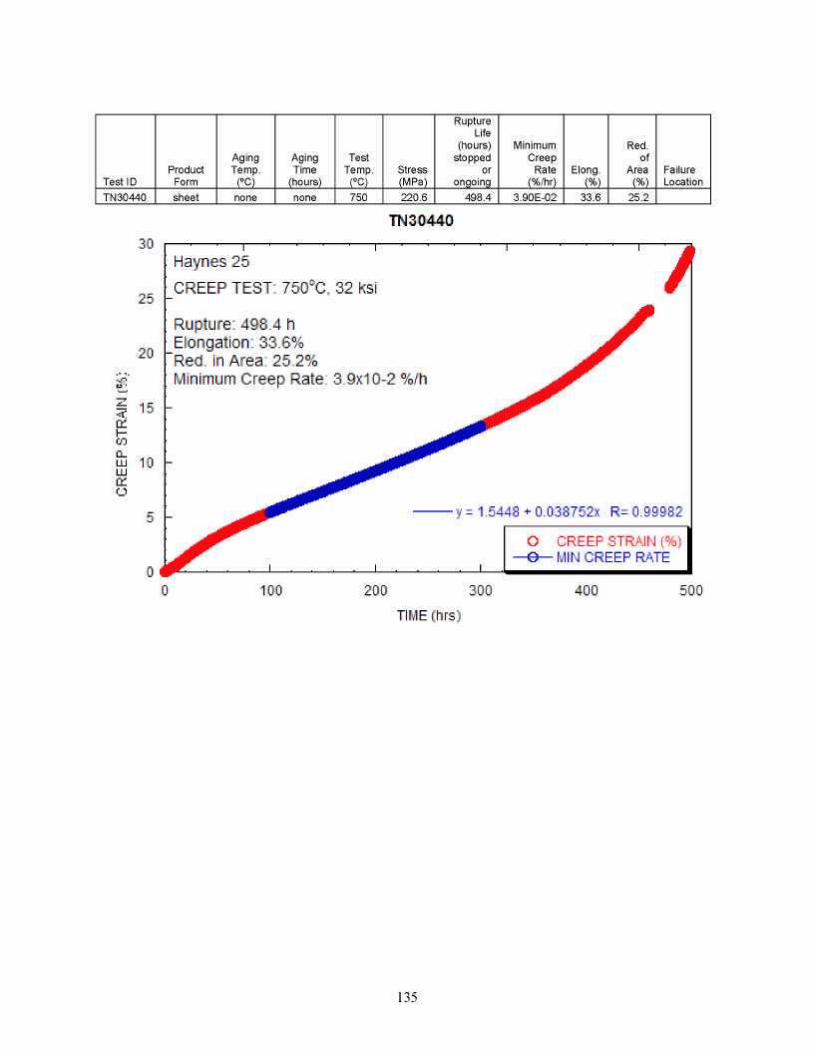
Test ID Product
Form
Aging Temp.
(ºC)
Aging Time
(hours)
Test Temp.
(ºC) Stress (MPa)
Rupture Life
(hours) stopped
or ongoing
Minimum Creep
Rate (%/hr)
Elong. (%)
Red. of
Area (%)
Failure Location
135
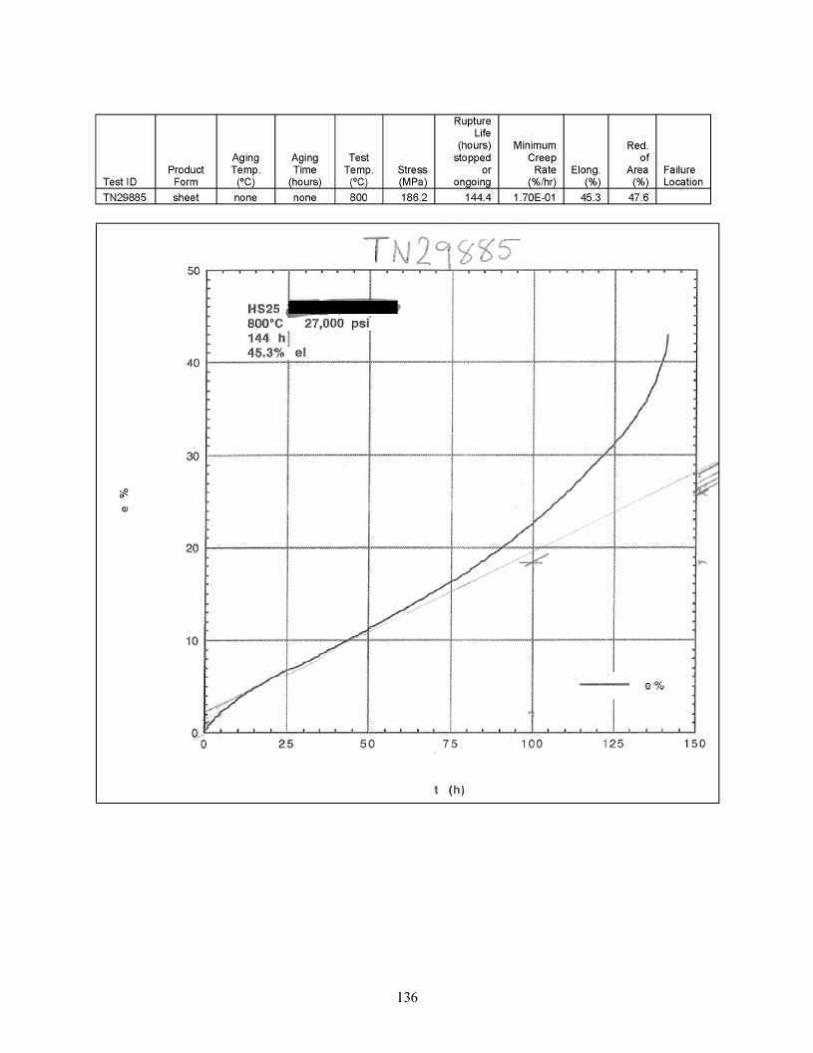
Test ID Product
Form
Aging Temp.
(ºC)
Aging Time
(hours)
Test Temp.
(ºC) Stress (MPa)
Rupture Life
(hours) stopped
or ongoing
Minimum Creep
Rate (%/hr)
Elong. (%)
Red. of
Area (%)
Failure Location
TN29885 sheet 800 186.2 144.4 1.70E-01 45.3 47.6 none none
136
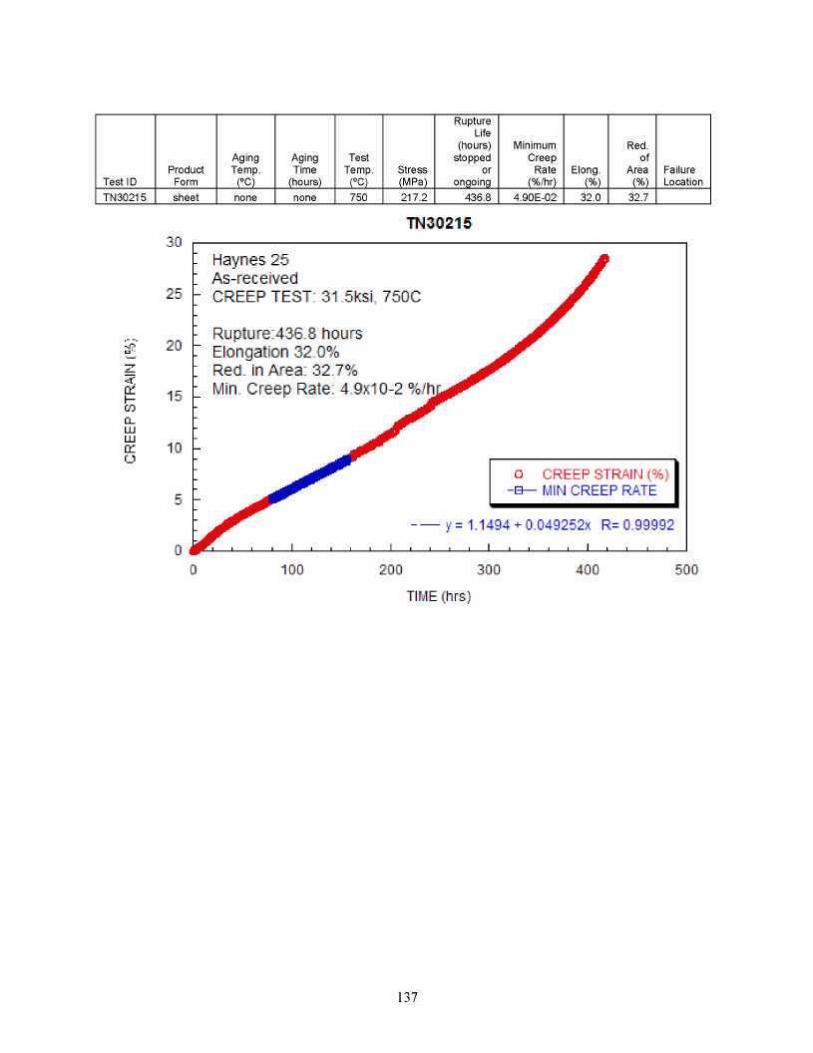
Test ID Product
Form
Aging Temp.
(ºC)
Aging Time
(hours)
Test Temp.
(ºC) Stress (MPa)
Rupture Life
(hours) stopped
or ongoing
Minimum Creep
Rate (%/hr)
Elong. (%)
Red. of
Area (%)
Failure Location
137
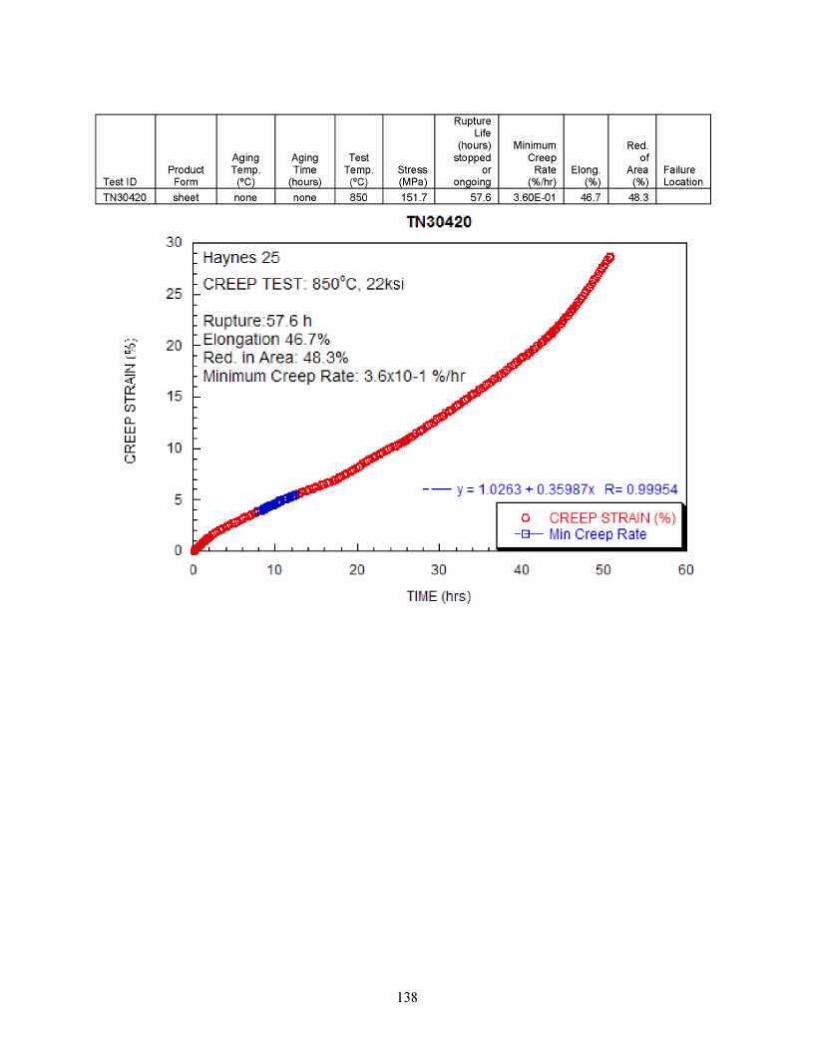
Test ID Product
Form
Aging Temp.
(ºC)
Aging Time
(hours)
Test Temp.
(ºC) Stress (MPa)
Rupture Life
(hours) stopped
or ongoing
Minimum Creep
Rate (%/hr)
Elong. (%)
Red. of
Area (%)
Failure Location
138
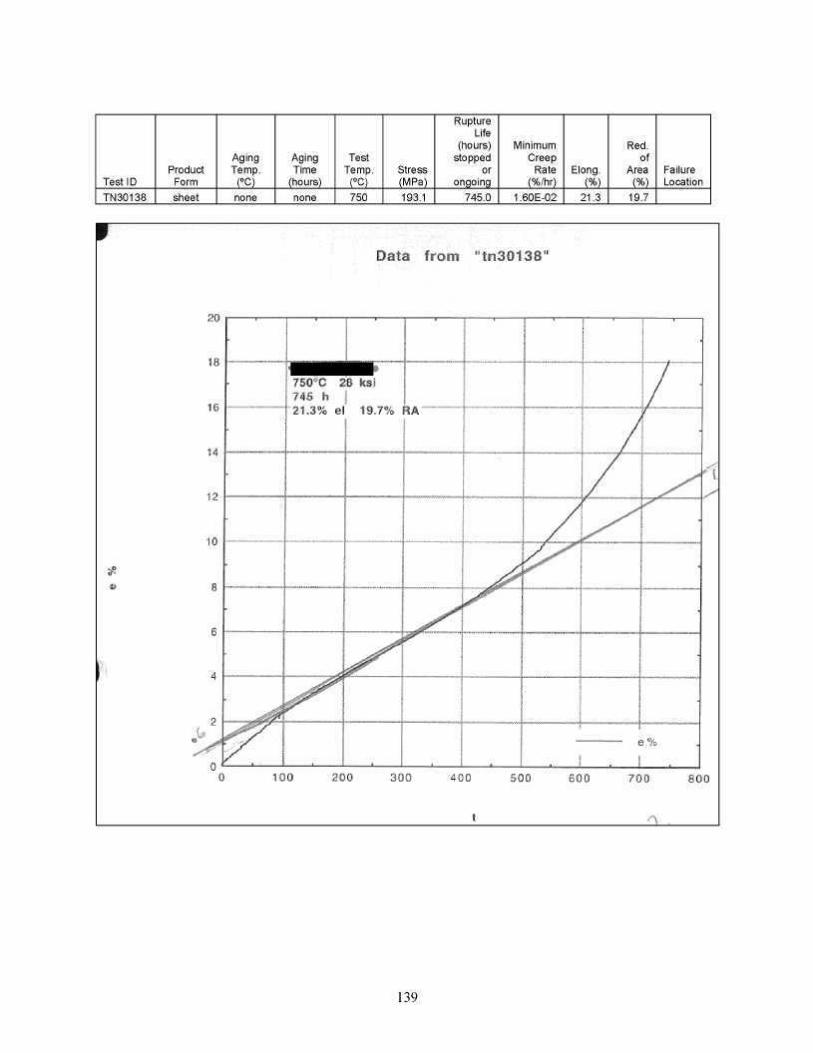
Test ID Product
Form
Aging Temp.
(ºC)
Aging Time
(hours)
Test Temp.
(ºC) Stress (MPa)
Rupture Life
(hours) stopped
or ongoing
Minimum Creep
Rate (%/hr)
Elong. (%)
Red. of
Area (%)
Failure Location
TN30138 sheet 750 193.1 745.0 1.60E-02 21.3 19.7 none none
139
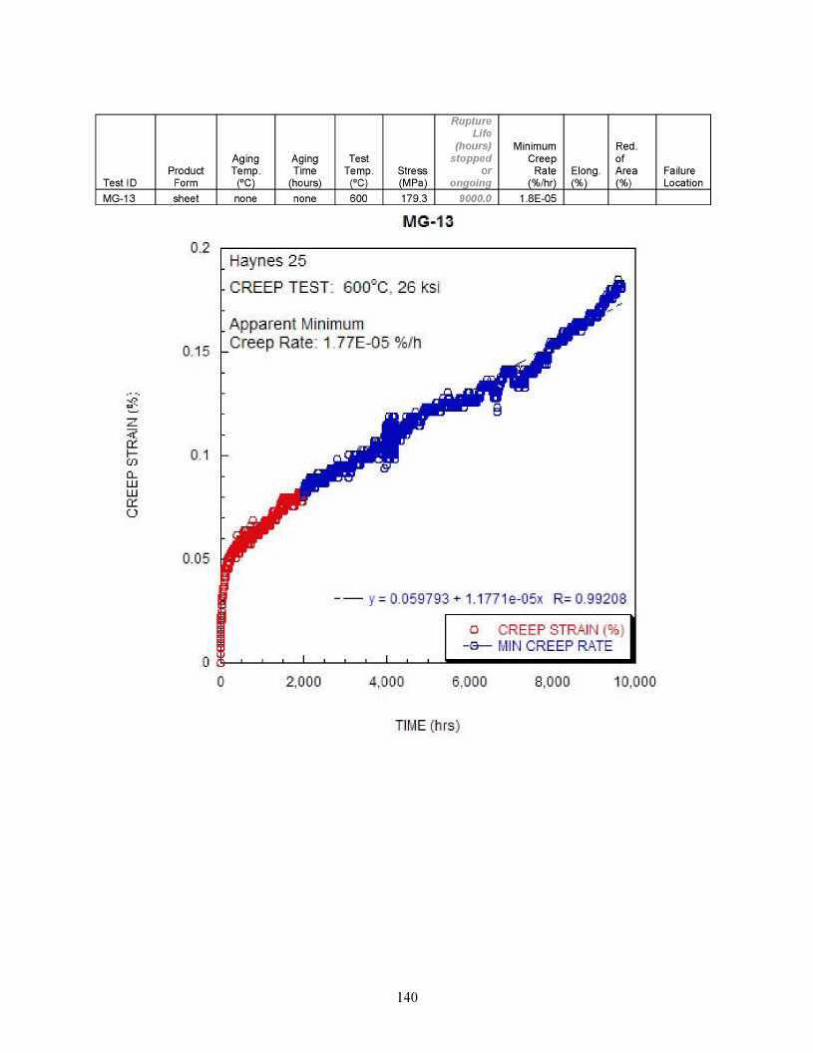
Test ID Product
Form
Aging Temp.
(ºC)
Aging Time
(hours)
Test Temp.
(ºC) Stress (MPa)
Rupture Life
(hours) stopped
or ongoing
Minimum Creep
Rate (%/hr)
Elong. (%)
Red. of Area (%)
Failure Location
MG-13 sheet 600 179.3 9000.0 1.8E-05
01 F Q] D_ LU LU 01 O
0.1
0.05
MG-13
0.2
0.15 -
Haynes 25
CREEP TEST: 600°C. 26 ksi
Apparent Minimum Creep Rate: 1.77E-05 %/h
— y = 0.059793 +- 1.1771e-05x R= 0.99208
o CREEP STRAIN {%) -Q— MIN CREEP RATE
0 2.000 4.000 6,000 8.000 10.000
TIMEfhrs)
none none
140
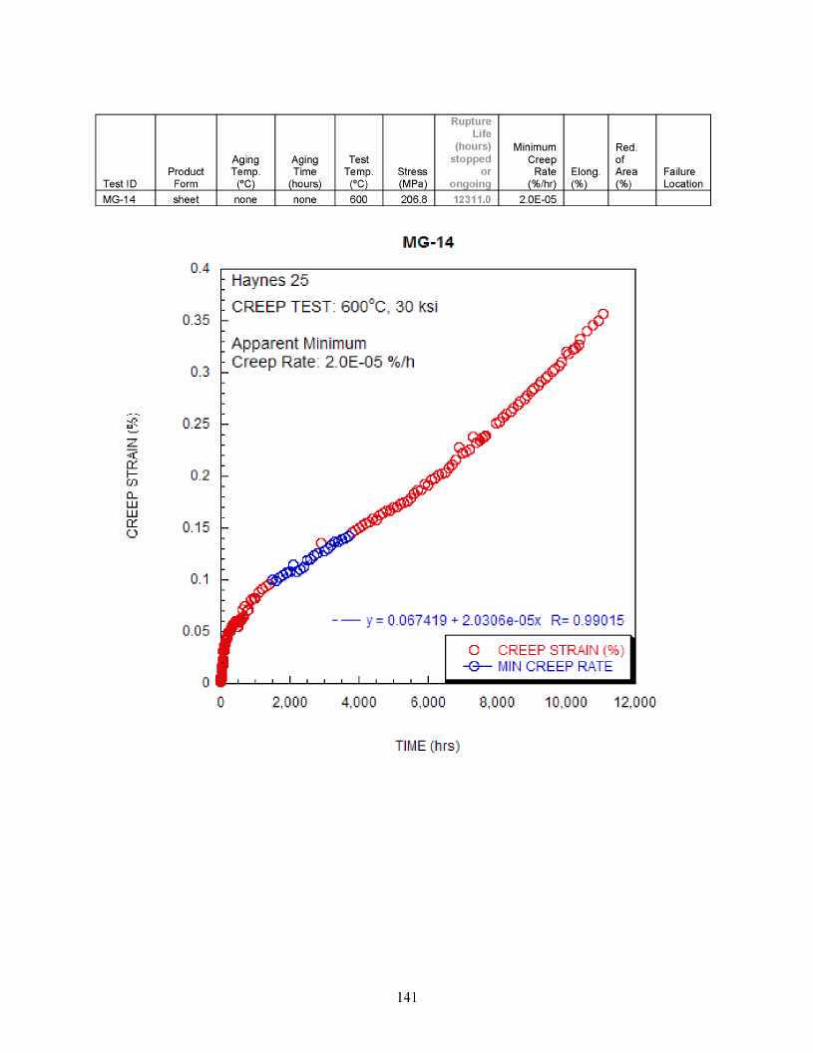
Test ID MG-14
Product Form sheet
Aging Temp.
(ºC) none
Aging Time
(hours) none
Test Temp.
(ºC) 600
Stress (MPa) 206.8
Rupture Life
(hours) stopped
or ongoing 12311.0
Minimum Creep
Rate (%/hr)
2.0E-05
Elong. (%)
Red. of Area (%)
Failure Location
MG-14
01 F Q] D_ LU LU fZ O
04
0.35 -
0.3 -
0.25 -
0.2
0.15 -
0.1 -
0.05
Haynes 25 CREEP TEST: 600°C, 30 ksi
Apparent Minimum Creep Rate: 2.0E-05 %/h
— y = 0.067419 + 2.0306e-05x R= 0.99015
0 P-1—'—'—i—' 0 2,000
O CREEP STRAIN (%) MIN CREEP RATE
4.000 6,000 3.000 10,000 12,000
TIMEfhrs)
141
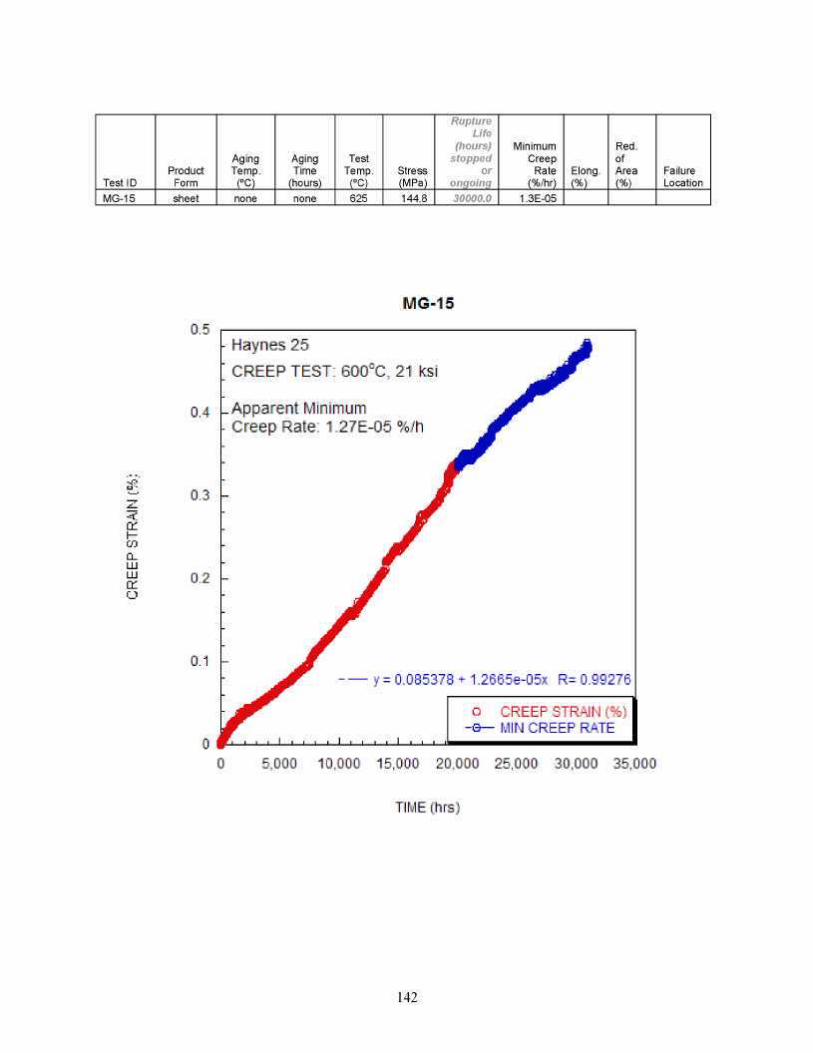
Test ID Product
Form
Aging Temp.
(ºC)
Aging Time
(hours)
Test Temp.
(ºC) Stress (MPa)
Rupture Life
(hours) stopped
or ongoing
Minimum Creep
Rate (%/hr)
Elong. (%)
Red. of Area (%)
Failure Location
142
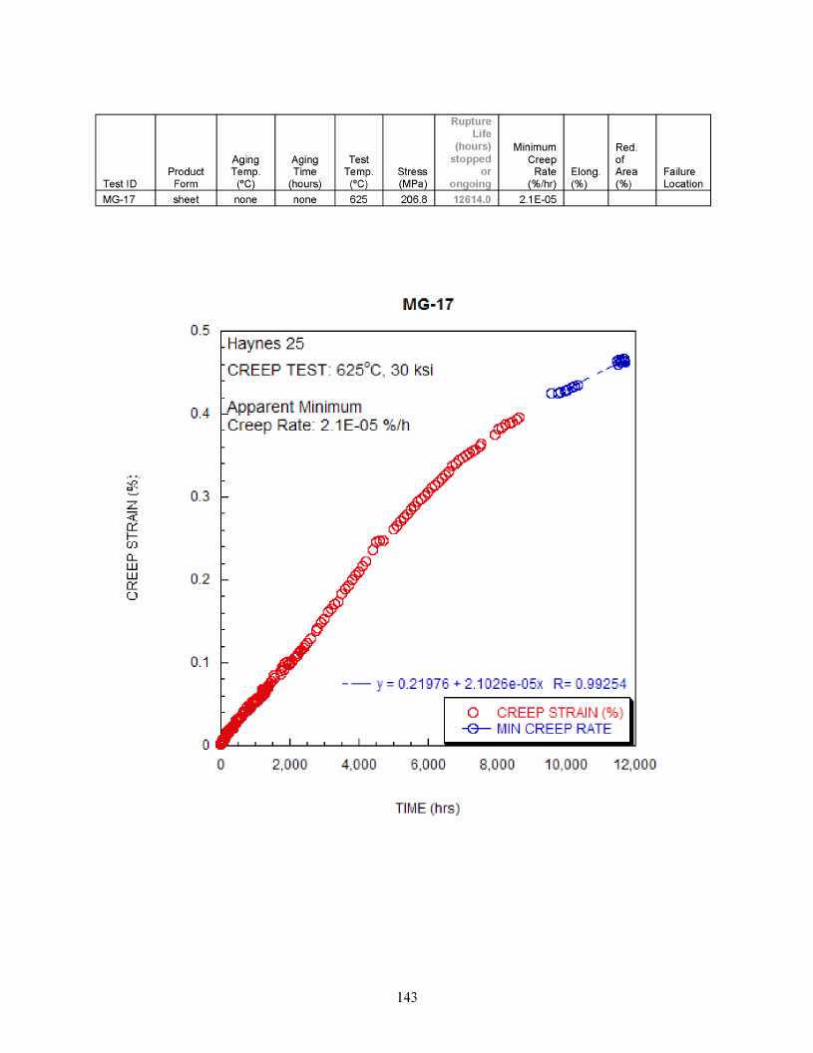
Test ID Product
Form
Aging Temp.
(ºC)
Aging Time
(hours)
Test Temp.
(ºC) Stress (MPa)
Rupture Life
(hours) stopped
or ongoing
Minimum Creep
Rate (%/hr)
Elong. (%)
Red. of Area (%)
Failure Location
143
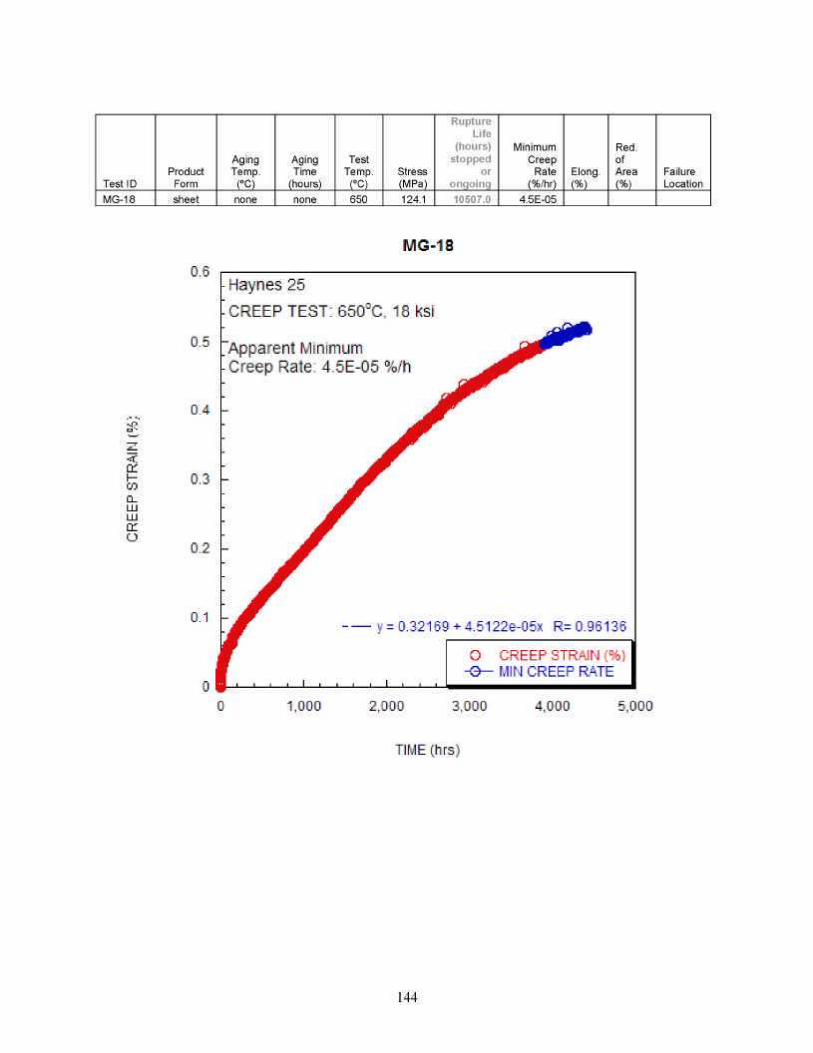
Test ID MG-18
Product Form sheet
Aging Temp.
(ºC) none
Aging Time
(hours) none
Test Temp.
(ºC) 650
Stress (MPa) 124.1
Rupture Life
(hours) stopped
or ongoing 10507.0
Minimum Creep
Rate (%/hr)
4.5E-05
Elong. (%)
Red. of Area (%)
Failure Location
MG-18
0.6
01 F CO
01 O
0.5 -
04 -
0.3 -
0.2 -
0.1 -
Haynes 25
CREEP TEST:650°C, 18 ksi
"Apparent Minimum Creep Rate: 4.5E-05 %/h
— y = 0.32169-^45122e-05x R= 0.96136
O CREEP STRAIN [%} MIN CREEP RATE
0 1.000 2.000 3,000 4000 5.000
TIME (hrs)
144
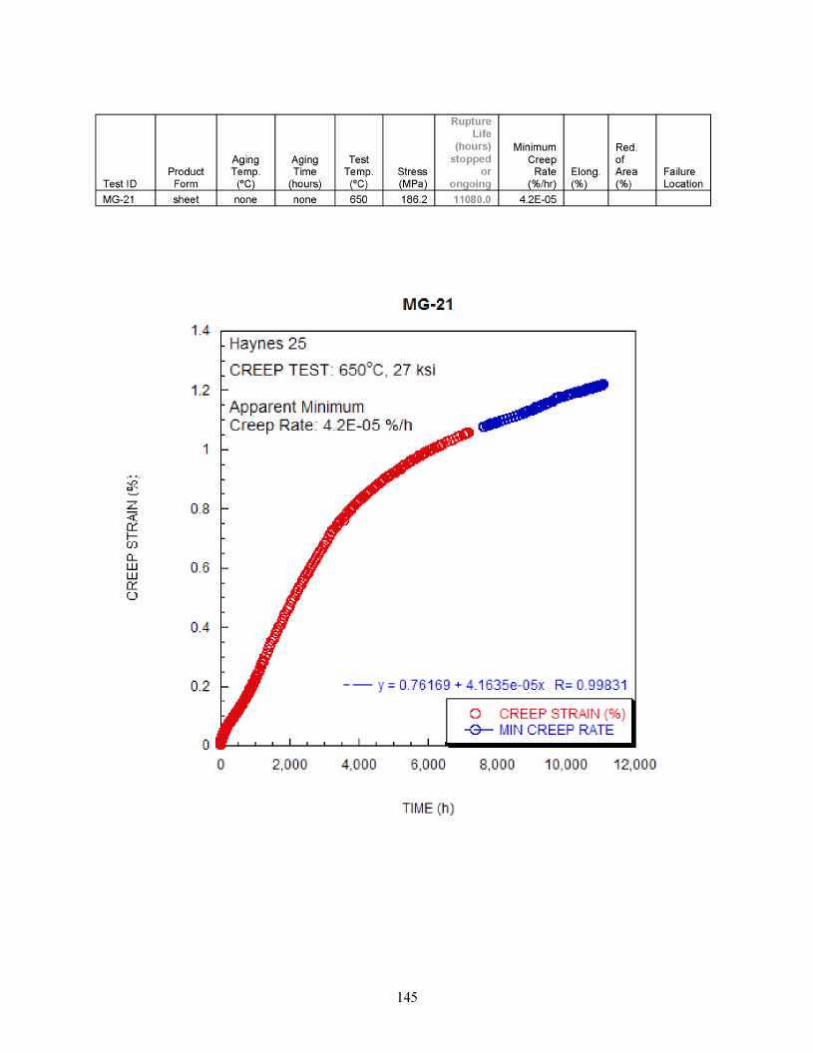
Test ID Product
Form
Aging Temp.
(ºC)
Aging Time
(hours)
Test Temp.
(ºC) Stress (MPa)
Rupture Life
(hours) stopped
or ongoing
Minimum Creep
Rate (%/hr)
Elong. (%)
Red. of Area (%)
Failure Location
145
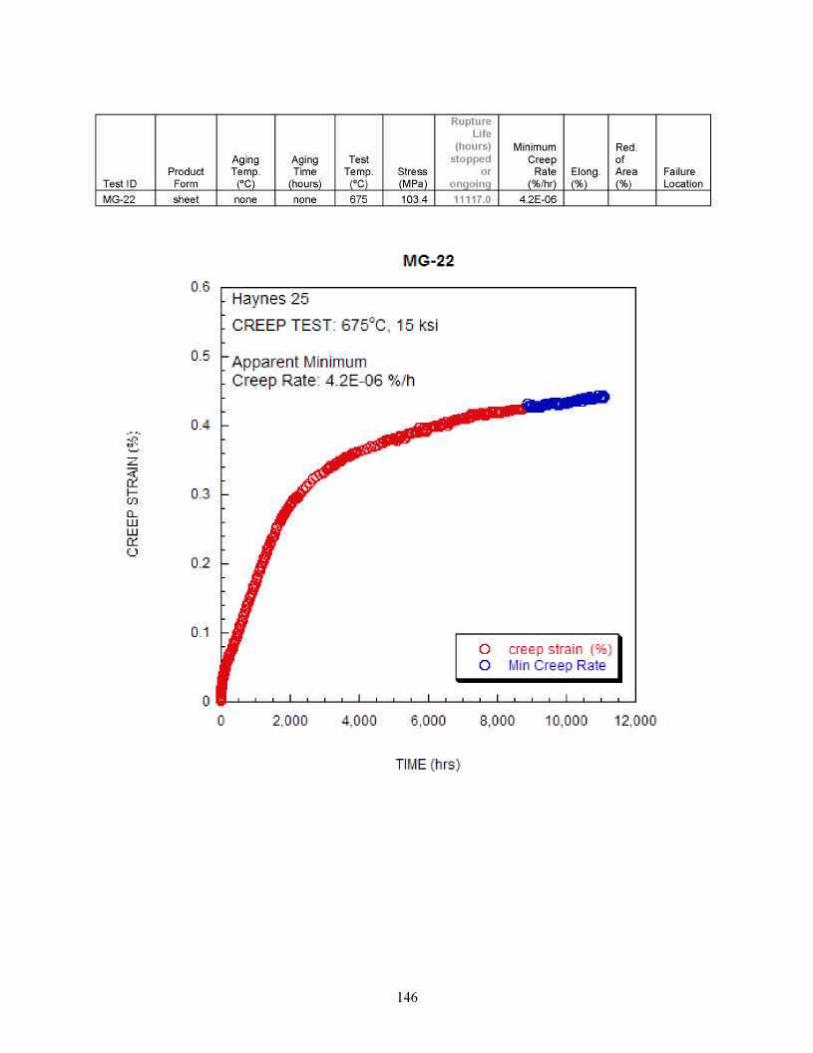
Test ID MG-22
Product Form sheet
Aging Temp.
(ºC) none
Aging Time
(hours) none
Test Temp.
(ºC) 675
Stress (MPa) 103.4
Rupture Life
(hours) stopped
or ongoing
Minimum Creep
Rate (%/hr)
4.2E-06
Elong. (%)
Red. of Area (%)
Failure Location
MG-22
01 F Q] D_ LU LU 01 O
0.6
0.5 -
0.4
Haynes 25 CREEP TEST: 675°C, 15 ksi
'Apparent Minimum Creep Rate: 4.2E-06 %/h
O creep strain (%; O Min Creep Rate
0 2,000 4.000 6,000 8.000 10.000 12,000
TIME (hrs)
146
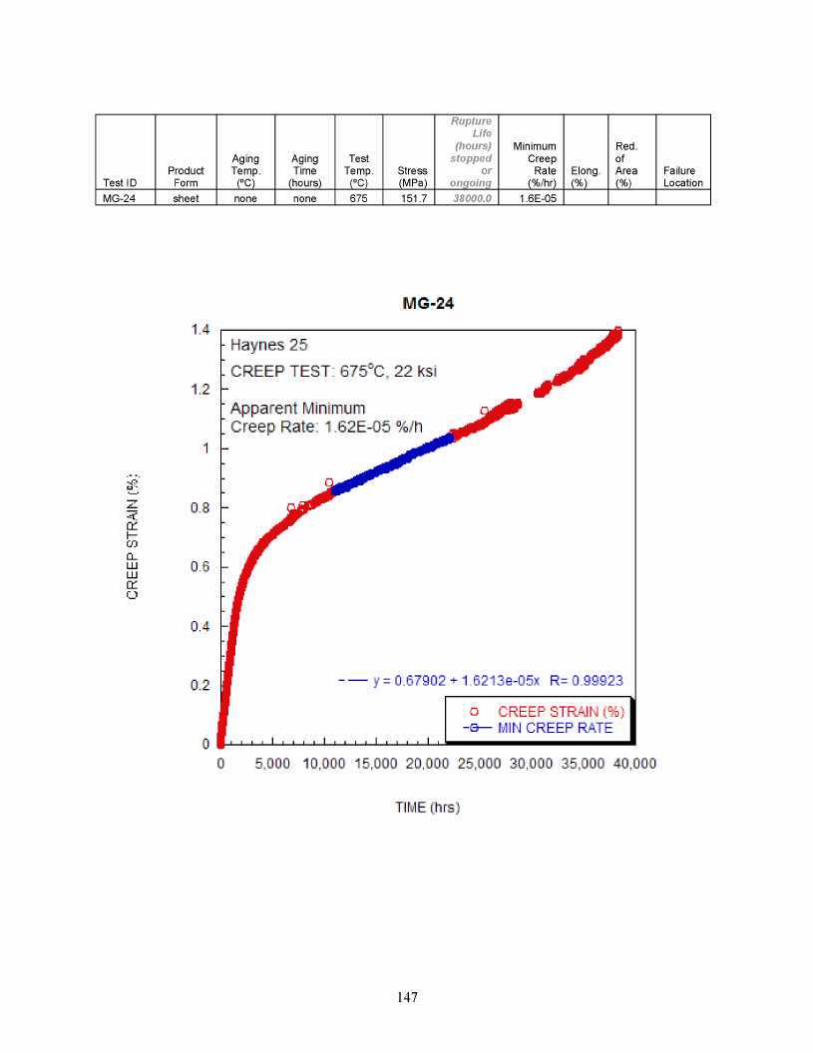
Test ID Product
Form
Aging Temp.
(ºC)
Aging Time
(hours)
Test Temp.
(ºC) Stress (MPa)
Rupture Life
(hours) stopped
or ongoing
Minimum Creep
Rate (%/hr)
Elong. (%)
Red. of Area (%)
Failure Location
147
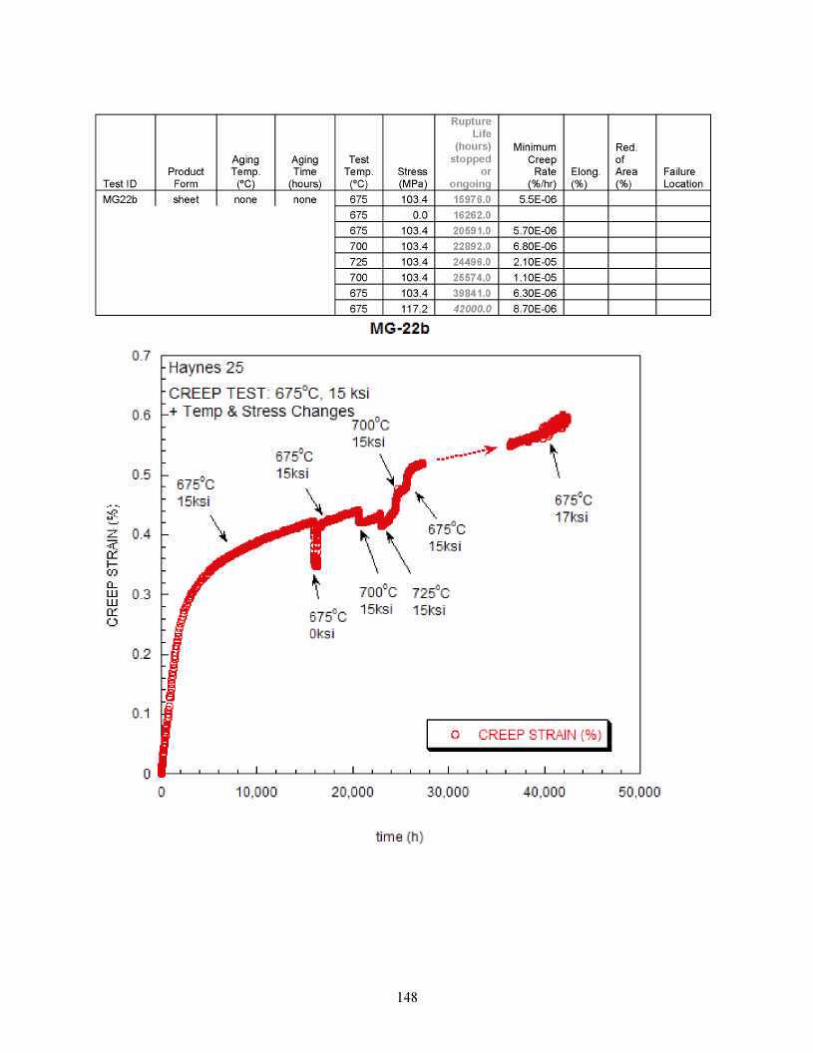
Test ID MG22b
Product Form sheet
Aging Temp.
(ºC) none
Aging Time
(hours) none
Test Temp.
(ºC) 675 675 675 700 725 700 675 675
Stress (MPa) 103.4
0.0 103.4 103.4 103.4 103.4 103.4 117.2
Rupture Life
(hours) stopped
or ongoing
Minimum Creep
Rate (%/hr)
5.5E-06
5.70E-06 6.80E-06 2.10E-05 1.10E-05 6.30E-06 8.70E-06
Elong. (%)
Red. of Area (%)
Failure Location
148
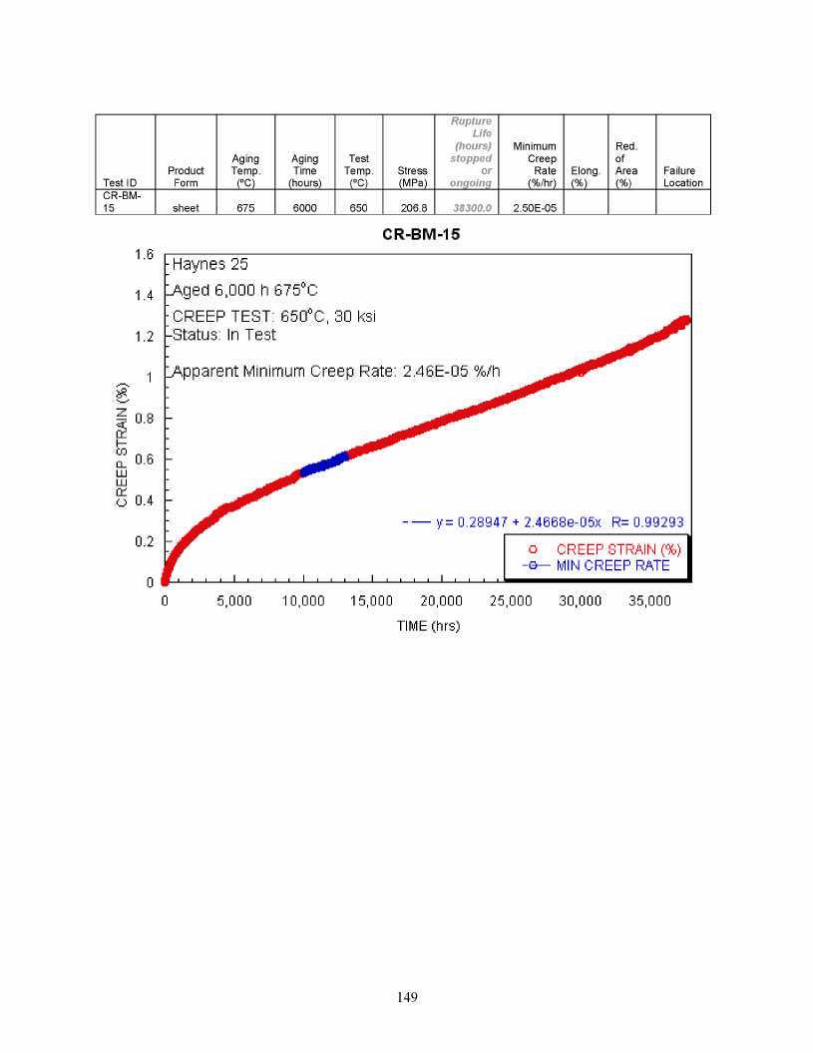
Test ID CR-BM-15
Product Form
sheet
Aging Temp.
(ºC)
675
Aging Time
(hours)
6000
Test Temp.
(ºC)
650
Stress (MPa)
206.8
Rupture Life
(hours) stopped
or ongoing
38300.0
Minimum Creep
Rate (%/hr)
2.50E-05
Elong. (%)
Red. of Area (%)
Failure Location
149
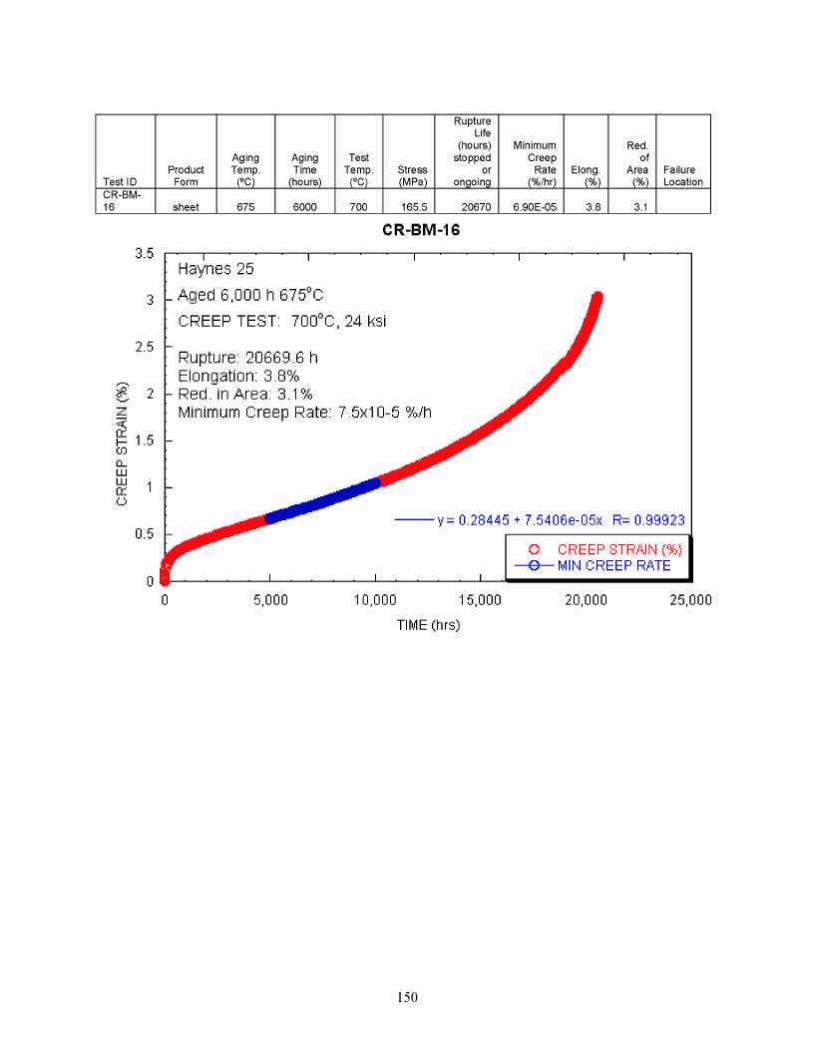
Test ID CR-BM-16
Product Form
sheet
Aging Temp.
(ºC)
675
Aging Time
(hours)
6000
Test Temp.
(ºC)
700
Stress (MPa)
165.5
Rupture Life
(hours) stopped
or ongoing
20670
Minimum Creep
Rate (%/hr)
6.90E-05
Elong. (%)
3.8
Red. of
Area (%)
3.1
Failure Location
150
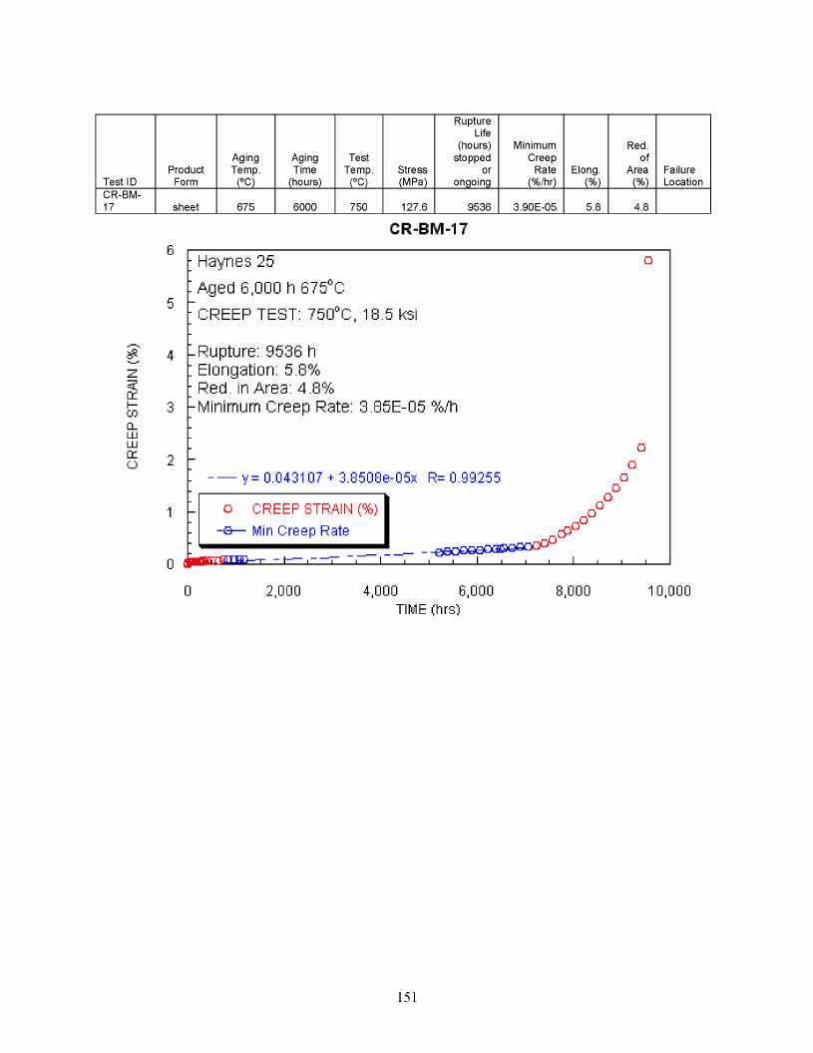
Test ID CR-BM-17
Product Form
sheet
Aging Temp.
(ºC)
675
Aging Time
(hours)
6000
Test Temp.
(ºC)
750
Stress (MPa)
127.6
Rupture Life
(hours) stopped
or ongoing
9536
Minimum Creep
Rate (%/hr)
3.90E-05
Elong. (%)
5.8
Red. of
Area (%)
4.8
Failure Location
151
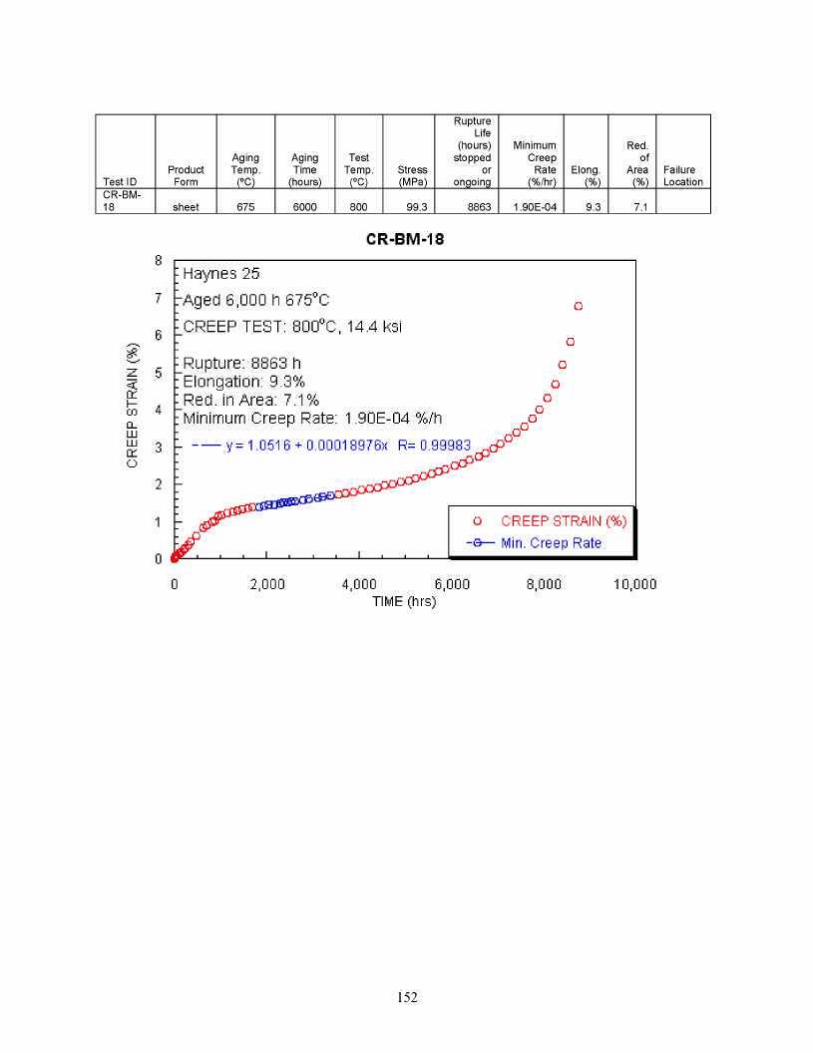
Test ID CR-BM-18
Product Form
sheet
Aging Temp.
(ºC)
675
Aging Time
(hours)
6000
Test Temp.
(ºC)
800
Stress (MPa)
99.3
Rupture Life
(hours) stopped
or ongoing
8863
Minimum Creep
Rate (%/hr)
1.90E-04
Elong. (%)
9.3
Red. of
Area (%)
7.1
Failure Location
152
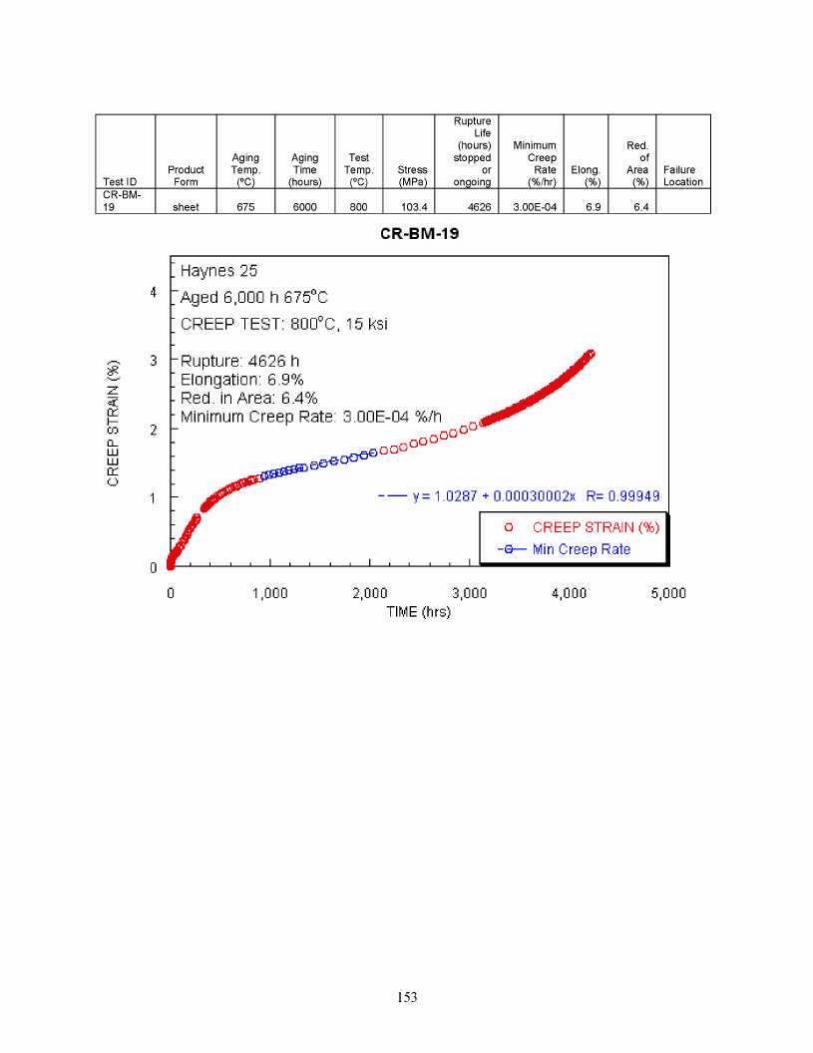
Test ID CR-BM-19
Product Form
sheet
Aging Temp.
(ºC)
675
Aging Time
(hours)
6000
Test Temp.
(ºC)
800
Stress (MPa)
103.4
Rupture Life
(hours) stopped
or ongoing
4626
Minimum Creep
Rate (%/hr)
3.00E-04
Elong. (%)
6.9
Red. of
Area (%)
6.4
Failure Location
153
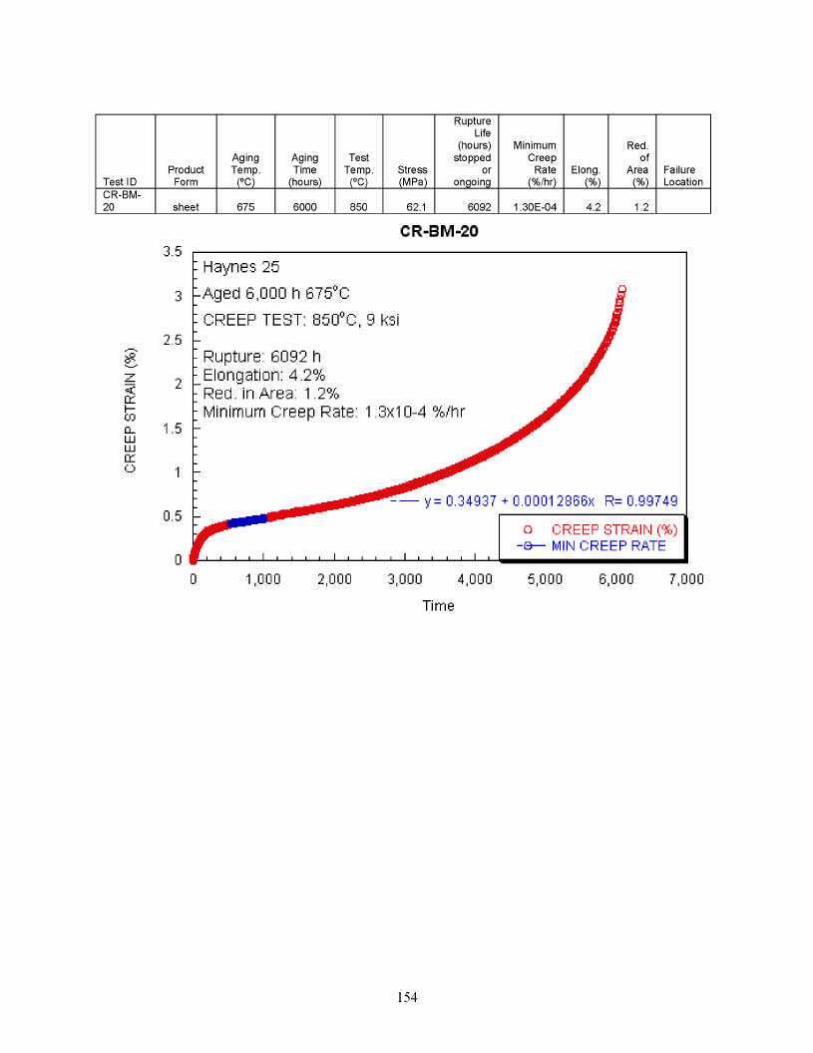
Test ID CR-BM-20
Product Form
sheet
Aging Temp.
(ºC)
675
Aging Time
(hours)
6000
Test Temp.
(ºC)
850
Stress (MPa)
62.1
Rupture Life
(hours) stopped
or ongoing
6092
Minimum Creep
Rate (%/hr)
1.30E-04
Elong. (%)
4.2
Red. of
Area (%)
1.2
Failure Location
154
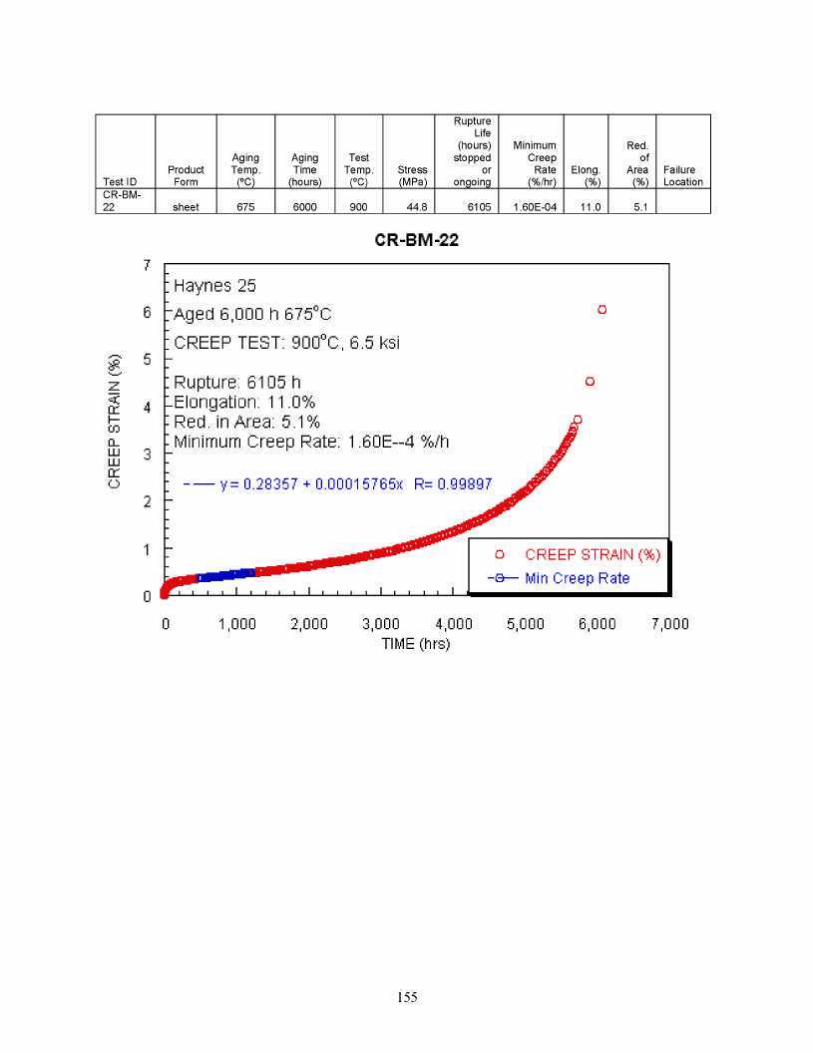
Test ID CR-BM-22
Product Form
sheet
Aging Temp.
(ºC)
675
Aging Time
(hours)
6000
Test Temp.
(ºC)
900
Stress (MPa)
44.8
Rupture Life
(hours) stopped
or ongoing
6105
Minimum Creep
Rate (%/hr)
1.60E-04
Elong. (%)
11.0
Red. of
Area (%)
5.1
Failure Location
155
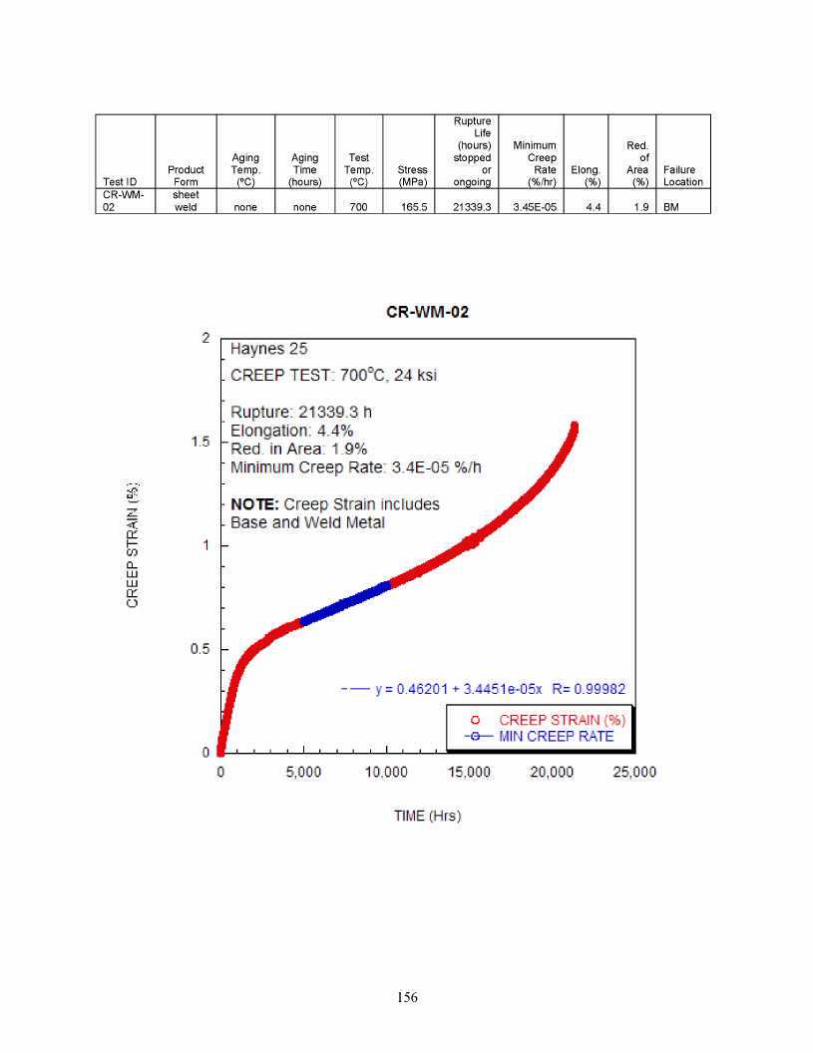
Test ID CR-WM-02
Product Form sheet weld
Aging Temp.
(ºC)
none
Aging Time
(hours)
none
Test Temp.
(ºC)
700
Stress (MPa)
165.5
Rupture Life
(hours) stopped
or ongoing
21339.3
Minimum Creep
Rate (%/hr)
3.45E-05
Elong. (%)
4.4
Red. of
Area (%)
1.9
Failure Location
BM
156
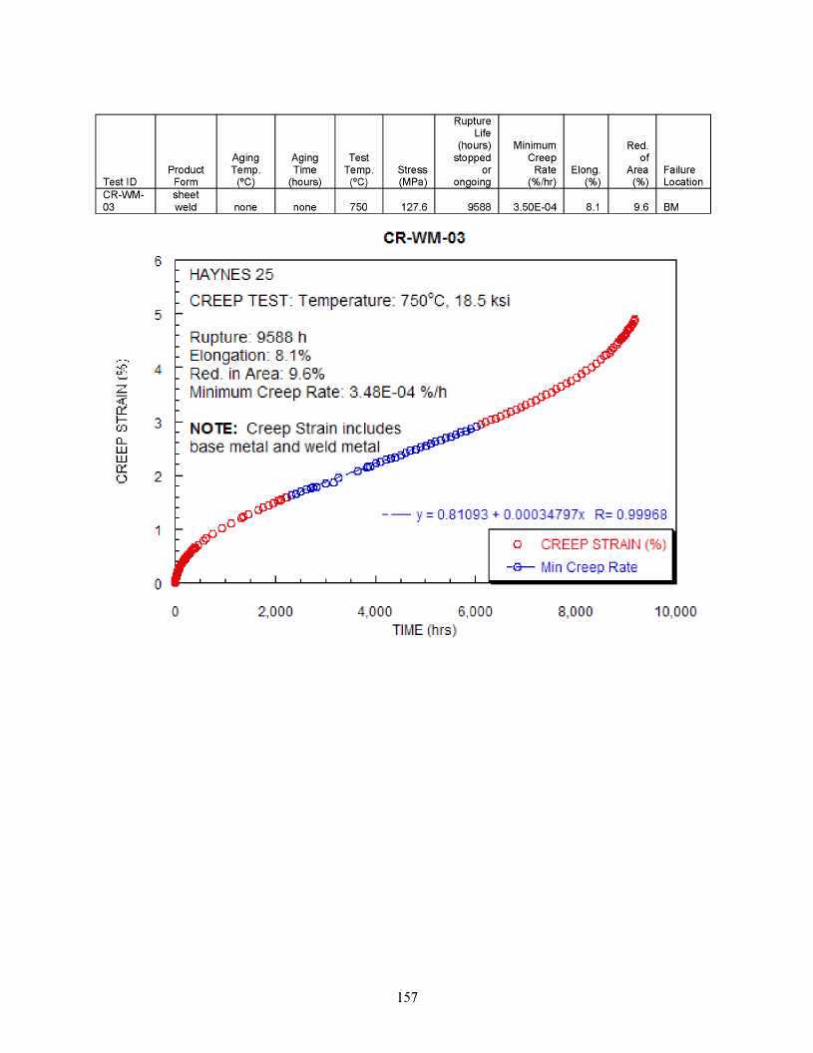
Test ID CR-WM-03
Product Form sheet weld
Aging Temp.
(ºC)
none
Aging Time
(hours)
none
Test Temp.
(ºC)
750
Stress (MPa)
127.6
Rupture Life
(hours) stopped
or ongoing
9588
Minimum Creep
Rate (%/hr)
3.50E-04
Elong. (%)
8.1
Red. of
Area (%)
9.6
Failure Location
BM
157
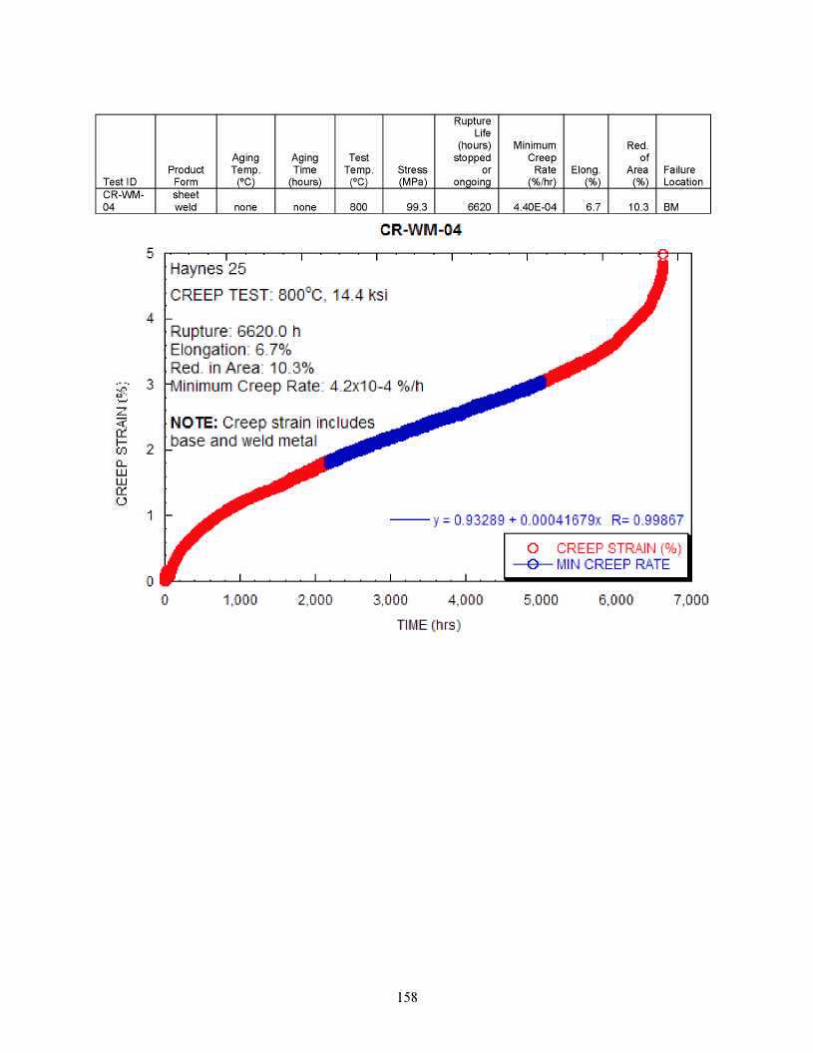
Test ID CR-WM-04
Product Form sheet weld
Aging Temp.
(ºC)
none
Aging Time
(hours)
none
Test Temp.
(ºC)
800
Stress (MPa)
99.3
Rupture Life
(hours) stopped
or ongoing
6620
Minimum Creep
Rate (%/hr)
4.40E-04
Elong. (%)
6.7
Red. of
Area (%)
10.3
Failure Location
BM
158
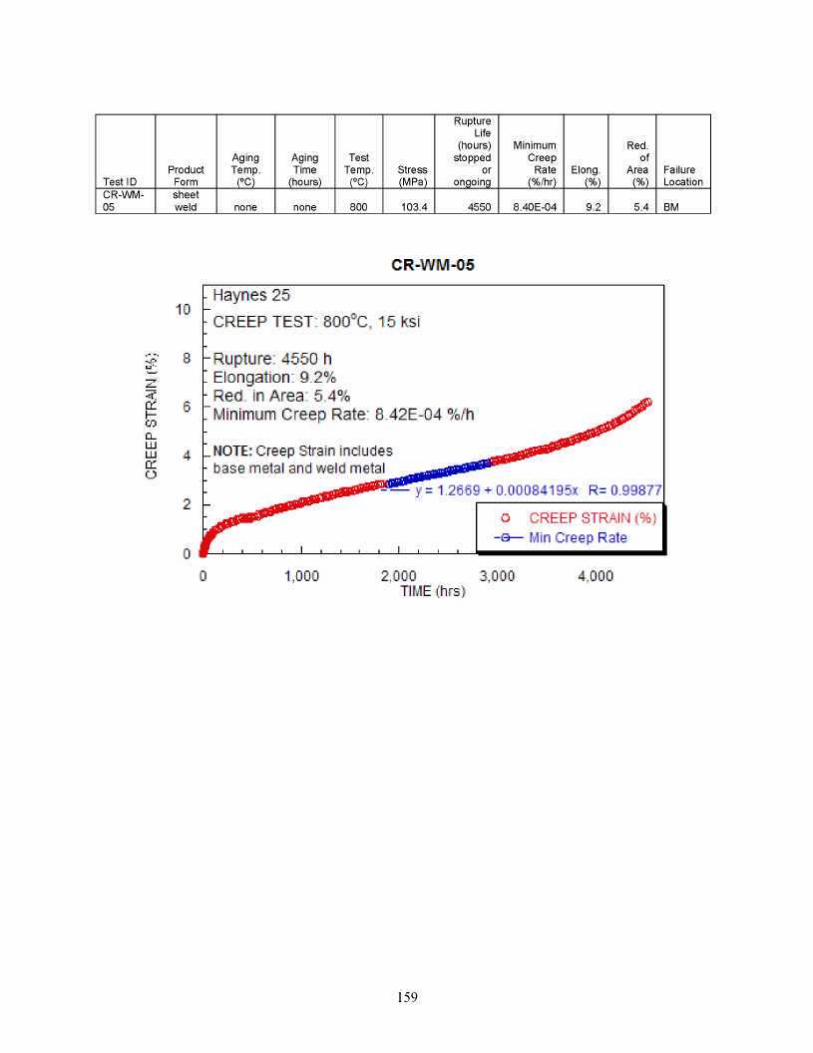
Test ID CR-WM-05
Product Form sheet weld
Aging Temp.
(ºC)
none
Aging Time
(hours)
none
Test Temp.
(ºC)
800
Stress (MPa)
103.4
Rupture Life
(hours) stopped
or ongoing
4550
Minimum Creep
Rate (%/hr)
8.40E-04
Elong. (%)
9.2
Red. of
Area (%)
5.4
Failure Location
BM
159
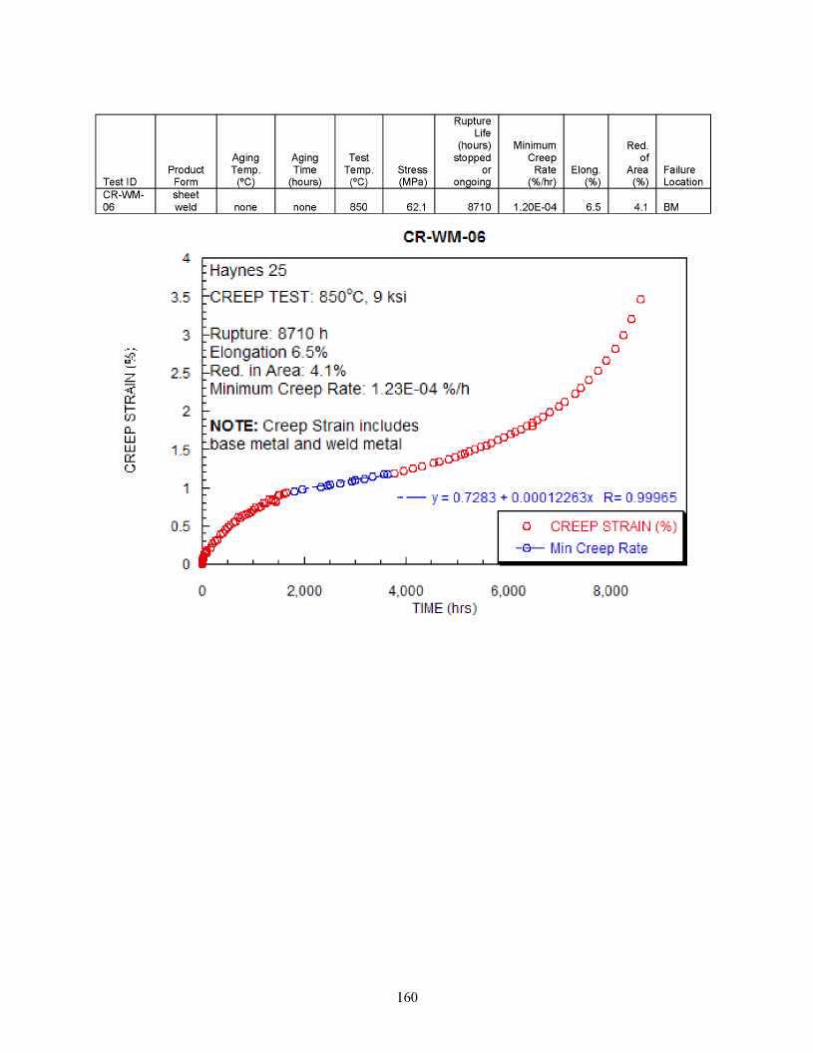
Test ID CR-WM-06
Product Form sheet weld
Aging Temp.
(ºC)
none
Aging Time
(hours)
none
Test Temp.
(ºC)
850
Stress (MPa)
62.1
Rupture Life
(hours) stopped
or ongoing
8710
Minimum Creep
Rate (%/hr)
1.20E-04
Elong. (%)
6.5
Red. of
Area (%)
4.1
Failure Location
BM
160
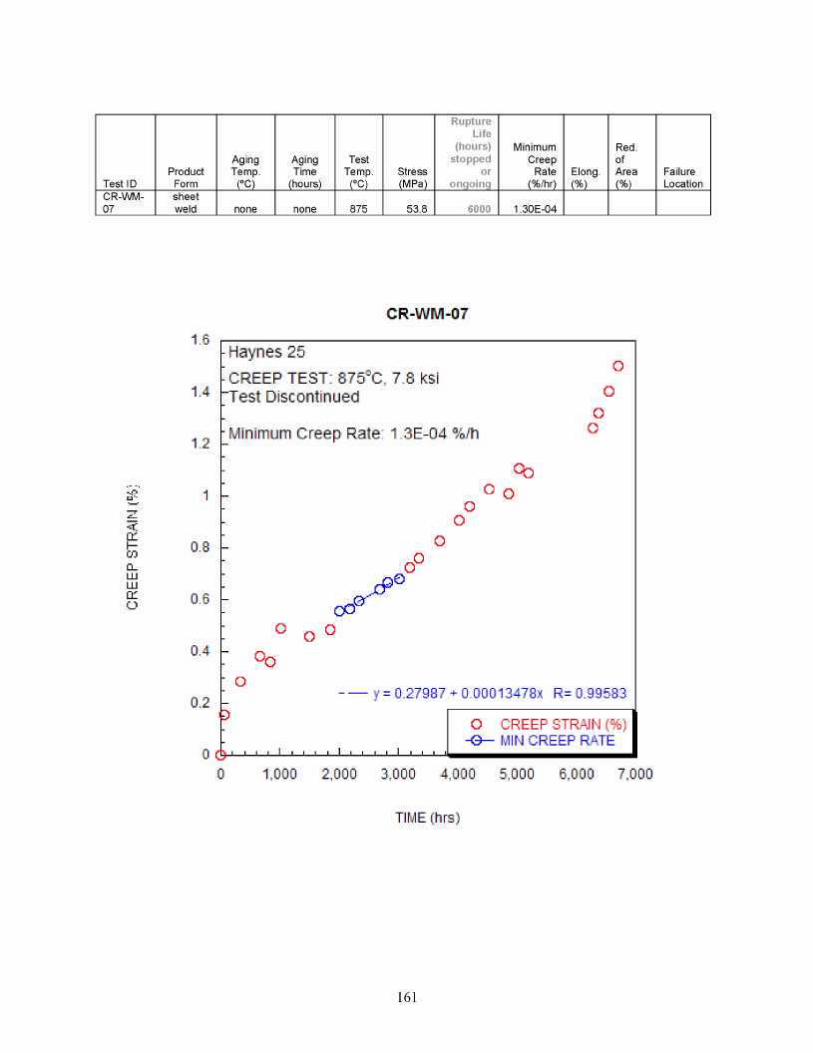
Test ID CR-WM-07
Product Form sheet weld
Aging Temp.
(ºC)
none
Aging Time
(hours)
none
Test Temp.
(ºC)
875
Stress (MPa)
53.8
Rupture Life
(hours) stopped
or ongoing
6000
Minimum Creep
Rate (%/hr)
1.30E-04
Elong. (%)
Red. of Area (%)
Failure Location
161
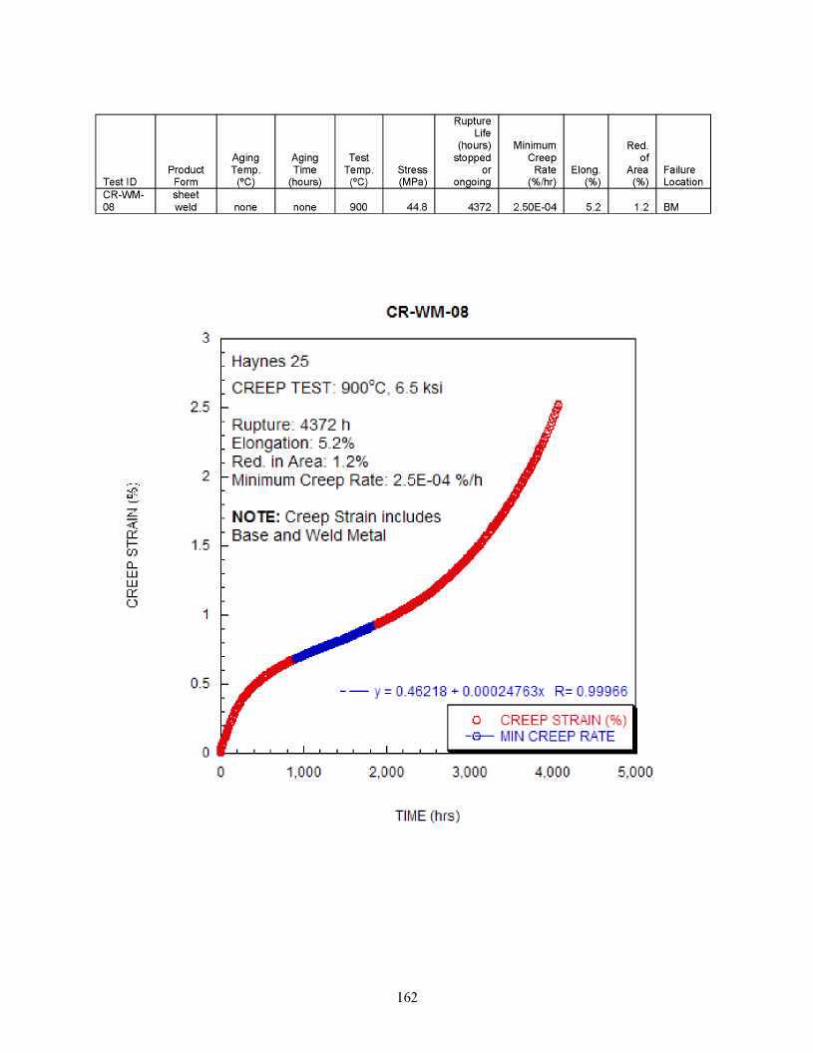
Test ID CR-WM-08
Product Form sheet weld
Aging Temp.
(ºC)
none
Aging Time
(hours)
none
Test Temp.
(ºC)
900
Stress (MPa)
44.8
Rupture Life
(hours) stopped
or ongoing
4372
Minimum Creep
Rate (%/hr)
2.50E-04
Elong. (%)
5.2
Red. of
Area (%)
1.2
Failure Location
BM
162
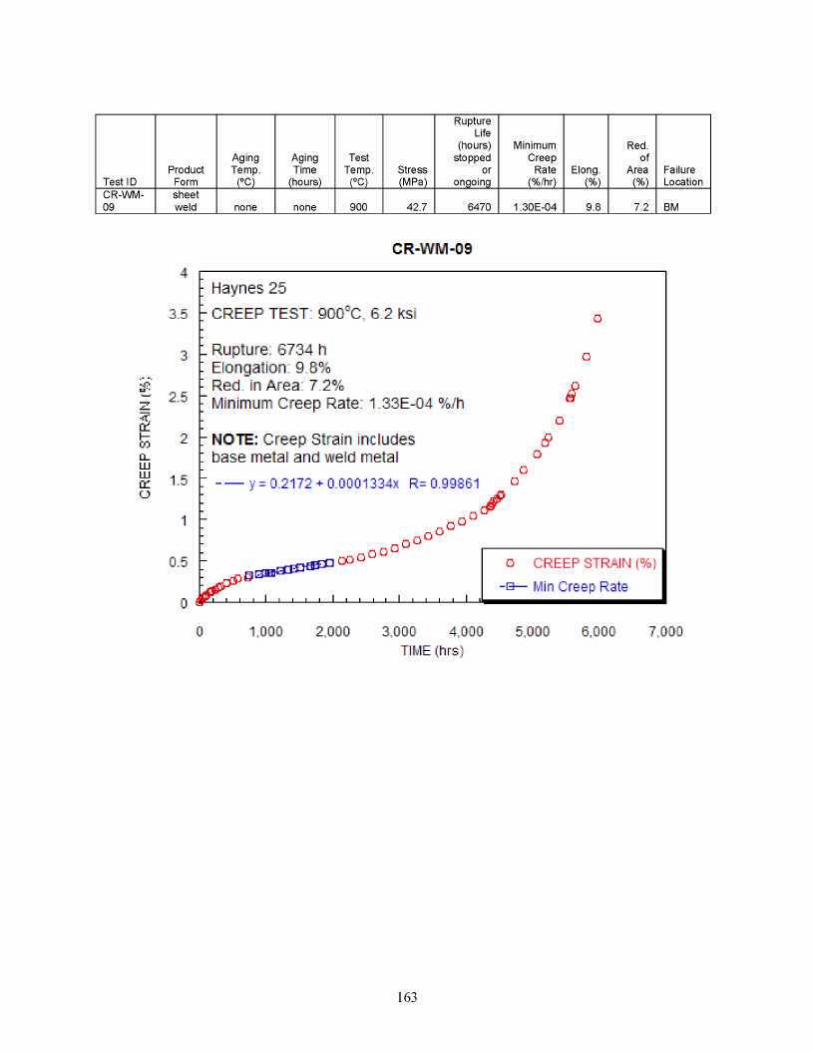
Test ID CR-WM-09
Product Form sheet weld
Aging Temp.
(ºC)
none
Aging Time
(hours)
none
Test Temp.
(ºC)
900
Stress (MPa)
42.7
Rupture Life
(hours) stopped
or ongoing
6470
Minimum Creep
Rate (%/hr)
1.30E-04
Elong. (%)
9.8
Red. of
Area (%)
7.2
Failure Location
BM
163
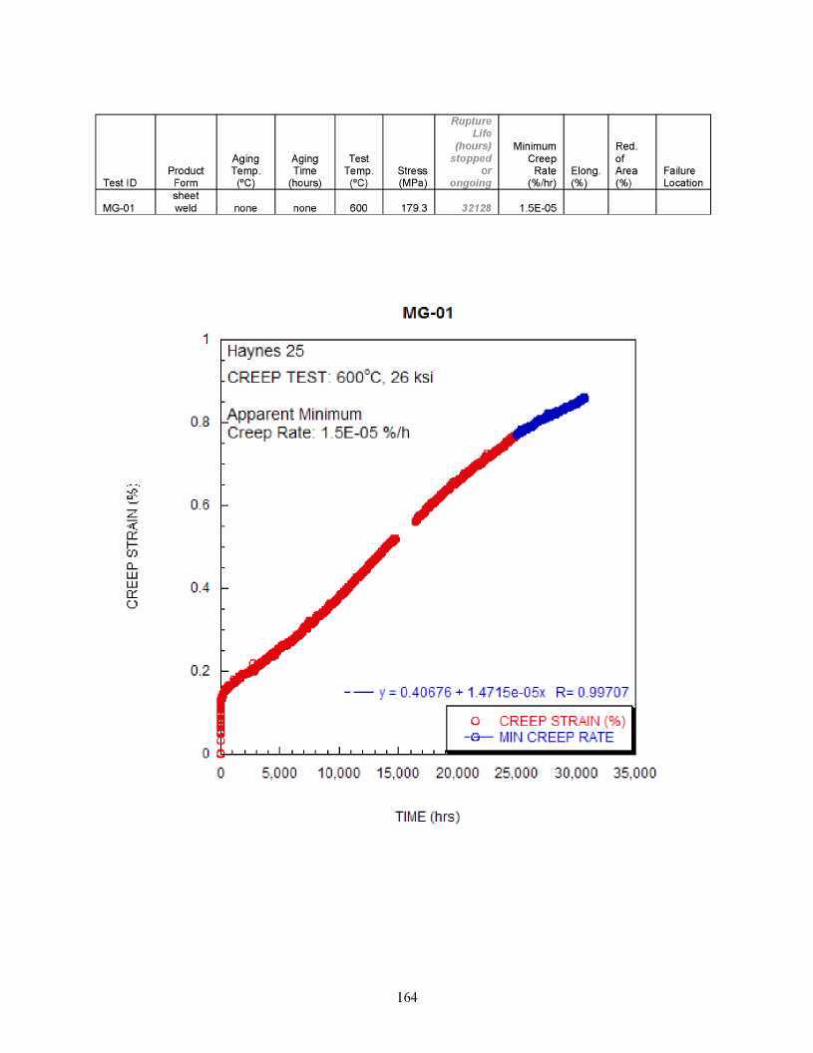
Test ID
MG-01
Product Form sheet weld
Aging Temp.
(ºC)
none
Aging Time
(hours)
none
Test Temp.
(ºC)
600
Stress (MPa)
179.3
Rupture Life
(hours) stopped
or ongoing
32128
Minimum Creep
Rate (%/hr)
1.5E-05
Elong. (%)
Red. of Area (%)
Failure Location
164
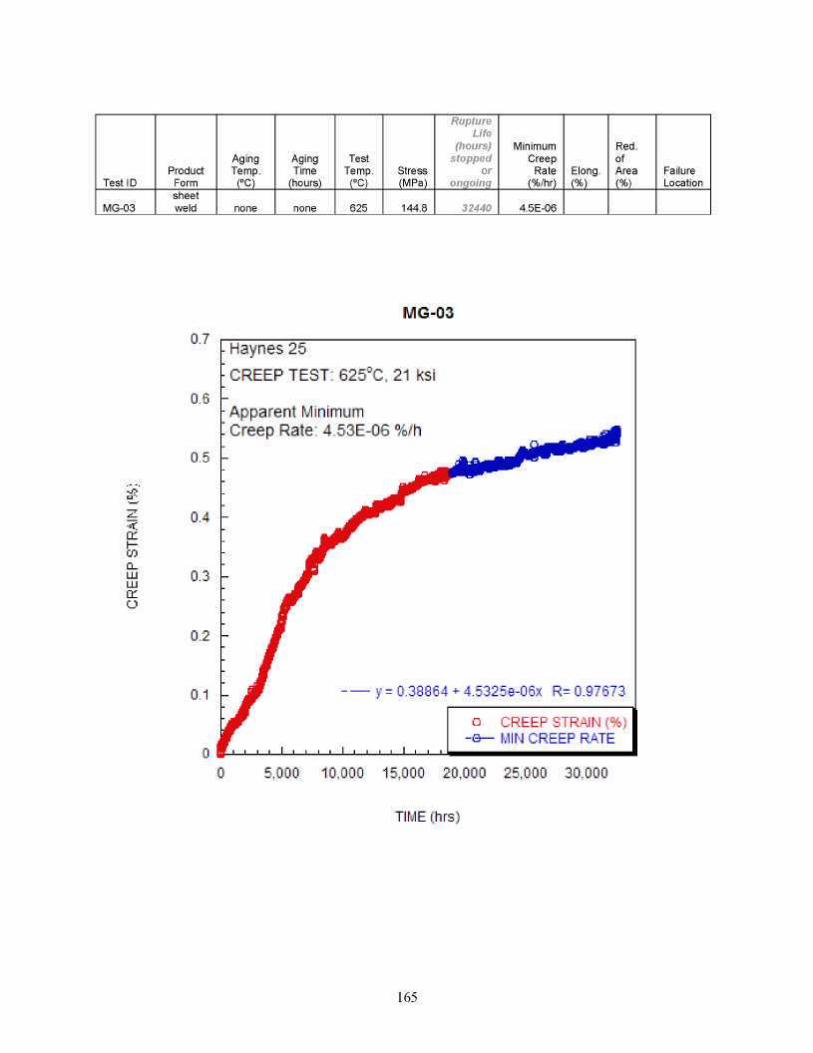
Test ID
MG-03
Product Form sheet weld
Aging Temp.
(ºC)
none
Aging Time
(hours)
none
Test Temp.
(ºC)
625
Stress (MPa)
144.8
Rupture Life
(hours) stopped
or ongoing
32440
Minimum Creep
Rate (%/hr)
4.5E-06
Elong. (%)
Red. of Area (%)
Failure Location
165
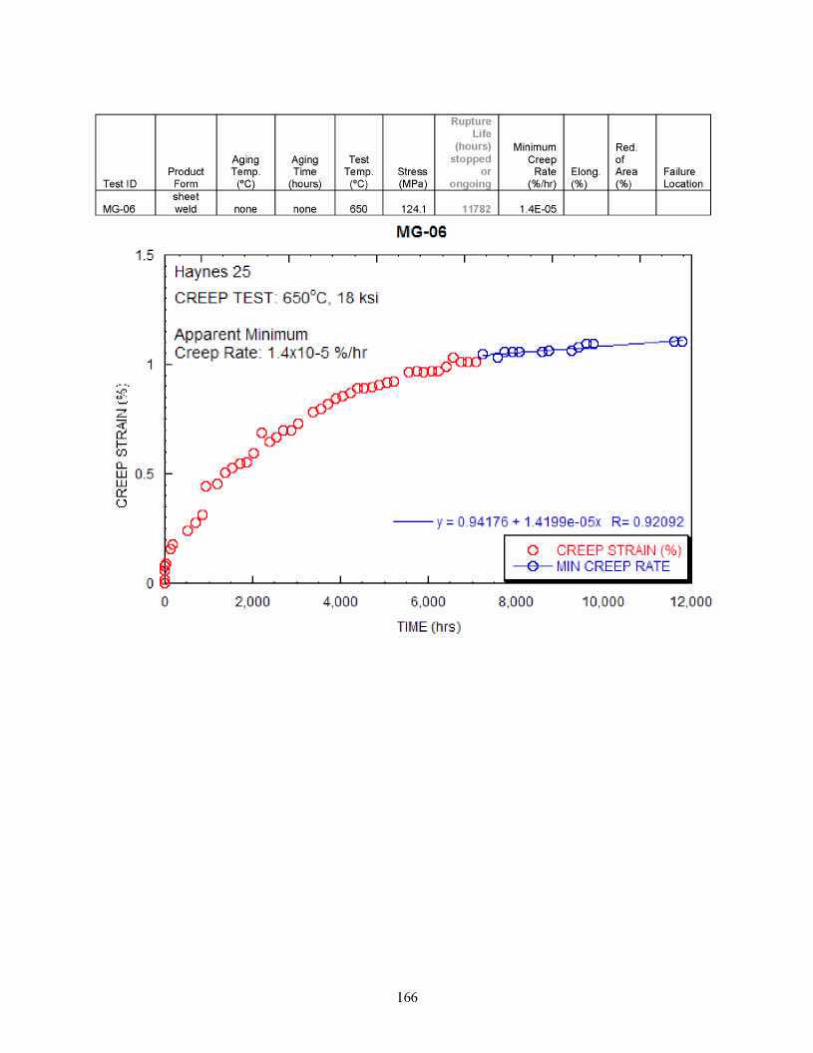
Test ID
MG-06
Product Form sheet weld
Aging Temp.
(ºC)
none
Aging Time
(hours)
none
Test Temp.
(ºC)
650
Stress (MPa)
124.1
Rupture Life
(hours) stopped
or ongoing
11782
Minimum Creep
Rate (%/hr)
1.4E-05
Elong. (%)
Red. of Area (%)
Failure Location
166
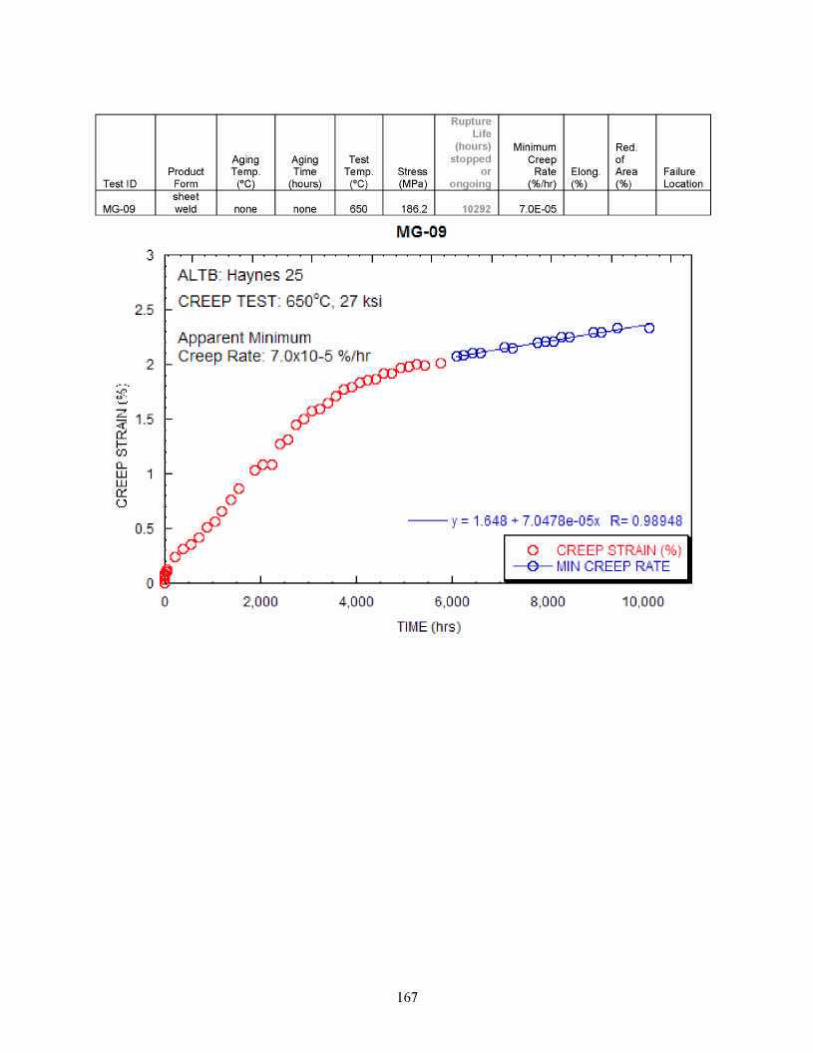
Test ID
MG-09
Product Form sheet weld
Aging Temp.
(ºC)
none
Aging Time
(hours)
none
Test Temp.
(ºC)
650
Stress (MPa)
186.2
Rupture Life
(hours) stopped
or ongoing
10292
Minimum Creep
Rate (%/hr)
7.0E-05
Elong. (%)
Red. of Area (%)
Failure Location
167
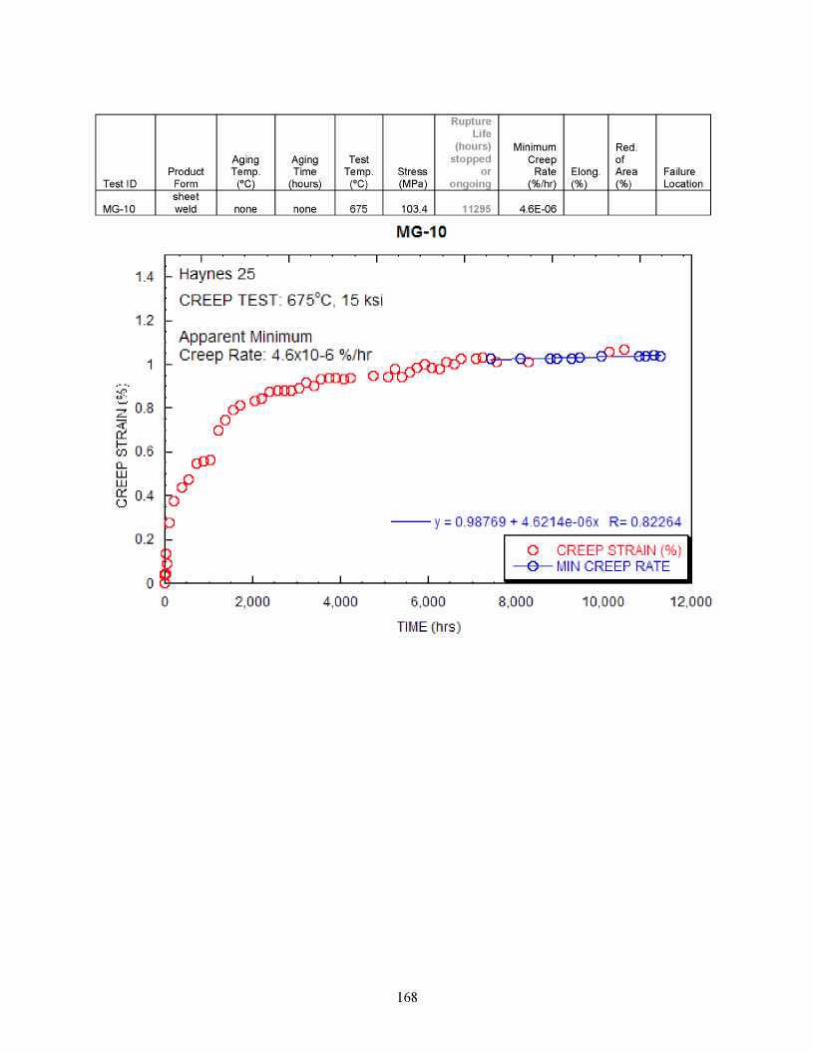
Test ID
MG-10
Product Form sheet weld
Aging Temp.
(ºC)
none
Aging Time
(hours)
none
Test Temp.
(ºC)
675
Stress (MPa)
103.4
Rupture Life
(hours) stopped
or ongoing
11295
Minimum Creep
Rate (%/hr)
4.6E-06
Elong. (%)
Red. of Area (%)
Failure Location
168
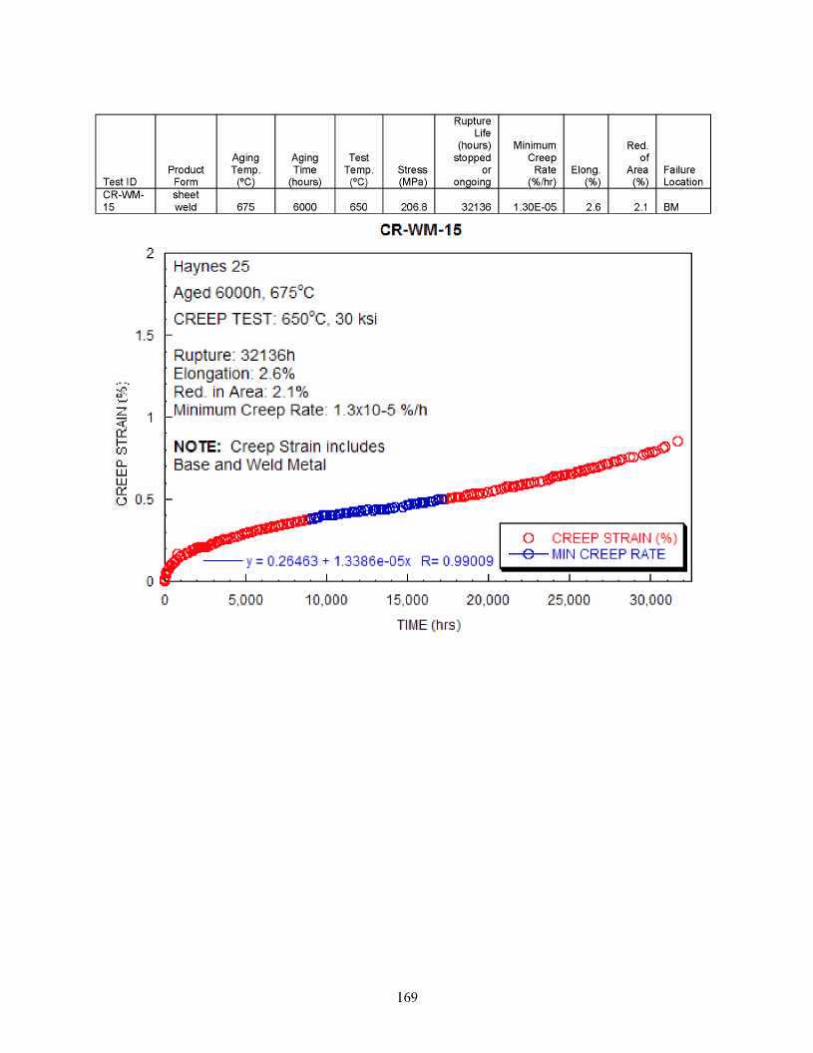
Test ID CR-WM-15
Product Form sheet weld
Aging Temp.
(ºC)
675
Aging Time
(hours)
6000
Test Temp.
(ºC)
650
Stress (MPa)
206.8
Rupture Life
(hours) stopped
or ongoing
32136
Minimum Creep
Rate (%/hr)
1.30E-05
Elong. (%)
2.6
Red. of
Area (%)
2.1
Failure Location
BM
169
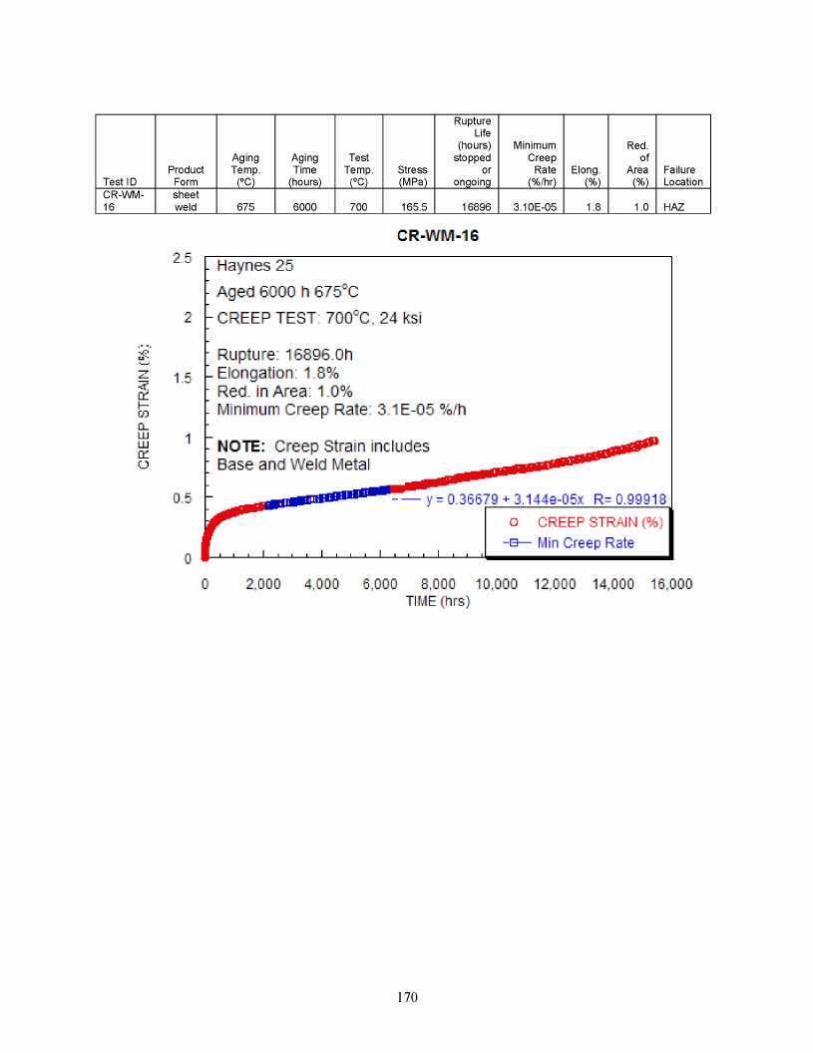
Test ID CR-WM-16
Product Form sheet weld
Aging Temp.
(ºC)
675
Aging Time
(hours)
6000
Test Temp.
(ºC)
700
Stress (MPa)
165.5
Rupture Life
(hours) stopped
or ongoing
16896
Minimum Creep
Rate (%/hr)
3.10E-05
Elong. (%)
1.8
Red. of
Area (%)
1.0
Failure Location
HAZ
170
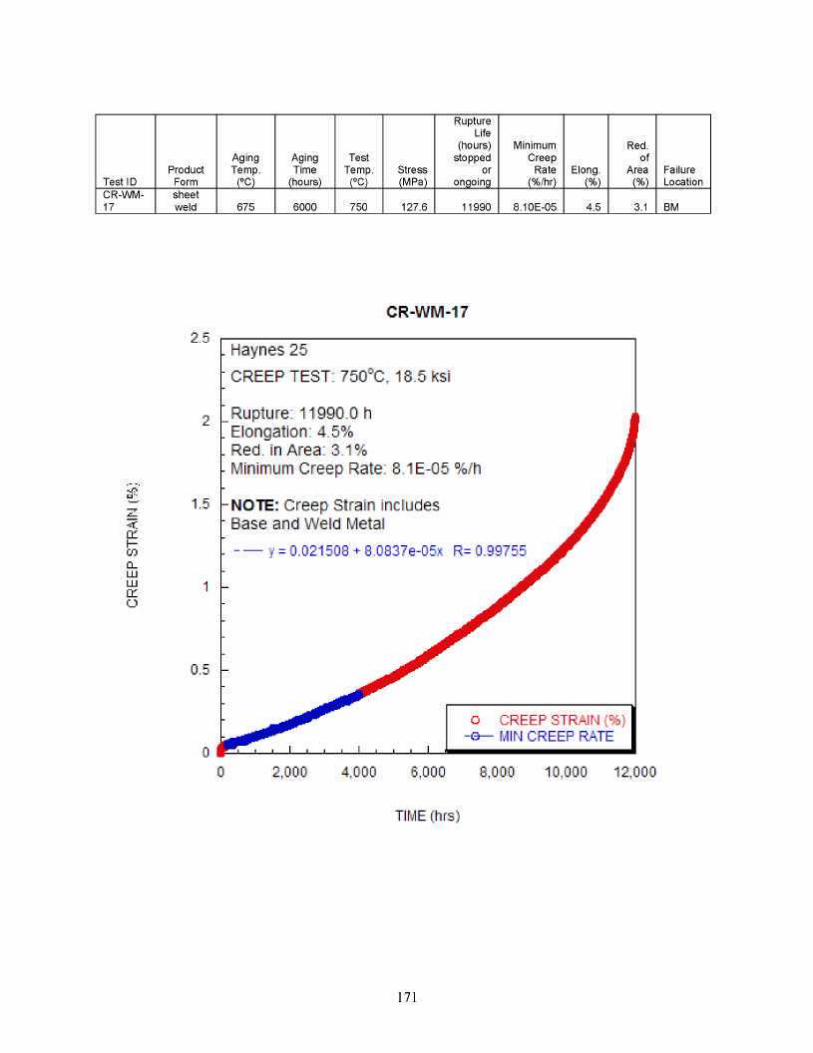
Test ID CR-WM-17
Product Form sheet weld
Aging Temp.
(ºC)
675
Aging Time
(hours)
6000
Test Temp.
(ºC)
750
Stress (MPa)
127.6
Rupture Life
(hours) stopped
or ongoing
11990
Minimum Creep
Rate (%/hr)
8.10E-05
Elong. (%)
4.5
Red. of
Area (%)
3.1
Failure Location
BM
171
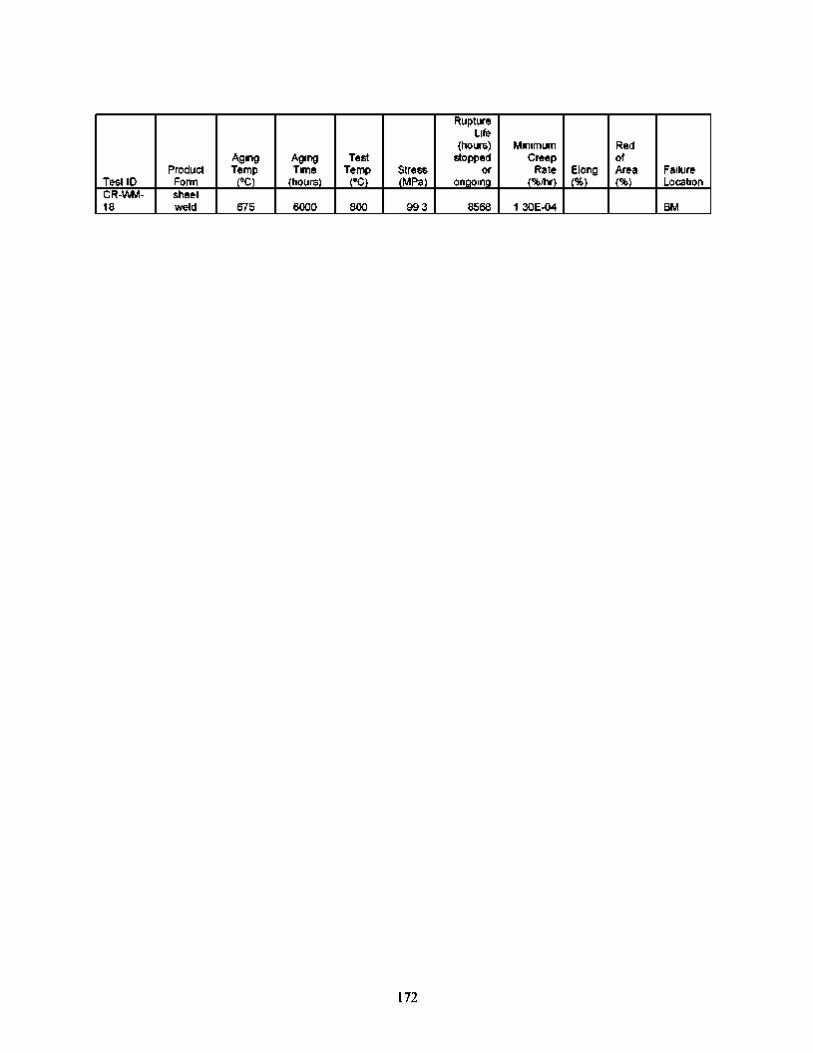
Test ID CR-WM-18
Product Form sheet weld
Aging Temp.
(ºC)
675
Aging Time
(hours)
6000
Test Temp.
(ºC)
800
Stress (MPa)
99 3
Rupture Life
(hours) stopped
or ongoing
8568
Minimum Creep
Rate (%/hr)
1 30E-04
Elong (%)
Red. of Area (%)
Failure Location
BM
172
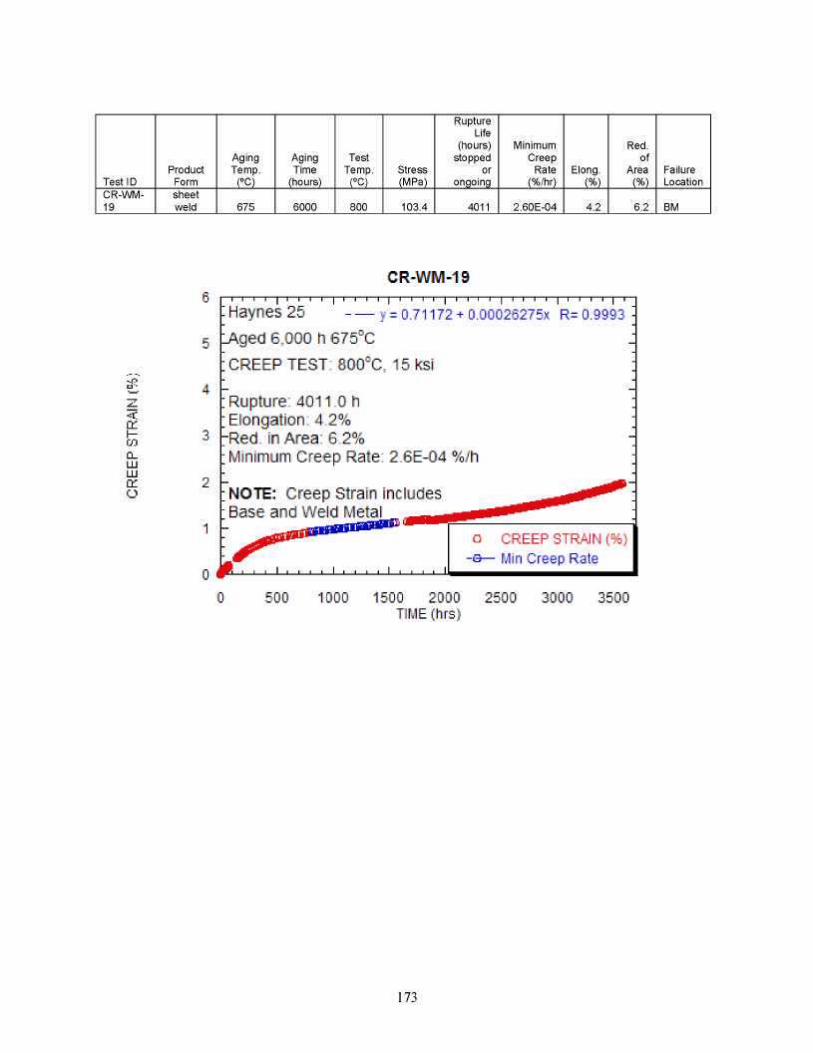
Test ID CR-WM-19
Product Form sheet weld
Aging Temp.
(ºC)
675
Aging Time
(hours)
6000
Test Temp.
(ºC)
800
Stress (MPa)
103.4
Rupture Life
(hours) stopped
or ongoing
4011
Minimum Creep
Rate (%/hr)
2.60E-04
Elong. (%)
4.2
Red. of
Area (%)
6.2
Failure Location
BM
173
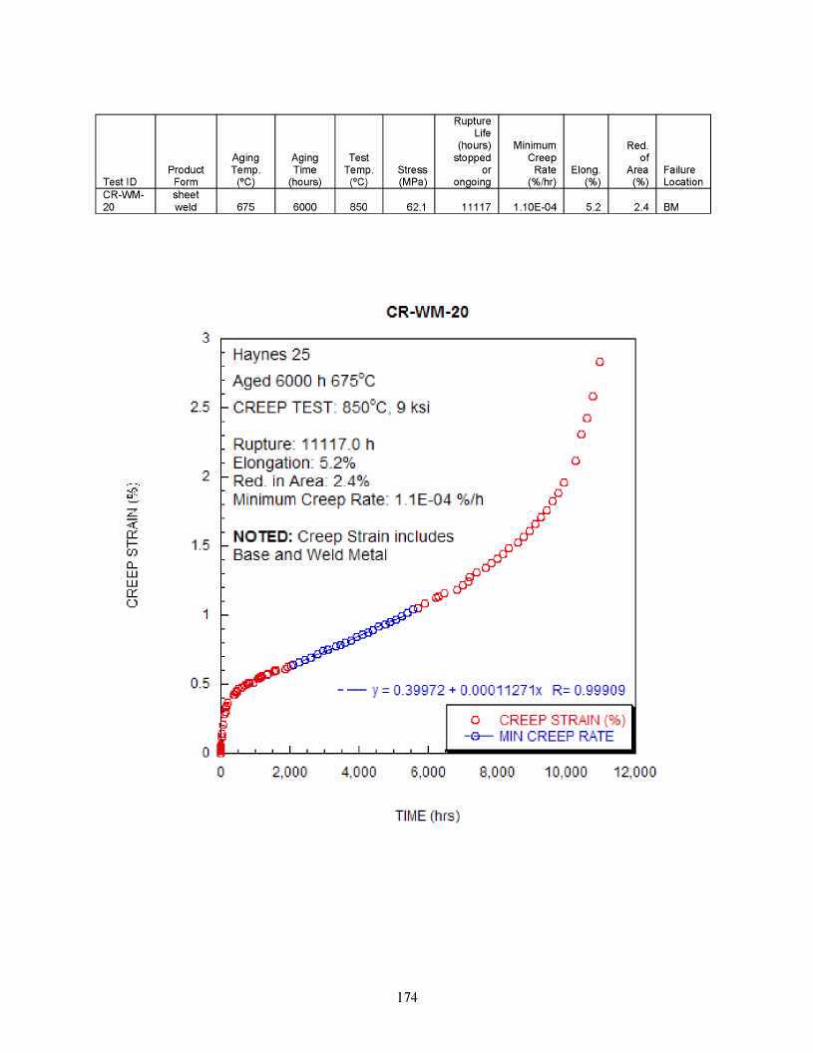
Test ID CR-WM-20
Product Form sheet weld
Aging Temp.
(ºC)
675
Aging Time
(hours)
6000
Test Temp.
(ºC)
850
Stress (MPa)
62.1
Rupture Life
(hours) stopped
or ongoing
11117
Minimum Creep
Rate (%/hr)
1.10E-04
Elong. (%)
5.2
Red. of
Area (%)
2.4
Failure Location
BM
174
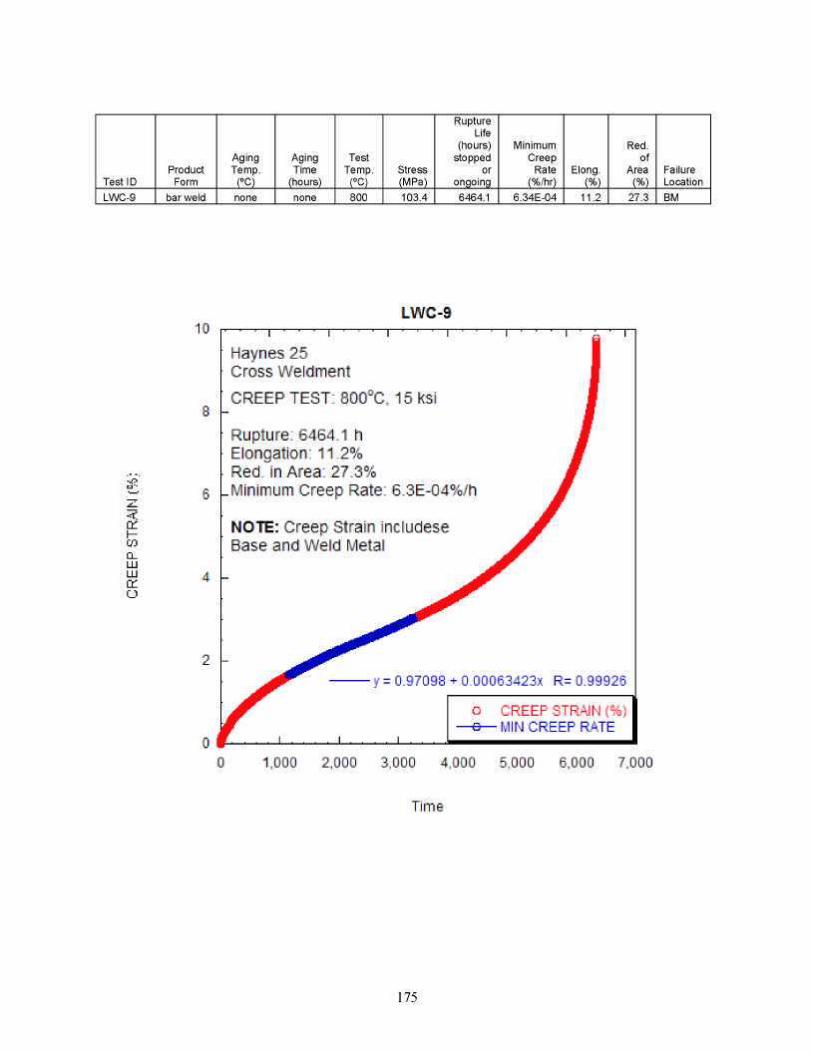
Test ID Product
Form
Aging Temp.
(ºC)
Aging Time
(hours)
Test Temp.
(ºC) Stress (MPa)
Rupture Life
(hours) stopped
or ongoing
Minimum Creep
Rate (%/hr)
Elong. (%)
Red. of
Area (%)
Failure Location
bar weld
175
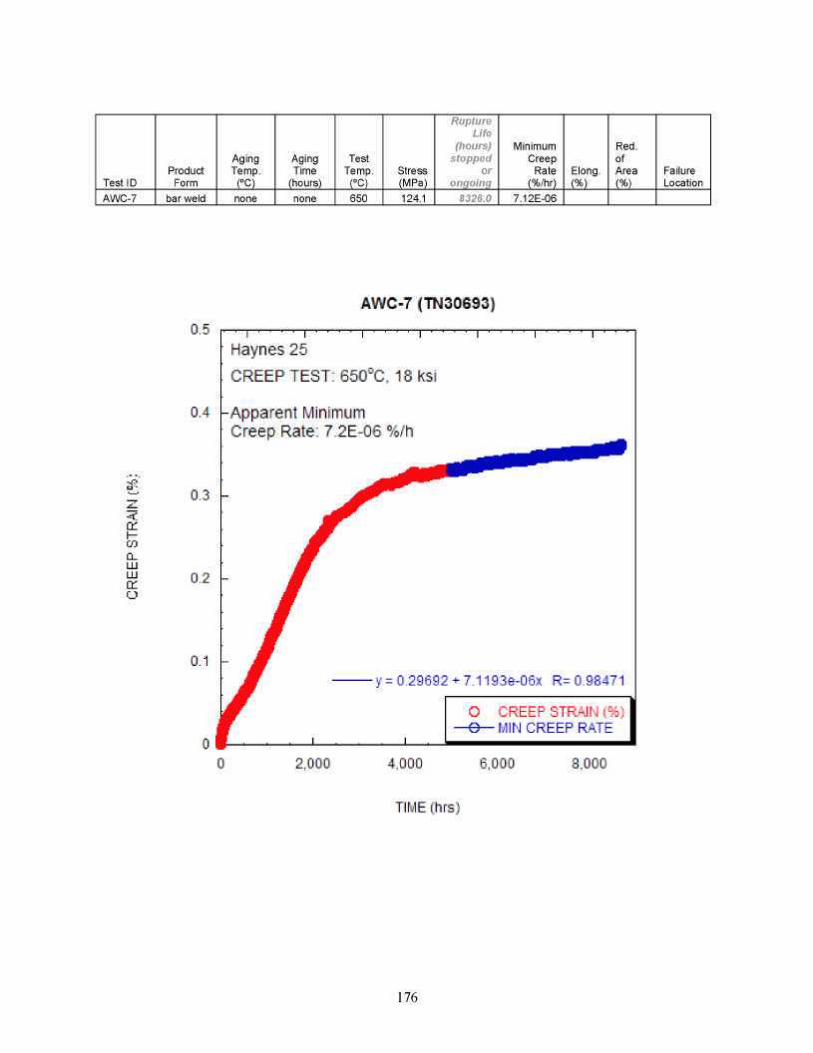
Test ID Product
Form
Aging Temp.
(ºC)
Aging Time
(hours)
Test Temp.
(ºC) Stress (MPa)
Rupture Life
(hours) stopped
or ongoing
Minimum Creep
Rate (%/hr)
Elong. (%)
Red. of Area (%)
Failure Location
bar weld
176
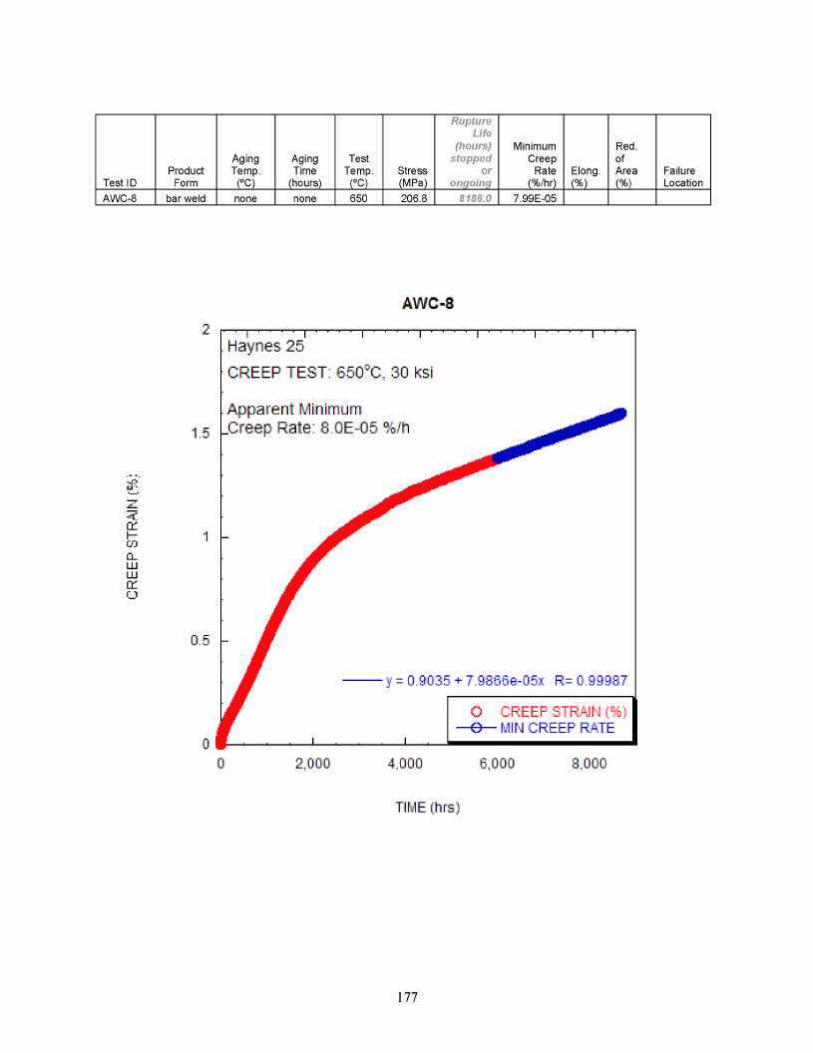
Test ID Product
Form
Aging Temp.
(ºC)
Aging Time
(hours)
Test Temp.
(ºC) Stress (MPa)
Rupture Life
(hours) stopped
or ongoing
Minimum Creep
Rate (%/hr)
Elong. (%)
Red. of Area (%)
Failure Location
bar weld
177
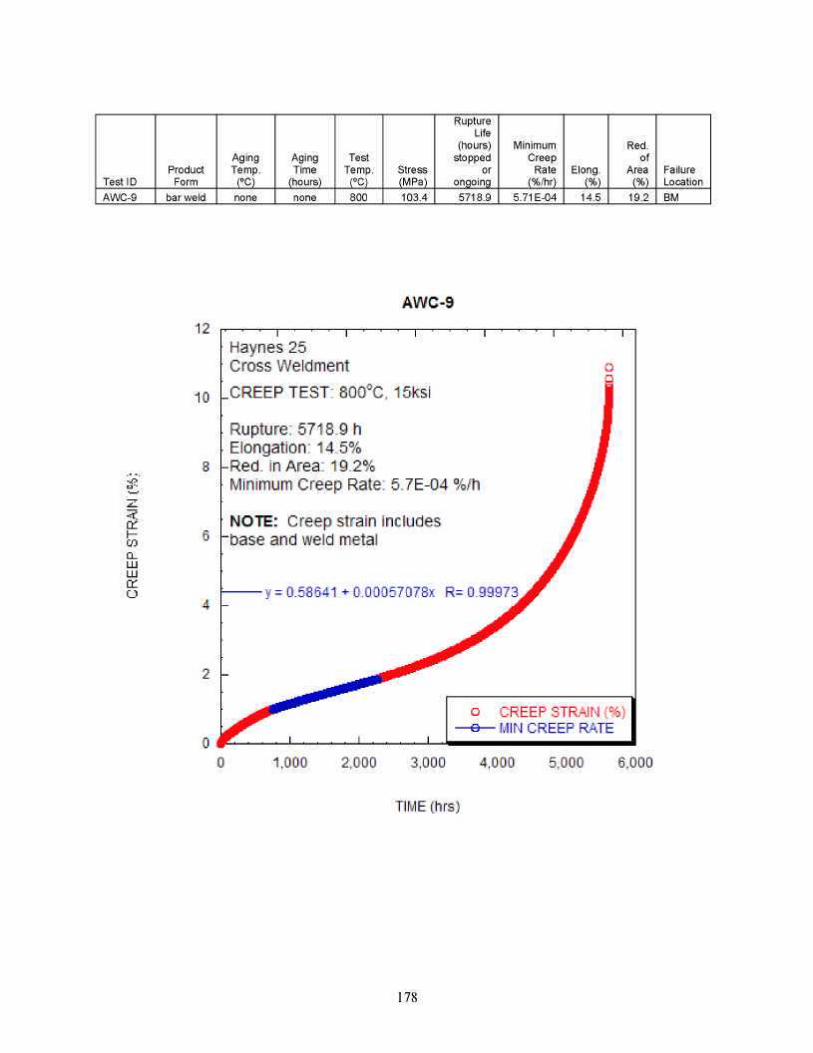
Test ID Product
Form
Aging Temp.
(ºC)
Aging Time
(hours)
Test Temp.
(ºC) Stress (MPa)
Rupture Life
(hours) stopped
or ongoing
Minimum Creep
Rate (%/hr)
Elong. (%)
Red. of
Area (%)
Failure Location
bar weld
178
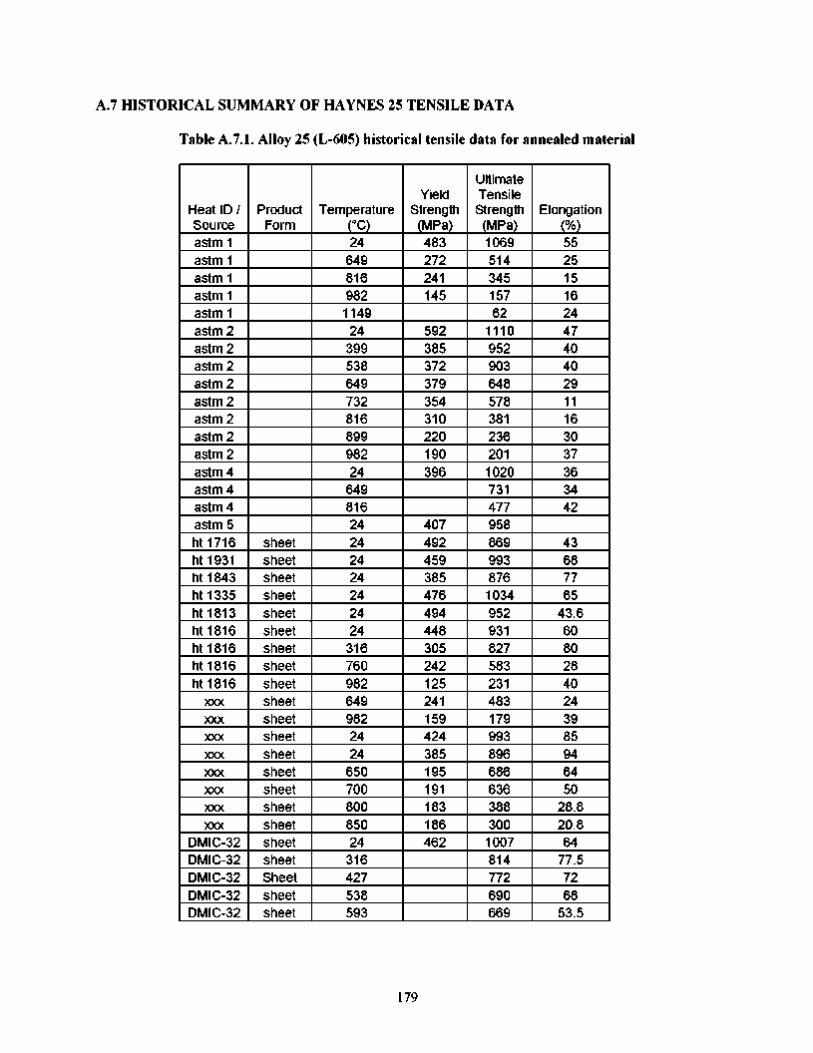
A.7 HISTORICAL SUMMARY OF HAYNES 25 TENSILE DATA
Table A.7.1. Alloy 25 (L-605) historical tensile data for annealed material
Heat ID / Source astm 1 astm 1 astm 1 astm 1 astm 1 astm 2 astm 2 astm 2 astm 2 astm 2 astm 2 astm 2 astm 2 astm 4 astm 4 astm 4 astm 5 ht 1716 ht 1931 ht 1843 ht 1335 ht 1813 ht 1816 ht 1816 ht 1816 ht 1816
xxx xxx xxx xxx xxx xxx xxx xxx
DMIC-32 DMIC-32 DMIC-32 DMIC-32 DMIC-32
Product Form
sheet sheet sheet sheet sheet sheet sheet sheet sheet sheet sheet sheet sheet sheet sheet sheet sheet sheet sheet Sheet sheet sheet
Temperature (°C) 24
649 816 982 1149 24 399 538 649 732 816 899 982 24
649 816 24 24 24 24 24 24 24 316 760 982 649 982 24 24
650 700 800 850 24 316 427 538 593
Yield Strength (MPa)
483 272 241 145
592 385 372 379 354 310 220 190 396
407 492 459 385 476 494 448 305 242 125 241 159 424 385 195 191 183 186 462
Ultimate Tensile Strength (MPa) 1069 514 345 157 62
1110 952 903 648 578 381 236 201 1020 731 477 958 869 993 876 1034 952 931 827 583 231 483 179 993 896 686 636 388 300 1007 814 772 690 669
Elongation (%) 55 25 15 16 24 47 40 40 29 11 16 30 37 36 34 42
43 68 77 65
43.6 60 80 28 40 24 39 85 94 64 50
28.8 20.8 64
77.5 72 68
53.5
179
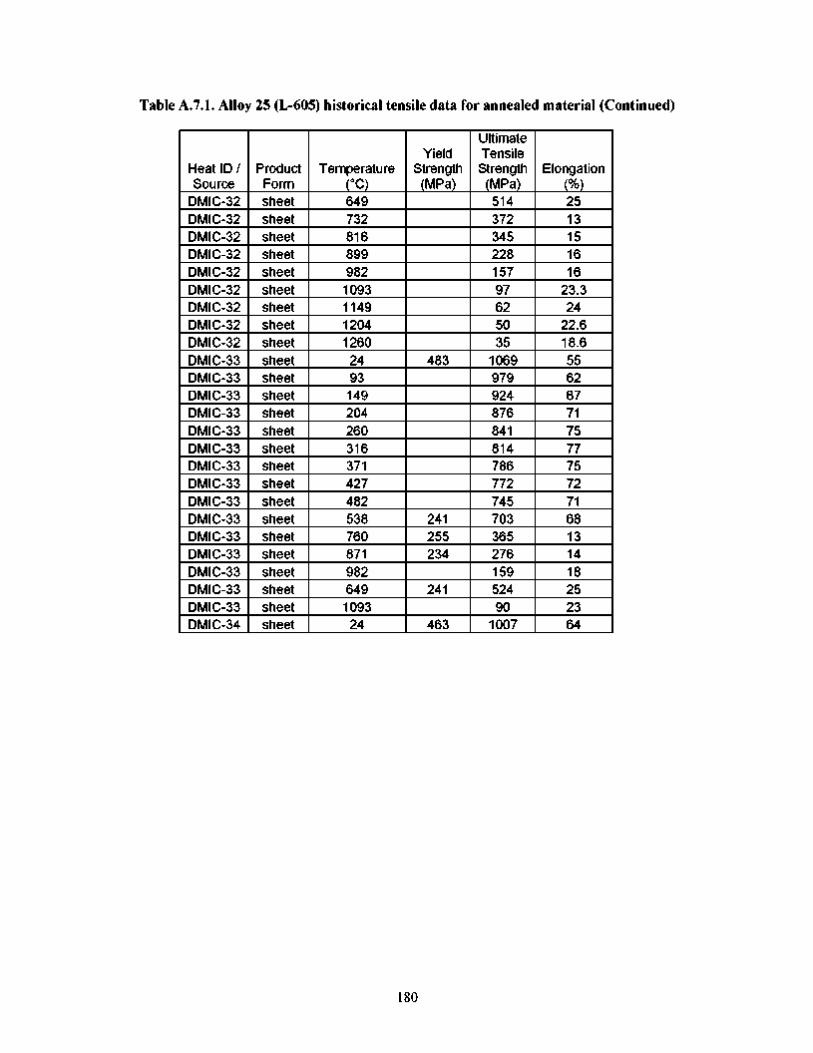
Table A.7.1. Alloy 25 (L-605) historical tensile data for annealed material (Continued)
Heat ID / Source
DMIC-32 DMIC-32 DMIC-32 DMIC-32 DMIC-32 DMIC-32 DMIC-32 DMIC-32 DMIC-32 DMIC-33 DMIC-33 DMIC-33 DMIC-33 DMIC-33 DMIC-33 DMIC-33 DMIC-33 DMIC-33 DMIC-33 DMIC-33 DMIC-33 DMIC-33 DMIC-33 DMIC-33 DMIC-34
Product Form sheet sheet sheet sheet sheet sheet sheet sheet sheet sheet sheet sheet sheet sheet sheet sheet sheet sheet sheet sheet sheet sheet sheet sheet sheet
Temperature (°C) 649 732 816 899 982 1093 1149 1204 1260 24 93 149 204 260 316 371 427 482 538 760 871 982 649 1093 24
Yield Strength (MPa)
483
241 255 234
241
463
Ultimate Tensile Strength (MPa)
514 372 345 228 157 97 62 50 35
1069 979 924 876 841 814 786 772 745 703 365 276 159 524 90
1007
Elongation (%) 25 13 15 16 16
23.3 24
22.6 18.6 55 62 67 71 75 77 75 72 71 68 13 14 18 25 23 64
180
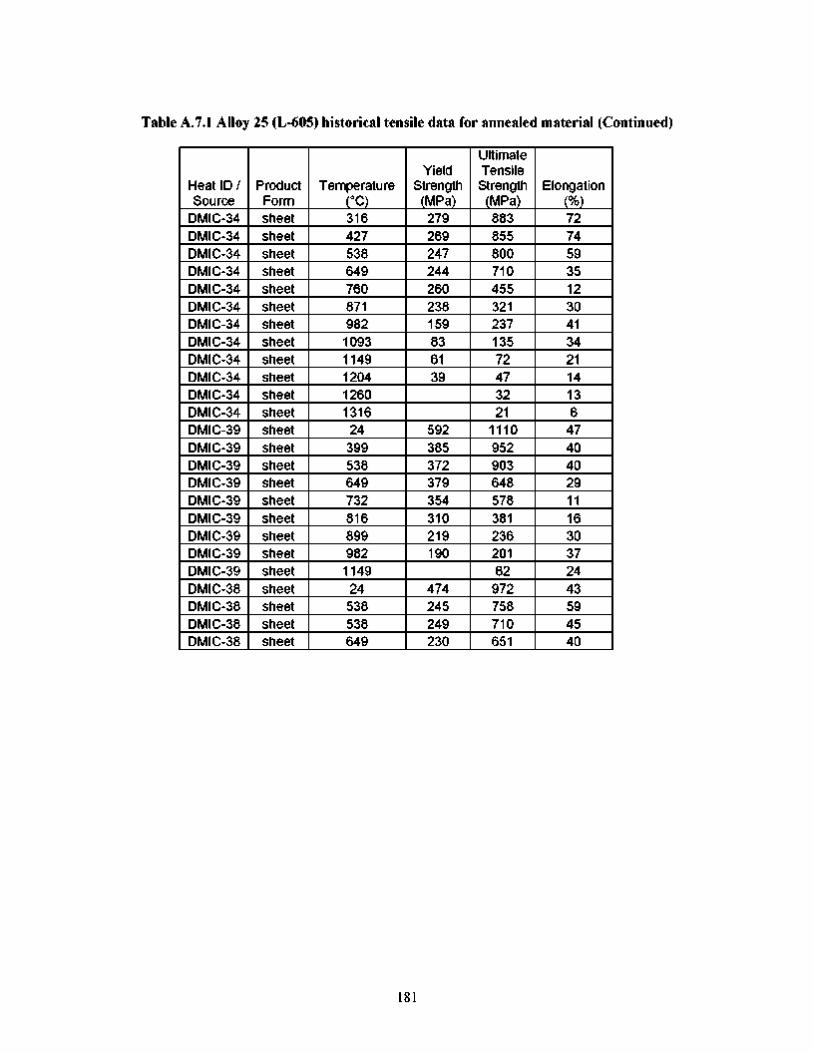
Table A.7.1 Alloy 25 (L-605) historical tensile data for annealed material (Continued)
Heat ID / Source
DMIC-34 DMIC-34 DMIC-34 DMIC-34 DMIC-34 DMIC-34 DMIC-34 DMIC-34 DMIC-34 DMIC-34 DMIC-34 DMIC-34 DMIC-39 DMIC-39 DMIC-39 DMIC-39 DMIC-39 DMIC-39 DMIC-39 DMIC-39 DMIC-39 DMIC-38 DMIC-38 DMIC-38 DMIC-38
Product Form sheet sheet sheet sheet sheet sheet sheet sheet sheet sheet sheet sheet sheet sheet sheet sheet sheet sheet sheet sheet sheet sheet sheet sheet sheet
Temperature (°C) 316 427 538 649 760 871 982 1093 1149 1204 1260 1316 24 399 538 649 732 816 899 982 1149 24 538 538 649
Yield Strength (MPa)
279 269 247 244 260 238 159 83 61 39
592 385 372 379 354 310 219 190
474 245 249 230
Ultimate Tensile Strength (MPa)
883 855 800 710 455 321 237 135 72 47 32 21
1110 952 903 648 578 381 236 201 62 972 758 710 651
Elongation (%) 72 74 59 35 12 30 41 34 21 14 13 6
47 40 40 29 11 16 30 37 24 43 59 45 40
181
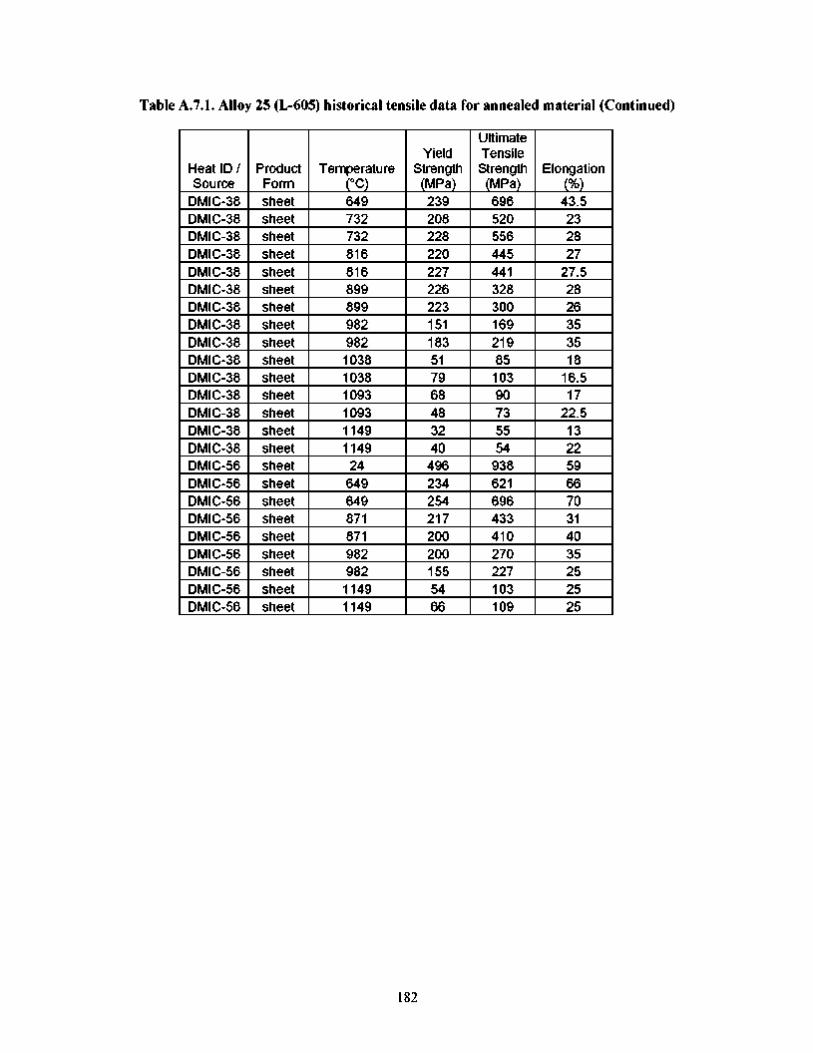
Table A.7.1. Alloy 25 (L-605) historical tensile data for annealed material (Continued)
Heat ID / Source
DMIC-38 DMIC-38 DMIC-38 DMIC-38 DMIC-38 DMIC-38 DMIC-38 DMIC-38 DMIC-38 DMIC-38 DMIC-38 DMIC-38 DMIC-38 DMIC-38 DMIC-38 DMIC-56 DMIC-56 DMIC-56 DMIC-56 DMIC-56 DMIC-56 DMIC-56 DMIC-56 DMIC-56
Product Form sheet sheet sheet sheet sheet sheet sheet sheet sheet sheet sheet sheet sheet sheet sheet sheet sheet sheet sheet sheet sheet sheet sheet sheet
Temperature (°C) 649 732 732 816 816 899 899 982 982 1038 1038 1093 1093 1149 1149 24 649 649 871 871 982 982 1149 1149
Yield Strength (MPa)
239 208 228 220 227 226 223 151 183 51 79 68 48 32 40 496 234 254 217 200 200 155 54 66
Ultimate Tensile Strength (MPa) 696 520 556 445 441 328 300 169 219 85 103 90 73 55 54
938 621 696 433 410 270 227 103 109
Elongation (%) 43.5 23 28 27
27.5 28 26 35 35 18
16.5 17
22.5 13 22 59 66 70 31 40 35 25 25 25
182
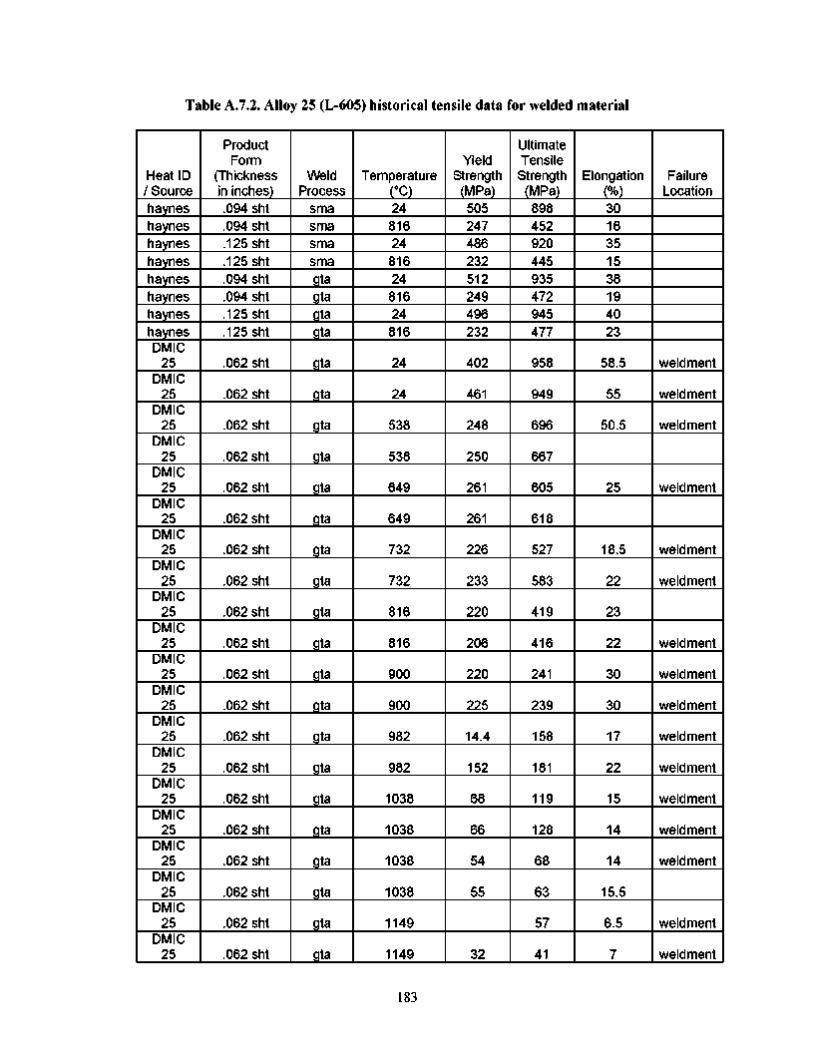
Table A.7.2. Alloy 25 (L-605) historical tensile data for welded material
Heat ID / Source haynes haynes haynes haynes haynes haynes haynes haynes DMIC
25 DMIC
25 DMIC
25 DMIC
25 DMIC
25 DMIC
25 DMIC
25 DMIC
25 DMIC
25 DMIC
25 DMIC
25 DMIC
25 DMIC
25 DMIC
25 DMIC
25 DMIC
25 DMIC
25 DMIC
25 DMIC
25 DMIC
25
Product Form
(Thickness in inches) .094 sht .094 sht .125 sht .125 sht .094 sht .094 sht .125 sht .125 sht
.062 sht
.062 sht
.062 sht
.062 sht
.062 sht
.062 sht
.062 sht
.062 sht
.062 sht
.062 sht
.062 sht
.062 sht
.062 sht
.062 sht
.062 sht
.062 sht
.062 sht
.062 sht
.062 sht
.062 sht
Weld Process
sma sma sma sma gta gta gta gta
gta
gta
gta
gta
gta
gta
gta
gta
gta
gta
gta
gta
gta
gta
gta
gta
gta
gta
gta
gta
Temperature (°C) 24 816 24 816 24 816 24 816
24
24
538
538
649
649
732
732
816
816
900
900
982
982
1038
1038
1038
1038
1149
1149
Yield Strength (MPa)
505 247 486 232 512 249 496 232
402
461
248
250
261
261
226
233
220
206
220
225
14.4
152
68
66
54
55
32
Ultimate Tensile
Strength (MPa)
898 452 920 445 935 472 945 477
958
949
696
667
605
618
527
583
419
416
241
239
158
181
119
128
68
63
57
41
Elongation (%) 30 16 35 15 38 19 40 23
58.5
55
50.5
25
18.5
22
23
22
30
30
17
22
15
14
14
15.5
6.5
7
Failure Location
weldment
weldment
weldment
weldment
weldment
weldment
weldment
weldment
weldment
weldment
weldment
weldment
weldment
weldment
weldment
weldment
183
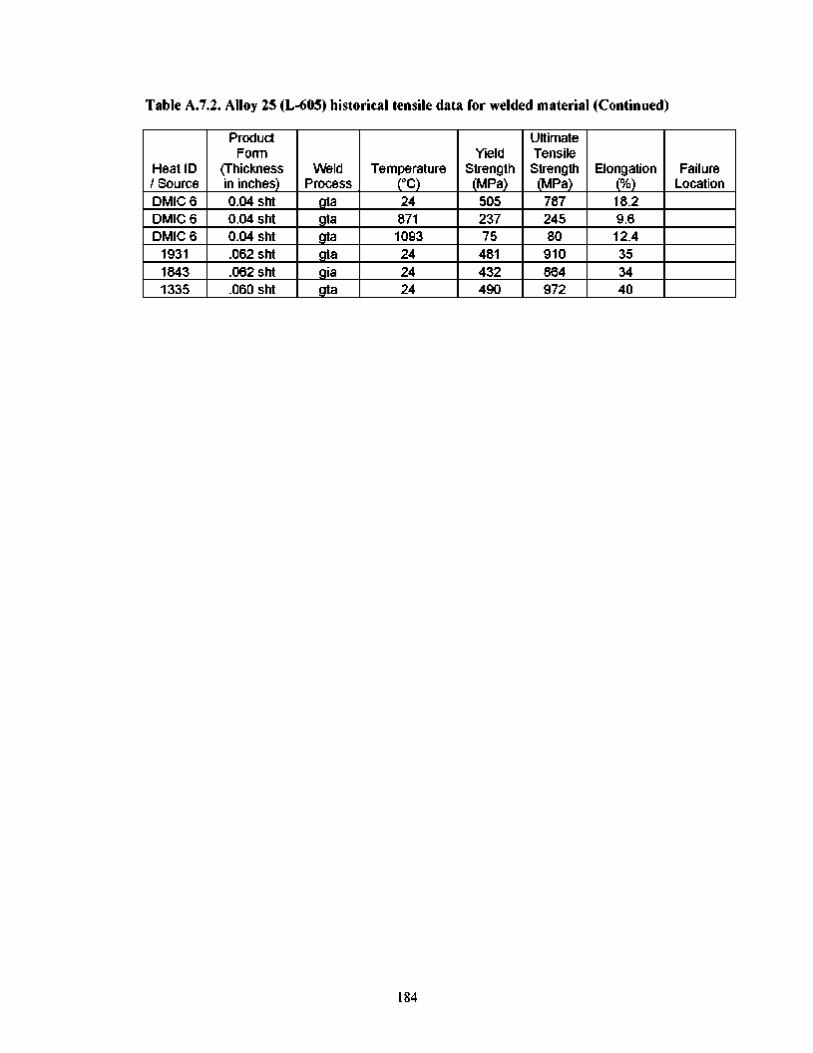
Table A.7.2. Alloy 25 (L-605) historical tensile data for welded material (Continued)
Heat ID / Source DMIC 6 DMIC 6 DMIC 6
1931 1843 1335
Product Form
(Thickness in inches) 0.04 sht 0.04 sht 0.04 sht .062 sht .062 sht .060 sht
Weld Process
gta gta gta gta gia gta
Temperature (°C) 24 871 1093 24 24 24
Yield Strength (MPa)
505 237 75
481 432 490
Ultimate Tensile
Strength (MPa)
787 245 80 910 864 972
Elongation (%) 18.2 9.6 12.4 35 34 40
Failure Location
184
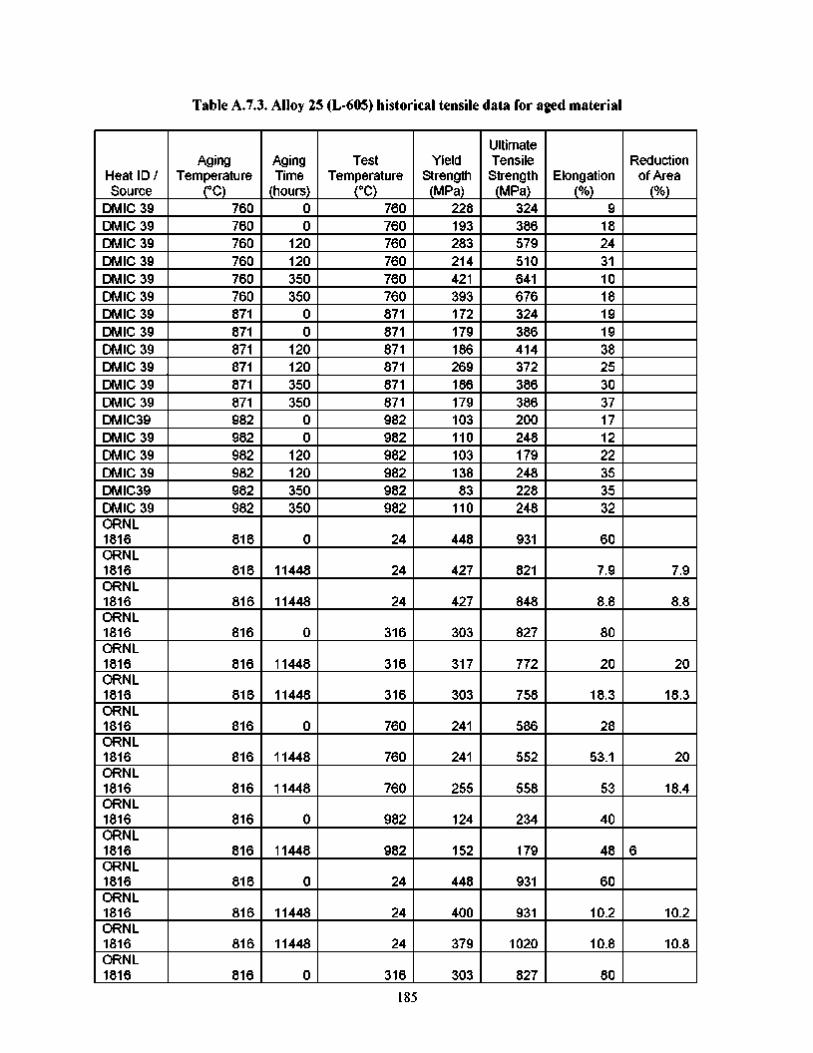
Table A.7.3. Alloy 25 (L-605) historical tensile data for aged material
Heat ID / Source
DMIC 39 DMIC 39 DMIC 39 DMIC 39 DMIC 39 DMIC 39 DMIC 39 DMIC 39 DMIC 39 DMIC 39 DMIC 39 DMIC 39 DMIC39 DMIC 39 DMIC 39 DMIC 39 DMIC39 DMIC 39 ORNL 1816 ORNL 1816 ORNL 1816 ORNL 1816 ORNL 1816 ORNL 1816 ORNL 1816 ORNL 1816 ORNL 1816 ORNL 1816 ORNL 1816 ORNL 1816 ORNL 1816 ORNL 1816 ORNL 1816
Aging Temperature
(°C) 760 760 760 760 760 760 871 871 871 871 871 871 982 982 982 982 982 982
816
816
816
816
816
816
816
816
816
816
816
816
816
816
816
Aging Time
(hours) 0 0
120 120 350 350
0 0
120 120 350 350
0 0
120 120 350 350
0
11448
11448
0
11448
11448
0
11448
11448
0
11448
0
11448
11448
0
Test Temperature
(°C) 760 760 760 760 760 760 871 871 871 871 871 871 982 982 982 982 982 982
24
24
24
316
316
316
760
760
760
982
982
24
24
24
316
Yield Strength (MPa)
228 193 283 214 421 393 172 179 186 269 186 179 103 110 103 138 83
110
448
427
427
303
317
303
241
241
255
124
152
448
400
379
303
Ultimate Tensile
Strength (MPa)
324 386 579 510 641 676 324 386 414 372 386 386 200 248 179 248 228 248
931
821
848
827
772
758
586
552
558
234
179
931
931
1020
827
Elongation (%)
9 18 24 31 10 18 19 19 38 25 30 37 17 12 22 35 35 32
60
7.9
8.8
80
20
18.3
28
53.1
53
40
48
60
10.2
10.8
80
Reduction of Area
(%)
7.9
8.8
20
18.3
20
18.4
6
10.2
10.8
185
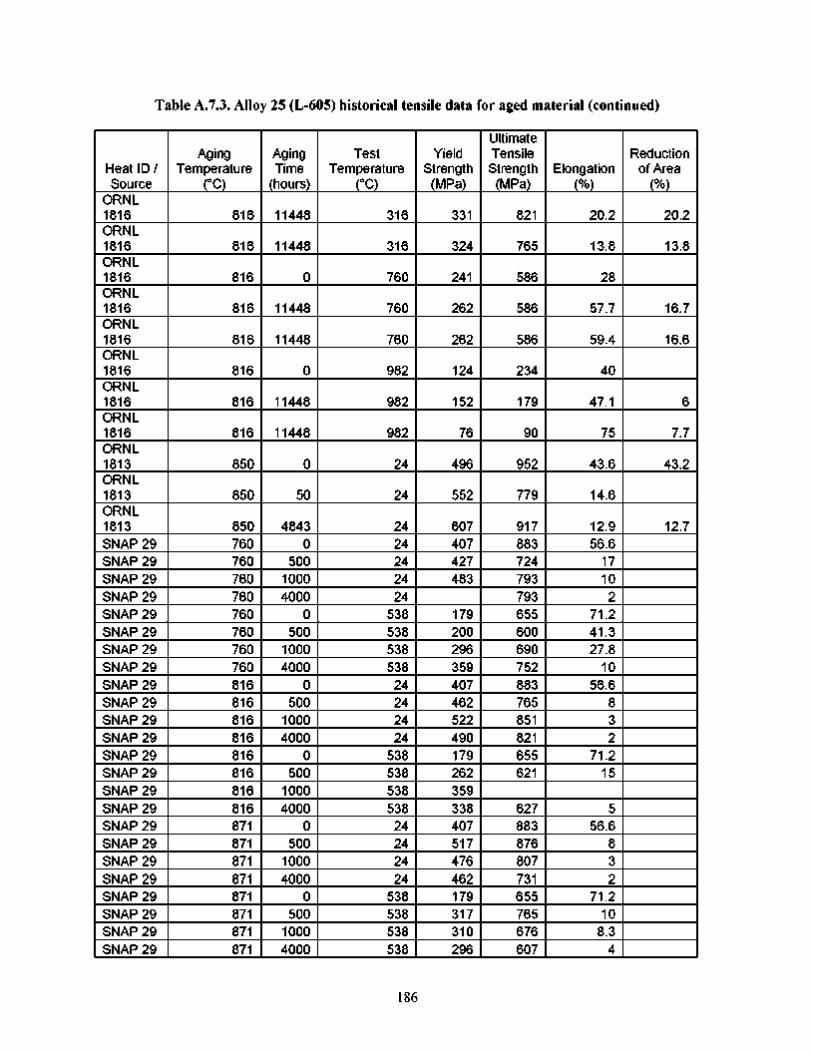
Table A.7.3. Alloy 25 (L-605) historical tensile data for aged material (continued)
Heat ID / Source
ORNL 1816 ORNL 1816 ORNL 1816 ORNL 1816 ORNL 1816 ORNL 1816 ORNL 1816 ORNL 1816 ORNL 1813 ORNL 1813 ORNL 1813 SNAP 29 SNAP 29 SNAP 29 SNAP 29 SNAP 29 SNAP 29 SNAP 29 SNAP 29 SNAP 29 SNAP 29 SNAP 29 SNAP 29 SNAP 29 SNAP 29 SNAP 29 SNAP 29 SNAP 29 SNAP 29 SNAP 29 SNAP 29 SNAP 29 SNAP 29 SNAP 29 SNAP 29
Aging Temperature
(°C) 816
816
816
816
816
816
816
816
850
850
850 760 760 760 760 760 760 760 760 816 816 816 816 816 816 816 816 871 871 871 871 871 871 871 871
Aging Time
(hours)
11448
11448
0
11448
11448
0
11448
11448
0
50
4843 0
500 1000 4000
0 500
1000 4000
0 500
1000 4000
0 500
1000 4000
0 500
1000 4000
0 500
1000 4000
Test Temperature
(°C) 316
316
760
760
760
982
982
982
24
24
24 24 24 24 24
538 538 538 538 24 24 24 24
538 538 538 538 24 24 24 24
538 538 538 538
Yield Strength (MPa)
331
324
241
262
262
124
152
76
496
552
607 407 427 483
179 200 296 359 407 462 522 490 179 262 359 338 407 517 476 462 179 317 310 296
Ultimate Tensile Strength (MPa)
821
765
586
586
586
234
179
90
952
779
917 883 724 793 793 655 600 690 752 883 765 851 821 655 621
627 883 876 807 731 655 765 676 607
Elongation (%)
20.2
13.8
28
57.7
59.4
40
47.1
75
43.6
14.6
12.9 56.6
17 10 2
71.2 41.3 27.8
10 56.6
8 3 2
71.2 15
5 56.6
8 3 2
71.2 10
8.3 4
Reduction of Area
(%)
20.2
13.8
16.7
16.6
6
7.7
43.2
12.7
186
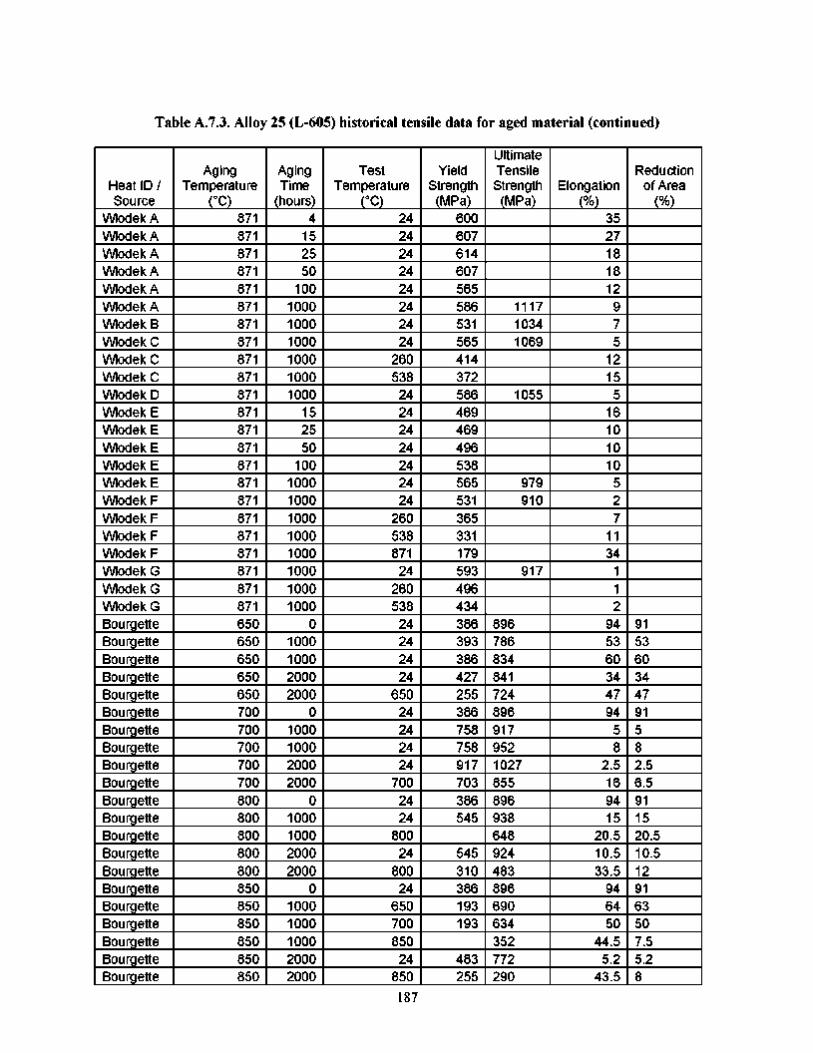
Table A.7.3. Alloy 25 (L-605) historical tensile data for aged material (continued)
Heat ID / Source
Wlodek A Wlodek A Wlodek A Wlodek A Wlodek A Wlodek A Wlodek B Wlodek C Wlodek C Wlodek C Wlodek D Wlodek E Wlodek E Wlodek E Wlodek E Wlodek E Wlodek F Wlodek F Wlodek F Wlodek F Wlodek G Wlodek G Wlodek G Bourgette Bourgette Bourgette Bourgette Bourgette Bourgette Bourgette Bourgette Bourgette Bourgette Bourgette Bourgette Bourgette Bourgette Bourgette Bourgette Bourgette Bourgette Bourgette Bourgette Bourgette
Aging Temperature
(°C) 871 871 871 871 871 871 871 871 871 871 871 871 871 871 871 871 871 871 871 871 871 871 871 650 650 650 650 650 700 700 700 700 700 800 800 800 800 800 850 850 850 850 850 850
Aging Time
(hours) 4
15 25 50
100 1000 1000 1000 1000 1000 1000
15 25 50
100 1000 1000 1000 1000 1000 1000 1000 1000
0 1000 1000 2000 2000
0 1000 1000 2000 2000
0 1000 1000 2000 2000
0 1000 1000 1000 2000 2000
Test Temperature
(°C) 24 24 24 24 24 24 24 24
260 538 24 24 24 24 24 24 24
260 538 871 24
260 538 24 24 24 24
650 24 24 24 24
700 24 24
800 24
800 24
650 700 850 24
850
Yield Strength (MPa)
600 607 614 607 565 586 531 565 414 372 586 469 469 496 538 565 531 365 331 179 593 496 434 386 393 386 427 255 386 758 758 917 703 386 545
545 310 386 193 193
483 255
Ultimate Tensile Strength (MPa)
1117 1034 1069
1055
979 910
917
896 786 834 841 724 896 917 952 1027 855 896 938 648 924 483 896 690 634 352 772 290
Elongation (%)
35 27 18 18 12 9 7 5
12 15 5
16 10 10 10 5 2 7
11 34
1 1 2
94 53 60 34 47 94
5 8
2.5 16 94 15
20.5 10.5 33.5
94 64 50
44.5 5.2
43.5
Reduction of Area
(%)
91 53 60 34 47 91 5 8 2.5 6.5 91 15 20.5 10.5 12 91 63 50 7.5 5.2 8
187
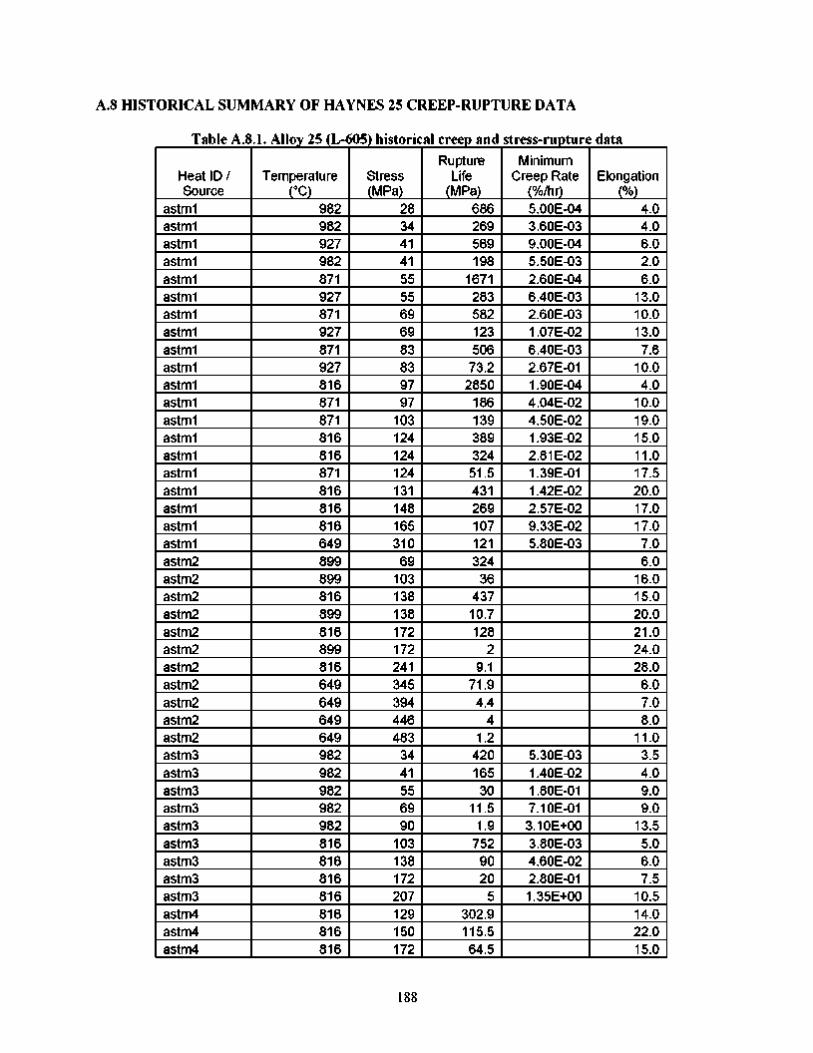
A.8 HISTORICAL SUMMARY OF HAYNES 25 CREEP-RUPTURE DATA
Table A.8.1. Alloy 25 (L-605) historical creep and stress-rupture data
Heat ID / Source
astml astml astml astml astml astml astml astml astml astml astml astml astml astml astml astml astml astml astml astml astm2 astm2 astm2 astm2 astm2 astm2 astm2 astm2 astm2 astm2 astm2 astm3 astm3 astm3 astm3 astm3 astm3 astm3 astm3 astm3 astm4 astm4 astm4
Temperature (°C)
982 982 927 982 871 927 871 927 871 927 816 871 871 816 816 871 816 816 816 649 899 899 816 899 816 899 816 649 649 649 649 982 982 982 982 982 816 816 816 816 816 816 816
Stress (MPa)
28 34 41 41 55 55 69 69 83 83 97 97
103 124 124 124 131 148 165 310 69
103 138 138 172 172 241 345 394 446 483
34 41 55 69 90
103 138 172 207 129 150 172
Rupture Life
(MPa) 686 269 569 198
1671 283 582 123 506 73.2
2850 186 139 389 324 51.5 431 269 107 121 324
36 437 10.7 128
2 9.1
71.9 4.4
4 1.2
420 165 30
11.5 1.9
752 90 20
5 302.9 115.5 64.5
Minimum Creep Rate
(%/hr) 5.00E-04 3.60E-03 9.00E-04 5.50E-03 2.60E-04 6.40E-03 2.60E-03 1.07E-02 6.40E-03 2.67E-01 1.90E-04 4.04E-02 4.50E-02 1.93E-02 2.81E-02 1.39E-01 142E-02 2.57E-02 9.33E-02 5.80E-03
5.30E-03 140E-02 1.80E-01 7.10E-01 3.10E+00 3.80E-03 4.60E-02 2.80E-01 1.35E+00
Elongation (%)
4.0 4.0 6.0 2.0 6.0
13.0 10.0 13.0 7.6
10.0 4.0
10.0 19.0 15.0 11.0 17.5 20.0 17.0 17.0 7.0 6.0
16.0 15.0 20.0 21.0 24.0 28.0
6.0 7.0 8.0
11.0 3.5 4.0 9.0 9.0
13.5 5.0 6.0 7.5
10.5 14.0 22.0 15.0
188
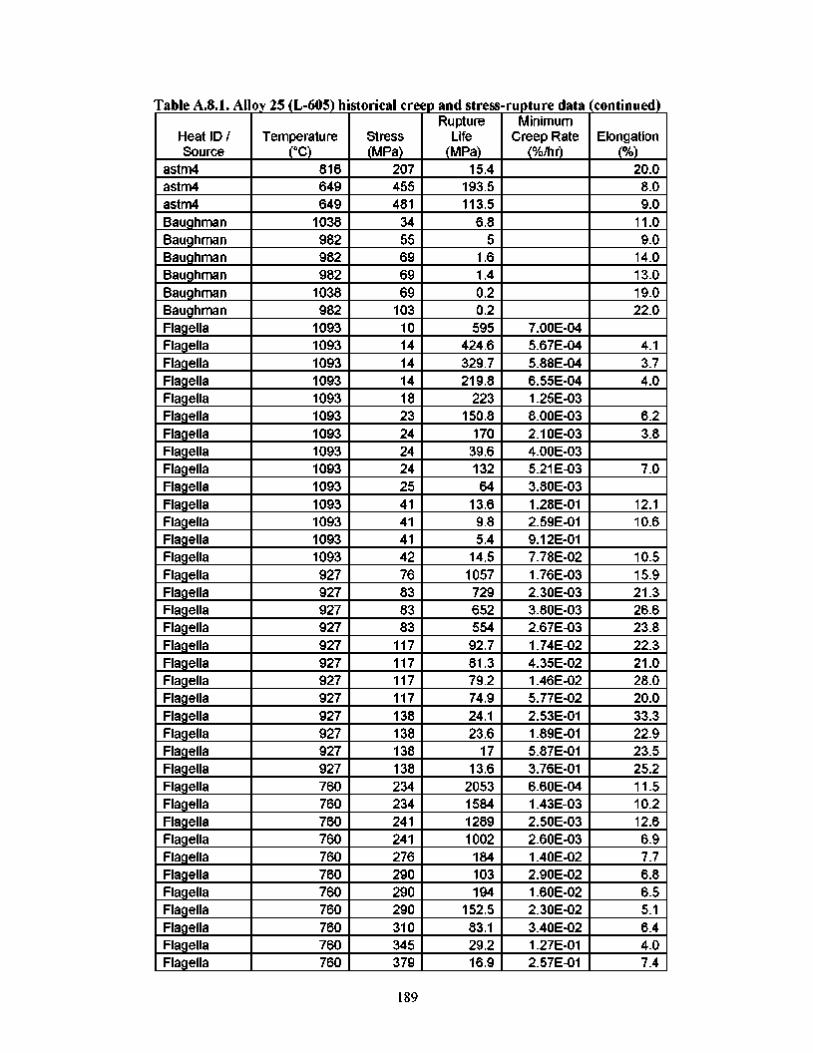
Table A.8.1. Alloy 25 (L-605) historical creep and stress-rupture data (continued
Heat ID / Source
astm4 astm4 astm4 Baughman Baughman Baughman Baughman Baughman Baughman Flagella Flagella Flagella Flagella Flagella Flagella Flagella Flagella Flagella Flagella Flagella Flagella Flagella Flagella Flagella Flagella Flagella Flagella Flagella Flagella Flagella Flagella Flagella Flagella Flagella Flagella Flagella Flagella Flagella Flagella Flagella Flagella Flagella Flagella Flagella Flagella Flagella
Temperature (°C)
816 649 649
1038 982 982 982
1038 982
1093 1093 1093 1093 1093 1093 1093 1093 1093 1093 1093 1093 1093 1093 927 927 927 927 927 927 927 927 927 927 927 927 760 760 760 760 760 760 760 760 760 760 760
Stress (MPa)
207 455 481
34 55 69 69 69
103 10 14 14 14 18 23 24 24 24 25 41 41 41 42 76 83 83 83
117 117 117 117 138 138 138 138 234 234 241 241 276 290 290 290 310 345 379
Rupture Life
(MPa) 15.4
193.5 113.5
6.8 5
1.6 1.4 0.2 0.2
595 424.6 329.7 219.8
223 150.8
170 39.6 132 64
13.6 9.8 5.4
14.5 1057 729 652 554 92.7 81.3 79.2 74.9 24.1 23.6
17 13.6
2053 1584 1289 1002
184 103 194
152.5 83.1 29.2 16.9
Minimum Creep Rate
(%/hr)
7.00E-04 5.67E-04 5.88E-04 6.55E-04 1.25E-03 8.00E-03 2.10E-03 4.00E-03 5.21E-03 3.80E-03 1.28E-01 2.59E-01 9.12E-01 7.78E-02 1.76E-03 2.30E-03 3.80E-03 2.67E-03 1.74E-02 4.35E-02 146E-02 5.77E-02 2.53E-01 1.89E-01 5.87E-01 3.76E-01 6.60E-04 143E-03 2.50E-03 2.60E-03 140E-02 2.90E-02 1.60E-02 2.30E-02 3.40E-02 1.27E-01 2.57E-01
Elongation (%)
20.0 8.0 9.0
11.0 9.0
14.0 13.0 19.0 22.0
4.1 3.7 4.0
6.2 3.8
7.0
12.1 10.6
10.5 15.9 21.3 26.6 23.8 22.3 21.0 28.0 20.0 33.3 22.9 23.5 25.2 11.5 10.2 12.6 6.9 7.7 6.8 6.5 5.1 6.4 4.0 7.4
189
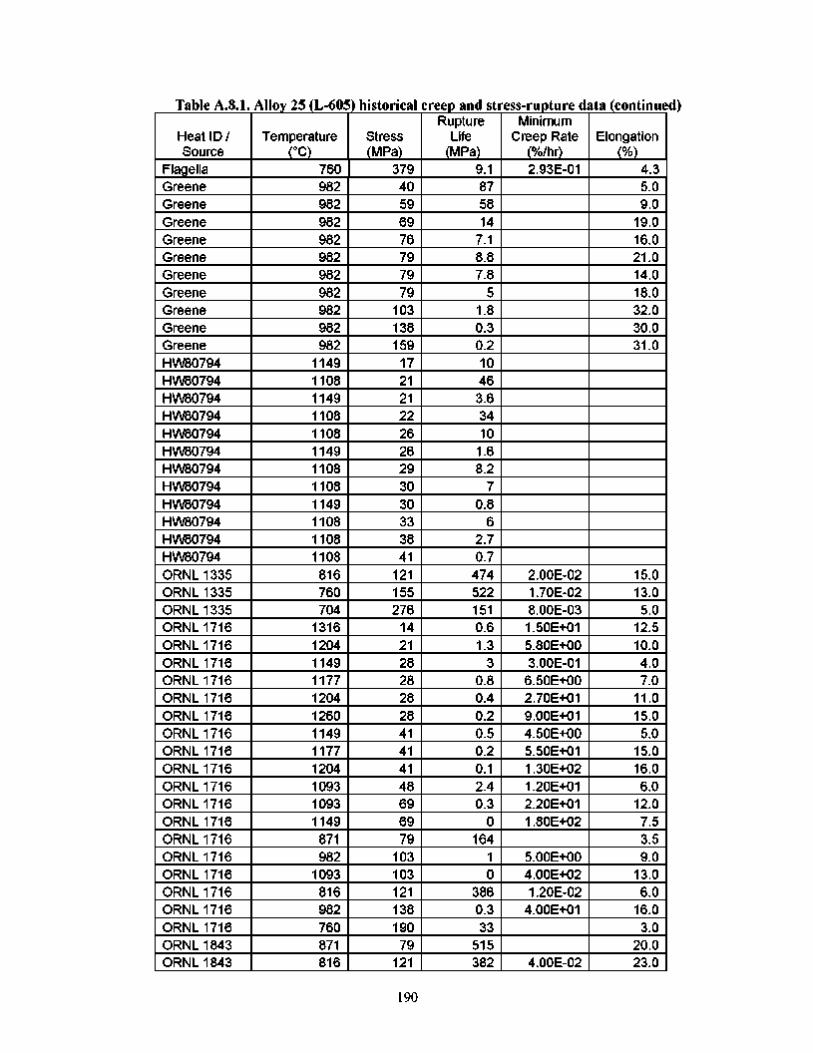
Table A.8.1. Alloy 25 (L-605) historical creep and stress-rupture data (continued)
Heat ID / Source
Flagella Greene Greene Greene Greene Greene Greene Greene Greene Greene Greene HW80794 HW80794 HW80794 HW80794 HW80794 HW80794 HW80794 HW80794 HW80794 HW80794 HW80794 HW80794 ORNL 1335 ORNL 1335 ORNL 1335 ORNL 1716 ORNL 1716 ORNL 1716 ORNL 1716 ORNL 1716 ORNL 1716 ORNL 1716 ORNL 1716 ORNL 1716 ORNL 1716 ORNL 1716 ORNL 1716 ORNL 1716 ORNL 1716 ORNL 1716 ORNL 1716 ORNL 1716 ORNL 1716 ORNL 1843 ORNL 1843
Temperature (°C)
760 982 982 982 982 982 982 982 982 982 982
1149 1108 1149 1108 1108 1149 1108 1108 1149 1108 1108 1108 816 760 704
1316 1204 1149 1177 1204 1260 1149 1177 1204 1093 1093 1149 871 982
1093 816 982 760 871 816
Stress (MPa)
379 40 59 69 76 79 79 79
103 138 159
17 21 21 22 26 26 29 30 30 33 38 41
121 155 276
14 21 28 28 28 28 41 41 41 48 69 69 79
103 103 121 138 190 79
121
Rupture Life
(MPa) 9.1 87 58 14
7.1 8.8 7.8
5 1.8 0.3 0.2 10 46 3.6 34 10
1.6 8.2
7 0.8
6 2.7 0.7
474 522 151 0.6 1.3
3 0.8 0.4 0.2 0.5 0.2 0.1 2.4 0.3
0 164
1 0
386 0.3 33
515 382
Minimum Creep Rate
(%/hr) 2.93E-01
2.00E-02 1.70E-02 8.00E-03 1.50E+01 5.80E+00 3.00E-01
6.50E+00 2.70E+01 9.00E+01 4.50E+00 5.50E+01 1.30E+02 1.20E+01 2.20E+01 1.80E+02
5.00E+00 4.00E+02 1.20E-02
4.00E+01
4.00E-02
Elongation (%)
4.3 5.0 9.0
19.0 16.0 21.0 14.0 18.0 32.0 30.0 31.0
15.0 13.0 5.0
12.5 10.0 4.0 7.0
11.0 15.0 5.0
15.0 16.0 6.0
12.0 7.5 3.5 9.0
13.0 6.0
16.0 3.0
20.0 23.0
190
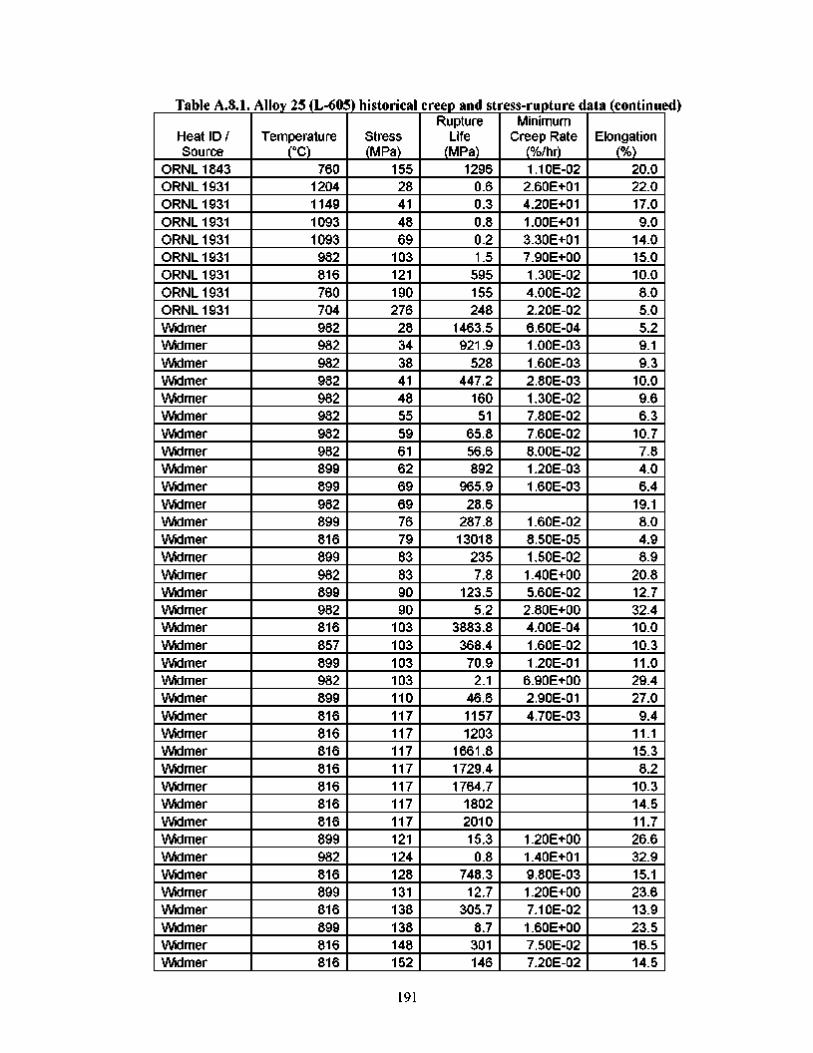
Table A.8.1. Alloy 25 (L-605) historical creep and stress-rupture data (continued)
Heat ID / Source
ORNL 1843 ORNL 1931 ORNL 1931 ORNL 1931 ORNL 1931 ORNL 1931 ORNL 1931 ORNL 1931 ORNL 1931 Wdmer Wdmer Wdmer Wdmer Wdmer Wdmer Wdmer Wdmer Wdmer Wdmer Wdmer Wdmer Wdmer Wdmer Wdmer Wdmer Wdmer Wdmer Wdmer Wdmer Wdmer Wdmer Wdmer Wdmer Wdmer Wdmer Wdmer Wdmer Wdmer Wdmer Wdmer Wdmer Wdmer Wdmer Wdmer Wdmer Wdmer
Temperature (°C)
760 1204 1149 1093 1093 982 816 760 704 982 982 982 982 982 982 982 982 899 899 982 899 816 899 982 899 982 816 857 899 982 899 816 816 816 816 816 816 816 899 982 816 899 816 899 816 816
Stress (MPa)
155 28 41 48 69
103 121 190 276
28 34 38 41 48 55 59 61 62 69 69 76 79 83 83 90 90
103 103 103 103 110 117 117 117 117 117 117 117 121 124 128 131 138 138 148 152
Rupture Life
(MPa) 1296
0.6 0.3 0.8 0.2 1.5
595 155 248
1463.5 921.9
528 447.2
160 51
65.8 56.6 892
965.9 28.6
287.8 13018
235 7.8
123.5 5.2
3883.8 368.4
70.9 2.1
46.6 1157 1203
1661.8 1729.4 1764.7
1802 2010 15.3 0.8
748.3 12.7
305.7 8.7 301 146
Minimum Creep Rate
(%/hr) 1.10E-02
2.60E+01 4.20E+01 1.00E+01 3.30E+01 7.90E+00 1.30E-02 4.00E-02 2.20E-02 6.60E-04 1.00E-03 1.60E-03 2.80E-03 1.30E-02 7.80E-02 7.60E-02 8.00E-02 1.20E-03 1.60E-03
1.60E-02 8.50E-05 1.50E-02 1.40E+00 5.60E-02
2.80E+00 4.00E-04 1.60E-02 1.20E-01
6.90E+00 2.90E-01 4.70E-03
1.20E+00 1.40E+01 9.80E-03 1.20E+00 7.10E-02 1.60E+00 7.50E-02 7.20E-02
Elongation (%)
20.0 22.0 17.0 9.0
14.0 15.0 10.0 8.0 5.0 5.2 9.1 9.3
10.0 9.6 6.3
10.7 7.8 4.0 6.4
19.1 8.0 4.9 8.9
20.8 12.7 32.4 10.0 10.3 11.0 29.4 27.0
9.4 11.1 15.3 8.2
10.3 14.5 11.7 26.6 32.9 15.1 23.6 13.9 23.5 16.5 14.5
191
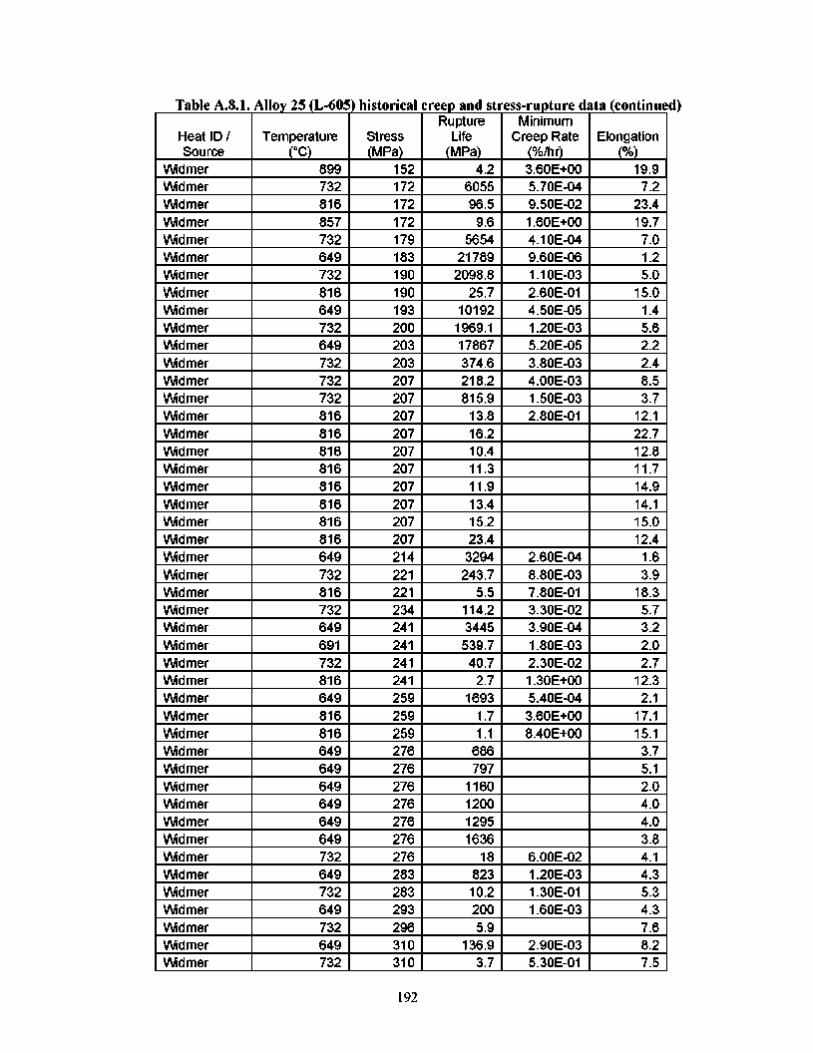
Table A.8.1. Alloy 25 (L-605) historical creep and stress-rupture data (continued)
Heat ID / Source
Wdmer Wdmer Wdmer Wdmer Wdmer Wdmer Wdmer Wdmer Wdmer Wdmer Wdmer Wdmer Wdmer Wdmer Wdmer Wdmer Wdmer Wdmer Wdmer Wdmer Wdmer Wdmer Wdmer Wdmer Wdmer Wdmer Wdmer Wdmer Wdmer Wdmer Wdmer Wdmer Wdmer Wdmer Wdmer Wdmer Wdmer Wdmer Wdmer Wdmer Wdmer Wdmer Wdmer Wdmer Wdmer Wdmer
Temperature (°C)
899 732 816 857 732 649 732 816 649 732 649 732 732 732 816 816 816 816 816 816 816 816 649 732 816 732 649 691 732 816 649 816 816 649 649 649 649 649 649 732 649 732 649 732 649 732
Stress (MPa)
152 172 172 172 179 183 190 190 193 200 203 203 207 207 207 207 207 207 207 207 207 207 214 221 221 234 241 241 241 241 259 259 259 276 276 276 276 276 276 276 283 283 293 296 310 310
Rupture Life
(MPa) 4.2
6055 96.5
9.6 5654
21789 2098.8
25.7 10192 1969.1 17867 374.6 218.2 815.9
13.8 16.2 10.4 11.3 11.9 13.4 15.2 23.4 3294
243.7 5.5
114.2 3445 539.7 40.7
2.7 1693
1.7 1.1
686 797
1160 1200 1295 1636
18 823 10.2 200 5.9
136.9 3.7
Minimum Creep Rate
(%/hr) 3.60E+00 5.70E-04 9.50E-02 1.60E+00 4.10E-04 9.60E-06 1.10E-03 2.60E-01 4.50E-05 1.20E-03 5.20E-05 3.80E-03 4.00E-03 1.50E-03 2.80E-01
2.60E-04 8.80E-03 7.80E-01 3.30E-02 3.90E-04 1.80E-03 2.30E-02 1.30E+00 5.40E-04 3.60E+00 8.40E+00
6.00E-02 1.20E-03 1.30E-01 1.60E-03
2.90E-03 5.30E-01
Elongation (%)
19.9 7.2
23.4 19.7 7.0 1.2 5.0
15.0 1.4 5.6 2.2 2.4 8.5 3.7
12.1 22.7 12.8 11.7 14.9 14.1 15.0 12.4
1.6 3.9
18.3 5.7 3.2 2.0 2.7
12.3 2.1
17.1 15.1 3.7 5.1 2.0 4.0 4.0 3.8 4.1 4.3 5.3 4.3 7.6 8.2 7.5
192
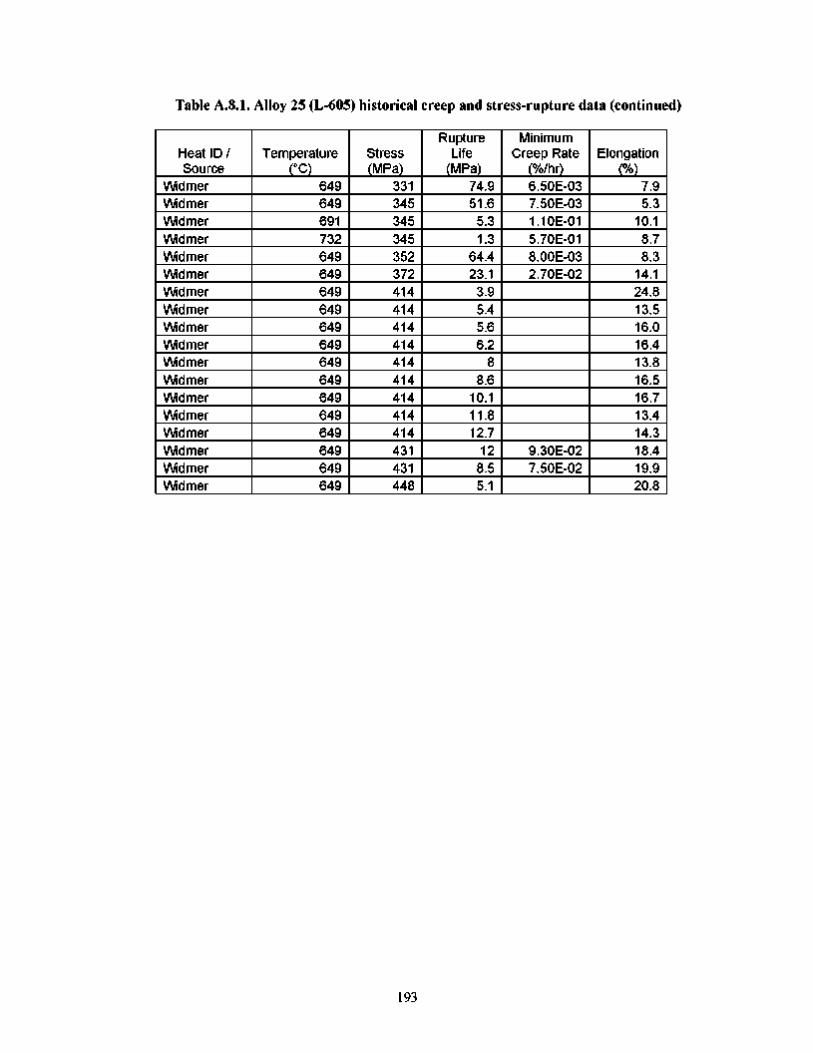
Table A.8.1. Alloy 25 (L-605) historical creep and stress-rupture data (continued)
Heat ID / Source
Wdmer Wdmer Wdmer Wdmer Wdmer Wdmer Wdmer Wdmer Wdmer Wdmer Wdmer Wdmer Wdmer Wdmer Wdmer Wdmer Wdmer Wdmer
Temperature (°C)
649 649 691 732 649 649 649 649 649 649 649 649 649 649 649 649 649 649
Stress (MPa)
331 345 345 345 352 372 414 414 414 414 414 414 414 414 414 431 431 448
Rupture Life
(MPa) 74.9 51.6
5.3 1.3
64.4 23.1
3.9 5.4 5.6 6.2
8 8.6
10.1 11.8 12.7
12 8.5 5.1
Minimum Creep Rate
(%/hr) 6.50E-03 7.50E-03 1.10E-01 5.70E-01 8.00E-03 2.70E-02
9.30E-02 7.50E-02
Elongation (%)
7.9 5.3
10.1 8.7 8.3
14.1 24.8 13.5 16.0 16.4 13.8 16.5 16.7 13.4 14.3 18.4 19.9 20.8
193
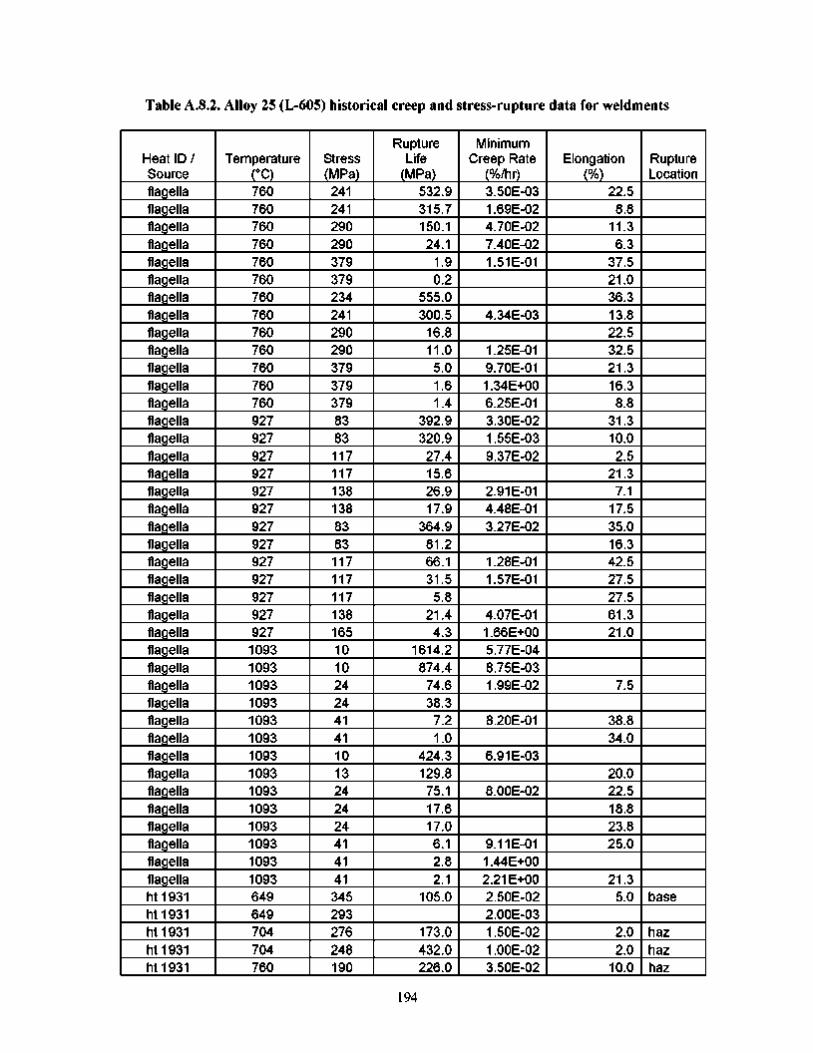
Table A.8.2. Alloy 25 (L-605) historical creep and stress-rupture data for weldments
Heat ID / Source flagella flagella flagella flagella flagella flagella flagella flagella flagella flagella flagella flagella flagella flagella flagella flagella flagella flagella flagella flagella flagella flagella flagella flagella flagella flagella flagella flagella flagella flagella flagella flagella flagella flagella flagella flagella flagella flagella flagella flagella ht 1931 ht 1931 ht 1931 ht 1931 ht 1931
Temperature (°C) 760 760 760 760 760 760 760 760 760 760 760 760 760 927 927 927 927 927 927 927 927 927 927 927 927 927 1093 1093 1093 1093 1093 1093 1093 1093 1093 1093 1093 1093 1093 1093 649 649 704 704 760
Stress (MPa)
241 241 290 290 379 379 234 241 290 290 379 379 379 83 83 117 117 138 138 83 83 117 117 117 138 165 10 10 24 24 41 41 10 13 24 24 24 41 41 41 345 293 276 248 190
Rupture Life
(MPa) 532.9 315.7 150.1 24.1
1.9 0.2
555.0 300.5
16.8 11.0 5.0 1.6 1.4
392.9 320.9 27.4 15.6 26.9 17.9
364.9 81.2 66.1 31.5
5.8 21.4
4.3 1614.2 874.4
74.6 38.3
7.2 1.0
424.3 129.8 75.1 17.6 17.0 6.1 2.8 2.1
105.0
173.0 432.0 226.0
Minimum Creep Rate
(%/hr) 3.50E-03 1.69E-02 4.70E-02 7.40E-02 1.51E-01
4.34E-03
1.25E-01 9.70E-01 1.34E+00 6.25E-01 3.30E-02 1.55E-03 9.37E-02
2.91E-01 4.48E-01 3.27E-02
1.28E-01 1.57E-01
4.07E-01 1.66E+00 5.77E-04 8.75E-03 1.99E-02
8.20E-01
6.91E-03
8.00E-02
9.11E-01 144E+00 2.21E+00 2.50E-02 2.00E-03 1.50E-02 1.00E-02 3.50E-02
Elongation (%)
22.5 8.8
11.3 6.3
37.5 21.0 36.3 13.8 22.5 32.5 21.3 16.3 8.8
31.3 10.0 2.5
21.3 7.1
17.5 35.0 16.3 42.5 27.5 27.5 61.3 21.0
7.5
38.8 34.0
20.0 22.5 18.8 23.8 25.0
21.3 5.0
2.0 2.0
10.0
Rupture Location
base
haz haz haz
194
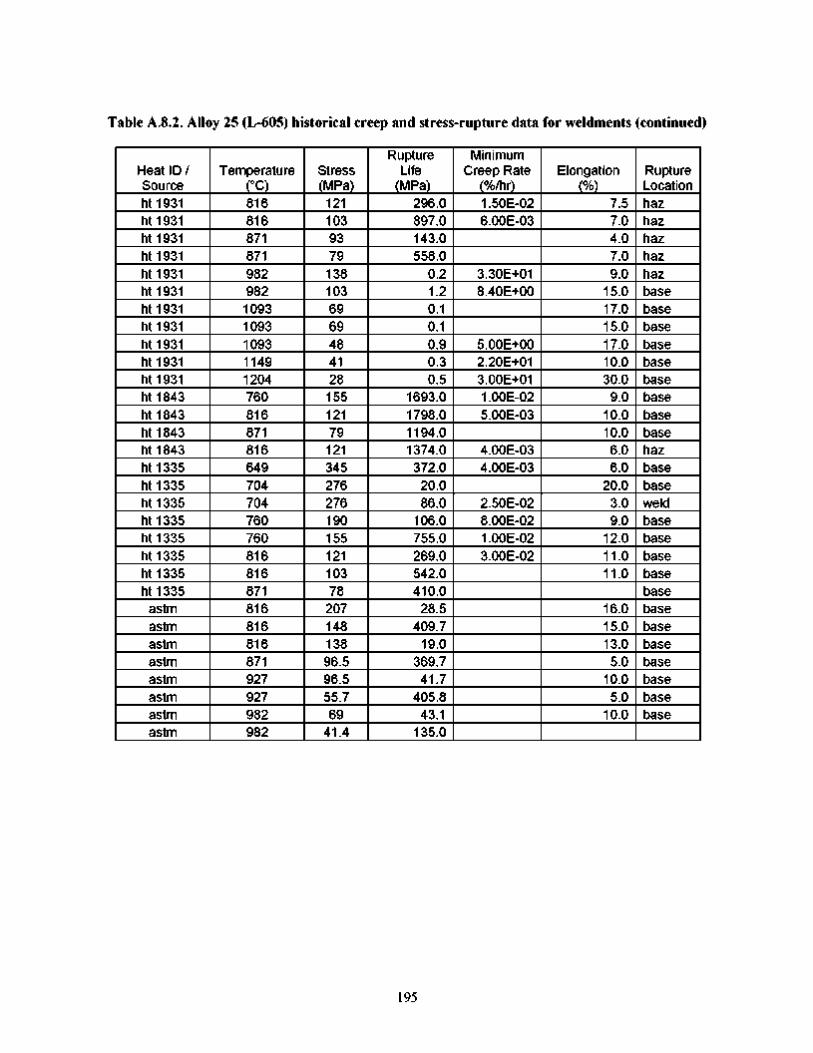
Table A.8.2. Alloy 25 (L-605) historical creep and stress-rupture data for weldments (continued)
Heat ID / Source ht 1931 ht 1931 ht 1931 ht 1931 ht 1931 ht 1931 ht 1931 ht 1931 ht 1931 ht 1931 ht 1931 ht 1843 ht 1843 ht 1843 ht 1843 ht 1335 ht 1335 ht 1335 ht 1335 ht 1335 ht 1335 ht 1335 ht 1335
astm astm astm astm astm astm astm astm
Temperature (°C) 816 816 871 871 982 982 1093 1093 1093 1149 1204 760 816 871 816 649 704 704 760 760 816 816 871 816 816 816 871 927 927 982 982
Stress (MPa)
121 103 93 79 138 103 69 69 48 41 28 155 121 79 121 345 276 276 190 155 121 103 78
207 148 138 96.5 96.5 55.7 69
41.4
Rupture Life
(MPa) 296.0 897.0 143.0 558.0
0.2 1.2 0.1 0.1 0.9 0.3 0.5
1693.0 1798.0 1194.0 1374.0 372.0 20.0 86.0
106.0 755.0 269.0 542.0 410.0
28.5 409.7
19.0 369.7 41.7
405.8 43.1
135.0
Minimum Creep Rate
(%/hr) 1.50E-02 6.00E-03
3.30E+01 8.40E+00
5.00E+00 2.20E+01 3.00E+01 1.00E-02 5.00E-03
4.00E-03 4.00E-03
2.50E-02 8.00E-02 1.00E-02 3.00E-02
Elongation (%)
7.5 7.0 4.0 7.0 9.0
15.0 17.0 15.0 17.0 10.0 30.0
9.0 10.0 10.0 6.0 6.0
20.0 3.0 9.0
12.0 11.0 11.0
16.0 15.0 13.0 5.0
10.0 5.0
10.0
Rupture Location haz haz haz haz haz base base base base base base base base base haz base base weld base base base base base base base base base base base base
195

196
ORNL/TM-2006/609
INTERNAL DISTRIBUTION
1. 2.
3-4. 5. 6. 7.
E. P. George D. B. Glanton J. F. King E. Lara-Curzio R. L. Martin T. E. McGreevy
8. 9.
10-11. 12. 13. 14. 15.
R. G. Miller W. Ren J. P. Shingledecker B. L. Sparks R. W. Swindeman G. B. Ulrich ORNL Technical Information Office
(RC)
EXTERNAL DISTRIBUTION
16. Robert T. Carpenter, Orbital Sciences Corporation 20030 Century Blvd., Suite 102, Germantown, MD 20874
17. John Dowicki, Office of Radioisotope Power Systems, NE-34/GTN U. S. Department of Energy, 1000 Independence Avenue SW, Washington, DC 20585-1290
18. Lloyd. Edgerly, Office of Radioisotope Power Systems, NE-34/GTN U. S. Department of Energy, 1000 Independence Avenue SW, Washington, DC 20585-1290
19. R. G. Hanson, Idaho National Laboratory, P. O. Box 1625, MS-6122, Idaho Falls, ID 83415
20. Stephen G. Johnson, Idaho National Laboratory, P. O. Box 1625, MS-6122, Idaho Falls, ID 83415
21. Robert Lange, Office of Radioisotope Power Systems, NE-34/GTN U. S. Department of Energy, 1000 Independence Avenue SW, Washington, DC 20585-1290
22. Andrew Leanna, Teledyne Energy Systems, 10707 Gilroy Road, Hunt Valley, MD 21031-1311
23. Michael Katcher, Haynes International, P.O. Box 9013, Kokomo, IN 46904-9013
24. Dwaine Klarstrom, Haynes International, P.O. Box 9013, Kokomo, IN 46904-9013
25-26. Michael McKittrick, Teledyne Energy Systems, 10707 Gilroy Road, Hunt Valley, MD 21031-
1311
27. Office of Scientific and Technical Information (PDF file to ORNL Releasing Official, D. R.
Hamrin)
28. Emil Skrabek, Orbital Sciences Corporation 20030 Century Blvd., Suite 102, Germantown, MD 20874
29. Craig E. Van Pelt, Los Alamos National Laboratory, P. O. Box 1633, Los Alamos, NM 87545
30. John Vogt, Teledyne Energy Systems, 10707 Gilroy Road, Hunt Valley, MD 21031-1311