Embed Size (px)
Citation preview

MULTI-OBJECTIVE EVOLUTIONARY ALGORITHMS FOR COOPERATIVE SPECTRUM SENSING IN COGNITIVE RADIO NETWORKS
AYMAN ABD EL-SALEH
THESIS SUBMITTED IN FULFILMENT FOR THE DEGREE OF DOCTOR OF PHILOSOPHY
FACULTY OF ENGINEERING AND BUILT ENVIRONMENT
UNIVERSITI KEBANGSAAN MALAYSIA BANGI
2012

ii
DECLARATION
I hereby declare that the work in this thesis is my own except for quotations and
summaries which have been duly acknowledged.
17 Februray 2012 AYMAN ABD EL-SALEH P38294

iii
ACKNOWLEDGEMENT
First and for most, all praises are due to Allah, the Almighty, the Most Gracious and
the Most Merciful, on Whom ultimately we depend for sustenance, guidance and
blessing.
Secondly, I would like to express my deepest gratitude and uncountable
appreciation to my supervisor Professor Mahamod Ismail for his continuous support,
stimulating suggestions, inspirational encouragement and constructive criticism
throughout the course of this research work. His timely and efficient contribution and
endless efforts helped me shape this study into its final form. My gratitude and
appreciation are also extended to my co-supervisor Professor Mohd Alauddin Mohd
Ali whose supervision during my M.Sc. dissertation was instrumental in the
development and growth of my research skills. Honestly, I am much honoured and
fortunate to work under the supervision of Professor Mahamod and Professor
Alauddin. Their inputs have made a difference.
I also would like to thank all UKM staffs for their support during my almost
eight years of study and research in the university. The financial supports of
PKT3/2009 grant as well as the UKM-OUPICT-36-177/2009 and UKM-OUP-ICT-
36-185/2011 research-university operation grants have been crucial to finish this
research work.
I would like to convey my gratitude and appreciation to my parents, brothers,
and sisters for their always accessible support. My father’s calls and words of
encouragement have been always triggering me to complete my study abroad. My
mother’s enormous love and prayers have definitely helped me towards the successful
completion of this thesis. My special acknowledgement and tribute is dedicated to my
lovely wife, Layal, for the encouraging ambiance and colourful atmosphere she
created in my life. Her love, spirit, moral support, and great sacrifices have been
always motivating me to work hard and overcome some tumultuous situations in my
professional life. Last but not least, I am indebted to all my relatives, friends, and
colleagues who have directly or implicitly contributed to this thesis. Thank you all,
thank you very much.
iv
ABSTRACT Cognitive radio (CR) users are envisioned as intelligent secondary users (SUs) armed with spectrum sensing capabilities to monitor licensees’ or primary users’ (PUs’) activities and opportunistically access unused channels. In cognitive radio networks (CRNs), cooperative spectrum sensing is performed with an essential aim of maximizing CRN throughput and also PU protection. However, these two objectives are unfortunately contradictory such as improving the PU detection through cooperation between SUs results in an increased relaying overhead. The main objective of this research work is to develop multi-objective evolutionary algorithms (MOEAs) based on genetic algorithms (GAs) for optimizing the performance of CRNs and CR by attaining a compromise between corresponding conflicting objectives according to predefined criteria. Three different CRN architectures, namely, hard decision fusion (HDF), soft data fusion (SDF), and hybrid SDF-HDF cluster-based CRNs have been proposed. The architectures satisfy distinct requirements of PU detection performance and overhead traffic. The SDF can be used when high PU detection performance is needed whereas the HDF is to be used when low overhead traffic is demanding. In contrast, the hybrid SDF-HDF is used when a balanced compromise between PU detection performance and overhead traffic is of interest. MOEAs based on GAs called single-objective GA (SOGA), bi-objective GA (BOGA), and multi-objective GA (MOGA) have been also developed as intelligent optimization systems for SDF, HDF, and hybrid SDF-HDF cluster-based CRNs, respectively. In addition, another MOGA has been developed to add in cognition and environment-awareness to CR systems. The MOGA-based decision engine evolves autonomously to return sub-optimal set of transmission parameters for the sensed wireless environment and under a predefined operational scenario resulted from the conflicting nature of corresponding objectives. Throughout this thesis, the CRN network deployments and CR system models are first proposed and their mathematical formalisms are derived, simulated, and analyzed to observe existing tradeoffs. Based on pre-simulation results, objective functions and their corresponding dependency relationships with design parameters for each proposed network or system have been then identified and formulated. These conflicting objectives are introduced as performance metrics for the corresponding MOEA. The performance of the GA-based system/engines is evaluated for different channel conditions and operating scenarios. Post-analyses and comparisons are finally carried out to verify the conceptual functionality and validate the obtained results. Simulation results of MOEAs of CRNs and CR systems show successful adaption in response to environmental and topological conditions. In SDF-based CRNs, the proposed SOGA achieves a fitness score of 10% higher than that of the best conventional SDF scheme given the same false alarm rate. The BOGA optimization system of HDF-based CRN achieves a fitness score improvement of 10% and 4% than when using static cooperation level and static sensing time, respectively. In hybrid SDF-HDF cluster-based CRN, the proposed MOGA optimization system, when using its optimal parameters, show a fitness score improvement of about 14.4% greater than that if the parameters are set to their maximum values and an improvement of about 69.3% when they are set to their minimum values. Finally, for CR systems, the simulation results confirm the effectiveness of the proposed MOGA decision engine since more than 80% of fitness score can always be achieved within the first 50 generations which is fast enough to meet real-time requirements.
v
ABSTRAK
Pengguna radio kognitif (CR) boleh dianggap sebagai pengguna sekunder (SU) cerdik yang memiliki kebolehan menderia spektrum bagi mengawas aktiviti pemilik lesen atau pengguna utama (PU) dan berpeluang untuk mengakses saluran-saluran yang tidak digunakan. Dalam rangkaian radio kognitif (CRN), penderiaan spektrum kerjasama dilaksana dengan matlamat penting bagi memaksimum truput dan juga perlindungan PU. Walaupun demikian, kedua-dua objektif tersebut malangnya saling bercanggahan seperti peningkatan pengesanan PU melalui kerjasama antara SU akan menghasilkan lebihan gegantian yang bertambah. Objektif utama kerja penyelidikan ini ialah membangunkan algoritma evolusi berbilang-objektif (MOEA) berasaskan algoritma genetik (GA) dalam mengoptimum prestasi CRN dan CR dengan mencapai kompromi antara objektif yang bercanggah yang sepadan mengikut kriteria yang telah dipratentukan. Tiga senibina CRN yang berbeza yang dinamakan CRN lakuran keputusan keras (HDF), CRN lakuran keputusan lembut (SDF) dan CRN berasaskan kelompok SF-HF hibrid telah dicadangkan. Senibina memenuhi keperluan nyata bagi prestasi pengesanan PU dan trafik lebihan. SDF boleh digunakan apabila prestasi pengesanan PU yang tinggi diperlukan sementara HDF digunakan apabila permintaan trafik lebihan adalah rendah. Sebaliknya, SDF-HDF digunakan apabila kompromi terimbang antara prestasi pengesanan PU dan lebihan trafik diminati. MOEA algoritma-algoritma genetik (GAs) yang dikenali sebagai GA objektif-tunggal (SOGA), GA dwiobjektif (BOGA) dan GA berbilang-objektif (MOGA) juga telah dibangunkan sebagai sistem pengoptimuman cerdik masing-masing bagi CRN SDF, HDF dan berasaskan kelompok SF-HF hibrid. Di samping itu, satu lagi MOGA telah dibina untuk menambah pecaman dan kesedaran persekitaran kepada sistem CR. Enjin keputusan berasaskan MOGA berkembang secara autonomi untuk mengembalikan set sub-optimum parameter penghantaran bagi persekitaran tanpa wayar yang dideria dan dalam senario operasi yang telah dipratentukan yang terhasil akibat keadaan bercanggahan objektif yang sepadan. Dalam keseluruhan tesis ini, pertamanya pelaksanaan rangkaian CRN dan model sistem CR telah dicadangkan dan kemudiannya formalisi matematik diterbit, disimulasi dan dianalisis untuk memerhatikan tolakansur yang wujud. Berdasarkan hasil prasimulasi, fungsi objektif dan hubungkait masing-masing dengan parameter rekabentuk bagi setiap rangkaian atau sistem yang dicadang telah dikenalpasti dan diformulasi. Objektif yang bercanggahan ini telah diperkenalkan sebagai metrik prestasi bagi MOEA yang sepadan. Prestasi sistem dan enjin berasaskan GA telah dinilai bagi keadaan saluran dan senario operasi yang berbeza. Pascaanalisis dan perbandingan akhirnya dilakukan bagi mengesahkan kebolehfungsian konsep dan hasil yang diperolehi. Hasil simulasi menunjukkan MOEA bagi CRN dan sistem CR berjaya disesuaikan untuk bertindak balas terhadap keadaan persekitaran dan topologi. Bagi CRN berasaskan SDF, skema SOGA yang dicadangkan mencapai skor kecergasan 10% lebih baik berbanding skor terbaik bagi skema SDF lazim untuk kadar penggera salah yang sama. Sistem pengoptimuman BOGA bagi CRN berasaskan HDF mencapai peningkatan skor kecergasan 10% dan 4% masing-masing apabila menggunakan tahap kerjasama statik dan masa deria statik. Dalam CRN berasaskan kelompok SDF-HDF, sistem pengoptimuman MOGA yang dicadangkan menunujukkan peningkatan skor kecergasan sebanyak 14.4% apabila parameter optimumnya digunakan berbanding jika parameter disetkan pada nilai maksimum dan peningkatan di sekitar 69.3% apabila nilai minimum disetkan. Akhirnya, bagi sistem CR hasil simulasi

vi
membuktikan keberkesanan enjin keputusan MOGA yang dicadangkan kerana lebih dari 80% skor kecergasan sentiasa boleh dicapai dalam 50 generasi dan hal ini cukup pantas bagi memenuhi keperluan masa nyata.

vii
CONTENTS
Page
DECLARATION ii
ACKNOWLEDGEMENTS iii
ABSTRACT iv
ABSTRAK v
CONTENTS vii
LIST OF TABLES xi
LIST OF ILLUSTRATIONS xii
LIST OF ABBREVIATIONS xv
LIST OF SYMBOLS xix
CHAPTER I INTRODUCTION
1.1 Background 1
1.1.1 Overview on Current Spectrum Regulations 2 1.1.2 Cognitive Radio Overview 4 1.1.3 Spectrum Sensing Overview 8
1.2 Problem Statement 11
1.3 Research Objectives and Scope 13
1.4 Research Contributions 15
1.5 General Methodology 16
1.6 Thesis Organization 17
CHAPTER II LITERATURE REVIEW
2.1 Introduction 19
2.2 Cognitive Radio Technology 19
2.2.1 Cognitive Radio Capabilities 21
2.2.2 CR Potential Applications 22
2.3 Spectrum Sensing 24
2.3.1 Local Spectrum Sensing Techniques 24 2.3.2 Performance Evaluation of Spectrum Sensing 29 2.3.3 Detection Criteria of Primary User 31 2.3.4 Challenges of Spectrum Sensing 32 2.3.5 Spectrum Sensing in Existing Wireless Standards 33
viii
2.4 Cooperative Spectrum Sensing 34
2.4.1 Centralized Sensing Architecture 35 2.4.2 Distributed Sensing Architecture 35
2.5 Fusion Schemes for Cooperative Spectrum Sensing 36
2.5.1 Hard Decision Fusion (HDF) 37 2.5.2 Soft Data Fusion (SDF) 37
2.6 Other Dynamic Spectrum (DSA) Aspects 39
2.6.1 CR Operating Bands 39 2.6.2 Spectrum Sharing Techniques 40 2.6.3 Cooperation Behaviour 41
2.7 Optimization 42
2.7.1 Types of Optimization Problems 42 2.7.2 Multi-Objective Optimization 43 2.7.3 Multi-Objective Approaches 45
2.8 Genetic algorithms (GAs) 47
2.8.1 GA Concepts and Terminology 47 2.8.2 Mechanism of GA 48 2.8.3 GA Components 49
2.9 Previous Work of Evolutionary Algorithms for CR 55
2.10 Summary 59
CHAPTER III MOGA-ASSISTED DECISION ENGINE FOR CR SYSTEMS
3.1 Introduction 60
3.2 Problem Formulation 60
3.2.1 Proposed Elements of CR System 61 3.2.2 Observation of Conflicting Objectives 67
3.3 System Development 73
3.3.1 System Architecture 73 3.3.2 CR Transmission Modes 75 3.3.3 GA Configuration 76
3.4 Performance Evaluation 78
3.4.1 Simulation Parameters and GA Operators 78 3.4.2 Performance Evaluation of MOGA-based CR 78
Systems 3.4.3 Discussion of Results 83
3.5 Adaptive versus Static Transmission Parameters of 85 Proposed MOGA-based CR System
3.6 Summary 87
ix
CHAPTER IV BOGA-ASSISTED HDF- BASED AND SOGA-ASSISTED SDF-BASED COOPERATIVE SPECTRUM SENSING IN COGNITIVE RADIO NETWORKS
4.1 Introduction 89
4.2 Generic CRN Model and Fusion Schemes 89
4.3 BOGA-Assisted HDF-Based Cooperative Spectrum 91 Sensing
4.3.1 HDF-based CRN System Model 92 4.3.2 Energy Detection Model for Channel Sensing 93 4.3.3 CRN-wise HDF Decision Probabilities 96 4.3.4 PU Protection-SU Throughput Tradeoff in 98 HDF-based CRNs 4.3.5 Problem Formulation for BOGA Optimization 102 4.3.6 Performance Evaluation of BOGA-assisted 103 HDF-based Optimization System 4.3.7 Results and Discussion 104
4.4 SOGA-Assisted SDF-Based Cooperative Spectrum 106 Sensing
4.4.1 SDF-based CRN System Model 107 4.4.2 Characterization of PU-SU and SU-FC Link 108 4.4.3 CRN-wise SDF Decision Probabilities 111 4.4.4 SDF-based Single-Objective Function 112 4.4.5 Conventional SDF Schemes 113 4.4.6 Performance Evaluation of SDF-based Schemes 116
4.4.7 Proposed SOGA-assisted SDF-based 122 Optimization System
4.4.8 Performance Evaluation of SOGA-assisted SDF- 124 based Optimization System 4.4.9 Results and Discussion 126
4.5 HDF and SDF Tradeoffs in CRNs 127
4.6 Summary 128
CHAPTER V MOGA-ASSISTED HYBRID SDF-HDF CLUSTER BASED COOPERATIVE SPECTRUM SENSING FOR COGNITIVE RADIO NETWORKS
5.1 Introduction 130
5.2 Hybrid SDF-HDF Cluster Based CRN System Model 130
5.3 Performance Metrics and Parameters 132
5.3.1 Proposed Objective Functions 132 5.3.2 Dependency Relationships of Performance Metrics 136
5.4 Formulation of Optimization Problem 138
5.4.1 Aggregation of Multiple Objective Functions 139

x
5.4.2 CRN Operational Modes 139
5.5 MOGA-Assisted Hybrid SDF-HDF Cluster Based 141 Cooperative Spectrum Sensing
5.5.1 Chromosome Encoding 142 5.5.2 Development of GUI Simulation Model (GUISM) 143
5.6 Performance Evaluation 144
5.7 Results and Discussion 147
5.8 SDF-SDF, HDF-HDF, and SDF-HDF Tradeoffs in CRNs 150
5.9 Summary 153
CHAPTER VI CONCLUSION AND FUTURE WORK
6.1 Conclusion 154
6.1.1 MOEA for CR Systems 155
6.1.2 MOEAs for CRNs 156
6.2 Future Work 159
REFERENCES 161
LIST OF PUBLICATIONS 170
xi
LIST OF TABLES
Table No. Page
1.1 Associated changes with emergence of CR 8
1.2 CRN architectures and corresponding requirements 13
2.1 Description of CR functions 22
2.2 Comparison of various spectrum sensing techniques 29
2.3 Local versus cooperative spectrum sensing 34
2.4 Centralized versus distributed cooperative spectrum sensing 36
2.5 Suggested values of GA control parameters 54
2.6 CR research fields and related research works 58
3.1 Proposed environmental parameters 62
3.2 Proposed transmission parameters 63
3.3 Cognitive radio objectives and related parameters 64
3.4 Definition of CR transmission modes 76
3.5 Summary of simulation results of CR system performance 83
3.6 Effect of varying the setting of CR transmit power 86
3.7 Effect of varying the setting of CR modulation index 86
3.8 Effect of varying the setting of CR symbol rate 87
4.1 Proposed SOGA-assisted SDF-based algorithm 123
5.1 Summary of dependent design parameters of the proposed 136 metrics
5.2 The proposed objective functions and their related parameters 138
5.3 Proposed operational modes and their corresponding weighting 140 coefficients
5.4 MOF scores at different parameter settings under related 147 operational mode.
5.5 Traffic overhead analysis for different SDF and HDF 152 combinations
xii
LIST OF ILLUSTRATIONS
Figure No. Page
1.1 Malaysia Spectrum Allocations as issued by MCMC 3
1.2 Measurement of 0-6 GHz spectrum utilization at BWRC 4
1.3 Simple CR system architecture 6
1.4 Simple deployment of CRN in conjunction with existing 10 PU network
1.5 Bottom-up approach with coverage of thesis chapters 14
1.6 General methodology of research 17
2.1 Cognition cycle of CR 21
2.2 Elements of spectrum sensing 25
2.3 Realization of various detection techniques for spectrum 27 sensing
2.4 Probability densities of received signal energy under H0 30 and H1 sensing hypotheses.
2.5 Fusion schemes for cooperative spectrum sensing 38
2.6 Spectrum sharing techniques 41
2.7 Multiobjective optimization and Pareto front solutions 45
2.8 Flowchart of GA mechanism 49
2.9 Distribution of decision variables at the first generation 52
2.10 GA performance over 100 generations of optimizing 55 equation (2.17)
3.1 Elements of a CR system 61
3.2 Error performance of MPSK and MQAM schemes 68
3.3 Fitness of minimizing-BER objective versus Eb/N0 for 69 various MPSK and MQAM schemes.
3.4 Fitness of minimizing-power consumption objective versus 70 Eb/N0 for various MPSK and MQAM schemes.
3.5 Fitness of minimizing-power consumption objective versus 70 symbol rate for various MPSK and MQAM schemes.
3.6 Fitness of maximizing-spectral efficiency objective versus 71 symbol rate for various MPSK and MQAM schemes.
3.7 Summary of conflicting objectives trends when varying their 72 corresponding parameters.
3.8 Pareto-front tradeoff between minimizing-power consumption 73
xiii
versus minimizing-BER objectives for various MPSK and MQAM schemes.
3.9 Proposed MOGA-base CR system architecture 74
3.10 Chromosome encoding of CR transmission parameters 77
3.11 MOF score versus number of generations under RCM 79
3.12 MOF score versus number of generations under PSM 80
3.13 MOF score versus number of generations under SEM 81
3.14 MOF score versus number of generations under BLM 82 (Solution 1).
3.15 MOF score versus number of generations under BLM 82 (Solution 2).
4.1 Simplified CRN model with its main activities 90
4.2 Deployment of HDF-based CRN 93
4.3 Realization of k-out-of-N HDF rule for N = 5 97
4.4 Probability of detection versus sensing time at different 99 probabilities of false alarm.
4.5 Probability of detection versus number of collaborating 99 SUs for different total number of SUs.
4.6 Optimal versus overall probability of detection for different 100 number of SUs.
4.7 Normalized throughput versus sensing time at different false 102 alarm probability.
4.8 Performance of BOGA-assisted HDF-based system 104
4.9 Bi-objective Fitness versus CRN-wise probability of false 105 alarm at different number of collaborating SUs.
4.10 Bi-objective Fitness versus CRN-wise probability of false 105 alarm at different settings of sensing time.
4.11 CR system model with linear SDF-based cooperative spectrum 107 sensing.
4.12 ROC performance comparison of cooperative spectrum sensing 118 SDF and HDF schemes.
4.13 ROC performance comparison of NDC-based SDF cooperative 119 spectrum sensing at FC with different number of SUs per cluster.
4.14 Channel bandwidth of the SU-FC link as a function of number 121 of bit per symbol and number of bits per sample at different sensning times.
4.15 Evaluation of convergence performance of SOGA-assisted 125 SDF-based system.
xiv
4.16 Detection performance of SOGA-assisted and other SDF- 126 and HDF- based schemes.
5.1 Detailed system model of the proposed hybrid SDF-HDF 131 cluster-based cooperative spectrum sensing.
5.2 Objective-parameter dependency relationships and their 137 conflicting behaviour.
5.3 Proposed MOGA optimization system and its I/Os 141
5.4 Chromosome representation of MOGA optimization system 143
5.5 GUISM for MOGA optimization system 144
5.6 GUISM simulation results under high quality mode 145
5.7 Average multi-objective fitness score with different parameter 149 settings.
5.8 Detection performance of various combinations of SDF- and 150 HDF- based CRNs.

xv
LIST OF ABBREVIATIONS
AAF Amplify-and-Forward ABC Artificial Bee Colony ACO Ant Colony Optimization ADC Analog-to-Digital Converter AI Artificial Intelligence AP Access Point AWGN Additive White Gaussian Noise BER Bit Error Rate BLM Balanced Mode BOF Bi-Objective Fitness BOGA Bi-Objective Genetic Algorithm BS Base Station BWRC Berkeley Wireless Research Centre CCB Control Channel Bandwidth CES Constant-Elasticity-of-Substitution CFAR Constant False Alarm Rate CFD Quantization Fidelity CGA Quantum Genetic Algorithm CH Cluster Header CLT Central Limit Theorem CR Cognitive Radio CRM Cognitive Resource Manger CRN Cogntitive Radio Network CSI Channel State Information

xvi
CSS Cooperative Spectrum Sensing CWT Centre for Wireless Telecommunications DAF Decode-and-Forward DARPA Defense Advanced Research Projects Agency DC Deflection Coefficient DIMSUMnet Dynamic Intelligent Management of Spectrum for Ubiquitous Mobile
Network DRiVE Dynamic Radio for IP Services in Vehicular Environments DSA Dynamic Spectrum Access EGC Equal Gain Combination EHF Extra High Frequency FC Fusion Centre FCC Federal Communications Commission FEC Forward Error Correction FFT Fast Fourier Transform GA Genetic Algorithm GSM Global System for Mobile Communications GUISM Graphical User Interface Simulation Model HDF Hard Decision Fusion HMM Hidden Markov Model IEEE Institute of Electrical and Electronics Engineers i.i.d. Independent and Identically Distributed ISM Industrial, Scientific, and Medical Frequency Band KPP Key Performance Parameter LAN Local Area Network

xvii
MCMC Malaysian Communications and Multimedia Commission MDC Modified Deflection Coefficient MIMO Multiple-Input Multiple-Output MOEA Multi-Objective Evolutionary Algorithm MOF Multi-Objective Fitness MOGA Multi-Objective Genetic Algorithm MOO Multiple-Objective Optimization MRC Maximal-Ratio Combining NDC Natural Deflection Coefficient OCRA OFDM-based Cognitive Radio Ofcom Office of Communications OFDM Orthogonal Frequency-Division Multiple OFDMA Orthogonal Frequency-Division Multiple Access OSI Open Systems Interconnection PDA Personal Digital Assistant PDF Probability Density Function POD Probability of Detection PSD Power Spectral Density PSK Phase Shift Keying PSM Power-Saving Mode PSO Particle Swarm Optimization PU Primary User QAM Quadrature Amplitude Modulation QoS Quality of Service RCM Reliable Communication Mode
xviii
RKRL Radio Knowledge Representation Language ROC Receiver Operating Characteristics SDF Soft Data Fusion SDR Software Defined Radio SEM Spectrally-Efficient Mode SINR Signal to Interference and Noise Power SNR Signal-to-Noise Ratio SOF Single-Objective Function SOGA Single-Objective Genetic Algorithm SPTF Spectrum Policy Task Force SU Secondary User THR CRN Throughput TPC Total Power Consumption TS Test Statistic TSP Travelling Salesman Problem TVWS TV While Space UHF Ultra High Frequency UMTS Universal Mobile Telecommunications System UNII Unlicensed National Information Infrastructure UWB Ultrawide Band VHF Very High Frequency WLAN Wireless Local Area Network WRAN Wireless Regional Area Network XG neXt Generation

xix
LIST OF SYMBOLS
dP Given probability of detection
fP Given probability of false alarm β Given threshold setting
2Sσ Variance of PU signal
2
,iWσ Variance of white noise of ith PU-SU link
2iδ Variance of white noise of ith SU-CH link
RiP Relay power of ith SU
0µ
Means vector of all SU observations under H0 hypothesis
1µ
Means vector of all SU observations under H1 hypothesis ω
Weighting coefficients vector
(.)E Expected value operator var(.) Variance operator Qf,j CRN-noise probability of false alarm within the jth cluster Qd,j CRN-noise probability of detection within the jth cluster Q(.) Q-function operator
n||.|| n-norm operator of a given vector
0H∑
Covariance matrix under hypothesis H0
1H∑ Covariance matrix under hypothesis H1
σ Elasticity between the single-objective functions
2md Modified Deflection Coefficient (MDC)
xx
2nd Normal Deflection Coefficient
Rn Normal Deflection Coefficient B Sensed bandwidth BWSU-FC link Channel bandwidth of the SU-FC link C(t) Offspring population CCBmax Maximum available control channel bandwidth CFDmax Maximum possible fidelity diag(.) Diagonal operator maps vector elements to a diagonal matrix Eb Energy per bit elite Elitism rate FBLM Objective function under balanced mode (BLM) FPSM Objective function under power-saving mode (PSM) FRCM Objective function under reliable communication mode (RCM) FSEM Objective function under spectrally-efficient mode (SEM) Freuse Frequency reuse factor fs Sampling frequency gi Gain of ith PU-SU channel hi Gain of ith SU-CH channel Gr CR receiving antenna gain Gt CR transmit antenna gain H0 Hypothesis of PU is absent H1 Hypothesis of PU is present j cluster index K Sensing time period

xxi
Ln Number of subcarriers m Number of cooperated SUs mopt Optimal number of collaborated SUs M Total number of existing SU Md Modulation index Mj Number of SUs into the jth cluster N Normal distribution n Number of single objective functions N Magnitude of the noise power in decibels N0 Noise power spectral density nbits Total number of bits per chromosomes ngene Total number of generations Ni Noise of the ith SU-FC Channel Nvar Number of dimensions of the optimization problem P(H0) Probability of the PU being inactive in a given band P(H1) Probability of the PU being active in a given band P(t) Random population of the tth generation Pc crossover rate Pd Probability of detection Pm Probability of missing detection Pf Probability of false alarm Pe Total probability of sensing error PL Path Loss pops Size of chromosomes population Pr Total power required to relay sensing measurements
xxii
Qd The CRN-wise probability of detection Qf The CRN-wise probability of false alarm R0 CRN throughput under H0 R1 CRN throughput under H1 Rb Bit rate Rn Normalized CRN throughput Rs Symbol rate S(f , α) Spectral correlation function S[n] PU discrete signal SINRmax Maximum score of SINR SNRi SNR at the ith SU receiver T Transpose operator of a vector Td SU Data transmission time Tf Total frame duration THRmax Maximum achievable throughput of the CRN TPCmax Maximum power consumption Tr Total relay time from SU to BS through CH Ts spectrum sensing time period u Number of quantization bits per sample v Number of bits per symbol W Transmission bandwidth wi Weighting coefficient of the ith class of objective functions Wi[n] The ith SU-PU sensing channel discrete noise X(f ) Auto-correlation function
xxiii
Xi[n] Discrete received sensing measurement by the ith SU Yi Energy estimate of received measurement by the ith SU Zg Global decision constructed at the fusion centre Zi Sensing decision made at the output of the decision maker of ith SU α Cyclic frequency β Threshold value ξ Spectral efficiency of a modulation scheme
CHAPTER I
INTRODUCTION
1.1 BACKGROUND
In the past decade, cognitive radio (CR) has been proposed as an innovative paradigm
for enabling efficient spectrum utilization, providing more reliable wireless services,
mitigating harmful interference, and facilitating convergence for different wireless
networks. CR systems are distinguished by distinct features include “awareness”,
“sensing”, “learning”, and “adaptation” (Arslan 2007). Because of such attributes, CR
could be used in niche applications such as emergency management, disaster
recovery, fire services, search and rescue, crime prevention, and various military
applications. In fact, today’s demands and future ambitions have convinced the
researchers and developers that CR would drive the future of wireless
communications. For instance, in emergency situations where certain areas might be
out-of-service for cellular phones, if a cellular phone becomes cognitive enough, the
CR user can then dial an emergency call by exploiting any existing radio
infrastructure (such as satellite networks) and technologies (such as beamforming) to
any nearby rescue unit. The CR technology aims, at its ultimate goals, to solve the so-
called interoperability problem through realizing wireless networks that could have
high level of coordination, cooperation, and compatibility. Aside from public safety
applications, the development of CR technologies could generate huge revenue for
governments and industry by, for example, permitting CR users or secondary users
(SUs) to access unused TV broadcast bands. In fact, IEEE802.22 wireless regional
area network (WRAN) will be the first worldwide CR-based standard for
2
opportunistic access of the (54-862 MHz) TV bands (Xiao & Hu 2009). Such efficient
utilization of spectrum is critically important for progressive development of next
generation wireless communications.
In the reminder of this chapter, current spectrum regulations and their
emerging problems are briefly discussed. Then, an introduction to CR is formally
introduced being a potential solution to overcome the problems of current spectrum
regulations. As a critical function of CR, spectrum sensing is also explained in short.
The preceding sections pave the road to the presented problem statement (and research
motivation) of the thesis. Then, the research objectives, contributions, and overview of
thesis organization are all stated.
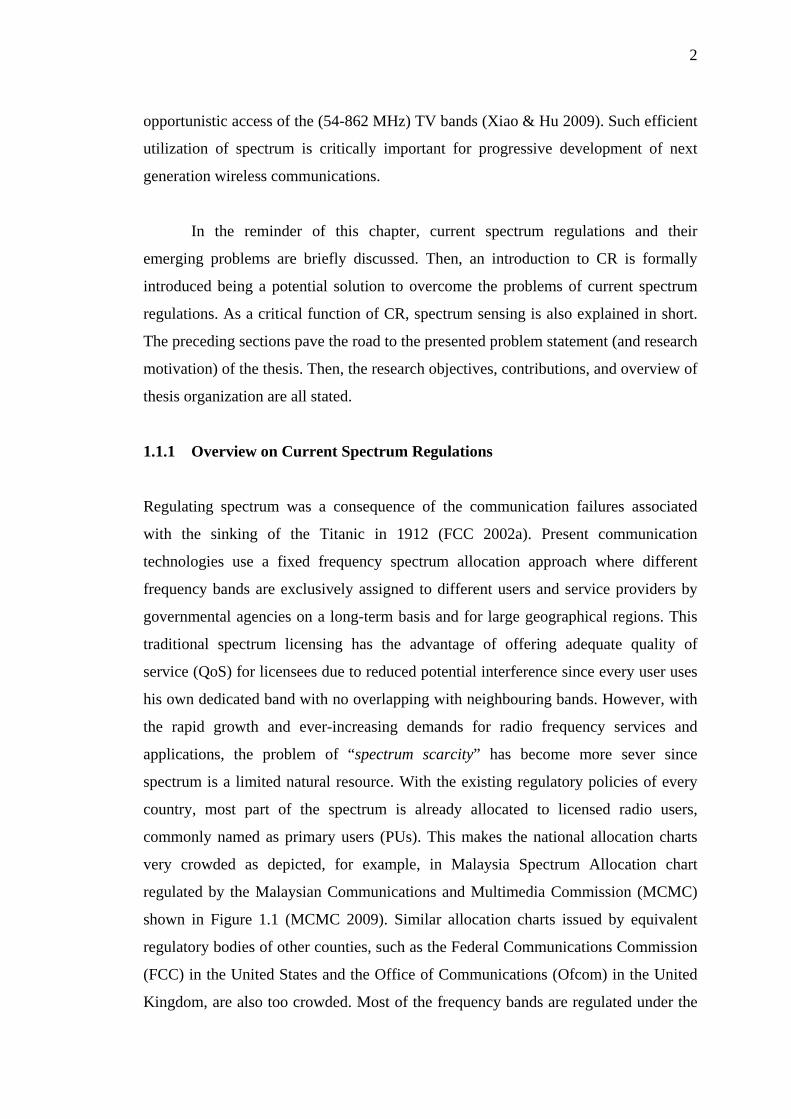
1.1.1 Overview on Current Spectrum Regulations
Regulating spectrum was a consequence of the communication failures associated
with the sinking of the Titanic in 1912 (FCC 2002a). Present communication
technologies use a fixed frequency spectrum allocation approach where different
frequency bands are exclusively assigned to different users and service providers by
governmental agencies on a long-term basis and for large geographical regions. This
traditional spectrum licensing has the advantage of offering adequate quality of
service (QoS) for licensees due to reduced potential interference since every user uses
his own dedicated band with no overlapping with neighbouring bands. However, with
the rapid growth and ever-increasing demands for radio frequency services and
applications, the problem of “spectrum scarcity” has become more sever since
spectrum is a limited natural resource. With the existing regulatory policies of every
country, most part of the spectrum is already allocated to licensed radio users,
commonly named as primary users (PUs). This makes the national allocation charts
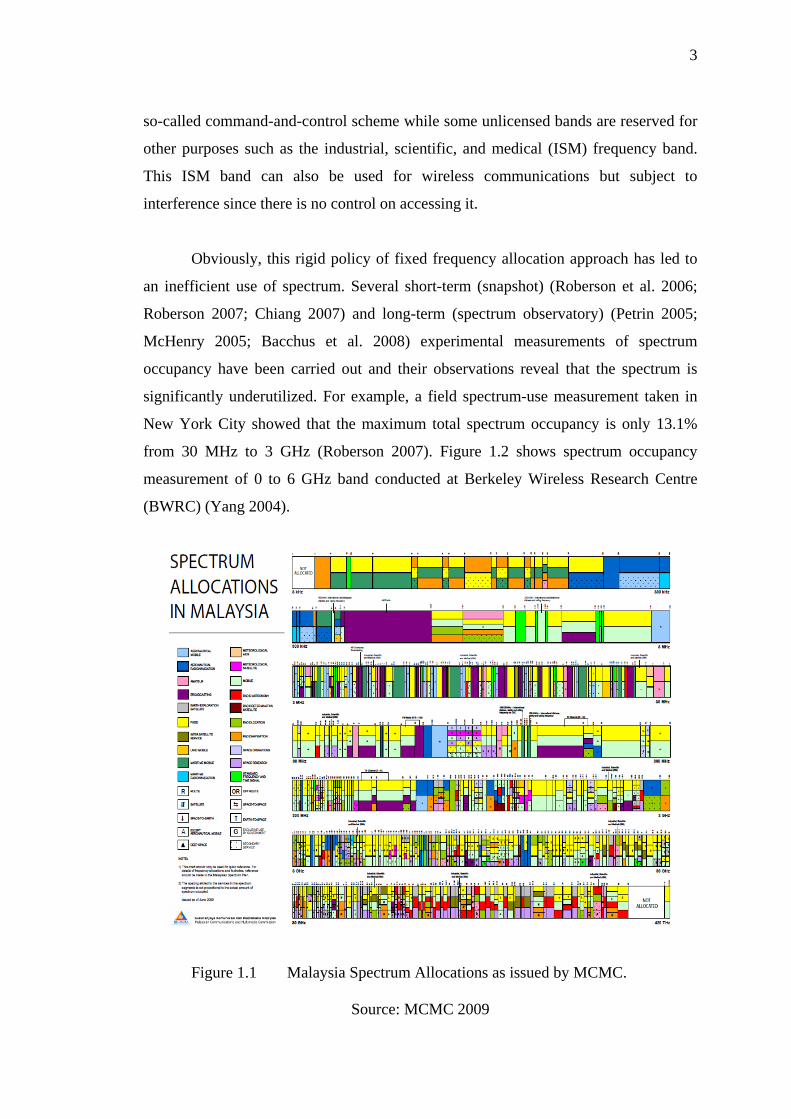
very crowded as depicted, for example, in Malaysia Spectrum Allocation chart
regulated by the Malaysian Communications and Multimedia Commission (MCMC)
shown in Figure 1.1 (MCMC 2009). Similar allocation charts issued by equivalent
regulatory bodies of other counties, such as the Federal Communications Commission
(FCC) in the United States and the Office of Communications (Ofcom) in the United
Kingdom, are also too crowded. Most of the frequency bands are regulated under the
3
so-called command-and-control scheme while some unlicensed bands are reserved for
other purposes such as the industrial, scientific, and medical (ISM) frequency band.
This ISM band can also be used for wireless communications but subject to
interference since there is no control on accessing it.
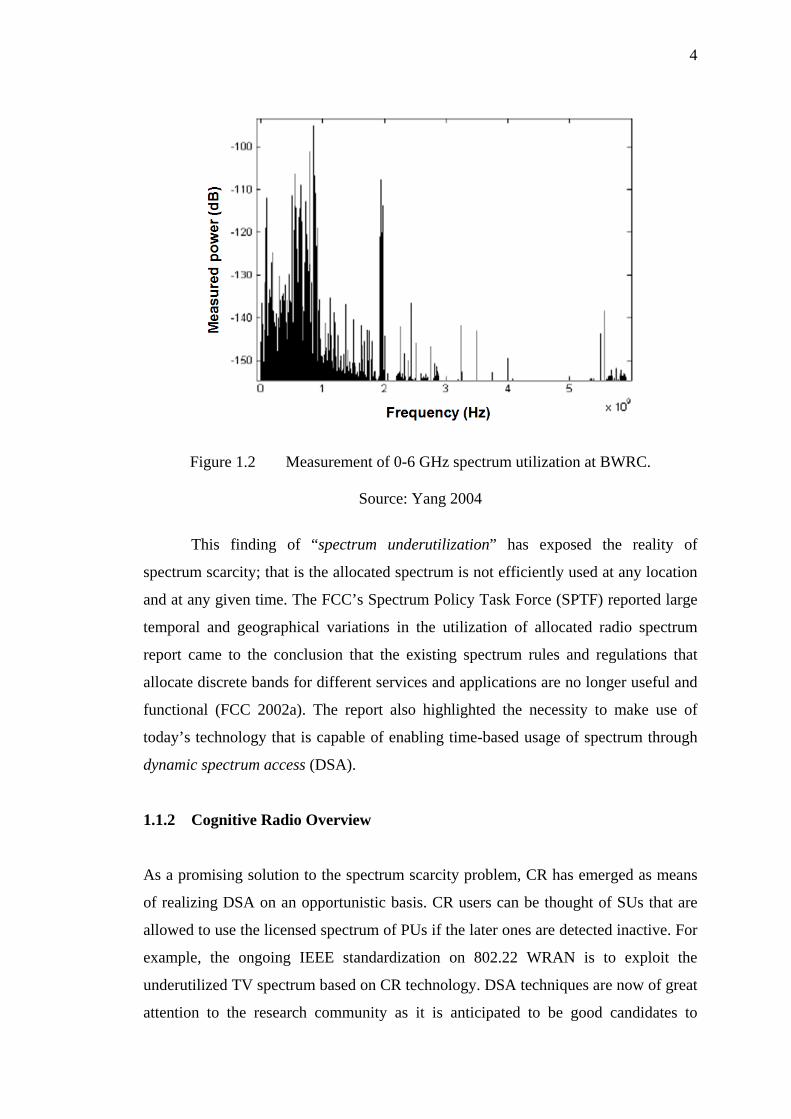
Obviously, this rigid policy of fixed frequency allocation approach has led to
an inefficient use of spectrum. Several short-term (snapshot) (Roberson et al. 2006;
Roberson 2007; Chiang 2007) and long-term (spectrum observatory) (Petrin 2005;
McHenry 2005; Bacchus et al. 2008) experimental measurements of spectrum
occupancy have been carried out and their observations reveal that the spectrum is
significantly underutilized. For example, a field spectrum-use measurement taken in
New York City showed that the maximum total spectrum occupancy is only 13.1%
from 30 MHz to 3 GHz (Roberson 2007). Figure 1.2 shows spectrum occupancy
measurement of 0 to 6 GHz band conducted at Berkeley Wireless Research Centre
(BWRC) (Yang 2004).
Figure 1.1 Malaysia Spectrum Allocations as issued by MCMC.
Source: MCMC 2009
4
Figure 1.2 Measurement of 0-6 GHz spectrum utilization at BWRC.
Source: Yang 2004
This finding of “spectrum underutilization” has exposed the reality of
spectrum scarcity; that is the allocated spectrum is not efficiently used at any location
and at any given time. The FCC’s Spectrum Policy Task Force (SPTF) reported large
temporal and geographical variations in the utilization of allocated radio spectrum
report came to the conclusion that the existing spectrum rules and regulations that
allocate discrete bands for different services and applications are no longer useful and
functional (FCC 2002a). The report also highlighted the necessity to make use of
today’s technology that is capable of enabling time-based usage of spectrum through
dynamic spectrum access (DSA).
1.1.2 Cognitive Radio Overview
As a promising solution to the spectrum scarcity problem, CR has emerged as means
of realizing DSA on an opportunistic basis. CR users can be thought of SUs that are
allowed to use the licensed spectrum of PUs if the later ones are detected inactive. For
example, the ongoing IEEE standardization on 802.22 WRAN is to exploit the
underutilized TV spectrum based on CR technology. DSA techniques are now of great
attention to the research community as it is anticipated to be good candidates to
5
replace the traditional approach of fixed spectrum allocation that is no longer able to
cope up with user’s requirements of contemporary communication systems.
Although the term “cognitive radio” was first formulated by Joseph Mitolla III
in 1990s (Mitola III & Maguire 1999; Mitola III 2000), there has been however no
commonly agreed definition for CR. The reason behind this lies on that different
researchers or institutes have distinct views on CR. Mitola described the CR as a
decision-making layer at which “wireless personal digital assistants and the related
networks were sufficiently computationally intelligent about radio resources, and
related computer-to-computer communications, to detect user needs as a function of
use context, and to provide radio resources and wireless services most appropriate to
those needs” (Mitola III & Maguire 1999; Mitola III 2000). Later on, the term
“cognitive radio” was defined by Haykin (2005) as follows: “Cognitive radio is an
intelligent wireless communication system that is aware of its surrounding
environment (i.e., outside world), and uses the methodology of understanding-by-
building to learn from the environment and adapt its internal states to statistical
variations in the incoming RF stimuli by making corresponding changes in certain
operating parameters (e.g., transmit-power, carrier frequency, and modulation
strategy) in real-time, with two primary objectives in mind: highly reliable
communication whenever and wherever needed; efficient utilization of the radio
spectrum”. On the other hand, the US Federal Communications Commission (FCC)
defined CR as “a radio that can change its transmitter parameters based on
interaction with the environment in which it operates. The majority of cognitive radios
will probably be SDRs (Software Defined Radios), but neither having software nor
being field programmable are requirements of a cognitive radio” (FCC 2003).
However, some entities are actually in process of standardizing the CR-related
concepts. In fact, FCC’s and Haykin’s views are simplified forms of Mitola’s vision
where only radio spectrum circumstances are taken into account while making a
decision on future transmission parameters. Thus, it is concluded that the original CR
concept of Mitola has been reduced in scope to a radio that efficiently utilizes
spectrum, looks for spectrum opportunities, and its adaptation process is limited to the
physical layer (Wyglinski et al. 2010).
6
Since there are distinct definitions for CR as was mentioned, there are also
different sets of cognitive capabilities and functions introduced by different
researchers and organizations. To overcome this ambiguity of CR definitions and thus
their corresponding capabilities, Simon Haykin’s definition of CR will be considered
throughout this thesis. In addition to limiting the scope of Mitola’s CR definition to an
efficient spectrum utilization-oriented system, Haykin (2005) also modified the basic
cognition cycle introduced by Mitola (1999). Surprisingly, according to ISI Web of
Science, as of October 2011, Haykin’s article (2005) which was published in the IEEE
Journal on Selected Areas in Communications in 2005 has been cited 1,661 times
whereas the original Mitola’s article on CR (1999) has been cited 944 times only
though it was published in 1999. Obviously, this is because Mitola’s full CR, which
takes into account every possible observable parameter and uses a large set of
adaptable parameters, is very much complex and not expected to be realized in the
near future. The research community is more interested in spectrum-sensing CR due
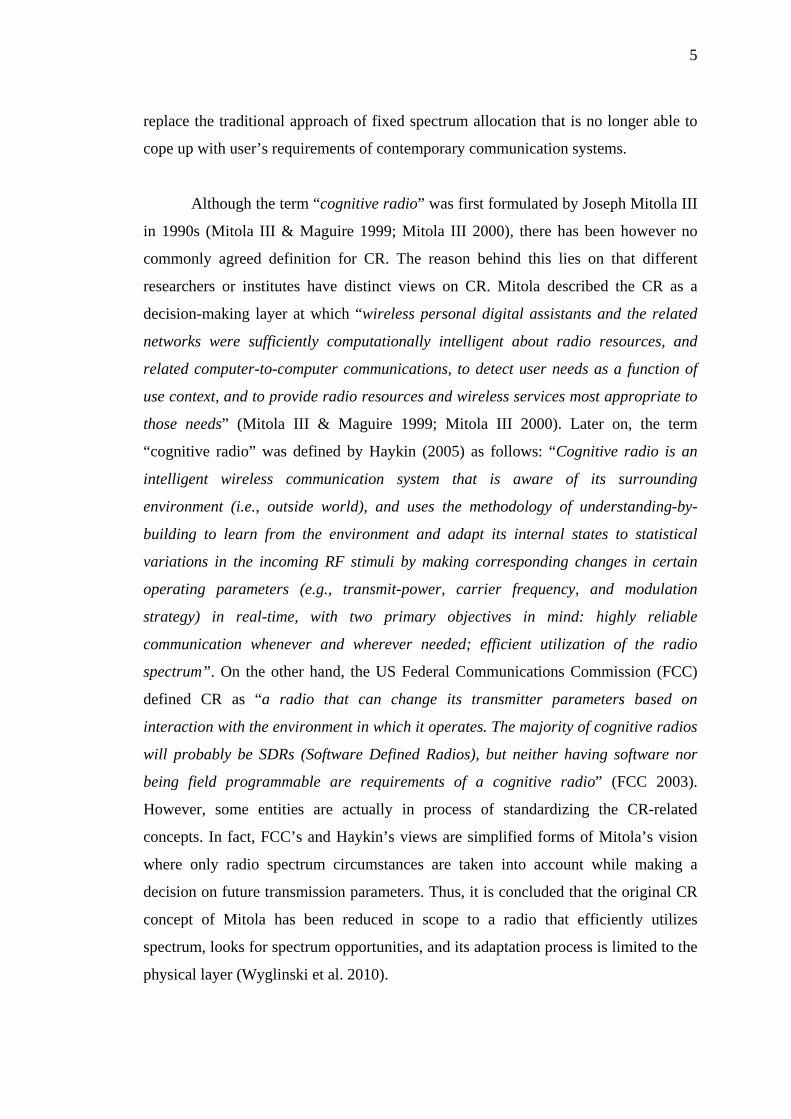
to its commercial and technical feasibility. A simple architecture of Haykin’s CR
vision can be depicted in Figure 1.3. The CR system comprises an intelligent core that
could interact periodically with surrounding wireless environment by processing
certain set of observation parameters and formulating optimal set of transmission
parameters whereby user’s requirements are also taken into account.
Figure 1.3 Simple CR system architecture

7
In comparison with CR, the traditional radio systems and wireless
communication networks, starting from 1897 when Guglielmo Marconi devised the
wireless telegraph and up to the current advances of third (wideband) and fourth
(broadband) generations, are obviously very limited in terms of cognition
functionality as their behaviours are mostly predefined by manufacturers and their
performance cannot be autonomously improved as in the case of CR. With the
emergence of CR technology, there should be consequent conceptual transitions
(Haykin 2005) that can be briefly summarized in Table 1.1. As was clearly stated in
(Mitola III & Maguire 1999), software defined radio (SDR) provides feasible platform
for CR implementations. It is believed that CR will evolve from the present SDR
infrastructure by incorporating more cognition attributes such as self-awareness,
learning capability, and autonomous adaption. However, there are some other
concerns that need to be clarified; for instance, one might ask why a PU should agree
to allow a CR user to opportunistically access its licensed band? Reasons for such
agreement might be concisely listed as (Wyglinski et al. 2010; Molisch 2011)
(i) Regulatory policy: the national regulator might mandate that specific bands can
be accessed by CR users as long as they do not cause harmful interference to PUs.
(ii) Profit: PUs (license-holders) might be able to charge SUs (CR users).
(iii)Emergency services: in cases of emergency, CR-based services might make use
of any existing PU infrastructure and bands.
In fact, a good analogy can be made between spectrum and country land;
consider a house owner (PU) who has decided to leave the country (spectrum) for
certain period, say on business trip. In this case, a question appears whether the owner
should rent his house (licensed band) for a tenant (CR user) or simply leave it vacant.
In this scenario, the house owner does not need to notify his developer (spectrum
regulator) on this. Another scenario is when there are polices allow the developer to
unconditionally make use of the house as soon as it was empty, perhaps to house a
foreign visitor. The difference between the two scenarios lies on whether or not the
intervention of regulatory body is appropriate. It basically depends on the “philosophy
of spectrum ownership” of a country whether ownership means full property rights or
limited property rights for PUs or license-holders.
8
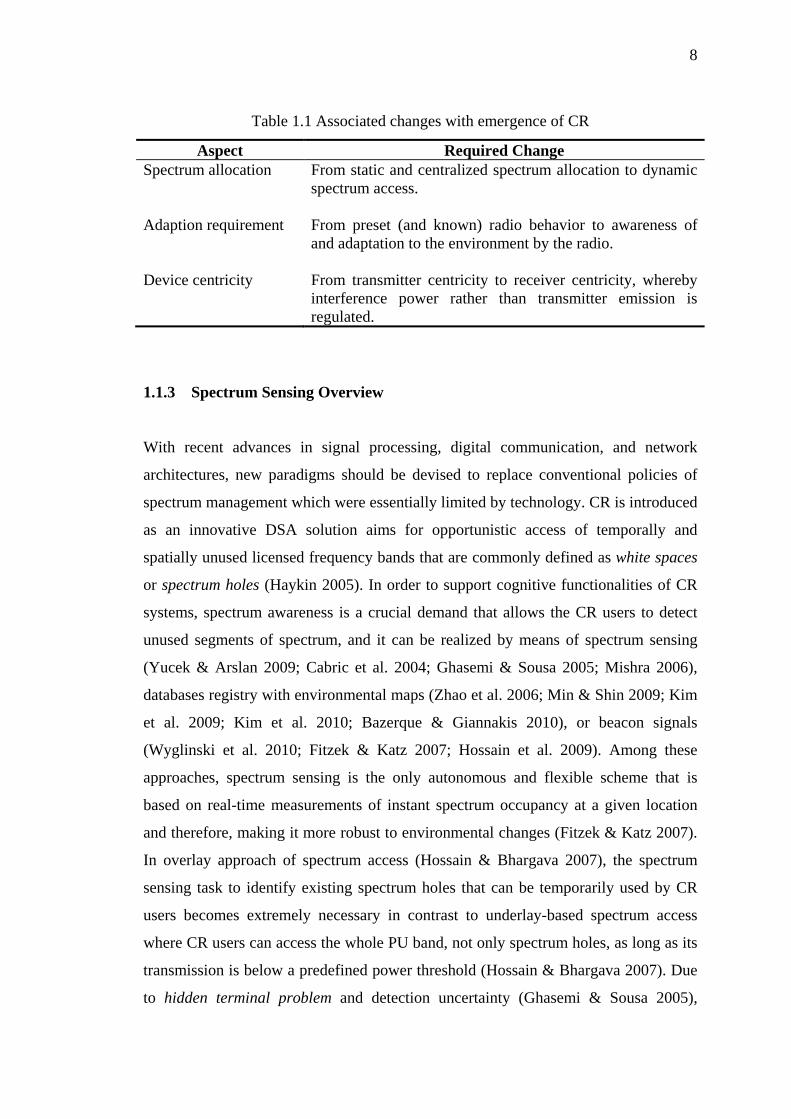
Table 1.1 Associated changes with emergence of CR
Aspect Required Change Spectrum allocation From static and centralized spectrum allocation to dynamic
spectrum access.
Adaption requirement From preset (and known) radio behavior to awareness of and adaptation to the environment by the radio.
Device centricity From transmitter centricity to receiver centricity, whereby interference power rather than transmitter emission is regulated.
1.1.3 Spectrum Sensing Overview
With recent advances in signal processing, digital communication, and network
architectures, new paradigms should be devised to replace conventional policies of
spectrum management which were essentially limited by technology. CR is introduced
as an innovative DSA solution aims for opportunistic access of temporally and
spatially unused licensed frequency bands that are commonly defined as white spaces
or spectrum holes (Haykin 2005). In order to support cognitive functionalities of CR
systems, spectrum awareness is a crucial demand that allows the CR users to detect
unused segments of spectrum, and it can be realized by means of spectrum sensing
(Yucek & Arslan 2009; Cabric et al. 2004; Ghasemi & Sousa 2005; Mishra 2006),
databases registry with environmental maps (Zhao et al. 2006; Min & Shin 2009; Kim
et al. 2009; Kim et al. 2010; Bazerque & Giannakis 2010), or beacon signals
(Wyglinski et al. 2010; Fitzek & Katz 2007; Hossain et al. 2009). Among these
approaches, spectrum sensing is the only autonomous and flexible scheme that is
based on real-time measurements of instant spectrum occupancy at a given location
and therefore, making it more robust to environmental changes (Fitzek & Katz 2007).
In overlay approach of spectrum access (Hossain & Bhargava 2007), the spectrum
sensing task to identify existing spectrum holes that can be temporarily used by CR
users becomes extremely necessary in contrast to underlay-based spectrum access
where CR users can access the whole PU band, not only spectrum holes, as long as its
transmission is below a predefined power threshold (Hossain & Bhargava 2007). Due
to hidden terminal problem and detection uncertainty (Ghasemi & Sousa 2005),
9
cooperative spectrum sensing (CSS) (Akyildiz et al. 2011; Yücek & Arslan 2009),
where multiple CR users of specific geographical collaborate, is widely proposed as a
key concept to improve PU detectability in cognitive radio networks (CRNs). CSS can
be realized by means of centralized (Ganesan & Li 2005; Visotsky et al. 2005) or
distributed (Tang 2005; Ahmed et al. 2006) architectures. Distributed sensing has an
advantage in the sense that it does not require a backbone infrastructure. However, the
concept of distributed cooperation where multiple CR terminals have to communicate
among themselves might not be attractive to the CR goals and functionalities due to
the increased cooperation overhead during the detection cycle. To reduce the
cooperation overhead, there have been studies proposed where CR users might only
share their 1-bit sensing decisions among themselves (Tang 2005). However, this
approach has been proven to be inferior to soft/data fusion schemes (Ganesan & Li
2005; Visotsky et al. 2005). Also, distributed sensing performs poorly in shadowing
environments and scenarios of hidden node problem (Krenik & Batra 2005) where CR
users might not be able to receive sensing measurements or decisions from other
neighbours, resulting in a sub-optimal knowledge of channel occupancy. Thus,
centralized sensing can be considered as a good candidate that suits network-wide
optimization though it requires infrastructural deployments (Hossain & Bhargava
2007).
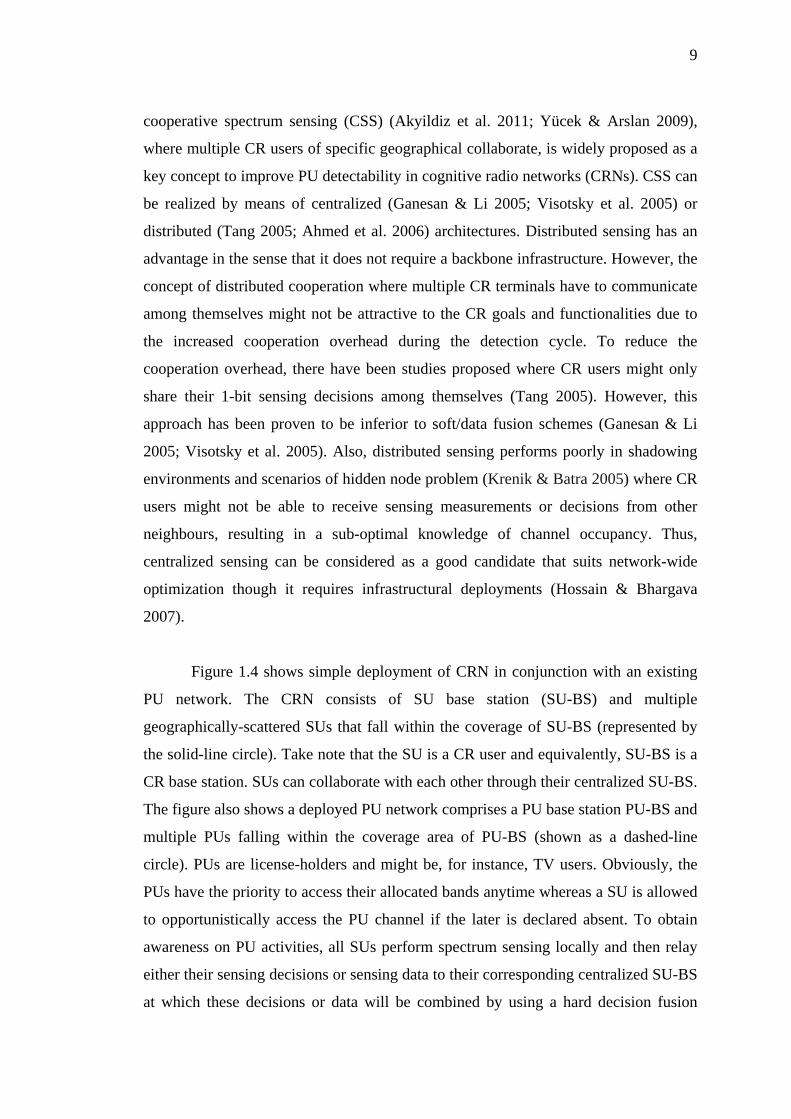
Figure 1.4 shows simple deployment of CRN in conjunction with an existing
PU network. The CRN consists of SU base station (SU-BS) and multiple
geographically-scattered SUs that fall within the coverage of SU-BS (represented by
the solid-line circle). Take note that the SU is a CR user and equivalently, SU-BS is a
CR base station. SUs can collaborate with each other through their centralized SU-BS.
The figure also shows a deployed PU network comprises a PU base station PU-BS and
multiple PUs falling within the coverage area of PU-BS (shown as a dashed-line
circle). PUs are license-holders and might be, for instance, TV users. Obviously, the
PUs have the priority to access their allocated bands anytime whereas a SU is allowed
to opportunistically access the PU channel if the later is declared absent. To obtain
awareness on PU activities, all SUs perform spectrum sensing locally and then relay
either their sensing decisions or sensing data to their corresponding centralized SU-BS
at which these decisions or data will be combined by using a hard decision fusion
10
(HDF) scheme or a soft data fusion (SDF) scheme, respectively, implemented at a
fusion centre (FC). The FC makes a global decision on the existence of PU and SU-
BS will then instruct its corresponding SUs whether or not to use the sensed band
based on that decision. This collaboration among SUs aims at reliable detection of PU
in order to reduces potential interference to it. This sensing activity is a crucial task to
enable success to CR technology since maintaining good QoS to PU is a must.
Therefore, the sensing activity has to be periodically repeated to keep monitoring the
PU availability using an appropriate duty cycle. The cooperative spectrum sensing is
proposed to overcome the hidden terminal problem where local sensing by a single
SU might fail to detect an active PU as a result on an existing obstacle shadowing the
transmission of the PU-BS as shown on the link labelled as (1) in Figure 1.4. The
cooperation between multiple SUs is also justified by being a means to have spatial
diversity and mitigate degradation of detection performance due to potential poor
quality of SU to SU-BS links as shown on the link labelled as (2) in the figure. This
deployment of CRN represents a centralized architecture for spectrum sensing. In
distribute architectures, the collaboration between SUs on sensing decisions or data is
realized by means of ad-hoc networks.
Figure 1.4 Simple deployment of CRN in conjunction with existing PU network
11
1.2 PROBLEM STATEMENT
Since the license-holder or PU has the priority for unconstraint access of its allocated
frequency band, the users’ collaboration in CSS-based CRNs is performed with an
essential aim of maximizing spectral efficiency in one hand, but on the other hand,
maintaining low level of potential interference to PU. However, these two objectives
are unfortunately contradictory. This is because increasing the CRN throughput, to
maximize the overall spectral efficiency, makes the PU less protected against possible
SU interfering signals whereas too much unnecessary protection for PU limits the
chances of CRN to conditionally access exiting spectrum holes. Thus, this
contradiction necessitates an algorithm that could jointly optimize these two
conflicting objectives so that a balanced compromise between them is attained.
Another issue needs to be addressed is on how to settle the detection-overhead
tradeoff. In CRNs, the PU detection has to be maximized so that the PU becomes
more protected from SU potential transmission. The PU detection performance can be
significantly improved by means of cooperation among SUs. However, this
cooperation results in an increased communication overhead due to the relaying
activities between cooperated nodes. Thus, this SU cooperation improves the PU
detection performance but at the same time it causes an increased overhead leads to
wastage of spectral resources. This thesis handles this contradiction between the
detection performance and overhead requirements through different potential CRN
architectures that can be used for different operational conditions.
The third issue which will be addressed in this thesis is on the adaptability
requirement of CR systems. A CR system is supposed to behave autonomously in
response to environmental changes based on user requirements and/or performance
priorities. To support the cognition capabilities of a CR system, an intelligent decision
engine that could perform multiple optimization tasks for different design objectives
should be implemented. Unfortunately, the contradiction is again expected and still a
major concern. For example, if a CR system aims to transmit with high throughput
and low error performance at the same time, a question appears here about how this
CR system can optimize these two conflicting objectives simultaneously. Also, CR
12
system should be able to know the type of transmission (modulation) format that
should be autonomously used in order to enhance the spectral efficiency which is the
cornerstone objective of CR technology.
This thesis provides solutions to the three main issues mentioned above.
Firstly, in order to jointly optimize the CRN throughput and PU protection, a
Neyman-Pearson approach has been used to maximize the PU detection performance
for constant CRN throughput. The detection performance is characterized by CRN-
wise detection probability whereas the CRN throughput is formulated in terms of the
CRN-wise false alarm probability. Thus, the confliction nature between the CRN
throughput and PU protection is formulated as a constrained optimization problem of
maximizing the CRN-wise probability of detection for a given CRN-wise false alarm
probability. This optimization problem of maximizing the detection performance sets
the motivation to look for potential CRN architectures that can satisfy this objective.
Unfortunately, maximizing the detection performance, through cooperation, results in
an increased communication overhead due to relaying activities among cooperated
SUs.
In order to entertain the second issue mentioned above, three distinct CRN
architectures have been proposed and developed to provide diverse options of
deployments to satisfy different requirements of PU detection performance and
communication overhead. These three architectures are for HDF-based CRNs, SDF-
based CRNs, and hybrid SDF-HDF cluster based CRNs. The operational requirements
at which each of these CRN architectures can be used are presented in Table 1.2. The
proposed CRNs are based on centralized CSS-based architectures where SUs send
their sensing decisions/data to a fusion centre located at a central BS. The proposed
HDF-based CRNs can be used when low overhead communication is required while
PU detection performance is moderate. On the other hand, SDF-based CRNs is used
when high PU detection performance is needed despites an increased overhead. SDF-
based CRNs show better PU detection performance than HDF-based CRNs since the
measurements data carry more informative content than the 1-bit decisions of the
HDF-based CRNs upon fusion. On the other hand, the HDF-based CRN requires
lesser data to be reported from SUs to FC than SDF-based CRNs and therefore has a
13
reduced traffic overhead. The hybrid SDF-HDF cluster-based CRN can be used when
balanced compromise of detection performance and traffic overhead is demanding.
The three architectures employ multi-objective evolutionary algorithms (MOEAs)
based on genetic algorithms (GAs) to optimize the performance metrics of CRNs. The
third issue of adaption requirement for CR systems is also resolved by proposing a
MOEA decision engine that could be envisioned as an intelligent core that processes
sensed parameters and provides adequate transmission options under predefined
conditions and design objectives.
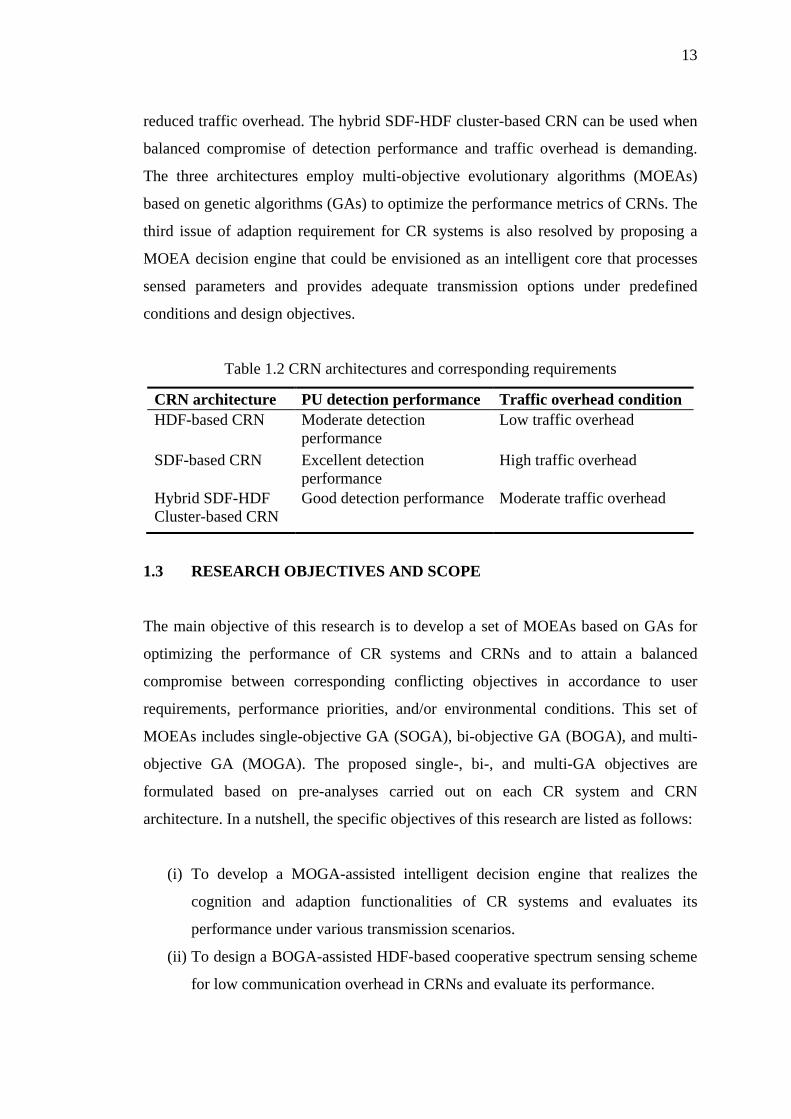
Table 1.2 CRN architectures and corresponding requirements
CRN architecture PU detection performance Traffic overhead condition HDF-based CRN Moderate detection
performance Low traffic overhead
SDF-based CRN Excellent detection performance
High traffic overhead
Hybrid SDF-HDF Cluster-based CRN
Good detection performance Moderate traffic overhead
1.3 RESEARCH OBJECTIVES AND SCOPE
The main objective of this research is to develop a set of MOEAs based on GAs for
optimizing the performance of CR systems and CRNs and to attain a balanced
compromise between corresponding conflicting objectives in accordance to user
requirements, performance priorities, and/or environmental conditions. This set of
MOEAs includes single-objective GA (SOGA), bi-objective GA (BOGA), and multi-
objective GA (MOGA). The proposed single-, bi-, and multi-GA objectives are
formulated based on pre-analyses carried out on each CR system and CRN
architecture. In a nutshell, the specific objectives of this research are listed as follows:
(i) To develop a MOGA-assisted intelligent decision engine that realizes the
cognition and adaption functionalities of CR systems and evaluates its
performance under various transmission scenarios.
(ii) To design a BOGA-assisted HDF-based cooperative spectrum sensing scheme
for low communication overhead in CRNs and evaluate its performance.
14
(iii) To devise a SOGA-assisted SDF-based cooperative spectrum sensing scheme
for high detection performance in CRNs and evaluate the performance of the
proposed scheme against other conventional SDF-based schemes.
(i) To propose a MOGA-assisted hybrid SDF-HDF cluster-based cooperative
spectrum sensing scheme for balanced compromise between detection
performance and traffic overhead in CRNs and analyze its performance under
different operational modes.
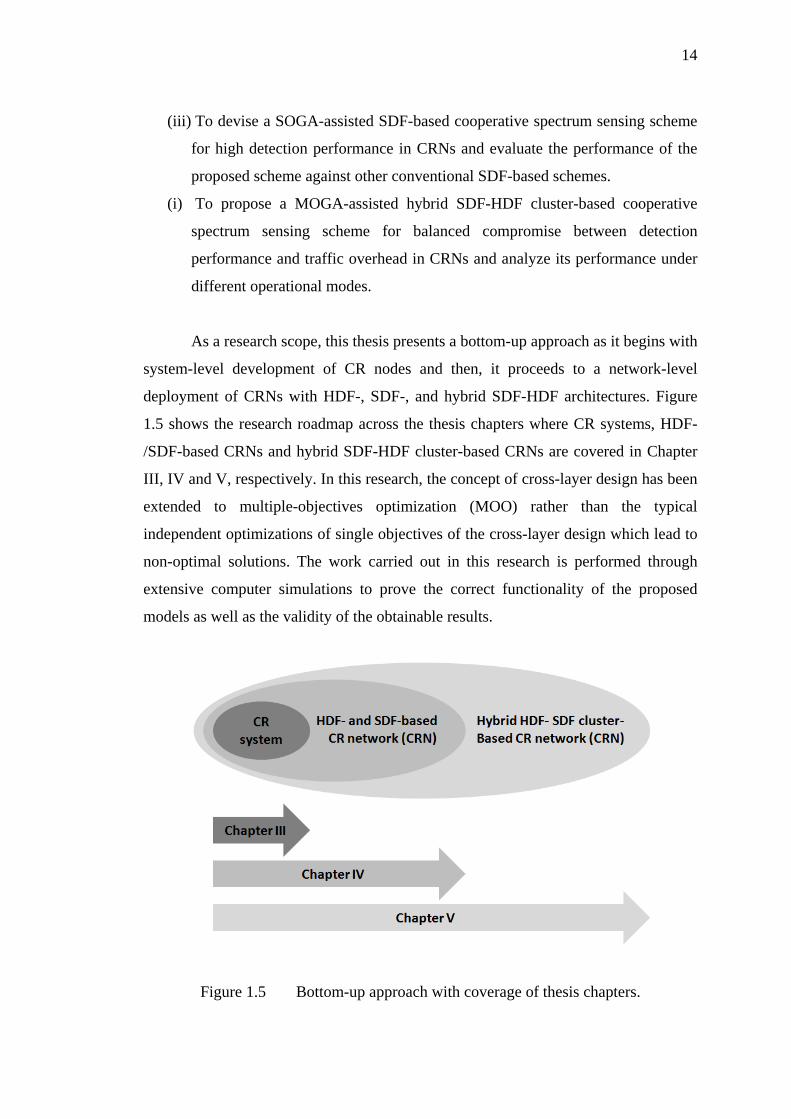
As a research scope, this thesis presents a bottom-up approach as it begins with
system-level development of CR nodes and then, it proceeds to a network-level
deployment of CRNs with HDF-, SDF-, and hybrid SDF-HDF architectures. Figure
1.5 shows the research roadmap across the thesis chapters where CR systems, HDF-
/SDF-based CRNs and hybrid SDF-HDF cluster-based CRNs are covered in Chapter
III, IV and V, respectively. In this research, the concept of cross-layer design has been
extended to multiple-objectives optimization (MOO) rather than the typical
independent optimizations of single objectives of the cross-layer design which lead to
non-optimal solutions. The work carried out in this research is performed through
extensive computer simulations to prove the correct functionality of the proposed
models as well as the validity of the obtainable results.
Figure 1.5 Bottom-up approach with coverage of thesis chapters.
15
1.4 RESEARCH CONTRIBUTIONS
The contributions of this research can be categorized into three distinct classes;
analytical studies, formalisms, algorithms and tools. The details of these contributions
can be addressed as follows:
(a) Analytical studies: In order to develop the objective function(s) for the proposed
CRN deployments as well as for CR systems, several analytical studies and computer
simulations have been performed. These analytical studies set a good foundation of
presenting the interrelationships between multitudes of performance metrics and
design parameters. These studies can be summarized in point form as follows:
(i) Performance metrics and Pareto-front analysis for CR systems.
(ii) Tradeoff analysis for HDF-based CRNs.
(iii) Comparative analysis for SDF-based CRNs.
(iv) Tradeoff analysis for hybrid HDF-SDF cluster-based CRNs.
(b) Formalisms: In this research, mathematical derivations for certain performance
metrics, such as PU detectability performance, have been carried out. Also, complete
single-, double-, and multi-objective formalisms for the proposed CRN deployments
and CR systems have been developed as needed. These formalisms include the
following outcomes:
(i) Multi-objective fitness function (MOF) for CR systems.
(ii) Bi-objective function (BOF) for HDF based CRNs.
(iii) Single-objective function (SOF) for SDF based CRNs.
(iv) Multi-objective function (MOF) for hybrid SDF-HDF cluster based CRNs.
(c) Algorithms: In this regard, GA-based optimization engines for CRN and CR
systems have been developed. These algorithms have been configured to suit the
optimization problems at hand and can be presented as follows:
(i) MOGA-based adaptive decision engine for CR systems.
(ii) BOGA-based optimization system for HDF-based CRNs.
(iii) SOGA-based weighting engine for linear SDF-based CRNs.
(iv) MOGA-based optimization system for hybrid SDF-HDF based CRNs.
16
(d) Tools: a graphical user interface simulation model (GUISM) is developed. It is a
friendly interactive tool that allows the user to interact with a MOGA optimization
system used for optimizing the MOF performance for a hybrid SDF-HDF cluster-
based CRN. The developed tool allows the user to vary the CRN settings including the
operational modes and search space of design parameters.
1.5 GENERAL METHODOLOGY
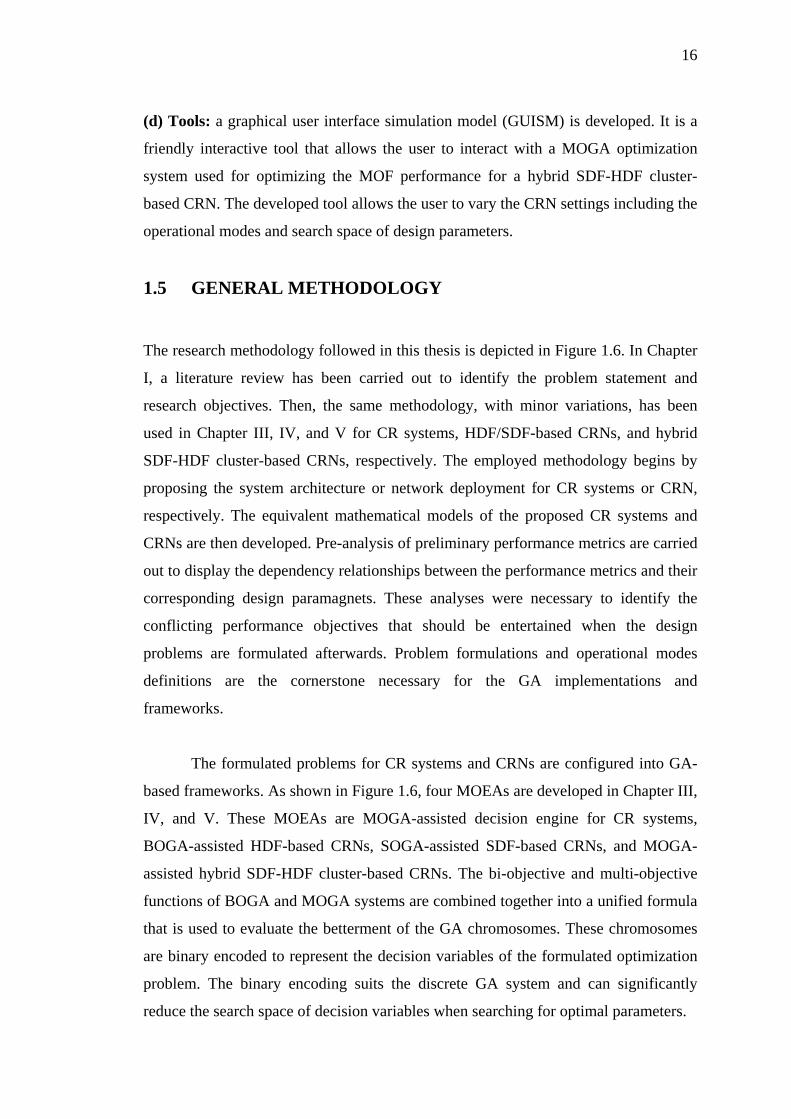
The research methodology followed in this thesis is depicted in Figure 1.6. In Chapter
I, a literature review has been carried out to identify the problem statement and
research objectives. Then, the same methodology, with minor variations, has been
used in Chapter III, IV, and V for CR systems, HDF/SDF-based CRNs, and hybrid
SDF-HDF cluster-based CRNs, respectively. The employed methodology begins by
proposing the system architecture or network deployment for CR systems or CRN,
respectively. The equivalent mathematical models of the proposed CR systems and
CRNs are then developed. Pre-analysis of preliminary performance metrics are carried
out to display the dependency relationships between the performance metrics and their
corresponding design paramagnets. These analyses were necessary to identify the
conflicting performance objectives that should be entertained when the design
problems are formulated afterwards. Problem formulations and operational modes
definitions are the cornerstone necessary for the GA implementations and
frameworks.
The formulated problems for CR systems and CRNs are configured into GA-
based frameworks. As shown in Figure 1.6, four MOEAs are developed in Chapter III,
IV, and V. These MOEAs are MOGA-assisted decision engine for CR systems,
BOGA-assisted HDF-based CRNs, SOGA-assisted SDF-based CRNs, and MOGA-
assisted hybrid SDF-HDF cluster-based CRNs. The bi-objective and multi-objective
functions of BOGA and MOGA systems are combined together into a unified formula
that is used to evaluate the betterment of the GA chromosomes. These chromosomes
are binary encoded to represent the decision variables of the formulated optimization
problem. The binary encoding suits the discrete GA system and can significantly
reduce the search space of decision variables when searching for optimal parameters.
17
The proposed MOEAs above are then evaluated through computer simulations
and the corresponding convergence performance of SOGA, BOGA, MOGA systems
is displayed and the obtainable solutions are recorded. Then, post-analysis is
performed to verify the optimality of the solutions obtained by the GA optimizations
and check whether or not these parameters provide the best operational performance
taking the fitness score as performance criteria. Finally, concluding remarks are drawn
and the research items are documented.
In Figure 1.6, the steps of thesis research methodology are mapped to their
corresponding chapters at which they are conducted. Most of these steps are further
explained and particularized in each chapter based on coverage and as needed. In
addition, detection performance and communication overhead tradeoffs between SDF-
based, HDF-based, and hybrid SDF-HDF cluster-based CRNs are also provided.
Figure 1.6 General methodology of research
18
1.6 THESIS ORGANIZATION
This thesis is organized as follows. Chapter II provides structured background on CR
concepts including, but not limited to, CR functions, spectrum sensing, cooperative
spectrum sensing, and CRN architectures. Also, the GA concepts, mechanisms,
operations, and parameters are all explained since the GA is the AI tool used in this
research for optimizing the performance of the CR systems and CRNs. Chapter II also
includes a survey in the literature on the applications of GAs on various CR aspects
such as adaption, spectrum allocation, and scheduling.
In Chapter III, the development of MOEA-assisted intelligent decision engine
is presented. The chapter begins by proposing the performance metrics of the CR
decision engine and analyzing the dependency relationships between these metrics and
their corresponding decision parameters (transmission parameters) to observe and
identify the conflicting objectives. This analysis is then used to develop the objective
functions that will be optimized by the MOEA-based decision engine under various
operational modes.
In Chapter V, the proposed HDF-based and SDF-based CRNs deployments are
presented. Then, the chapter provides equivalent mathematical models of the proposed
CRNs and performance metrics (i.e. objectives) are also developed. Pre-analysis is
performed to identify any existing conflicts between the proposed objectives. The
chapter also presents the fitness functions that are introduced to the GA-assisted FC at
the centralized BS. Evaluation and results discussions are also provided.
Chapter VI presents the proposed hybrid SDF-HDF cluster-based CRN.
Various pre-analysis simulations were carried out to identify potential conflicting
objectives. The proposed multi-objective fitness function is then introduced to the GA
optimization system whose performance is evaluated under various operational modes
and channel conditions. Finally post-analysis are conducted to verify the obtained
results. In Chapter VII, the conclusions are drawn and suggested future works are
listed.
CHAPTER II
LITERATURE REVIEW
2.1 INTRODUCTION
In this chapter, aspects of CR and, in particular, spectrum sensing are being discussed.
The chapter begins with providing an overview on CR including a brief description of
its evolution, capabilities, and potential applications. Then, various spectrum sensing
elements are presented. These elements include local sensing techniques, sensing
performance evaluation, sensing challenges and existing standards, cooperative
spectrum sensing, decisions and data fusion schemes, and some other DSA issues. It
also gives brief explanation on optimization and GA concepts. Finally, the chapter
ends up with a survey on the previous research works of GA optimization for CR-
based problems.
2.2 COGNITIVE RADIO TECHNOLOGY
In a research paper published in 1999, there was a significant juncture in wireless
communications when J. Mitola introduced his terrific idea of CR as a result of his
research at the KTH Royal Institute of Technology, University of Stockholm, Sweden
(Mitola 1999). Mitola presented how CR could add in flexibility to personal wireless
services using a new language named the radio knowledge representation language
(RKRL). Then, he emphasized his idea further in his PhD thesis (Mitola 2000). In the
United States, there have been several studied focusing on spectrum utilization carried
out by organizations such as the Federal Communications Commission (FCC) and the
20
National Telecommunication and Information Administration (NTIA) as well as the
academies and researchers themselves. In 2002, the Spectrum-Policy Task Force
(SPTF) appointed by FCC published a report based on extensive studies of spectrum
usage (FCC 2002a). The report came to the conclusion that the existing spectrum rules
and regulations that allocate discrete bands for different services and applications are
no longer useful and functional. The report also highlighted the necessity to make use
of today’s technology that is capable of enabling time-based usage of spectrum
through dynamic spectrum access (DSA). Consequently, the research on CR has been
quickly focused on DSA and secondary usage of spectrum through many funded
projects. Among all those, the neXt Generation (XG) project funded by the US
Defense Advanced Research Projects Agency (DARPA) was a significant and
interesting research work focusing on spectrum management and secondary-usage
opportunities (DARPA 2003a, DRAPA 2003b). In addition, there have been other
strategies proposed in the literature for DSA such as spectrum pooling (Weiss &
Jondral 2004), the usage of virtual unlicensed spectrum based on CR approach
(CORVUS) (Broderson et al. 2004), the OFDM-based cognitive radio (OCRA)
network (Akyildiz & Li 2006), the European dynamic radio for IP services in
vehicular environments (DRiVE) (Xu et al. 2000) and dynamic intelligent
management of spectrum for ubiquitous mobile network (DIMSUMnet) (Buddhikot et
al. 2005).
Aside from that, there have been other research groups working on
standardizing CR and SDR technologies and architectures; one of which is the IEEE
802.22 group whose focus is on providing dynamic access to unused TV bands
(Cordeiro et al. 2005). The main framework of IEEE 802.22 is to investigate on
employing CR-based opportunistic access to the so-called TV while spaces (TVWSs)
since considerable segments of the VHF/UHF TV bands are largely underutilized. In
2004, the FCC already agreed to permit opportunistic to TV bands in the US (FCC
2004). The selection of TV bands in particular is due to its lower spectral utilization
than other PU networks such as cellular networks. FCC called for proposals from
industry for CR prototypes (FCC 2006). After comprehensive evaluations and tests
(FCC 2008), the FCC officially approved the opportunistic access of TVWSs (FCC
2009). Also, Ofcom, the spectrum regulatory body of UK has similar activities to that
21
of FCC. In 2009, Ofcom published a report on its proposal of CR access to TVWSs
(Ofcom 2009). In fact, the IEEE 802.22 standard for Wireless Regional Area
Networks (WRAN) is expected to be the first commercial CR-based deployment
aiming at opportunistic access of unused and underused VHF/UHF TV bands between
54 and 862 MHz (Cordeiro et al. 2006).
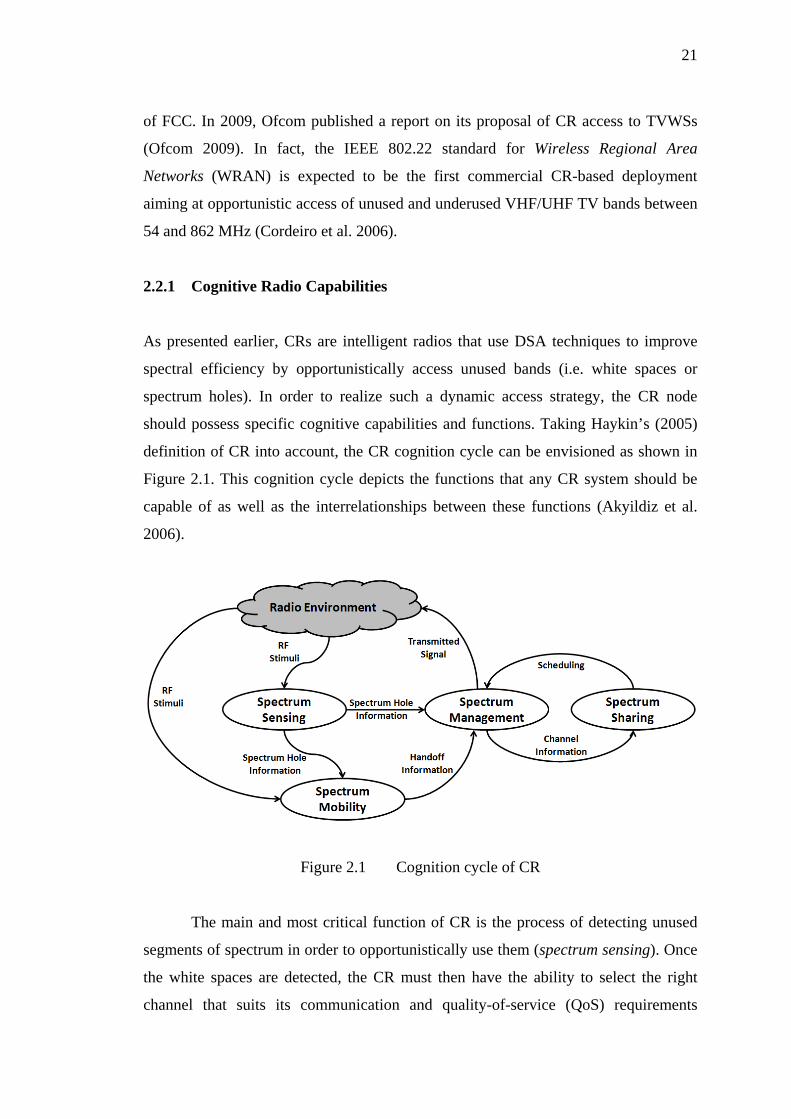
2.2.1 Cognitive Radio Capabilities
As presented earlier, CRs are intelligent radios that use DSA techniques to improve
spectral efficiency by opportunistically access unused bands (i.e. white spaces or
spectrum holes). In order to realize such a dynamic access strategy, the CR node
should possess specific cognitive capabilities and functions. Taking Haykin’s (2005)
definition of CR into account, the CR cognition cycle can be envisioned as shown in
Figure 2.1. This cognition cycle depicts the functions that any CR system should be
capable of as well as the interrelationships between these functions (Akyildiz et al.
2006).
Figure 2.1 Cognition cycle of CR
The main and most critical function of CR is the process of detecting unused
segments of spectrum in order to opportunistically use them (spectrum sensing). Once
the white spaces are detected, the CR must then have the ability to select the right
channel that suits its communication and quality-of-service (QoS) requirements
22
(spectrum management). Since the CRs are given lower priority than license-holders,
they should be able to terminate their transmission in case a licensed user (i.e. PU)
suddenly becomes active and smoothly move to another unused channel (spectrum
mobility). Also, In a CR network there should be a scheduling algorithm involved to
assure that all CRs get fair opportunities on accessing the spectrum (spectrum
sharing). Brief descriptions of CR functions are summarized in Table 2.1.
Based on the functions above, the CR can be further characterized by two
functionalities; cognitive capability and reconfigureability (Haykin 2005). The
cognitive capability indicates to the ability of the CR to obtain awareness on the
surrounding environment (e.g. spectral occupancy, channel condition, etc) whereas the
reconfigureability allows the CR system to autonomously adapts to the observed radio
environment by dynamically programming its transmission parameters (transmit
power, modulation scheme, and others).
Table 2.1 Description of CR functions
CR function Function description
Spectrum sensing Detecting unused spectrum and sharing the spectrum without harmful interference with other users.
Spectrum management Capturing the best available spectrum to meet user communication requirements.
Spectrum mobility Maintaining seamless communication requirements during the transition to better spectrum.
Spectrum sharing Providing the fair spectrum scheduling method among coexisting CR users.
2.2.2 CR Potential Applications
The term “cognitive radio” is coined to describe a radio with intelligence. In contrast,
to traditional radio systems, CR is capable of employing its radio in the most optimal
way by observing its surrounding environment, learn about it, and use the learning
outcomes to improve communication. Due to such attributes, CR can suit multitudes
23
of wireless applications that require a sort of intelligence. Some of these applications
can be addressed as follows (Arslan 2007):
(i) Resources optimization and QoS enhancement applications: The limited
wireless resources necessitate innovative solutions to optimize their usage and at the
same time improve communication QoS. CR systems and networks can be
interestingly used to optimize several resource aspects such as power consumption,
spectrum utilization, software/hardware resources, and network infrastructure. In
addition, the cognition feature of CR can be used to obtain awareness on surrounding
environment and make use of it. For instance, awareness of channel fading properties,
noise, available interference, capability of error correction can assist on suitable
employment of modulation type and index, forward error correction (FEC) scheme,
and interleaving length. Power optimization is a continuous objective, since the
emergence of wireless communication technology, aiming at sustained and long-
lasting connectivity. For instance, adaptive power control can be used based on
awareness of channel and positions of mobile users for prioritizing tasks according to
received power levels. With spectrum awareness, CR can enable multitudes of
spectral tasks such as dynamic spectrum sensing, dynamic spectrum access, and
dynamic spectrum management. In fact, dynamic spectrum management offers
dynamic cognitive ruling, coordination, and synchronization required after sensing the
spectrum and before accessing it and subject to PU unavailability. The utilization of
software/hardware resources of individual nodes within a link can also be intelligently
improved by CR. For instance, SDR-based CR applications can support upgrade of
hardware through software alternation. This can help to reduce the needs for hardware
replacement which in turn reduce manufacturing and labor costs. This configurability
of SDR-based CR systems can realize convergence among different networks such as
Global System for Mobile Communications (GSM) and Wireless Local Area Network
(WLAN) in emergency situations (Arslan 2007).
(ii) Interoperability enabling applications: As mentioned above, CR can be used to
realize ubiquitous connectivity for adaptive systems over heterogeneous networks,
multiple bands, diverse geographical locations, and distinct policies and regulations of
24
spectrum. This concept of interoperability can find futile applications in public safety
responders as well as military (Da Silva et al. 2004).
(iii) End user product/service specific applications: One of the CR sets of
applications is the one entraining the direct needs of consumers. CR can be used for
many service-specific products such as cell phones, personal digital assistants (PDAs),
laptops, and fax machines. Many other CR applications include public safety,
protection and security, climate change and disaster relief, fire services, crime
prevention, traffic control, and medical applications (Arslan 2007).
2.3 SPECTRUM SENSING
DSA techniques are being widely proposed as a key solution that could resolve the
spectrum scarcity versus spectrum underutilization dilemma. For wireless
communications, it is commonly known that the range of frequencies between 10
MHz and 6 GHz is mostly used. While one might view this as a lot of resource, we
should keep in mind that most of it has been already allocated to a variety of wireless
technologies and services leading to a sort of spectrum scarcity. However, several
experimental studies of spectrum occupancy have shown that the real cause of
spectrum scarcity lies on that the exclusively allocated bands are not being efficiently
utilized (Yang 2004; Roberson 2007).
As explained in section 1.1.3, spectrum sensing is a key requirement that CR
has to be capable of in order to monitor PU activities. Reliable and efficient sensing
scheme is crucially required to ensure low level of interference to PU while allowing
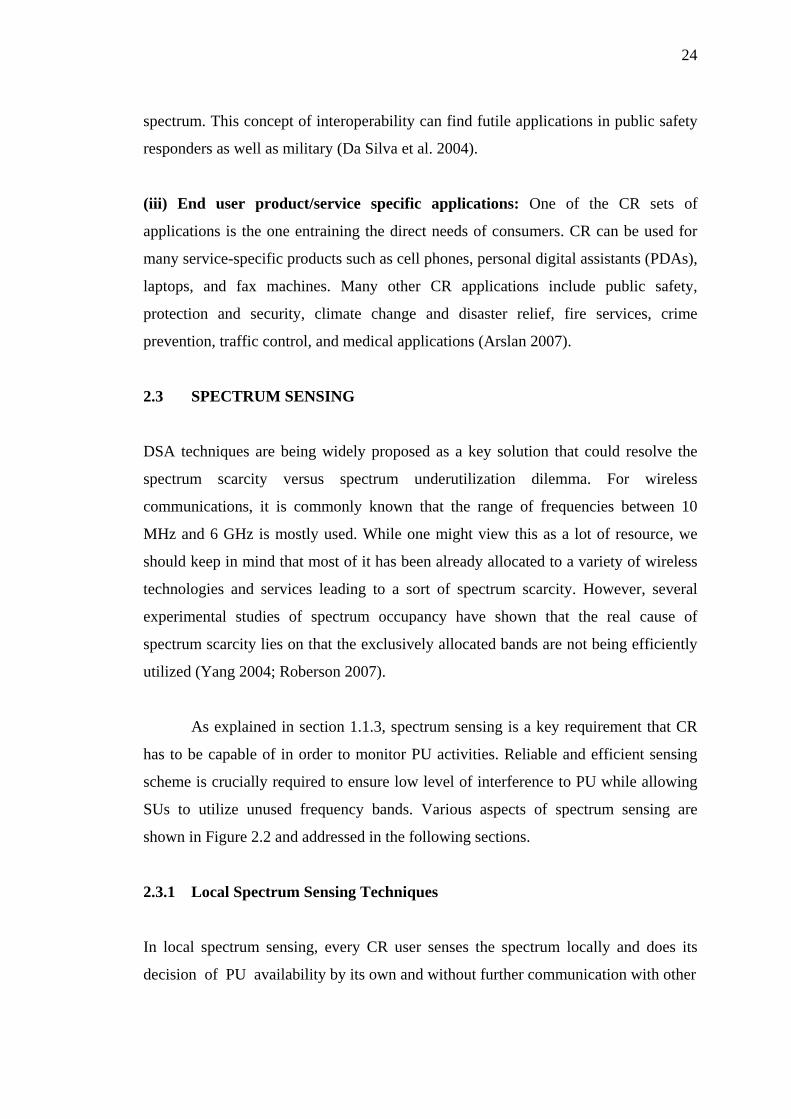
SUs to utilize unused frequency bands. Various aspects of spectrum sensing are
shown in Figure 2.2 and addressed in the following sections.
2.3.1 Local Spectrum Sensing Techniques
In local spectrum sensing, every CR user senses the spectrum locally and does its
decision of PU availability by its own and without further communication with other
25
Figu
re 2
.2
Elem
ents
of s
pect
rum
sens
ing
26
CR users in the vicinity. From a statistical point of view, sensing the spectrum is
represented by a problem of binary hypothesis-testing:
H0: PU is absent
H1: PU is present
Under these two hypotheses, two important probabilities are defined and used
as a key metric of sensing performance, namely, probability of detection (Pd) and
probability of false alarm (Pf) which are, respectively, given by
Pd = P(Decision = H1│H1) (2.1)
Pf = P(Decision = H1│H0) (2.2)
In the literature, there have been several detection techniques that can be
invoked in local spectrum sensing. In following section, some of these techniques are
addressed.
(i) Matched filter: The matched filter is considered as an optimal detection scheme
since it maximizes the signal-to-noise ratio (SNR) of the received signal in the
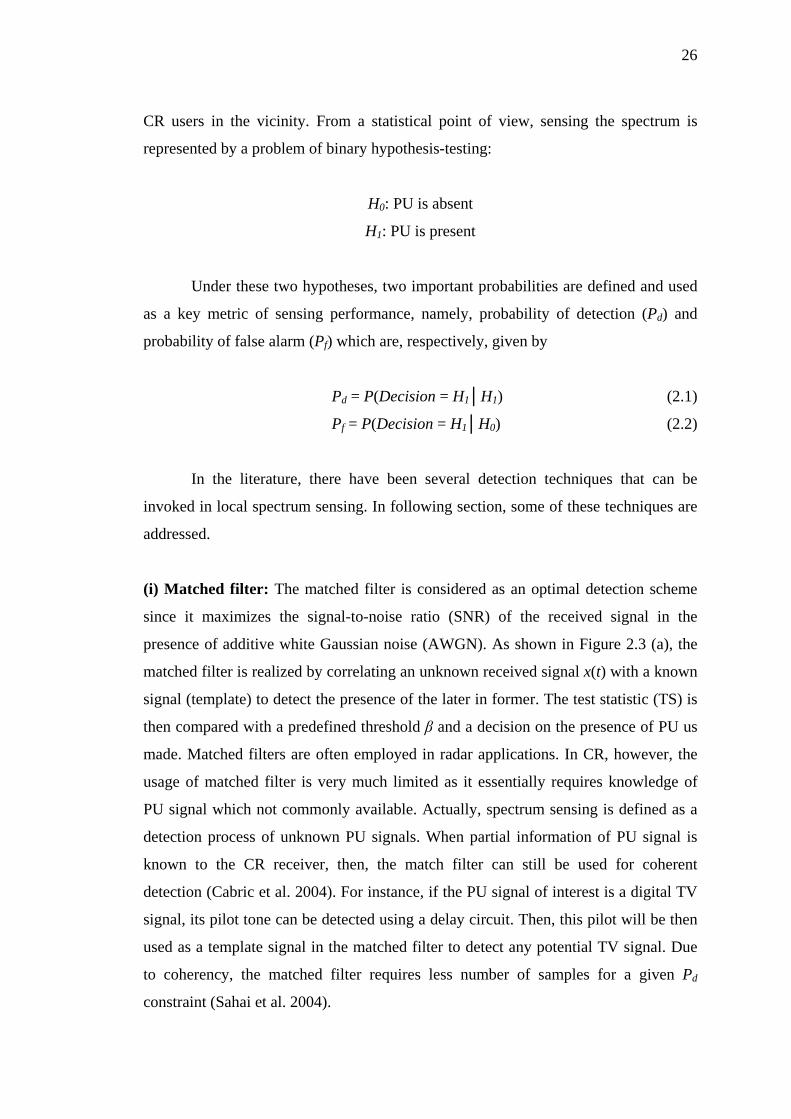
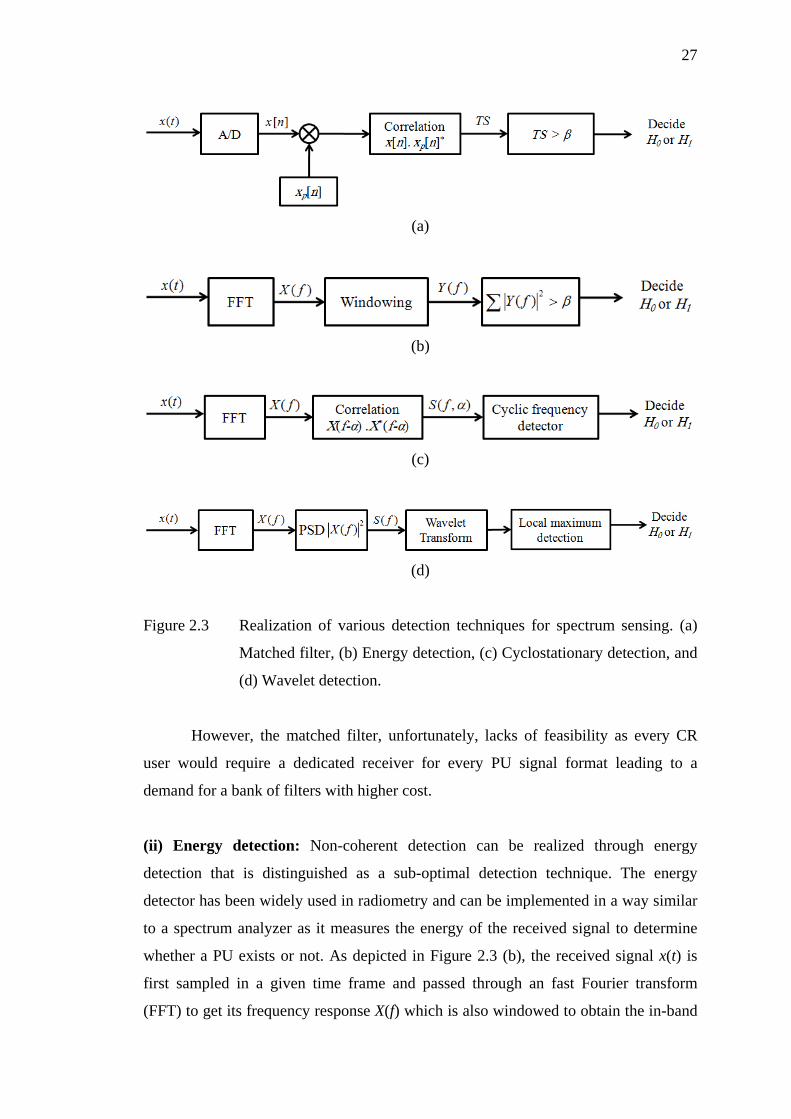
presence of additive white Gaussian noise (AWGN). As shown in Figure 2.3 (a), the
matched filter is realized by correlating an unknown received signal x(t) with a known
signal (template) to detect the presence of the later in former. The test statistic (TS) is
then compared with a predefined threshold β and a decision on the presence of PU us
made. Matched filters are often employed in radar applications. In CR, however, the
usage of matched filter is very much limited as it essentially requires knowledge of
PU signal which not commonly available. Actually, spectrum sensing is defined as a
detection process of unknown PU signals. When partial information of PU signal is
known to the CR receiver, then, the match filter can still be used for coherent
detection (Cabric et al. 2004). For instance, if the PU signal of interest is a digital TV
signal, its pilot tone can be detected using a delay circuit. Then, this pilot will be then
used as a template signal in the matched filter to detect any potential TV signal. Due
to coherency, the matched filter requires less number of samples for a given Pd
constraint (Sahai et al. 2004).
27
(a)
(b)
(c)
(d)
Figure 2.3 Realization of various detection techniques for spectrum sensing. (a)
Matched filter, (b) Energy detection, (c) Cyclostationary detection, and
(d) Wavelet detection.
However, the matched filter, unfortunately, lacks of feasibility as every CR
user would require a dedicated receiver for every PU signal format leading to a
demand for a bank of filters with higher cost.
(ii) Energy detection: Non-coherent detection can be realized through energy
detection that is distinguished as a sub-optimal detection technique. The energy
detector has been widely used in radiometry and can be implemented in a way similar
to a spectrum analyzer as it measures the energy of the received signal to determine
whether a PU exists or not. As depicted in Figure 2.3 (b), the received signal x(t) is
first sampled in a given time frame and passed through an fast Fourier transform
(FFT) to get its frequency response X(f) which is also windowed to obtain the in-band
28
spectrum Y(f). Then, the signal energy is estimated and compared with a predefined
threshold β to decide H0 or H1. The main feature of energy detection is that it does not
require any prior knowledge of PU waveform. This feature reflects ease on the
implementation of the CR receiver employing energy detection. However, the energy
detector might not be the choice in low SNR environments as it cannot detect the PU
signal if its estimated energy is below the predefined threshold. In fact, selecting
appropriate threshold is also challenging as it is solely susceptible to the variations of
interference level and channel noise. It also cannot distinguish between SUs sharing
the same band and the PU (Shankar et al. 2005).
(iii) Cyclostationary detection: if the autocorrelation of the PU signal is a periodic
function of time, then, the signal is referred to as cyclostationary. With such a
property, the PU can be detected even at very low SNR environments. The
implementation of cyclostationary detection is shown in Figure 2.3 (c). The so-called
spectral correlation function S(f,α) is computed by auto-correlating X(f) where α is
known as cyclic frequency (Hossain & Bhargava 2007). Then, cyclic frequency
detector is used to extract the periodicity of the PU signal if any. The drawbacks of
cyclostationary detection can be identified as its demand of partial knowledge of PU
waveform as well as its high computational cost.
(iv) Wavelet detection: The wavelet technique can be used for PU detection over
wideband channels as it offers adaption flexibility to dynamic environments (Tian &
Giannakis 2006). The idea of this scheme lies on the power spectral characteristics of
a train of consecutive sub-bands that construct the entire wideband where the spectral
power is smooth within the sub-bands but changes abruptly of the sub-bands
boundaries. As depicted in Figure 2.3 (d), the power spectral density (PSD) of X(f) is
computed and a wavelet transform is employed to locate the singularities of S(f) by
which the unused sub-bands can be identified. There are, however, drawback for this
scheme such as the inability to perform well for spread spectrum signals and the
demand for high sampling rate which increases the computational cost. Table 2.2
shows the pros and cons of the spectrum sensing techniques mentioned earlier. In this
thesis, energy detection has been adopted due its simplicity and optimality for zero-
mean PU signals.
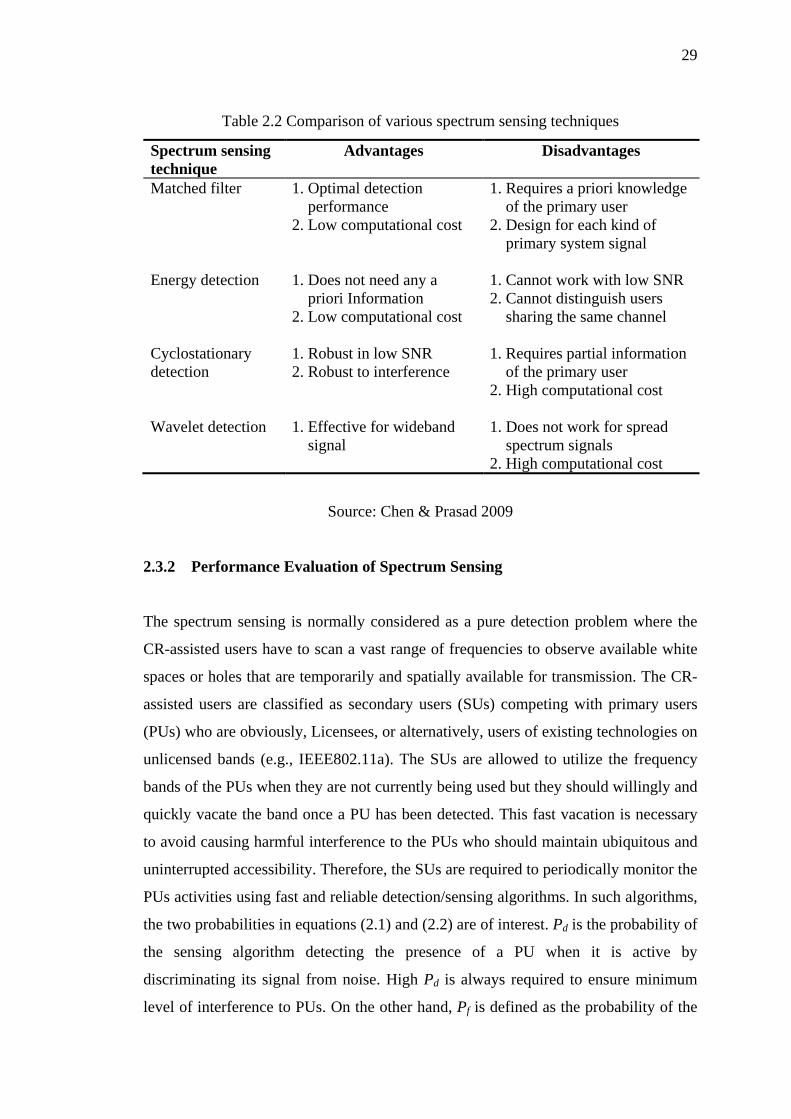
29
Table 2.2 Comparison of various spectrum sensing techniques
Spectrum sensing technique
Advantages Disadvantages
Matched filter
1. Optimal detection performance 2. Low computational cost
1. Requires a priori knowledge of the primary user 2. Design for each kind of primary system signal
Energy detection
1. Does not need any a priori Information 2. Low computational cost
1. Cannot work with low SNR 2. Cannot distinguish users sharing the same channel
Cyclostationary detection
1. Robust in low SNR 2. Robust to interference
1. Requires partial information of the primary user 2. High computational cost
Wavelet detection 1. Effective for wideband signal
1. Does not work for spread spectrum signals 2. High computational cost
Source: Chen & Prasad 2009
2.3.2 Performance Evaluation of Spectrum Sensing
The spectrum sensing is normally considered as a pure detection problem where the
CR-assisted users have to scan a vast range of frequencies to observe available white
spaces or holes that are temporarily and spatially available for transmission. The CR-
assisted users are classified as secondary users (SUs) competing with primary users
(PUs) who are obviously, Licensees, or alternatively, users of existing technologies on
unlicensed bands (e.g., IEEE802.11a). The SUs are allowed to utilize the frequency
bands of the PUs when they are not currently being used but they should willingly and
quickly vacate the band once a PU has been detected. This fast vacation is necessary
to avoid causing harmful interference to the PUs who should maintain ubiquitous and
uninterrupted accessibility. Therefore, the SUs are required to periodically monitor the
PUs activities using fast and reliable detection/sensing algorithms. In such algorithms,
the two probabilities in equations (2.1) and (2.2) are of interest. Pd is the probability of
the sensing algorithm detecting the presence of a PU when it is active by
discriminating its signal from noise. High Pd is always required to ensure minimum
level of interference to PUs. On the other hand, Pf is defined as the probability of the
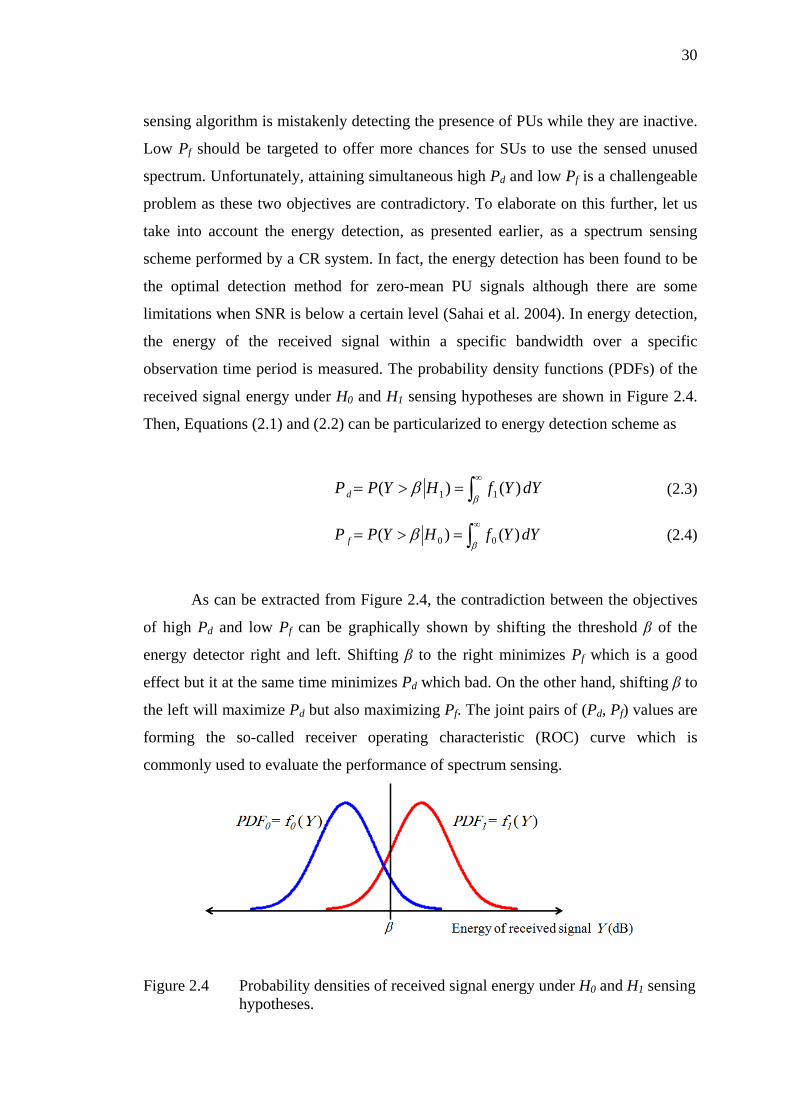
30
sensing algorithm is mistakenly detecting the presence of PUs while they are inactive.
Low Pf should be targeted to offer more chances for SUs to use the sensed unused
spectrum. Unfortunately, attaining simultaneous high Pd and low Pf is a challengeable
problem as these two objectives are contradictory. To elaborate on this further, let us
take into account the energy detection, as presented earlier, as a spectrum sensing
scheme performed by a CR system. In fact, the energy detection has been found to be
the optimal detection method for zero-mean PU signals although there are some
limitations when SNR is below a certain level (Sahai et al. 2004). In energy detection,
the energy of the received signal within a specific bandwidth over a specific
observation time period is measured. The probability density functions (PDFs) of the
received signal energy under H0 and H1 sensing hypotheses are shown in Figure 2.4.
Then, Equations (2.1) and (2.2) can be particularized to energy detection scheme as
dYYfHYPPd )()( 11 ∫∞
=>=β
β
(2.3)
dYYfHYPP f )()( 00 ∫∞
=>=β
β
(2.4)
As can be extracted from Figure 2.4, the contradiction between the objectives
of high Pd and low Pf can be graphically shown by shifting the threshold β of the
energy detector right and left. Shifting β to the right minimizes Pf which is a good
effect but it at the same time minimizes Pd which bad. On the other hand, shifting β to
the left will maximize Pd but also maximizing Pf. The joint pairs of (Pd, Pf) values are
forming the so-called receiver operating characteristic (ROC) curve which is
commonly used to evaluate the performance of spectrum sensing.
Figure 2.4 Probability densities of received signal energy under H0 and H1 sensing hypotheses.
31
2.3.3 Detection Criteria of Primary User In CR systems of SUs, spectrum sensing tasks are periodically performed to observe
potential vacant bands by reliable monitoring of PUs activities. Thus, accurate
detection of PUs is a crucial requirement for both parties; PUs and SUs. In fact,
spectrum sensing is often considered as a pure signal detection problem. In this
section, two different philosophies of exploiting the observed white spaces are
presented and can addresses as follows: (i) Neyman-Pearson criterion: In Neyman-Pearson approach, the decision protocol
aims at maximizing Pd for a given Pf (Quan et al. 2008; Shen & Kwak 2009).
Defining the probability of missed detection as Pm = 1- Pd, the decision approach can
also be formulated as to minimize Pm for a given Pf. This scenario is called constant
false alarm rate (CFAR) (Peh & Liang 2007). The philosophy of Neyman-Pearson
criterion lies on minimizing potential interference to active PU while maintaining
constant rate of accessing the unused spectrum. Mathematically, by setting Pf in (2.4)
to a fixed rate fP , thus
ff PdYYfHYPP ==>= ∫∞
)()( 00 ββ
(2.5)
Then, the threshold β for fP
can be expressed as
)( fPfunc=β
(2.6)
where func is a statistical function comprised of received PU signal properties. By
substituting (2.6) into (2.3), then
dYYfHYPPd )()( 11 ∫∞
=>=β
β
(2.7)
32
(ii) Mini-max criterion: This criterion is more aggressive as it jointly takes into
account PU as well as SU perspectives (Shen & Kwak 2009). This is because it
minimizes the total sensing decision error probability defined as
Pe = P(H0) . Pf + P(H1) . Pm (2.8)
where P(H0) and P(H1) denote the probabilities of PU under H0 and H1, respectively.
While the detector threshold in Neyman-Pearson criterion is set at a fixed level for a
given Pf, the detector threshold based on Mini-max approach is dynamically
positioned according to the statistical properties of the PDFs under H0 and H1. For
example, if the distance between the means of the two PDFs is far, the threshold might
be set to be relatively large so that Pf can be minimized while still maintaining no miss
detection of the PU signal. For simplicity, Pf and Pm might be assumed equal to obtain
closed form expression for the detector threshold although this strict assumption might
not be always acceptable (Shen & Kwak 2009).
2.3.4 Challenges of Spectrum Sensing
In this section, some of the challenges associated with spectrum sensing are briefly
addressed.
(i) Sensing time: Designing the sensing slot for CR systems is one of the critical
development tasks. The sensing activity is performed with a duty cycle or frame
duration Tf. This Tf is divided into two slots; the first slot Ts is allocated for spectrum
sensing whereas the remaining slot (Tf – Ts) is used by the SU to access the unused
licensed bands (Liang et al. 2008). However, the CR system, or SU, has to
immediately vacate the licensed bands once an active PU has been declared by the
next sensing exercise. Making Ts too short might result in poor detection of PU and
will therefore cause harmful interference to it whereas using long Ts will limit the
access time period of unused bands by SUs and then consequently reduces the total
throughput of the CRN. Thus, designing Ts is one of the challengeable tasks of CR
systems and adaptive solutions should be employed to dynamically set the sensing
time based on wireless environmental conditions.
33
(ii) Hardware requirements: In CR systems, spectrum sensing can make use of the
state-of-the-art solutions to support its functional requirements (Arslan 2007).
Spectrum sensing requires high-rate samplers, large dynamic range analog-to-digital
converters (ADCs), reconfigurable hardware, multiple antenna circuitry, and high-
speed signal processors. For instance, in CRN, sensing nodes are required to scan a
much wider band than conventional narrowband receivers. This calls for employment
of high-rate processors to meet real-time requirements.
(iii) Hidden primary user problem: This problem occurs when the PU transmitter is
shadowed from the SU receiver by any existing obstacles on the line-of-sight between
them (Ghasemi & Sousa 2005) as has been depicted earlier in Figure 1.4. Failure of
PU detection makes it less protected from interference and results quality degradation.
Thus, spatial diversity solutions should be employed to improve the detectability of
PU receivers. This diversity can be realized by means of collaboration among SUs as
will be shown in Section 2.4.
(iv) Spread spectrum primary users: Spread spectrum-based PU signals are
distinguished by their wide spanned bandwidth and low power levels. This low power
level requires spectrum sensors of very high sensitivity so that the presence of PUs
can be reliably identified. If partial knowledge on PU signal is available, feature
detection-based sensors can be used as was proposed in (Roy et al. 2010).
2.3.5 Spectrum Sensing in Existing Wireless Standards
Some wireless technologies can be said to be partially cognitive in the sense that
require some sort of spectrum sensing. For instance, the IEEE 802.11k standard which
is an extension of IEEE 802.11 require some measurements through constructing
reports of channel load and noise histogram at an access point by collecting channel
data form mobiles nodes and measuring interference levels, respectively (Arslan
2007). Also, in the Bluetooth standard, new features are being introduced to allow the
Bluetooth users to adaptively identify active transmissions in the ISM band such as,
microwave ovens and cordless telephones, and avoid potential mutual interference
(Arslan 2007). In addition, the IEEE 802.22 standard which is believed to be the first
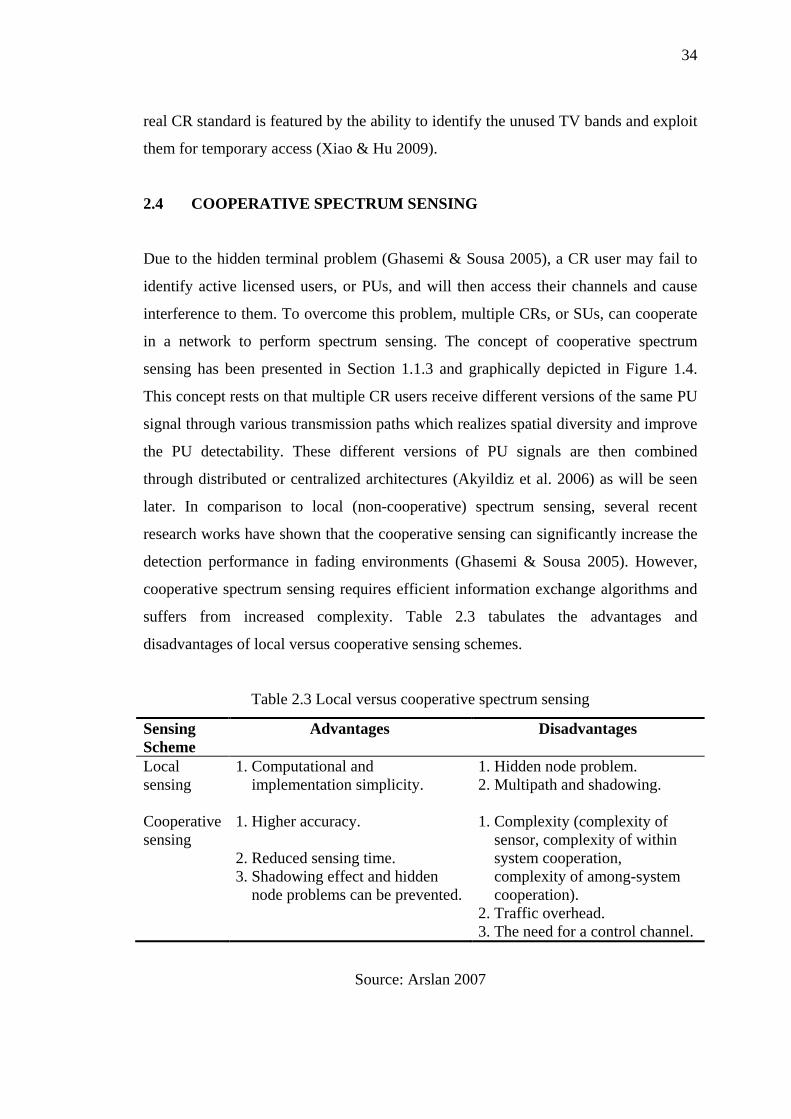
34
real CR standard is featured by the ability to identify the unused TV bands and exploit
them for temporary access (Xiao & Hu 2009).
2.4 COOPERATIVE SPECTRUM SENSING
Due to the hidden terminal problem (Ghasemi & Sousa 2005), a CR user may fail to
identify active licensed users, or PUs, and will then access their channels and cause
interference to them. To overcome this problem, multiple CRs, or SUs, can cooperate
in a network to perform spectrum sensing. The concept of cooperative spectrum
sensing has been presented in Section 1.1.3 and graphically depicted in Figure 1.4.
This concept rests on that multiple CR users receive different versions of the same PU
signal through various transmission paths which realizes spatial diversity and improve
the PU detectability. These different versions of PU signals are then combined
through distributed or centralized architectures (Akyildiz et al. 2006) as will be seen
later. In comparison to local (non-cooperative) spectrum sensing, several recent
research works have shown that the cooperative sensing can significantly increase the
detection performance in fading environments (Ghasemi & Sousa 2005). However,
cooperative spectrum sensing requires efficient information exchange algorithms and
suffers from increased complexity. Table 2.3 tabulates the advantages and
disadvantages of local versus cooperative sensing schemes.
Table 2.3 Local versus cooperative spectrum sensing
Sensing Scheme
Advantages Disadvantages
Local sensing
1. Computational and implementation simplicity.
1. Hidden node problem. 2. Multipath and shadowing.
Cooperative sensing
1. Higher accuracy. 2. Reduced sensing time. 3. Shadowing effect and hidden node problems can be prevented.
1. Complexity (complexity of sensor, complexity of within system cooperation, complexity of among-system cooperation). 2. Traffic overhead. 3. The need for a control channel.
Source: Arslan 2007
35
As mentioned earlier, cooperative spectrum sensing can be implemented in
two approaches: distributed or centralized architectures. These two approaches are
explained in the following two sections.
2.4.1 Centralized Sensing Architecture
In centralized cooperative sensing architecture, unlicensed CR users, or SUs, sense the
target PU channels and report the sensing results to a central unit at which a global
decision on the spectrum access is made (Ganesan & Li 2005; Visotsky et al. 2005).
This global decision of whether or not a PU is active is made by combining the
sensing results from all SUs in the vicinity of the central unit which might be an
access point (AP) as in Wireless LAN technology or base station (BS) as in cellular
technology. Figure 1.4 shows the deployment of centralized CRN where all the SUs
within the coverage area of the SU-BS report their sensing results to it. In terms of
advantages, the centralized BS whose footprint may span several kilometres can
afford optimal DSA solution as it offers optimization across network-wide
information. On the other hand, the main disadvantage of the centralized approach is
the requirement for backbone infrastructure (i.e. central BS). However, this
infrastructural requirement can be mitigated by replacing the central BS by a master
mobile node (Visotsky et al. 2005).
2.4.2 Distributed Sensing Architecture
In the distributed approach of cooperative spectrum sensing, unlicensed CR users, or
SUs, exchange the sensing results among each other and the decision on the spectrum
access by each unlicensed user is made locally (Tang 2005; Ahmed et al. 2006). The
main advantage of distributed spectrum sensing is the on-fly ad-hoc set up of the
network where no central BS is needed. However, the deployment of such distributed
architecture would not be anticipated in the near future due to many challenges and
drawbacks; since the distributed networks usually have comparatively smaller
coverage area than centralized networks, the measurements received from multiple
nearby SUs might not differ much and therefore, sensing measurements will be
redundant and the spatial diversity gain will then be reduced. Consequently, this
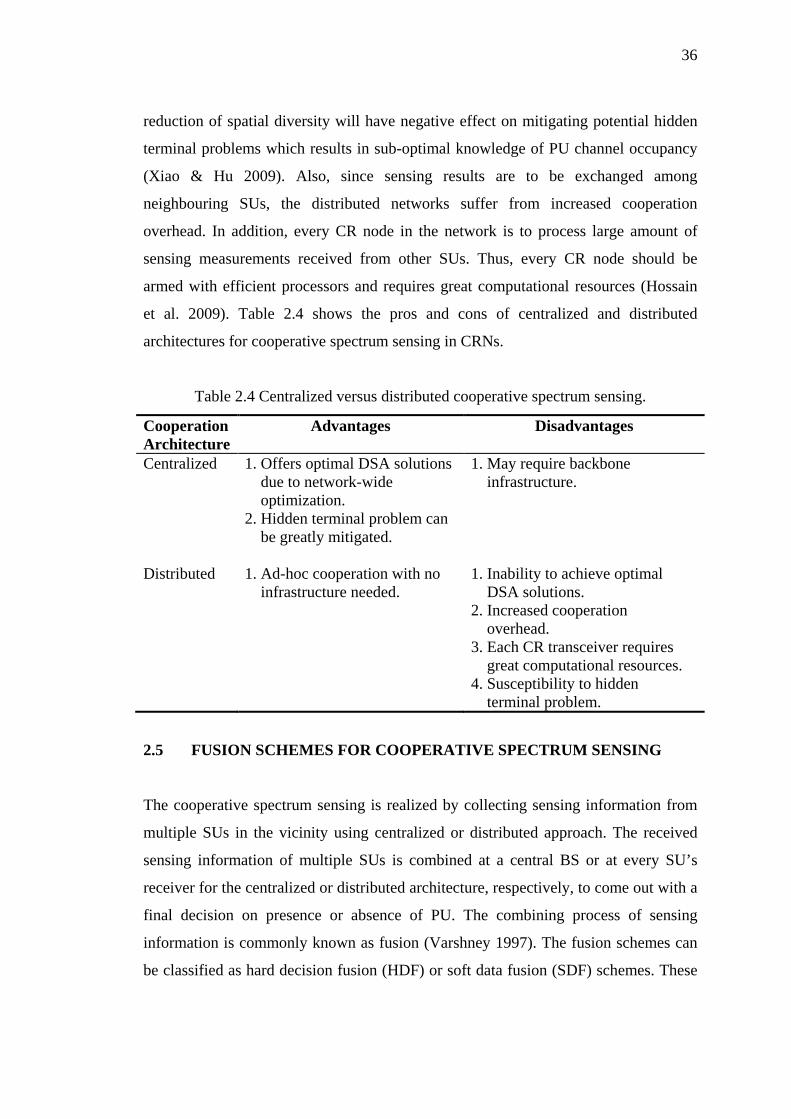
36
reduction of spatial diversity will have negative effect on mitigating potential hidden
terminal problems which results in sub-optimal knowledge of PU channel occupancy
(Xiao & Hu 2009). Also, since sensing results are to be exchanged among
neighbouring SUs, the distributed networks suffer from increased cooperation
overhead. In addition, every CR node in the network is to process large amount of
sensing measurements received from other SUs. Thus, every CR node should be
armed with efficient processors and requires great computational resources (Hossain
et al. 2009). Table 2.4 shows the pros and cons of centralized and distributed
architectures for cooperative spectrum sensing in CRNs.
Table 2.4 Centralized versus distributed cooperative spectrum sensing.
Cooperation Architecture
Advantages Disadvantages
Centralized 1. Offers optimal DSA solutions due to network-wide optimization. 2. Hidden terminal problem can be greatly mitigated.
1. May require backbone infrastructure.
Distributed 1. Ad-hoc cooperation with no infrastructure needed.
1. Inability to achieve optimal DSA solutions. 2. Increased cooperation overhead. 3. Each CR transceiver requires great computational resources. 4. Susceptibility to hidden terminal problem.
2.5 FUSION SCHEMES FOR COOPERATIVE SPECTRUM SENSING
The cooperative spectrum sensing is realized by collecting sensing information from
multiple SUs in the vicinity using centralized or distributed approach. The received
sensing information of multiple SUs is combined at a central BS or at every SU’s
receiver for the centralized or distributed architecture, respectively, to come out with a
final decision on presence or absence of PU. The combining process of sensing
information is commonly known as fusion (Varshney 1997). The fusion schemes can
be classified as hard decision fusion (HDF) or soft data fusion (SDF) schemes. These
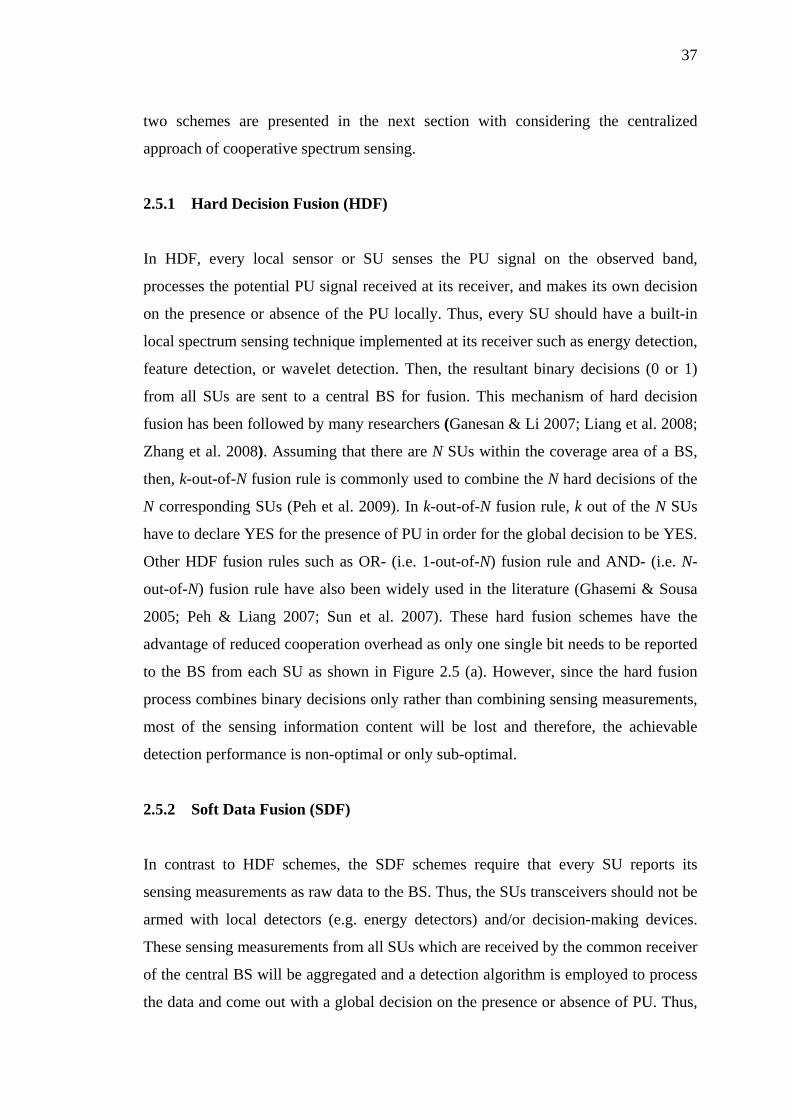
37
two schemes are presented in the next section with considering the centralized
approach of cooperative spectrum sensing.
2.5.1 Hard Decision Fusion (HDF)
In HDF, every local sensor or SU senses the PU signal on the observed band,
processes the potential PU signal received at its receiver, and makes its own decision
on the presence or absence of the PU locally. Thus, every SU should have a built-in
local spectrum sensing technique implemented at its receiver such as energy detection,
feature detection, or wavelet detection. Then, the resultant binary decisions (0 or 1)
from all SUs are sent to a central BS for fusion. This mechanism of hard decision
fusion has been followed by many researchers (Ganesan & Li 2007; Liang et al. 2008;
Zhang et al. 2008). Assuming that there are N SUs within the coverage area of a BS,
then, k-out-of-N fusion rule is commonly used to combine the N hard decisions of the
N corresponding SUs (Peh et al. 2009). In k-out-of-N fusion rule, k out of the N SUs
have to declare YES for the presence of PU in order for the global decision to be YES.
Other HDF fusion rules such as OR- (i.e. 1-out-of-N) fusion rule and AND- (i.e. N-
out-of-N) fusion rule have also been widely used in the literature (Ghasemi & Sousa
2005; Peh & Liang 2007; Sun et al. 2007). These hard fusion schemes have the
advantage of reduced cooperation overhead as only one single bit needs to be reported
to the BS from each SU as shown in Figure 2.5 (a). However, since the hard fusion
process combines binary decisions only rather than combining sensing measurements,
most of the sensing information content will be lost and therefore, the achievable
detection performance is non-optimal or only sub-optimal.
2.5.2 Soft Data Fusion (SDF)
In contrast to HDF schemes, the SDF schemes require that every SU reports its
sensing measurements as raw data to the BS. Thus, the SUs transceivers should not be
armed with local detectors (e.g. energy detectors) and/or decision-making devices.
These sensing measurements from all SUs which are received by the common receiver
of the central BS will be aggregated and a detection algorithm is employed to process
the data and come out with a global decision on the presence or absence of PU. Thus,
38
it is clear that the SUs in SDF scenario act as radio relays and have no processing
units since only one single detector is needed at the common receiver of the central
BS as shown in Figure 2.5 (b). Linear combination data fusion scheme was proposed
in (Quan et al 2008) and extended further in (Shen & Kwak 2009) where the received
sensing measurements are first weighted and then aggregated based on maximizing
the natural deflection coefficient (NDC) or modified deflection coefficient (MDC).
Other SDF schemes include the maximal-ratio combining (MRC) (Ma & Li 2007) and
equal gain combination (EGC) (Qi et al. 2009). These soft schemes show better
detection performance than HDF schemes. However, the SDF schemes have the
disadvantage of increased cooperation overhead due to the huge amount of sensing
data reported from the SUs to the central BS. Some relay protocols such as Amplify-
And-Forward (AAF) approach or Decode-And-Forward (DAF) approach (Molisch
2011) can be used to relay sensing measurements from the SUs to the fusion centre
placed at the centralized BS (Shen & Kwak 2009).
(a) HDF
(b) SDF
Figure 2.5 Fusion schemes for cooperative spectrum sensing
39
2.6 OTHER DYNAMIC SPECTRUM (DSA) ASPECTS
This section provides some other DSA aspects such as the potential CR operating
bands, Spectrum Sharing Techniques and the PU-SU and SU-SU cooperation
behaviour.
2.6.1 CR Operating Bands
One of the main aspects for the feasibility of CR technology is the frequency bands at
which a CR system operates. The potential CR access bands can be classified into two
main categories, namely, licensed bands and unlicensed bands. These two categories
can be presented as follows:
(i) Licensed bands: These bands are defined as frequency bands assigned exclusively
to licensees such as the Global System for Mobile Communications (GSM) bands and
Universal Mobile Telecommunications System (UMTS) in cellular technology and the
TV bands in TV broadcasting. With the emergence of spectrum sensing techniques,
CR can scan the spectrum and temporarily access the bands declared as not in use.
The first realizable CRN is the 802.22 WRAN which uses the unused (54-862 MHz)
TV bands (Xiao & Hu 2009). Making use of these licensed unused bands requires
rapid vacation once the licence holder returns and therefore spectrum sensing is a
crucial requirement for the success of CR technology. In addition, spectrum mobility
is also important as it offers smooth transition from one band to another.
(ii) Unlicensed bands: The unlicensed bands are segments of spectrum allocated for
unconstrained access by any device with no licence or complicated ownership rules
involved. These bands include the the 2.4 GHz Industrial, Scientific and Medical
(ISM) band used by IEEE 802.11 b/g/n and Bluetooth devices, the 5 GHz Unlicensed
National Information Infrastructure (UNII) band used by IEEE 802.11a standard, and
the 60 GHz Extra High Frequency (EHF) band used for short-range communications
(Arslan 2007). Utilising such unlicensed bands is more challengeable than accessing
licensed bands since any device of any public services can freely access the
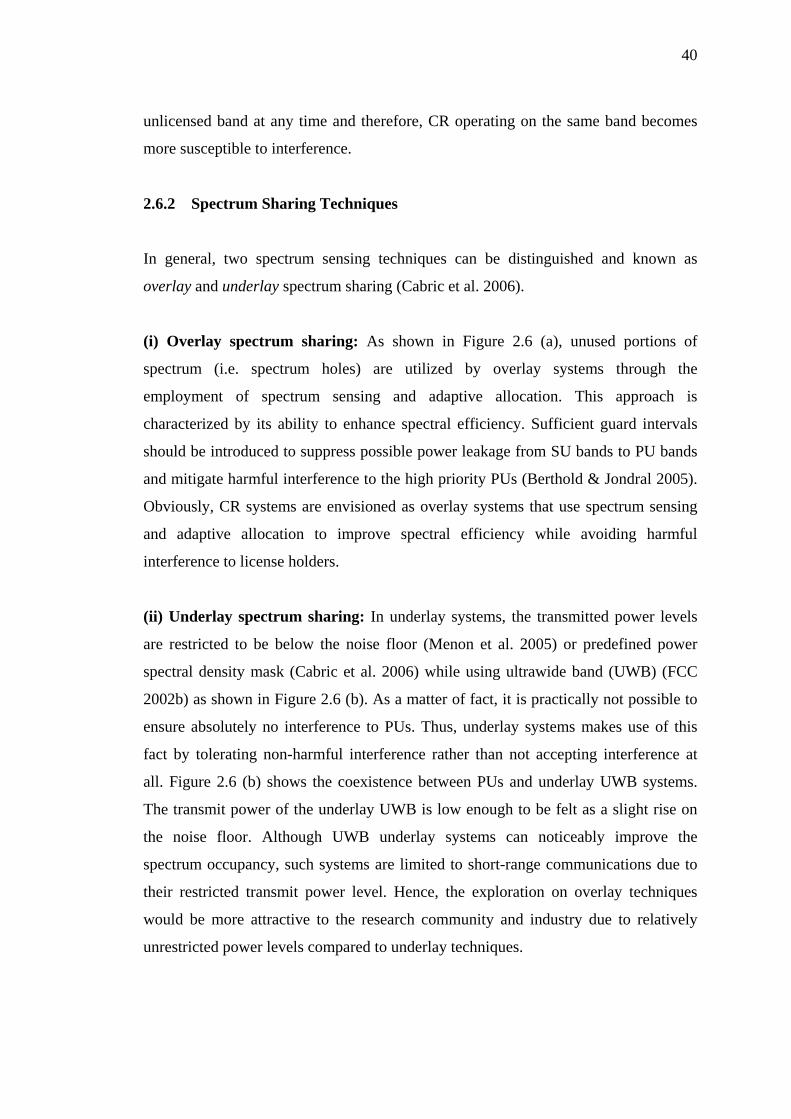
40
unlicensed band at any time and therefore, CR operating on the same band becomes
more susceptible to interference.
2.6.2 Spectrum Sharing Techniques
In general, two spectrum sensing techniques can be distinguished and known as
overlay and underlay spectrum sharing (Cabric et al. 2006).
(i) Overlay spectrum sharing: As shown in Figure 2.6 (a), unused portions of
spectrum (i.e. spectrum holes) are utilized by overlay systems through the
employment of spectrum sensing and adaptive allocation. This approach is
characterized by its ability to enhance spectral efficiency. Sufficient guard intervals
should be introduced to suppress possible power leakage from SU bands to PU bands
and mitigate harmful interference to the high priority PUs (Berthold & Jondral 2005).
Obviously, CR systems are envisioned as overlay systems that use spectrum sensing
and adaptive allocation to improve spectral efficiency while avoiding harmful
interference to license holders.
(ii) Underlay spectrum sharing: In underlay systems, the transmitted power levels
are restricted to be below the noise floor (Menon et al. 2005) or predefined power
spectral density mask (Cabric et al. 2006) while using ultrawide band (UWB) (FCC
2002b) as shown in Figure 2.6 (b). As a matter of fact, it is practically not possible to
ensure absolutely no interference to PUs. Thus, underlay systems makes use of this
fact by tolerating non-harmful interference rather than not accepting interference at
all. Figure 2.6 (b) shows the coexistence between PUs and underlay UWB systems.
The transmit power of the underlay UWB is low enough to be felt as a slight rise on
the noise floor. Although UWB underlay systems can noticeably improve the
spectrum occupancy, such systems are limited to short-range communications due to
their restricted transmit power level. Hence, the exploration on overlay techniques
would be more attractive to the research community and industry due to relatively
unrestricted power levels compared to underlay techniques.
41
(a)
(b)
Figure 2.6 Spectrum sharing techniques. (a) Overlay Access and (b) Underlay
Access.
2.6.3 Cooperation Behaviour
For both centralized and distributed approaches of cooperative sensing, the PU
may or may not choose to cooperate with the central BS or individual SUs,
respectively. However, this PU-SU sort of cooperation is not feasibly anticipated
without providing benefits to PUs as returns for tolerating potential and, hopefully,
non-harmful interference from SUs (Hossain & Bhargava 2007). On the other hand,
SU-SU cooperation is highly needed to improve the detection performance by
supplying spatial diversity. In centralized cooperative sensing, the SU-SU cooperation
42
is performed through the central SU-BS whereas in distributed sensing, the SU-SU
cooperation is conducted directly in an ad-hoc fashion. In fact, the SU-SU cooperation
is not limited to the uplink operations (i.e. spectrum sensing) only but also extended to
the downlink transmission where channel and power allocation algorithms are needed
for spectrum sharing.
2.7 OPTIMIZATION
Optimization deals with the problem of finding solutions over a given set of choices to
optimize certain criteria (Gen & Cheng 2000). This optimization problem might be of
single-objective or multi-objective in accordance to the number of criteria to be
optimized. To solve optimization problems using computers, the problem at hand
should be first mathematically formulated. Then, this mathematical model is used by
an optimization algorithm to find the best (global) optima (maxima/minima) rather
than suboptimal (local) maxima/minima (Haupt & Haupt 2004). Advanced numerical
methods are often used for problem optimization. However, as the difficulty level of a
given problem increases, the conventional numerical methods cannot not be used.
Iterative random-search methods such as evolutionary algorithms can be the best
choice for such complicated problems.
2.7.1 Types of Optimization Problems
(i) Parametric problems: In this type of problems, parameters are the decision
variables to be optimized. These optimization problems can be further categorized into
constrained and unconstrained problems. The problem constraints might be design
conditions, initial boundaries or quality demands. A constrained single-objective
optimization problem is usually written in the following form (Gen & Cheng 2000):
mixgtosubjectxfz
i ...,,2,1,0)()(max
=≤=
(2.9)
43
where nRx∈ is a vector of n decision variables, )(xf is an objective function,
0)( ≤xgi
is the ith constraint of m total constraints form the feasible search space. This
feasible search space, denoted as S, is defined as:
}0,...,,2,1,0)({ ≥=≤∈= xmixgRxS in
(2.10)
As an example of parametric optimization problems, the problem of array antenna
design is considered (Haupt & Haupt 2004). The optimization problem of (2.9) can be
minimizing total sidelobe levels in the antenna pattern and the parameters of nRx∈
are the n array amplitude weights.
(ii) Combinatorial problems: Combinatorial optimization problems are characterized
by a finite set of feasible solutions. These optimization problems can, for instance, be
relative or absolute ordering problems (Todd 1997). A common example of
combinatorial problems is the travelling salesman problem (TSP) where a salesman
travelling between a limited set of cities and returning to the start city covering the
shortest distance. Another practical example would be the ordering of jobs in a
manufacturing or production line. With very large but number of feasible solutions, it
is too hard to obtain the optimal solution by simple enumeration (Gen & Cheng 2000).
It is very common to solve such hard problems using a heuristic search algorithm such
as GA.
2.7.2 Multi-Objective Optimization
Multi-objective problems appear when there are multiple conflicting objectives to be
optimized simultaneously. In such a case, there does not necessarily exist a solution
that is best with respect to all objectives because of incommensurability and
confliction among objectives (Gen & Cheng 2000). A solution might be optimal for
one objective but sup-optimal or even poor for another. Therefore, there is usually a
set of solutions for a given multiple-objective function which cannot simply be with
each other. These solutions are commonly called nondominated solutions or Pareto
front solutions (Gen & Cheng 2000). For such solutions, no improvement is possibly
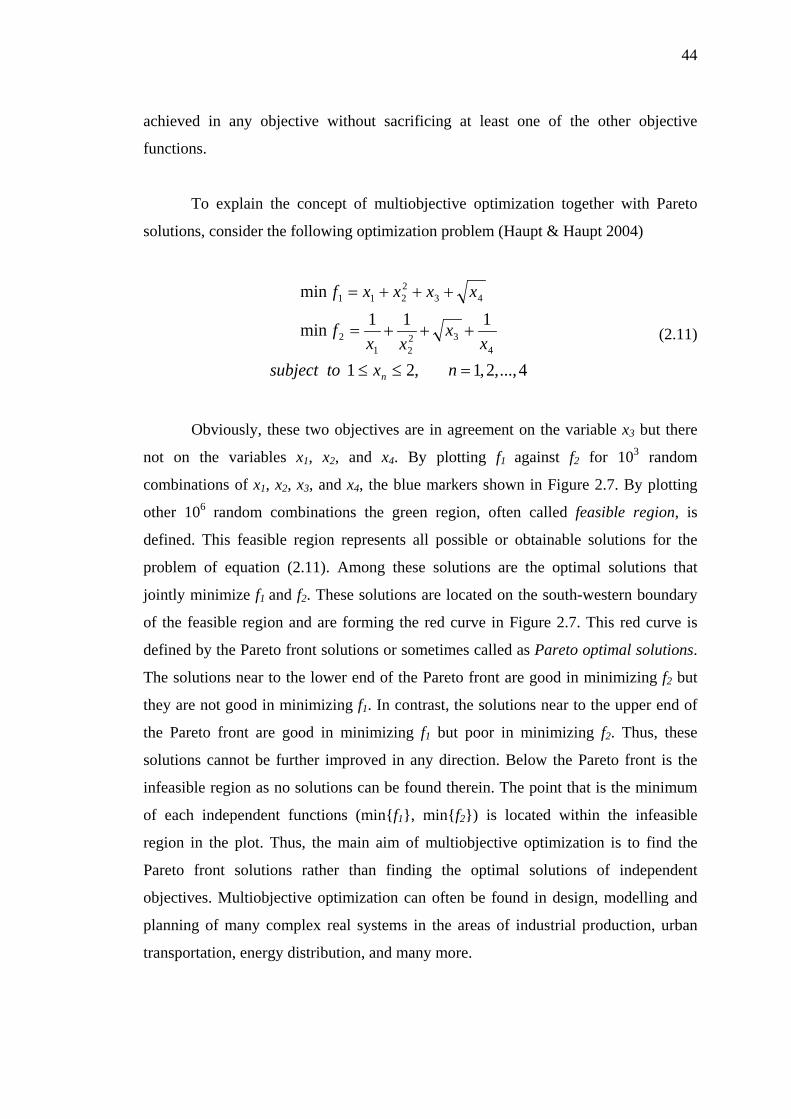
44
achieved in any objective without sacrificing at least one of the other objective
functions.
To explain the concept of multiobjective optimization together with Pareto
solutions, consider the following optimization problem (Haupt & Haupt 2004)
4...,,2,1,21
111min
min
432
212
432211
=≤≤
+++=
+++=
nxtosubjectx
xxx
f
xxxxf
n
(2.11)
Obviously, these two objectives are in agreement on the variable x3 but there
not on the variables x1, x2, and x4. By plotting f1 against f2 for 103 random
combinations of x1, x2, x3, and x4, the blue markers shown in Figure 2.7. By plotting
other 106 random combinations the green region, often called feasible region, is
defined. This feasible region represents all possible or obtainable solutions for the
problem of equation (2.11). Among these solutions are the optimal solutions that
jointly minimize f1 and f2. These solutions are located on the south-western boundary
of the feasible region and are forming the red curve in Figure 2.7. This red curve is
defined by the Pareto front solutions or sometimes called as Pareto optimal solutions.
The solutions near to the lower end of the Pareto front are good in minimizing f2 but
they are not good in minimizing f1. In contrast, the solutions near to the upper end of
the Pareto front are good in minimizing f1 but poor in minimizing f2. Thus, these
solutions cannot be further improved in any direction. Below the Pareto front is the
infeasible region as no solutions can be found therein. The point that is the minimum
of each independent functions (min{f1}, min{f2}) is located within the infeasible
region in the plot. Thus, the main aim of multiobjective optimization is to find the
Pareto front solutions rather than finding the optimal solutions of independent
objectives. Multiobjective optimization can often be found in design, modelling and
planning of many complex real systems in the areas of industrial production, urban
transportation, energy distribution, and many more.
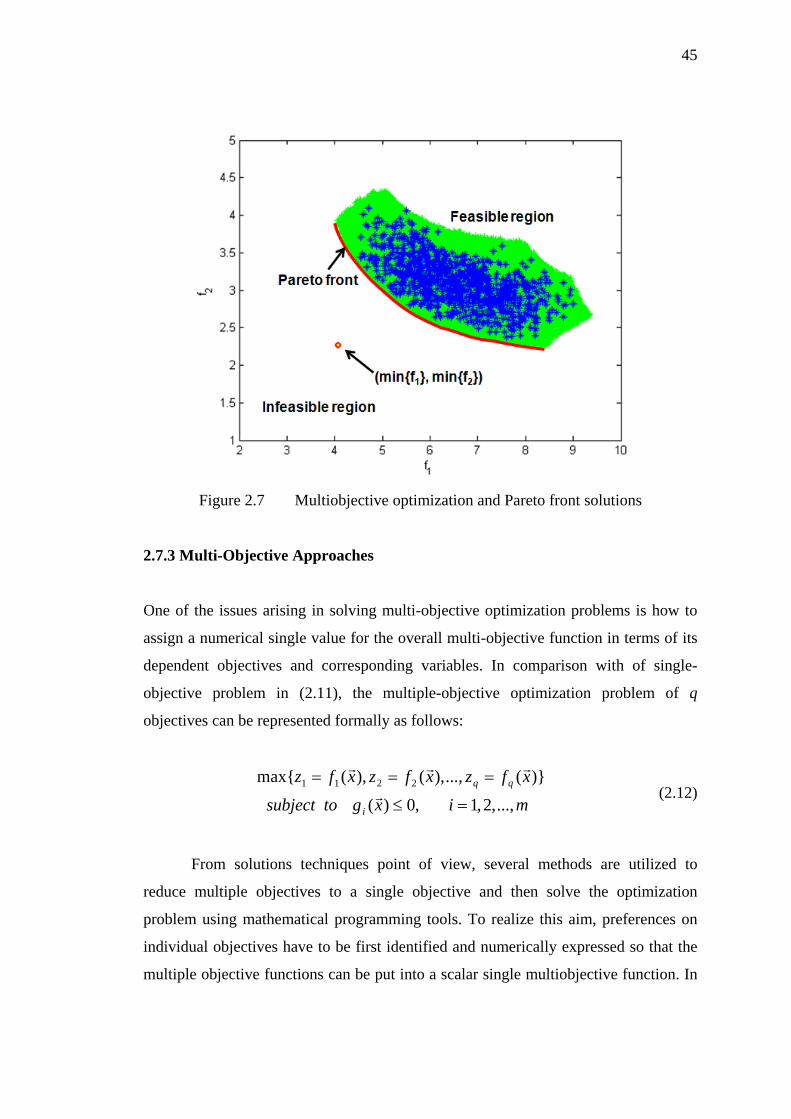
45
Figure 2.7 Multiobjective optimization and Pareto front solutions
2.7.3 Multi-Objective Approaches
One of the issues arising in solving multi-objective optimization problems is how to
assign a numerical single value for the overall multi-objective function in terms of its
dependent objectives and corresponding variables. In comparison with of single-
objective problem in (2.11), the multiple-objective optimization problem of q
objectives can be represented formally as follows:
mixgtosubjectxfzxfzxfz
i
...,,2,1,0)(
)}(...,),(),(max{ 2211
=≤
===
(2.12)
From solutions techniques point of view, several methods are utilized to
reduce multiple objectives to a single objective and then solve the optimization
problem using mathematical programming tools. To realize this aim, preferences on
individual objectives have to be first identified and numerically expressed so that the
multiple objective functions can be put into a scalar single multiobjective function. In
46
the next two items, several approaches to combine multiple objective functions into
one overall utility function are briefly explained (Chung 1994).
(i) Weighted-sum approach: In this approach, optimization preferences are
expressed by weighting coefficients assigned to individual single-objective functions.
The weighted-sum technique applied on the problem of (2.12) can be represented as
follows:
Sxtosubject
xfxzq
kkk
∈
=∑=
1)()(max ω
(2.13)
where ωk the individual weighting coefficient of the kth objective which is interpreted
as the relative emphasis of its corresponding objective compared to other objectives.
Practically, )(xfk
is often normalized to prevent the utility function )(xz being much
sensitive to high-score objectives and less sensitive to low-score objectives. Therefore,
the condition ||ω
|| = 1 is usually implemented where ]...,,,[ 21 qωωωω =
and ||.|| is 1-
norm operator of a given vector. Different settings of ω
helps to tradeoff
corresponding objectives based on system requirements or user needs.
(ii) Linear-logarithmic approach: The linear-logarithmic utility function is
formulated by additive terms of logarithmic functions representing the individual
objectives. Unlike the weighted-sum utility, the linear-logarithmic formulation helps
to improve the optimization performance when optima at the extreme edges by
providing convexity to the optimization curve so that this problem can be mitigated.
The mathematical representation of linear-logarithmic utility function is expressed as:
Sxtosubject
xfxzq
kkk
∈
=∑=
1)}(ln{)}(ln{max ω
(2.14)
Obviously, this formulation is very much similar to the weighted-sum one but
with incorporating logarithmic addition instead of linear addition.
47
(iii) Constant-elasticity-of-substitution (CES) approach: As the name implies, this
approach is established by developing a constant which indicates to a dependency
measure among corresponding objective functions. The utility function of this
approach is expressed as follows:
Sxtosubject
xfxzq
kkk
∈
=
−−
=∑
ρ
ρω/1
1))(()(max
(2.15)
where σσρ /)1( −= and σ is the elasticity between the single-objective functions.
However, this formulation might not be really feasible for adaptive optimization which
involves individual objectives traded-off due to the usage of constant value of elasticity for all
objectives.
2.8 GENETIC ALGORITHMS (GAs)
Genetic Algorithms (GAs) are evolutionary algorithms well-known as powerful and
broadly applicable stochastic search and optimization techniques. The GA framework
was first proposed by Holland (1975) and further investigated by De Jong’s doctoral
dissertation (1975). However, more interest was generated when Goldberg published
his famous book in 1989 which has become a standard text for GAs (Goldberg 1989).
Within less than a decade since Goldberg’s book, GAs have been widely applied in
many engineering fields.
2.8.1 GA Concepts and Terminology
GAs can be often classified into two main types; binary and continuous (Haupt &
Haupt 2004). In this section, the binary GA is presented and explained. However, the
overall idea remains the same for continuous GA with some modifications.
In binary GA, solutions are represented by binary strings (chromosomes)
evolve in a manner similar to the genetic growth (Gen & Cheng 2000). A population
of strings P(t) at the tth iteration (generation) is randomly initialized giving a diverse
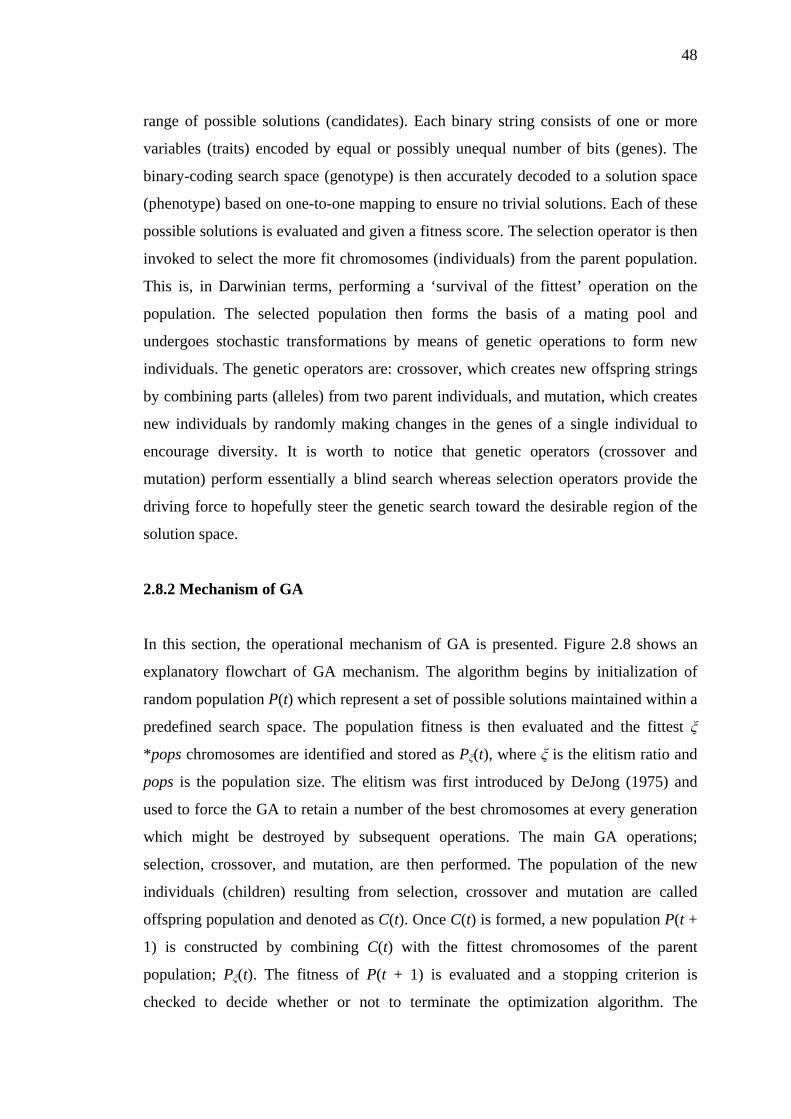
48
range of possible solutions (candidates). Each binary string consists of one or more
variables (traits) encoded by equal or possibly unequal number of bits (genes). The
binary-coding search space (genotype) is then accurately decoded to a solution space
(phenotype) based on one-to-one mapping to ensure no trivial solutions. Each of these
possible solutions is evaluated and given a fitness score. The selection operator is then
invoked to select the more fit chromosomes (individuals) from the parent population.
This is, in Darwinian terms, performing a ‘survival of the fittest’ operation on the
population. The selected population then forms the basis of a mating pool and
undergoes stochastic transformations by means of genetic operations to form new
individuals. The genetic operators are: crossover, which creates new offspring strings
by combining parts (alleles) from two parent individuals, and mutation, which creates
new individuals by randomly making changes in the genes of a single individual to
encourage diversity. It is worth to notice that genetic operators (crossover and
mutation) perform essentially a blind search whereas selection operators provide the
driving force to hopefully steer the genetic search toward the desirable region of the
solution space.
2.8.2 Mechanism of GA
In this section, the operational mechanism of GA is presented. Figure 2.8 shows an
explanatory flowchart of GA mechanism. The algorithm begins by initialization of
random population P(t) which represent a set of possible solutions maintained within a
predefined search space. The population fitness is then evaluated and the fittest ξ
*pops chromosomes are identified and stored as Pξ(t), where ξ is the elitism ratio and
pops is the population size. The elitism was first introduced by DeJong (1975) and
used to force the GA to retain a number of the best chromosomes at every generation
which might be destroyed by subsequent operations. The main GA operations;
selection, crossover, and mutation, are then performed. The population of the new
individuals (children) resulting from selection, crossover and mutation are called
offspring population and denoted as C(t). Once C(t) is formed, a new population P(t +
1) is constructed by combining C(t) with the fittest chromosomes of the parent
population; Pξ(t). The fitness of P(t + 1) is evaluated and a stopping criterion is
checked to decide whether or not to terminate the optimization algorithm. The
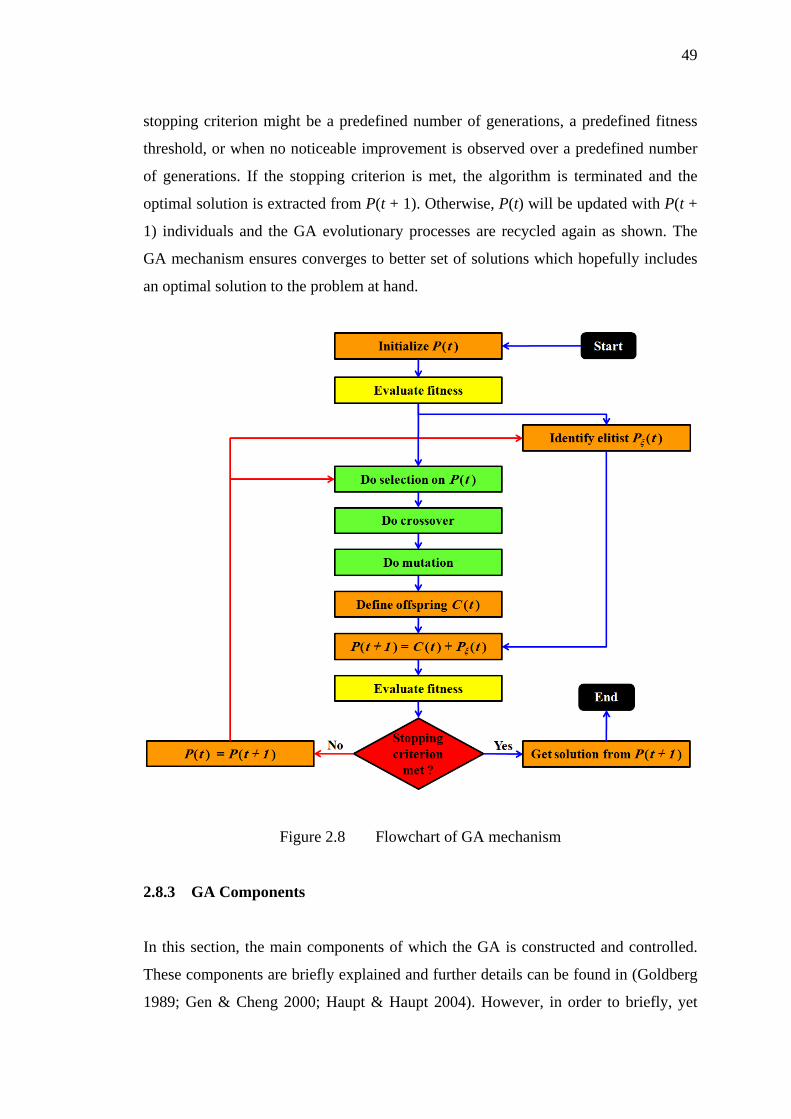
49
stopping criterion might be a predefined number of generations, a predefined fitness
threshold, or when no noticeable improvement is observed over a predefined number
of generations. If the stopping criterion is met, the algorithm is terminated and the
optimal solution is extracted from P(t + 1). Otherwise, P(t) will be updated with P(t +
1) individuals and the GA evolutionary processes are recycled again as shown. The
GA mechanism ensures converges to better set of solutions which hopefully includes
an optimal solution to the problem at hand.
Figure 2.8 Flowchart of GA mechanism
2.8.3 GA Components
In this section, the main components of which the GA is constructed and controlled.
These components are briefly explained and further details can be found in (Goldberg
1989; Gen & Cheng 2000; Haupt & Haupt 2004). However, in order to briefly, yet
50
sufficiently, explain these components, the subsequent sections are associated with an
exemplary optimization problem.
(i) Decision variables and fitness functions: The GA begins by defining the given
optimization problem and its corresponding decision variables. The optimization
problem might be a maximization or minimization problem based on its physical
interpretation. The defined problem is formulated as a fitness function which might be
a mathematical function or a game. Fitness scores are calculated by frequent
evaluations of the fitness function at different sets of input decision variables. Each set
of decision variables forms a chromosome. If the chromosome has Nvar variables
given by p1, p2, …, pNvar in an Nvar-dimensional optimization problem, then the
chromosome is written as a vector of Nvar elements,
Chromosome = [p1, p2, p3, …, pNvar] (2.16)
To efficiently associate the theory with practical application, an optimization
problem depicted in Figure 2.9 and mathematically expressed in (2.17) is presented as
1,132),(max
222222222 ))8.0((1000))5.0((1000)(2
≤≤−++= +−−+−−+−
yxtosubjecteeeyxf yxyxyx
(2.17)
Obviously, this fitness function is a 2-Dimensional constrained problem that
can be solved by finding (xopt,yopt) at which f(x, y) is maximized. As can be seen in
Figure 2.9, the problem has global maxima as well as local maxima. The decision
variables represent any {x, y} pair and equation (2.16) can therefore be written as
Chromosome = [x, y] (2.18)
(ii) Variable encoding and decoding: Binary encoding was historically considered
since Holland’s time and therefore, most following works have been using binary
encodings due to the well-developed and binary-based theories and mechanisms
(Mitchell 1996). On the other hand, GAs with real and integer encodings were also
51
used (Wright 1991; Lin et al. 1992; Thomas et al. 1995). However, there have been no
rigorous guidelines for predicting which encoding scheme will work better for a given
application. In binary GA, the decision variables are represented in binary. Thus,
stable encoding and decoding processes are required to map the decimal range of
decision variables to a binary range and vice versa, respectively. Assume that each
decision variable in decimal is encoded into an ngenes bits string, then, each
chromosome as in (2.16) will be consisted of Nvar * ngenes bits. Taking the given
problem at (2.17) into account with using 16-bit string per variable, a chromosome of
32 bits is generated.
(iii) Population of chromosomes: After the fitness function and its corresponding
decision variables are all identified, The GA intialized by randomly generating a
group of chromosomes called population. Each chromosome (of Nvar decision
variables) in the population represents a possible solution to the given problem. This
initial population of pops chromosomes (potential solutions) is shown in Figure 2.9 as
black markers. The chromosomes of the initial population will undergo GA operations
to produce new chromosomes with hopefully better fitness values. Other alternatives
than random initial population is the uniform population, where chromosomes are
uniformly distributed across the search space, and complementary sampling, where
half the population is randomly generated and the second half is the complementary
chromosomes of the first half (Haupt & Haupt 2004).
(iv) Chromosome selection: Once the initial population is generated, certain ones of
its chromosomes are selected for mating. The main purpose of selection is to choose
the fittest individuals of every population for reproduction in hopes that their offspring
will have better fitness. To achieve this purpose, several selection schemes were
proposed in the literature and again, it could be worth to say that there are no clear
guidelines to know which selection scheme works best for which application. To
maintain the best chromosomes of every population, elitism strategy is often used
(DeJong 1975). With pops being the population size of P(t), the elitist (fittest ever) ξ
*pops chromosomes are transferred straight away to the next population. Thus, the
selection process aims at selecting the good chromosomes from which (1 – ξ) *pops
new chromosomes are generated and are to replace the discarded chromosomes.
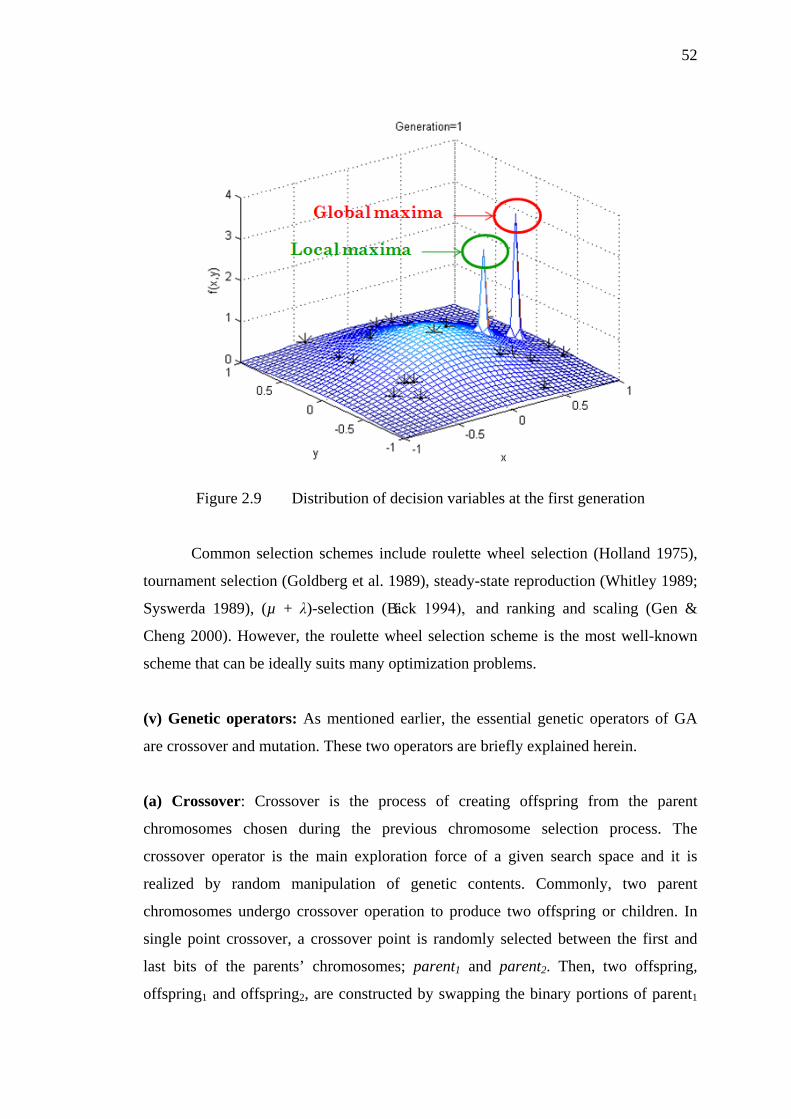
52
Figure 2.9 Distribution of decision variables at the first generation
Common selection schemes include roulette wheel selection (Holland 1975),
tournament selection (Goldberg et al. 1989), steady-state reproduction (Whitley 1989;
Syswerda 1989), (µ + λ)-selection (Bӓck 1994), and ranking and scaling (Gen &
Cheng 2000). However, the roulette wheel selection scheme is the most well-known
scheme that can be ideally suits many optimization problems.
(v) Genetic operators: As mentioned earlier, the essential genetic operators of GA
are crossover and mutation. These two operators are briefly explained herein.
(a) Crossover: Crossover is the process of creating offspring from the parent
chromosomes chosen during the previous chromosome selection process. The
crossover operator is the main exploration force of a given search space and it is
realized by random manipulation of genetic contents. Commonly, two parent
chromosomes undergo crossover operation to produce two offspring or children. In
single point crossover, a crossover point is randomly selected between the first and
last bits of the parents’ chromosomes; parent1 and parent2. Then, two offspring,
offspring1 and offspring2, are constructed by swapping the binary portions of parent1
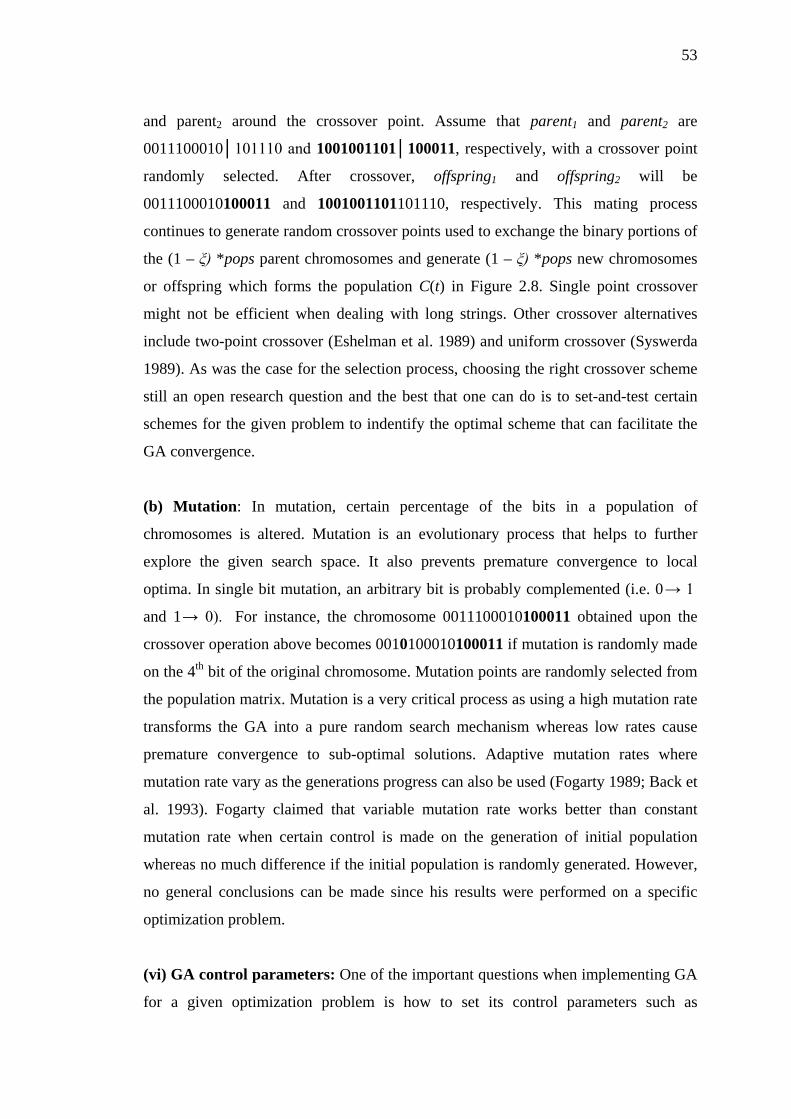
53
and parent2 around the crossover point. Assume that parent1 and parent2 are
0011100010│101110 and 1001001101│100011, respectively, with a crossover point
randomly selected. After crossover, offspring1 and offspring2 will be
0011100010100011 and 1001001101101110, respectively. This mating process
continues to generate random crossover points used to exchange the binary portions of
the (1 – ξ) *pops parent chromosomes and generate (1 – ξ) *pops new chromosomes
or offspring which forms the population C(t) in Figure 2.8. Single point crossover
might not be efficient when dealing with long strings. Other crossover alternatives
include two-point crossover (Eshelman et al. 1989) and uniform crossover (Syswerda
1989). As was the case for the selection process, choosing the right crossover scheme
still an open research question and the best that one can do is to set-and-test certain
schemes for the given problem to indentify the optimal scheme that can facilitate the
GA convergence.
(b) Mutation: In mutation, certain percentage of the bits in a population of
chromosomes is altered. Mutation is an evolutionary process that helps to further
explore the given search space. It also prevents premature convergence to local
optima. In single bit mutation, an arbitrary bit is probably complemented (i.e. 0 → 1
and 1 → 0). For instance, the chromosome 0011100010100011 obtained upon the
crossover operation above becomes 0010100010100011 if mutation is randomly made
on the 4th bit of the original chromosome. Mutation points are randomly selected from
the population matrix. Mutation is a very critical process as using a high mutation rate
transforms the GA into a pure random search mechanism whereas low rates cause
premature convergence to sub-optimal solutions. Adaptive mutation rates where
mutation rate vary as the generations progress can also be used (Fogarty 1989; Back et
al. 1993). Fogarty claimed that variable mutation rate works better than constant
mutation rate when certain control is made on the generation of initial population
whereas no much difference if the initial population is randomly generated. However,
no general conclusions can be made since his results were performed on a specific
optimization problem.
(vi) GA control parameters: One of the important questions when implementing GA
for a given optimization problem is how to set its control parameters such as
54
population size, crossover rate, and mutation rate. Unfortunately, these parameters are
nonlinearly dependent on one another and therefore, they cannot be optimized
independently. There have been many research studies trying to answer this question
although their conclusions don’t really tally with each other. These conflicts are due to
the usage of different research methodology and suite of benchmarking functions.
De Jong (1975) carried out an early experimental study to analyze the effect of
varying the control parameters on GA online and offline performance. The online
performance is defined as the average fitness of all chromosomes formed in all
generations where as the offline performance is defined by the fitness estimate of the
best chromosome for each generation. De Jong made use of a particular suite of
benchmarking functions to evaluate the GA performance over different settings of
control parameters. He found out that there are always specific values of control
parameters that produce good online and offline performance and they are as stated in
Table 2.5. De Jong’s functions have been widely used in the literature for evaluation
of evolutionary algorithms. Grefenstette (1986) came out with an interesting approach
when he optimized the GA parameters by another GA. The results obtained in this
method can be said to be more reliable than those obtained from experimental studies.
Grefenstette’s setting of GA control parameters is as mentioned in Table 2.5. Another
comprehensive experiment was conducted by Schaffer et al. (1989) who spent more
than a year of CPU time on systematic testing of a large set of parameter combinations
and his finding of optimal set of GA control parameters is addressed in Table 2.5.
However, all above studies as well as other recent literature studies focus on searching
for optimal parameter settings for specific sets of benchmarking functions. Thus, the
parameter values of each setting will most likely differ when applied on different
optimization problems and/or real-world engineering problems.
Table 2.5 Suggested values of GA control parameters
GA Control parameters (De Jong 1975) (Grefenstette 1986) (Schaffer et al. 1989)
Population size 50-100 30 20-30 Crossover rate 0.60 0.95 0.75-0.95 Mutation rate 0.001 0.01 0.005-0.01
55
(vii) Algorithm convergence: To observe the convergence of a GA, a performance
metric should be used. The most common approach of evaluating the convergence
performance is to calculate the maximum (best) fitness in each population as well as
the mean (average) fitness of all chromosomes of each population. Figure 2.10
displays the GA performance over 100 generations. It is clear that the GA can find the
global maxima of Figure 2.9 within less than 50 generations. The GA termination
criteria can be a predefined number of generations, a predefined fitness threshold, or
when no noticeable improvement is observed over a predefined number of
generations. Other researchers prefer to use the number of fitness evaluations rather
than number of GA generations (Nickabadi et al. 2011).
Figure 2.10 GA performance over 100 generations of optimizing equation (2.17)
2.9 PREVIOUS WORK OF EVOLUTIONARY ALGORITHMS FOR CR
For the past few decades, the area of artificial intelligence (AI) is being receiving a
great attention by the scientific research community. In the context of CR, several AI
techniques have been proposed and implemented for different fields and applications
of CR systems and networks. These AI techniques include, but not limited to,
evolutionary algorithms such as genetic algorithms (GAs), neural networks (NNs),
fuzzy control, game theory, knowledge-based Reasoning, and case-based reasoning
(Fette 2009). In this section, a survey on GA-based research works of CR is presented.
0 10 20 30 40 50 60 70 80 90 1000
0.5
1
1.5
2
2.5
3
3.5
Generation
Fitn
ess
Maximum fitnessMean fitness
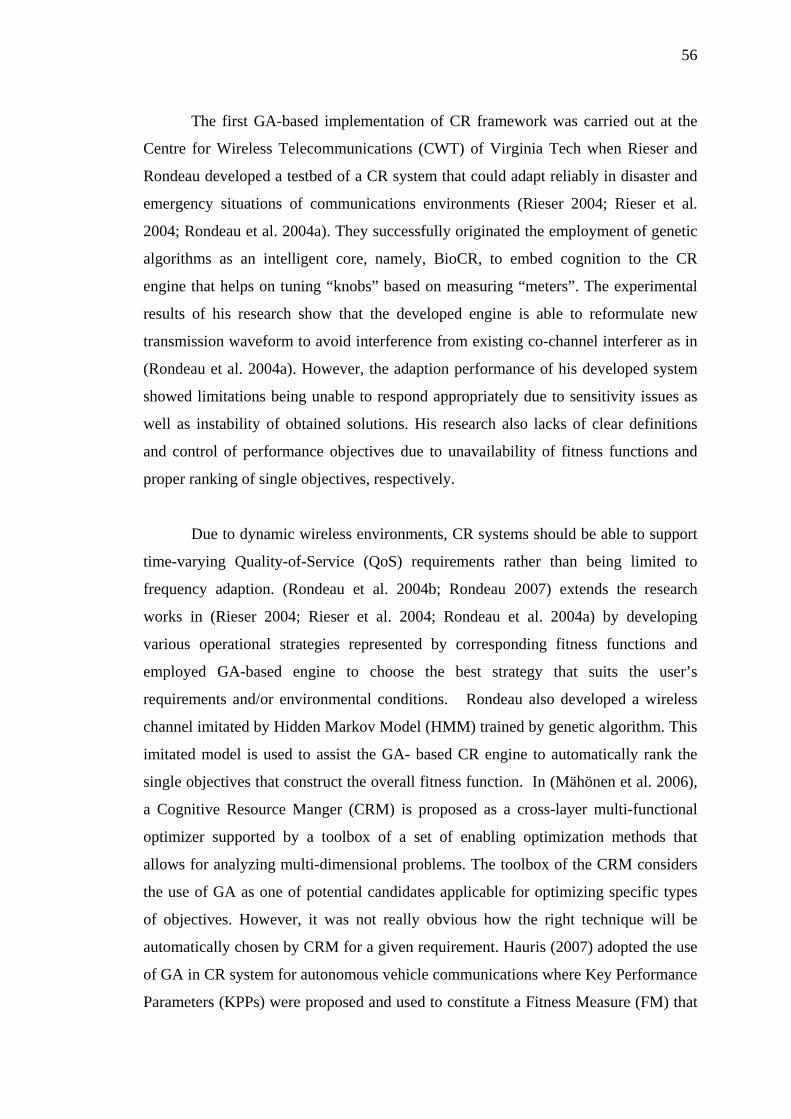
56
The first GA-based implementation of CR framework was carried out at the
Centre for Wireless Telecommunications (CWT) of Virginia Tech when Rieser and
Rondeau developed a testbed of a CR system that could adapt reliably in disaster and
emergency situations of communications environments (Rieser 2004; Rieser et al.
2004; Rondeau et al. 2004a). They successfully originated the employment of genetic
algorithms as an intelligent core, namely, BioCR, to embed cognition to the CR
engine that helps on tuning “knobs” based on measuring “meters”. The experimental
results of his research show that the developed engine is able to reformulate new
transmission waveform to avoid interference from existing co-channel interferer as in
(Rondeau et al. 2004a). However, the adaption performance of his developed system
showed limitations being unable to respond appropriately due to sensitivity issues as
well as instability of obtained solutions. His research also lacks of clear definitions
and control of performance objectives due to unavailability of fitness functions and
proper ranking of single objectives, respectively.
Due to dynamic wireless environments, CR systems should be able to support
time-varying Quality-of-Service (QoS) requirements rather than being limited to
frequency adaption. (Rondeau et al. 2004b; Rondeau 2007) extends the research
works in (Rieser 2004; Rieser et al. 2004; Rondeau et al. 2004a) by developing
various operational strategies represented by corresponding fitness functions and
employed GA-based engine to choose the best strategy that suits the user’s
requirements and/or environmental conditions. Rondeau also developed a wireless
channel imitated by Hidden Markov Model (HMM) trained by genetic algorithm. This
imitated model is used to assist the GA- based CR engine to automatically rank the
single objectives that construct the overall fitness function. In (Mähönen et al. 2006),
a Cognitive Resource Manger (CRM) is proposed as a cross-layer multi-functional
optimizer supported by a toolbox of a set of enabling optimization methods that
allows for analyzing multi-dimensional problems. The toolbox of the CRM considers
the use of GA as one of potential candidates applicable for optimizing specific types
of objectives. However, it was not really obvious how the right technique will be
automatically chosen by CRM for a given requirement. Hauris (2007) adopted the use
of GA in CR system for autonomous vehicle communications where Key Performance
Parameters (KPPs) were proposed and used to constitute a Fitness Measure (FM) that
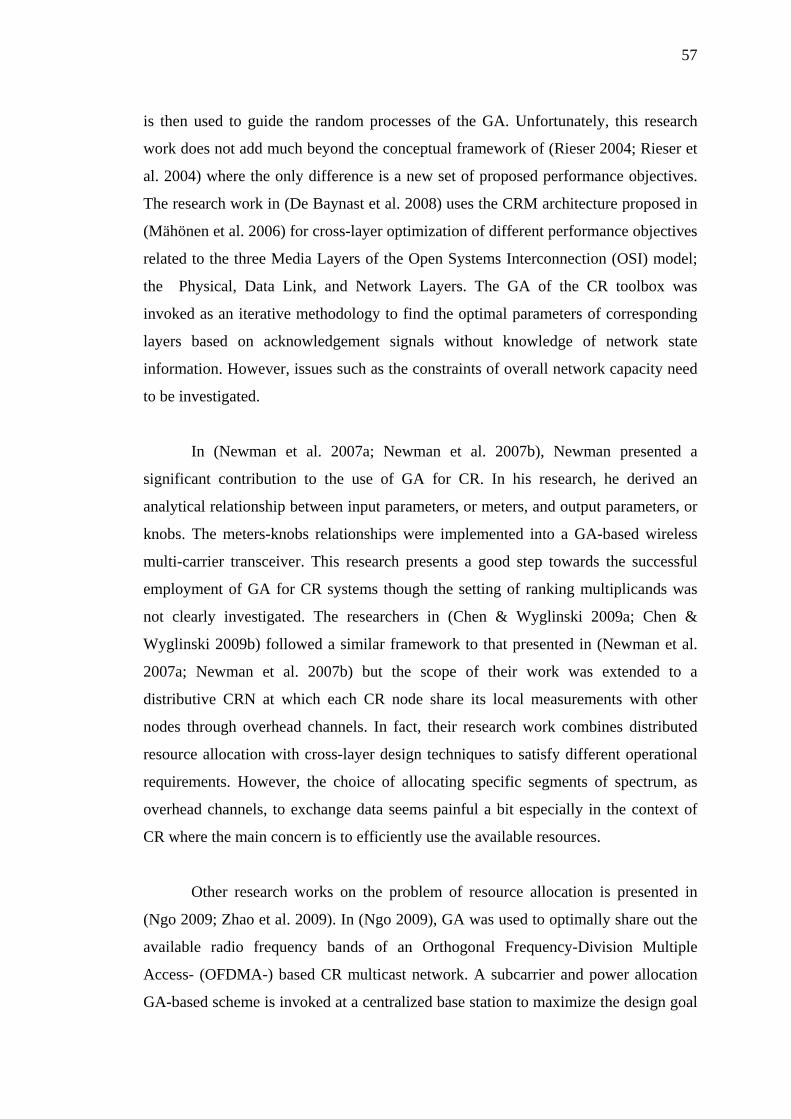
57
is then used to guide the random processes of the GA. Unfortunately, this research
work does not add much beyond the conceptual framework of (Rieser 2004; Rieser et
al. 2004) where the only difference is a new set of proposed performance objectives.
The research work in (De Baynast et al. 2008) uses the CRM architecture proposed in
(Mähönen et al. 2006) for cross-layer optimization of different performance objectives
related to the three Media Layers of the Open Systems Interconnection (OSI) model;
the Physical, Data Link, and Network Layers. The GA of the CR toolbox was
invoked as an iterative methodology to find the optimal parameters of corresponding
layers based on acknowledgement signals without knowledge of network state
information. However, issues such as the constraints of overall network capacity need
to be investigated.
In (Newman et al. 2007a; Newman et al. 2007b), Newman presented a
significant contribution to the use of GA for CR. In his research, he derived an
analytical relationship between input parameters, or meters, and output parameters, or
knobs. The meters-knobs relationships were implemented into a GA-based wireless
multi-carrier transceiver. This research presents a good step towards the successful
employment of GA for CR systems though the setting of ranking multiplicands was
not clearly investigated. The researchers in (Chen & Wyglinski 2009a; Chen &
Wyglinski 2009b) followed a similar framework to that presented in (Newman et al.
2007a; Newman et al. 2007b) but the scope of their work was extended to a
distributive CRN at which each CR node share its local measurements with other
nodes through overhead channels. In fact, their research work combines distributed
resource allocation with cross-layer design techniques to satisfy different operational
requirements. However, the choice of allocating specific segments of spectrum, as
overhead channels, to exchange data seems painful a bit especially in the context of
CR where the main concern is to efficiently use the available resources.
Other research works on the problem of resource allocation is presented in
(Ngo 2009; Zhao et al. 2009). In (Ngo 2009), GA was used to optimally share out the
available radio frequency bands of an Orthogonal Frequency-Division Multiple
Access- (OFDMA-) based CR multicast network. A subcarrier and power allocation
GA-based scheme is invoked at a centralized base station to maximize the design goal
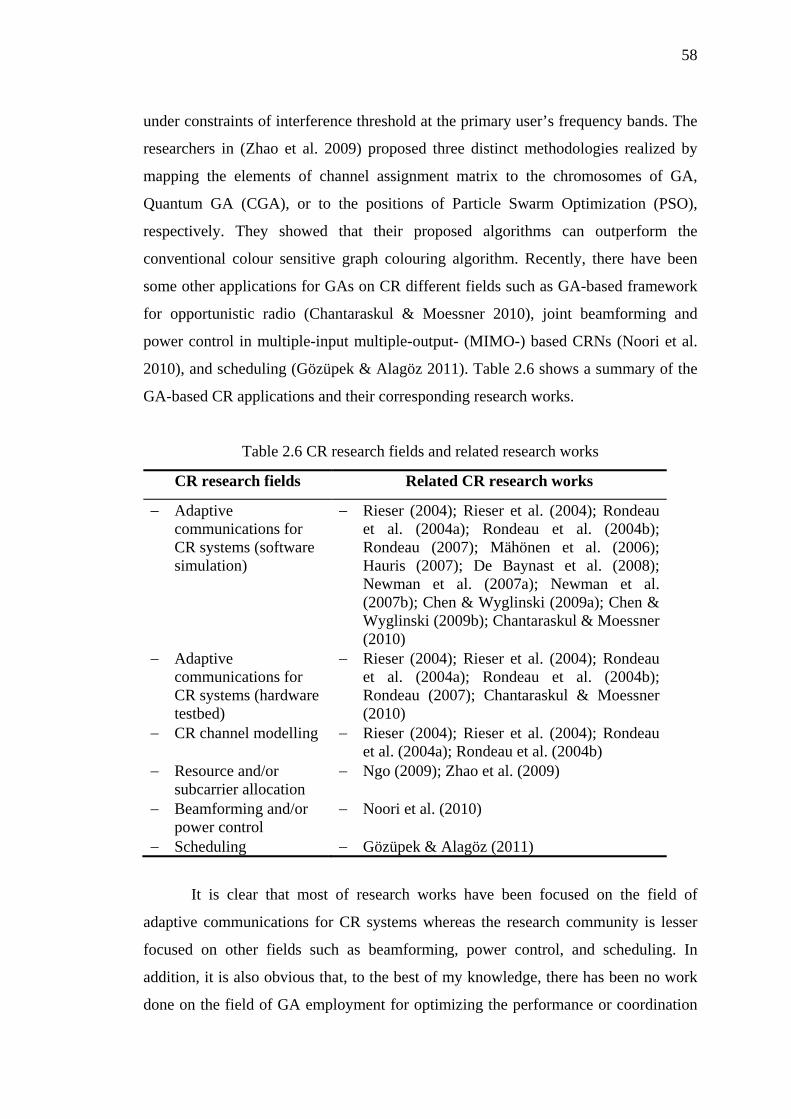
58
under constraints of interference threshold at the primary user’s frequency bands. The
researchers in (Zhao et al. 2009) proposed three distinct methodologies realized by
mapping the elements of channel assignment matrix to the chromosomes of GA,
Quantum GA (CGA), or to the positions of Particle Swarm Optimization (PSO),
respectively. They showed that their proposed algorithms can outperform the
conventional colour sensitive graph colouring algorithm. Recently, there have been
some other applications for GAs on CR different fields such as GA-based framework
for opportunistic radio (Chantaraskul & Moessner 2010), joint beamforming and
power control in multiple-input multiple-output- (MIMO-) based CRNs (Noori et al.
2010), and scheduling (Gözüpek & Alagöz 2011). Table 2.6 shows a summary of the
GA-based CR applications and their corresponding research works.
Table 2.6 CR research fields and related research works
CR research fields Related CR research works
− Adaptive communications for CR systems (software simulation)
− Rieser (2004); Rieser et al. (2004); Rondeau et al. (2004a); Rondeau et al. (2004b); Rondeau (2007); Mähönen et al. (2006); Hauris (2007); De Baynast et al. (2008); Newman et al. (2007a); Newman et al. (2007b); Chen & Wyglinski (2009a); Chen & Wyglinski (2009b); Chantaraskul & Moessner (2010)
− Adaptive communications for CR systems (hardware testbed)
− Rieser (2004); Rieser et al. (2004); Rondeau et al. (2004a); Rondeau et al. (2004b); Rondeau (2007); Chantaraskul & Moessner (2010)
− CR channel modelling − Rieser (2004); Rieser et al. (2004); Rondeau et al. (2004a); Rondeau et al. (2004b)
− Resource and/or subcarrier allocation
− Ngo (2009); Zhao et al. (2009)
− Beamforming and/or power control
− Noori et al. (2010)
− Scheduling − Gözüpek & Alagöz (2011)
It is clear that most of research works have been focused on the field of
adaptive communications for CR systems whereas the research community is lesser
focused on other fields such as beamforming, power control, and scheduling. In
addition, it is also obvious that, to the best of my knowledge, there has been no work
done on the field of GA employment for optimizing the performance or coordination
59
of cooperative spectrum sensing. Thus, this thesis presents the novelty of employing
GAs for optimizing different CRN structures as well as CR systems with improved
features.
2.10 SUMMARY
This chapter reviews many related aspects of cognitive radio, spectrum sensing, and
related solutions. It begins with an introductory background to CR capabilities and
potential applications in various engineering fields. The spectrum sensing is presented
in details as a key concept to realize dynamic spectrum solutions such as CR. The
evaluation procedure of detection performance is also explained. The common
challenges to realize efficient sensing schemes are reviewed. The local spectrum
sensing schemes are then extended to cooperative architectures and common fusion
approached of sensing data and sensing decisions are introduced as well as some other
DSA aspects. After providing the previous CR and spectrum sensing concepts, the
chapter proceeds to deliver brief background on the GA mechanism and associated
operators and parameters. Finally, a review on the literature of GA applications on CR
research fields is presented. This includes employing GAs for adaptive CR systems,
channel modelling, resource allocation, beamforming and scheduling. This chapter is
considered as a cornerstone reference that cover most of the research methods and
components used on the following chapters.
CHAPTER III
MOGA-ASSISTED DECISION ENGINE FOR CR SYSTEMS
3.1 INTRODUCTION
In a CRN, a CR node should be able to autonomously adapt to surrounding
environmental conditions by means of configurable parameters or “knobs”. This
chapter presents a realization of a CR system by incorporating a GA decision engine
on it. The research methodology followed in this chapter is as outlined in Chapter I.
Various steps are implicitly explained within the text to improve the chapter
readability. This chapter begins with introducing the motivation towards the
modulation scheme proposed for CR systems and problem formulation. The, the CR
system development, performance evaluation, and sensitivity analysis is presented.
3.2 PROBLEM FORMULATION
To develop a CR system, the main challenge is to propose a cognition entity that maps
the CR input parameters to its output parameters based on predefined performance
objectives. For a system to be cognitive, it should be aware of the surrounding
wireless conditions and able to autonomously adapt to a certain transmission mode
that optimizes the overall performance of the system. This awareness of channel
condition is realized by defining the CR inputs as environmentally sensed parameters
which are used in conjunction with predefined radio objectives to determine an
optimal setting of transmission parameters. A simplified crucial diagram of the
cognition components of a CR system is depicted in Figure 3.1. In the next sections, a
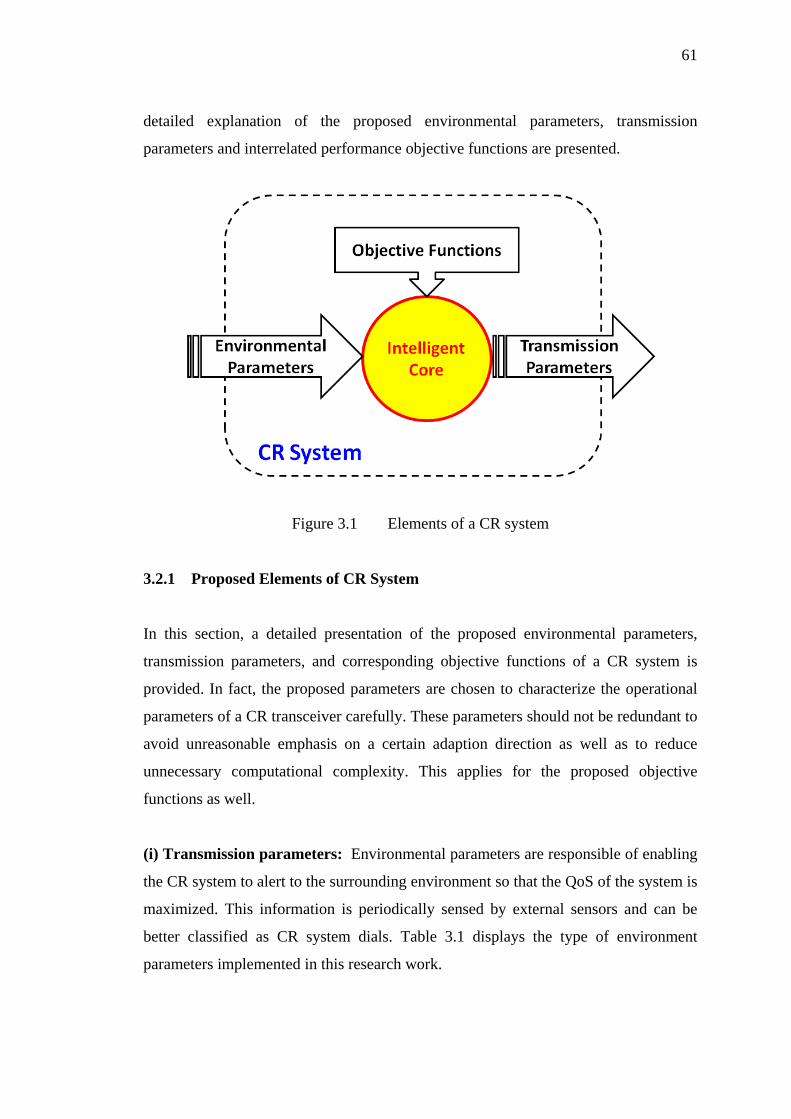
61
detailed explanation of the proposed environmental parameters, transmission
parameters and interrelated performance objective functions are presented.
Figure 3.1 Elements of a CR system
3.2.1 Proposed Elements of CR System
In this section, a detailed presentation of the proposed environmental parameters,
transmission parameters, and corresponding objective functions of a CR system is
provided. In fact, the proposed parameters are chosen to characterize the operational
parameters of a CR transceiver carefully. These parameters should not be redundant to
avoid unreasonable emphasis on a certain adaption direction as well as to reduce
unnecessary computational complexity. This applies for the proposed objective
functions as well.
(i) Transmission parameters: Environmental parameters are responsible of enabling
the CR system to alert to the surrounding environment so that the QoS of the system is
maximized. This information is periodically sensed by external sensors and can be
better classified as CR system dials. Table 3.1 displays the type of environment
parameters implemented in this research work.
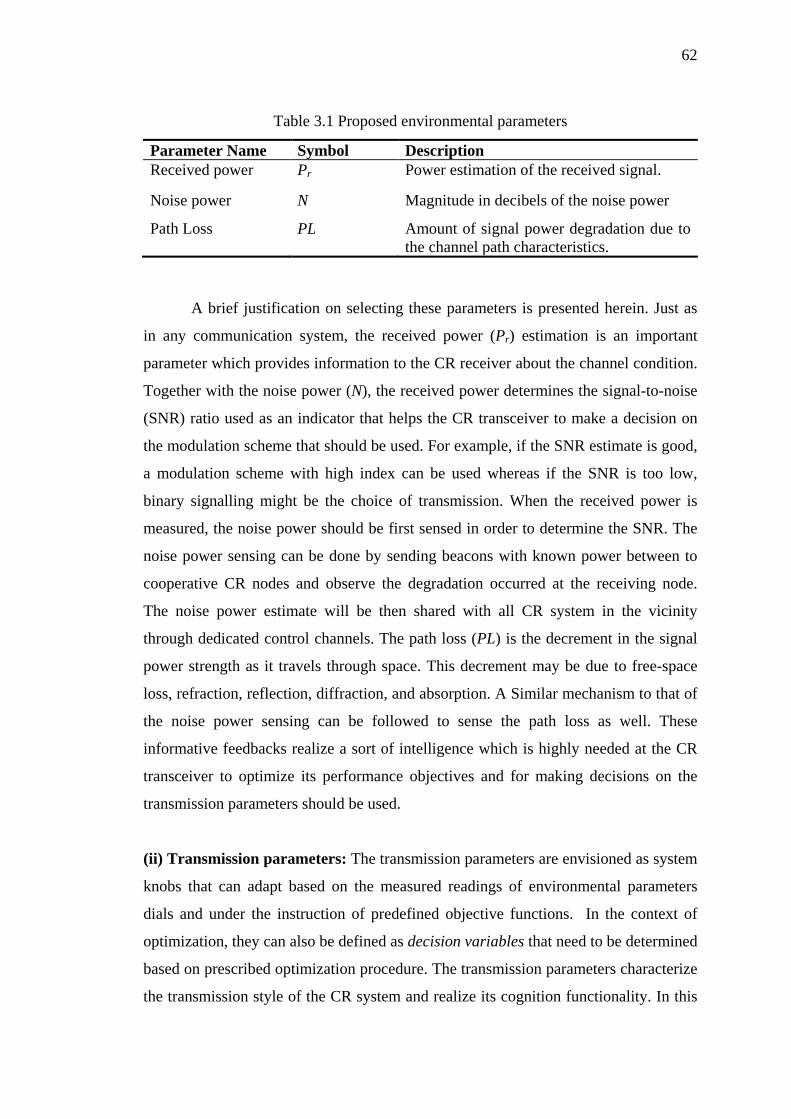
62
Table 3.1 Proposed environmental parameters
Parameter Name Symbol Description Received power Pr Power estimation of the received signal.
Noise power N Magnitude in decibels of the noise power
Path Loss PL Amount of signal power degradation due to the channel path characteristics.
A brief justification on selecting these parameters is presented herein. Just as
in any communication system, the received power (Pr) estimation is an important
parameter which provides information to the CR receiver about the channel condition.
Together with the noise power (N), the received power determines the signal-to-noise
(SNR) ratio used as an indicator that helps the CR transceiver to make a decision on
the modulation scheme that should be used. For example, if the SNR estimate is good,
a modulation scheme with high index can be used whereas if the SNR is too low,
binary signalling might be the choice of transmission. When the received power is
measured, the noise power should be first sensed in order to determine the SNR. The
noise power sensing can be done by sending beacons with known power between to
cooperative CR nodes and observe the degradation occurred at the receiving node.
The noise power estimate will be then shared with all CR system in the vicinity
through dedicated control channels. The path loss (PL) is the decrement in the signal
power strength as it travels through space. This decrement may be due to free-space
loss, refraction, reflection, diffraction, and absorption. A Similar mechanism to that of
the noise power sensing can be followed to sense the path loss as well. These
informative feedbacks realize a sort of intelligence which is highly needed at the CR
transceiver to optimize its performance objectives and for making decisions on the
transmission parameters should be used.
(ii) Transmission parameters: The transmission parameters are envisioned as system
knobs that can adapt based on the measured readings of environmental parameters
dials and under the instruction of predefined objective functions. In the context of
optimization, they can also be defined as decision variables that need to be determined
based on prescribed optimization procedure. The transmission parameters characterize
the transmission style of the CR system and realize its cognition functionality. In this
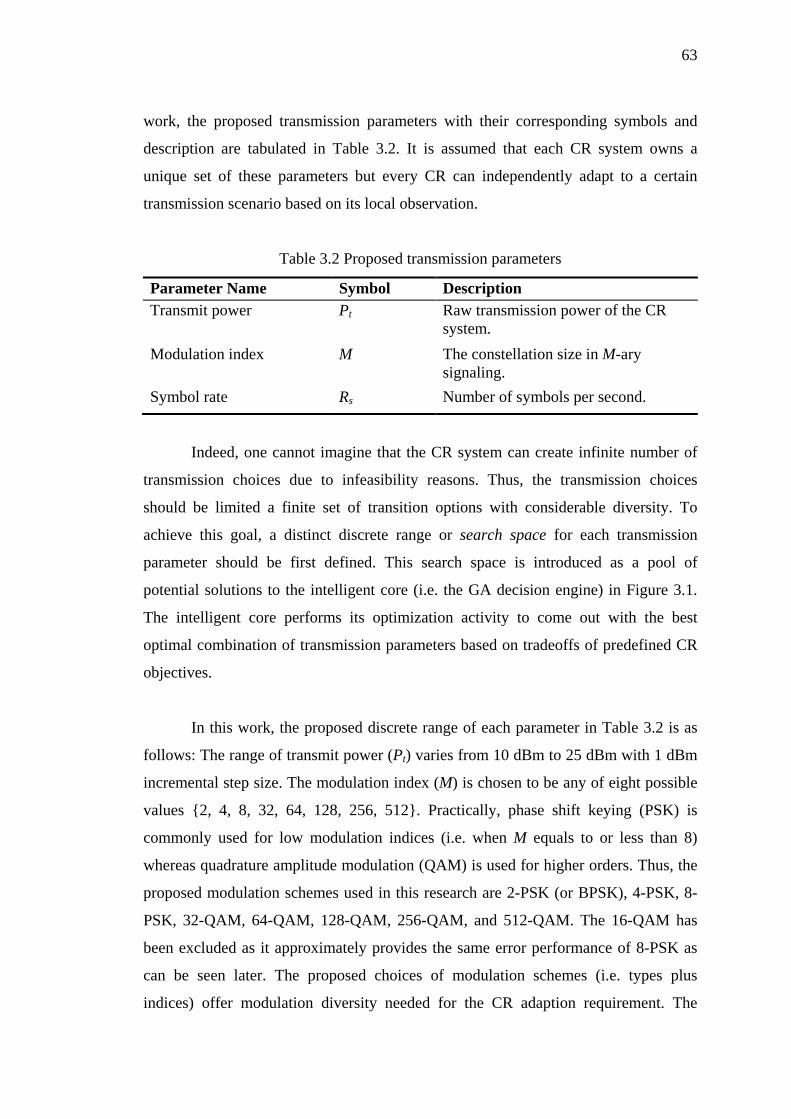
63
work, the proposed transmission parameters with their corresponding symbols and
description are tabulated in Table 3.2. It is assumed that each CR system owns a
unique set of these parameters but every CR can independently adapt to a certain
transmission scenario based on its local observation.
Table 3.2 Proposed transmission parameters
Parameter Name Symbol Description Transmit power Pt Raw transmission power of the CR
system. Modulation index M The constellation size in M-ary
signaling. Symbol rate Rs Number of symbols per second.
Indeed, one cannot imagine that the CR system can create infinite number of
transmission choices due to infeasibility reasons. Thus, the transmission choices
should be limited a finite set of transition options with considerable diversity. To
achieve this goal, a distinct discrete range or search space for each transmission
parameter should be first defined. This search space is introduced as a pool of
potential solutions to the intelligent core (i.e. the GA decision engine) in Figure 3.1.
The intelligent core performs its optimization activity to come out with the best
optimal combination of transmission parameters based on tradeoffs of predefined CR
objectives.
In this work, the proposed discrete range of each parameter in Table 3.2 is as
follows: The range of transmit power (Pt) varies from 10 dBm to 25 dBm with 1 dBm
incremental step size. The modulation index (M) is chosen to be any of eight possible
values {2, 4, 8, 32, 64, 128, 256, 512}. Practically, phase shift keying (PSK) is
commonly used for low modulation indices (i.e. when M equals to or less than 8)
whereas quadrature amplitude modulation (QAM) is used for higher orders. Thus, the
proposed modulation schemes used in this research are 2-PSK (or BPSK), 4-PSK, 8-
PSK, 32-QAM, 64-QAM, 128-QAM, 256-QAM, and 512-QAM. The 16-QAM has
been excluded as it approximately provides the same error performance of 8-PSK as
can be seen later. The proposed choices of modulation schemes (i.e. types plus
indices) offer modulation diversity needed for the CR adaption requirement. The
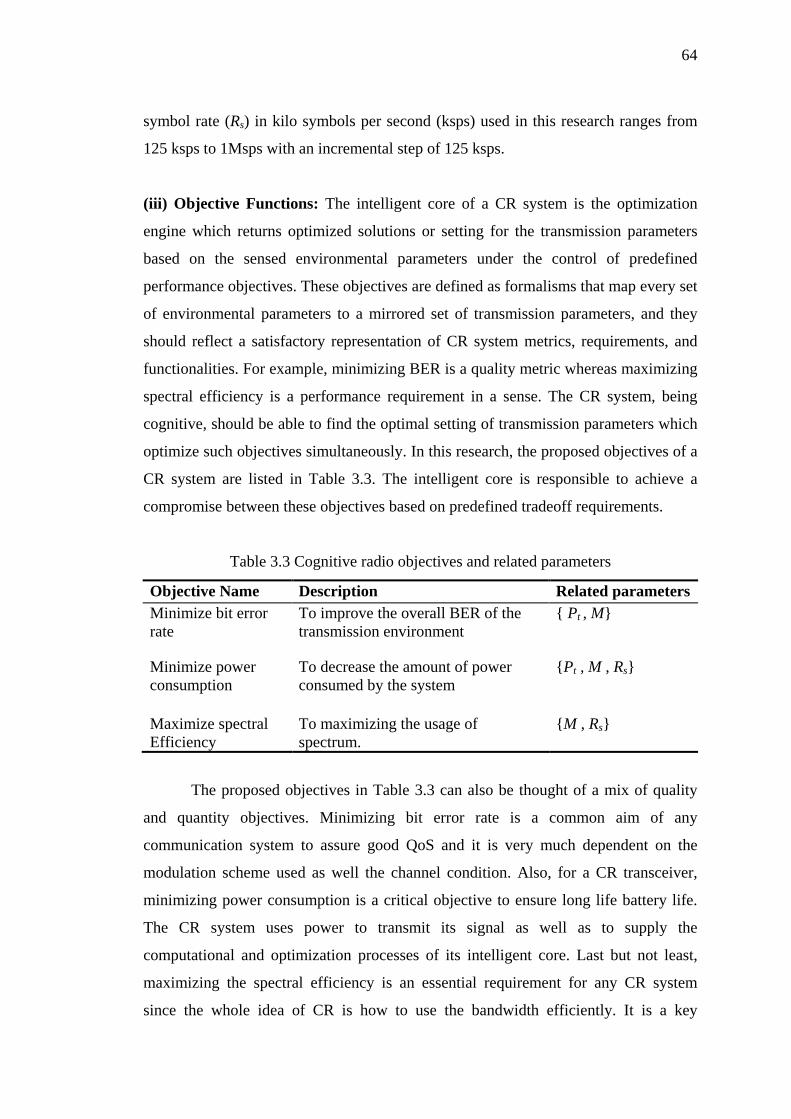
64
symbol rate (Rs) in kilo symbols per second (ksps) used in this research ranges from
125 ksps to 1Msps with an incremental step of 125 ksps.
(iii) Objective Functions: The intelligent core of a CR system is the optimization
engine which returns optimized solutions or setting for the transmission parameters
based on the sensed environmental parameters under the control of predefined
performance objectives. These objectives are defined as formalisms that map every set
of environmental parameters to a mirrored set of transmission parameters, and they
should reflect a satisfactory representation of CR system metrics, requirements, and
functionalities. For example, minimizing BER is a quality metric whereas maximizing
spectral efficiency is a performance requirement in a sense. The CR system, being
cognitive, should be able to find the optimal setting of transmission parameters which
optimize such objectives simultaneously. In this research, the proposed objectives of a
CR system are listed in Table 3.3. The intelligent core is responsible to achieve a
compromise between these objectives based on predefined tradeoff requirements.
Table 3.3 Cognitive radio objectives and related parameters
Objective Name Description Related parameters Minimize bit error rate
To improve the overall BER of the transmission environment
{ Pt , M}
Minimize power consumption
To decrease the amount of power consumed by the system
{Pt , M , Rs}
Maximize spectral Efficiency
To maximizing the usage of spectrum.
{M , Rs}
The proposed objectives in Table 3.3 can also be thought of a mix of quality
and quantity objectives. Minimizing bit error rate is a common aim of any
communication system to assure good QoS and it is very much dependent on the
modulation scheme used as well the channel condition. Also, for a CR transceiver,
minimizing power consumption is a critical objective to ensure long life battery life.
The CR system uses power to transmit its signal as well as to supply the
computational and optimization processes of its intelligent core. Last but not least,
maximizing the spectral efficiency is an essential requirement for any CR system
since the whole idea of CR is how to use the bandwidth efficiently. It is a key
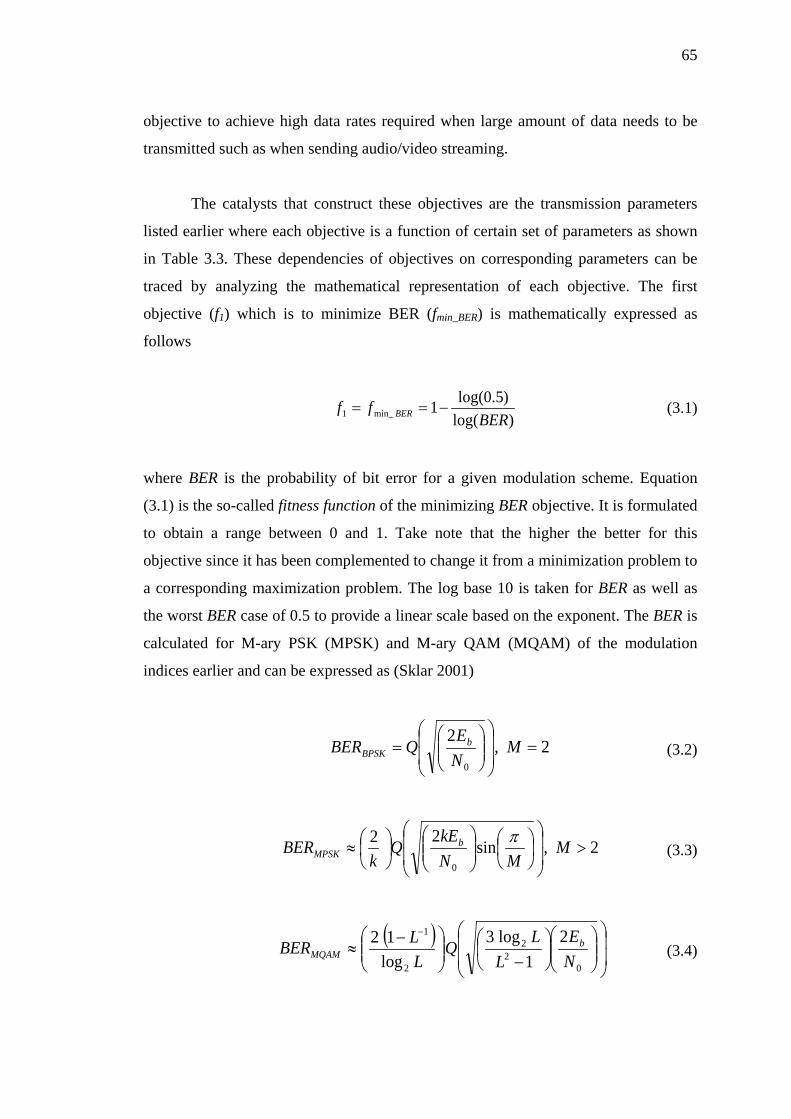
65
objective to achieve high data rates required when large amount of data needs to be
transmitted such as when sending audio/video streaming.
The catalysts that construct these objectives are the transmission parameters
listed earlier where each objective is a function of certain set of parameters as shown
in Table 3.3. These dependencies of objectives on corresponding parameters can be
traced by analyzing the mathematical representation of each objective. The first
objective (f1) which is to minimize BER (fmin_BER) is mathematically expressed as
follows
)log()5.0log(1min_1 BER
ff BER −== (3.1)
where BER is the probability of bit error for a given modulation scheme. Equation
(3.1) is the so-called fitness function of the minimizing BER objective. It is formulated
to obtain a range between 0 and 1. Take note that the higher the better for this
objective since it has been complemented to change it from a minimization problem to
a corresponding maximization problem. The log base 10 is taken for BER as well as
the worst BER case of 0.5 to provide a linear scale based on the exponent. The BER is
calculated for M-ary PSK (MPSK) and M-ary QAM (MQAM) of the modulation
indices earlier and can be expressed as (Sklar 2001)
2,2
0
=
= M
NEQBER b
BPSK
(3.2)
2,sin22
0
>
≈ M
MNkEQ
kBER b
MPSKπ
(3.3)
( )
−
−≈
−
02
2
2
1 21
log3log12
NE
LLQ
LLBER b
MQAM
(3.4)
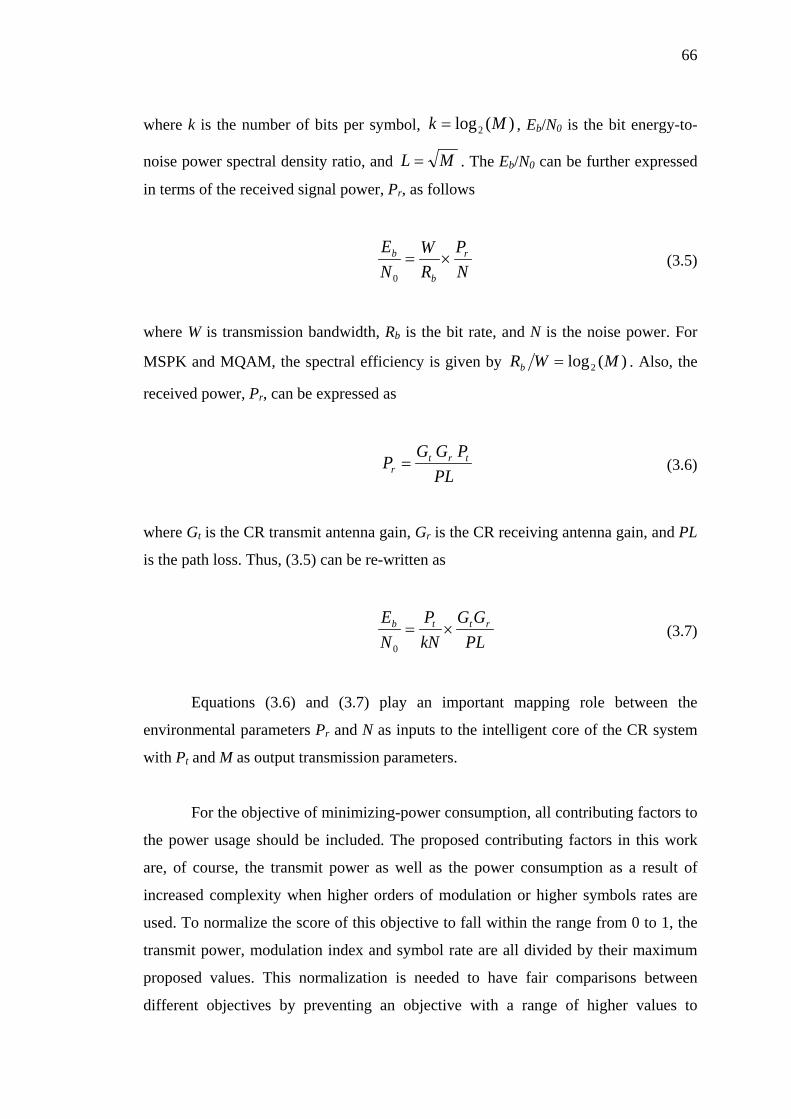
66
where k is the number of bits per symbol, )(log2 Mk = , Eb/N0 is the bit energy-to-
noise power spectral density ratio, and ML = . The Eb/N0 can be further expressed
in terms of the received signal power, Pr, as follows
NP
RW
NE r
b
b ×=0
(3.5)
where W is transmission bandwidth, Rb is the bit rate, and N is the noise power. For
MSPK and MQAM, the spectral efficiency is given by )(log2 MWRb = . Also, the
received power, Pr, can be expressed as
PLPGGP trt
r =
(3.6)
where Gt is the CR transmit antenna gain, Gr is the CR receiving antenna gain, and PL
is the path loss. Thus, (3.5) can be re-written as
PLGG
kNP
NE rttb ×=
0
(3.7)
Equations (3.6) and (3.7) play an important mapping role between the
environmental parameters Pr and N as inputs to the intelligent core of the CR system
with Pt and M as output transmission parameters.
For the objective of minimizing-power consumption, all contributing factors to
the power usage should be included. The proposed contributing factors in this work
are, of course, the transmit power as well as the power consumption as a result of
increased complexity when higher orders of modulation or higher symbols rates are
used. To normalize the score of this objective to fall within the range from 0 to 1, the
transmit power, modulation index and symbol rate are all divided by their maximum
proposed values. This normalization is needed to have fair comparisons between
different objectives by preventing an objective with a range of higher values to
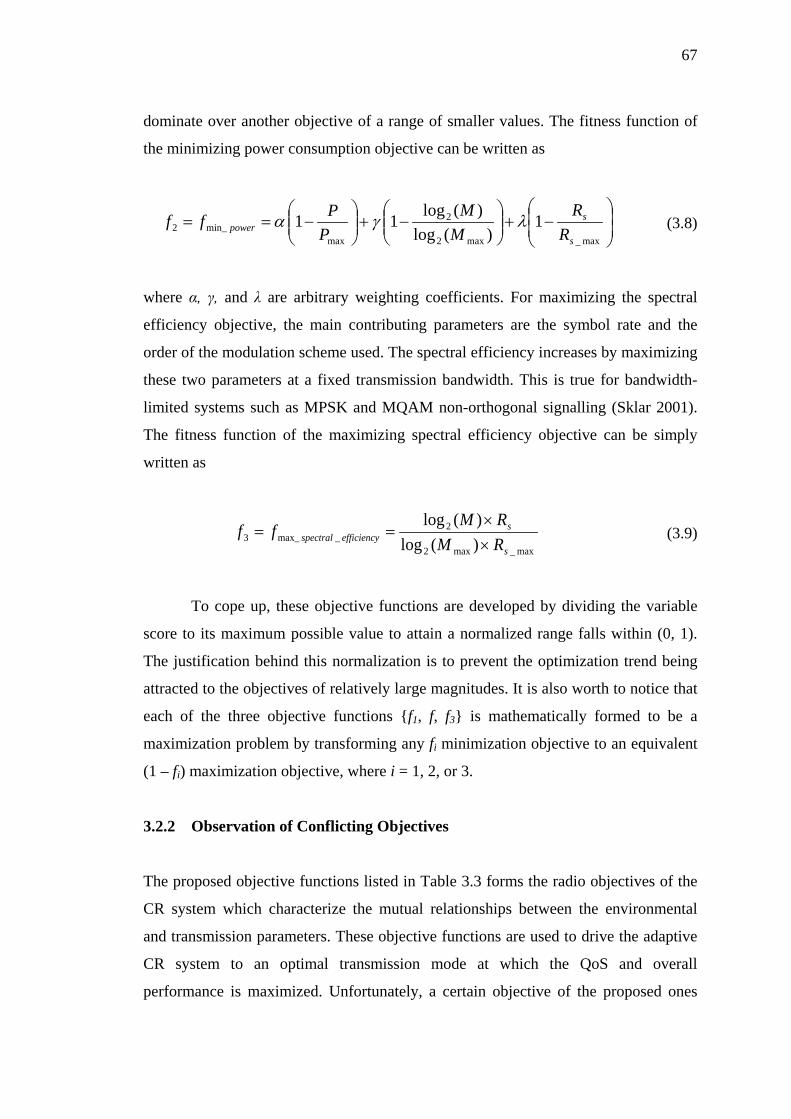
67
dominate over another objective of a range of smaller values. The fitness function of
the minimizing power consumption objective can be written as
−+
−+
−==
max_max2
2
maxmin_2 1
)(log)(log11
s
spower R
RM
MPPff λγα (3.8)
where α, γ, and λ are arbitrary weighting coefficients. For maximizing the spectral
efficiency objective, the main contributing parameters are the symbol rate and the
order of the modulation scheme used. The spectral efficiency increases by maximizing
these two parameters at a fixed transmission bandwidth. This is true for bandwidth-
limited systems such as MPSK and MQAM non-orthogonal signalling (Sklar 2001).
The fitness function of the maximizing spectral efficiency objective can be simply
written as
max_max2
2_max_3 )(log
)(log
s
sefficiencyspectral RM
RMff
××
== (3.9)
To cope up, these objective functions are developed by dividing the variable
score to its maximum possible value to attain a normalized range falls within (0, 1).
The justification behind this normalization is to prevent the optimization trend being
attracted to the objectives of relatively large magnitudes. It is also worth to notice that
each of the three objective functions {f1, f, f3} is mathematically formed to be a
maximization problem by transforming any fi minimization objective to an equivalent
(1 – fi) maximization objective, where i = 1, 2, or 3.
3.2.2 Observation of Conflicting Objectives
The proposed objective functions listed in Table 3.3 forms the radio objectives of the
CR system which characterize the mutual relationships between the environmental
and transmission parameters. These objective functions are used to drive the adaptive
CR system to an optimal transmission mode at which the QoS and overall
performance is maximized. Unfortunately, a certain objective of the proposed ones
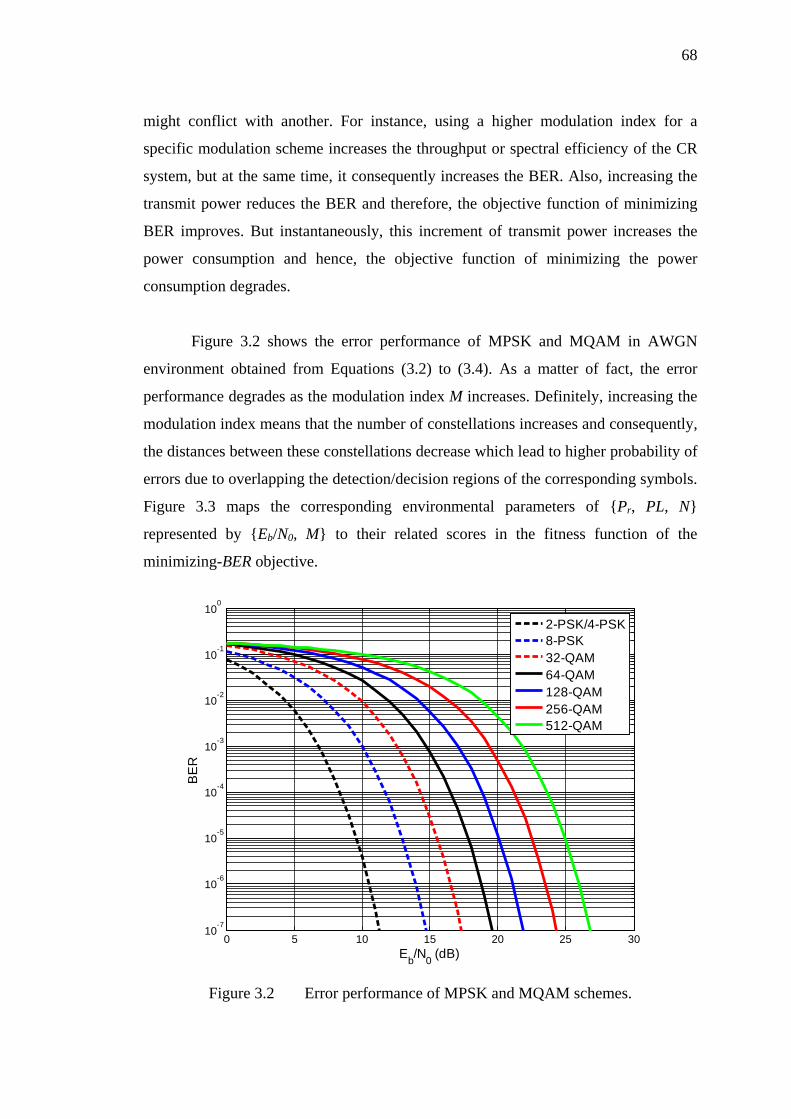
68
might conflict with another. For instance, using a higher modulation index for a
specific modulation scheme increases the throughput or spectral efficiency of the CR
system, but at the same time, it consequently increases the BER. Also, increasing the
transmit power reduces the BER and therefore, the objective function of minimizing
BER improves. But instantaneously, this increment of transmit power increases the
power consumption and hence, the objective function of minimizing the power
consumption degrades.
Figure 3.2 shows the error performance of MPSK and MQAM in AWGN
environment obtained from Equations (3.2) to (3.4). As a matter of fact, the error
performance degrades as the modulation index M increases. Definitely, increasing the
modulation index means that the number of constellations increases and consequently,
the distances between these constellations decrease which lead to higher probability of
errors due to overlapping the detection/decision regions of the corresponding symbols.
Figure 3.3 maps the corresponding environmental parameters of {Pr, PL, N}
represented by {Eb/N0, M} to their related scores in the fitness function of the
minimizing-BER objective.
Figure 3.2 Error performance of MPSK and MQAM schemes.
0 5 10 15 20 25 3010
-7
10-6
10-5
10-4
10-3
10-2
10-1
100
Eb/N0 (dB)
BE
R
2-PSK/4-PSK8-PSK32-QAM64-QAM128-QAM256-QAM512-QAM
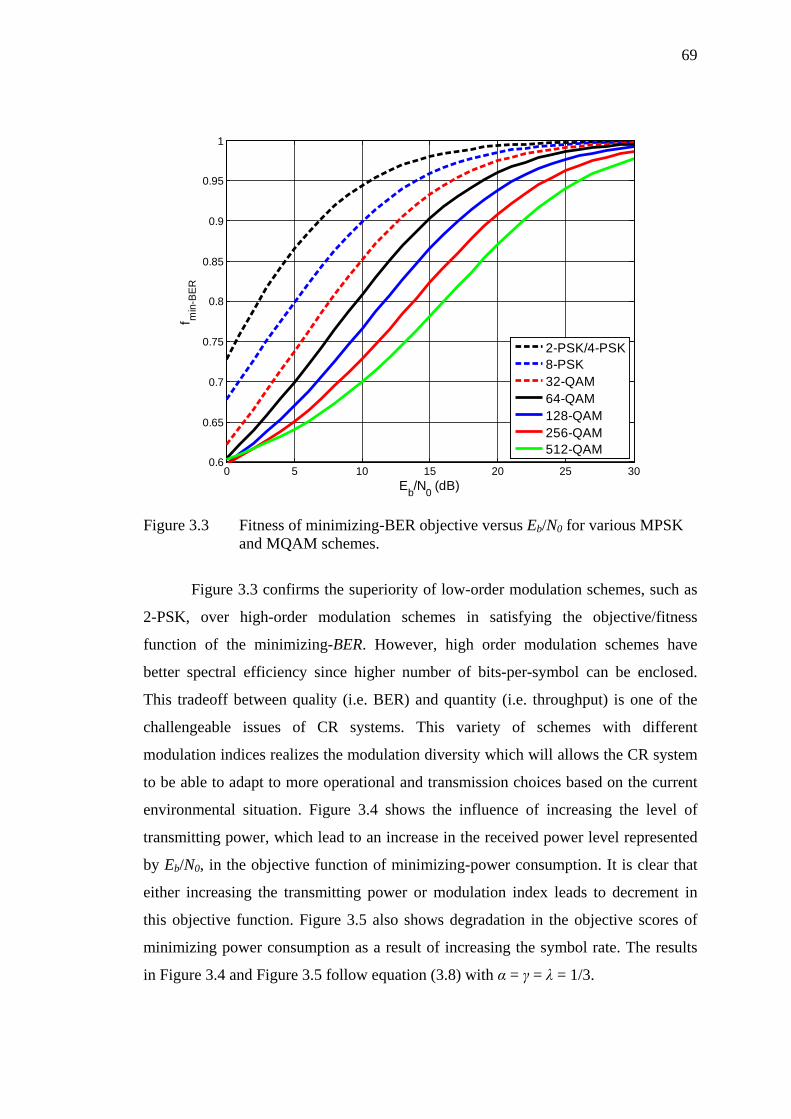
69
Figure 3.3 Fitness of minimizing-BER objective versus Eb/N0 for various MPSK
and MQAM schemes.
Figure 3.3 confirms the superiority of low-order modulation schemes, such as
2-PSK, over high-order modulation schemes in satisfying the objective/fitness
function of the minimizing-BER. However, high order modulation schemes have
better spectral efficiency since higher number of bits-per-symbol can be enclosed.
This tradeoff between quality (i.e. BER) and quantity (i.e. throughput) is one of the
challengeable issues of CR systems. This variety of schemes with different
modulation indices realizes the modulation diversity which will allows the CR system
to be able to adapt to more operational and transmission choices based on the current
environmental situation. Figure 3.4 shows the influence of increasing the level of
transmitting power, which lead to an increase in the received power level represented
by Eb/N0, in the objective function of minimizing-power consumption. It is clear that
either increasing the transmitting power or modulation index leads to decrement in
this objective function. Figure 3.5 also shows degradation in the objective scores of
minimizing power consumption as a result of increasing the symbol rate. The results
in Figure 3.4 and Figure 3.5 follow equation (3.8) with α = γ = λ = 1/3.
0 5 10 15 20 25 300.6
0.65
0.7
0.75
0.8
0.85
0.9
0.95
1
Eb/N0 (dB)
f min
-BE
R
2-PSK/4-PSK8-PSK32-QAM64-QAM128-QAM256-QAM512-QAM
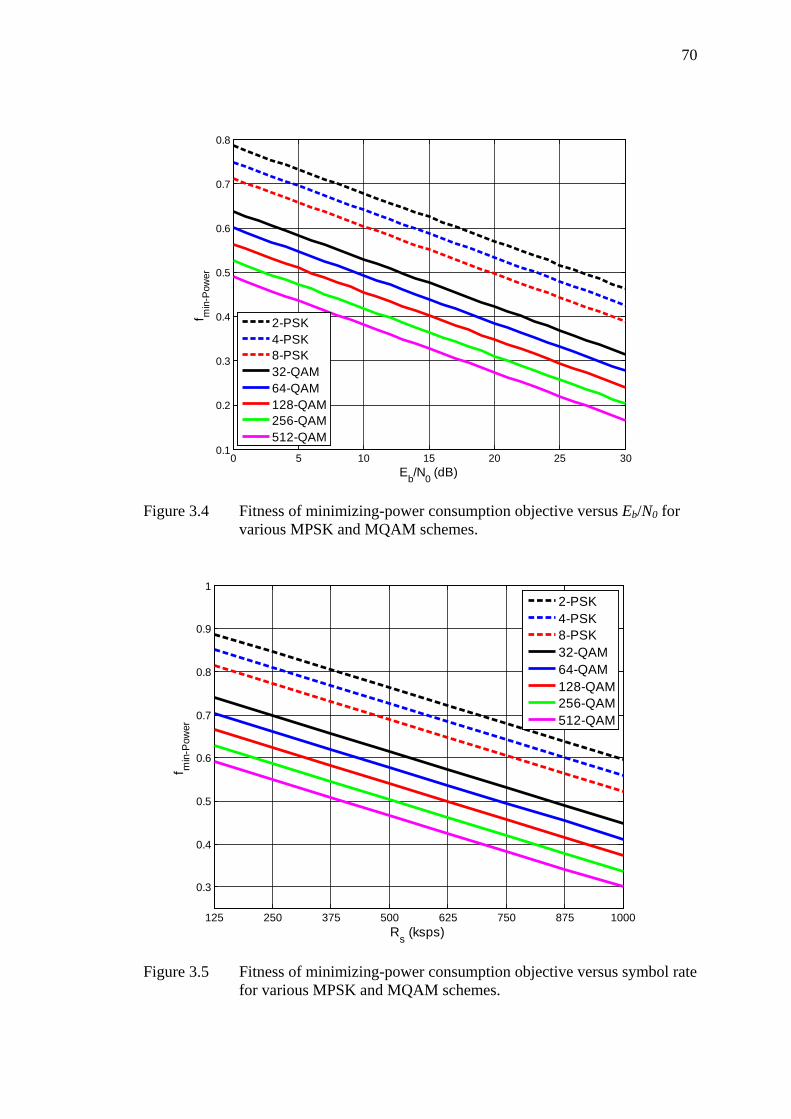
70
Figure 3.4 Fitness of minimizing-power consumption objective versus Eb/N0 for
various MPSK and MQAM schemes.
Figure 3.5 Fitness of minimizing-power consumption objective versus symbol rate
for various MPSK and MQAM schemes.
0 5 10 15 20 25 300.1
0.2
0.3
0.4
0.5
0.6
0.7
0.8
Eb/N0 (dB)
f min
-Pow
er
2-PSK4-PSK8-PSK32-QAM64-QAM128-QAM256-QAM512-QAM
125 250 375 500 625 750 875 1000
0.3
0.4
0.5
0.6
0.7
0.8
0.9
1
Rs (ksps)
f min
-Pow
er
2-PSK4-PSK8-PSK32-QAM64-QAM128-QAM256-QAM512-QAM
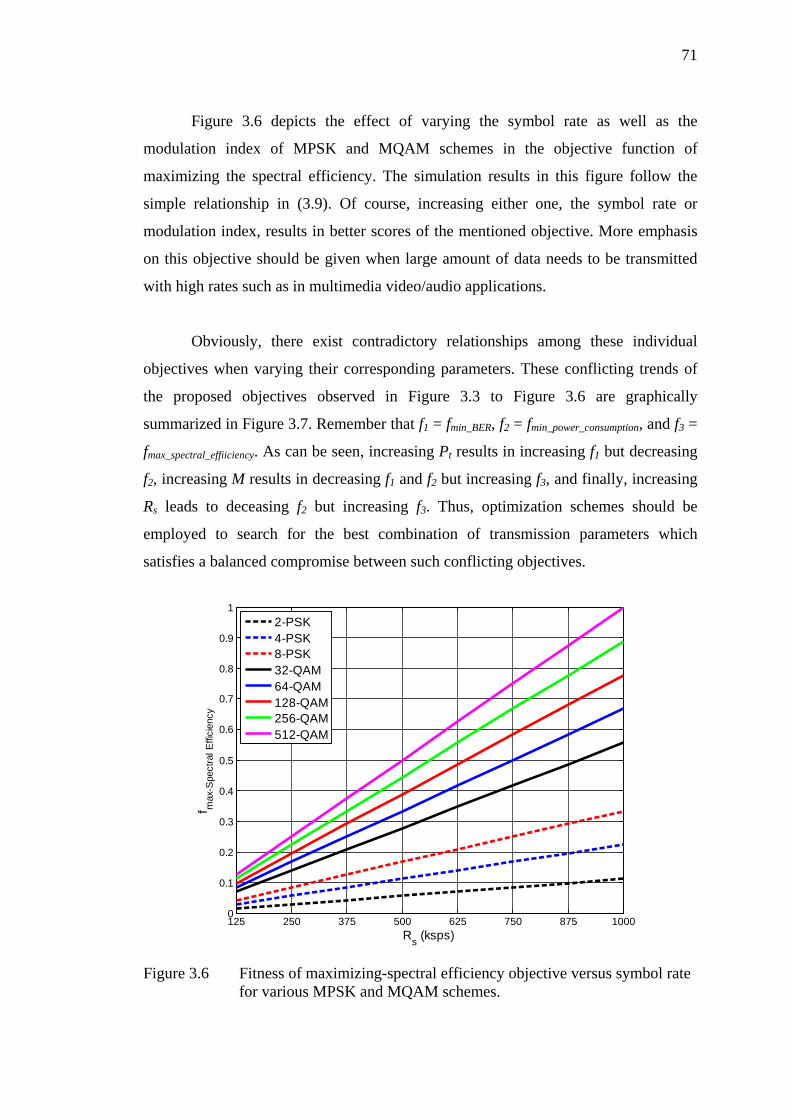
71
Figure 3.6 depicts the effect of varying the symbol rate as well as the
modulation index of MPSK and MQAM schemes in the objective function of
maximizing the spectral efficiency. The simulation results in this figure follow the
simple relationship in (3.9). Of course, increasing either one, the symbol rate or
modulation index, results in better scores of the mentioned objective. More emphasis
on this objective should be given when large amount of data needs to be transmitted
with high rates such as in multimedia video/audio applications.
Obviously, there exist contradictory relationships among these individual
objectives when varying their corresponding parameters. These conflicting trends of
the proposed objectives observed in Figure 3.3 to Figure 3.6 are graphically
summarized in Figure 3.7. Remember that f1 = fmin_BER, f2 = fmin_power_consumption, and f3 =
fmax_spectral_effiiciency. As can be seen, increasing Pt results in increasing f1 but decreasing
f2, increasing M results in decreasing f1 and f2 but increasing f3, and finally, increasing
Rs leads to deceasing f2 but increasing f3. Thus, optimization schemes should be
employed to search for the best combination of transmission parameters which
satisfies a balanced compromise between such conflicting objectives.
Figure 3.6 Fitness of maximizing-spectral efficiency objective versus symbol rate
for various MPSK and MQAM schemes.
125 250 375 500 625 750 875 10000
0.1
0.2
0.3
0.4
0.5
0.6
0.7
0.8
0.9
1
Rs (ksps)
f max
-Spe
ctra
l Effi
cien
cy
2-PSK4-PSK8-PSK32-QAM64-QAM128-QAM256-QAM512-QAM
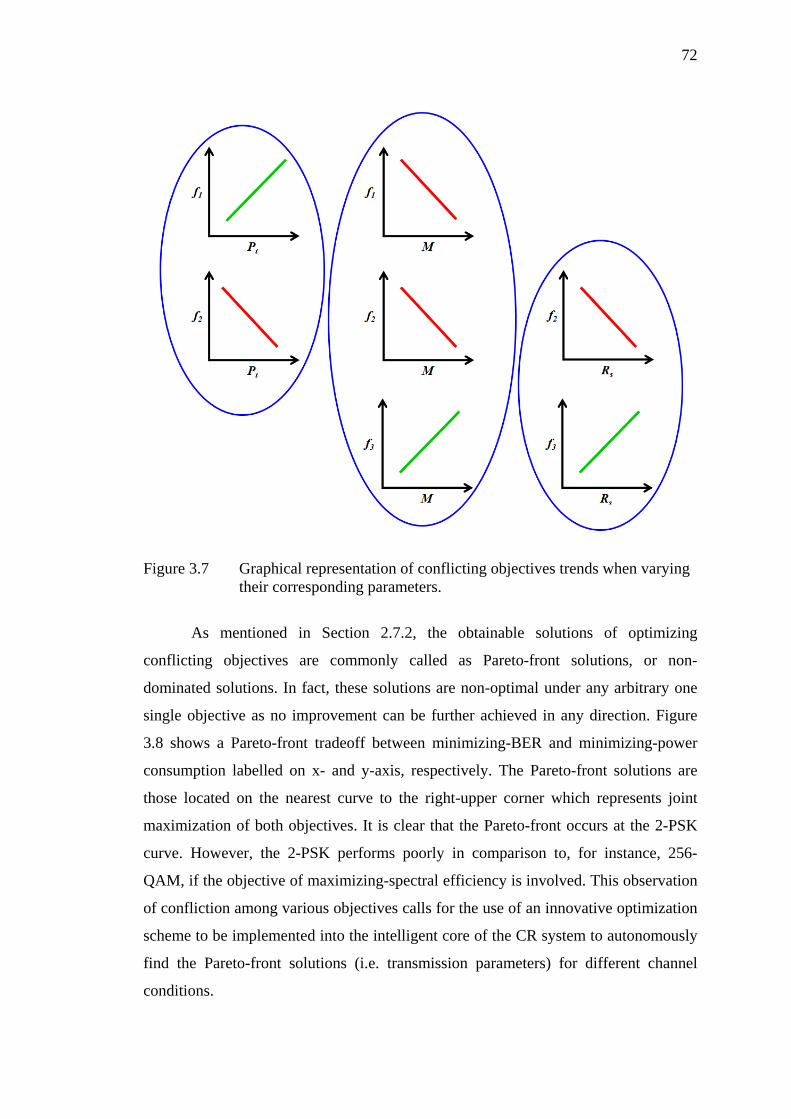
72
Figure 3.7 Graphical representation of conflicting objectives trends when varying
their corresponding parameters.
As mentioned in Section 2.7.2, the obtainable solutions of optimizing
conflicting objectives are commonly called as Pareto-front solutions, or non-
dominated solutions. In fact, these solutions are non-optimal under any arbitrary one
single objective as no improvement can be further achieved in any direction. Figure
3.8 shows a Pareto-front tradeoff between minimizing-BER and minimizing-power
consumption labelled on x- and y-axis, respectively. The Pareto-front solutions are
those located on the nearest curve to the right-upper corner which represents joint
maximization of both objectives. It is clear that the Pareto-front occurs at the 2-PSK
curve. However, the 2-PSK performs poorly in comparison to, for instance, 256-
QAM, if the objective of maximizing-spectral efficiency is involved. This observation
of confliction among various objectives calls for the use of an innovative optimization
scheme to be implemented into the intelligent core of the CR system to autonomously
find the Pareto-front solutions (i.e. transmission parameters) for different channel
conditions.
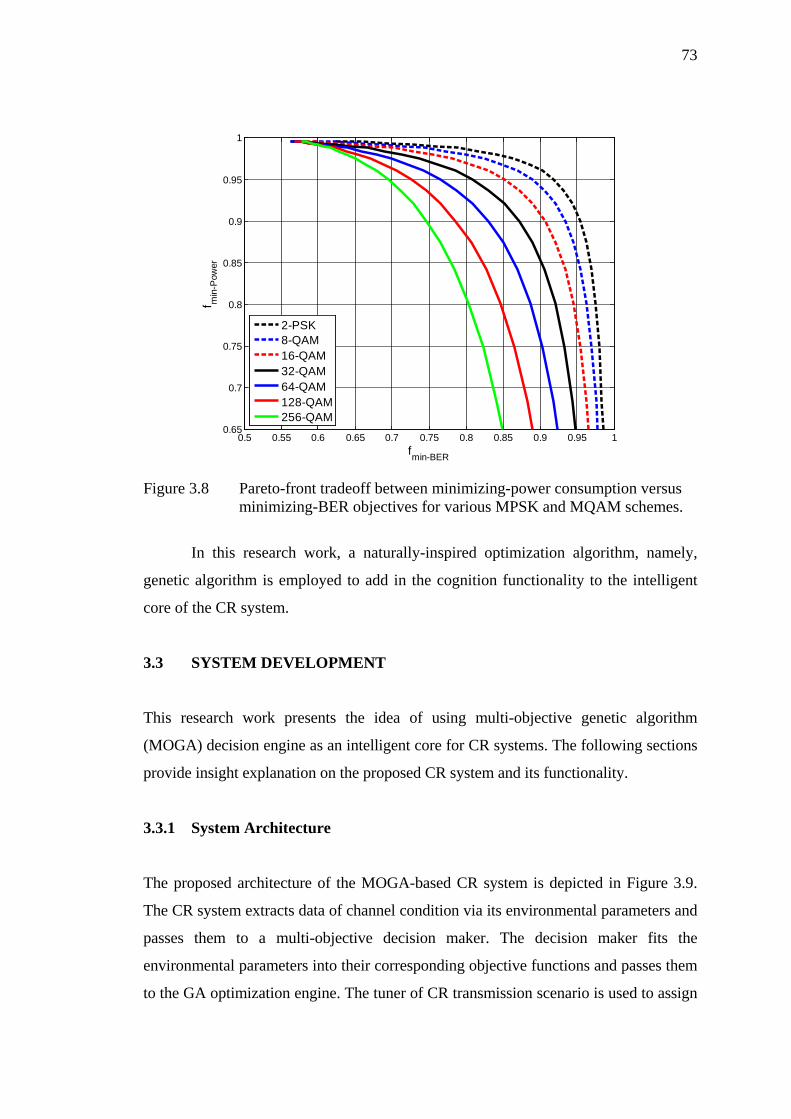
73
Figure 3.8 Pareto-front tradeoff between minimizing-power consumption versus
minimizing-BER objectives for various MPSK and MQAM schemes.
In this research work, a naturally-inspired optimization algorithm, namely,
genetic algorithm is employed to add in the cognition functionality to the intelligent
core of the CR system.
3.3 SYSTEM DEVELOPMENT
This research work presents the idea of using multi-objective genetic algorithm
(MOGA) decision engine as an intelligent core for CR systems. The following sections
provide insight explanation on the proposed CR system and its functionality.
3.3.1 System Architecture
The proposed architecture of the MOGA-based CR system is depicted in Figure 3.9.
The CR system extracts data of channel condition via its environmental parameters and
passes them to a multi-objective decision maker. The decision maker fits the
environmental parameters into their corresponding objective functions and passes them
to the GA optimization engine. The tuner of CR transmission scenario is used to assign
0.5 0.55 0.6 0.65 0.7 0.75 0.8 0.85 0.9 0.95 10.65
0.7
0.75
0.8
0.85
0.9
0.95
1
fmin-BER
f min
-Pow
er
2-PSK8-QAM16-QAM32-QAM64-QAM128-QAM256-QAM
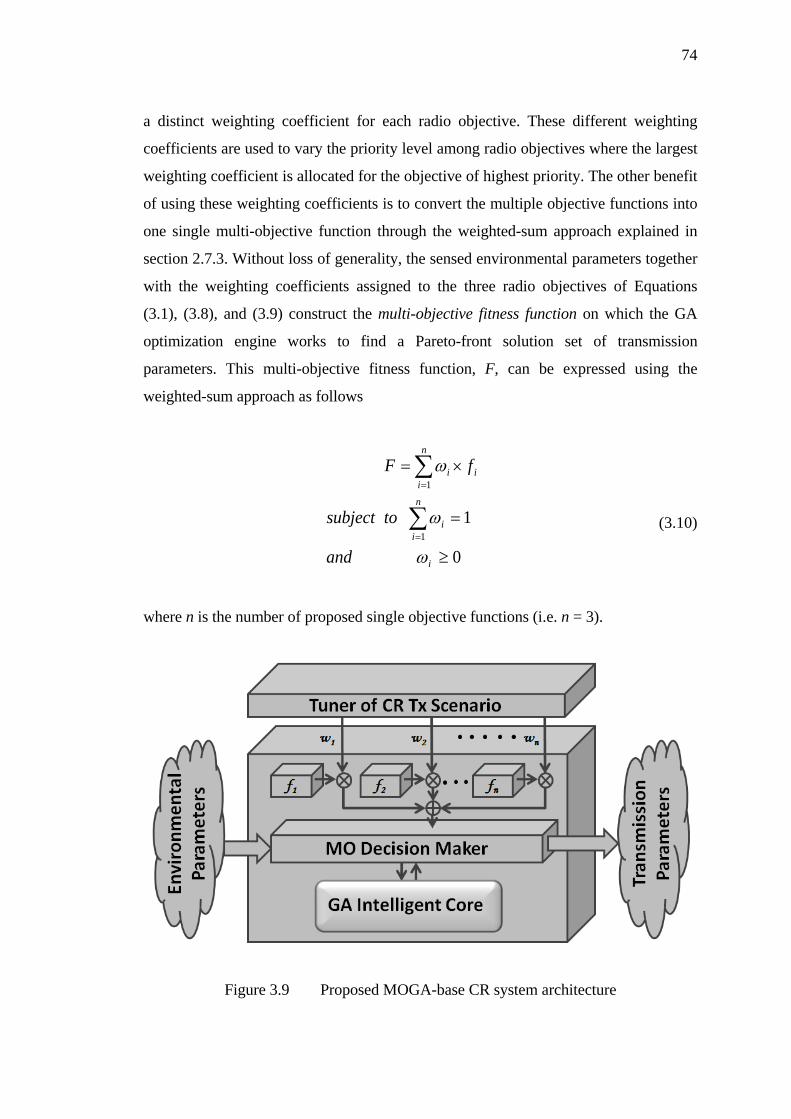
74
a distinct weighting coefficient for each radio objective. These different weighting
coefficients are used to vary the priority level among radio objectives where the largest
weighting coefficient is allocated for the objective of highest priority. The other benefit
of using these weighting coefficients is to convert the multiple objective functions into
one single multi-objective function through the weighted-sum approach explained in
section 2.7.3. Without loss of generality, the sensed environmental parameters together
with the weighting coefficients assigned to the three radio objectives of Equations
(3.1), (3.8), and (3.9) construct the multi-objective fitness function on which the GA
optimization engine works to find a Pareto-front solution set of transmission
parameters. This multi-objective fitness function, F, can be expressed using the
weighted-sum approach as follows
0
11
1
≥
=
×=
∑
∑
=
=
i
n
ii
n
iii
and
tosubject
fF
ω
ω
ω
(3.10)
where n is the number of proposed single objective functions (i.e. n = 3).
Figure 3.9 Proposed MOGA-base CR system architecture
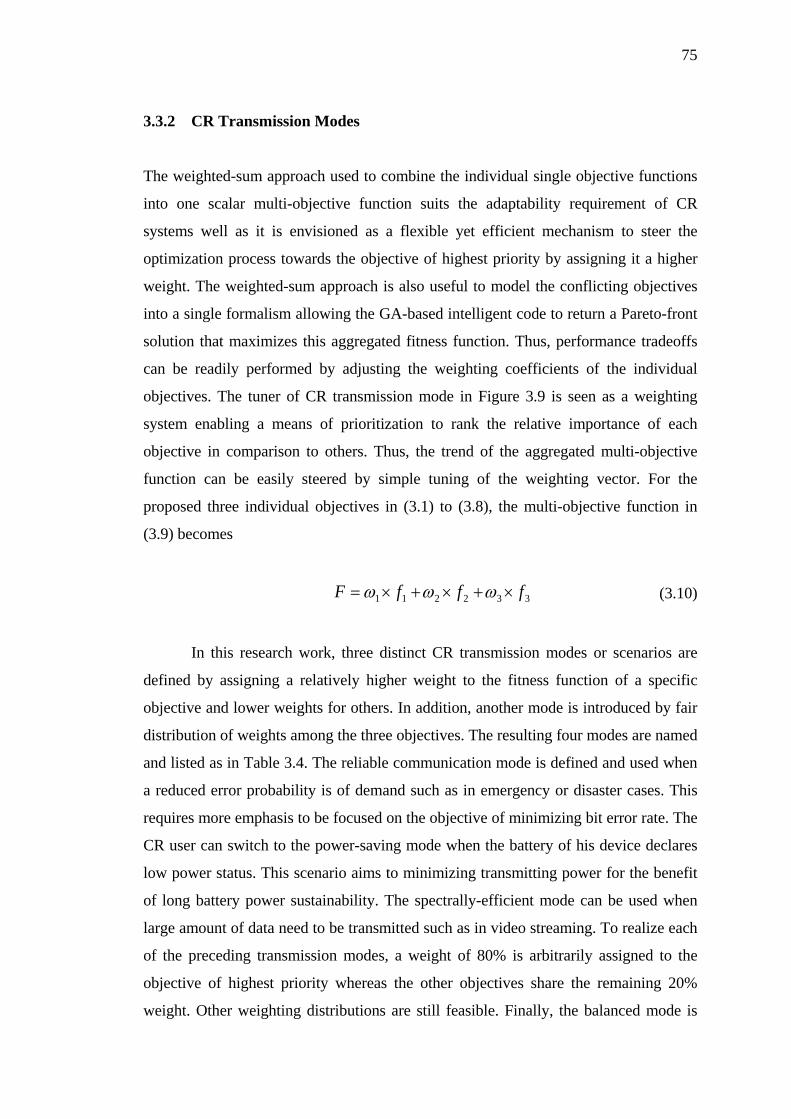
75
3.3.2 CR Transmission Modes
The weighted-sum approach used to combine the individual single objective functions
into one scalar multi-objective function suits the adaptability requirement of CR
systems well as it is envisioned as a flexible yet efficient mechanism to steer the
optimization process towards the objective of highest priority by assigning it a higher
weight. The weighted-sum approach is also useful to model the conflicting objectives
into a single formalism allowing the GA-based intelligent code to return a Pareto-front
solution that maximizes this aggregated fitness function. Thus, performance tradeoffs
can be readily performed by adjusting the weighting coefficients of the individual
objectives. The tuner of CR transmission mode in Figure 3.9 is seen as a weighting
system enabling a means of prioritization to rank the relative importance of each
objective in comparison to others. Thus, the trend of the aggregated multi-objective
function can be easily steered by simple tuning of the weighting vector. For the
proposed three individual objectives in (3.1) to (3.8), the multi-objective function in
(3.9) becomes
332211 fffF ×+×+×= ωωω (3.10)
In this research work, three distinct CR transmission modes or scenarios are
defined by assigning a relatively higher weight to the fitness function of a specific
objective and lower weights for others. In addition, another mode is introduced by fair
distribution of weights among the three objectives. The resulting four modes are named
and listed as in Table 3.4. The reliable communication mode is defined and used when
a reduced error probability is of demand such as in emergency or disaster cases. This
requires more emphasis to be focused on the objective of minimizing bit error rate. The
CR user can switch to the power-saving mode when the battery of his device declares
low power status. This scenario aims to minimizing transmitting power for the benefit
of long battery power sustainability. The spectrally-efficient mode can be used when
large amount of data need to be transmitted such as in video streaming. To realize each
of the preceding transmission modes, a weight of 80% is arbitrarily assigned to the
objective of highest priority whereas the other objectives share the remaining 20%
weight. Other weighting distributions are still feasible. Finally, the balanced mode is
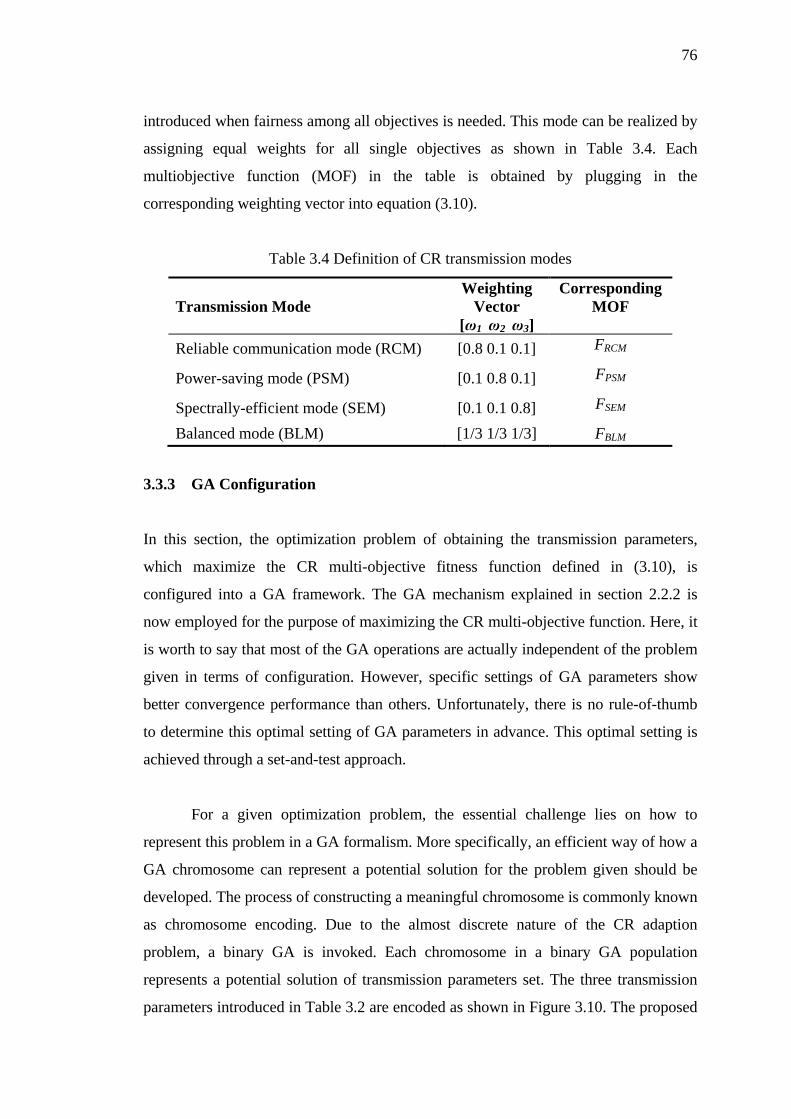
76
introduced when fairness among all objectives is needed. This mode can be realized by
assigning equal weights for all single objectives as shown in Table 3.4. Each
multiobjective function (MOF) in the table is obtained by plugging in the
corresponding weighting vector into equation (3.10).
Table 3.4 Definition of CR transmission modes
Transmission Mode Weighting
Vector [ω1 ω2 ω3]
Corresponding MOF
Reliable communication mode (RCM) [0.8 0.1 0.1] FRCM
Power-saving mode (PSM) [0.1 0.8 0.1] FPSM
Spectrally-efficient mode (SEM) [0.1 0.1 0.8] FSEM
Balanced mode (BLM) [1/3 1/3 1/3] FBLM
3.3.3 GA Configuration
In this section, the optimization problem of obtaining the transmission parameters,
which maximize the CR multi-objective fitness function defined in (3.10), is
configured into a GA framework. The GA mechanism explained in section 2.2.2 is
now employed for the purpose of maximizing the CR multi-objective function. Here, it
is worth to say that most of the GA operations are actually independent of the problem
given in terms of configuration. However, specific settings of GA parameters show
better convergence performance than others. Unfortunately, there is no rule-of-thumb
to determine this optimal setting of GA parameters in advance. This optimal setting is
achieved through a set-and-test approach.
For a given optimization problem, the essential challenge lies on how to
represent this problem in a GA formalism. More specifically, an efficient way of how a
GA chromosome can represent a potential solution for the problem given should be
developed. The process of constructing a meaningful chromosome is commonly known
as chromosome encoding. Due to the almost discrete nature of the CR adaption
problem, a binary GA is invoked. Each chromosome in a binary GA population
represents a potential solution of transmission parameters set. The three transmission
parameters introduced in Table 3.2 are encoded as shown in Figure 3.10. The proposed
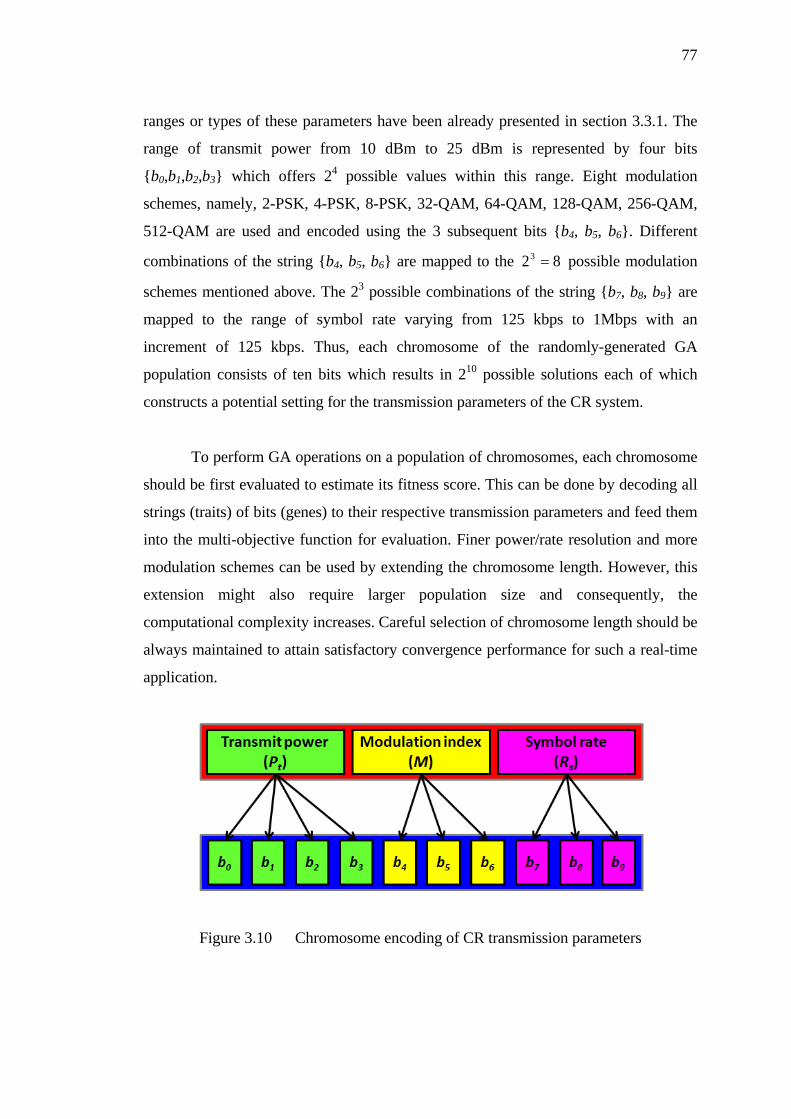
77
ranges or types of these parameters have been already presented in section 3.3.1. The
range of transmit power from 10 dBm to 25 dBm is represented by four bits
{b0,b1,b2,b3} which offers 24 possible values within this range. Eight modulation
schemes, namely, 2-PSK, 4-PSK, 8-PSK, 32-QAM, 64-QAM, 128-QAM, 256-QAM,
512-QAM are used and encoded using the 3 subsequent bits {b4, b5, b6}. Different
combinations of the string {b4, b5, b6} are mapped to the 823 = possible modulation
schemes mentioned above. The 23 possible combinations of the string {b7, b8, b9} are
mapped to the range of symbol rate varying from 125 kbps to 1Mbps with an
increment of 125 kbps. Thus, each chromosome of the randomly-generated GA
population consists of ten bits which results in 210 possible solutions each of which
constructs a potential setting for the transmission parameters of the CR system.
To perform GA operations on a population of chromosomes, each chromosome
should be first evaluated to estimate its fitness score. This can be done by decoding all
strings (traits) of bits (genes) to their respective transmission parameters and feed them
into the multi-objective function for evaluation. Finer power/rate resolution and more
modulation schemes can be used by extending the chromosome length. However, this
extension might also require larger population size and consequently, the
computational complexity increases. Careful selection of chromosome length should be
always maintained to attain satisfactory convergence performance for such a real-time
application.
Figure 3.10 Chromosome encoding of CR transmission parameters
78
3.4 PERFORMANCE EVALUATION
This section presents computer simulations of the developed MOGA-based CR system
performance under various transmission modes. The convergence performance as well
as the obtainable transmission parameters after GA optimization is shown. The
convergence performance is described by the number of generations needed to find
the Pareto-front solutions. These obtained solutions are analyzed in correspondence to
the belonging CR transmission modes to verify the correct functionality of the
proposed system.
3.4.1 Simulation Parameters and GA Operators
As has been mentioned earlier, there is no rule-of-thumb to choose the best
combination of GA operators and parameters for a given optimization problem. Thus,
the GA parameters used in this research are of standard settings suggested in the
literature (De Jong 1975; Grefenstette 1986; Schaffer et al. 1989) with minor
variations as a result of observations realized by plug-and-test experiments. The initial
GA population of 20 chromosomes is randomly generated. Each chromosome has a
length of 10 bits as explained in section 3.4.3. Roulette wheel selection, Two-point
crossover with a rate of 95%, and bit-flip mutation with a rate of 0.001 are
appropriately implemented. An elitism rate of 10% is kept to maintain the best
solutions in every parent population. The evolutionary optimization process of GA is
terminated after 100 generations and the best chromosome in the last population is
extracted, decoded, and displayed as a Pareto-front solution which achieves a well-
balanced compromise between the conflicting objectives.
3.4.2 Performance Evaluation of MOGA-based CR Systems
In this section, the performance of the MOGA-based CR system is simulated under
the four transmission modes proposed in Table 3.4. For each mode, the obtained
solution after terminating the GA evolutionary processes is analyzed to verify its
adequate satisfaction of the CR system requirements under this mode.
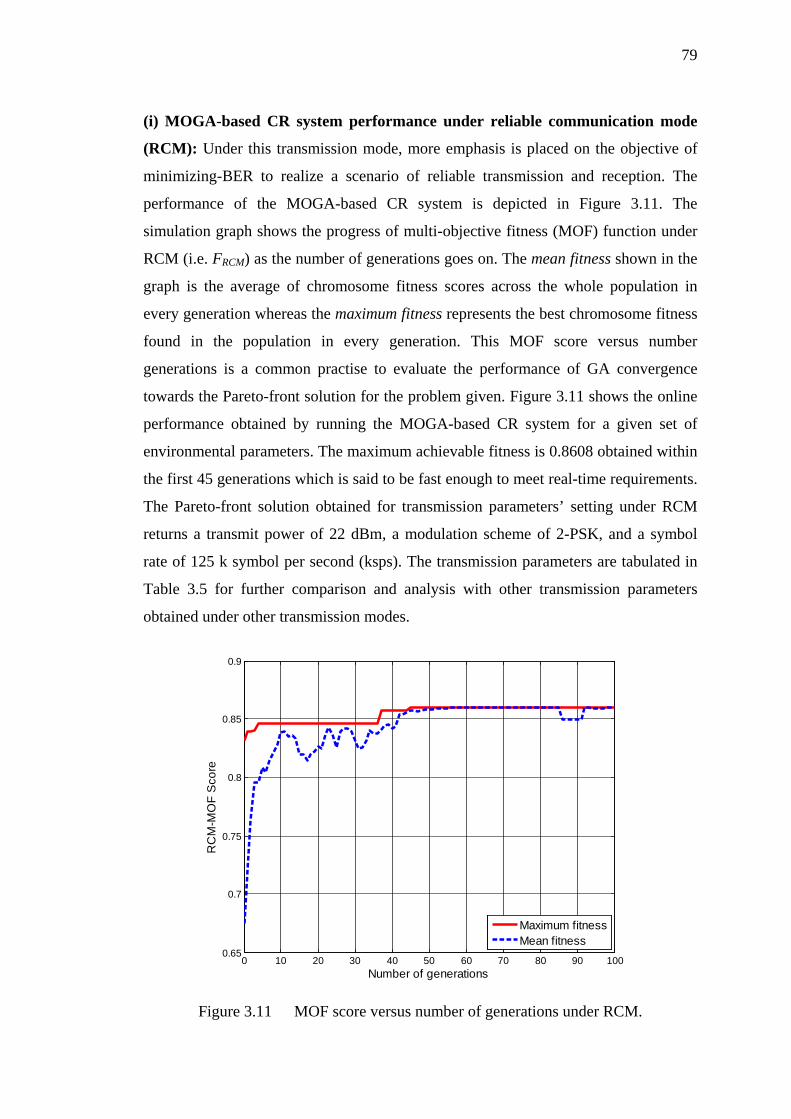
79
(i) MOGA-based CR system performance under reliable communication mode
(RCM): Under this transmission mode, more emphasis is placed on the objective of
minimizing-BER to realize a scenario of reliable transmission and reception. The
performance of the MOGA-based CR system is depicted in Figure 3.11. The
simulation graph shows the progress of multi-objective fitness (MOF) function under
RCM (i.e. FRCM) as the number of generations goes on. The mean fitness shown in the
graph is the average of chromosome fitness scores across the whole population in
every generation whereas the maximum fitness represents the best chromosome fitness
found in the population in every generation. This MOF score versus number
generations is a common practise to evaluate the performance of GA convergence
towards the Pareto-front solution for the problem given. Figure 3.11 shows the online
performance obtained by running the MOGA-based CR system for a given set of
environmental parameters. The maximum achievable fitness is 0.8608 obtained within
the first 45 generations which is said to be fast enough to meet real-time requirements.
The Pareto-front solution obtained for transmission parameters’ setting under RCM
returns a transmit power of 22 dBm, a modulation scheme of 2-PSK, and a symbol
rate of 125 k symbol per second (ksps). The transmission parameters are tabulated in
Table 3.5 for further comparison and analysis with other transmission parameters
obtained under other transmission modes.
Figure 3.11 MOF score versus number of generations under RCM.
0 10 20 30 40 50 60 70 80 90 1000.65
0.7
0.75
0.8
0.85
0.9
Number of generations
RC
M-M
OF
Sco
re
Maximum fitnessMean fitness
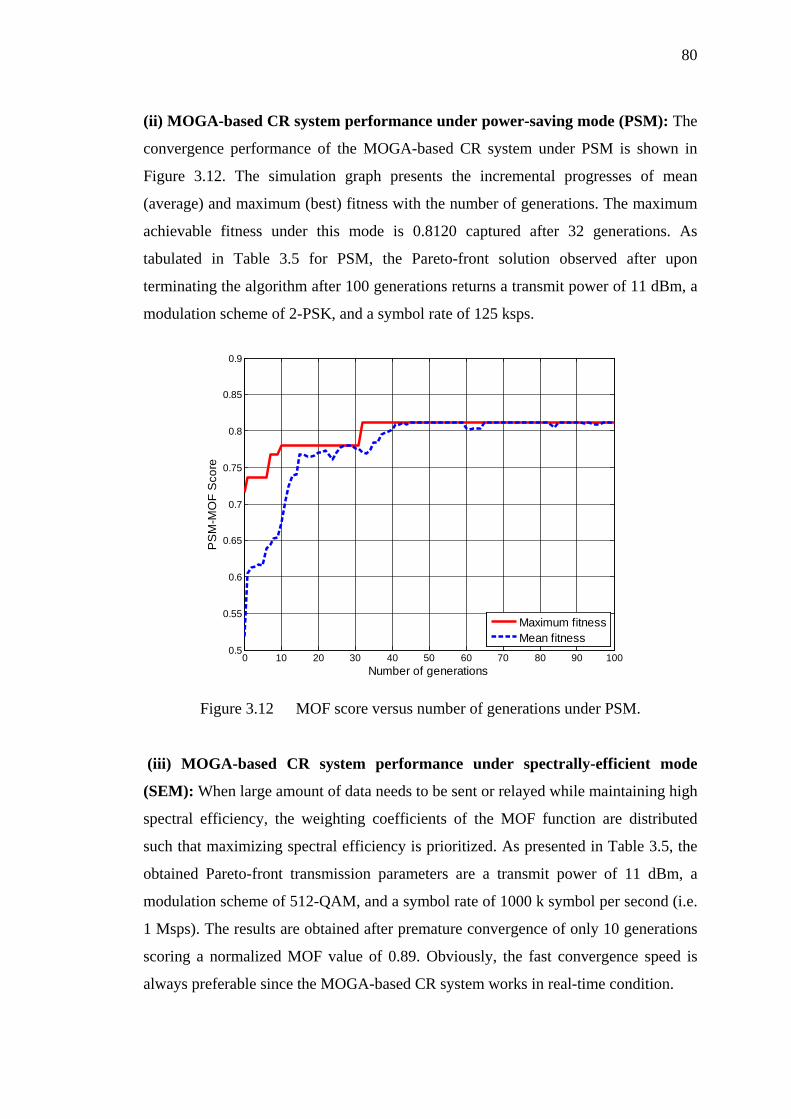
80
(ii) MOGA-based CR system performance under power-saving mode (PSM): The
convergence performance of the MOGA-based CR system under PSM is shown in
Figure 3.12. The simulation graph presents the incremental progresses of mean
(average) and maximum (best) fitness with the number of generations. The maximum
achievable fitness under this mode is 0.8120 captured after 32 generations. As
tabulated in Table 3.5 for PSM, the Pareto-front solution observed after upon
terminating the algorithm after 100 generations returns a transmit power of 11 dBm, a
modulation scheme of 2-PSK, and a symbol rate of 125 ksps.
Figure 3.12 MOF score versus number of generations under PSM.
(iii) MOGA-based CR system performance under spectrally-efficient mode
(SEM): When large amount of data needs to be sent or relayed while maintaining high
spectral efficiency, the weighting coefficients of the MOF function are distributed
such that maximizing spectral efficiency is prioritized. As presented in Table 3.5, the
obtained Pareto-front transmission parameters are a transmit power of 11 dBm, a
modulation scheme of 512-QAM, and a symbol rate of 1000 k symbol per second (i.e.
1 Msps). The results are obtained after premature convergence of only 10 generations
scoring a normalized MOF value of 0.89. Obviously, the fast convergence speed is
always preferable since the MOGA-based CR system works in real-time condition.
0 10 20 30 40 50 60 70 80 90 1000.5
0.55
0.6
0.65
0.7
0.75
0.8
0.85
0.9
Number of generations
PS
M-M
OF
Sco
re
Maximum fitnessMean fitness
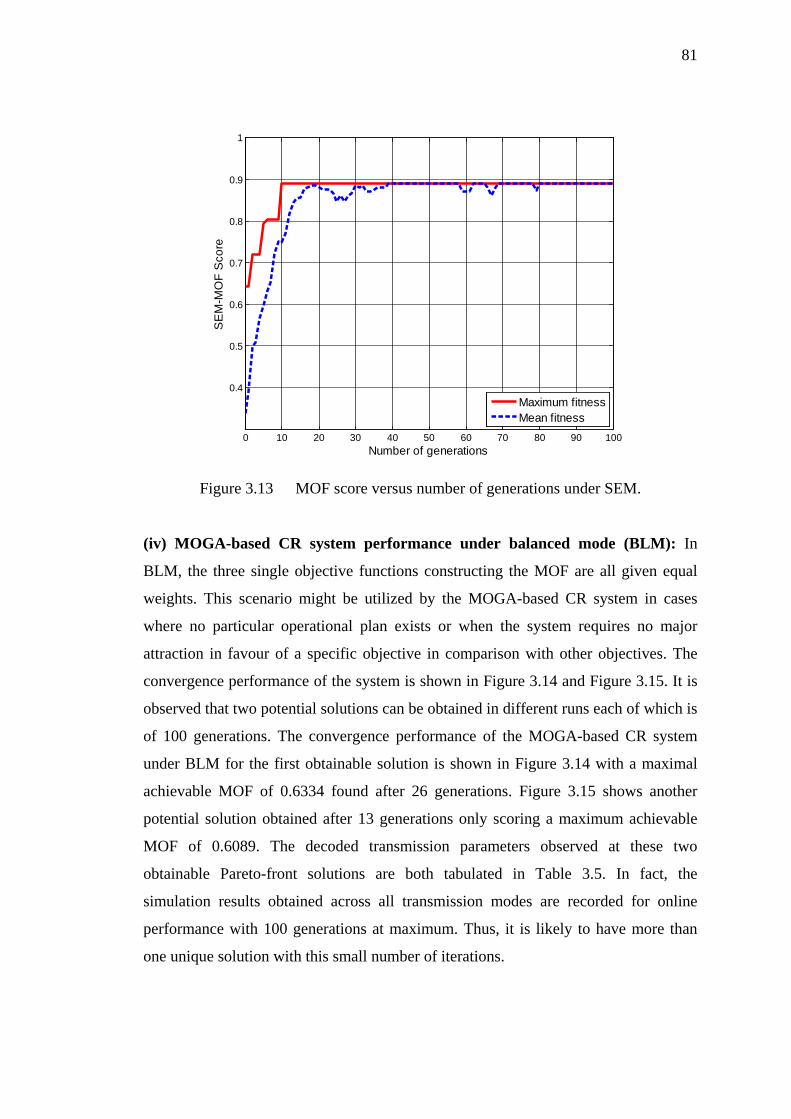
81
Figure 3.13 MOF score versus number of generations under SEM.
(iv) MOGA-based CR system performance under balanced mode (BLM): In
BLM, the three single objective functions constructing the MOF are all given equal
weights. This scenario might be utilized by the MOGA-based CR system in cases
where no particular operational plan exists or when the system requires no major
attraction in favour of a specific objective in comparison with other objectives. The
convergence performance of the system is shown in Figure 3.14 and Figure 3.15. It is
observed that two potential solutions can be obtained in different runs each of which is
of 100 generations. The convergence performance of the MOGA-based CR system
under BLM for the first obtainable solution is shown in Figure 3.14 with a maximal
achievable MOF of 0.6334 found after 26 generations. Figure 3.15 shows another
potential solution obtained after 13 generations only scoring a maximum achievable
MOF of 0.6089. The decoded transmission parameters observed at these two
obtainable Pareto-front solutions are both tabulated in Table 3.5. In fact, the
simulation results obtained across all transmission modes are recorded for online
performance with 100 generations at maximum. Thus, it is likely to have more than
one unique solution with this small number of iterations.
0 10 20 30 40 50 60 70 80 90 100
0.4
0.5
0.6
0.7
0.8
0.9
1
Number of generations
SE
M-M
OF
Sco
re
Maximum fitnessMean fitness
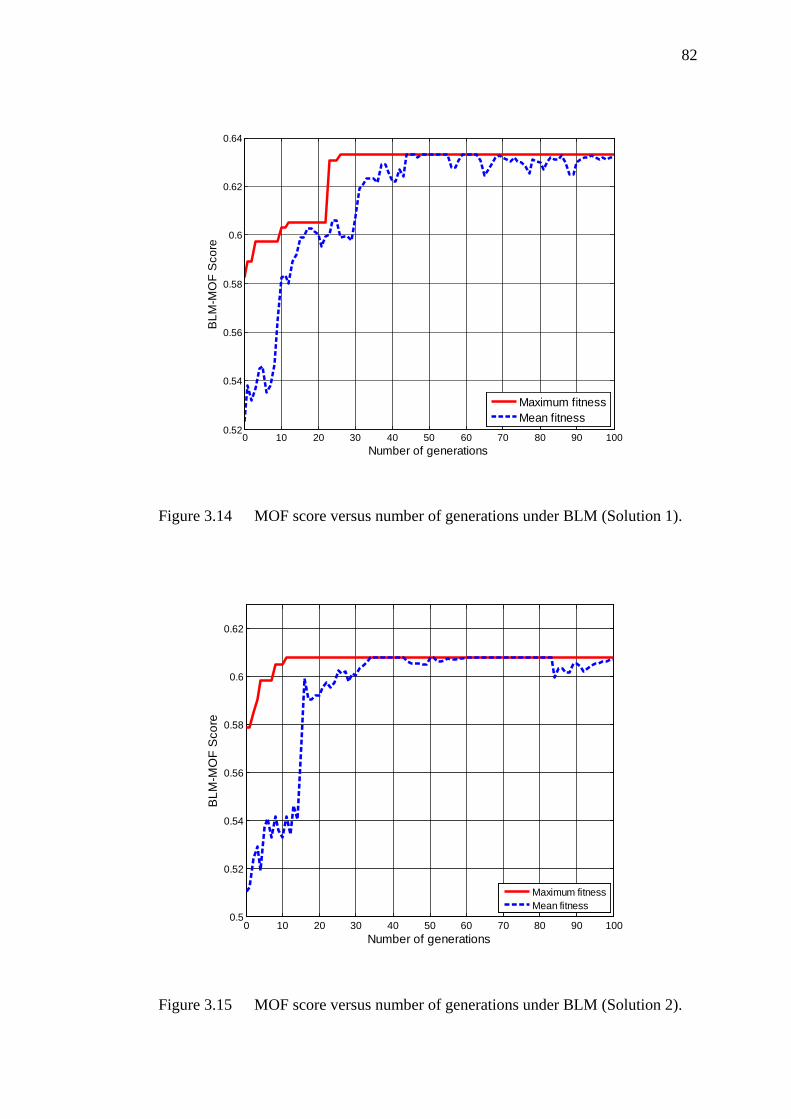
82
Figure 3.14 MOF score versus number of generations under BLM (Solution 1).
Figure 3.15 MOF score versus number of generations under BLM (Solution 2).
0 10 20 30 40 50 60 70 80 90 1000.52
0.54
0.56
0.58
0.6
0.62
0.64
Number of generations
BLM
-MO
F S
core
Maximum fitnessMean fitness
0 10 20 30 40 50 60 70 80 90 1000.5
0.52
0.54
0.56
0.58
0.6
0.62
Number of generations
BLM
-MO
F S
core
Maximum fitnessMean fitness
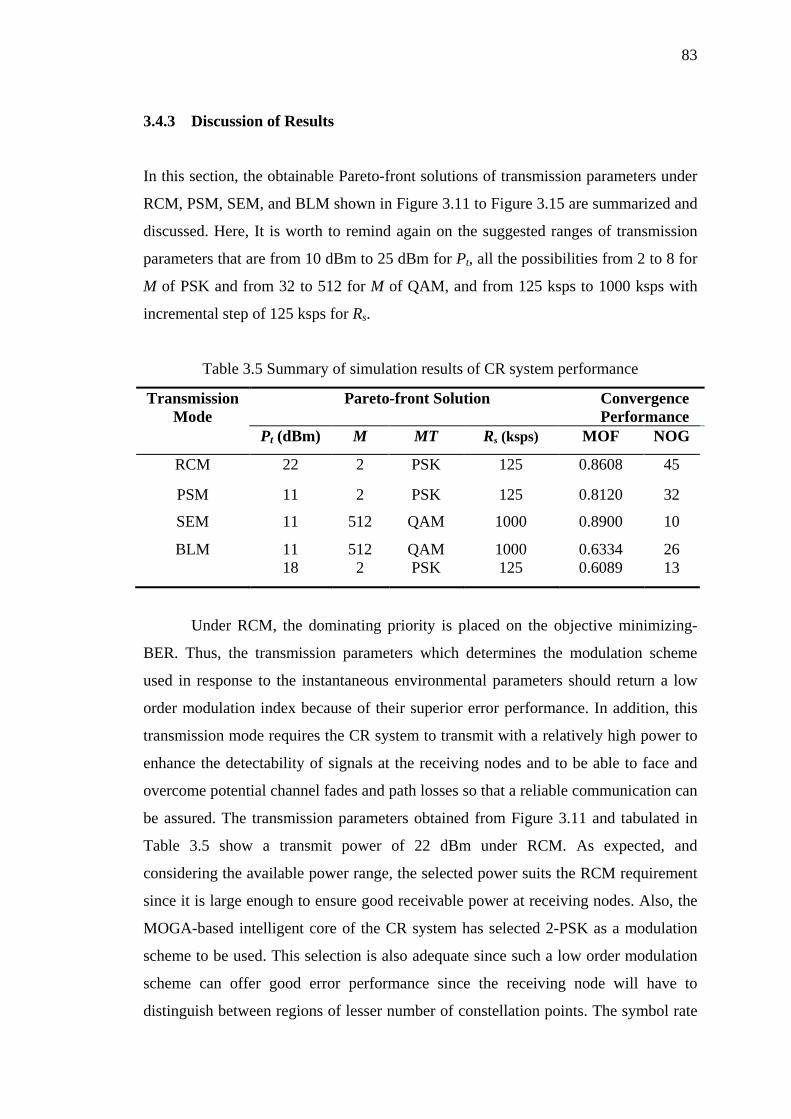
83
3.4.3 Discussion of Results
In this section, the obtainable Pareto-front solutions of transmission parameters under
RCM, PSM, SEM, and BLM shown in Figure 3.11 to Figure 3.15 are summarized and
discussed. Here, It is worth to remind again on the suggested ranges of transmission
parameters that are from 10 dBm to 25 dBm for Pt, all the possibilities from 2 to 8 for
M of PSK and from 32 to 512 for M of QAM, and from 125 ksps to 1000 ksps with
incremental step of 125 ksps for Rs.
Table 3.5 Summary of simulation results of CR system performance
Transmission Mode
Pareto-front Solution Convergence Performance
Pt (dBm) M MT Rs (ksps) MOF NOG
RCM 22 2 PSK 125 0.8608 45
PSM 11 2 PSK 125 0.8120 32
SEM 11 512 QAM 1000 0.8900 10 BLM 11
18 512 2
QAM PSK
1000 125
0.6334 0.6089
26 13
Under RCM, the dominating priority is placed on the objective minimizing-
BER. Thus, the transmission parameters which determines the modulation scheme
used in response to the instantaneous environmental parameters should return a low
order modulation index because of their superior error performance. In addition, this
transmission mode requires the CR system to transmit with a relatively high power to
enhance the detectability of signals at the receiving nodes and to be able to face and
overcome potential channel fades and path losses so that a reliable communication can
be assured. The transmission parameters obtained from Figure 3.11 and tabulated in
Table 3.5 show a transmit power of 22 dBm under RCM. As expected, and
considering the available power range, the selected power suits the RCM requirement
since it is large enough to ensure good receivable power at receiving nodes. Also, the
MOGA-based intelligent core of the CR system has selected 2-PSK as a modulation
scheme to be used. This selection is also adequate since such a low order modulation
scheme can offer good error performance since the receiving node will have to
distinguish between regions of lesser number of constellation points. The symbol rate
84
returned is 125 ksps and this also anticipated in RCM since higher rates will result in
unnecessary higher power consumption. From Pareto-front point of view, the obtained
solution is definitely sub-optimal. This can be observed by the selected transmit power
being 22 dBm not 25 dBm. However, this is the best compromise that can be agreed
with among the three proposed conflicting objectives.
The obtained transmission parameters under PSM are as shown in Table 3.5.
Under this scenario, the power consumption should be minimized. The transmit power
selected by the MOGA-based decision engine returns a low 11 dBm level of transmit
power. This proves the correct functionality of the CR system employing MOGA.
Also, the modulation scheme selected is 2-PSK which also ensures low power
consumption, and finally, the symbol rate found by the evolutionary processes of
MOGA is only 125 ksps which again minimizes the objective of minimizing-power
consumption.
When the MOGA-based CR system is being under SEM, the highest priority
objective is to achieve high spectral efficiency so that more date can be sent out in
shorter time frames. Assuming a fixed allowable bandwidth such as in non-orthogonal
signalling of PSK and QAM, the optimization problems can be said to be maximizing
the achievable throughput of the CR system; that is maximizing it data rate. The
simulation results of the CR system shows that the MOGA intelligent core returns a
symbol rate is 1000 ksps with 512-QAM modulation scheme. Obviously, these
parameters of high symbol rate and high modulation index allow the CR system to
transmit as a rate of 9 Mbps.
Under BLM, the MOGA intelligent core of the CR system returns two possible
solutions when it runs online for 100 generations. The corresponding transmission
parameters of these two solutions are tabulated as shown in Table 3.5. It can be
observed that in the first Pareto front solution, the MOGA returns low {Pt} and high
{M, Rs} whereas in the second solution, average {Pt} and low {M, Rs} is returned.
Take note that the Pareto-front includes more than one unique solution as can be seen
in Figure 2.7. Interestingly, the returned values of transmission solutions under BLM
has a sort of complementary or water-filling relationship between the transmit power
85
on one side and the symbol rate and modulation index on the other side. Also, since
all objectives enjoy fairness, the MOGA works freely to return any possible solution
that maximizes the MOF score within the proposed number of generations.
3.5 ADAPTIVE VERSUS STATIC TRANSMISSION PARAMETERS OF MOGA-BASED CR SYSTEM
To prove the effectiveness of the proposed adaptive MOGA-based CR system, the
sub-optimality of the obtained Pareto-front solutions under the RCM, PSM, and SEM
is verified. The followed verification procedure compares the MOGA-based CR
system whose transmission parameters are fully adaptive, as presented earlier, with
the same system but with static setting of transmission parameters. The semi-adaption
property of the CR system is realized by selecting one transmission parameter each
time and set it to a static value and compare it with a fully adaptive CR system under
different transmission modes. The performance metric considered in the comparisons
is the maximum MOF. The maximum MOF achieved in every experiment of testing
the transmit power, the modulation index, and the symbol rate is extracted and
tabulated in Tables 3.6, 3.7, and 3.8, respectively. The total number of simulation
experiments for the three parameters with one adaptive and three static settings under
four the transmission modes is 48. However, only the MOF values are extracted and
tabulated into the corresponding tables as below.
Table 3.6 presents the MOF scores of the MOGA-based CR system with
adaptive transmit power as well as with three static values set at 15 dBm, 18 dBm, and
25 dBm under the proposed transmission modes. The sensitivity of a transmission
parameter is defined as the dynamic range or change amount of the achievable MOF
when varying the setting of this transmission parameter. It is clear that the achievable
MOF of the CR system under PSM shows high sensitivity to the setting of transmit
power in comparison to other transmission modes. This is basically expected since in
PSM, a high weighting coefficient is placed on the objective function of minimizing-
power consumption. Thus, varying the transmit power level results in a considerable
change on the MOF score. Under RCM, SEM and BLM, the transmit power has no
major effect since it receives a reduced weight and therefore, lesser effect.
Table 3.6 Effect of varying the setting of CR transmit power
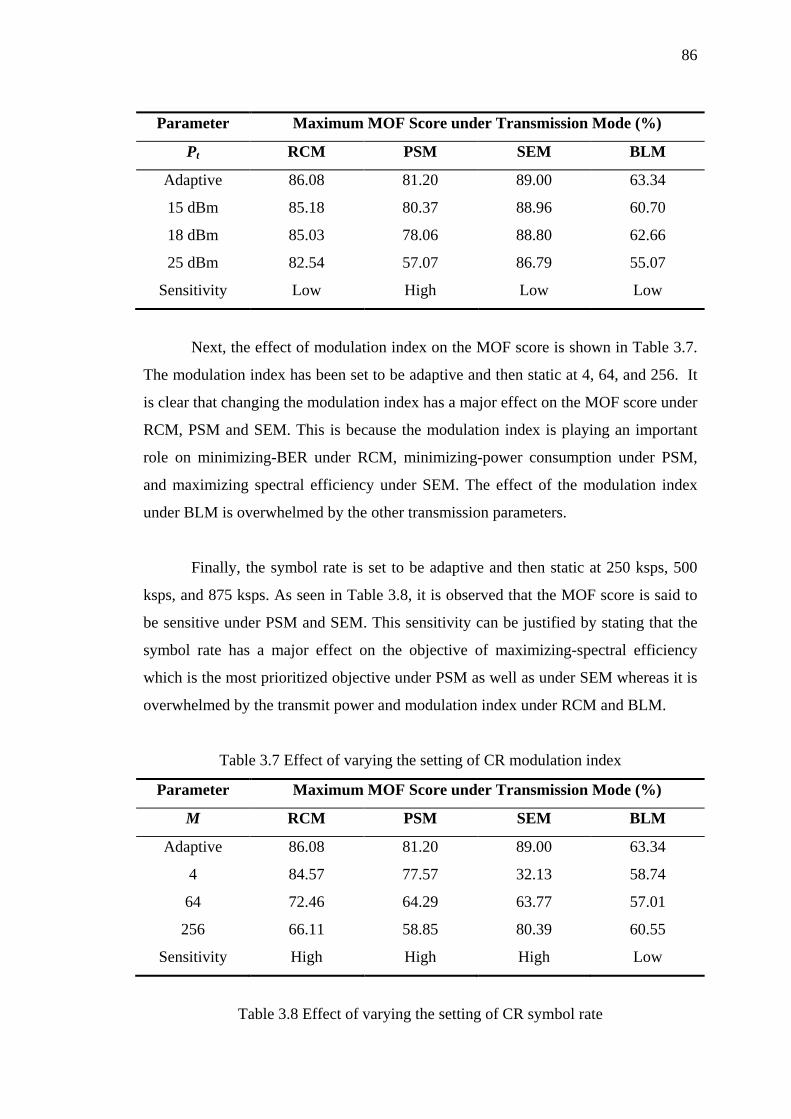
86
Parameter Maximum MOF Score under Transmission Mode (%)
Pt RCM PSM SEM BLM
Adaptive 86.08 81.20 89.00 63.34
15 dBm 85.18 80.37 88.96 60.70
18 dBm 85.03 78.06 88.80 62.66
25 dBm 82.54 57.07 86.79 55.07
Sensitivity Low High Low Low
Next, the effect of modulation index on the MOF score is shown in Table 3.7.
The modulation index has been set to be adaptive and then static at 4, 64, and 256. It
is clear that changing the modulation index has a major effect on the MOF score under
RCM, PSM and SEM. This is because the modulation index is playing an important
role on minimizing-BER under RCM, minimizing-power consumption under PSM,
and maximizing spectral efficiency under SEM. The effect of the modulation index
under BLM is overwhelmed by the other transmission parameters.
Finally, the symbol rate is set to be adaptive and then static at 250 ksps, 500
ksps, and 875 ksps. As seen in Table 3.8, it is observed that the MOF score is said to
be sensitive under PSM and SEM. This sensitivity can be justified by stating that the
symbol rate has a major effect on the objective of maximizing-spectral efficiency
which is the most prioritized objective under PSM as well as under SEM whereas it is
overwhelmed by the transmit power and modulation index under RCM and BLM.
Table 3.7 Effect of varying the setting of CR modulation index
Parameter Maximum MOF Score under Transmission Mode (%)
M RCM PSM SEM BLM
Adaptive 86.08 81.20 89.00 63.34
4 84.57 77.57 32.13 58.74
64 72.46 64.29 63.77 57.01
256 66.11 58.85 80.39 60.55
Sensitivity High High High Low
Table 3.8 Effect of varying the setting of CR symbol rate
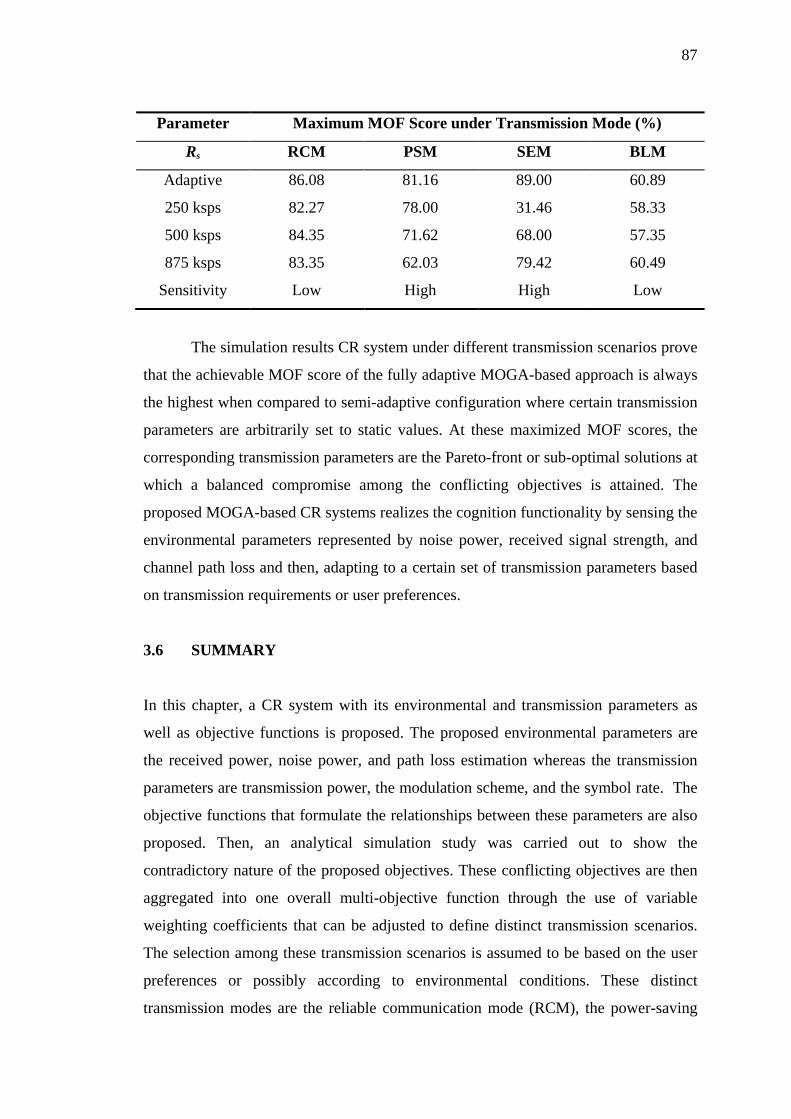
87
Parameter Maximum MOF Score under Transmission Mode (%)
Rs RCM PSM SEM BLM
Adaptive 86.08 81.16 89.00 60.89
250 ksps 82.27 78.00 31.46 58.33
500 ksps 84.35 71.62 68.00 57.35
875 ksps 83.35 62.03 79.42 60.49
Sensitivity Low High High Low
The simulation results CR system under different transmission scenarios prove
that the achievable MOF score of the fully adaptive MOGA-based approach is always
the highest when compared to semi-adaptive configuration where certain transmission
parameters are arbitrarily set to static values. At these maximized MOF scores, the
corresponding transmission parameters are the Pareto-front or sub-optimal solutions at
which a balanced compromise among the conflicting objectives is attained. The
proposed MOGA-based CR systems realizes the cognition functionality by sensing the
environmental parameters represented by noise power, received signal strength, and
channel path loss and then, adapting to a certain set of transmission parameters based
on transmission requirements or user preferences.
3.6 SUMMARY
In this chapter, a CR system with its environmental and transmission parameters as
well as objective functions is proposed. The proposed environmental parameters are
the received power, noise power, and path loss estimation whereas the transmission
parameters are transmission power, the modulation scheme, and the symbol rate. The
objective functions that formulate the relationships between these parameters are also
proposed. Then, an analytical simulation study was carried out to show the
contradictory nature of the proposed objectives. These conflicting objectives are then
aggregated into one overall multi-objective function through the use of variable
weighting coefficients that can be adjusted to define distinct transmission scenarios.
The selection among these transmission scenarios is assumed to be based on the user
preferences or possibly according to environmental conditions. These distinct
transmission modes are the reliable communication mode (RCM), the power-saving
88
mode (PSM), the spectrally-efficient mode (SEM) and the balanced mode (BLM). The
proposed MOGA decision engine is developed to be able to optimize the transmission
parameters, for a given set of sensed environmental parameters, which can satisfy the
requirements of the predefined transmission mode. The performance of the proposed
MOGA system is evaluated and verified under the proposed transmission modes. It is
shown that the proposed MOGA decision engine is able to search for and find the sub-
optimal or Pareto-front solutions of transmission solutions within the first 50
evolutionary generations. This convergence speed makes the proposed MOGA
decision engine feasible for such a real-time application. Under RCM, PSM, or SEM
transmission modes, the proposed MOGA engine achieves a MOF score of more than
80%. This MOF score is a considerable achievement since it represents a compromise
between several conflicting objectives. A lower MOF score of more than 60% is
achieved when BLM transmission mode is used due to increased level of contradiction
occurred when weighting coefficients are uniform assigned to the confliction
objectives. Finally, sensitivity analyses have been carried out to prove the
effectiveness of the proposed inclusion of the transmission parameters in the overall
multi-objective performance.
CHAPTER IV
BOGA-ASSISTED HDF- BASED AND SOGA-ASSISTED SDF-BASED COOPERATIVE SPECTRUM SENSING IN COGNITIVE RADIO
NETWORKS
4.1 INTRODUCTION
In spectrum-sensing CRNs, several CR users collaborate together and share their
information on PU activities. This collaboration can be realized by centralized or
distributed means. In this research, a centralized architecture has been used due to its
reduced communication overhead in comparison to distributed architectures. This
chapter presents the employment of GAs for optimizing the performance of (hard
decision fusion-) HDF- and (soft data fusion) SDF-based CRNs. For each of these two
fusion approaches, the corresponding optimization problem is identified and
formulated as an objective function(s) on which GA works, the GA-based
optimization system is evaluated, and the obtainable solutions are analyzed to judge
on the effectiveness of the proposed methodology. For HDF-based CRN, a bi-
objective genetic algorithm (BOGA) is used whereas a single-objective genetic
algorithm (SOGA) is used.
4.2 GENERIC CRN MODEL AND FUSION SCHEMES
Spectrum sensing is normally considered as a pure detection problem where the CR-
assisted users have to scan a vast range of frequencies to observe available ‘white
spaces’ or ‘holes’ that are temporarily and spatially available for transmission. The
CR-assisted users are classified as secondary users (SUs) with lower access priority
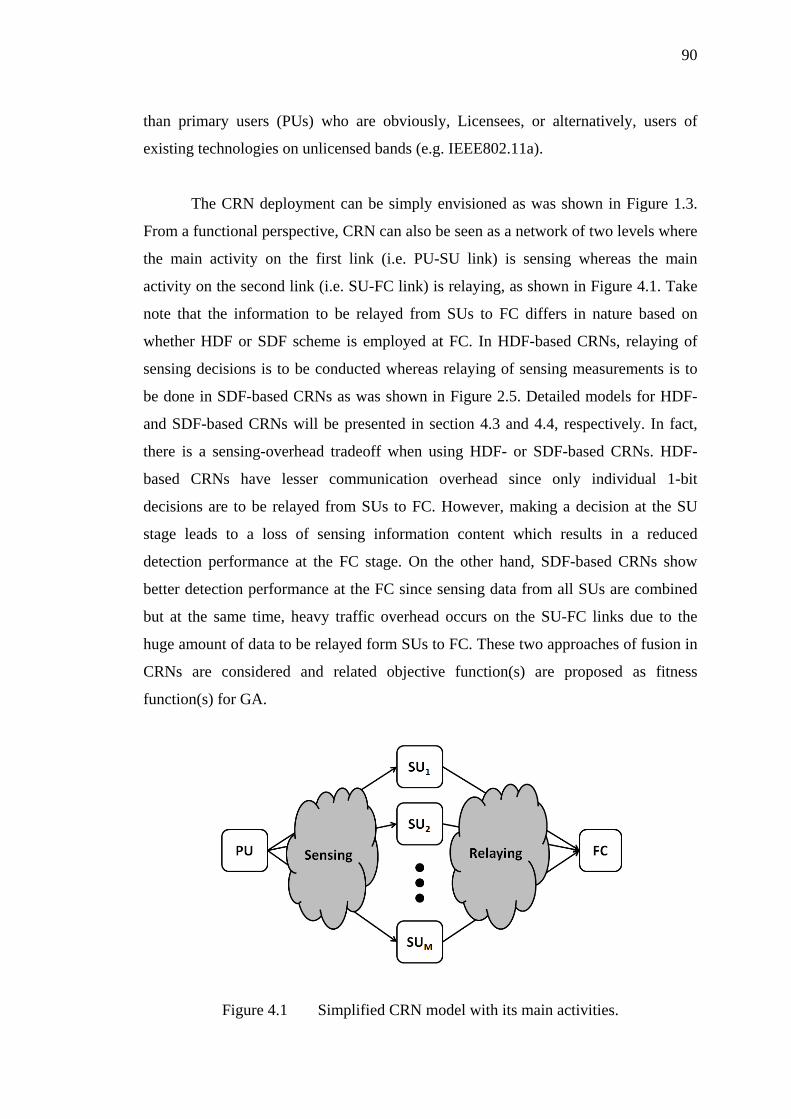
90
than primary users (PUs) who are obviously, Licensees, or alternatively, users of
existing technologies on unlicensed bands (e.g. IEEE802.11a).
The CRN deployment can be simply envisioned as was shown in Figure 1.3.
From a functional perspective, CRN can also be seen as a network of two levels where
the main activity on the first link (i.e. PU-SU link) is sensing whereas the main
activity on the second link (i.e. SU-FC link) is relaying, as shown in Figure 4.1. Take
note that the information to be relayed from SUs to FC differs in nature based on
whether HDF or SDF scheme is employed at FC. In HDF-based CRNs, relaying of
sensing decisions is to be conducted whereas relaying of sensing measurements is to
be done in SDF-based CRNs as was shown in Figure 2.5. Detailed models for HDF-
and SDF-based CRNs will be presented in section 4.3 and 4.4, respectively. In fact,
there is a sensing-overhead tradeoff when using HDF- or SDF-based CRNs. HDF-
based CRNs have lesser communication overhead since only individual 1-bit
decisions are to be relayed from SUs to FC. However, making a decision at the SU
stage leads to a loss of sensing information content which results in a reduced
detection performance at the FC stage. On the other hand, SDF-based CRNs show
better detection performance at the FC since sensing data from all SUs are combined
but at the same time, heavy traffic overhead occurs on the SU-FC links due to the
huge amount of data to be relayed form SUs to FC. These two approaches of fusion in
CRNs are considered and related objective function(s) are proposed as fitness
function(s) for GA.
Figure 4.1 Simplified CRN model with its main activities.
91
4.3 BOGA-ASSISTED HDF-BASED COOPERATIVE SPECTRUM SENSING
In CRN, SUs are allowed to utilize the frequency bands of PUs when these bands are
not currently being used. However, the SUs should willingly and quickly vacate the
band once a PU has been detected. This fast vacation is necessary to avoid causing
harmful interference to the PUs who should maintain ubiquitous and uninterrupted
accessibility. Therefore, the SUs are required to periodically monitor the PUs
activities using fast and reliable detection/sensing algorithms. In such algorithms, the
PU(s) detection probability (Pd) and false alarm probability (Pf) measured at the SU or
FC stage will be of interest. These two probabilities are directly related to the
interference introduced to PU and the throughput of SU network, respectively. Higher
probability of detection should always be targeted to make the PU more protected
against SU interference whereas lower false alarm probability must be the main aim if
the throughput of SU network or CRN needs to be maximized. Unfortunately, these
two probabilities are inversely correlated as increasing the probability of detection
leads to decreasing the probability of false alarm and vice versa, as shown in section
2.3.1. This conflicting nature leads to conflicting behaviour between objective of
protecting PU and the objective of maximizing CRN throughput.
In this research, a CRN based on WRAN system deployment has been
proposed. Each frame in WRAN consists of a sensing time slot plus a data
transmission slot. Longer sensing time offers higher probability of detection and
therefore, better PU detection. However, this long sensing time results in a reduction
on the remaining time fraction that can be used for data transmission and hence it
degrades the achievable throughput of CRN. This fundamental tradeoff among the
conflicting objectives of maximizing PU protecting and maximizing SU accessibility
requires an intelligent mechanism to formulate a sensing time duration that can jointly
sub-optimize these two objectives.
Also, the fusion process at FC is performed by combining the individual
sensing decisions from all existing SUs in the vicinity of the base station at which the
FC is located. However, since the local sensing decision taken at every SU is very
92
much dependent on the corresponding SNR at the SU receiver, it is likely to obtain
unreliable sensing decisions when the SNR of received signal is low. These unreliable
decisions affect the overall detection performance at the FC stage upon combining
them. This is because the inclusion of SUs with low SNR measures will contribute
negatively on creating the final sensing decision. Therefore, again, the intelligent
mechanism suggested above for finding the optimal sensing time should also be able
to determine the cooperation level between N existing SUs. The cooperation level is
defined as the k-out-of-N SUs with the highest SNRs that should collaborate to
produce a reliable global sensing decision at the FC.
Thus, a GA-based intelligent mechanism is used to find a pair of sensing time
and cooperation level that optimize the performance of cooperative sensing in HDF-
based CRNs. This is the scope of research work in Section 4.3. The performance
metrics used in this architecture are the PU protection as well as the CRN throughput.
Thus, the proposed GA mechanism works on optimizing these two objectives and it is
therefore termed as bi-objective genetic algorithm (BOGA).
4.3.1 HDF-based CRN System Model
The main attribute of the proposed HDF-based CRN is that the sensing measurement
at every SU is locally processed to come out with an individual sensing decision. The
resultant individual decisions from all SUs are then forwarded to the FC at which all
decisions are aggregated to produce one global sensing decision on the availability of
PU in a given band. The mathematical model of the deployed HDF-based CRN is
graphically represented in Figure 4.2. The PU-SU link can be any of M links from the
PU to M existing SUs whereas the SU-FC link can be any of the M links from the SUs
to the FC. The channel noise and gain of the ith PU-SU link is Wi and gi, respectively,
where i = 1, 2, …, M. Xi[n] is the nth sample of the received sensing measurement at
SUi, Yi is the energy estimate of received measurement within SUi, and Zi the sensing
decision made at the output of the decision maker (DM) to be sent to FC. The global
decision constructed at FC is denoted as Zg. In order to achieve a synchronized
sensing, relaying, and decision making processes, all SUs are assumed to monitor the
PU activities within the same sensing time slot (Ts).
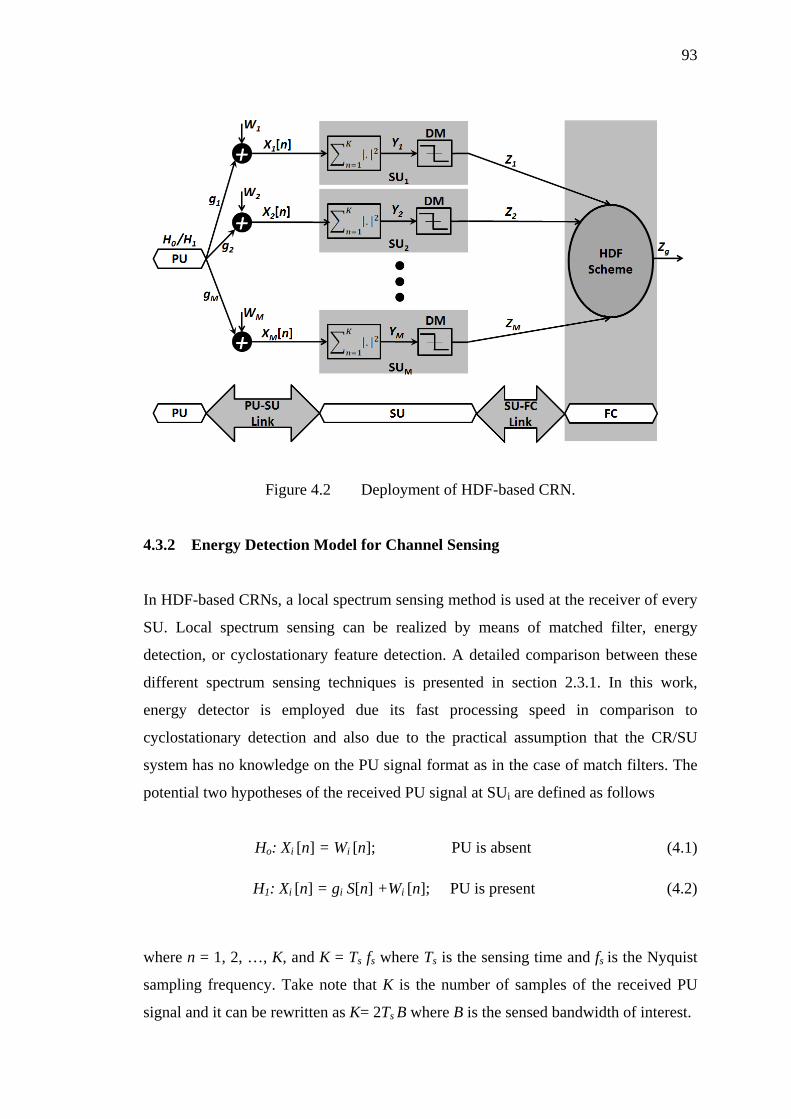
93
Figure 4.2 Deployment of HDF-based CRN.
4.3.2 Energy Detection Model for Channel Sensing
In HDF-based CRNs, a local spectrum sensing method is used at the receiver of every
SU. Local spectrum sensing can be realized by means of matched filter, energy
detection, or cyclostationary feature detection. A detailed comparison between these
different spectrum sensing techniques is presented in section 2.3.1. In this work,
energy detector is employed due its fast processing speed in comparison to
cyclostationary detection and also due to the practical assumption that the CR/SU
system has no knowledge on the PU signal format as in the case of match filters. The
potential two hypotheses of the received PU signal at SUi are defined as follows
Ho: Xi [n] = Wi [n]; PU is absent (4.1)
H1: Xi [n] = gi S[n] +Wi [n]; PU is present (4.2)
where n = 1, 2, …, K, and K = Ts fs where Ts is the sensing time and fs is the Nyquist
sampling frequency. Take note that K is the number of samples of the received PU
signal and it can be rewritten as K= 2Ts B where B is the sensed bandwidth of interest.
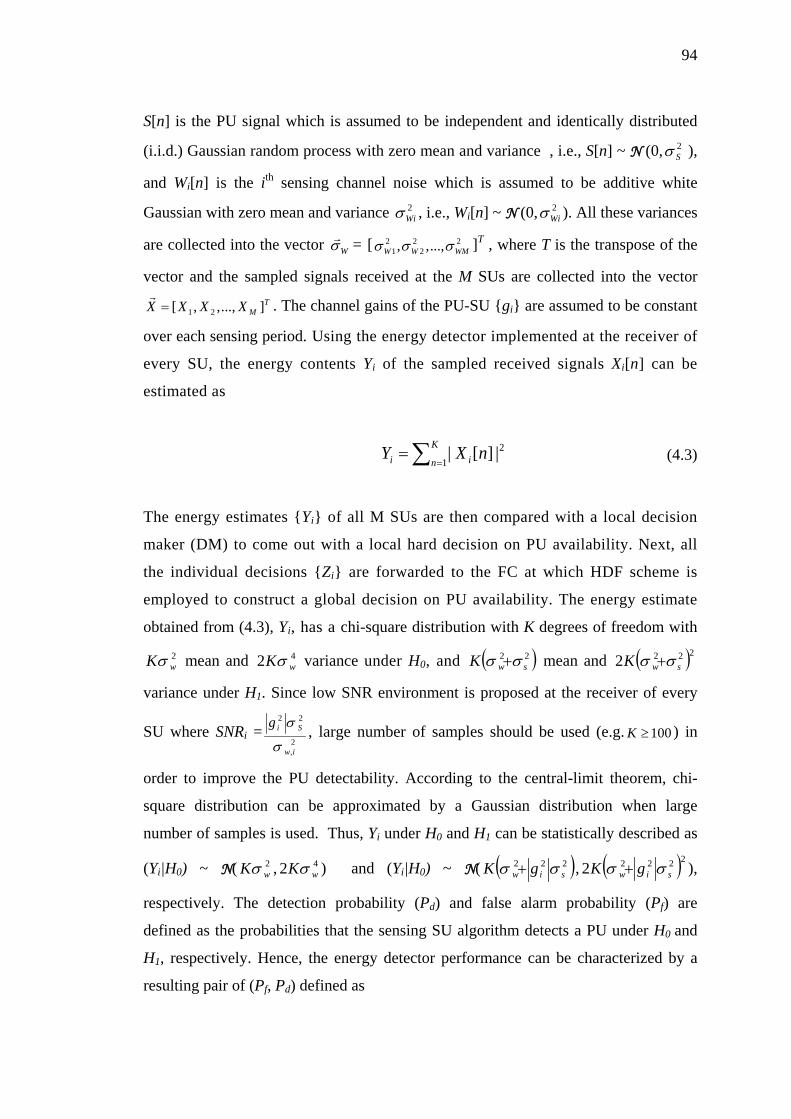
94
S[n] is the PU signal which is assumed to be independent and identically distributed
(i.i.d.) Gaussian random process with zero mean and variance , i.e., S[n] ~ N (0, 2Sσ ),
and Wi[n] is the ith sensing channel noise which is assumed to be additive white
Gaussian with zero mean and variance 2Wiσ , i.e., Wi[n] ~ N (0, 2
Wiσ ). All these variances
are collected into the vector Wσ = [ 22
22
1 ...,,, WMWW σσσ ]T , where T is the transpose of the
vector and the sampled signals received at the M SUs are collected into the vector T
MXXXX ]...,,,[ 21=
. The channel gains of the PU-SU {gi} are assumed to be constant
over each sensing period. Using the energy detector implemented at the receiver of
every SU, the energy contents Yi of the sampled received signals Xi[n] can be
estimated as
∑ ==
K
n ii nXY1
2|][| (4.3)
The energy estimates {Yi} of all M SUs are then compared with a local decision
maker (DM) to come out with a local hard decision on PU availability. Next, all
the individual decisions {Zi} are forwarded to the FC at which HDF scheme is
employed to construct a global decision on PU availability. The energy estimate
obtained from (4.3), Yi, has a chi-square distribution with K degrees of freedom with
2wKσ mean and 42 wKσ variance under H0, and ( )22
swK σσ + mean and ( )2222 swK σσ +
variance under H1. Since low SNR environment is proposed at the receiver of every
SU where SNRi =2,
22
iw
Sig
σ
σ , large number of samples should be used (e.g. 100≥K ) in
order to improve the PU detectability. According to the central-limit theorem, chi-
square distribution can be approximated by a Gaussian distribution when large
number of samples is used. Thus, Yi under H0 and H1 can be statistically described as
(Yi|H0) ~ N( 2wKσ , 42 wKσ ) and (Yi|H0) ~ N( ( )222
siw gK σσ + , ( )22222 siw gK σσ + ),
respectively. The detection probability (Pd) and false alarm probability (Pf) are
defined as the probabilities that the sensing SU algorithm detects a PU under H0 and
H1, respectively. Hence, the energy detector performance can be characterized by a
resulting pair of (Pf, Pd) defined as
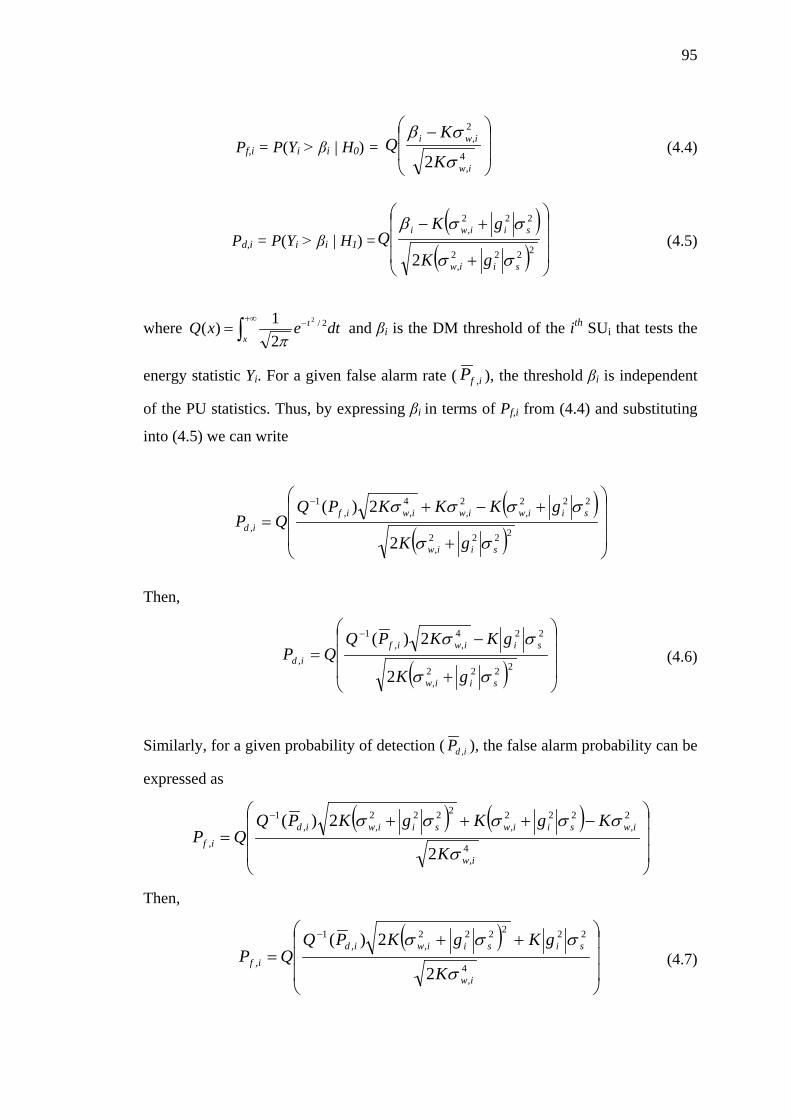
95
Pf,i = P(Yi > βi | H0) =
−4
,
2,
2 iw
iwi
K
KQ
σ
σβ (4.4)
Pd,i = P(Yi > βi | H1) =( )
( )
+
+−2222
,
222,
2 siiw
siiwi
gK
gKQ
σσ
σσβ (4.5)
where dtexQ t
x
2/2
21)( −+∞
∫= π and βi is the DM threshold of the ith SUi that tests the
energy statistic Yi. For a given false alarm rate ( ifP , ), the threshold βi is independent
of the PU statistics. Thus, by expressing βi in terms of Pf,i from (4.4) and substituting
into (4.5) we can write
( )( )
+
+−+=
−
2222,
222,
2,
4,,
1
,
2
2)(
siiw
siiwiwiwifid
gK
gKKKPQQP
σσ
σσσσ
Then,
( )
+
−=
−
2222,
224,,
1
,
2
2)(
siiw
siiwifid
gK
gKKPQQP
σσ
σσ
(4.6)
Similarly, for a given probability of detection ( idP , ), the false alarm probability can be
expressed as
( ) ( )
−+++=
−
4,
2,
222,
2222,,
1
,2
2)(
iw
iwsiiwsiiwidif
K
KgKgKPQQP
σ
σσσσσ
Then,
( )
++=
−
4,
222222,,
1
,2
2)(
iw
sisiiwid
ifK
gKgKPQQP
σ
σσσ (4.7)
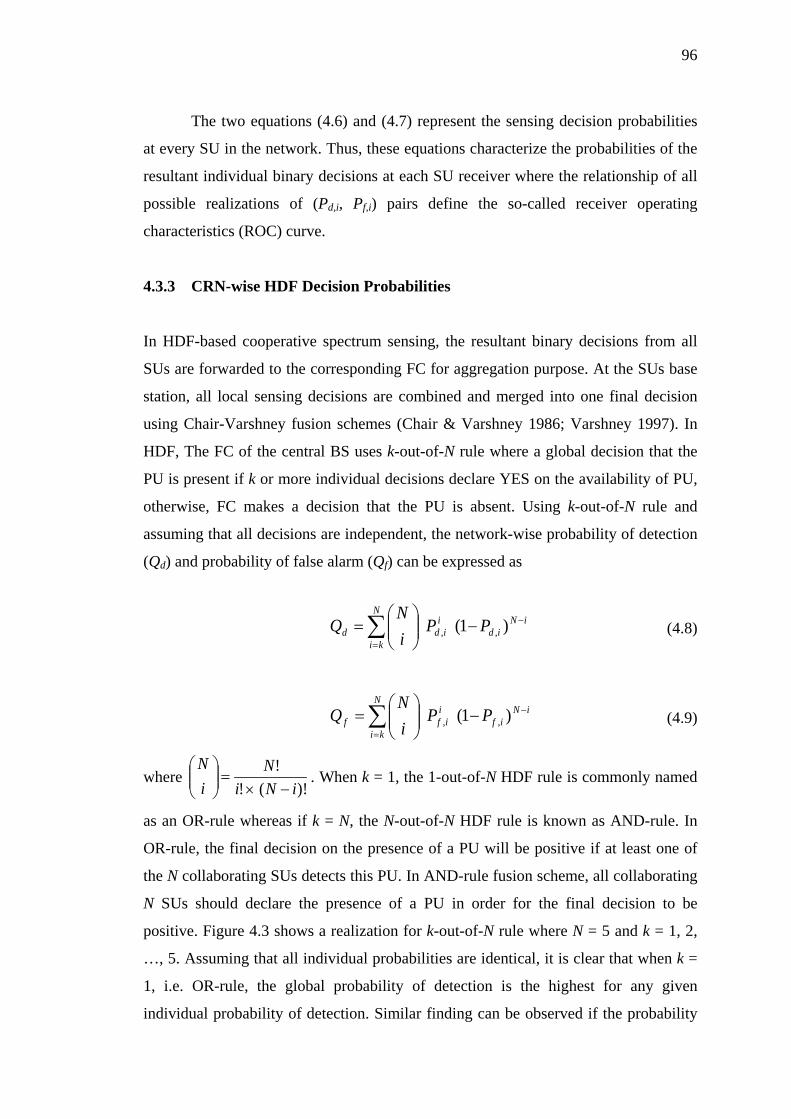
96
The two equations (4.6) and (4.7) represent the sensing decision probabilities
at every SU in the network. Thus, these equations characterize the probabilities of the
resultant individual binary decisions at each SU receiver where the relationship of all
possible realizations of (Pd,i, Pf,i) pairs define the so-called receiver operating
characteristics (ROC) curve.
4.3.3 CRN-wise HDF Decision Probabilities
In HDF-based cooperative spectrum sensing, the resultant binary decisions from all
SUs are forwarded to the corresponding FC for aggregation purpose. At the SUs base
station, all local sensing decisions are combined and merged into one final decision
using Chair-Varshney fusion schemes (Chair & Varshney 1986; Varshney 1997). In
HDF, The FC of the central BS uses k-out-of-N rule where a global decision that the
PU is present if k or more individual decisions declare YES on the availability of PU,
otherwise, FC makes a decision that the PU is absent. Using k-out-of-N rule and
assuming that all decisions are independent, the network-wise probability of detection
(Qd) and probability of false alarm (Qf) can be expressed as
iNid
N
ki
iidd PP
iN
Q −
=
−
= ∑ )1( ,,
(4.8)
iNif
N
ki
iiff PP
iN
Q −
=
−
= ∑ )1( ,,
(4.9)
where )!(!
!iNi
NiN
−×=
. When k = 1, the 1-out-of-N HDF rule is commonly named
as an OR-rule whereas if k = N, the N-out-of-N HDF rule is known as AND-rule. In
OR-rule, the final decision on the presence of a PU will be positive if at least one of
the N collaborating SUs detects this PU. In AND-rule fusion scheme, all collaborating
N SUs should declare the presence of a PU in order for the final decision to be
positive. Figure 4.3 shows a realization for k-out-of-N rule where N = 5 and k = 1, 2,
…, 5. Assuming that all individual probabilities are identical, it is clear that when k =
1, i.e. OR-rule, the global probability of detection is the highest for any given
individual probability of detection. Similar finding can be observed if the probability
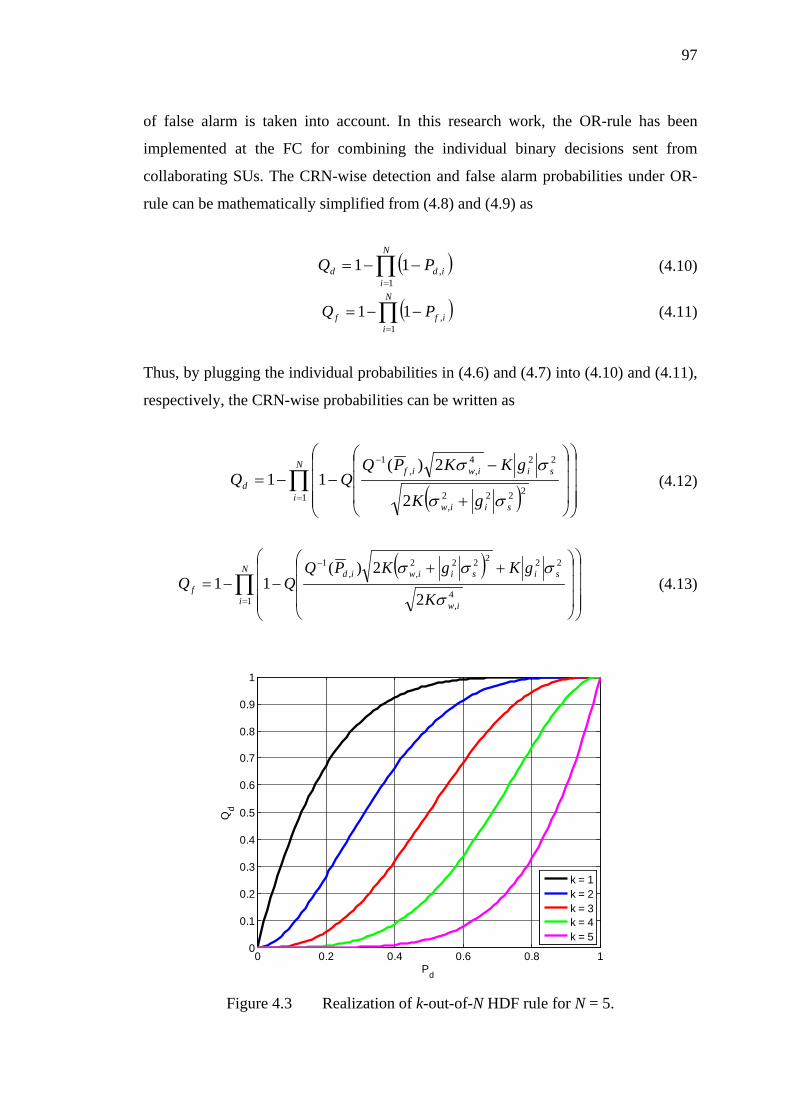
97
of false alarm is taken into account. In this research work, the OR-rule has been
implemented at the FC for combining the individual binary decisions sent from
collaborating SUs. The CRN-wise detection and false alarm probabilities under OR-
rule can be mathematically simplified from (4.8) and (4.9) as
( )∏
=
−−=N
iidd PQ
1,11
(4.10)
( )∏=
−−=N
iiff PQ
1,11
(4.11)
Thus, by plugging the individual probabilities in (4.6) and (4.7) into (4.10) and (4.11),
respectively, the CRN-wise probabilities can be written as
( )∏=
−
+
−−−=
N
isiiw
siiwifd
gK
gKKPQQQ
12222
,
224,,
1
2
2)(11
σσ
σσ
(4.12)
( )∏=
−
++−−=
N
i iw
sisiiwid
fK
gKgKPQQQ
14
,
222222,,
1
2
2)(11
σ
σσσ
(4.13)
Figure 4.3 Realization of k-out-of-N HDF rule for N = 5.
0 0.2 0.4 0.6 0.8 10
0.1
0.2
0.3
0.4
0.5
0.6
0.7
0.8
0.9
1
Pd
Qd
k = 1k = 2k = 3k = 4k = 5
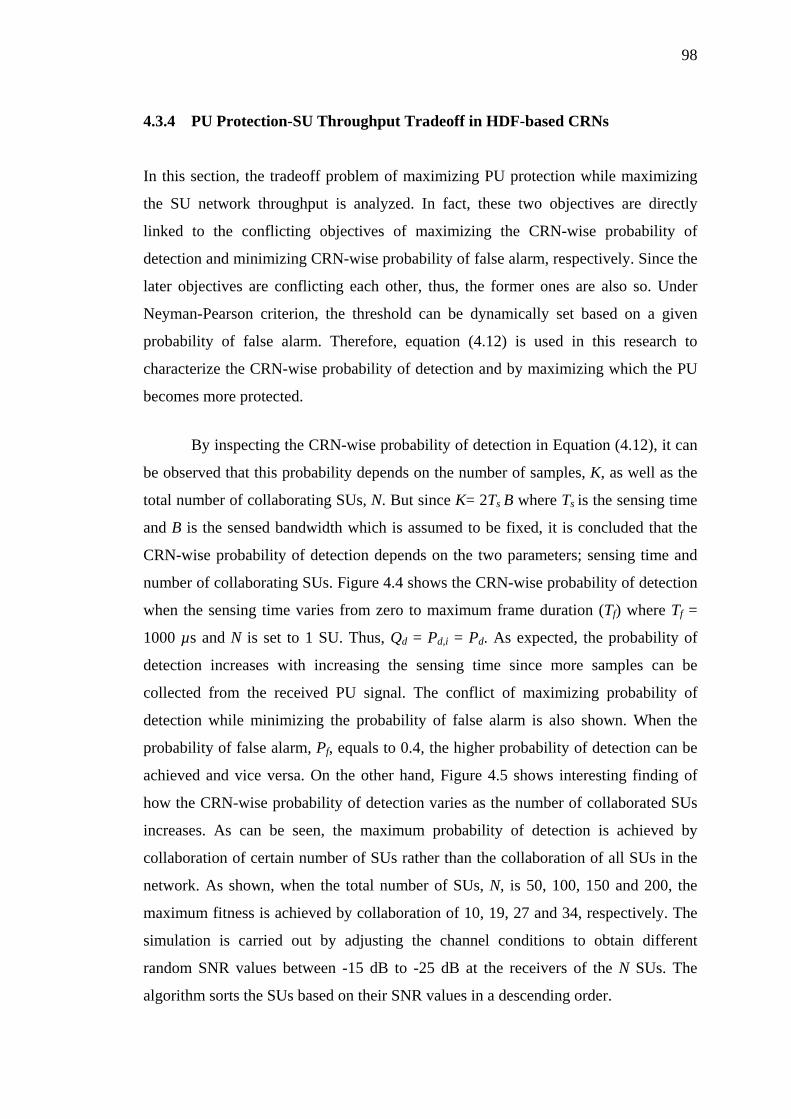
98
4.3.4 PU Protection-SU Throughput Tradeoff in HDF-based CRNs
In this section, the tradeoff problem of maximizing PU protection while maximizing
the SU network throughput is analyzed. In fact, these two objectives are directly
linked to the conflicting objectives of maximizing the CRN-wise probability of
detection and minimizing CRN-wise probability of false alarm, respectively. Since the
later objectives are conflicting each other, thus, the former ones are also so. Under
Neyman-Pearson criterion, the threshold can be dynamically set based on a given
probability of false alarm. Therefore, equation (4.12) is used in this research to
characterize the CRN-wise probability of detection and by maximizing which the PU
becomes more protected.
By inspecting the CRN-wise probability of detection in Equation (4.12), it can
be observed that this probability depends on the number of samples, K, as well as the
total number of collaborating SUs, N. But since K= 2Ts B where Ts is the sensing time
and B is the sensed bandwidth which is assumed to be fixed, it is concluded that the
CRN-wise probability of detection depends on the two parameters; sensing time and
number of collaborating SUs. Figure 4.4 shows the CRN-wise probability of detection
when the sensing time varies from zero to maximum frame duration (Tf) where Tf =
1000 µs and N is set to 1 SU. Thus, Qd = Pd,i = Pd. As expected, the probability of
detection increases with increasing the sensing time since more samples can be
collected from the received PU signal. The conflict of maximizing probability of
detection while minimizing the probability of false alarm is also shown. When the
probability of false alarm, Pf, equals to 0.4, the higher probability of detection can be
achieved and vice versa. On the other hand, Figure 4.5 shows interesting finding of
how the CRN-wise probability of detection varies as the number of collaborated SUs
increases. As can be seen, the maximum probability of detection is achieved by
collaboration of certain number of SUs rather than the collaboration of all SUs in the
network. As shown, when the total number of SUs, N, is 50, 100, 150 and 200, the
maximum fitness is achieved by collaboration of 10, 19, 27 and 34, respectively. The
simulation is carried out by adjusting the channel conditions to obtain different
random SNR values between -15 dB to -25 dB at the receivers of the N SUs. The
algorithm sorts the SUs based on their SNR values in a descending order.
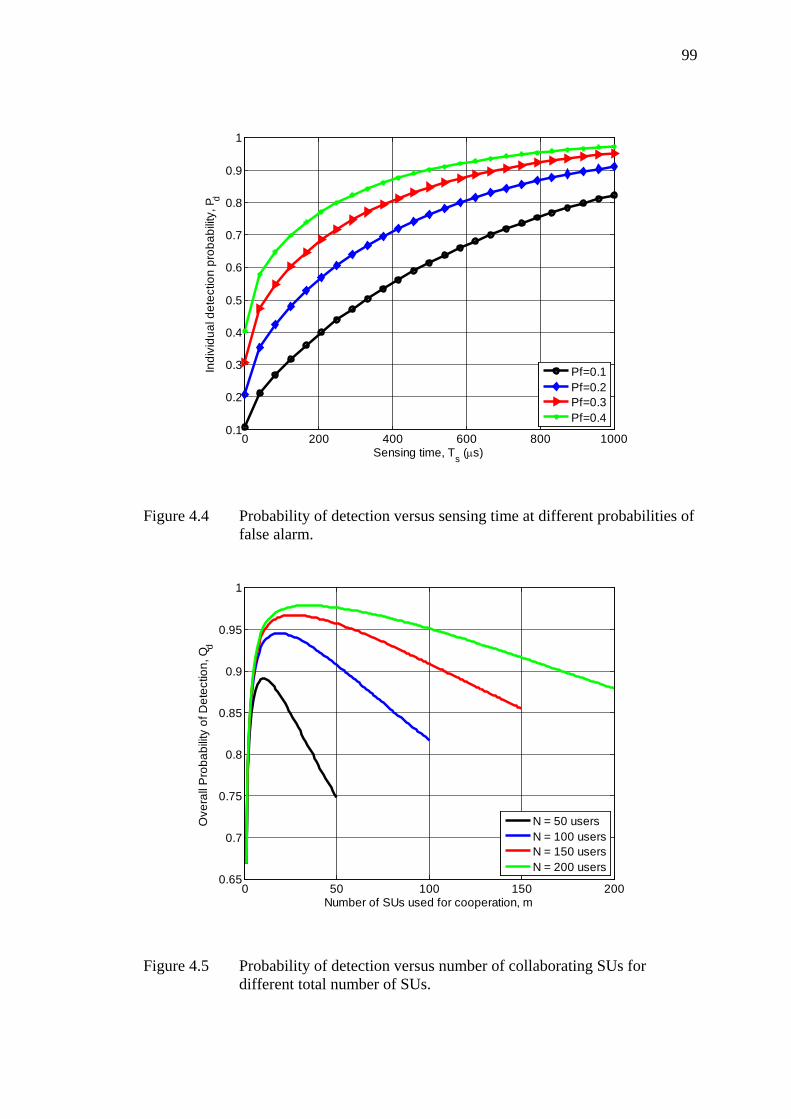
99
Figure 4.4 Probability of detection versus sensing time at different probabilities of false alarm.
Figure 4.5 Probability of detection versus number of collaborating SUs for different total number of SUs.
0 200 400 600 800 10000.1
0.2
0.3
0.4
0.5
0.6
0.7
0.8
0.9
1
Sensing time, Ts (µs)
Indi
vidu
al d
etec
tion
prob
abilit
y, P d
Pf=0.1Pf=0.2Pf=0.3Pf=0.4
0 50 100 150 2000.65
0.7
0.75
0.8
0.85
0.9
0.95
1
Number of SUs used for cooperation, m
Ove
rall
Pro
babi
lity
of D
etec
tion,
Qd
N = 50 usersN = 100 usersN = 150 usersN = 200 users
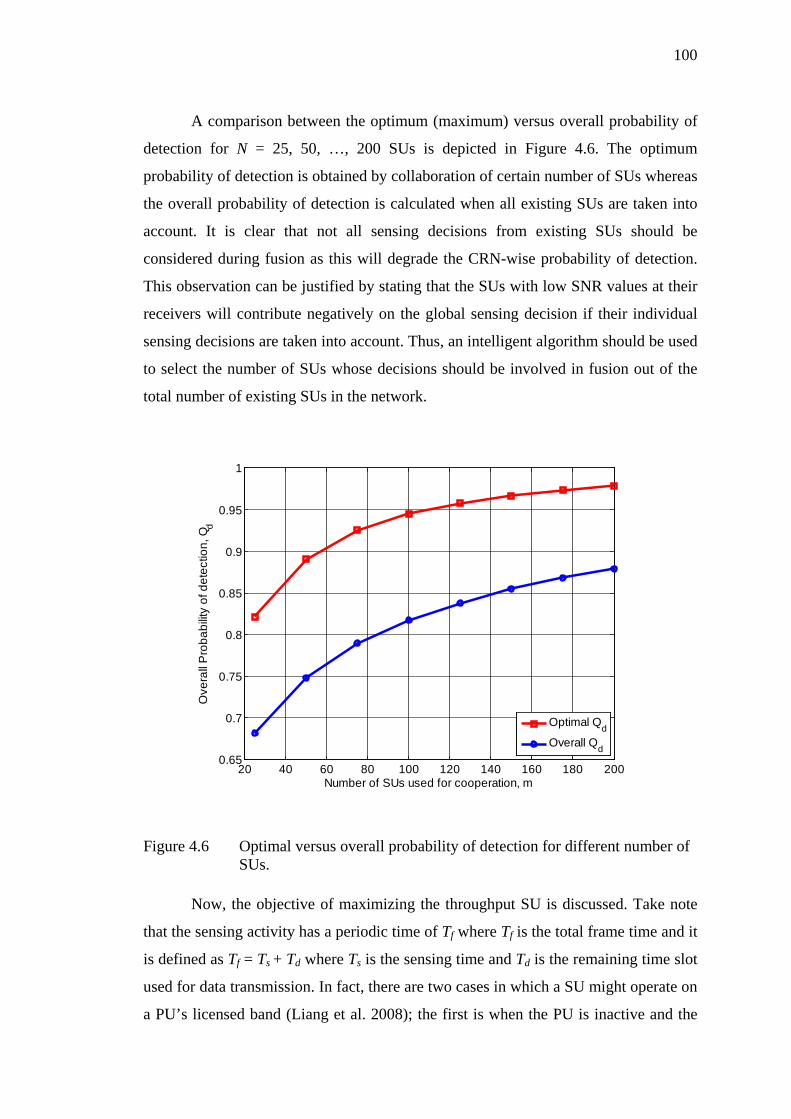
100
A comparison between the optimum (maximum) versus overall probability of
detection for N = 25, 50, …, 200 SUs is depicted in Figure 4.6. The optimum
probability of detection is obtained by collaboration of certain number of SUs whereas
the overall probability of detection is calculated when all existing SUs are taken into
account. It is clear that not all sensing decisions from existing SUs should be
considered during fusion as this will degrade the CRN-wise probability of detection.
This observation can be justified by stating that the SUs with low SNR values at their
receivers will contribute negatively on the global sensing decision if their individual
sensing decisions are taken into account. Thus, an intelligent algorithm should be used
to select the number of SUs whose decisions should be involved in fusion out of the
total number of existing SUs in the network.
Figure 4.6 Optimal versus overall probability of detection for different number of SUs.
Now, the objective of maximizing the throughput SU is discussed. Take note
that the sensing activity has a periodic time of Tf where Tf is the total frame time and it
is defined as Tf = Ts + Td where Ts is the sensing time and Td is the remaining time slot
used for data transmission. In fact, there are two cases in which a SU might operate on
a PU’s licensed band (Liang et al. 2008); the first is when the PU is inactive and the
20 40 60 80 100 120 140 160 180 2000.65
0.7
0.75
0.8
0.85
0.9
0.95
1
Number of SUs used for cooperation, m
Ove
rall
Pro
babi
lity
of d
etec
tion,
Qd
Optimal QdOverall Qd
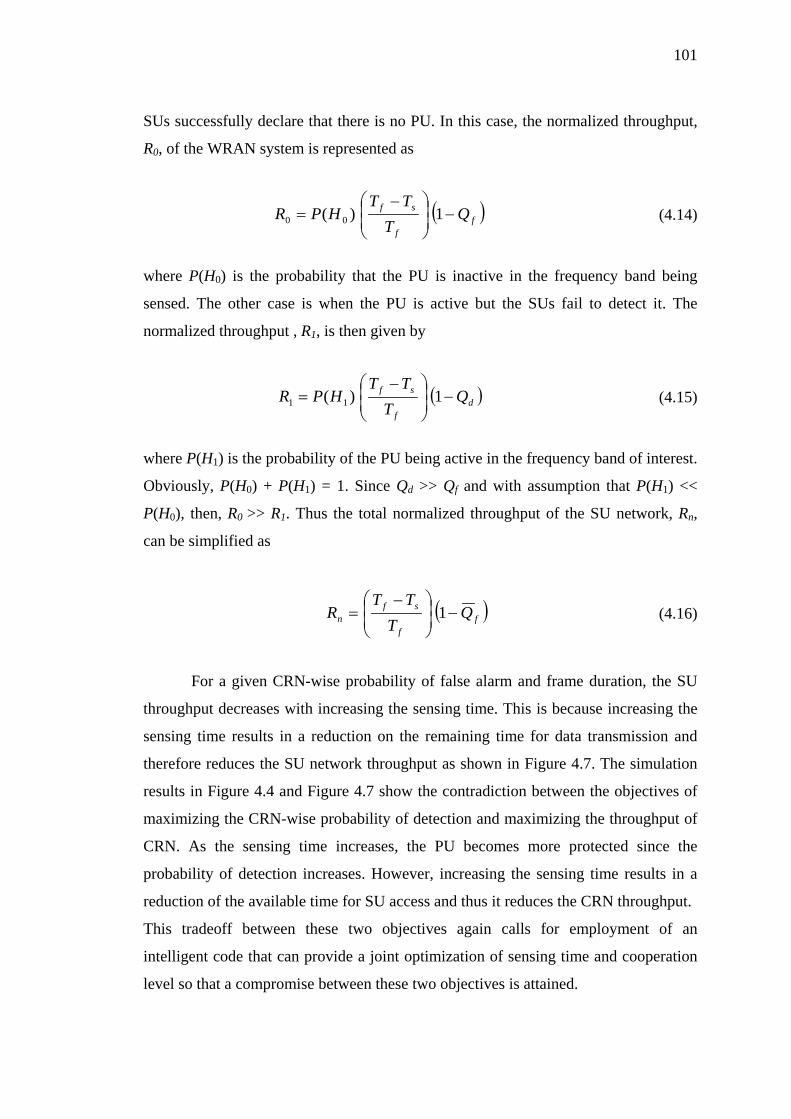
101
SUs successfully declare that there is no PU. In this case, the normalized throughput,
R0, of the WRAN system is represented as
( )ff
sf QT
TTHPR −
−= 1)( 00
(4.14)
where P(H0) is the probability that the PU is inactive in the frequency band being
sensed. The other case is when the PU is active but the SUs fail to detect it. The
normalized throughput , R1, is then given by
( )df
sf QT
TTHPR −
−= 1)( 11 (4.15)
where P(H1) is the probability of the PU being active in the frequency band of interest.
Obviously, P(H0) + P(H1) = 1. Since Qd >> Qf and with assumption that P(H1) <<
P(H0), then, R0 >> R1. Thus the total normalized throughput of the SU network, Rn,
can be simplified as
( )ff
sfn Q
TTT
R −
−= 1 (4.16)
For a given CRN-wise probability of false alarm and frame duration, the SU
throughput decreases with increasing the sensing time. This is because increasing the
sensing time results in a reduction on the remaining time for data transmission and
therefore reduces the SU network throughput as shown in Figure 4.7. The simulation
results in Figure 4.4 and Figure 4.7 show the contradiction between the objectives of
maximizing the CRN-wise probability of detection and maximizing the throughput of
CRN. As the sensing time increases, the PU becomes more protected since the
probability of detection increases. However, increasing the sensing time results in a
reduction of the available time for SU access and thus it reduces the CRN throughput.
This tradeoff between these two objectives again calls for employment of an
intelligent code that can provide a joint optimization of sensing time and cooperation
level so that a compromise between these two objectives is attained.
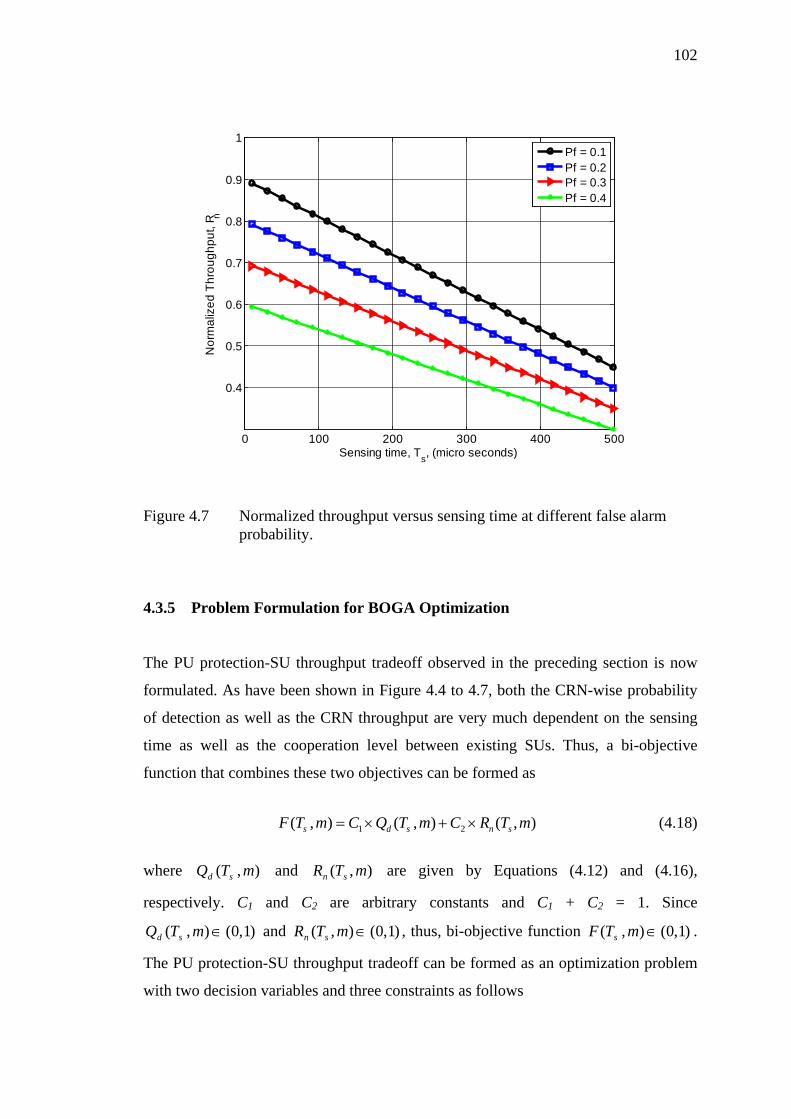
102
Figure 4.7 Normalized throughput versus sensing time at different false alarm probability.
4.3.5 Problem Formulation for BOGA Optimization
The PU protection-SU throughput tradeoff observed in the preceding section is now
formulated. As have been shown in Figure 4.4 to 4.7, both the CRN-wise probability
of detection as well as the CRN throughput are very much dependent on the sensing
time as well as the cooperation level between existing SUs. Thus, a bi-objective
function that combines these two objectives can be formed as
),(),(),( 21 mTRCmTQCmTF snsds ×+×= (4.18)
where ),( mTQ sd and ),( mTR sn are given by Equations (4.12) and (4.16),
respectively. C1 and C2 are arbitrary constants and C1 + C2 = 1. Since
)1,0(),( ∈mTQ sd and )1,0(),( ∈mTR sn , thus, bi-objective function )1,0(),( ∈mTF s .
The PU protection-SU throughput tradeoff can be formed as an optimization problem
with two decision variables and three constraints as follows
0 100 200 300 400 500
0.4
0.5
0.6
0.7
0.8
0.9
1
Sensing time, Ts, (micro seconds)
Nor
mal
ized
Thr
ough
put,
R n
Pf = 0.1Pf = 0.2Pf = 0.3Pf = 0.4
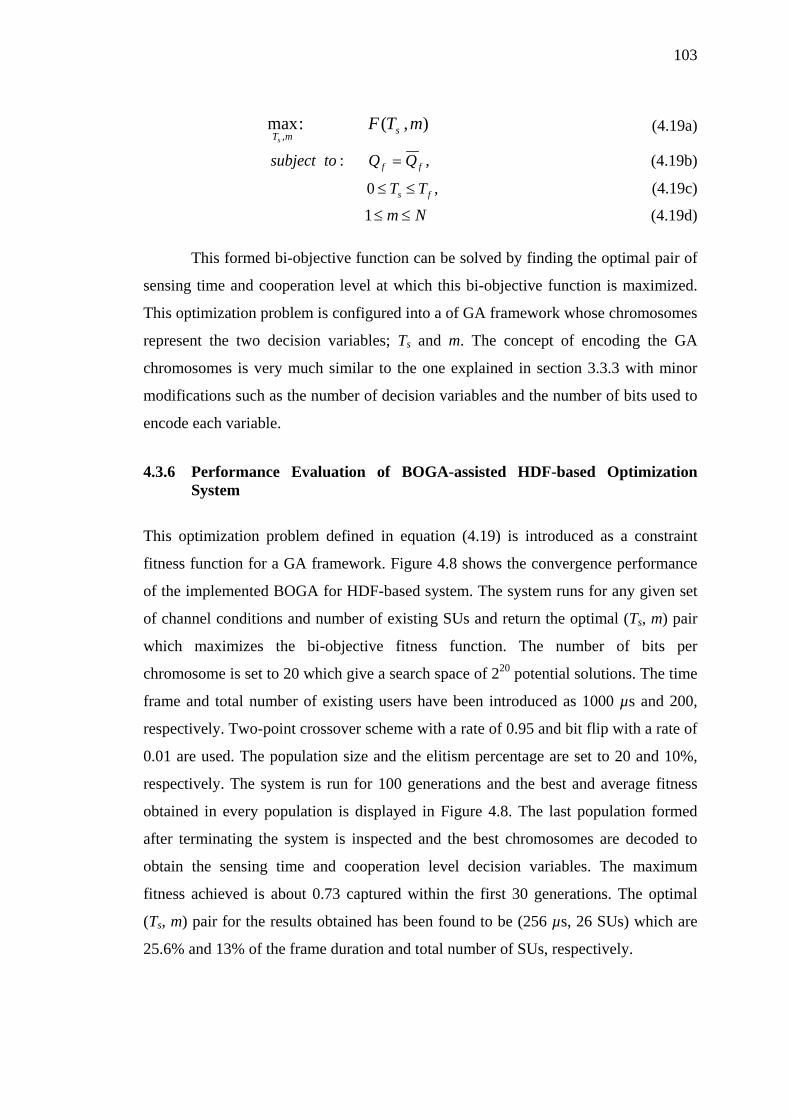
103
),(:max,
mTF smTs (4.19a)
,: ff QQtosubject = (4.19b)
,0 fs TT ≤≤ (4.19c)
Nm ≤≤1 (4.19d)
This formed bi-objective function can be solved by finding the optimal pair of
sensing time and cooperation level at which this bi-objective function is maximized.
This optimization problem is configured into a of GA framework whose chromosomes
represent the two decision variables; Ts and m. The concept of encoding the GA
chromosomes is very much similar to the one explained in section 3.3.3 with minor
modifications such as the number of decision variables and the number of bits used to
encode each variable.
4.3.6 Performance Evaluation of BOGA-assisted HDF-based Optimization
System
This optimization problem defined in equation (4.19) is introduced as a constraint
fitness function for a GA framework. Figure 4.8 shows the convergence performance
of the implemented BOGA for HDF-based system. The system runs for any given set
of channel conditions and number of existing SUs and return the optimal (Ts, m) pair
which maximizes the bi-objective fitness function. The number of bits per
chromosome is set to 20 which give a search space of 220 potential solutions. The time
frame and total number of existing users have been introduced as 1000 µs and 200,
respectively. Two-point crossover scheme with a rate of 0.95 and bit flip with a rate of
0.01 are used. The population size and the elitism percentage are set to 20 and 10%,
respectively. The system is run for 100 generations and the best and average fitness
obtained in every population is displayed in Figure 4.8. The last population formed
after terminating the system is inspected and the best chromosomes are decoded to
obtain the sensing time and cooperation level decision variables. The maximum
fitness achieved is about 0.73 captured within the first 30 generations. The optimal
(Ts, m) pair for the results obtained has been found to be (256 µs, 26 SUs) which are
25.6% and 13% of the frame duration and total number of SUs, respectively.
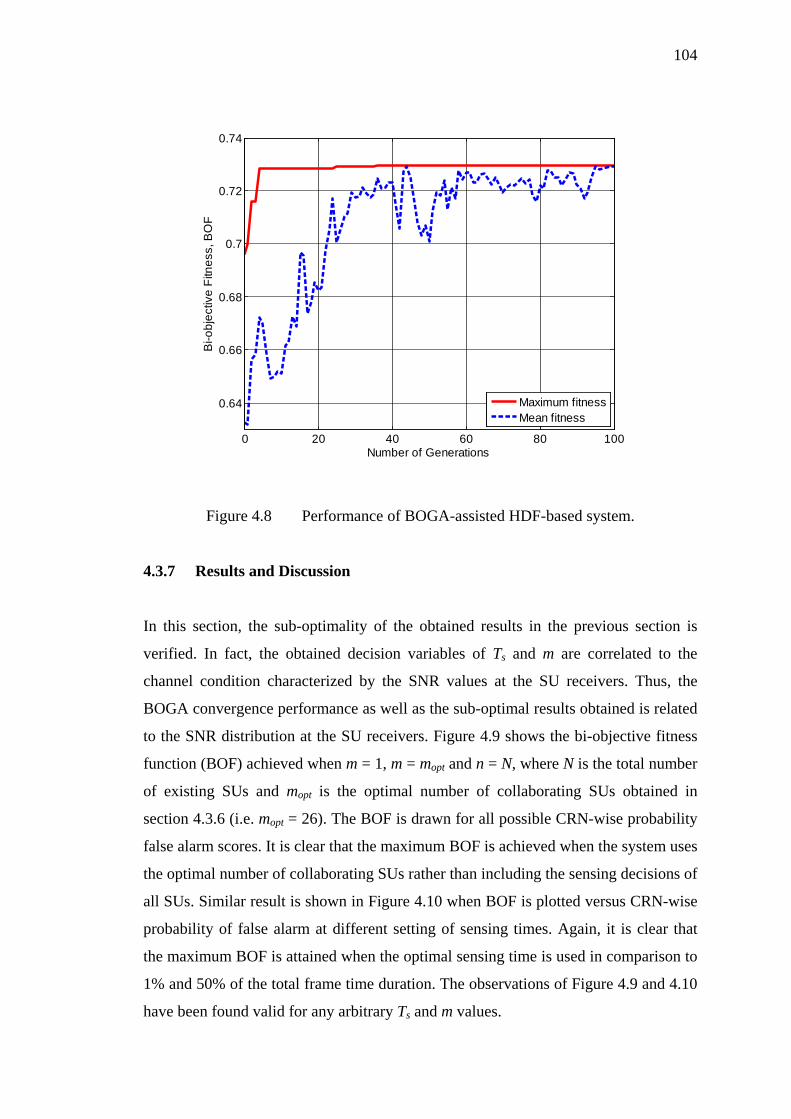
104
Figure 4.8 Performance of BOGA-assisted HDF-based system.
4.3.7 Results and Discussion
In this section, the sub-optimality of the obtained results in the previous section is
verified. In fact, the obtained decision variables of Ts and m are correlated to the
channel condition characterized by the SNR values at the SU receivers. Thus, the
BOGA convergence performance as well as the sub-optimal results obtained is related
to the SNR distribution at the SU receivers. Figure 4.9 shows the bi-objective fitness
function (BOF) achieved when m = 1, m = mopt and n = N, where N is the total number
of existing SUs and mopt is the optimal number of collaborating SUs obtained in
section 4.3.6 (i.e. mopt = 26). The BOF is drawn for all possible CRN-wise probability
false alarm scores. It is clear that the maximum BOF is achieved when the system uses
the optimal number of collaborating SUs rather than including the sensing decisions of
all SUs. Similar result is shown in Figure 4.10 when BOF is plotted versus CRN-wise
probability of false alarm at different setting of sensing times. Again, it is clear that
the maximum BOF is attained when the optimal sensing time is used in comparison to
1% and 50% of the total frame time duration. The observations of Figure 4.9 and 4.10
have been found valid for any arbitrary Ts and m values.
0 20 40 60 80 100
0.64
0.66
0.68
0.7
0.72
0.74
Number of Generations
Bi-o
bjec
tive
Fitn
ess,
BO
F
Maximum fitnessMean fitness
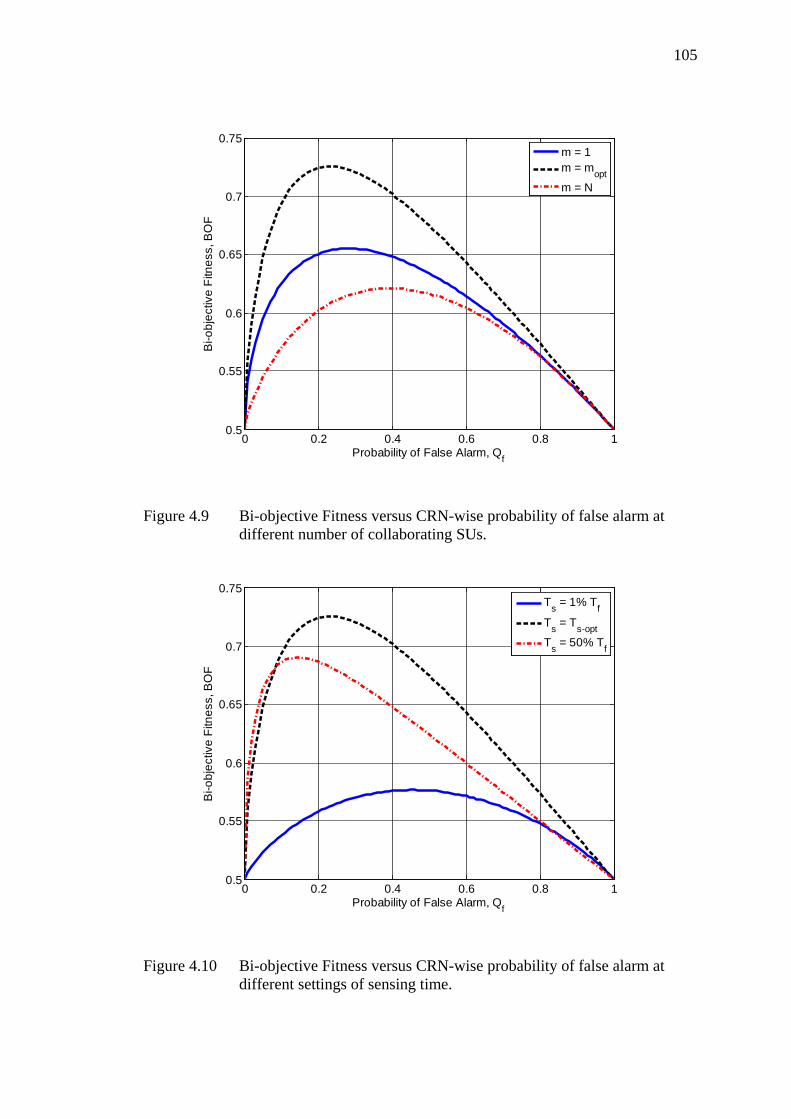
105
Figure 4.9 Bi-objective Fitness versus CRN-wise probability of false alarm at different number of collaborating SUs.
Figure 4.10 Bi-objective Fitness versus CRN-wise probability of false alarm at different settings of sensing time.
0 0.2 0.4 0.6 0.8 10.5
0.55
0.6
0.65
0.7
0.75
Probability of False Alarm, Qf
Bi-o
bjec
tive
Fitn
ess,
BO
F
m = 1m = moptm = N
0 0.2 0.4 0.6 0.8 10.5
0.55
0.6
0.65
0.7
0.75
Probability of False Alarm, Qf
Bi-o
bjec
tive
Fitn
ess,
BO
F
Ts = 1% TfTs = Ts-optTs = 50% Tf
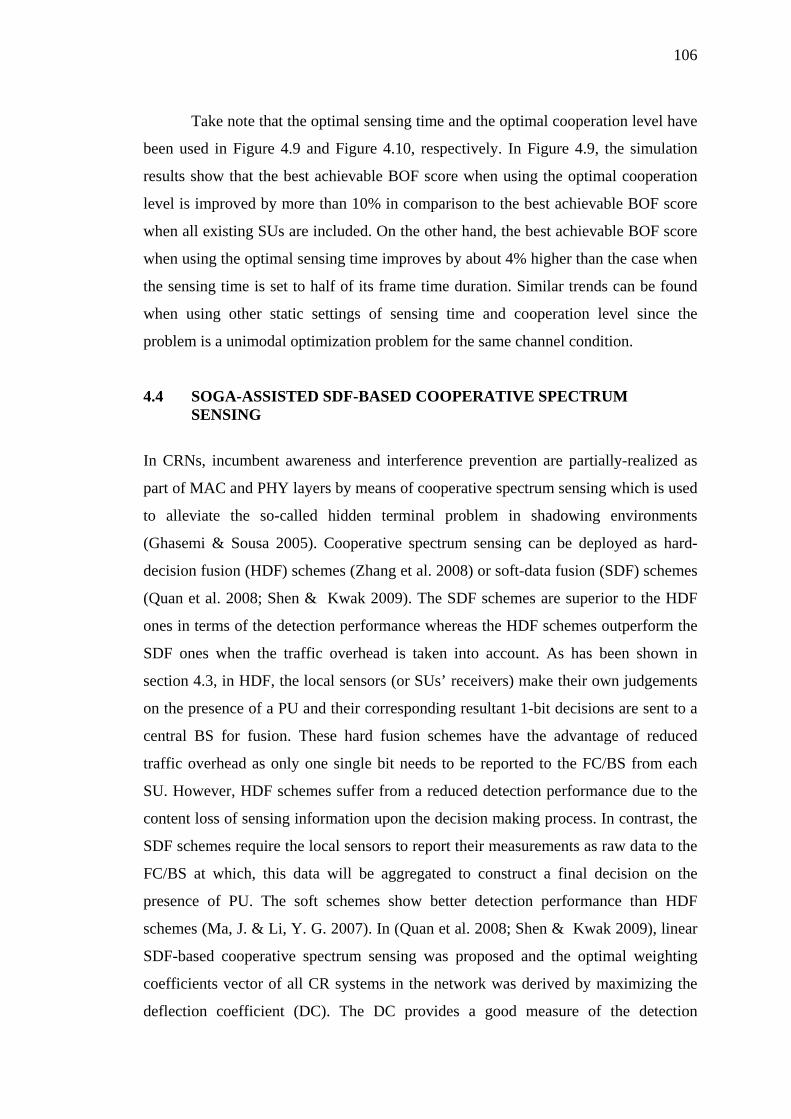
106
Take note that the optimal sensing time and the optimal cooperation level have
been used in Figure 4.9 and Figure 4.10, respectively. In Figure 4.9, the simulation
results show that the best achievable BOF score when using the optimal cooperation
level is improved by more than 10% in comparison to the best achievable BOF score
when all existing SUs are included. On the other hand, the best achievable BOF score
when using the optimal sensing time improves by about 4% higher than the case when
the sensing time is set to half of its frame time duration. Similar trends can be found
when using other static settings of sensing time and cooperation level since the
problem is a unimodal optimization problem for the same channel condition.
4.4 SOGA-ASSISTED SDF-BASED COOPERATIVE SPECTRUM SENSING
In CRNs, incumbent awareness and interference prevention are partially-realized as
part of MAC and PHY layers by means of cooperative spectrum sensing which is used
to alleviate the so-called hidden terminal problem in shadowing environments
(Ghasemi & Sousa 2005). Cooperative spectrum sensing can be deployed as hard-
decision fusion (HDF) schemes (Zhang et al. 2008) or soft-data fusion (SDF) schemes
(Quan et al. 2008; Shen & Kwak 2009). The SDF schemes are superior to the HDF
ones in terms of the detection performance whereas the HDF schemes outperform the
SDF ones when the traffic overhead is taken into account. As has been shown in
section 4.3, in HDF, the local sensors (or SUs’ receivers) make their own judgements
on the presence of a PU and their corresponding resultant 1-bit decisions are sent to a
central BS for fusion. These hard fusion schemes have the advantage of reduced
traffic overhead as only one single bit needs to be reported to the FC/BS from each
SU. However, HDF schemes suffer from a reduced detection performance due to the
content loss of sensing information upon the decision making process. In contrast, the
SDF schemes require the local sensors to report their measurements as raw data to the
FC/BS at which, this data will be aggregated to construct a final decision on the
presence of PU. The soft schemes show better detection performance than HDF
schemes (Ma, J. & Li, Y. G. 2007). In (Quan et al. 2008; Shen & Kwak 2009), linear
SDF-based cooperative spectrum sensing was proposed and the optimal weighting
coefficients vector of all CR systems in the network was derived by maximizing the
deflection coefficient (DC). The DC provides a good measure of the detection
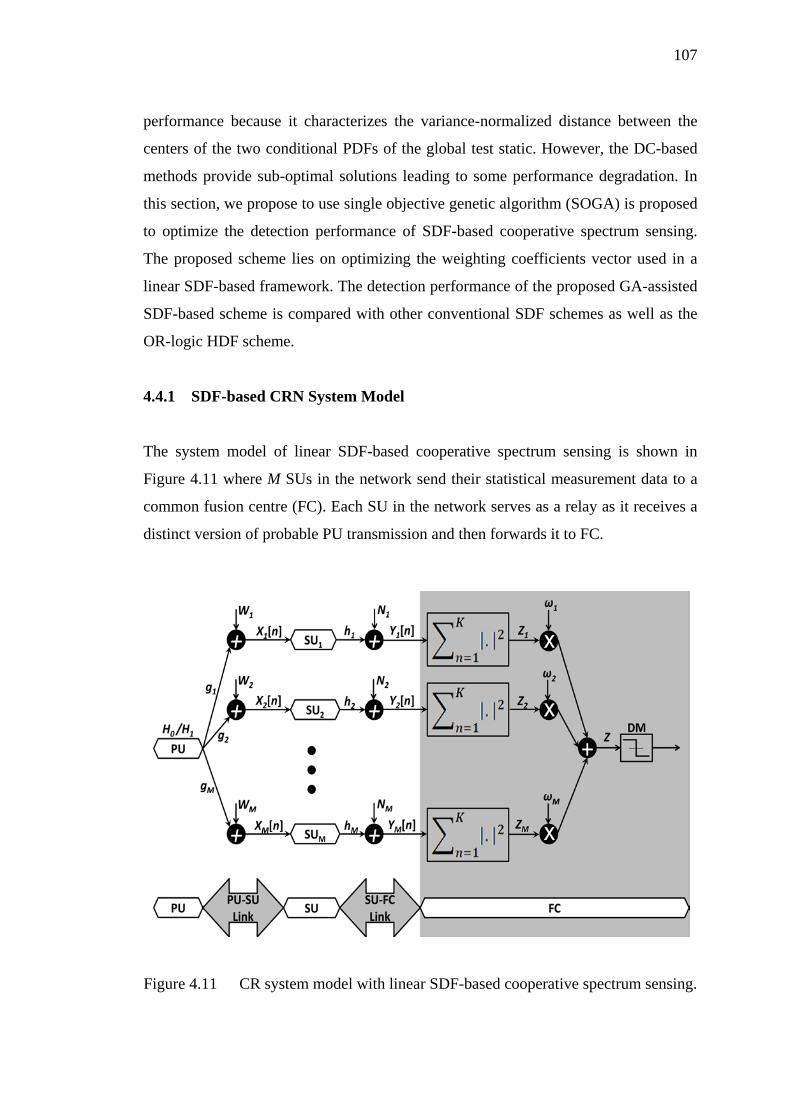
107
performance because it characterizes the variance-normalized distance between the
centers of the two conditional PDFs of the global test static. However, the DC-based
methods provide sub-optimal solutions leading to some performance degradation. In
this section, we propose to use single objective genetic algorithm (SOGA) is proposed
to optimize the detection performance of SDF-based cooperative spectrum sensing.
The proposed scheme lies on optimizing the weighting coefficients vector used in a
linear SDF-based framework. The detection performance of the proposed GA-assisted
SDF-based scheme is compared with other conventional SDF schemes as well as the
OR-logic HDF scheme.
4.4.1 SDF-based CRN System Model
The system model of linear SDF-based cooperative spectrum sensing is shown in
Figure 4.11 where M SUs in the network send their statistical measurement data to a
common fusion centre (FC). Each SU in the network serves as a relay as it receives a
distinct version of probable PU transmission and then forwards it to FC.
Figure 4.11 CR system model with linear SDF-based cooperative spectrum sensing.
108
In Figure 4.11 above, the FC receives the SUs signals and performs linear
weighted SDF to combine the individual measurements and concludes a final decision
on the availability of PU.
4.4.2 Characterization of PU-SU and SU-FC Link
(i) Characterization of PU-SU Link: The sensing task at any arbitrary SU is the
same binary hypothesis test expressed in (4.1) and (4.2). In this section, the same PU-
SU channel parameters and PU signal statistical properties of the HDF model are used
again in this SDF model. To clear potential confusion and ensure continuity, these
characteristics are briefly re-mentioned herein. S[n] is the PU signal whose statistical
properties are similarly defined as S[n] ~ N(0, 2Sσ ), and Wi[n] is the ith sensing channel
noise which is characterized as Wi[n] ~ N (0, 2Wiσ ). The variances of PU-SU paths are
collected into the vector TWMWWW ]...,,,[ 22
22
1 σσσσ =
where T is the transpose of the
vector. {gi} is the channel gains of the PU-SU paths which is assumed to be constant
over each sensing period; this can be justified by assuming slow-fading nature over
these links where the delay requirement is short in comparison to the channel
coherence time is a quasi-static scenario (Hossain & Bhargava 2007). Xi[n] is the
received sampled signal at the ith SU receiver and the sampled signals received at the
M SUs are collected into the vector TMXXXX ]...,,,[ 21=
.
(ii) Characterization of SU-FC Link: In SDF-based architectures, no decision
making processes are to be performed at SUs stage. Instead, the M SUs relay their
individual sensing data or measurements of PU signal availability to the
corresponding FC/BS through a dedicated control channel in an orthogonal
manner. Each relay will simply act in an amplify-and-forward (AAF) manner. The
justification of using AAF instead of the less complexity decode-and-forward
(DAF) scheme is referred to its ability to improve the detection performance by
employing some signal processing techniques at the FC. The channel noises {Ni}
of the SU-FC paths are assumed to be zero mean and spatially uncorrelated
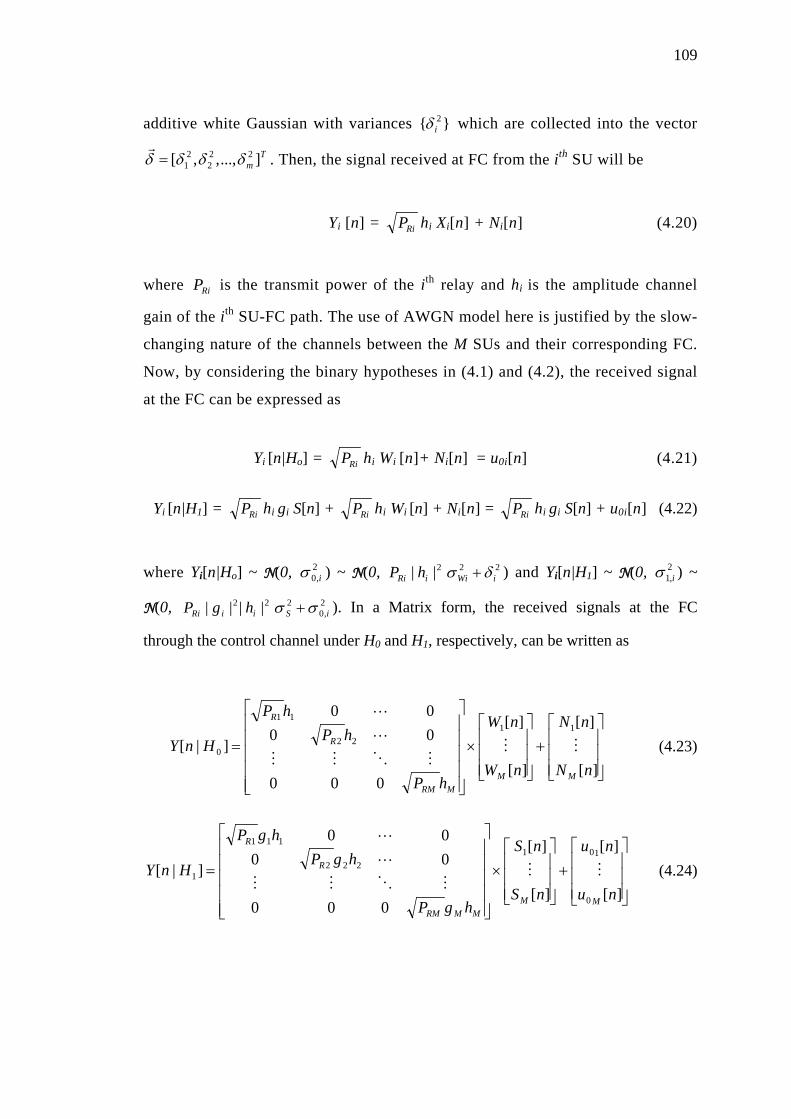
109
additive white Gaussian with variances }{ 2iδ which are collected into the vector
Tm ]...,,,[ 22
22
1 δδδδ =
. Then, the signal received at FC from the ith SU will be
Yi [n] = RiP hi Xi[n] + Ni[n] (4.20)
where RiP is the transmit power of the ith relay and hi is the amplitude channel
gain of the ith SU-FC path. The use of AWGN model here is justified by the slow-
changing nature of the channels between the M SUs and their corresponding FC.
Now, by considering the binary hypotheses in (4.1) and (4.2), the received signal
at the FC can be expressed as
Yi [n|Ho] = RiP hi Wi [n]+ Ni[n] = u0i[n] (4.21)
Yi [n|H1] = RiP hi gi S[n] + RiP hi Wi [n] + Ni[n] = RiP hi gi S[n] + u0i[n] (4.22)
where Yi[n|Ho] ~ N(0, 2,0 iσ ) ~ N(0,
222|| iWiiRi hP δσ + ) and Yi[n|H1] ~ N(0, 2,1 iσ ) ~
N(0, 2,0
222 |||| iSiiRi hgP σσ + ). In a Matrix form, the received signals at the FC
through the control channel under H0 and H1, respectively, can be written as
+
×
=][
][
][
][
000
0000
]|[11
22
11
0
nN
nN
nW
nW
hP
hPhP
HnY
MMMRM
R
R
(4.23)
+
×
=][
][
][
][
000
0000
]|[
0
101222
111
1
nu
nu
nS
nS
hgP
hgPhgP
HnY
MMMMRM
R
R
(4.24)
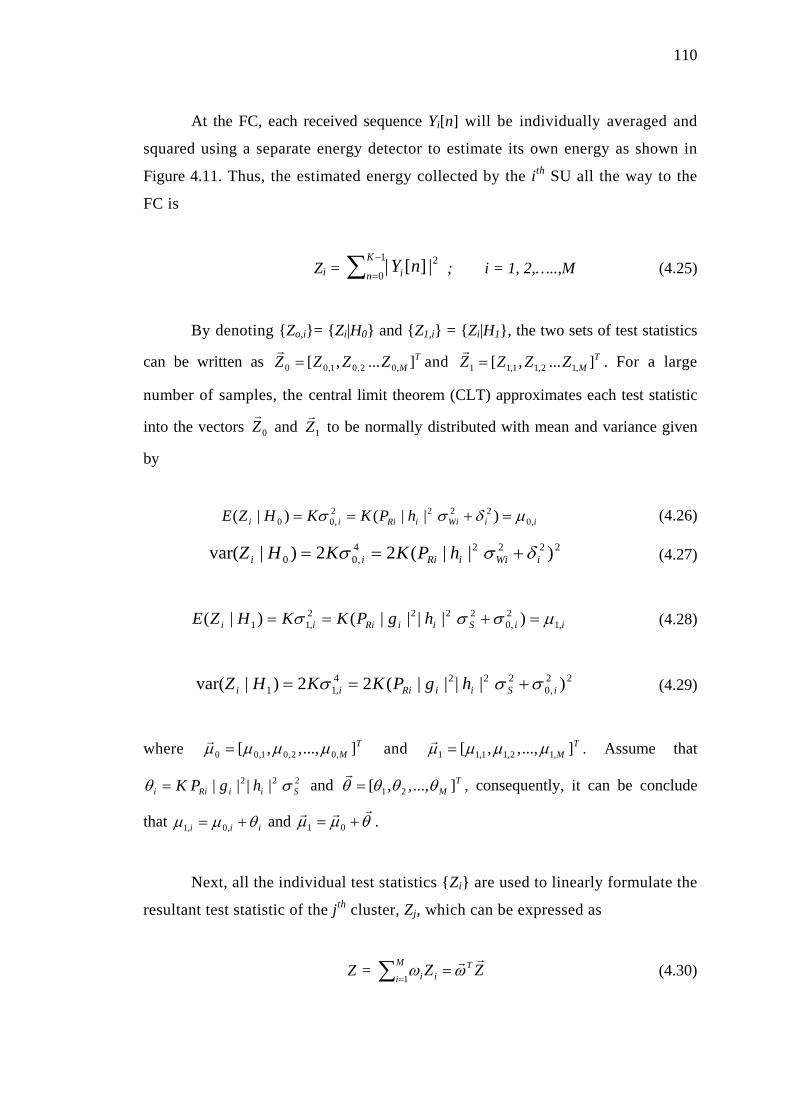
110
At the FC, each received sequence Yi[n] will be individually averaged and
squared using a separate energy detector to estimate its own energy as shown in
Figure 4.11. Thus, the estimated energy collected by the ith SU all the way to the
FC is
Zi = ∑ −
=
1
02|][|K
n i nY ; i = 1, 2,…..,M (4.25)
By denoting {Zo,i}= {Zi|H0} and {Z1,i} = {Zi|H1}, the two sets of test statistics
can be written as TMZZZZ ]...,[ ,02,01,00 =
and T
MZZZZ ]...,[ ,12,11,11 =
. For a large
number of samples, the central limit theorem (CLT) approximates each test statistic
into the vectors 0Z
and 1Z
to be normally distributed with mean and variance given
by
iiWiiRiii hPKKHZE ,02222
,00 )||()|( µδσσ =+== (4.26)
22224,00 )||(22)|var( iWiiRiii hPKKHZ δσσ +== (4.27)
iiSiiRiii hgPKKHZE ,12,0
2222,11 )||||()|( µσσσ =+== (4.28)
22
,02224
,11 )||||(22)|var( iSiiRiii hgPKKHZ σσσ +== (4.29)
where TM ]...,,,[ ,02,01,00 µµµµ =
and TM ]...,,,[ ,12,11,11 µµµµ =
. Assume that
222 |||| SiiRii hgPK σθ = and TM ]...,,,[ 21 θθθθ =
, consequently, it can be conclude
that iii θµµ += ,0,1 and θµµ
+= 01 .
Next, all the individual test statistics {Zi} are used to linearly formulate the
resultant test statistic of the jth cluster, Zj, which can be expressed as
Z = ZZ Ti
M
i i
ωω =∑ =1
(4.30)
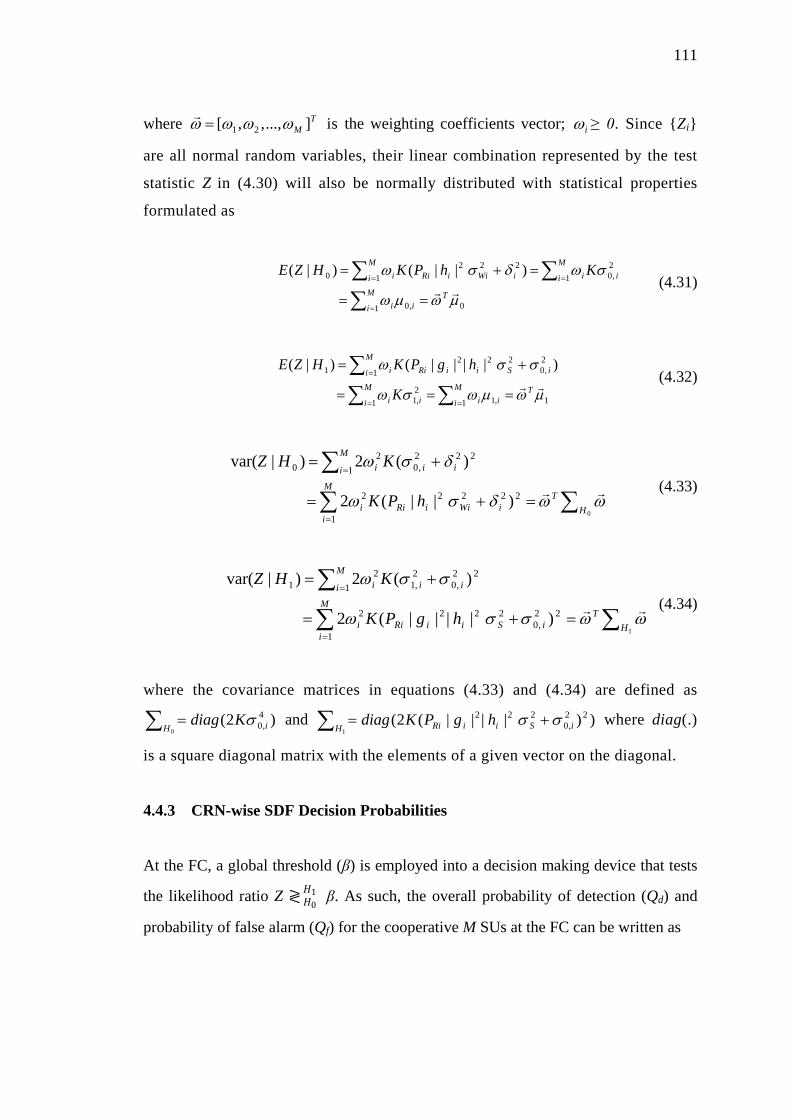
111
where TM ]...,,,[ 21 ωωωω =
is the weighting coefficients vector; iω ≥ 0. Since {Zi}
are all normal random variables, their linear combination represented by the test
statistic Z in (4.30) will also be normally distributed with statistical properties
formulated as
∑∑∑
=
==
==
=+=M
iT
ii
M
i iiM
i iWiiRii KhPKHZE
1 0,0
12,01
2220 )||()|(
µωµω
σωδσω
(4.31)
∑∑∑
==
=
===
+=M
iT
iiM
i ii
M
i iSiiRii
K
hgPKHZE
1 1,112,1
12,0
2221 )||||()|(
µωµωσω
σσω
(4.32)
∑∑
∑=+=
+=
=
=
0
2222
1
2
221
2,0
20
)||(2
)(2)|var(
HT
iWiiRi
M
ii
iM
i ii
hPK
KHZ
ωωδσω
δσω
(4.33)
∑∑
∑=+=
+=
=
=
1
22,0
222
1
2
22,01
2,1
21
)||||(2
)(2)|var(
HT
iSiiRi
M
ii
iM
i ii
hgPK
KHZ
ωωσσω
σσω
(4.34)
where the covariance matrices in equations (4.33) and (4.34) are defined as
∑ =0
)2( 4,0H iKdiag σ and ∑ +=
1))||||(2( 22
,0222
H iSiiRi hgPKdiag σσ where diag(.)
is a square diagonal matrix with the elements of a given vector on the diagonal.
4.4.3 CRN-wise SDF Decision Probabilities
At the FC, a global threshold (β) is employed into a decision making device that tests
the likelihood ratio Z ≷ 𝐻𝐻0 𝐻𝐻1 β. As such, the overall probability of detection (Qd) and
probability of false alarm (Qf) for the cooperative M SUs at the FC can be written as
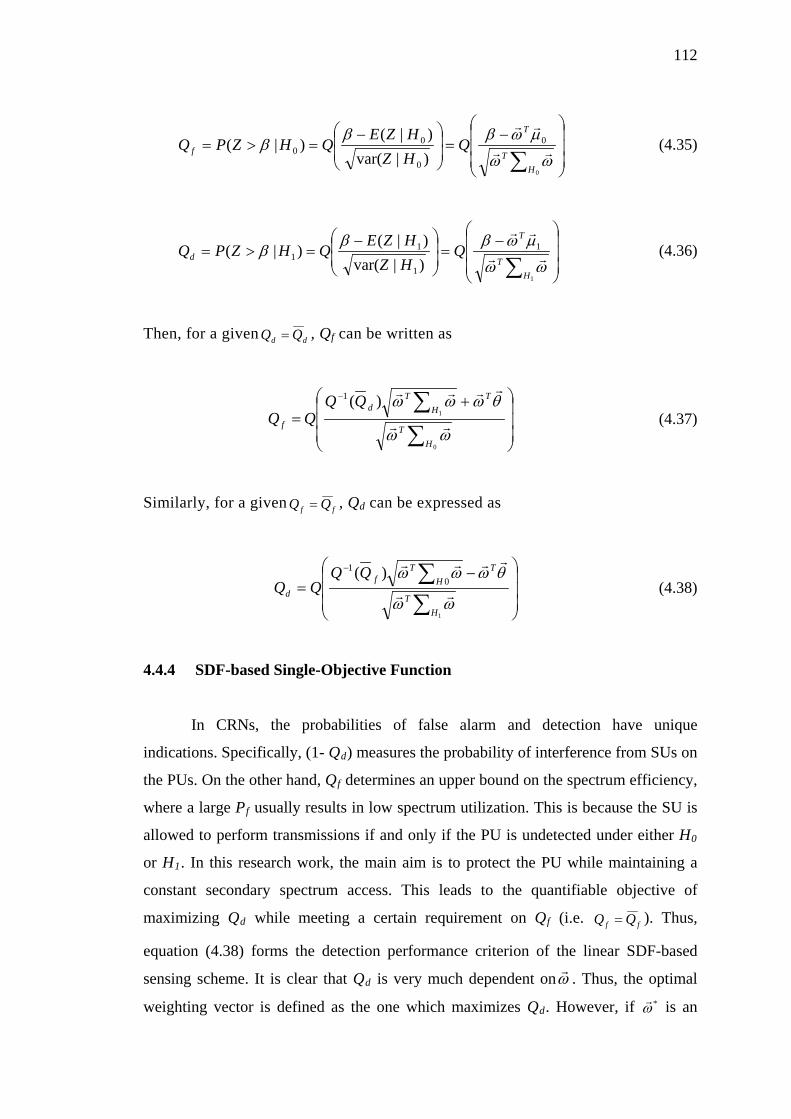
112
−
=
−=>=
∑0
0
0
00 )|var(
)|()|(
HT
T
f QHZHZE
QHZPQωω
µωβββ
(4.35)
−
=
−=>=
∑1
1
1
11 )|var(
)|()|(H
T
T
d QHZHZEQHZPQ
ωω
µωβββ
(4.36)
Then, for a given dd QQ = , Qf can be written as
+=
∑∑−
0
1)(1
HT
TH
Td
f
QQQQ
ωω
θωωω
(4.37)
Similarly, for a given ff QQ = , Qd can be expressed as
−=
∑∑−
1
01 )(
HT
TH
Tf
d
QQQQ
ωω
θωωω
(4.38)
4.4.4 SDF-based Single-Objective Function
In CRNs, the probabilities of false alarm and detection have unique
indications. Specifically, (1- Qd) measures the probability of interference from SUs on
the PUs. On the other hand, Qf determines an upper bound on the spectrum efficiency,
where a large Pf usually results in low spectrum utilization. This is because the SU is
allowed to perform transmissions if and only if the PU is undetected under either H0
or H1. In this research work, the main aim is to protect the PU while maintaining a
constant secondary spectrum access. This leads to the quantifiable objective of
maximizing Qd while meeting a certain requirement on Qf ff QQ = (i.e. ). Thus,
equation (4.38) forms the detection performance criterion of the linear SDF-based
sensing scheme. It is clear that Qd ω
is very much dependent on . Thus, the optimal
weighting vector is defined as the one which maximizes Qd*ω. However, if
is an
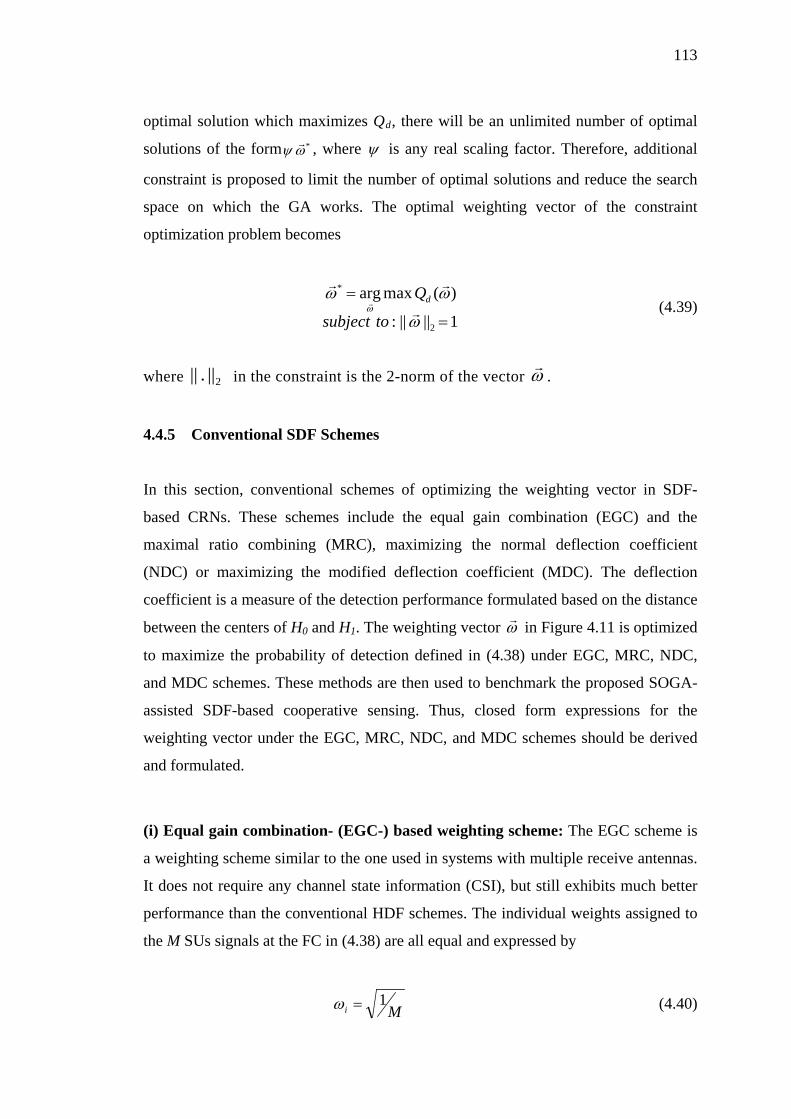
113
optimal solution which maximizes Qd
*ωψ
, there will be an unlimited number of optimal
solutions of the form , where ψ is any real scaling factor. Therefore, additional
constraint is proposed to limit the number of optimal solutions and reduce the search
space on which the GA works. The optimal weighting vector of the constraint
optimization problem becomes
1||||:
)(maxarg
2
*
=
=
ω
ωωω
tosubject
Qd
(4.39)
where 2||.|| in the constraint is the 2-norm of the vector ω
.
4.4.5 Conventional SDF Schemes
In this section, conventional schemes of optimizing the weighting vector in SDF-
based CRNs. These schemes include the equal gain combination (EGC) and the
maximal ratio combining (MRC), maximizing the normal deflection coefficient
(NDC) or maximizing the modified deflection coefficient (MDC). The deflection
coefficient is a measure of the detection performance formulated based on the distance
between the centers of H0 and H1. The weighting vector ω
in Figure 4.11 is optimized
to maximize the probability of detection defined in (4.38) under EGC, MRC, NDC,
and MDC schemes. These methods are then used to benchmark the proposed SOGA-
assisted SDF-based cooperative sensing. Thus, closed form expressions for the
weighting vector under the EGC, MRC, NDC, and MDC schemes should be derived
and formulated.
(i) Equal gain combination- (EGC-) based weighting scheme: The EGC scheme is
a weighting scheme similar to the one used in systems with multiple receive antennas.
It does not require any channel state information (CSI), but still exhibits much better
performance than the conventional HDF schemes. The individual weights assigned to
the M SUs signals at the FC in (4.38) are all equal and expressed by
Mi1=ω (4.40)
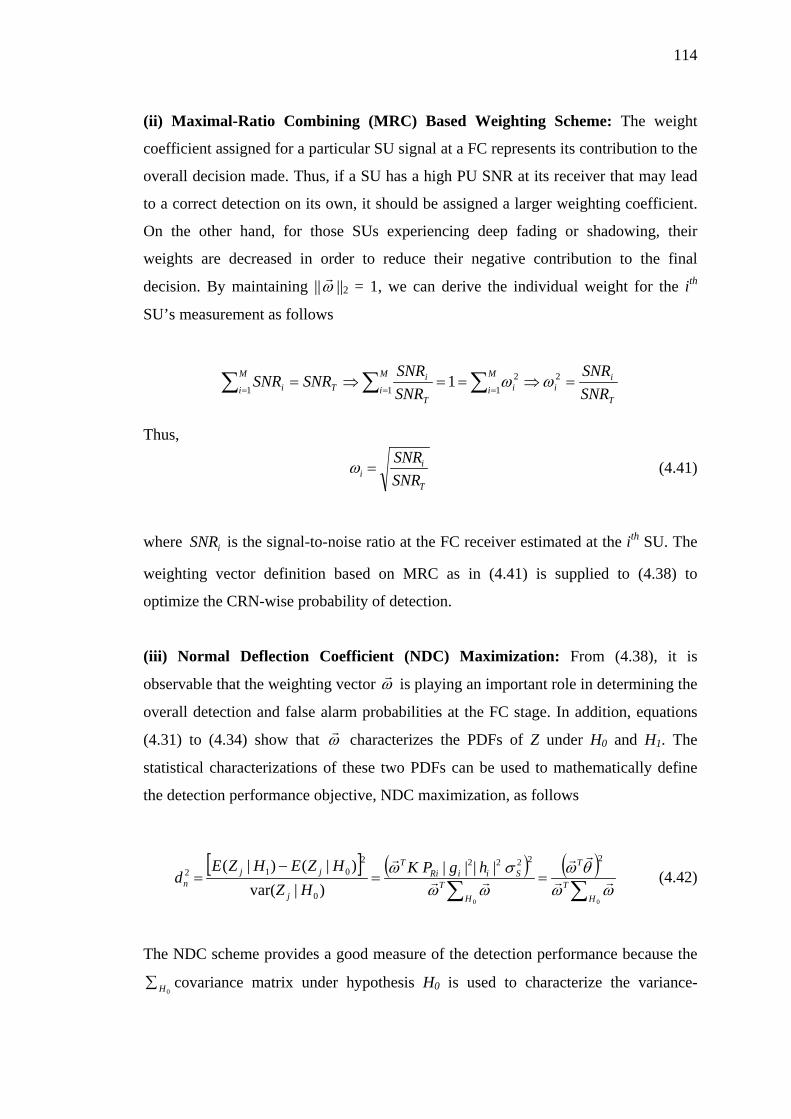
114
(ii) Maximal-Ratio Combining (MRC) Based Weighting Scheme: The weight
coefficient assigned for a particular SU signal at a FC represents its contribution to the
overall decision made. Thus, if a SU has a high PU SNR at its receiver that may lead
to a correct detection on its own, it should be assigned a larger weighting coefficient.
On the other hand, for those SUs experiencing deep fading or shadowing, their
weights are decreased in order to reduce their negative contribution to the final
decision. By maintaining ||ω
||2 = 1, we can derive the individual weight for the ith
SU’s measurement as follows
T
ii
M
i iM
iT
iT
M
i i SNRSNR
SNRSNRSNRSNR =⇒==⇒= ∑∑∑ ===
21
211
1 ωω
Thus,
T
ii SNR
SNR=ω (4.41)
where iSNR is the signal-to-noise ratio at the FC receiver estimated at the ith SU. The
weighting vector definition based on MRC as in (4.41) is supplied to (4.38) to
optimize the CRN-wise probability of detection.
(iii) Normal Deflection Coefficient (NDC) Maximization: From (4.38), it is
observable that the weighting vector ω
is playing an important role in determining the
overall detection and false alarm probabilities at the FC stage. In addition, equations
(4.31) to (4.34) show that ω
characterizes the PDFs of Z under H0 and H1. The
statistical characterizations of these two PDFs can be used to mathematically define
the detection performance objective, NDC maximization, as follows
[ ] ( ) ( )∑∑
==−
=00
22222
0
2012 ||||
)|var()|()|(
HT
T
HT
SiiRiT
j
jjn
hgPKHZ
HZEHZEd
ωωθω
ωωσω
(4.42)
The NDC scheme provides a good measure of the detection performance because the
0H∑ covariance matrix under hypothesis H0 is used to characterize the variance-

115
normalized distance between the centers of the two conditional PDFs of Zj under H0
and H1. Now, we set )(2 ω
nd as our optimization target, optimal weight vector NDCopt ,ω
that maximizes the distance is
)(maxarg 2, ωω
ω
nNDCopt d= (4.43)
By solving the equation 0)(2
=∂
∂ωω
nd , we obtain θ
θω
ωωω
1
0,0 −∑=
∑HT
HT
NDCopt , let
NDCTH
T
αθω
ωω=
∑
0 and by setting NDCα , which is a scalar, to one and normalizing
each weighting coefficient, we obtain the optimal weighting vector as
θωωω 1
0,,,* ||||/ −∑== HNDCoptNDCoptNDCopt (4.44)
The justification of setting αNDC to 1 is that αNDC is a scalar value with no effect on 2nd in (4.42). This optimal weighting vector is the best that can push the centers of the
two PDFs under H0 and H1 apart from each other and hence, maximizes the detection
probability in (3.38). Then, by substituting the optimal weighting vector in (4.44) into
(4.38) we obtain
−=
∑ ∑∑∑
−
−−−
2
0
1
0
1
01
1
)(
H HT
HT
HT
fd
QQQQ
θθ
θθθθ
(4.45)
(iv) Modified Deflection Coefficient (MDC) Maximization: In this subsection, we
investigate the maximization of MDC in order to find the optimal weights setting for
the SDF at the FC. The MDC can be defined as
[ ] ( ) ( )∑∑
==−
=11
22222
1
2012 ||||
)|var()|()|(
HT
T
HT
SiiRiT
j
jjm
hgPKHZ
HZEHZEd
ωωθω
ωωσω
(4.46)

116
which employs the 1H∑ covariance matrix under hypothesis H1 to fulfill the task of
variance-normalization. Obviously, 2md can be obtained by simply replacing the
0H∑
covariance matrix in (4.42) with the 1H∑ covariance matrix. The optimal weight
vector MDCopt ,ω is then similarly defined as the one that maximizes the distance )(2 ω
md
)(maxarg 2, ωω
ω
mMDCopt d= (4.47)
By solving the equation 0)(2
=∂
∂ωω
md , we obtain θ
θω
ωωω
1
1,1 −∑=
∑HT
HT
MDCopt .
Similarly, let MDCTH
T
αθω
ωω=
∑
1 which is a scalar and again by setting MDCα = 1 to
ensure 1|||| 2 =ω
and normalizing each weighting co-efficient, we obtain the optimal
weighting vector
θωωω 1
1,,,* ||||/ −∑== HMDCoptMDCoptMDCopt (4.48)
Again, this optimal weighting setting will be used to optimize the detection
probability in (4.38). Similar to NDCM, by substituting the optimal weighting vector
in (4.48) into (4.38) we obtain
−=
∑∑∑ ∑
−
−− +−
1
1
1
1
2
1
1
01 )(
HT
HT
H HT
fd
QQQQ
θθ
θθθθ (4.49)
4.4.6 Performance Evaluation of SDF-based Schemes
In this section, the detection performance of the SDF-based NDC, MDC, MRC and
EGC schemes as well as the OR-rule based HDF scheme is studied. The SU-FC
channel bandwidth of the SDF-based schemes is also analyzed. The purpose of these
explorative studies is to determine the parameters that significantly affect the CRN
performance. The design parameters examined in this section include the setting of the
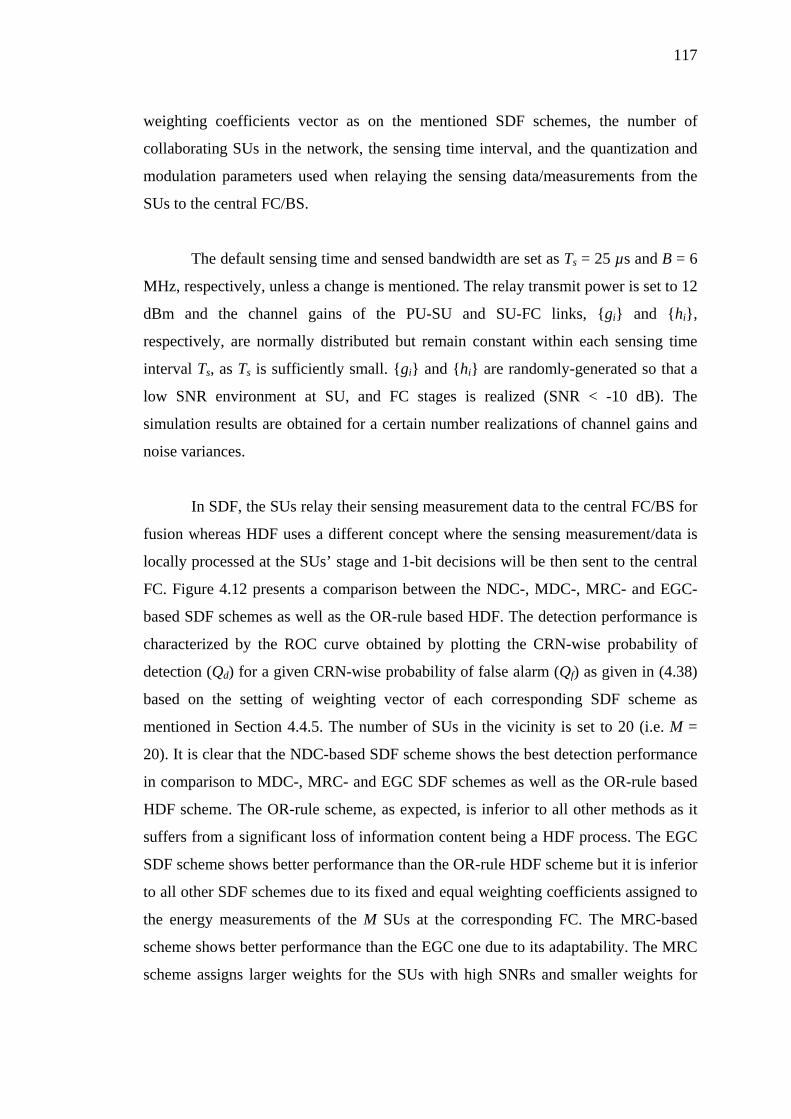
117
weighting coefficients vector as on the mentioned SDF schemes, the number of
collaborating SUs in the network, the sensing time interval, and the quantization and
modulation parameters used when relaying the sensing data/measurements from the
SUs to the central FC/BS.
The default sensing time and sensed bandwidth are set as Ts = 25 µs and B = 6
MHz, respectively, unless a change is mentioned. The relay transmit power is set to 12
dBm and the channel gains of the PU-SU and SU-FC links, {gi} and {hi},
respectively, are normally distributed but remain constant within each sensing time
interval Ts, as Ts is sufficiently small. {gi} and {hi} are randomly-generated so that a
low SNR environment at SU, and FC stages is realized (SNR < -10 dB). The
simulation results are obtained for a certain number realizations of channel gains and
noise variances.
In SDF, the SUs relay their sensing measurement data to the central FC/BS for
fusion whereas HDF uses a different concept where the sensing measurement/data is
locally processed at the SUs’ stage and 1-bit decisions will be then sent to the central
FC. Figure 4.12 presents a comparison between the NDC-, MDC-, MRC- and EGC-
based SDF schemes as well as the OR-rule based HDF. The detection performance is
characterized by the ROC curve obtained by plotting the CRN-wise probability of
detection (Qd) for a given CRN-wise probability of false alarm (Qf) as given in (4.38)
based on the setting of weighting vector of each corresponding SDF scheme as
mentioned in Section 4.4.5. The number of SUs in the vicinity is set to 20 (i.e. M =
20). It is clear that the NDC-based SDF scheme shows the best detection performance
in comparison to MDC-, MRC- and EGC SDF schemes as well as the OR-rule based
HDF scheme. The OR-rule scheme, as expected, is inferior to all other methods as it
suffers from a significant loss of information content being a HDF process. The EGC
SDF scheme shows better performance than the OR-rule HDF scheme but it is inferior
to all other SDF schemes due to its fixed and equal weighting coefficients assigned to
the energy measurements of the M SUs at the corresponding FC. The MRC-based
scheme shows better performance than the EGC one due to its adaptability. The MRC
scheme assigns larger weights for the SUs with high SNRs and smaller weights for
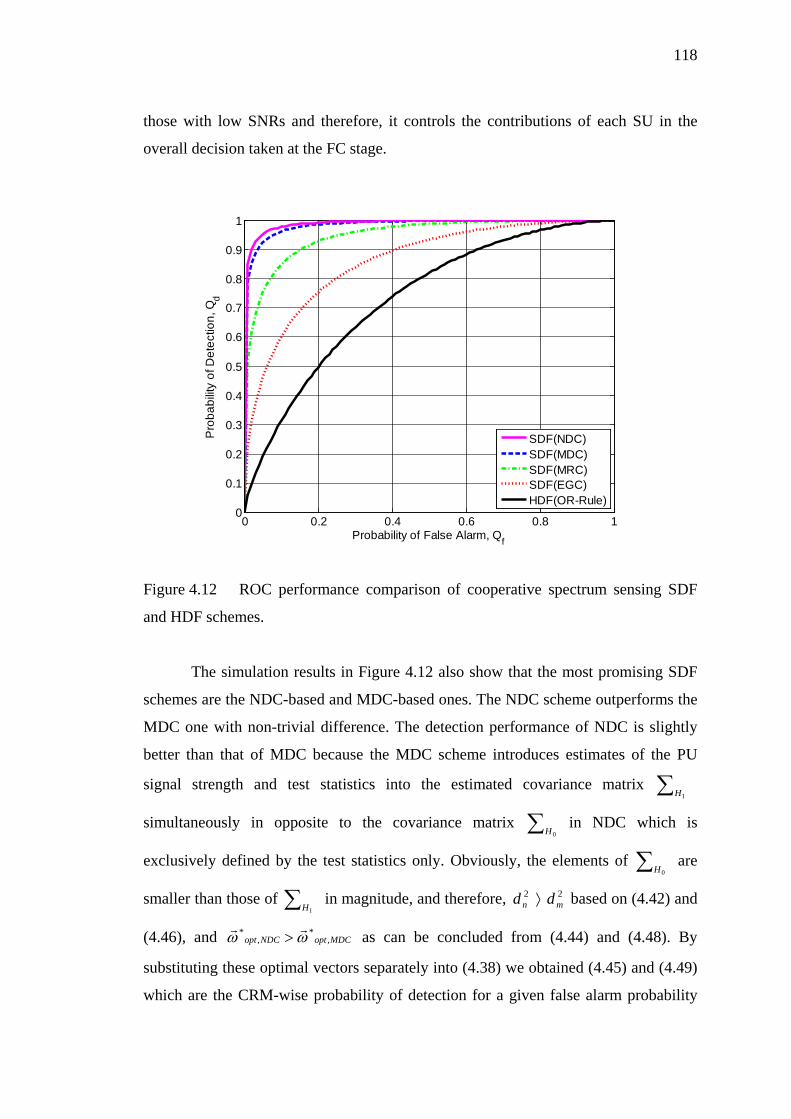
118
those with low SNRs and therefore, it controls the contributions of each SU in the
overall decision taken at the FC stage.
Figure 4.12 ROC performance comparison of cooperative spectrum sensing SDF
and HDF schemes.
The simulation results in Figure 4.12 also show that the most promising SDF
schemes are the NDC-based and MDC-based ones. The NDC scheme outperforms the
MDC one with non-trivial difference. The detection performance of NDC is slightly
better than that of MDC because the MDC scheme introduces estimates of the PU
signal strength and test statistics into the estimated covariance matrix ∑1H
simultaneously in opposite to the covariance matrix ∑0H
in NDC which is
exclusively defined by the test statistics only. Obviously, the elements of ∑0H
are
smaller than those of ∑1H
in magnitude, and therefore, 22mn dd ⟩ based on (4.42) and
(4.46), and MDCoptNDCopt ,*
,* ωω
> as can be concluded from (4.44) and (4.48). By
substituting these optimal vectors separately into (4.38) we obtained (4.45) and (4.49)
which are the CRM-wise probability of detection for a given false alarm probability
0 0.2 0.4 0.6 0.8 10
0.1
0.2
0.3
0.4
0.5
0.6
0.7
0.8
0.9
1
Probability of False Alarm, Qf
Pro
babi
lity
of D
etec
tion,
Qd
SDF(NDC)SDF(MDC)SDF(MRC)SDF(EGC)HDF(OR-Rule)
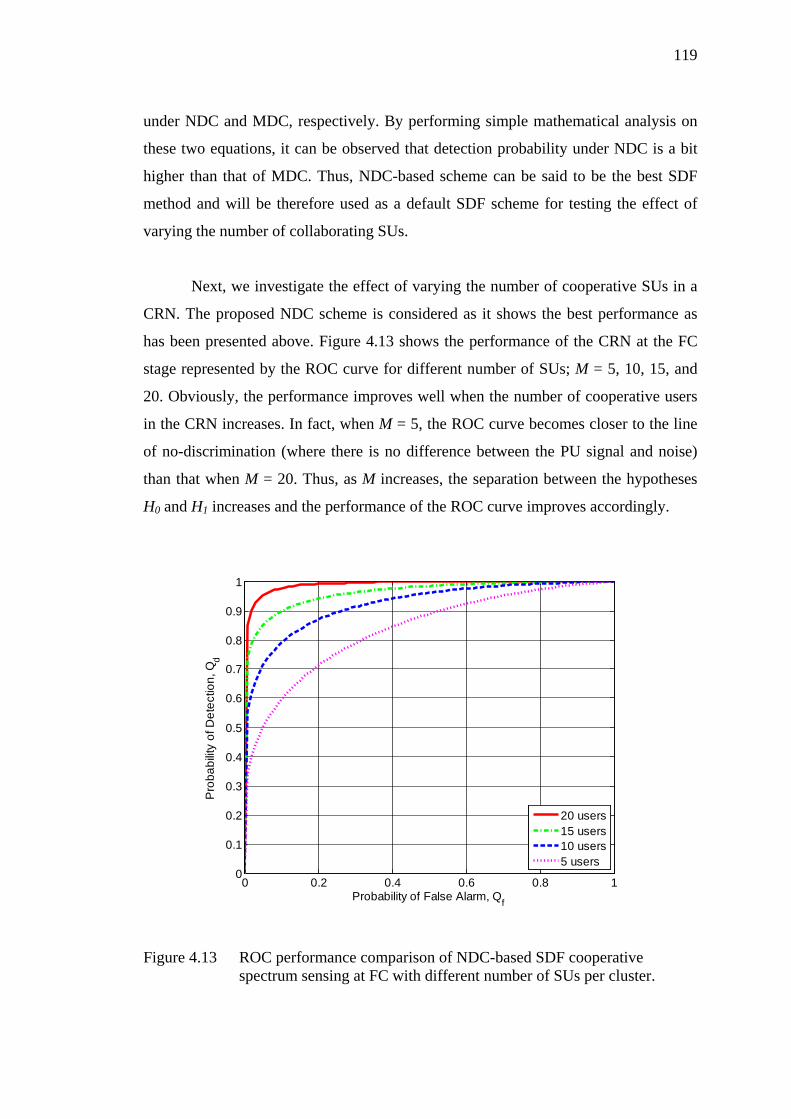
119
under NDC and MDC, respectively. By performing simple mathematical analysis on
these two equations, it can be observed that detection probability under NDC is a bit
higher than that of MDC. Thus, NDC-based scheme can be said to be the best SDF
method and will be therefore used as a default SDF scheme for testing the effect of
varying the number of collaborating SUs.
Next, we investigate the effect of varying the number of cooperative SUs in a
CRN. The proposed NDC scheme is considered as it shows the best performance as
has been presented above. Figure 4.13 shows the performance of the CRN at the FC
stage represented by the ROC curve for different number of SUs; M = 5, 10, 15, and
20. Obviously, the performance improves well when the number of cooperative users
in the CRN increases. In fact, when M = 5, the ROC curve becomes closer to the line
of no-discrimination (where there is no difference between the PU signal and noise)
than that when M = 20. Thus, as M increases, the separation between the hypotheses
H0 and H1 increases and the performance of the ROC curve improves accordingly.
Figure 4.13 ROC performance comparison of NDC-based SDF cooperative
spectrum sensing at FC with different number of SUs per cluster.
0 0.2 0.4 0.6 0.8 10
0.1
0.2
0.3
0.4
0.5
0.6
0.7
0.8
0.9
1
Probability of False Alarm, Qf
Pro
babi
lity
of D
etec
tion,
Qd
20 users15 users10 users5 users
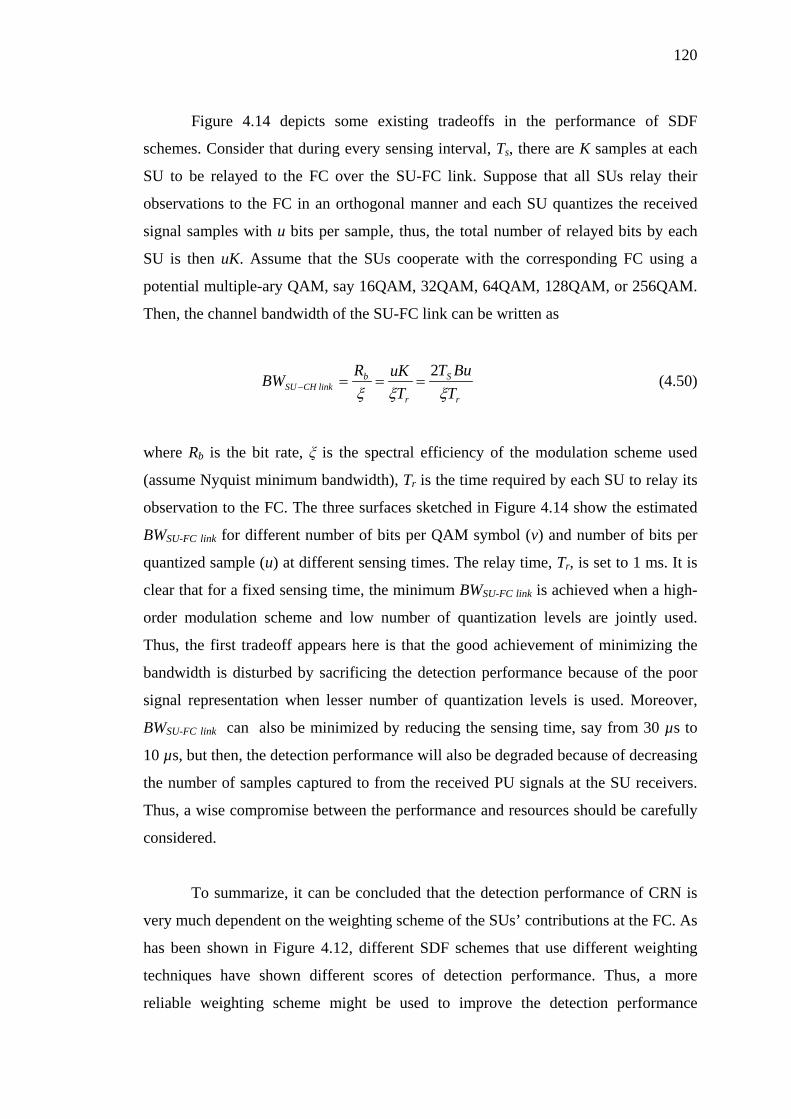
120
Figure 4.14 depicts some existing tradeoffs in the performance of SDF
schemes. Consider that during every sensing interval, Ts, there are K samples at each
SU to be relayed to the FC over the SU-FC link. Suppose that all SUs relay their
observations to the FC in an orthogonal manner and each SU quantizes the received
signal samples with u bits per sample, thus, the total number of relayed bits by each
SU is then uK. Assume that the SUs cooperate with the corresponding FC using a
potential multiple-ary QAM, say 16QAM, 32QAM, 64QAM, 128QAM, or 256QAM.
Then, the channel bandwidth of the SU-FC link can be written as
r
S
r
blinkCHSU T
BuTT
uKRBWξξξ
2===− (4.50)
where Rb is the bit rate, ξ is the spectral efficiency of the modulation scheme used
(assume Nyquist minimum bandwidth), Tr is the time required by each SU to relay its
observation to the FC. The three surfaces sketched in Figure 4.14 show the estimated
BWSU-FC link for different number of bits per QAM symbol (v) and number of bits per
quantized sample (u) at different sensing times. The relay time, Tr, is set to 1 ms. It is
clear that for a fixed sensing time, the minimum BWSU-FC link is achieved when a high-
order modulation scheme and low number of quantization levels are jointly used.
Thus, the first tradeoff appears here is that the good achievement of minimizing the
bandwidth is disturbed by sacrificing the detection performance because of the poor
signal representation when lesser number of quantization levels is used. Moreover,
BWSU-FC link can also be minimized by reducing the sensing time, say from 30 µs to
10 µs, but then, the detection performance will also be degraded because of decreasing
the number of samples captured to from the received PU signals at the SU receivers.
Thus, a wise compromise between the performance and resources should be carefully
considered.
To summarize, it can be concluded that the detection performance of CRN is
very much dependent on the weighting scheme of the SUs’ contributions at the FC. As
has been shown in Figure 4.12, different SDF schemes that use different weighting
techniques have shown different scores of detection performance. Thus, a more
reliable weighting scheme might be used to improve the detection performance
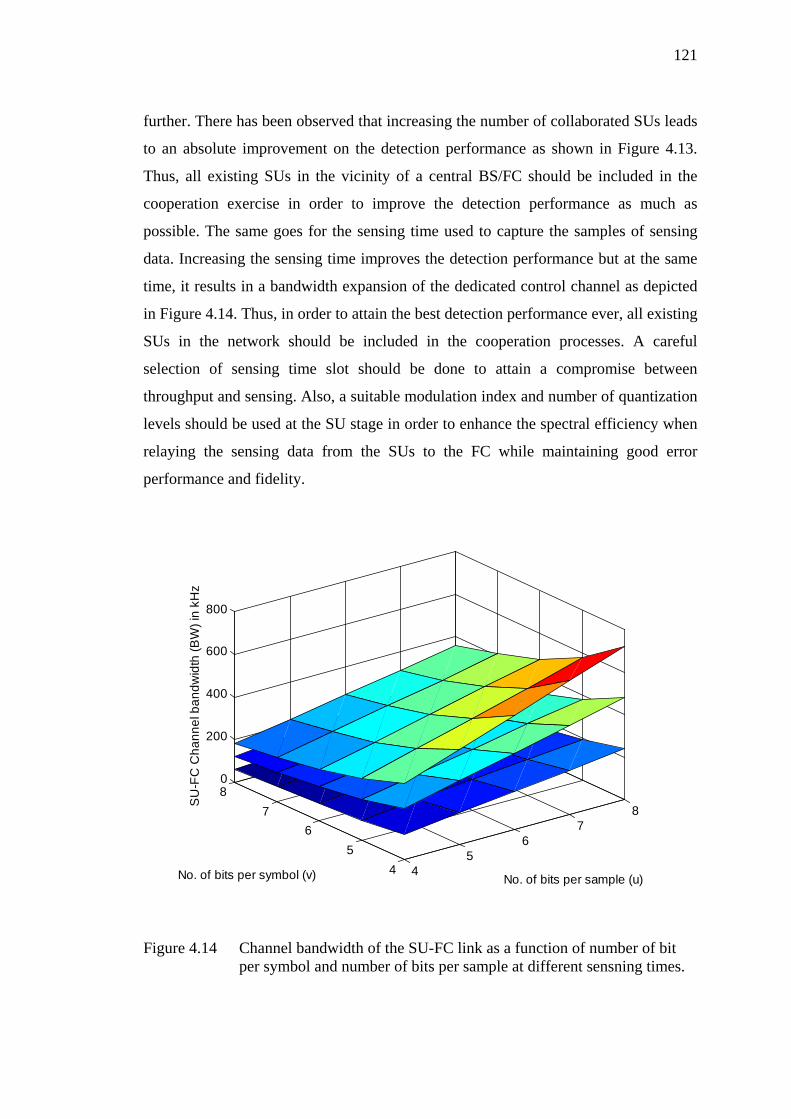
121
further. There has been observed that increasing the number of collaborated SUs leads
to an absolute improvement on the detection performance as shown in Figure 4.13.
Thus, all existing SUs in the vicinity of a central BS/FC should be included in the
cooperation exercise in order to improve the detection performance as much as
possible. The same goes for the sensing time used to capture the samples of sensing
data. Increasing the sensing time improves the detection performance but at the same
time, it results in a bandwidth expansion of the dedicated control channel as depicted
in Figure 4.14. Thus, in order to attain the best detection performance ever, all existing
SUs in the network should be included in the cooperation processes. A careful
selection of sensing time slot should be done to attain a compromise between
throughput and sensing. Also, a suitable modulation index and number of quantization
levels should be used at the SU stage in order to enhance the spectral efficiency when
relaying the sensing data from the SUs to the FC while maintaining good error
performance and fidelity.
Figure 4.14 Channel bandwidth of the SU-FC link as a function of number of bit per symbol and number of bits per sample at different sensning times.
45
67
8
45
67
80
200
400
600
800
No. of bits per sample (u)No. of bits per symbol (v)
SU
-FC
Cha
nnel
ban
dwid
th (B
W) i
n kH
z
122
In fact, great rooms for improvement in the detection performance can be
achieved by employing a more effective weighting scheme at the FC. Since there is no
tradeoff behaviour observed on the detection performance as a result of varying the
sensing time and number of collaborating SUs, only the setting of weighting vector at
the FC should be chosen as a design objective to improve the detection performance.
This calls for a more innovative and probably intelligent scheme to search for the most
optimal setting of weighting coefficients so that the PU can be perfectly detected and
hence sufficiently protected.
4.4.7 Proposed SOGA-assisted SDF-based Optimization System
As mentioned in the preceding section. The CRN-wise detection performance is very
much dependent on the setting of weighting coefficients at the FC. The weighting
coefficients are shown in Figure 4.11 and are mathematically collected into the vectorT
M ]...,,,[ 21 ωωωω =
. The objective of maximizing the CRN-wise probability of
detection expressed in (4.38) can be realized by determining the optimal setting of this
weighting vector. In this section, a single-objective genetic algorithm (SOGA) is
proposed to search for the optimal values of weighting coefficients intelligently and
autonomously. This research work is motivated by the fact that the conventional SDF
methods such as NDC, MDC, MRC, and EGC are capable of providing sub-optimal
settings of weighting coefficients which might not suffice when low SNR values are
observed such as in deep fading environments.
The proposed SOGA-assisted SDF-based algorithm is explained in Table 4.1.
A population of strings P(t) at generation t is randomly initialized giving a diverse
range of possible solutions or potential weighting settings. Each binary string consists
of M decision variables encoded by equal number of bits. The binary-coded search
space is then accurately decoded to a solution space based on one-to-one mapping to
ensure no trivial solutions. Each of these possible solutions is evaluated and given a
fitness score based on equation (4.38). The selection operator is then invoked to select
the fittest chromosomes from the parent population. In Darwinian terms, this performs
a ‘survival of the fittest’ operation on every population. The selected parent
population forms the basis of a mating pool and undergoes stochastic transformations

123
Table 4.1 Proposed SOGA-assisted SDF-based algorithm.
Steps Details of the Algorithm
Step 1 Set t = 0 and randomly generate a population P(t) of pops chromosomes each of which is of (M*nbits) bits long, where M is the number of weighting coefficients (i.e. number of SUs in the network) and nbits is the number of bits to represent each coefficient.
Step 2 Decode each chromosome in the random population into its corresponding weighting coefficients vector
TjMjjj ]...,,,[ 21 ωωωω =
, where jiω ∈[0,1] , i = 1, 2, ..., M and j
= 1, 2, ..., pops.
Step 3 Normalize the weighting coefficients vector through dividing jω
by its 2-norm such that ( )2/1
1
2*
= ∑
=
M
ijijj ωωω
so that the
constraint 1|||| 2* =jω
is satisfied.
Step 4 Compute the fitness score of every normalized decoded weighting vector, *
jω
, and rank their corresponding chromosomes based on
their fitness scores and identify the best elitepops * chromosomes, where elite is a parameter determines a fraction of pops, i.e. elite ∈[0,1), and . denotes floor operation.
Step 5 Update t = t +1 and reproduce )1(* elitepops − new chromosomes (candidate solutions) through genetic algorithm operations; selection, crossover, and mutation, where . denotes ceiling operation.
Step 6 Construct new population P(t) by concatenating the newly )1(* elitepops − reproduced chromosomes with the best
elitepops * found in P(t - 1).
Step 7 decode and normalize the chromosomes of the new population P(t) as in Step 2 and Step 3, respectively.
Step 8 Evaluate the fitness score of each candidate solution as in Step 4.
Step 9 If t is equal to a predefined number of generations (iterations), ngene, terminate the algorithm; otherwise go to Step 5.
124
by means of genetic operations to form new individuals. The population of the new
individuals resulting from crossover and mutation are called offspring population C(t).
It is worth to notice that genetic operators perform essentially a blind search whereas
selection operators provide the driving force to hopefully steer the genetic search
toward the desirable region of the solution space. Once C(t) is formed, a new
population is formed, by combining C(t) with the fittest chromosomes of the parent
population, and re-evaluated. The evolutionary process continues and after several
predefined number of generations, the algorithm converges to the best individual
which hopefully represents an optimal solution to the problem of maximizing the
CRN-wise probability of detection. In this algorithm, the initial population of
chromosomes is randomly generated and each chromosome is decoded and
normalized to satisfy the constraint in (4.39). As our objective is to maximize Qd, we
utilize it as the fitness function (i.e. f(ω
) = Qd(ω
)) used to evaluate the quality of the
chromosomes. The constraint in (4.39) is proposed to limit the number of optimal
solutions and reduce the search space on which the GA works.
4.4.8 Performance Evaluation of SOGA-assisted SDF-based Optimization
System
In this section, the convergence and detection performance of the proposed GA-
assisted scheme are both evaluated. In order to choose an appropriate form of the
algorithm to meet the nature of the given problem and to achieve more efficient
evolutionary processes, the effect of various GA parameter settings has been analyzed
using a set-and-test approach. The GA parameters and operators used in this
simulation are set as follows: pops = 30, Pc = 0.95, and Pm = 0.01 as in for online
applications; where Pc is two-point crossover rate and Pm is bit-flip mutation rate,
nbits = 6, elite = 0.1, ngene = 100, and roulette wheel selection was used. The CR
network simulation parameters are M = 20, K = 150, fP = 0.25, PRi = 12 dBm, and
{gi}, {hi} are randomly-generated so that low SNR environment at SU and FC
receivers is realized (SNR < -10 dB). Notice that {gi}, {hi} are assumed to be constant
over every sensing time period; this is justified by the slow-fading nature over the PU-
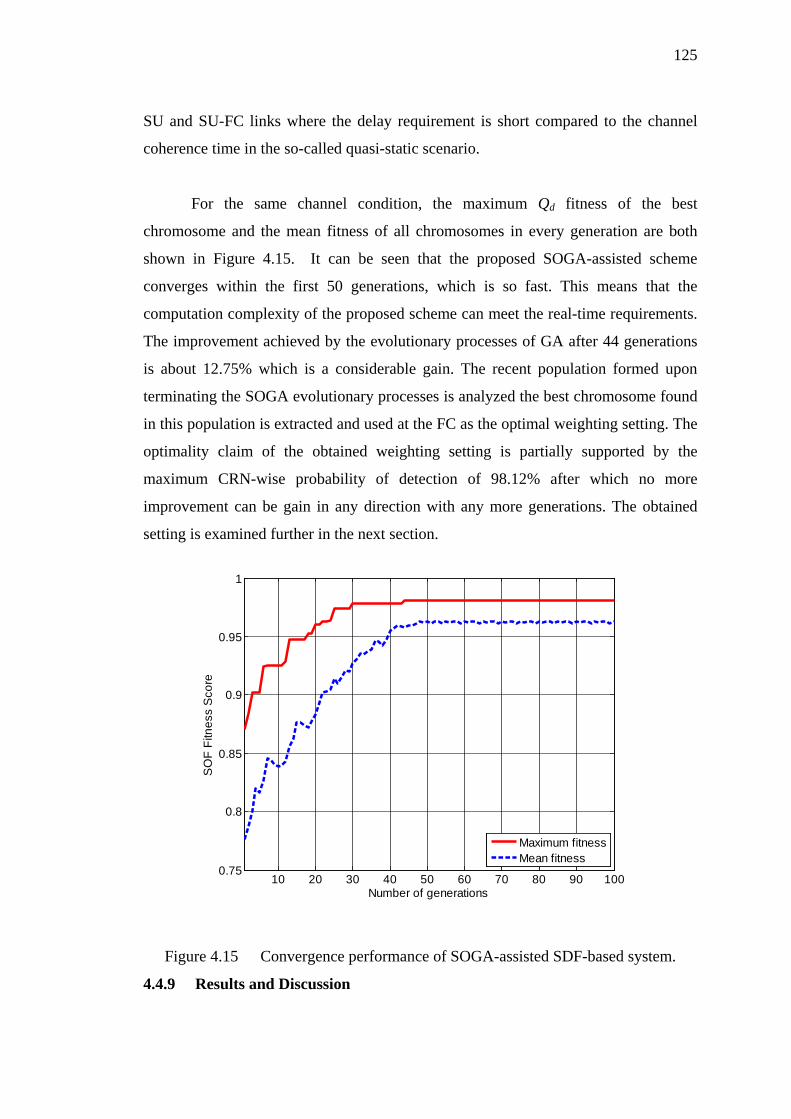
125
SU and SU-FC links where the delay requirement is short compared to the channel
coherence time in the so-called quasi-static scenario.
For the same channel condition, the maximum Qd fitness of the best
chromosome and the mean fitness of all chromosomes in every generation are both
shown in Figure 4.15. It can be seen that the proposed SOGA-assisted scheme
converges within the first 50 generations, which is so fast. This means that the
computation complexity of the proposed scheme can meet the real-time requirements.
The improvement achieved by the evolutionary processes of GA after 44 generations
is about 12.75% which is a considerable gain. The recent population formed upon
terminating the SOGA evolutionary processes is analyzed the best chromosome found
in this population is extracted and used at the FC as the optimal weighting setting. The
optimality claim of the obtained weighting setting is partially supported by the
maximum CRN-wise probability of detection of 98.12% after which no more
improvement can be gain in any direction with any more generations. The obtained
setting is examined further in the next section.
Figure 4.15 Convergence performance of SOGA-assisted SDF-based system.
4.4.9 Results and Discussion
10 20 30 40 50 60 70 80 90 1000.75
0.8
0.85
0.9
0.95
1
Number of generations
SO
F Fi
tnes
s S
core
Maximum fitnessMean fitness
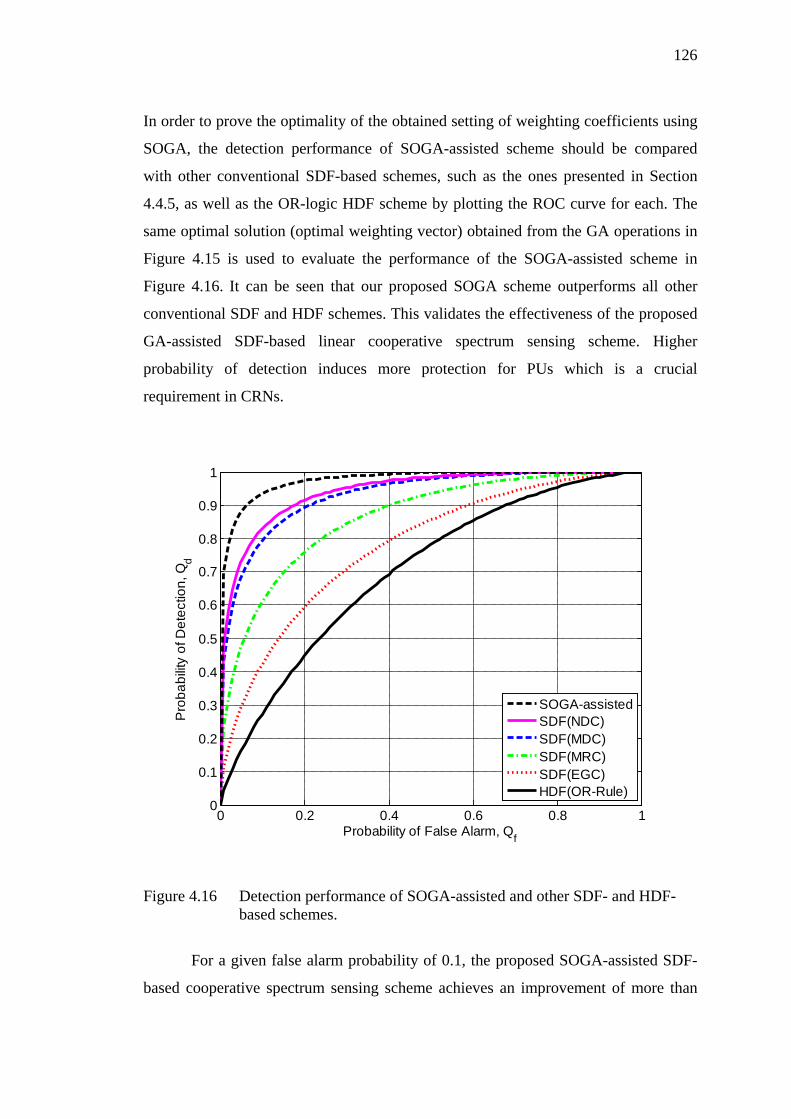
126
In order to prove the optimality of the obtained setting of weighting coefficients using
SOGA, the detection performance of SOGA-assisted scheme should be compared
with other conventional SDF-based schemes, such as the ones presented in Section
4.4.5, as well as the OR-logic HDF scheme by plotting the ROC curve for each. The
same optimal solution (optimal weighting vector) obtained from the GA operations in
Figure 4.15 is used to evaluate the performance of the SOGA-assisted scheme in
Figure 4.16. It can be seen that our proposed SOGA scheme outperforms all other
conventional SDF and HDF schemes. This validates the effectiveness of the proposed
GA-assisted SDF-based linear cooperative spectrum sensing scheme. Higher
probability of detection induces more protection for PUs which is a crucial
requirement in CRNs.
Figure 4.16 Detection performance of SOGA-assisted and other SDF- and HDF- based schemes.
For a given false alarm probability of 0.1, the proposed SOGA-assisted SDF-
based cooperative spectrum sensing scheme achieves an improvement of more than
0 0.2 0.4 0.6 0.8 10
0.1
0.2
0.3
0.4
0.5
0.6
0.7
0.8
0.9
1
Probability of False Alarm, Qf
Pro
babi
lity
of D
etec
tion,
Qd
SOGA-assistedSDF(NDC)SDF(MDC)SDF(MRC)SDF(EGC)HDF(OR-Rule)
127
10% in the detection performance in comparison to the best conventional SDF-based
scheme (i.e. NDC). This makes the proposed algorithm very promising since it offers
better PU protection. The other excellent feature of the proposed algorithm is the fast
computational speed since the optimal weighting setting can be found within about 50
generations as has been shown in Figure 4.15. This fast processing time makes the
proposed SOGA technique very promising in such a real-time application.
4.5 HDF and SDF TRADEOFFS IN CRNS
The HDF- and SDF-based cooperative spectrum sensing methods are distinguished
from each other by the mechanism they use to monitor the PU activities. As presented
earlier, the HDF-based schemes make local decisions at the SU’s stage and send their
1-bit individual decisions to the FC to construct a global decision whereas the SDF-
based schemes do not make decisions at SUs but they else relay their raw sensing
measurements to the FC at which linear weighted combination is performed to
develop the global decision on PU availability. Thus, the proposed BOGA-assisted
HDF- based and SOGA-assisted SDF-based cooperative spectrum sensing can now be
compared. Although, the performance objectives for the two algorithms are assumed
distinct, fair comparison can be made by specifying two general items that are the
detection performance and traffic ( or communication) overhead. In terms of detection
performance, it has been observed in Figure 4.16 that any SDF-based scheme such as
EGC, MRC, MDC, NDC, or the proposed SOGA scheme show higher CRN-wise
probability of detection for given probability of false alarm than the OR-logic HDF-
based scheme. For instance, for a given false alarm probability of 0.1, the worst SDF
scheme (i.e. EGC) shows a detection probability of about 15% higher than that of the
OR-logic HDF scheme. Thus, SDF-based schemes should be used to enhance the
detection performance and perfectly protect the PU especially when the PU-SU and
SU-FC links undergo deep fades and/or high noise levels.
On the other hand, in terms of traffic or communication overhead, the HDF-
based schemes such as the OR-logic rule outperforms and of the conventional or
proposed SDF-based schemes. This is because in HDF, the SUs process the data
locally and send single decision bits to the FC whereas in SDF, the sensing data is sent
128
as it is (after quantization) and the global decision on PU availability is made at the
FC. Consider a CRN of M SUs in the vicinity of a FC/BS, K samples of potential PU
signal to be captured at each SU receiver, and u quantization bits per sample used to
relay the soft measurement in the SDF case. Let’s simply define the traffic overhead
by the total number of bits reported from all SUs to the FC/BS. In HDF architecture,
M SUs report their M binary decisions to the FC. Thus, any HDF scheme requires
relay of M bits from all SUs to the central FC/BS. In any SDF scheme, each of the M
SUs relays K samples each of which is quantized using u bits. Thus, the total number
of relayed bits from all SUs to the FC is uKM. This makes the ratio of traffic overhead
of HDF to SDF as M to uKM or simply as 1 to uK. Obviously, this shows that HDF
requires very much lesser number of bits to be relayed from SUs to FC than SDF.
Therefore, HDF schemes require lesser spectral and power resources than SDF
schemes. Thus, HDF schemes should be used instead of SDF schemes when
restrictions on power and spectral resources exist.
4.6 SUMMARY
This chapter presents the employment of GAs for optimizing the performance of
HDF- and SDF-based CRNs. In HDF-based CRNs, a BOGA-assisted optimization
system is developed to optimize the sensing time and SU cooperation level so that the
proposed BOF is maximized. The BOF function combines the detection performance
as well as the SU throughput into one single scalar function introduced to the BOGA
system as a fitness function. The performance of the proposed BOGA system is
evaluated and the solutions obtained are further analyzed to prove their sub-optimality
in comparison to other potential settings. The simulation results show an improvement
of 10% on the BOF score when using the optimal cooperation level than when using
100% cooperation level as well as improvement of 4% when using the optimal
sensing time rather than setting the sensing period to half of its total frame duration.
On the other hand, a SOGA-assisted optimization system is proposed and developed
to optimize the detection performance in SDF-based CRNs. The SOGA is configured
to optimize the weighting coefficient of the linear soft fusion process at the fusion
centre of CRN. The solution of weighting coefficients obtained from the evolutionary
processes of SOGA is then used to evaluate the ROC curve of the CRN-wise detection
129
performance. The proposed SOGA-assisted is compared with other conventional SDF
schemes in the literature such as NDC, MDC, MRC and EGC as well as the OR-rule
HDF scheme. For a given false alarm rate of 0.1, the proposed SOGA-assisted SDF-
based cooperative spectrum sensing scheme achieves an improvement of more than
10% in the detection performance in comparison to the best conventional SDF-based
scheme (i.e. NDC). Finally, the detection performance and traffic overhead in HDF-
and SDF-based CRNs are discussed based on the obtained results to support the claim
of proposing HDF-based CRN when low traffic overhead is needed and the SDF-
based CRNs for cases where high detection performance is of interest.
CHAPTER V
MOGA-ASSISTED HYBRID SDF-HDF CLUSTER BASED COOPERATIVE SPECTRUM SENSING FOR COGNITIVE RADIO NETWORKS
5.1 INTRODUCTION
The chapter presents an extended architecture of cooperative spectrum sensing model
for CRNs from HDF- and SDF-based CRNs presented in Chapter IV. This is realized
by means of hybridization between SDF and HDF architectures in a cluster based
deployment. This proposal is motivated by contradiction between the detection
performance and communication overhead in the performance of HDF- and SDF-
based CRNs. Since SDF-based CRNs show better detection performance than HDF-
based CRNs whereas HDF-based CRNs require lesser relay overhead than SDF-based
CRNs, the idea of proposing a hybrid SDF-HDF cluster based architecture that comes
as a solution to achieve a compromised detection performance and communication
overhead is explained. The research work carried out in this chapter begins with
proposing several performance metrics that can be formulated as multi-objective
function to be optimized by a multi-objective genetic algorithm MOGA system. The
convergence performance of the proposed system is examined and the results obtained
are analyzed to verify the functionality of the proposed MOGA optimization system.
5.2 HYBRID SDF-HDF CLUSTER BASED CRN SYSTEM MODEL
The proposed deployment of hybrid SDF-HDF cluster based CRNs is depicted in
Figure 5.1. The hybridization between SDF and HDF schemes is realized by grouping
the existing SUs within the vicinity of a central BS into multiple clusters. The sensing
measurements from the SUs of each cluster are relayed to their corresponding cluster
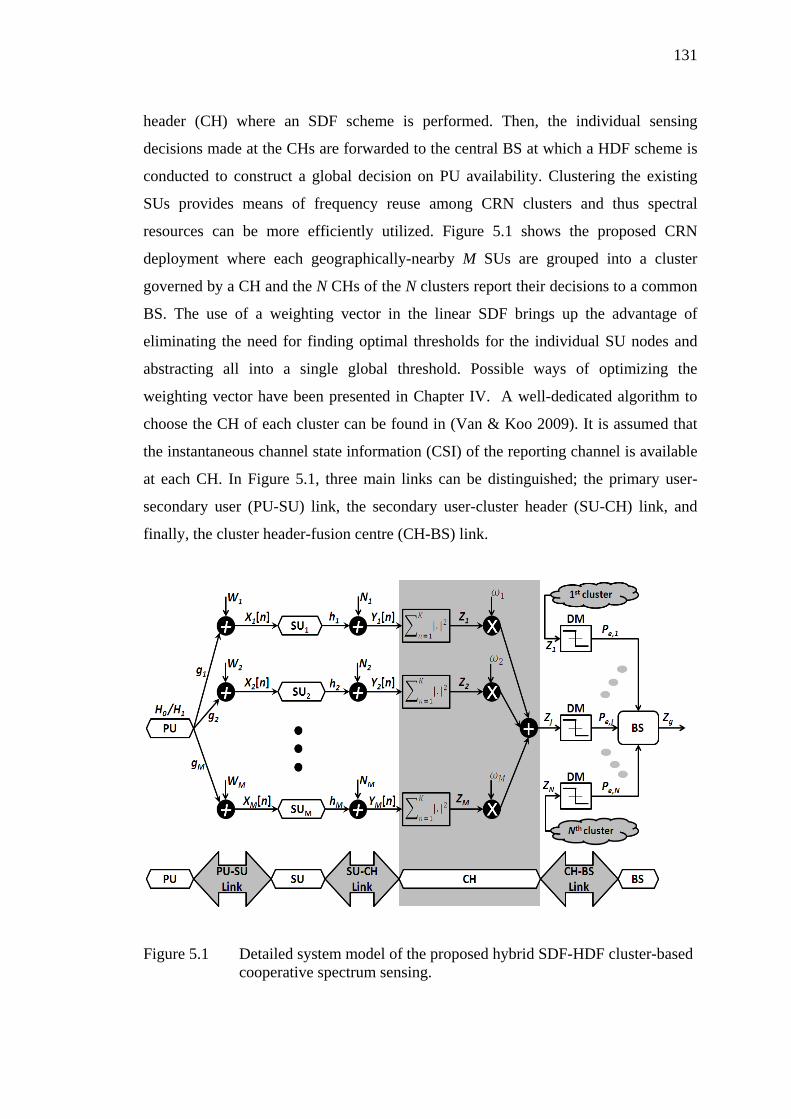
131
header (CH) where an SDF scheme is performed. Then, the individual sensing
decisions made at the CHs are forwarded to the central BS at which a HDF scheme is
conducted to construct a global decision on PU availability. Clustering the existing
SUs provides means of frequency reuse among CRN clusters and thus spectral
resources can be more efficiently utilized. Figure 5.1 shows the proposed CRN
deployment where each geographically-nearby M SUs are grouped into a cluster
governed by a CH and the N CHs of the N clusters report their decisions to a common
BS. The use of a weighting vector in the linear SDF brings up the advantage of
eliminating the need for finding optimal thresholds for the individual SU nodes and
abstracting all into a single global threshold. Possible ways of optimizing the
weighting vector have been presented in Chapter IV. A well-dedicated algorithm to
choose the CH of each cluster can be found in (Van & Koo 2009). It is assumed that
the instantaneous channel state information (CSI) of the reporting channel is available
at each CH. In Figure 5.1, three main links can be distinguished; the primary user-
secondary user (PU-SU) link, the secondary user-cluster header (SU-CH) link, and
finally, the cluster header-fusion centre (CH-BS) link.
Figure 5.1 Detailed system model of the proposed hybrid SDF-HDF cluster-based cooperative spectrum sensing.
132
5.3 PERFORMANCE METRICS AND PARAMETERS
In this section, several performance metrics that characterize the overall qualitative
and quantitative performance of cooperative spectrum sensing are proposed. These
performance metrics include sensing metrics such as the global detectability of PU as
well as other metrics of crosslayer parameters. The proposed architecture is claimed to
be a more extended and realistic model that can consider several aspects at the SU,
CH, and BS stages. The CRNs architectures being formed of intelligent and
autonomous nodes should be able to satisfy multiple operational requirements rather
than considering the detection performance only. For instance, the power consumption
as well as the bandwidth utilization due to the relay of sensing measurements should
be both minimized. Thus, this section presents several performance metrics
formulated in a normalized manner such that they can be aggregated into a scalar
multi-objective metric or function.
5.3.1 Proposed Objective Functions
The proposed multiple objective functions of the hybrid SDF-HDF cluster based CRN
are now derived based on the system model shown in Figure 5.1. These proposed
objectives are put in normalized forms so that no objective of high scores overwhelms
others of low scores. The normalization procedure is necessary to provide about
uniform distribution of scores for all proposed objectives within the (0, 1) range.
Detailed explanations of the proposed objectives are now addressed.
(i) PU detection Probability: The probability of detecting the PU is one of the main
metrics of cooperative spectrum sensing in CRNs. As shown in Figure 5.1, an SDF
scheme is employed at the CH stage whereas a HDF scheme is used at the BS. Thus,
the probability of detection at the jth CH, jdQ , , is the same as the one expressed in
Equation 4.38 mentioned in Section 4.4.3. Thus
−=
∑∑−
1
01
,
)(
HT
TH
Tf
jd
QQQQ
ωω
θωωω
(5.1)
133
In the CH-BS link, all CHs communicate with the central BS through a
dedicated control channel in an orthogonal manner. The individual clusters’ decisions
are forwarded from the N CHs to the BS at which a final global decision is made
based on a HDF OR-rule. The HDF is used to reduce the reporting traffic overhead
from the M SUs to the BS. In our proposed system model, it is assumed that the
reporting channel of each CH-BS link is a binary symmetric channel (BSC) with a
probability of reporting error, Pe,j (Sun et al. 2007). Therefore, the overall probability
of detection, Qd, of the hybrid SDF-HDF cluster based CRN is given by
( )[ ]∏ =+−−−==
N
j jejdjejdd PQPQQPOD1 ,,,, 1)1(1 (5.2)
For simplicity, it is assumed that the BSCs of the CH-BS links are all identical
and have the same probability of reporting error, i.e. Pe,j = Pe. The objective of this
metric is to maximize POD.
(ii) Relay probability of error: In the proposed model shown in Figure 5.1, any ith
SU relays its sensing measurements to the jth CH. For simplicity, it is assumed that all
SUs within a given cluster use an M-ary QAM scheme with the same modulation
index, Md, when relaying their measurements to their corresponding CH. Thus, the
relay probability of error, denoted as BER, is expressed as
( )
−
−=
0
2
2
*2)1(
log3log
1*2N
EM
MQ
MM
BER b
d
d
d
d (5.3)
where Eb/N0 is bit energy per noise power spectral density. The objective of this
metric is to minimize BER.
(iii) Control Channel Bandwidth: The bandwidth of the control channel is an
important design metric since the spectral resources is the main concern that has led to
the emergence of CR technology. Thus, this metric should be included as a key
parameter when designing a CRN. Assume that the SUs relay their measurements to
their corresponding CH using orthogonal frequency division multiple access

134
(OFDMA) manner with Ln subcarriers. For simplicity, it is assumed that the number
of subcarriers used by each SU is the same. The normalized control channel
bandwidth (CCB) is then written as
( )max
2
1log
)2(
CCBFTM
MLuBT
CCB reuserd
N
jjns ∑
=
=
(5.4)
where Ts is the sensing time duration, B is the sensed bandwidth, u is the number of
quantization bits per sample, Mj is the number of SUs into the jth cluster, Md is the M-
ary modulation index, Tr is the relay time, Freuse is the frequency reuse factor and
CCBmax is the maximum available control channel bandwidth. The objective of this
metric is to minimize CCB.
(iv) CRN Throughput: The CRN throughput is proportional to the available time of
SU opportunistic data transmission out of the total frame time duration. The
normalized CRN throughput (THR) for a given frame time duration can be modified
from equation (4.16) introduced by Liang et al. (2008) as follows
( )
max
1)(
THR
QT
TTT
THRf
f
rsf −
+−
= (5.5)
where THRmax is the maximum achievable throughput of the CRN. The sensing time
period is assumed to be the same for all SUs. This is because varying the sensing time
among SUs may result in synchronization issues that complicate the periodic sensing
activity of the CRN. The objective of this metric is to maximize THR.
(v) Total Power Consumption: As in any communication system, the power
consumption should be always minimized to allow long connectivity especially when
limited power resources are available. The total power consumption of SUs in the
network is due to the total transmission power used to relay the sensing measurements
135
from the SU transmitters all the way to the central BS through the corresponding FC.
The normalized total power consumption (TPC) during the relay of sensing
measurements can then be expressed as
max
1 1,
TPC
PTPC
N
j
M
iijr
j
∑∑= ==
(5.6)
where Pr_j,i is the transmit power of the ith SU in the jth cluster and TPCmax is
maximum power consumption. The objective of this metric is to minimize TPC.
(vi) Signal to interference and noise ratio: As the number of SUs per cluster
increases, the mutual interference caused by the transmission of nearby SUs becomes
a serious matter. In this metric, it is assumed that the interference effect at the receiver
of a certain SU is limited to the SUs who exist within the same cluster only and not to
be influenced by the transmission of SUs of neighbouring clusters. The normalized
signal to interference and noise power (SINR) can be expressed as
∑∑∑= =
≠=
+=
N
j
Mj
iM
ikkkjrij
ijr
j
PN
PSINR
SINR1 1
,1,,
,
max
1 (5.7)
where SINRmax is the maximum possible score of SINR. The objective of this metric is
to minimize SINR.
(vii) Quantization fidelity of sensing measurements: The collected samples of the
sensing measurements at the SU receivers are quantized to a certain number of levels
to reduce the amount of traffic overhead upon relaying the sensing measurements to
the corresponding CHs. The number of quantization levels, and thus the number of
quantization bits per sample (u), has to be carefully selected. This is because using too
many quantization levels results in bandwidth expansion whereas reducing the number
of quantization levels will degrade the signal fidelity. The fidelity can be simply
136
thought of how much the quantized samples resemble their original signal (Sklar
2001). The normalized quantization fidelity (CFD) can be written as
max
22CFD
CFDu
=
(5.8)
where CFDmax is the maximum possible fidelity. The objective of this metric is to
maximize CFD.
5.3.2 Dependency Relationships of Performance Metrics
The performance metrics formulated in Equations (5.2) to (5.8) describe multiple
objectives of the CRN that need to be jointly optimized. By inspecting the mentioned
equations of the performance metrics, several dependent parameters can be
distinguished. These parameters and their used symbols and descriptions are tabulated
in Table 5.1. Each of these parameters may control more than one single performance
metric as shown in Figure 5.2.
Table 5.1 Summary of dependent design parameters of the proposed metrics.
Parameter Name Symbol Description Modulation index Md Modulation index used to relay the
measurements.
Sensing time Ts Time duration taken to perform spectrum sensing.
Probability of false alarm Qf The CRN-wise probability of false alarm.
Relay power Pr Amount of power required to relay the measurements.
Number of SUs per cluster M Number of SUs in each cluster.
No of bits per sample u Number of quantization bits per sample.
Total relay time Tr Total relay time from SU to BS through CH.
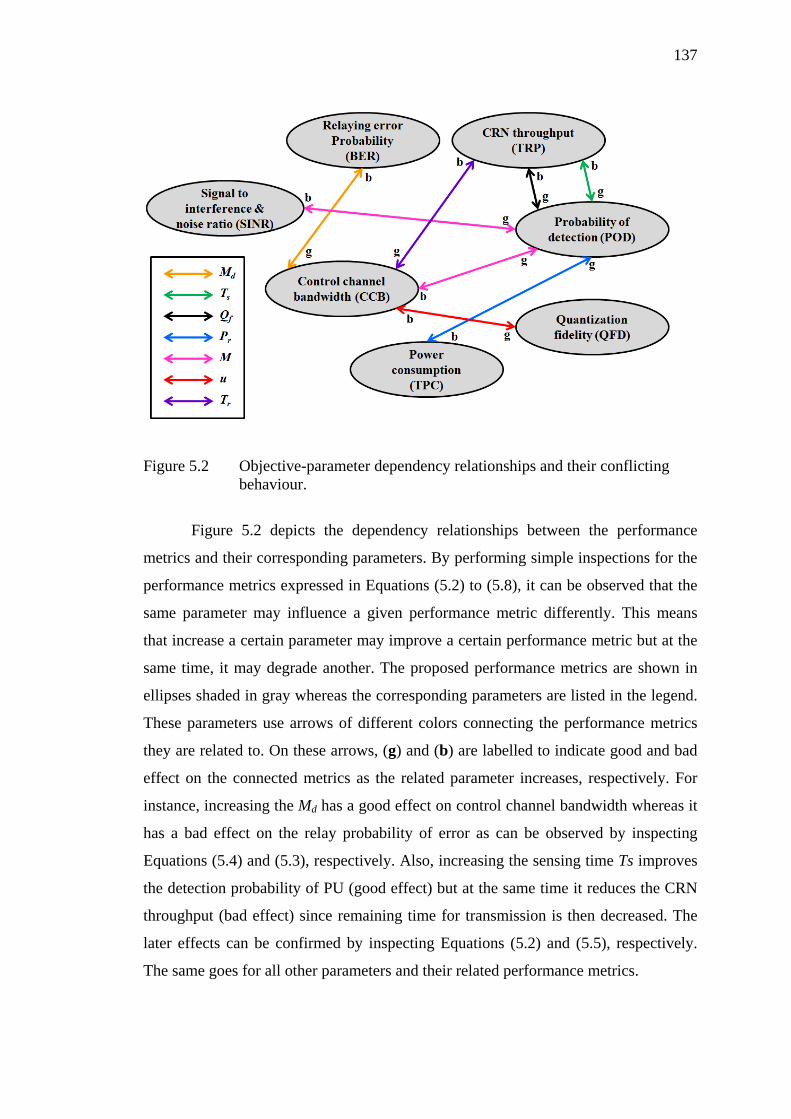
137
Figure 5.2 Objective-parameter dependency relationships and their conflicting behaviour.
Figure 5.2 depicts the dependency relationships between the performance
metrics and their corresponding parameters. By performing simple inspections for the
performance metrics expressed in Equations (5.2) to (5.8), it can be observed that the
same parameter may influence a given performance metric differently. This means
that increase a certain parameter may improve a certain performance metric but at the
same time, it may degrade another. The proposed performance metrics are shown in
ellipses shaded in gray whereas the corresponding parameters are listed in the legend.
These parameters use arrows of different colors connecting the performance metrics
they are related to. On these arrows, (g) and (b) are labelled to indicate good and bad
effect on the connected metrics as the related parameter increases, respectively. For
instance, increasing the Md has a good effect on control channel bandwidth whereas it
has a bad effect on the relay probability of error as can be observed by inspecting
Equations (5.4) and (5.3), respectively. Also, increasing the sensing time Ts improves
the detection probability of PU (good effect) but at the same time it reduces the CRN
throughput (bad effect) since remaining time for transmission is then decreased. The
later effects can be confirmed by inspecting Equations (5.2) and (5.5), respectively.
The same goes for all other parameters and their related performance metrics.
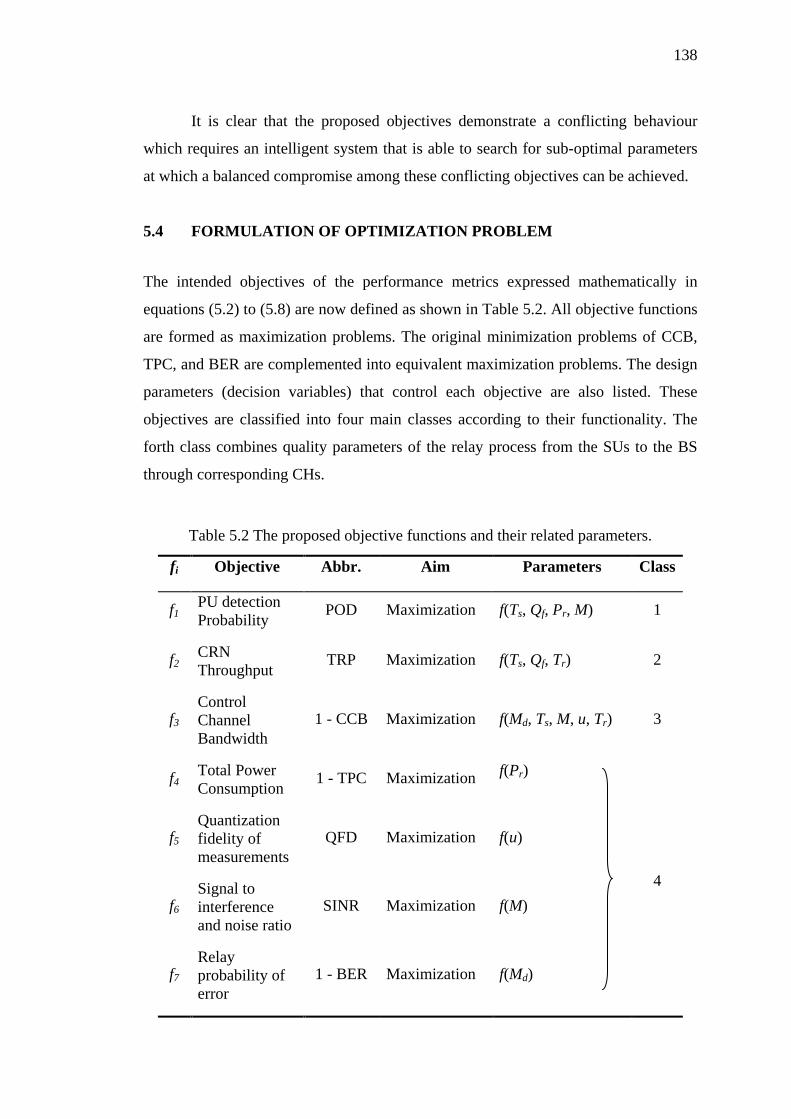
138
It is clear that the proposed objectives demonstrate a conflicting behaviour
which requires an intelligent system that is able to search for sub-optimal parameters
at which a balanced compromise among these conflicting objectives can be achieved.
5.4 FORMULATION OF OPTIMIZATION PROBLEM
The intended objectives of the performance metrics expressed mathematically in
equations (5.2) to (5.8) are now defined as shown in Table 5.2. All objective functions
are formed as maximization problems. The original minimization problems of CCB,
TPC, and BER are complemented into equivalent maximization problems. The design
parameters (decision variables) that control each objective are also listed. These
objectives are classified into four main classes according to their functionality. The
forth class combines quality parameters of the relay process from the SUs to the BS
through corresponding CHs.
Table 5.2 The proposed objective functions and their related parameters.
fi Objective Abbr. Aim Parameters Class
f1 PU detection Probability POD Maximization f(Ts, Qf, Pr, M) 1
f2 CRN Throughput
TRP Maximization f(Ts, Qf, Tr) 2
f3 Control Channel Bandwidth
1 - CCB Maximization f(Md, Ts, M, u, Tr) 3
f4 Total Power Consumption 1 - TPC Maximization f(Pr)
4
f5 Quantization fidelity of measurements
QFD Maximization f(u)
f6 Signal to interference and noise ratio
SINR Maximization f(M)
f7
Relay probability of error
1 - BER Maximization f(Md)
139
5.4.1 Aggregation of Multiple Objective Functions
These multiple objective functions shown in Table 5.2 are aggregated into one multi-
objective. As explained in section 2.7.3, the aggregation of multiple objectives is
realized using the weighted-sum utility function or using the linear logarithmic utility
function expressed in equation (2.13) and (2.14), respectively. Both approaches are
used in the proposed work. In fact, the weighted-sum approach is the default option
since it shows better performance whereas the linear logarithmic approach is used
when the optima (maxima or minima) is found at extreme edges. Since the obtainable
parameters after the optimization processes are expected to be Pareto-front or sub-
optimal solutions, it is therefore less likely to find these solutions at extreme edges.
The seven objective functions listed in Table 5.2 can be formed using the weighted-
sum approach as follows
'44332211
1
fwfwfwfw
fwfC
iiiobjectivemulti
+++=
=∑=
−
(5.9)
where ( ) 4/7654'
4 fffff +++= , C is the number of objective classes (i.e. C = 4)
and wi is the weighting coefficient of the ith class (or objective). Similarly, the
objective functions can be aggregated using the linear logarithmic utility function as
follows
)ln()ln()ln()ln(
)ln()(ln
'44332211
1
fwfwfwfw
fwfC
iiiobjectivemulti
+++=
=∑=
− (5.10)
5.4.2 CRN Operational Modes
The aggregation procedure realized using the weighted-sum or linear logarithmic
utility functions provides a unique feature that can benefit the cognition requirement
of CRN as well as the CR systems. This cognition is allows the optimization process
to be steered towards a specific objective according to the operational requirements
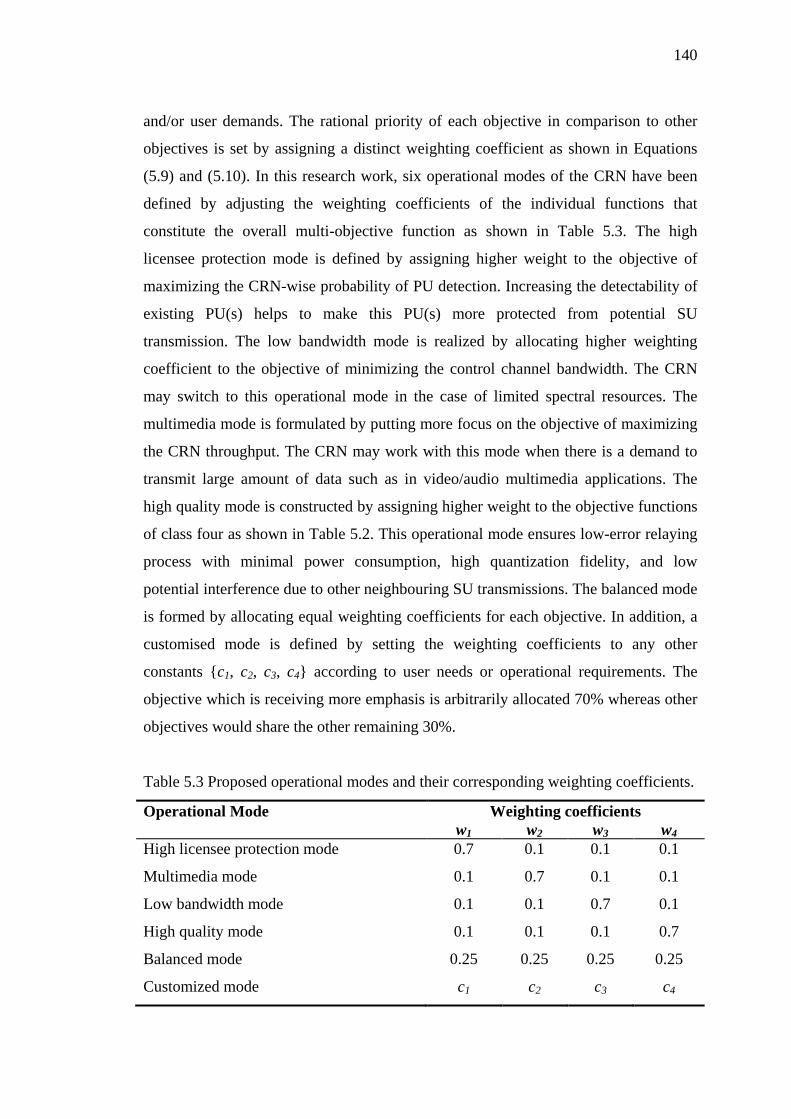
140
and/or user demands. The rational priority of each objective in comparison to other
objectives is set by assigning a distinct weighting coefficient as shown in Equations
(5.9) and (5.10). In this research work, six operational modes of the CRN have been
defined by adjusting the weighting coefficients of the individual functions that
constitute the overall multi-objective function as shown in Table 5.3. The high
licensee protection mode is defined by assigning higher weight to the objective of
maximizing the CRN-wise probability of PU detection. Increasing the detectability of
existing PU(s) helps to make this PU(s) more protected from potential SU
transmission. The low bandwidth mode is realized by allocating higher weighting
coefficient to the objective of minimizing the control channel bandwidth. The CRN
may switch to this operational mode in the case of limited spectral resources. The
multimedia mode is formulated by putting more focus on the objective of maximizing
the CRN throughput. The CRN may work with this mode when there is a demand to
transmit large amount of data such as in video/audio multimedia applications. The
high quality mode is constructed by assigning higher weight to the objective functions
of class four as shown in Table 5.2. This operational mode ensures low-error relaying
process with minimal power consumption, high quantization fidelity, and low
potential interference due to other neighbouring SU transmissions. The balanced mode
is formed by allocating equal weighting coefficients for each objective. In addition, a
customised mode is defined by setting the weighting coefficients to any other
constants {c1, c2, c3, c4} according to user needs or operational requirements. The
objective which is receiving more emphasis is arbitrarily allocated 70% whereas other
objectives would share the other remaining 30%.
Table 5.3 Proposed operational modes and their corresponding weighting coefficients.
Operational Mode Weighting coefficients w1 w2 w3 w4
High licensee protection mode 0.7 0.1 0.1 0.1
Multimedia mode 0.1 0.7 0.1 0.1
Low bandwidth mode 0.1 0.1 0.7 0.1
High quality mode 0.1 0.1 0.1 0.7
Balanced mode 0.25 0.25 0.25 0.25
Customized mode c1 c2 c3 c4
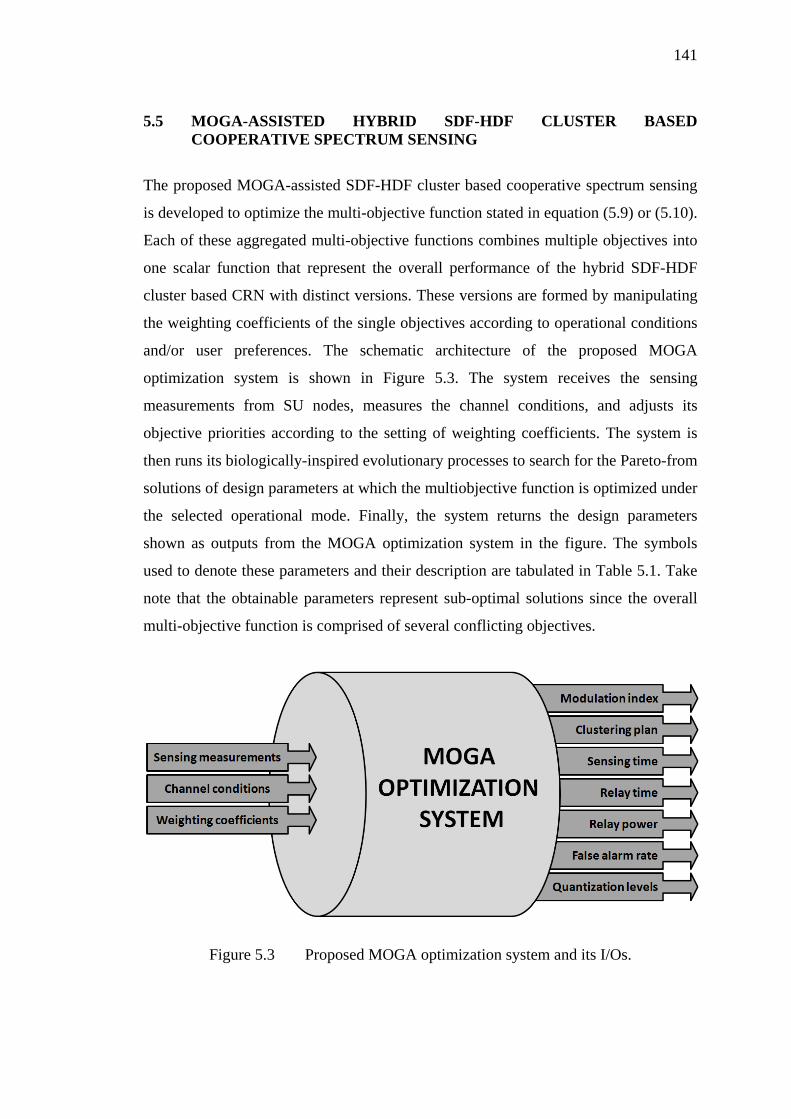
141
5.5 MOGA-ASSISTED HYBRID SDF-HDF CLUSTER BASED COOPERATIVE SPECTRUM SENSING
The proposed MOGA-assisted SDF-HDF cluster based cooperative spectrum sensing
is developed to optimize the multi-objective function stated in equation (5.9) or (5.10).
Each of these aggregated multi-objective functions combines multiple objectives into
one scalar function that represent the overall performance of the hybrid SDF-HDF
cluster based CRN with distinct versions. These versions are formed by manipulating
the weighting coefficients of the single objectives according to operational conditions
and/or user preferences. The schematic architecture of the proposed MOGA
optimization system is shown in Figure 5.3. The system receives the sensing
measurements from SU nodes, measures the channel conditions, and adjusts its
objective priorities according to the setting of weighting coefficients. The system is
then runs its biologically-inspired evolutionary processes to search for the Pareto-from
solutions of design parameters at which the multiobjective function is optimized under
the selected operational mode. Finally, the system returns the design parameters
shown as outputs from the MOGA optimization system in the figure. The symbols
used to denote these parameters and their description are tabulated in Table 5.1. Take
note that the obtainable parameters represent sub-optimal solutions since the overall
multi-objective function is comprised of several conflicting objectives.
Figure 5.3 Proposed MOGA optimization system and its I/Os.
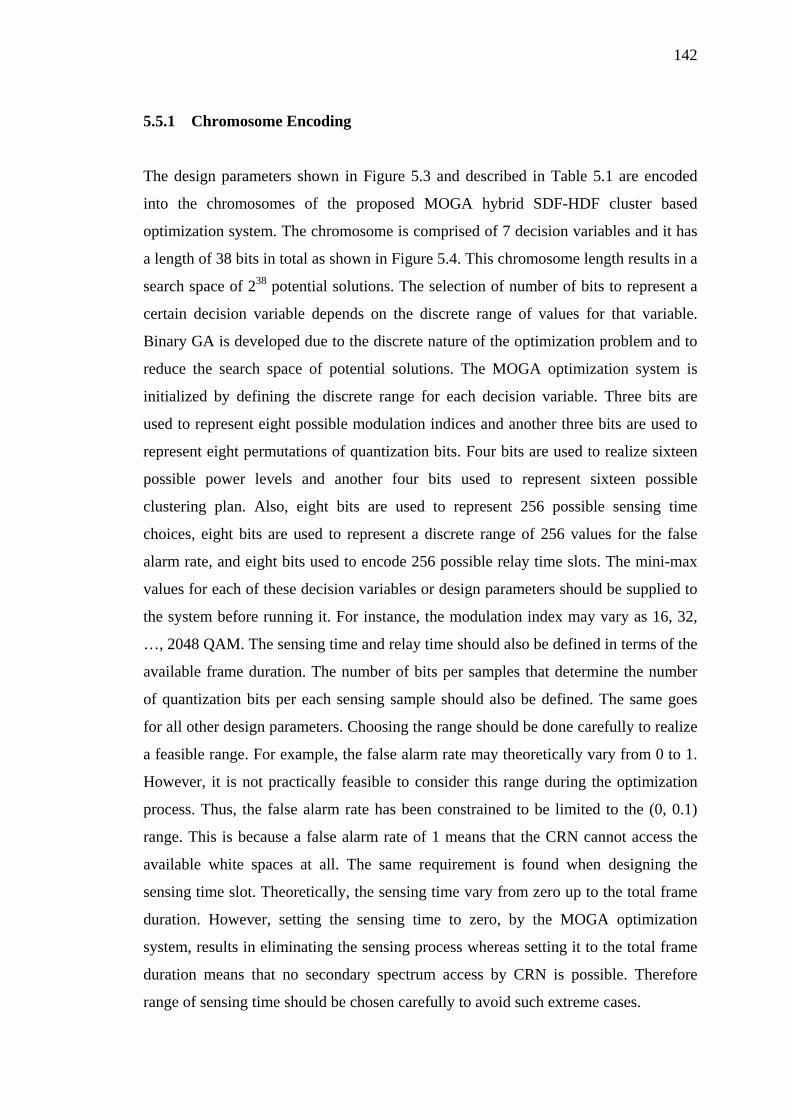
142
5.5.1 Chromosome Encoding
The design parameters shown in Figure 5.3 and described in Table 5.1 are encoded
into the chromosomes of the proposed MOGA hybrid SDF-HDF cluster based
optimization system. The chromosome is comprised of 7 decision variables and it has
a length of 38 bits in total as shown in Figure 5.4. This chromosome length results in a
search space of 238 potential solutions. The selection of number of bits to represent a
certain decision variable depends on the discrete range of values for that variable.
Binary GA is developed due to the discrete nature of the optimization problem and to
reduce the search space of potential solutions. The MOGA optimization system is
initialized by defining the discrete range for each decision variable. Three bits are
used to represent eight possible modulation indices and another three bits are used to
represent eight permutations of quantization bits. Four bits are used to realize sixteen
possible power levels and another four bits used to represent sixteen possible
clustering plan. Also, eight bits are used to represent 256 possible sensing time
choices, eight bits are used to represent a discrete range of 256 values for the false
alarm rate, and eight bits used to encode 256 possible relay time slots. The mini-max
values for each of these decision variables or design parameters should be supplied to
the system before running it. For instance, the modulation index may vary as 16, 32,
…, 2048 QAM. The sensing time and relay time should also be defined in terms of the
available frame duration. The number of bits per samples that determine the number
of quantization bits per each sensing sample should also be defined. The same goes
for all other design parameters. Choosing the range should be done carefully to realize
a feasible range. For example, the false alarm rate may theoretically vary from 0 to 1.
However, it is not practically feasible to consider this range during the optimization
process. Thus, the false alarm rate has been constrained to be limited to the (0, 0.1)
range. This is because a false alarm rate of 1 means that the CRN cannot access the
available white spaces at all. The same requirement is found when designing the
sensing time slot. Theoretically, the sensing time vary from zero up to the total frame
duration. However, setting the sensing time to zero, by the MOGA optimization
system, results in eliminating the sensing process whereas setting it to the total frame
duration means that no secondary spectrum access by CRN is possible. Therefore
range of sensing time should be chosen carefully to avoid such extreme cases.
143
Figure 5.4 Chromosome representation of MOGA optimization system.
5.5.2 Development of GUI Simulation Model (GUISM)
In this research work, a graphical user interface simulation model (GUISM) has been
developed in order to realize a friendly interactive tool user interface that helps the
user to choose the operational mode of the MOGA optimization system, select the
aggregation approach and utility functions, setting the range of decision variables, and
setting the genetic algorithm parameters. The GUISM is depicted in Figure 5.5. It
contains three input panels which allow the user to interact with GUISM. The first
panel allows the user to choose the utility function to be either weighted sum or linear
logarithmic function. The second panel provides means to realize as static or dynamic
channel conditions by using “With Twister” or “Without Twister”, respectively. The
third panel allows the user to choose any of the six operational modes defined in Table
5.3. If the user chooses the customized mode, four input boxes are provided to enter
the weighting coefficients of the four classes in Table 5.2, respectively. The user can
also set the minimum and maximum values that define the range of each design
parameter. Also, the user is able to set the total number of SUs in the system, the total
number of generation, the total frame duration and the twister state if a static channel
is considered. The GUISM is then run by clicking on the START button. After the
MOGA optimization system is terminated upon exceeding the predefined total number
of generations, the optimal design parameters will be shown in the static boxes in the
same GUISM as shown. Other observations can be shown also in the GUISM
including the value of the multi-objective functions, the generation index at which the
maximum score of the multi-objective function is achieved, and the time taken by
CPU to perform the optimization process in second. The best and average multi-
objective fitness function scores versus generations will also be plotted in the upper
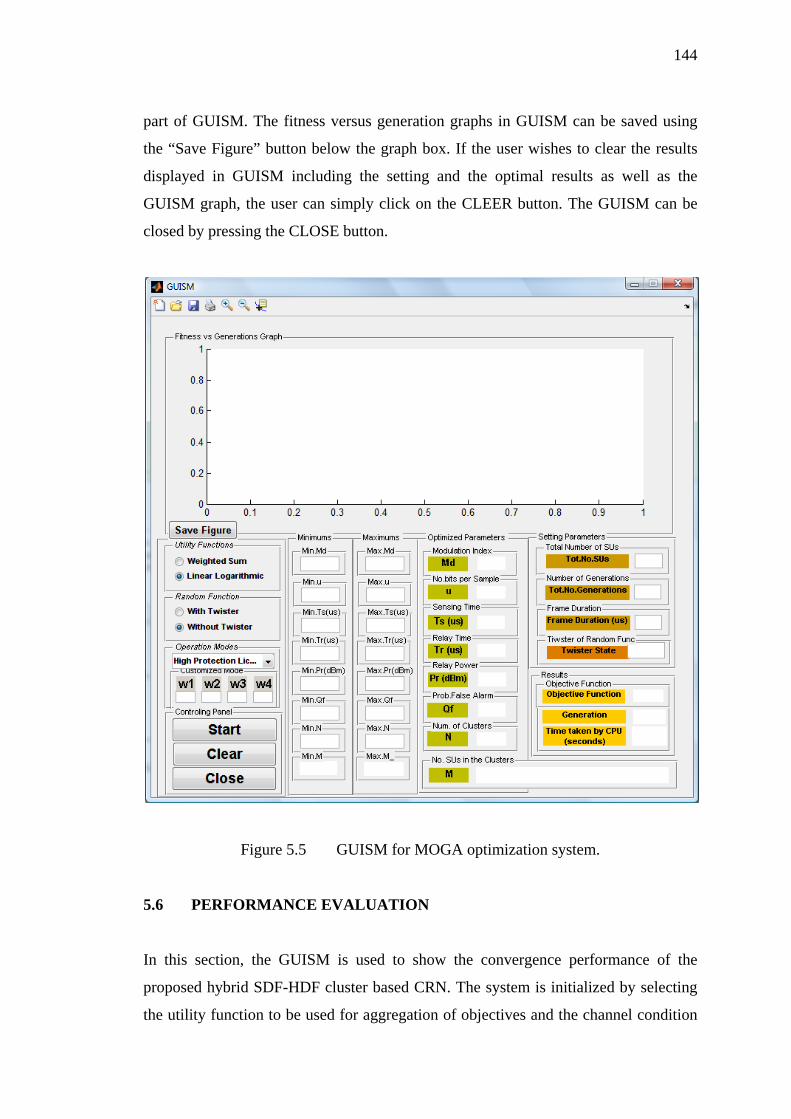
144
part of GUISM. The fitness versus generation graphs in GUISM can be saved using
the “Save Figure” button below the graph box. If the user wishes to clear the results
displayed in GUISM including the setting and the optimal results as well as the
GUISM graph, the user can simply click on the CLEER button. The GUISM can be
closed by pressing the CLOSE button.
Figure 5.5 GUISM for MOGA optimization system.
5.6 PERFORMANCE EVALUATION
In this section, the GUISM is used to show the convergence performance of the
proposed hybrid SDF-HDF cluster based CRN. The system is initialized by selecting
the utility function to be used for aggregation of objectives and the channel condition
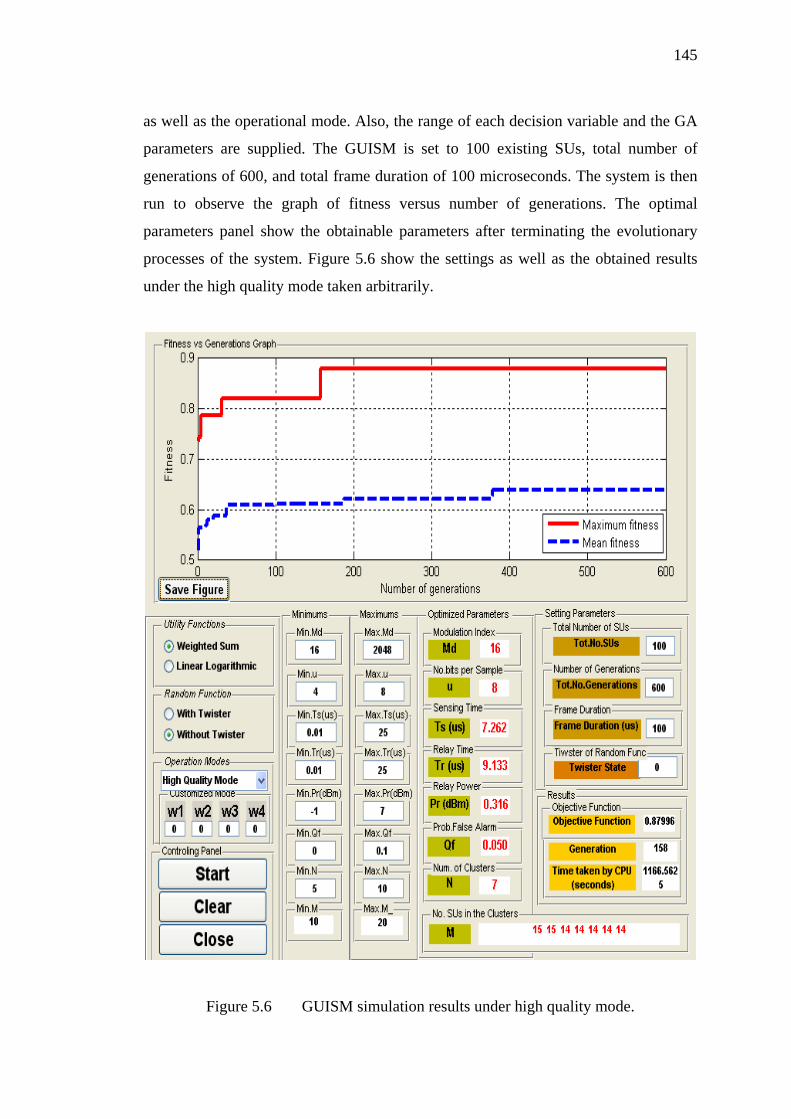
145
as well as the operational mode. Also, the range of each decision variable and the GA
parameters are supplied. The GUISM is set to 100 existing SUs, total number of
generations of 600, and total frame duration of 100 microseconds. The system is then
run to observe the graph of fitness versus number of generations. The optimal
parameters panel show the obtainable parameters after terminating the evolutionary
processes of the system. Figure 5.6 show the settings as well as the obtained results
under the high quality mode taken arbitrarily.
Figure 5.6 GUISM simulation results under high quality mode.
146
The convergence performance is shown on the upper fitness versus
generation’s graph. It is noticed that the obtainable sub-optimal solution is obtained
after 158 generations scoring a maximum fitness of about 0.88 (or 88%). The
obtainable parameters are modulation index Md = 16, u = 8 quantization bits per
sample, sensing time Ts = 7.262 microseconds, relay time Tr = 9.133 microseconds,
relay power Pr = 0.316 dBm, false alarm rate Qf = 0.05, and number of clusters N = 7
of about equal number of SUs. Under the chosen high quality operational mode, the
optimization process is steered towards prioritizing the forth class of objectives in
Table 5.2 that is to minimize the power consumption, maximize the quantization
fidelity, minimizing the signal to interference and noise ratio, and minimizing the
relay error rate. However, the dependent parameters of these conflicting objectives
may conflict among each other as well as with objectives of other classes. For
example, increasing the number of quantization levels results in increasing the
quantization bits which improves the quantization fidelity but it causes increment on
the control channel bandwidth. Also minimizing the power consumption can be
achieved by reducing the transmission power of the SUs when relaying their sensing
measurements to their corresponding CH. However, reducing the transmission power
has the bad effect of degrading the CRN-wise probability of detection as has been
shown in Figure 5.2. Therefore, the obtainable parameters are not expected to be the
optimal parameters at their extreme values that solely maximize the class of objectives
with the highest priority. Instead, the obtainable solutions are only sub-optimal values
that can realize compromises between the conflicting intra and inter classes of
objectives. By inspecting the values of obtainable parameters, the lowest modulation
index of 16 is chosen since high relay quality is demanded. The highest number of
quantization bits of 8 is also used to improve the quantization fidelity. A low sub-
optimal transmission power of 0.316 dBm is acceptable to reduce the power
consumption. The other parameters are selected to attain a balanced compromises
based on the weighting coefficients assigned to the respective objectives. In fact, the
obtainable solutions of design parameters should be judged by relating them to the
respective objectives due to the contradictory natures of these objectives. The right
way to prove the sub-optimality of the obtainable solutions is to evaluate their
collective impact on the overall aggregated multi-objective fitness function. The
simulation results of all operational modes are discussed on the next section.
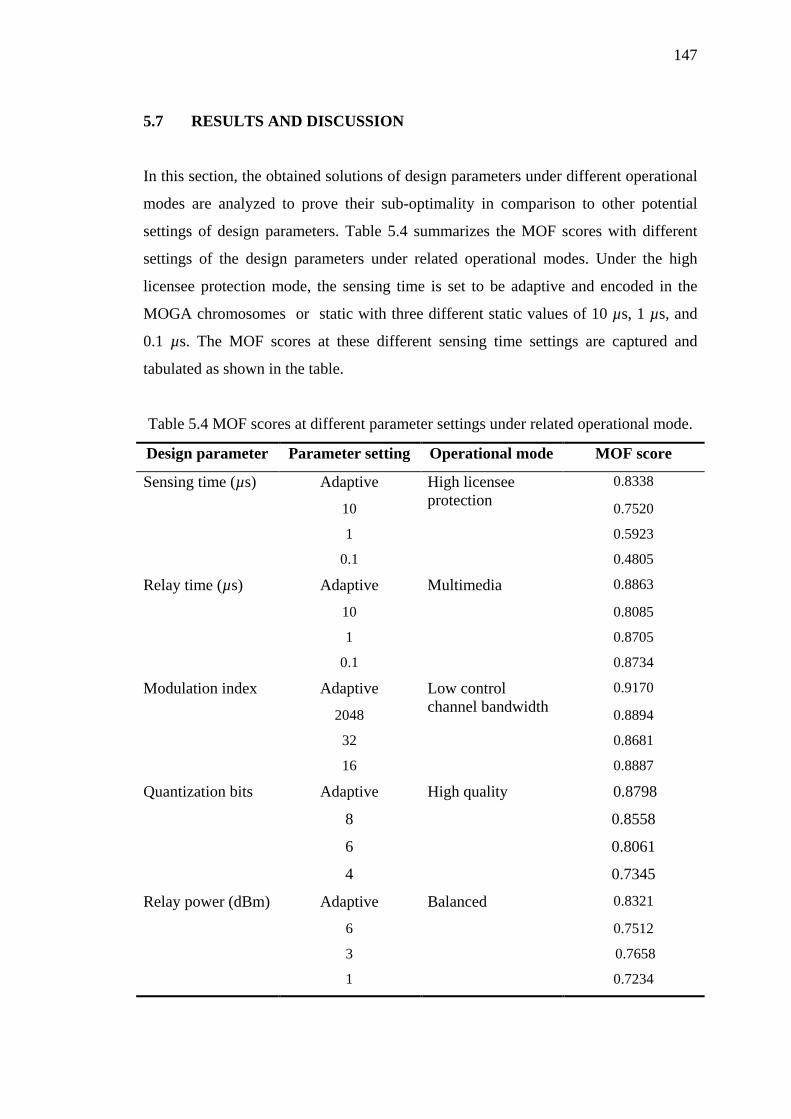
147
5.7 RESULTS AND DISCUSSION
In this section, the obtained solutions of design parameters under different operational
modes are analyzed to prove their sub-optimality in comparison to other potential
settings of design parameters. Table 5.4 summarizes the MOF scores with different
settings of the design parameters under related operational modes. Under the high
licensee protection mode, the sensing time is set to be adaptive and encoded in the
MOGA chromosomes or static with three different static values of 10 µs, 1 µs, and
0.1 µs. The MOF scores at these different sensing time settings are captured and
tabulated as shown in the table.
Table 5.4 MOF scores at different parameter settings under related operational mode.
Design parameter Parameter setting Operational mode MOF score
Sensing time (µs) Adaptive High licensee protection
0.8338
10 0.7520
1 0.5923
0.1 0.4805
Relay time (µs) Adaptive Multimedia
0.8863
10 0.8085
1 0.8705
0.1 0.8734
Modulation index Adaptive Low control channel bandwidth
0.9170
2048 0.8894
32 0.8681
16 0.8887
Quantization bits Adaptive High quality
0.8798
8 0.8558
6 0.8061
4 0.7345
Relay power (dBm) Adaptive Balanced 0.8321
6 0.7512
3 0.7658
1 0.7234
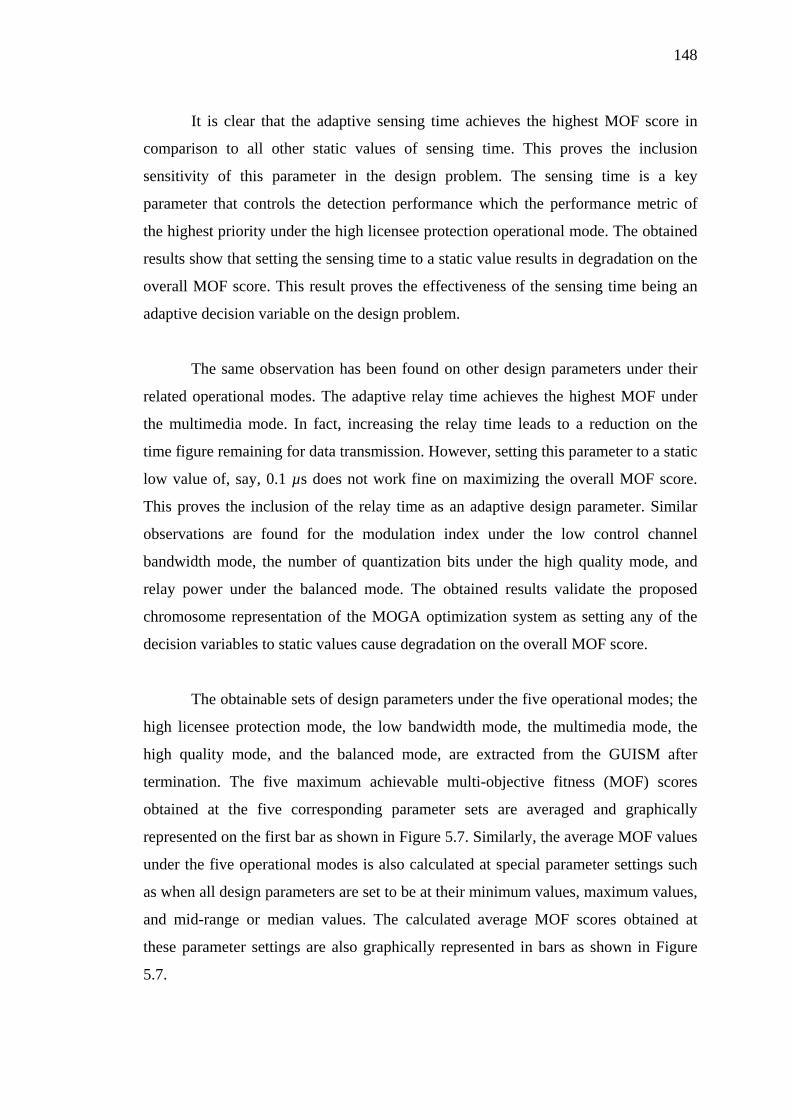
148
It is clear that the adaptive sensing time achieves the highest MOF score in
comparison to all other static values of sensing time. This proves the inclusion
sensitivity of this parameter in the design problem. The sensing time is a key
parameter that controls the detection performance which the performance metric of
the highest priority under the high licensee protection operational mode. The obtained
results show that setting the sensing time to a static value results in degradation on the
overall MOF score. This result proves the effectiveness of the sensing time being an
adaptive decision variable on the design problem.
The same observation has been found on other design parameters under their
related operational modes. The adaptive relay time achieves the highest MOF under
the multimedia mode. In fact, increasing the relay time leads to a reduction on the
time figure remaining for data transmission. However, setting this parameter to a static
low value of, say, 0.1 µs does not work fine on maximizing the overall MOF score.
This proves the inclusion of the relay time as an adaptive design parameter. Similar
observations are found for the modulation index under the low control channel
bandwidth mode, the number of quantization bits under the high quality mode, and
relay power under the balanced mode. The obtained results validate the proposed
chromosome representation of the MOGA optimization system as setting any of the
decision variables to static values cause degradation on the overall MOF score.
The obtainable sets of design parameters under the five operational modes; the
high licensee protection mode, the low bandwidth mode, the multimedia mode, the
high quality mode, and the balanced mode, are extracted from the GUISM after
termination. The five maximum achievable multi-objective fitness (MOF) scores
obtained at the five corresponding parameter sets are averaged and graphically
represented on the first bar as shown in Figure 5.7. Similarly, the average MOF values
under the five operational modes is also calculated at special parameter settings such
as when all design parameters are set to be at their minimum values, maximum values,
and mid-range or median values. The calculated average MOF scores obtained at
these parameter settings are also graphically represented in bars as shown in Figure
5.7.
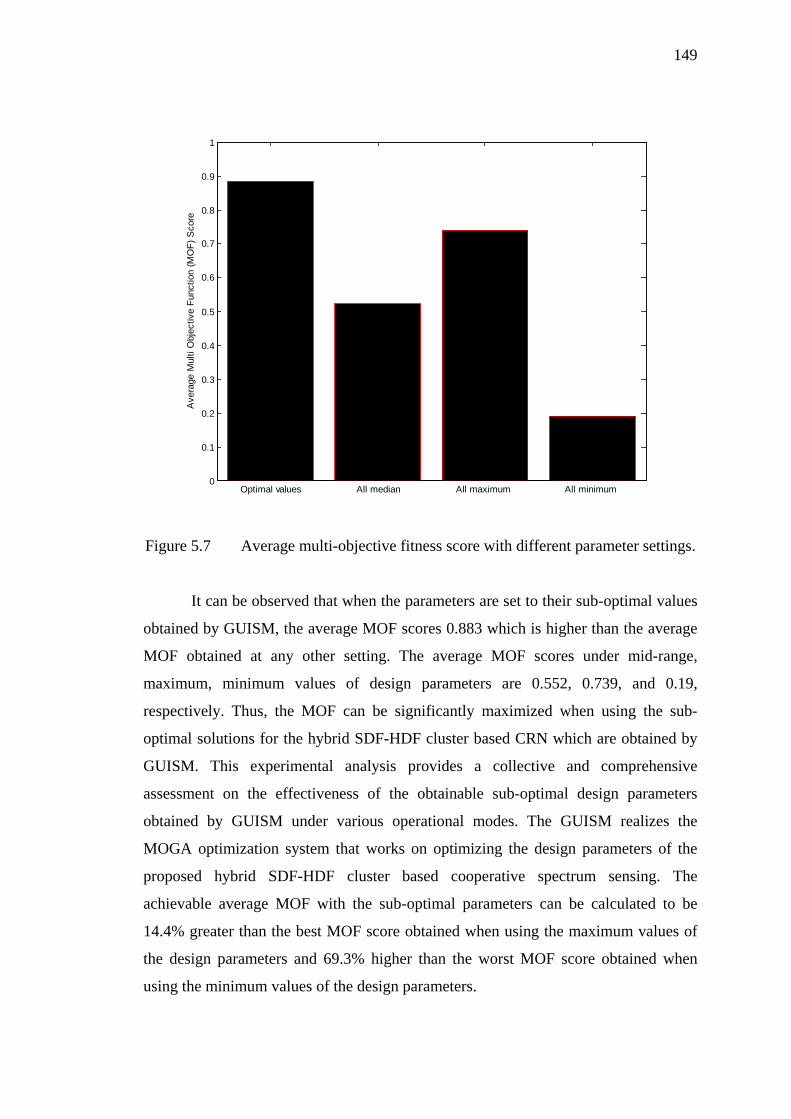
149
Figure 5.7 Average multi-objective fitness score with different parameter settings.
It can be observed that when the parameters are set to their sub-optimal values
obtained by GUISM, the average MOF scores 0.883 which is higher than the average
MOF obtained at any other setting. The average MOF scores under mid-range,
maximum, minimum values of design parameters are 0.552, 0.739, and 0.19,
respectively. Thus, the MOF can be significantly maximized when using the sub-
optimal solutions for the hybrid SDF-HDF cluster based CRN which are obtained by
GUISM. This experimental analysis provides a collective and comprehensive
assessment on the effectiveness of the obtainable sub-optimal design parameters
obtained by GUISM under various operational modes. The GUISM realizes the
MOGA optimization system that works on optimizing the design parameters of the
proposed hybrid SDF-HDF cluster based cooperative spectrum sensing. The
achievable average MOF with the sub-optimal parameters can be calculated to be
14.4% greater than the best MOF score obtained when using the maximum values of
the design parameters and 69.3% higher than the worst MOF score obtained when
using the minimum values of the design parameters.
Optimal values All median All maximum All minimum 0
0.1
0.2
0.3
0.4
0.5
0.6
0.7
0.8
0.9
1
Ave
rage
Mul
ti O
bjec
tive
Func
tion
(MO
F) S
core
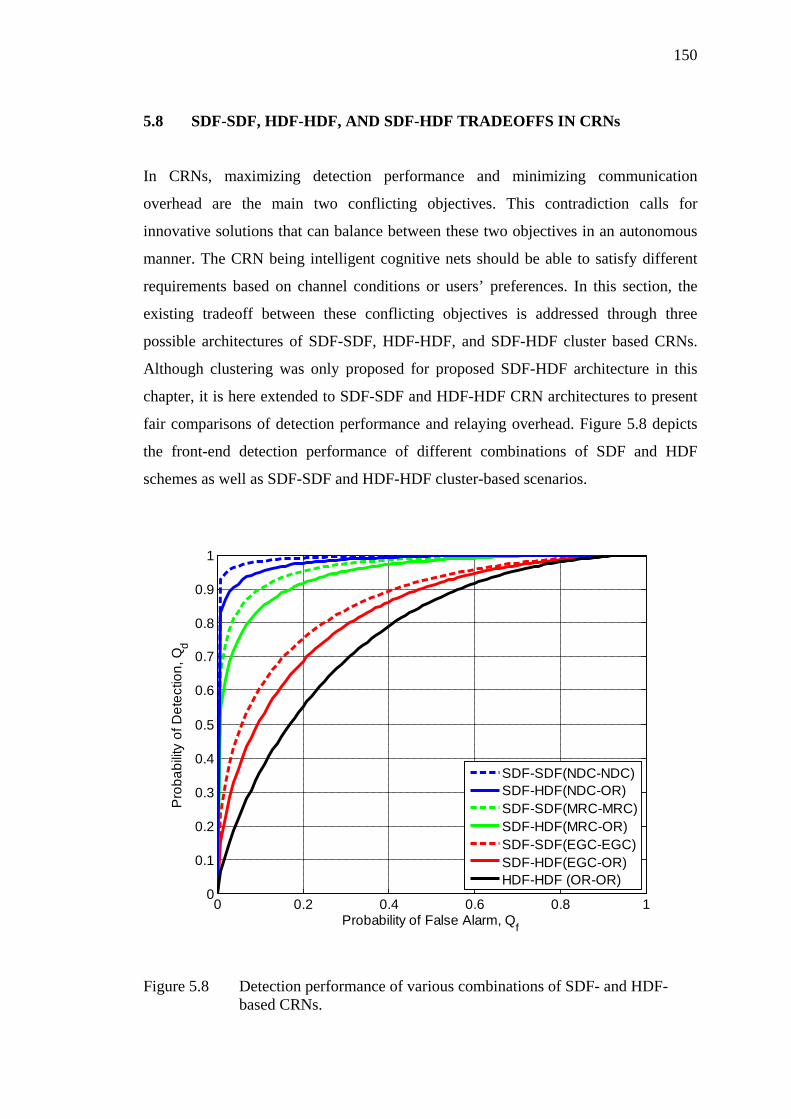
150
5.8 SDF-SDF, HDF-HDF, AND SDF-HDF TRADEOFFS IN CRNs
In CRNs, maximizing detection performance and minimizing communication
overhead are the main two conflicting objectives. This contradiction calls for
innovative solutions that can balance between these two objectives in an autonomous
manner. The CRN being intelligent cognitive nets should be able to satisfy different
requirements based on channel conditions or users’ preferences. In this section, the
existing tradeoff between these conflicting objectives is addressed through three
possible architectures of SDF-SDF, HDF-HDF, and SDF-HDF cluster based CRNs.
Although clustering was only proposed for proposed SDF-HDF architecture in this
chapter, it is here extended to SDF-SDF and HDF-HDF CRN architectures to present
fair comparisons of detection performance and relaying overhead. Figure 5.8 depicts
the front-end detection performance of different combinations of SDF and HDF
schemes as well as SDF-SDF and HDF-HDF cluster-based scenarios.
Figure 5.8 Detection performance of various combinations of SDF- and HDF- based CRNs.
0 0.2 0.4 0.6 0.8 10
0.1
0.2
0.3
0.4
0.5
0.6
0.7
0.8
0.9
1
Probability of False Alarm, Qf
Pro
babi
lity
of D
etec
tion,
Qd
SDF-SDF(NDC-NDC)SDF-HDF(NDC-OR)SDF-SDF(MRC-MRC)SDF-HDF(MRC-OR)SDF-SDF(EGC-EGC)SDF-HDF(EGC-OR)HDF-HDF (OR-OR)
151
In fact, the only possible CRN scenarios are SDF-SDF, SDF-HDF, and HDF-
HDF. The HDF-SDF is unrealizable because once the sensing information content is
lost by hard fusion, this content cannot be retrieved or softened anymore. For the
purpose of illustration, the SDF schemes used in this section are NDC, MRC, and
EGC whereas the OR-rule is used as a HDF scheme. However, the SOGA-assisted
scheme proposed in chapter IV can be used here as well. The MDC scheme has been
excluded as it almost has the same detection performance as NDC. As expected, the
SDF-SDF (NDC-NDC) cooperative sensing scenario shows the best detection
performance among all other scenarios as demonstrated in Figure 5.8. However, being
an SDF-SDF scenario, the NDC-NDC has the drawback of increased traffic overhead.
On the other hand, the hybrid SDF-HDF (NDC-OR) cluster-based cooperative sensing
scenario has a superior detection performance comparing to all other SDF-SDF
(except NDC-NDC scenario), HDF-HDF, and SDF-HDF combinations. The
interesting finding here is that although the SDF-SDF combinations of MRC-MRC
and EGC-EGC use soft fusion in both SU-CH and CH-BS stages, these two
combinations still unable to outperform the proposed SDF-HDF (NDC-OR) scenario
which uses hard fusion in the CH-BS stage.
One may intuitively say that applying SDF in two successive links should
result in better performance than applying SDF followed by HDF in these two links.
However, the improved performance of SDF-HDF (NDC-OR) over the two SDF-SDF
scenarios, MRC-MRC and EGC-EGC, is justified by the degradation occurred in
SDF-HDF (NDC-OR), due to the utilization of OR-rule fusion scheme in the CH-BS
link, is compensated by the superior performance of NDC so that the overall
performance of the NDC-OR scenario outperforms the ones of MRC-MRC and EGC-
EGC combinations. The advantage of using HDF instead of SDF at the CH-BS link is
the reduced traffic overhead especially when the number of clusters is comparable.
The MRC-MRC and EGC-EGC have better performance than MRC-OR and EGC-
OR, respectively, which is again due to using the OR-rule HDF in the CH-BS stage.
Finally, the HDF-HDF (OR-OR) has the worst detection performance as comparing to
all other combinations but it has the unique advantage of minimum traffic overhead.
Thus, the SDF-HDF CRN architecture can be said to be a good compromise between
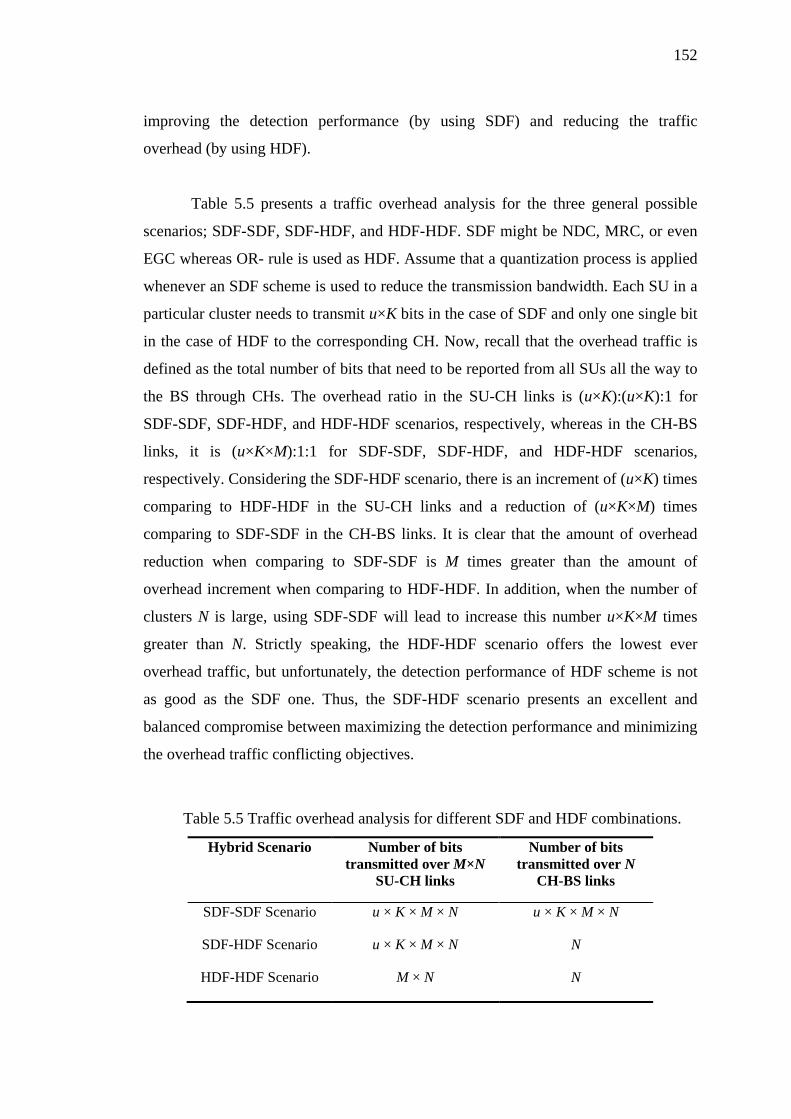
152
improving the detection performance (by using SDF) and reducing the traffic
overhead (by using HDF).
Table 5.5 presents a traffic overhead analysis for the three general possible
scenarios; SDF-SDF, SDF-HDF, and HDF-HDF. SDF might be NDC, MRC, or even
EGC whereas OR- rule is used as HDF. Assume that a quantization process is applied
whenever an SDF scheme is used to reduce the transmission bandwidth. Each SU in a
particular cluster needs to transmit u×K bits in the case of SDF and only one single bit
in the case of HDF to the corresponding CH. Now, recall that the overhead traffic is
defined as the total number of bits that need to be reported from all SUs all the way to
the BS through CHs. The overhead ratio in the SU-CH links is (u×K):(u×K):1 for
SDF-SDF, SDF-HDF, and HDF-HDF scenarios, respectively, whereas in the CH-BS
links, it is (u×K×M):1:1 for SDF-SDF, SDF-HDF, and HDF-HDF scenarios,
respectively. Considering the SDF-HDF scenario, there is an increment of (u×K) times
comparing to HDF-HDF in the SU-CH links and a reduction of (u×K×M) times
comparing to SDF-SDF in the CH-BS links. It is clear that the amount of overhead
reduction when comparing to SDF-SDF is M times greater than the amount of
overhead increment when comparing to HDF-HDF. In addition, when the number of
clusters N is large, using SDF-SDF will lead to increase this number u×K×M times
greater than N. Strictly speaking, the HDF-HDF scenario offers the lowest ever
overhead traffic, but unfortunately, the detection performance of HDF scheme is not
as good as the SDF one. Thus, the SDF-HDF scenario presents an excellent and
balanced compromise between maximizing the detection performance and minimizing
the overhead traffic conflicting objectives.
Table 5.5 Traffic overhead analysis for different SDF and HDF combinations.
Hybrid Scenario Number of bits transmitted over M×N
SU-CH links
Number of bits transmitted over N
CH-BS links
SDF-SDF Scenario u × K × M × N u × K × M × N
SDF-HDF Scenario u × K × M × N N
HDF-HDF Scenario M × N N
153
5.9 SUMMARY
This chapter extends the SDF- and HDF-based CRNs proposed in chapter IV to a
hybrid SDF-HDF cluster-based CRN architecture. Several performance metrics are
proposed to construct the overall multi-objective fitness function of the whole network
from the SUs all the way to the central FC/BS through corresponding CHs. The
contradiction between the proposed single objective functions is observed. The CRN
design parameters are then identified and the single objective functions are aggregated
into one overall multi-objective function after being weighted using appropriate
weighting coefficients. The CRN operational modes associated with the distinct
settings of the weighting coefficients are also identified. A MOGA optimization
system is then developed to optimize the CRN design parameters so that the overall
MOF function is maximized. GUISM is also developed that allow the user to interact
with the proposed MOGA optimization system and observe its convergence
performance as well as the returned solutions after exceeding the predefined total
number of generations. The obtainable design parameters under various operational
modes are analysed to prove the effectiveness of their inclusion as adaptive
parameters in the design problem. The optimal parameters can score an average MOF
value of 0.883 which is 14.4% greater than the best MOF score obtained when using
the maximum values of the design parameters and 69.3% higher than the worst MOF
score obtained when using the minimum values of the design parameters. SDF-SDF,
HDF-HDF, and SDF-HDF detection performance and traffic overhead tradeoffs are
finally discussed based on the obtained simulation results. The analyses support the
claim of proposing the hybrid SDF-HDF cluster based CRN architecture for a
compromised detection performance and traffic overhead.
CHAPTER VI
CONCLUSIONS AND FUTURE WORK
6.1 CONCLUSIONS
Nowadays, there is a common agreement among research community in academia as
well as in industry on that the conventional exclusive allocation of spectral resources
for different technologies is no more feasible. This agreement is originated from the
continuously increasing demand for operating frequency bands to support new
emerging technologies. Recent empirical studies have shown that the scarcity of
spectrum is not really caused due to limited nature resource, but instead, it is a result
of the current inefficient allocation schemes since most of the frequency bands are
significantly underutilized. To tackle this issue, DSA schemes are being proposed to
replace the current static allocation schemes that are no more able to cope up with the
state of the art technologies and applications. CR is widely envisioned as means of
realizing DSA solutions and provides opportunities to enhance spectrum efficiency.
CR systems are adaptive wireless nodes act autonomously based on their awareness of
the surrounding environment. Therefore, the CR systems should employ an intelligent
core that is able to process the environmental information and adapts its transmission
accordingly. On the other hand, this awareness requires the CR nodes to be armed
with spectrum sensing capabilities. Cooperative spectrum sensing is established
among several CR nodes in a CRN to improve the PU detection performance.
However, this cooperation between CR nodes results in communication overhead due
to relaying activities of sensing data and decisions. Unfortunately, the two objectives
of maximizing detection performance and minimizing communication overhead are
contradictory. Thus, an intelligent optimization system should be used to compromise
155
between these two conflicting objectives. As mentioned in the research objectives in
Section 1.3, this thesis proposes MOEAs as intelligent autonomous cores for CR
systems as per objective (i) and as optimization systems for HDF-, SDF-, and hybrid
SDF-HDF cluster-based CRNs as per objective (ii), (iii), and (iv), respectively. The
novelty of this thesis lies on the proposed hybrid SDF-HDF cluster based CRN
architecture as a solution that realizes a balanced compromise between the conflicting
objectives of maximizing the detection performance while minimizing the
communication overhead. In addition, the thesis novelty is reflected on the
employment of MOEAs of different objectives for CR systems and CRNs. The
proposed MOEAs developments for CR systems and CRNs and their corresponding
findings are all summarized in the following sections.
6.1.1 MOEA for CR Systems
In Chapter III, a particular MOEA called MOGA is developed as an intelligent core or
decision engine of a CR system that is able to adapt its transmission parameters in
response to a set of sensed environmental parameters based on given performance
objectives. The proposed environmental parameters of the CR system are the received
power, the noise power, and the path loss estimation whereas the transmission
parameters are the transmission power, the modulation scheme, and the symbol rate.
The objective functions that formulate the relationships between these I/O parameters
are also proposed. Then, an analytical simulation study was carried out to show the
contradictory nature of the proposed objectives. These conflicting objectives are
aggregated into one overall multi-objective function through the use of variable
weighting coefficients that can be adjusted to define distinct transmission scenarios
for the CR system. These distinct transmission modes are the reliable communication
mode (RCM), the power-saving mode (PSM), the spectrally-efficient mode (SEM)
and the balanced mode (BLM).
The proposed MOGA decision engine is developed to be able to adaptively
optimize the transmission parameters in such a way it can satisfy the requirements of
the predefined transmission mode. The performance of the proposed MOGA system is
evaluated and validated under the proposed transmission modes. It is shown that the
156
proposed MOGA decision engine is able to search for and find the sub-optimal or the
so-called Pareto-front solutions of transmission solutions within the first 50
evolutionary generations. This convergence speed makes the proposed MOGA
decision engine feasible for such a real-time application. Under RCM, PSM, or SEM
transmission modes, the proposed MOGA engine achieves a MOF score of more than
80%. This MOF score is a considerable achievement since it represents a compromise
between several conflicting objectives. A lower MOF score of more than 60% is
achieved when BLM transmission mode is used due to increased level of contradiction
occurred when weighting coefficients are uniform assigned to the confliction
objectives. Sensitivity analyses have been carried out to prove the effectiveness of the
proposed inclusion of the transmission parameters in the overall multi-objective
performance metric. It was shown that by triggering the MOGA decision engine to
adaptively optimize its transmission parameters, higher MOF values can be scored
than when setting its parameters to static values. Thus, these analyses confirm the
validity of including the proposed transmission parameters as decision variables in the
CR optimization problem. However, more environmental and transmission parameters
can be identified, formulated and optimized by the proposed MOGA decision engine
to improve its cognition capabilities and awareness of the surrounding environment.
6.1.2 MOEAs for CRNs
Three distinct CRN architectures are proposed to resolve the contradiction between
the detection performance and communication overhead in cooperative spectrum
sensing. Chapter IV presents HDF- and SDF-based CRN architectures whereas
Chapter V extends the CRN architectures in Chapter IV to a hybrid SDF-HDF cluster
based one. The motivation of proposing these CRN architectures is to provide choice
diversity of detection performance and communications overhead. The proposed
HDF-based CRN is distinguished by its reduced communication overhead whereas the
other proposed SDF-based CRN show better PU detection performance. This
performance contradiction between HDF- and SDF-based CRN is settled by proposing
a hybrid SDF-HDF cluster based CRN architecture. This hybrid architecture provides
a balanced compromise between the conflicting objectives of maximizing the
detection performance while minimizing the communication overhead. Tradeoff
157
analyses on these two objectives in HDF-, SDF-, hybrid SDF-HDF CRN architectures
are supplied in Chapter IV and V.
For HDF-based CRN architectures, a BOGA-assisted optimization system is
proposed and developed to jointly optimize the sensing time and SU cooperation level
so that the proposed BOF is maximized. The BOF function combines the detection
performance as well as the SU throughput into one single scalar function introduced to
the BOGA system as a fitness function. The performance of the proposed BOGA
system is evaluated and the solutions obtained are further analyzed to prove their sub-
optimality in comparison to other potential settings. The simulation results show an
improvement of 10% on the best achievable BOF score when using the optimal
cooperation level than when using 100% cooperation level as well as an improvement
of 4% when using the optimal sensing time than when setting the sensing period to
half of its total frame duration.
On the other hand, a SOGA-assisted optimization system is proposed and
developed to optimize the detection performance in SDF-based CRNs. The SOGA is
configured to optimize the weighting coefficient of the linear soft fusion process at the
fusion centre of CRN. The solution of weighting coefficients obtained from the
evolutionary processes of SOGA is then used to evaluate the ROC curve of the CRN-
wise detection performance. The proposed SOGA-assisted is compared with other
conventional SDF schemes in the literature such as NDC, MDC, MRC and EGC as
well as the OR-rule HDF scheme. For a given false alarm rate of 0.1, the proposed
SOGA-assisted SDF-based cooperative spectrum sensing scheme achieves an
improvement of more than 10% in the detection performance in comparison to the
best conventional SDF-based scheme (i.e. NDC). Finally, the detection performance
and traffic overhead in HDF- and SDF-based CRNs are discussed based on the
obtained results to support the claim of proposing HDF-based CRN when low traffic
overhead is needed and the SDF-based CRNs for cases where high detection
performance is of interest.
In Chapter IV, the proposed hybrid SDF-HDF cluster-based CRN architecture
is presented. Several performance metrics are proposed to construct the overall multi-
158
objective fitness function of the whole network from the SUs all the way to the central
FC/BS through corresponding CHs. The contradiction between the proposed single
objective functions is first analyzed. The CRN design parameters are then identified
and the single objective functions are aggregated into one overall multi-objective
function after being weighted using appropriate weighting coefficients. The CRN
operational modes associated with distinct settings of the weighting coefficients are
also formulated. A MOGA optimization system is then developed to optimize the
CRN design parameters so that the overall MOF function is maximized. GUISM is
also developed that allow the user to interact with the proposed MOGA optimization
system and observe its convergence performance as well as the returned solutions
after exceeding a predefined number of generations. The obtainable design parameters
under various operational modes are analysed to prove the effectiveness of their
inclusion as adaptive parameters in the design problem. The optimal parameters can
score an average MOF value of 0.883 which is 14.4% greater than the best MOF score
obtained when using the maximum values of the design parameters and 69.3% higher
than the worst MOF score obtained when using the minimum values of the design
parameters. SDF-SDF, HDF-HDF, and SDF-HDF detection performance and traffic
overhead tradeoffs are finally discussed based on the obtained simulation results. The
analyses support the claim of proposing the hybrid SDF-HDF cluster based CRN
architecture for a compromised detection performance and traffic overhead.
In conclusion, all the objectives of this thesis defined in chapter I have been
achieved. Although the proposed MOEAs can successfully realize intelligent cores for
CRs and optimization systems for CRNs of different architectures, there are still
several open problems need to be addressed in order to further extend and improve the
results presented in this thesis. Among the main limitations of this research work is
the lack of knowledge on how a certain CRN with a specific architecture such as an
HDF-based one can be cognitively switched to another hybrid SDF-HDF cluster-
based architecture with least possible change of infrastructure and in a seamless
manner. In fact, further investigation should be carried out on the correlation of the
proposed parameters and their corresponding search spaces. These limitations and
other ones are recommended as a future work in the next section.
159
6.2 FUTURE WORK
This section summarizes some recommendations and potential research directions
suggested as a future work to extend the achievements and improve the results
presented in this thesis. These summaries include the followings:
(i) To facilitate the interoperability and convergence of the proposed different
HDF-, SDF-, and hybrid SDF-HDF CRNs, an interesting research direction
can be found in looking into practical ways of evolvable networks that can
adapt its functionalities and activities using the same infrastructure. For
instance, the idea lies on the technology that can be used to configure a
specific infrastructure to work as SDF- or HDF-based architectures based on
channel conditions or operator/user requirements.
(ii) More design parameters are performance metrics can be included as decision
variables and objective functions, respectively, for CR systems as well as
HDF-, SDF-, and hybrid SDF-HDF CRN architectures.
(iii) In this research, it is assumed that a transmission mode is chosen through
tuning the weighting coefficients assigned to the individual objectives by the
CR user. However, it would be worth to explore the possibility of mapping
these weighting coefficients directly to certain environmental circumstances or
device operating conditions.
(iv) The relaying scheme used by the SUs in this research is the amplify-and-
forward scheme. It would be of interest to explore the possibility of employing
other relaying schemes such as decode-and-forward scheme.
(v) In the proposed hybrid SDF-HDF cluster based CRN architecture, the MOGA
optimization system searches for the optimal modulation index, transmission
power, sensing time, relay time, modulation scheme, and quantization levels
which are shared by all SUs. However, this work can be extended to search for
a distinct set of parameters for each SU. This would definitely improve the
160
overall performance of the network with the penalty of hugely increased
overhead.
(vi) In this research, standard settings of GA parameters have been used in all
proposed MOEA optimization systems. However, commonly, there has been
no rule-of-thumb on the best set of parameters that optimize the convergence
performance of the GA system. The conventional procedure of selecting the
GA parameter for a formulated optimization problem used to be the set-and-
test approach of extensive experiments. This approach requires long time and
unnecessary effort with uncertainty on whether or not the set of parameters
found is the optimal set ever. This work can be extended to consider
employing a hierarchical formalism of two GA layers where the first GA
works to search for the optimal set of parameters that can be then used by the
second GA for the given optimization problem.
(vii) It is also worth to consider other biologically-inspired optimization algorithms
such as particle swarm optimization (PSO), ant colony optimization (ACO), or
artificial bee colony (ABC) algorithm that may show better convergence
performance with possibly lesser number of parameters to be set.
161
REFERENCES
Ahmed, N., Hadaller, D. & Keshav, S. 2006. GUESS: gossiping updates for efficient spectrum sensing. Proceeding of International workshop on Decentralized resource sharing in mobile computing and networking, Los Angeles, California, USA, pp. 12–17.
Akyildiz, I.F. & Li, Y. 2006. OCRA: OFDM-based cognitive radio networks.
Technical Report, Broadband and Wireless Networking Laboratory, Georgia Institute of Technology.
Akyildiz, I.F., Lee, W.-Y., Vuran, M.C. & Mohanty, S. 2006. NeXt
generation/dynamic spectrum access/cognitive radio wireless networks: a survey. Computer Networks 50(13): 2127–2159.
Akyildiz, I.F., Lo, B.F. & Balakrishnan, R. 2011. Cooperative spectrum sensing in
cognitive radio networks: A survey. Physical Communication 4: 40-62. Arslan, H. 2007. Cognitive Radio, Software Defined Radio, and Adaptive Wireless
Systems. Dordrecht: Springer. Bacchus, R.B., Fertner, A.J., Hood, C.S., & Roberson, D.A. 2008. Long-term, wide-
band spectral monitoring in support of dynamic spectrum access networks at the IIT spectrum observatory. Proceedings of the Third IEEE Symposium on New Frontiers in Dynamic Spectrum Access Networks, pp. 1-10.
Bäck, T. 1993. Optimal mutation rates in genetic search. Proceeding of the 5th
International Conference on Genetic Algorithms, San Mates, CA, Morgan Kaufmann, pp. 2–9.
Bazerque, J. & Giannakis, G. 2010. Distributed spectrum sensing for cognitive radio
networks by exploiting sparsity, IEEE Transactions on Signal Processing 58(3): 1847–1862.
Berthold, U. & Jondral, F.K. 2005. Guidelines for designing OFDM overlay systems.
Proceeding of IEEE Internatioanl Symposium of New Frontiers in Dynamic Spectrum Access Networks, Baltimore, MD, USA, 1: 626–629.
Broderson, R.W., Wolisz, A., Cabric, D., Mishra, S.M. and Willkomm, D. 2004.
CORVUS: A cognitive radio approach for usage of virtual unlicensed spectrum. White Paper submitted at the University of Berkeley, CA.
Buddhikot, M.M., Kolody, P., Miller, S., Ryan, K., & Evans, J. 2005. DIMSUMNet:
New directions in wireless networking using coordinated dynamic spectrum access. Proceeding of IEEE International Symposium on a World of Wireless, Mobile and Multimedia Networks (WoWMoM 2005), pp. 78–85.
162
Bӓck, T. 1994. Selective Pressure in Evolutionary Algorithms: a Characterization mechanisms, Proceeding of the first IEEE Conference on Evolutionary Computation, IEEE Press, Piscataway, NJ, pp. 57-62.
Cabric, D., Mishra, S. & Brodersen, R. 2004. Implementation issues in spectrum
sensing for cognitive radios. Proceeding of Asilomar Conference on Signals, Systems, and Computers, 1: 772–776.
Cabric, D., O’Donnell, I.D., Chen, M.S.-W. & Brodersen, R. W. 2006. Spectrum
Sharing Radios. IEEE Circuits and Systems Magazine 6(2): 30-45. Chair, Z. & Varshney, P.K. 1986. Optimal data fusion in multiple sensor detection
systems. IEEE Transaction on Aerospace and Electronic Systems, (22): 98-101.
Chantaraskul S. & Moessner, K. 2010. Implementation of a genetic algorithm-based
decision making framework for opportunistic radio, IET Communications 4(5): 495–506.
Chen, K.-C. & Prasad, R. 2009, Cognitive Radio Networks. Chichester: Wiley. Chen, S. & Wyglinski, A.M. 2009a. Cognitive Radio-Enabled Distributed Cross-
Layer Optimization via Genetic Algorithms. Proceedings of the 4th International Conference on Cognitive Radio Oriented Wireless Networks and Communications (CrownCom).
Chen, S. & Wyglinski, A.M. 2009b. Efficient Spectrum Utilization via Cross-Layer
Optimization in Distributed Cognitive Radio Networks. Computer Communications 32(18): 1931-1943.
Chiang, R., Rowe, G. & Sowerby, K. 2007. A quantitative analysis of spectral
occupancy measurements for cognitive radio. Proceedings of the IEEE Vehicular Technology Conference, pp. 3016-3020.
Chung, J.W. 1994. Utility and Production Functions. Cambridge: Blackwell. Cordeiro, C., Challapali, K., Birru, D. & Shankar, S. 2005. IEEE 802.22: The first
worldwide wireless standard based on cognitive radios. Proceeding of IEEE International Symposium on Dynamic Spectrum Access Networks (DySPAN 2005), pp. 328–337.
Cordeiro, C., Challapali, K., Birru, D. & Shankar, S. 2006. IEEE 802.22: An
introduction to the first wireless standard based on cognitive radios. Journal of Communications 1(1): 38–47.
DARPA XG Working group. 2003a .The XG vision. rfc v1.0. DARPA XG Working group. 2003b. The XG architectural framework. rfc v1.0.
163
DaSilva, L., Midkiff, S., Park, J., Hadjichristofi, G., Davis, N., & Phanse, K. 2004. Network mobility and protocol interoperability in ad hoc networks. IEEE Communication Magazine 42(11): 88–96.
De Baynast, A., Mähönen, P. & Petrova, M. 2008. ARQ-based Cross-layer
Optimization for Wireless Multicarrier Transmission on Cognitive Radio Networks. Computer Communications Elsevier, 52 (4): 778-794.
De Jong, K.A. 1975. Analysis of the Behaviour of a Class of Genetic Adaptive
Systems, Doctoral Dissertation, University of Michigan. Eshelman, L.J., R.A. Caruna, and J.D. Schaffer. 1989. Biases in the crossover
landscape. Prococeeding of 3rd International Conference on Genetic Algorithms. San Mateo, CA: Morgan.
FCC. 2002a. Spectrum Policy Task Force (SPTF). Technical Report 02-135, Federal
Communications Commission. FCC. 2002b. Federal Communications Commission. FCC first report and order:
Revision of part 15 of the commission’s rules regarding ultra-wideband transmission systems. ET Docket No. 98-153.
FCC. 2003. In the Matter of Facilitating Opportunities for Flexible, Efficient, and
Reliable Spectrum Use Employing Cognitive Radio Technologies, Authorization and Use of Software defined Radios. Federal Communication Committee (FCC) NPRM 03-322.
FCC. 2004. Federal Communications Commission. Unlicensed operation in the TV
broadcast bands. ET Docket No. 04-186. FCC. 2006. Federal Communications Commission. First report and order and further
notice of proposed rulemaking in the matter of unlicesed operation in TV broadcast bands. ET Docket No. 04-186.
FCC. 2008. Federal Communications Commission. The FCC’s Office of Engineering
and Technology release report on tests of prototype white space devices. ET Docket No. 04-186.
FCC. 2009. Federal Communications Commission. FCC adopts rules for unlicenesd use of television white space. Official FCC announcement.
Fette, B. 2009. Cognitive radio technology, 2nd edition. Burlington: Academic Press
publications, Elsevier. Fitzek, F.H.P. & Katz, M.D. 2007. Cognitive Wireless Networks. Dordrecht: Springer. Fogarty, T.C. 1989. Varying the probability of mutation in the genetic algorithm.
Proceeding of the 3rd International Conference on Genetic Algorithms. Los Altos, CA: Morgan Kaufmann, pp. 104–109.
164
Ganesan, G. & Li, Y.G. 2005. Cooperative spectrum sensing in cognitive radio networks. Proceeding of IEEE International Symposium on New Frontiers in Dynamic Spectrum Access Networks, Baltimore, Maryland, pp. 137–143.
Ganesan G. & Li, Y.G. 2007. Cooperative Spectrum Sensing in Cognitive Radio, Part
I: Two User Networks. IEEE Transaction on Wireless Communications 6(6): 2204 - 2213.
Gen, M. & Cheng, R. 2000. Genetic Algorithms and Engineering Optimization. New
York: John Wiley & Sons, Inc. Ghasemi, A. & Sousa, E.S. 2005. Collaborative spectrum sensing for opportunistic
access in fading environments. Proceeding of IEEE DySPAN, Baltimore, MD, USA: 131–136.
Goldberg, D.E. 1989. Genetic Algorithms in Search, Optimization and Machine
Learning. Reading, MA: Addison-Wesley. Goldberg, D., Korb, B. & Deb K. 1989. Messy Genetic Algorithms: Motivation,
analysis, and first results, Complex Systems 3: 493-530. Gözüpek, D. & Alagöz, F. 2011. Genetic algorithm-based scheduling in cognitive
radio networks under interference temperature constraints. International Journal of Communication Systems 24(2): 239–257.
Grefenstette, J.J. 1986. Optimization of control parameters for genetic algorithms.
IEEE Transaction on Sys., Man, and Cyber. SMC-16(1): 122-128. Haupt, R.L. & Haupt, S. E. 2004. Practical Genetic Algorithms, Second Edition, John
Wiley & Sons, Inc. Hauris, J.F. 2007. Genetic algorithm optimization in a cognitive radio for autonomous
vehicle communications. Proceedings of the IEEE International Symposium on Computational Intelligence in Robotics and Automation.
Haykin, S. 2005. Cognitive radio: brain-empowered wireless communications. IEEE
Journal on Selected Areas in Communications 23(2): 201–220. Holland, J.H. 1975. Adaption in Natural and Artificial Systems. 1st Edition. Ann
Arbor: University of Michigan Press. Hossain, E. & Bhargava, V.K. 2007. Cognitive Wireless Communication Networks.
New York: Springer. Hossain, E., Niyato, D. & Han, Z. 2009. Dynamic Spectrum Access and Management
in Cognitive Radio Networks. Cambridge: Cambridge University Press.
165
Kim, S.-J., Dall’Anese, E. & Giannakis, G.B. 2009. Sparsity-aware cooperative cognitive radio sensing using channel gain maps. Proceeding of the Forty-Third Asilomar Conference on Signals, Systems and Computers, pp. 518–522.
Kim, S.-J., Dall’Anese, E. & Giannakis, G.B. 2010. Cooperative spectrum sensing for
cognitive radios using kriged kalman filtering, IEEE Journal of Selected Topics in Signal Processing 5(1): 24-36.
Krenik, W. & Batra, A. 2005. Cognitive radio techniques for wide area networks. The 42nd Design Automation Conference, Anaheim, California, USA, pp. 409–412.
Liang, Y.-C., Zeng, Y., Peh, E.C.Y. & Hoang, A.T. 2008. Sensing-Throughput
Tradeoff for Cognitive Radio Networks. IEEE Transactions on Wireless Communications 7(4): 1326-1337.
Lin, C.-Y. & Hajela, P. 1992. Genetic Algorithms in Optimization Problems with
Discrete and Integer Design Variables. Engineering Optimization 19: 309-327. Ma, J. & Li, Y.G. 2007. Soft Combination and Detection for Cooperative Spectrum
Sensing in Cognitive Radio Networks. Proceeding of IEEE Global Communications Conference, pp. 3139-3143.
Mähönen, P., Petrova, M., Riihijarvi, J., & Wellens, M. 2006. Cognitive wireless
networks: Your network just became a teenager (poster). Proceeding of IEEE INFOCOM.
McHenry, M.A. 2005. NSF spectrum occupancy measurements project summary.
Shared Spectrum Company Report. MCMC. 2009. Spectrum Allocations in Malaysia. http://www.skmm.gov.my/link_file/ what_we_do/spectrum/allocation/pdf/Malaysian_Spectrum_Allocations_Chart.pdf
[January 2012]. Melanie, M. 1996. An Introduction to Genetic Algorithms. Cambridge, Massachusetts:
MIT Press. Menon, R., Buehrer, R.M. & Reed, J.H. 2005. Outage probability based comparison
of underlay and overlay spectrum sharing techniques. Proceeding of IEEE Internatioanl Symposium of New Frontiers in Dynamic Spectrum Access Networks, Baltimore, MD, USA, 1: 101–109.
Min, A.W. & Shin, K.G. 2009. An optimal sensing framework based on spatial RSS
profile in cognitive radio networks. Proceeding of IEEE SECON, pp. 1–9. Mishra, S., Sahai, A. & Brodersen, R. 2006. Cooperative sensing among cognitive
radios. Proceeding of IEEE ICC 4: 1658–1663. Mitola III, J. & Maguire, G.Q. 1999. Cognitive radio: Making software radios more
personal. IEEE Personal Communications 6(4): 13-18.
166
Mitola III, J. 2000. Cognitive Radio-An Integrated Agent Architecture for Software Defined Radio. Ph.D. dissertation, Royal Institute of Technology (KTH), Stockholm, Sweden.
Molisch, A.F. 2011. Wireless Communications, 2nd edition. Chichester: John Wiley &
Sons Ltd. Newman, T.R., Rajbanshi, R., Wyglinski, A.M., Evans, J.B., & Minden, G.J. 2007a.
Population adaptation for genetic algorithm-based cognitive radios. IEEE Proceeding of Cognitive Radio Oriented Wireless Networks and Communications Conference, Orlando, FL.
Newman, T.R., Barker, B.A., Wyglinski, A.M., Agah, A., Evans, J.B., & Minden, G.J.
2007b. Cognitive engine implementation for wireless multicarrier transceivers, Wiley Wireless Communications and Mobile Computing, pp. 1129–1142.
Ngo, D.T. 2009. Resource Allocation for OFDMA-Based Multicast Wireless Systems,
M.Sc. Thesis, University of Alberta, Canada. Nickabadi, A., Ebadzadeh, M.M. & Safabakhsh, R. 2011. A novel particle swarm
optimization algorithm with adaptive inertia weight. Applied Soft Computing, Elsevier 11(4): 3658–3670.
Noori, N., Razavizadeh, S.M. & Attar, A. 2010. Joint beamforming and power control
in MIMO cognitive radio networks. IEICE Electronics Express 7(3): 203-208. Ofcom. 2009. Office of Communications. Digital dividend: Cognitive access.
www.ofcom.org.uk/consult/condocs/cognitive. Peh, E. & Liang, Y.-C. 2007. Optimization for Cooperative Sensing in Cognitive
Radio Networks. Proceeding of IEEE Wireless Communications and Networking Conference (WCNC), Hong Kong, 27-32.
Peh, E.C.Y., Liang, Y.-C., Guan, Y.L. & Zeng, Y. 2009. Optimization of Cooperative
Sensing in Cognitive Radio Networks: A Sensing-Throughput Tradeoff View. IEEE Transactions on Vehicular Technology 58(9): 5294-5299.
Petrin, A. 2005. Maximizing the utility of radio spectrum: Broadband spectrum
measurements and occupancy model for use by cognitive radio. PhD thesis, Georgia Institute of Technology, Atlanta, GA, USA.
Qi, C., Wang, J. & Li, S. 2009. Weighted-clustering Cooperative Spectrum Sensing in
Cognitive Radio Context. Proceeding of International Conference on Communications and Mobile Computing 1: 102-106.
Quan, Z., Cui, S. & Sayed, A.H. 2008. Optimal Linear Cooperation for Spectrum
Sensing in Cognitive Radio Networks. IEEE Journal of Selected Topics in Signal Processing (2)1: 28-40.
167
Rieser, C.J. 2004. Biologically inspired cognitive radio engine model utilizing distributed genetic algorithms for secure and robust wireless communications and networking. Ph.D. dissertation, Virginia Tech.
Rieser, C., Rondeau, T., Bostian, C., & Gallagher, T. 2004. Cognitive radio testbed:
Further details and testing of a distributed genetic algorithm based cognitive engine for programmable radios. Proceeding of IEEE Military Communications Conference.
Roberson, D. 2007. Structural support for cognitive radio system deployment.
Proceedings of the Second International Conference on Cognitive Radio-Oriented Wireless Networks and Communications (CrownCom), 401-407.
Roberson, D.A., Hood, C.S., LoCicero, J.L. & MacDonald, J.T. 2006. Spectral
occupancy and interference studies in support of cognitive radio technology deployment. Proceedings of the First IEEE Workshop on Network Technologies for Software-Defined Radio Networks, pp. 26 – 35.
Rondeau, T.W. 2007. Application of Artificial Intelligence to Wireless
Communications, PhD Thesis, Blacksburg, Virginia. Rondeau, T.W., Le, B., Rieser, C.J. & Bostian, C.W. 2004a. Cognitive Radios with
Genetic Algorithms: Intelligent Control of Software Defined Radios,” in Software Defined Radio Forum Technical Conference, Phoenix, AZ, C-3–C-8.
Rondeau, T.W., Rieser, C.J., Gallagher, T.M., & Bostian, C.W. 2004b. Online
modeling of wireless channels with hidden markov models and channel impulse responses for cognitive radios. In IEEE MTT-S Digest.
Roy, S.D., Kundu, S., Ferrari, G. & Raheli, R. 2010. Performance Evaluation of
Cognitive Radio CDMA Networks with Spectrum Sensing. IEEE International Conference on Communications Workshops (ICC), pp. 1-5.
Sahai, A., Hoven, N. & Tandra, R. 2004. Some Fundamental Limits on Cognitive
Radio. Proceeding of Allerton Conference, Monticello, pp. 772-776. Schaffer, J.D., Caruana, R.A., Eshelman, L.J. & Das, R. 1989. A study of control
parameters affecting on-line performance of genetic algorithms for function optimization. Proceeding of 3rd International Conference on Genetic Algorithms and Their Applications. George Mason University, Fairfax, Virginia, 51-61.
Shankar, N.S., Cordeiro, C. & Challapali, K. 2005. Spectrum agile radios: Utilization
and sensing architectures. Proceeding of IEEE Symposium of New Frontiers in Dynamic Spectrum Access Networks, Baltimore, USA, pp. 160–169.
Shen, B. & Kwak, K.S. 2009. Soft Combination Schemes for Cooperative Spectrum
Sensing in Cognitive Radio Networks. ETRI Journal. 31(3): 263-270.
168
Sklar, B. 2001. Digital Communications: Fundamentals and Applications. 2nd Edition. New Jersey: Printce-Hall, Inc.
Sun, C., Zhang, W. & Letaief, K.B. 2007. Cluster-Based Cooperative Spectrum
Sensing in Cognitive Radio Systems. Proceeding of IEEE International Conference on Communications (ICC), pp. 2511-2515.
Syswerda, G. 1989. Unifrom Crossover in Genetic Algorithms, Proceeding on the 3rd
International Conference on Genetic Algorithms, Morgan Kaufmann Publishers, San Francisco, 2-9.
Tang, H. 2005. Some physical layer issues of wide-band cognitive radio systems.
Proceeding of IEEE International Symposium on New Frontiers in Dynamic Spectrum Access Networks, Baltimore, Maryland, 151–159.
Thomas, G.M., Gerth, R., Velasco, T. & Rabelo, L.C. 1995. Using Real-Coded
Genetic Algorithms for Weibull Parameter Estimation. Computers and Industrial Engineering, 29: 377-381.
Throughput Tradeoff for Cognitive Radio Networks. IEEE Transaction on Wireless
Communications 7(4): 1326-1337. Tian Z. & Giannakis, G.B. 2006. A wavelet approach to wideband spectrum sensing
for cognitive radios. Proceeding of International Conference on Cognitive Radio Oriented Wireless Networks and Communications, Greece, 1-5.
Todd, D. 1997. Multiple Criteria Genetic Algorithms in Engineering Design and
Operation. Doctoral Dissertation. University Of Newcastle. Van, H.-V. & Koo, I. 2009. An Optimal Data Fusion Rule in Cluster-Based
Cooperative Spectrum Sensing. Lecture Notes in Computer Science, Springer Berlin Heidelberg, 5755/2009, pp. 708-717.
Varshney, P.K. 1997. Distributed Detection and Data Fusion. New York: Springer-
Verlag. Visotsky, E., Kuffner, S., & Peterson R. 2005. On collaborative detection of TV
transmissions in support of dynamic spectrum sharing. Proceeding of IEEE International Symposium on New Frontiers in Dynamic Spectrum Access Networks, Baltimore, Maryland, 338–345.
Weiss, T. & Jondral, F.K. 2004. Spectrum pooling: An innovative strategy for the
enhancement of spectrum efficiency. IEEE Communication Magazine 43(3): S8–S14.
Whitley, D. 1989. GENITOR: A Different Genetic Algorithm, Proceeding of the
Rpcky Mountain Conference on Artificial Intelligence, Denver.
169
Wright, A.H. 1991. Genetic Algorithms for Real Parameter Optimization. Proceedings of a Workshop on the Foundations of Genetic Algorithms, pp. 205-218.
Wyglinski, A.M., Nekovee, M. & Hou, Y.T. 2010. Cognitive Radio Communications
and Networks: Principles and Practice, Academic Press, Elsevier. Xiao, Y. & Hu, F. Cognitive Radio Networks. Boca Raton, Florida: Auerbach
Publications, Taylor and Francis Group. Xu, L., Tonjes, R., Paila, T., Hansmann, W., Frank, M., & M. Albrecht. 2000.
DRiVE-ing to the internet: Dynamic radio for IP services in vehicular environments. Proceeding of 25th Annual IEEE Conference on Local Computer Networks, pp. 281–289.
Yang, J. 2004. Spatial Channel Characterization for Cognitive Radios. M.Sc. Thesis,
UC Berkeley. Yücek, T. & Arslan, H. 2009. A Survey of Spectrum Sensing Algorithms for
Cognitive Radio Applications, IEEE Communications Surveys & Tutorials 11(1): 116-130.
Zhang, W., Mallik, R.K. & Letaief, K.B. 2008. Cooperative spectrum sensing
optimization in cognitive radio networks. Proceeding of IEEE International Conference of Communications (ICC), pp. 3411–3415.
Zhao, Y., Gaeddert, J., Bae, K.K. & Reed, J.H. 2006. Radio environment map enabled
situation-aware cognitive radio learning algorithms. Proceedings of SDR Technical Conference and Product Exposition.
Zhao, Z., Peng, Z., Zheng, S. & Shang, J. 2009. Cognitive Radio Spectrum Allocation
using Evolutionary Algorithms, IEEE Transactions on Wireless Communications 8(9): 4421-4425.
170
LIST OF PUBLICATIONS
Journal Papers
(1) El-Saleh, A. A., Ismail, M., Viknesh, R., Mark, C. C. & Chan, M. L. 2009.
Particle Swarm Optimization for Mobile Network Design. IEICE Electron. Express 6(17): 1219-1225. (ISI & Scopus indexed).
(2) El-Saleh, A. A., Ismail, M., Ali, M. A. M. & Alnuaimy, A. N. H. 2009. Capacity
Optimization for Local & Cooperative Spectrum Sensing in Cognitive Radio Networks. International Journal of Electronics, Circuits & Systems 3(3): 132-138. (Scopus indexed).
(3) El-Saleh, A. A., Ismail, M., Ali, M. A. M. & Arka, I. H. 2010. Hybrid SDF-HDF
Cluster-Based Fusion Scheme for Cooperative Spectrum Sensing in Cognitive Radio Networks. The KSII Transactions on Internet & Information Systems (TIIS) 4(6): 1023-1041. (ISI & Scopus indexed).
(4) El-Saleh, A. A., Ismail, M., Ali, M. A. M., Kamarudin, M. R. & Rahman, T. A.
2011. Analytical Simulation & Performance Optimization for Spectrum Sensing in Cognitive Radio Networks. International Journal on Computer Science & Engineering (IJCSE) 3(2): 554-568. (Indexed by Google Scholar, Scirus, DOAJ, and others).
(5) El-Saleh, A. A., Ismail, M. & Ali, M. A. M. 2011. Genetic algorithm-assisted soft
fusion-based linear cooperative spectrum sensing. IEICE Electron. Express 8(18): 1527-1533. (ISI & Scopus indexed).
(6) Akbari, M., Manesh, M. R., El-Saleh A. A., & Ismail, M. 2012. Improved soft fusion-based cooperative spectrum sensing using particle swarm optimization, IEICE Electron. Express, Accepted. (ISI & Scopus indexed).
Proceeding Papers
(7) El-Saleh, A. A., Ismail, M., Ghafoor, O. B. A. & Ibrahim, A. H. 2008. Comparison between Overlay Cognitive Radio & Underlay Cognitive Ultra Wideb& Radio for Wireless Communications. Proceedings of the Fifth IASTED International Conference on Communication Systems & Networks (AsiaCSN 2008), pp. 41-45, Langkawi, Malaysia.
(8) El-Saleh, A. A., Ismail, M., & Ali, M. A. M. 2009. Optimizing Spectrum Sensing
Parameters for Local & Cooperative Cognitive Radios. Proceedings of the 11th International Conference on Advanced Communication Technology (ICACT-2009), pp. 1810-1815, Phoenix Park, Korea.
171
(9) El-Saleh, A. A., Ismail, M., Ali, M. A. M. & Alnuaimy, A. N. H. 2009. Capacity
Optimization for Local & Cooperative Spectrum Sensing in Cognitive Radio Networks. Proceedings of the International Conference on Communication Technology (ICCT-2009) 38: 69-75, Penang, Malaysia.
(10) El-Saleh, A. A., Ismail, M., Ali, M. A. M. & Al-kebsi, I. I. 2009. Capacity
Enhancement & Interference Reduction in Cooperative Cognitive Radio Networks. Proceedings of the International Conference on Future Computer & Communication (ICFCC-2009), pp. 145-149, Kuala Lumpur, Malaysia.
(11) El-Saleh, A. A., Ismail, M., Ali, M. A. M. & Ng, J. 2009. Development of a
Cognitive Radio Decision Engine using Multi-Objective Hybrid Genetic Algorithm. Proceedings of the 2009 IEEE 9th Malaysia International Conference on Communications (MICC 2009), pp. 453-457, Kuala Lumpur, Malaysia.
(12) El-Saleh, A. A., Ismail, M., & Ali, M. A. M. 2010. Pragmatic Trellis Coded Modulation for Adaptive Multi-Objective Genetic Algorithm-Based Cognitive Radio Systems. Proceeding of the 16th Asia-Pacific Conference on Communication (APCC 2010), pp. 480-485, Auckl&, New Zealand.
(13) El-Saleh, A. A., Ismail, M., Ali, M. A. M., Kamarudin, M. R. & Rahman, T. A.
2010. Adaptive Optimization for Spectrum Sensing in Cognitive Radio Networks. Proceeding of the 2010 International Conference on Intelligent Network & Computing (ICINC 2010), pp. 220-224, Kuala Lumpur, Malaysia.
(14) El-Saleh, A. A., Ismail, M., Ali, M. A. M., & Singh, M. 2011. Reliability-
Resources Tradeoffs in Cluster-Based Cooperative Spectrum Sensing. Proceeding of the 17th Asia-Pacific Conference on Communication (APCC 2011), pp. 360-365, Kota Kinabalu, Sabah, Malaysia.
(15) El-Saleh, A. A., Ismail, M., Ali, M. A. M., & Hossain, M. K. 2011. Biologically-
inspired Soft Fusion Scheme for Cooperative Spectrum Sensing in Cognitive Radio Networks. Proceedings of the 7th International Conference on Information Technology & Application (ICITA 2011), pp. 239-244, Sydney, Australia.
(16) Hossain, M. K., El-Saleh, A. A. & Ismail. M. 2011. A Comparison Between
Binary & Continuous Genetic Algorithm for Collaborative Spectrum Optimization in Cognitive Radio Network. Proceedings of the 9th IEEE Student Conference on Research & Development (SCOReD 2011), pp. 145-150, Cyberjaya, Malaysia.
(17) El-Saleh, A. A., Ismail, M., Akbari, M., Manesh, M. R. & Zavareh, S. A. R. T. 2012. Minimizing the Detection Error of Cognitive Radio Networks Using Particle Swarm Optimization. Proceedings of the 4th International Conference on Computer and Communication Engineering (ICCCE 2012), Kuala Lumpur, Malaysia. (Accepted).
172
Other Presentations/Workshops/Seminars
(18) El-Saleh, A. A. 2010. Optimization Strategies for Spectrum Sensing in Cognitive Radio Networks”, MMU Engineering Research Colloquium 2010 (MERC2010), Multimedia University, Cyberjaya, Malaysia.
(19) El-Saleh, A. A. 2011 .A Study on Soft & Hard Decision Fusion Schemes for
Cluster-Based Cooperative Spectrum Sensing in Cognitive Radio Networks. MMU Engineering Research Colloquium & Exhibition 2011 (MERCE2011), Multimedia University, Cyberjaya, Malaysia.