Embed Size (px)
Citation preview
MULTI-FAMILY RESIDENTIAL PROPERTY
REPOSITORY AND INVESTMENT ANALYSIS
by
Brian Wojcik
A practicum thesis submitted to Johns Hopkins University in conformity with the
requirements for the degree of Master of Science in Real Estate.
Baltimore, Maryland May, 2012
© 2011 Brian Wojcik
All Rights Reserved
2 | P a g e
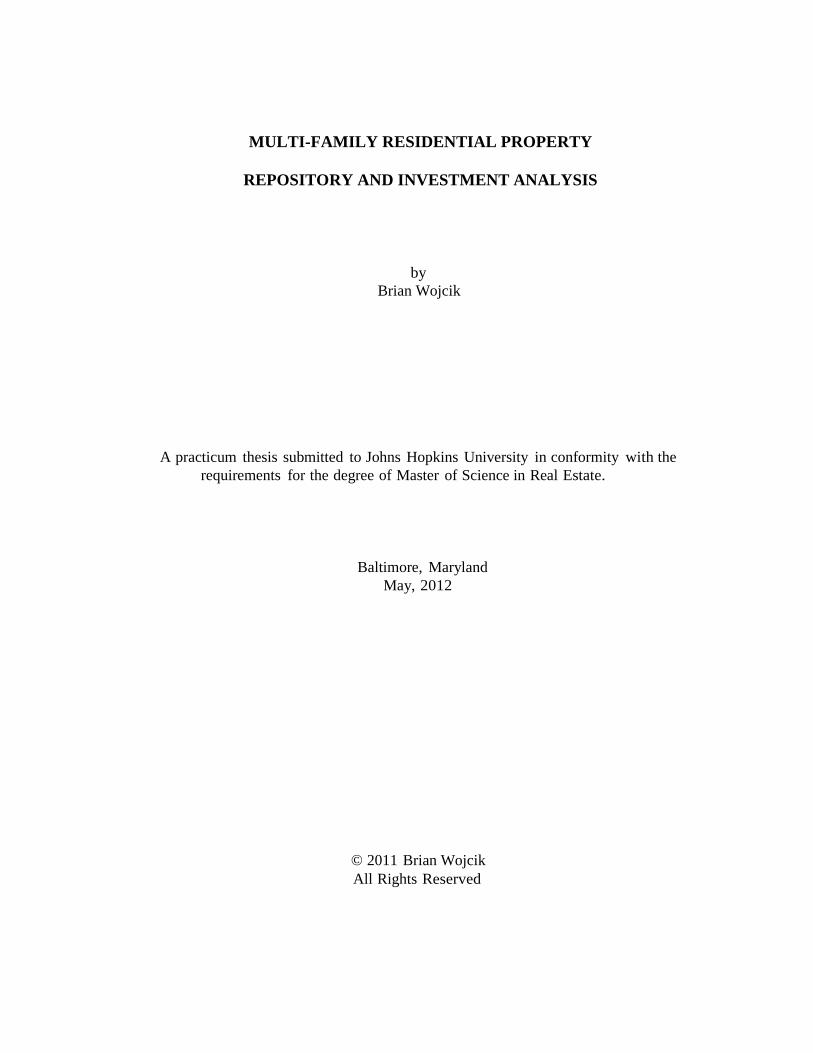
CONTENTS Executive Summary ............................................................................................................................. 4
Repository Assessment ....................................................................................................................... 7
Refinance Financial Analysis – Summary ......................................................................................... 8
Investment Summary .......................................................................................................................... 9
Investment Highlights - Leveraged ................................................................................................ 10
Strengths & Weaknesses ............................................................................................................... 12
Timeline Summary ......................................................................................................................... 12
Property Overview ............................................................................................................................ 13
Background and History................................................................................................................. 13
History of Expenses ........................................................................................................................ 15
Historical Timeline Snapshot ......................................................................................................... 16
Highlights ....................................................................................................................................... 17
Exterior Photographs & Site Plan .................................................................................................. 21
Market Analysis ................................................................................................................................. 23
Baltimore Neighborhood Map Views ............................................................................................ 23
Comparable Rents.......................................................................................................................... 24
Rent Growth and Vacancy Trends ................................................................................................. 25
Economic & Demographic Trends ................................................................................................. 25
Competition and Comparable Properties ...................................................................................... 27
Renovation Overview ........................................................................................................................ 33
Project Timeline ............................................................................................................................. 33
Value-Add Strategy ........................................................................................................................ 33
Capital Project Improvement Strategy .......................................................................................... 35
Investment - Financial Analysis ......................................................................................................... 36
Financial Analysis – Equity Analysis and Waterfall ........................................................................ 38
General Assumptions and Inputs ................................................................................................... 41
Market Leasing and Financial Assumptions – As Complete .......................................................... 42
Sources & Uses .............................................................................................................................. 43
Renovation Budget ........................................................................................................................ 44
Government Support for Project ................................................................................................... 45
Business, Property and Asset Management Plan .............................................................................. 45
Conclusion ......................................................................................................................................... 46
Appendices ........................................................................................................................................ 47
Interior Photographs...................................................................................................................... 47
3 | P a g e
Rent Roll ......................................................................................................................................... 49
Cash Flow (As-Is) ............................................................................................................................ 50
Cash Flow (As-Complete) Expected Case ...................................................................................... 51
Refinance - Financial Analysis ............................................................................................................ 52
Refinance Financial Analysis – Summary ....................................................................................... 52
Refinance General Assumptions and Inputs .................................................................................. 52
Refinance Market Leasing Assumptions – As Is ............................................................................. 53
Refinance Market Leasing and Financial Assumptions – As Complete ......................................... 54
Refinance – Sources & Uses ........................................................................................................... 56
Refinance – Renovation Budget .................................................................................................... 57
Refinance – Columbia Bank Sizing Report ..................................................................................... 58
Bibliography ....................................................................................................................................... 59
4 | P a g e
EXECUTIVE SUMMARY
The following repository and investment analysis for Tiffany Monterey Associates LP (Tiffany)
evaluates the exit strategy options for the ownership of a 36 unit garden style Class C apartment
complex in a Class B neighborhood located in in North East Baltimore at Ednor Gardens-Lakeside
community near Lake Montebello in Baltimore City, MD. They are at a decision point to either sell as it
is, or to capitalize the property and sell after increasing the value. This analysis tests the efficacy of
repositioning given the financial climate and the ownership circumstance. It then provides an exit
strategy option resulting from an in depth investment analysis from the buyer side perspective.
The property is conveniently located at the junction of Loch Raven Blvd and The Alameda. Four
different bus route stops are within a few blocks of the complex that provide access to the inner
harbor to Bayview and Hopkins Hospitals, which is ideal for the city resident commuter and a primary
selling point with new renters. It also boasts open floor plans that are larger than surrounding
communities. It has large bedrooms and closets that were uncommon during the time of construction
in 1960 – therefore this apartment community is not at immediate risk of becoming functionally
obsolescent.
Tiffany is operating at a $25,000 loss per year. The loss is the result of deferred maintenance and
correlates with the cost of turnover vacancy. Deferred maintenance has kept rent trailing market rent
that has driven down the property value and increased cost basis. Several long term residents moved
to purchase a home, leaving apartments that have had no upgrades or improvements in 10-15 years.
The expense of these turnovers represents 4-6 months of equivalent rent, and Tiffany does not have
substantial reserves to fund extensive turnovers (estimated at ~$4,500 vs. ~$1,500). Paying for these
turnovers through free cash flow takes 150 days, which represent a significant absorption and turnover
vacancy loss. Turnovers (painting, hardware replacement, kitchen floor replacement, tub resurfacing
and bath wall lining) are being financed through cash flow and purchased on credit which is accruing
debt. Each turnover takes about 5 months to complete due to owner financial constraints. Neither the
property nor the ownership has cash reserves to make improvements. The ownership has the following
choices:
1. Do nothing; spend less on maintenance, operate at break even.
2. Dispose; sell as is where is.
5 | P a g e
3. Reposition and hold; refinance existing debt service, get a renovation loan for
improvements, and increase value through increased NOI and reduced expenses.
4. Reposition and sell; Utilize funding to make repairs, increase value and equity position, and
assist a willing investor with seller financing options.
The market area supports increased rents if the property provides an improved product. The
former model was rented for $200 above average rent in early 2011. It yielded a $125 rental rate
premium with the minor kitchen and bath upgrades. The property stabilized in August 2010 at 92%
occupancy with 15 percent increase in average rent over previous years. Average rents are currently
$683 per month, or about $0.74 per sf. It reached 100% occupancy in May 2011 with a long term and
stable tenant base. No occupants are subsidized. During this period, the property experienced healthy
cash flows which paid down debt incurred for previously mentioned repairs and maintenance. The
mean rent in the market area is $855.63 and the price per square foot for a two bedroom apartment is
$1.05 per sf. Similar two bedroom units rent from $1,005 with 959 sf as compared to Tiffany with 900
sf with projected average rent of $783 for a two bedroom unit.
Opportunity to significantly increase NOI is accomplished through: 1.) Decreased turnover time
from 150 days to 10 days, 2.) Cosmetic repairs to buildings/common areas, and exterior curb appeal
enhancements which allow for increased (market rate) rents, 3.) Capital investment, utility and
operational maintenance expense reduction, 4.) Rent growth through interior upgrades, and 5.) Install
fixtures and complete the finishes to the remaining four one-bedroom units not currently rentable.
As an investment, from the buyer’s perspective the “as is” adjusted value based on a direct
capitalization method is $837,256 using a 10 percent Cap rate. This is the purchase price used for each
scenario in the analysis. The variables for “Best Case” are a ten percent increase in rent above
expected and a ten percent reduction in renovation costs from expected. The variables for “Worst
Case” are the inverse of “Best Case.” A sensitivity analysis in the Investment Summary section shows
detailed levered returns for best and worst case scenarios.
6 | P a g e
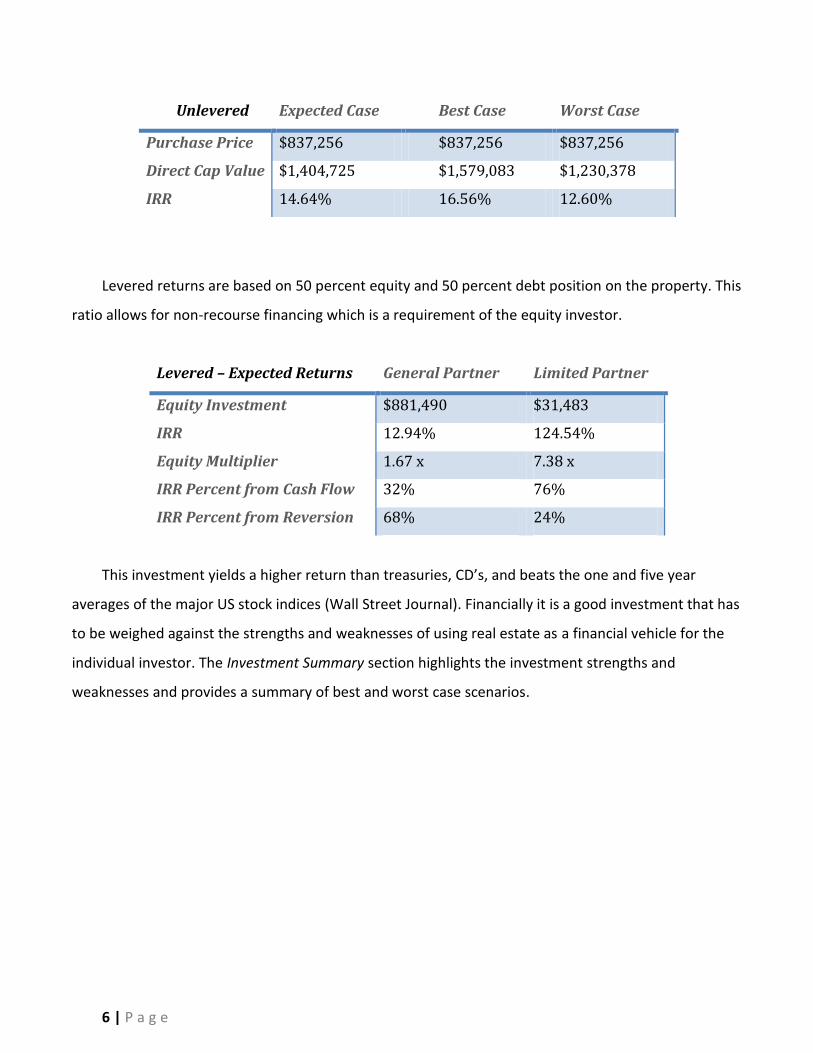
Unlevered Expected Case Best Case Worst Case
Purchase Price $837,256 $837,256 $837,256
Direct Cap Value $1,404,725 $1,579,083 $1,230,378
IRR 14.64% 16.56% 12.60%
Levered returns are based on 50 percent equity and 50 percent debt position on the property. This
ratio allows for non-recourse financing which is a requirement of the equity investor.
Levered – Expected Returns General Partner Limited Partner
Equity Investment $881,490 $31,483
IRR 12.94% 124.54%
Equity Multiplier 1.67 x 7.38 x
IRR Percent from Cash Flow 32% 76%
IRR Percent from Reversion 68% 24%
This investment yields a higher return than treasuries, CD’s, and beats the one and five year
averages of the major US stock indices (Wall Street Journal). Financially it is a good investment that has
to be weighed against the strengths and weaknesses of using real estate as a financial vehicle for the
individual investor. The Investment Summary section highlights the investment strengths and
weaknesses and provides a summary of best and worst case scenarios.
7 | P a g e
REPOSITORY ASSESSMENT
There are four factors affecting the ownership to sell or to reposition the property.
1. Tiffany is operating at a loss and has no working capital, and the ownership has no capital.
2. One sibling in the ownership recently died, leaving his spouse without income. The balance of
ownership is financially concerned for her welfare and would like her to benefit from a sale.
3. 16 financial institutions have been contacted with a pitch package to rewrite the existing note
(which has a balloon payment due in June 2013), and receive renovation funds to make
improvements on the property; all 16 have declined to lend on a 100 percent income producing
property. The current debt holder Columbia Bank is giving it consideration due to a solid
payment history. However, the decision making is by committee and now places a strong
emphasis on global cash flow.
4. Operating losses on other properties among the current ownership contribute to a negative
global cash flow.
The current ownership will be forced to sell if the existing loan application with the current lender
is not approved as a result of the four factors mentioned above. If the loan application is approved,
one consideration is the ownership reposition the property for sale within two years to possibly benefit
from increased value. With this strategy, they may benefit from increased value and equity in the
property. However, they’ll also be incurring the additional risk from the increased debt load and
unknown global financial circumstances. This decision has to be balanced with their desire to exit the
real estate business.
If forced to sell without repositioning the property, a recommended list price is $1,175,588. This
price is derived from an eight percent Cap rate on NOI ($94,047) before preparation and leasing costs.
The ownership will benefit from current market compressed Cap rates. Currently, the ownership has
accrued ~$700k in debt against the property (includes existing mortgage). Any difference between this
number and the sale price is potential equity. Favorable returns for a potential buyer are achievable if
the property were to settle at a nine or ten percent Cap rate, while providing the ownership with
sufficient income to pay debt and have some remaining equity. Detail can be found in the Investment –
Financial Analysis section.
Analysis of the four external factors stated above is outside the scope of this document. The
efficacy of refinancing the current note is shown in the following summary. The summary below uses
8 | P a g e
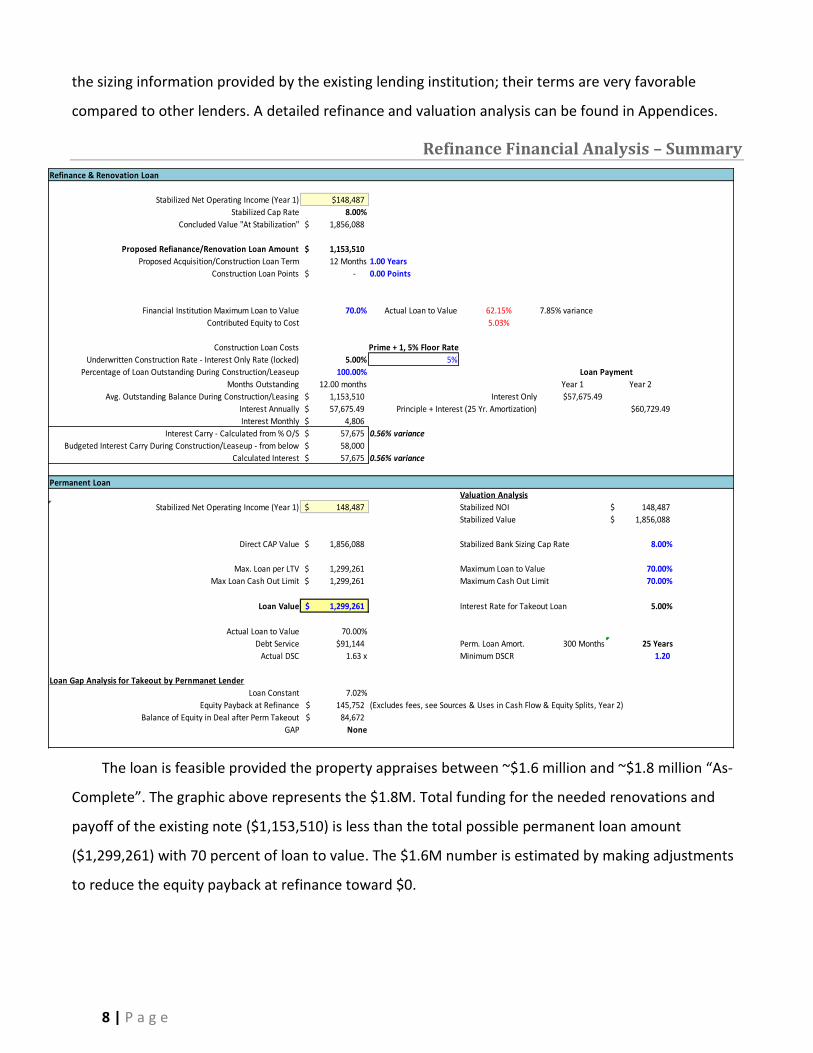
the sizing information provided by the existing lending institution; their terms are very favorable
compared to other lenders. A detailed refinance and valuation analysis can be found in Appendices.
Refinance Financial Analysis – Summary
Refinance & Renovation Loan
Stabilized Net Operating Income (Year 1) $148,487
Stabilized Cap Rate 8.00%
Concluded Value "At Stabilization" 1,856,088$
Proposed Refianance/Renovation Loan Amount 1,153,510$
Proposed Acquisition/Construction Loan Term 12 Months 1.00 Years
Construction Loan Points -$ 0.00 Points
Financial Institution Maximum Loan to Value 70.0% Actual Loan to Value 62.15% 7.85% variance
Contributed Equity to Cost 5.03%
Construction Loan Costs Prime + 1, 5% Floor Rate
Underwritten Construction Rate - Interest Only Rate (locked) 5.00% 5%
Percentage of Loan Outstanding During Construction/Leaseup 100.00% Loan Payment
Months Outstanding 12.00 months Year 1 Year 2
Avg. Outstanding Balance During Construction/Leasing 1,153,510$ Interest Only $57,675.49
Interest Annually 57,675.49$ Principle + Interest (25 Yr. Amortization) $60,729.49
Interest Monthly 4,806$
Interest Carry - Calculated from % O/S 57,675$ 0.56% variance
Budgeted Interest Carry During Construction/Leaseup - from below 58,000$
Calculated Interest 57,675$ 0.56% variance
Permanent Loan
Valuation Analysis
Stabilized Net Operating Income (Year 1) 148,487$ Stabilized NOI 148,487$
Stabilized Value 1,856,088$
Direct CAP Value 1,856,088$ Stabilized Bank Sizing Cap Rate 8.00%
Max. Loan per LTV 1,299,261$ Maximum Loan to Value 70.00%
Max Loan Cash Out Limit 1,299,261$ Maximum Cash Out Limit 70.00%
Loan Value 1,299,261$ Interest Rate for Takeout Loan 5.00%
Actual Loan to Value 70.00%
Debt Service $91,144 Perm. Loan Amort. 300 Months 25 Years
Actual DSC 1.63 x Minimum DSCR 1.20
Loan Gap Analysis for Takeout by Pernmanet Lender
Loan Constant 7.02%
Equity Payback at Refinance 145,752$ (Excludes fees, see Sources & Uses in Cash Flow & Equity Splits, Year 2)
Balance of Equity in Deal after Perm Takeout 84,672$
GAP None
The loan is feasible provided the property appraises between ~$1.6 million and ~$1.8 million “As-
Complete”. The graphic above represents the $1.8M. Total funding for the needed renovations and
payoff of the existing note ($1,153,510) is less than the total possible permanent loan amount
($1,299,261) with 70 percent of loan to value. The $1.6M number is estimated by making adjustments
to reduce the equity payback at refinance toward $0.
9 | P a g e
If approved, the ownership must balance the risk of the increased debt load against the marginal
gains. It may be best for the ownership to accept a small deferred premium and offer owner financing,
sell the property “As-Is” and place the burden of financial risks to a new buyer.
INVESTMENT SUMMARY
This section determines the maximum purchase price threshold in order to achieve the
investment objective. It also summarizes best and worst case scenarios with investment strengths and
weaknesses. Lastly, a timeline provides a summary of the project plan and exit. Sources and uses,
inputs, and assumptions are found in a later section entitled Investment – Financial Analysis.
The investment has a five year horizon, with a reversion occurring on the last day of the fifth year.
The analysis has a specific investment partner who seeks non-recourse debt financing. The equity
requirement from the lender for non-recourse debt is a minimum 50 percent of stabilized value. The
equity investor has an eight percent preferred return, a 40 percent promote, and 50 percent
distribution from a reversion, all with a minimum required return of 10 percent over the life of the
investment. In this analysis, the Equity investor is the Limited Partner, and the Managing Member is
the General Partner.
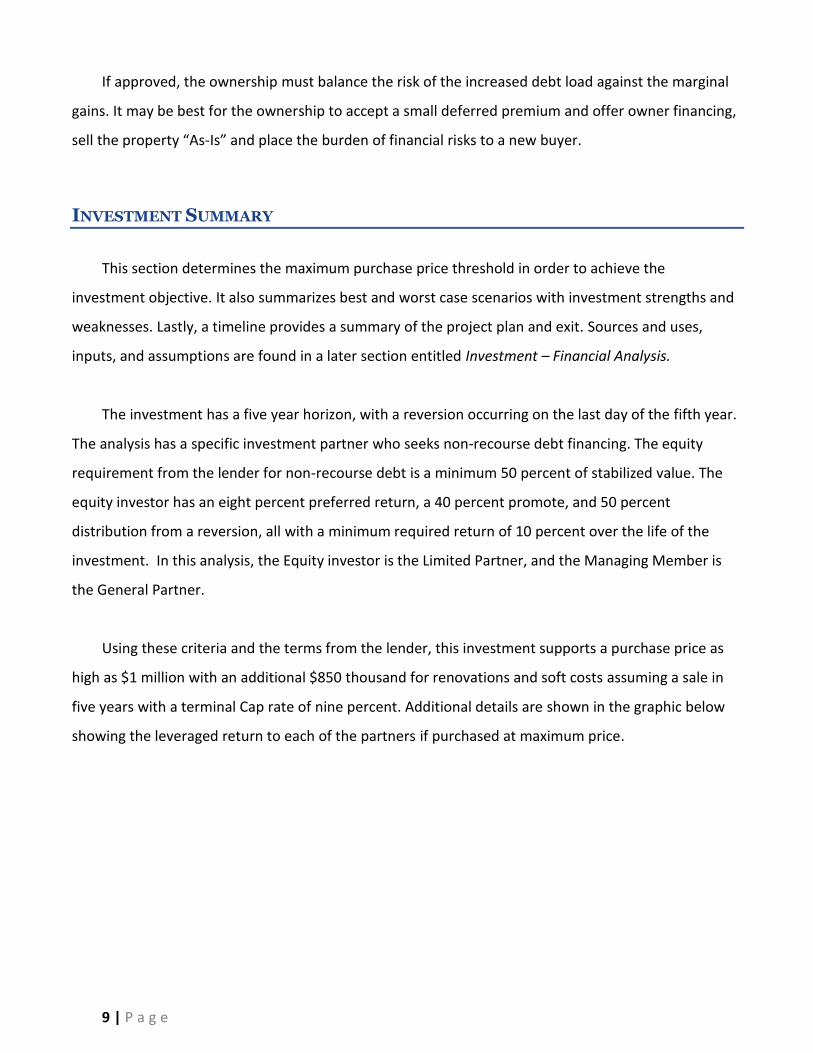
Using these criteria and the terms from the lender, this investment supports a purchase price as
high as $1 million with an additional $850 thousand for renovations and soft costs assuming a sale in
five years with a terminal Cap rate of nine percent. Additional details are shown in the graphic below
showing the leveraged return to each of the partners if purchased at maximum price.
10 | P a g e
Maximum Purchase Price Threshold
LIMITED PARTNER RETURNS OVER HOLDING PERIOD
IRR Cash Out Year 1 Year 2 Year 3 Year 4 Year 5
9.99% ($1,038,001) $93,600 $123,063 $92,827 $93,873 $1,154,575
Equity Multiplier 1.50 X EQUITY PLUS REFINANCE EQUITY PLUS REVERSION
IRR Percent from Cash Flow 32%
IRR Percent from Reversion 68%
GENERAL PARTNER RETURNS OVER HOLDING PERIOD
IRR Cash Out Year 1 Year 2 Year 3 Year 4 Year 5
82.14% ($31,483) $15,840 $60,034 $14,680 $16,250 $15,750
Equity Multiplier 3.89 X EQUITY PLUS REFINANCE EQUITY PLUS REVERSION
IRR Percent from Cash Flow 100%
IRR Percent from Reversion 0%
All cash from the reversion is provided to the Limited Partner to meet their investment objective.
Investment Highlights - Leveraged
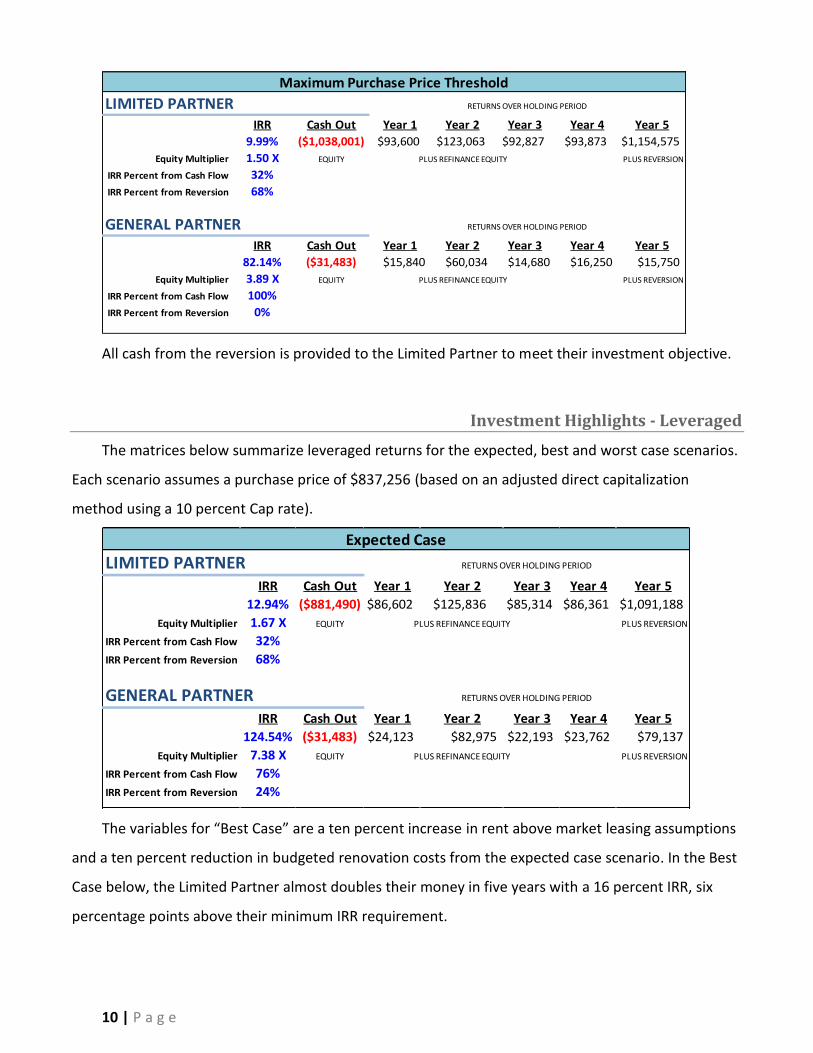
The matrices below summarize leveraged returns for the expected, best and worst case scenarios.
Each scenario assumes a purchase price of $837,256 (based on an adjusted direct capitalization
method using a 10 percent Cap rate).
Expected Case Calculated from Model
LIMITED PARTNER RETURNS OVER HOLDING PERIOD
IRR Cash Out Year 1 Year 2 Year 3 Year 4 Year 5
12.94% ($881,490) $86,602 $125,836 $85,314 $86,361 $1,091,188
Equity Multiplier 1.67 X EQUITY PLUS REFINANCE EQUITY PLUS REVERSION
IRR Percent from Cash Flow 32%
IRR Percent from Reversion 68%
GENERAL PARTNER RETURNS OVER HOLDING PERIOD
IRR Cash Out Year 1 Year 2 Year 3 Year 4 Year 5
124.54% ($31,483) $24,123 $82,975 $22,193 $23,762 $79,137
Equity Multiplier 7.38 X EQUITY PLUS REFINANCE EQUITY PLUS REVERSION
IRR Percent from Cash Flow 76%
IRR Percent from Reversion 24%
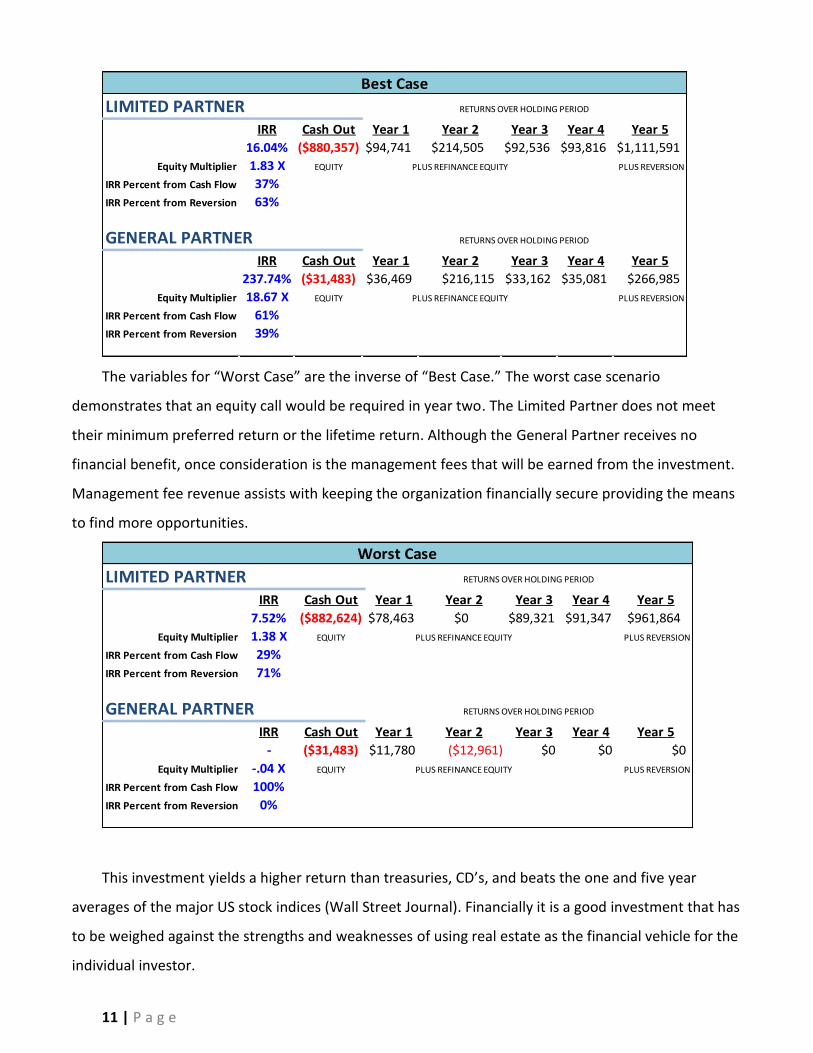
The variables for “Best Case” are a ten percent increase in rent above market leasing assumptions
and a ten percent reduction in budgeted renovation costs from the expected case scenario. In the Best
Case below, the Limited Partner almost doubles their money in five years with a 16 percent IRR, six
percentage points above their minimum IRR requirement.
11 | P a g e
Best Case Maximum Purchase Price Threshold
LIMITED PARTNER RETURNS OVER HOLDING PERIOD
IRR Cash Out Year 1 Year 2 Year 3 Year 4 Year 5
16.04% ($880,357) $94,741 $214,505 $92,536 $93,816 $1,111,591
Equity Multiplier 1.83 X EQUITY PLUS REFINANCE EQUITY PLUS REVERSION
IRR Percent from Cash Flow 37%
IRR Percent from Reversion 63%
GENERAL PARTNER RETURNS OVER HOLDING PERIOD
IRR Cash Out Year 1 Year 2 Year 3 Year 4 Year 5
237.74% ($31,483) $36,469 $216,115 $33,162 $35,081 $266,985
Equity Multiplier 18.67 X EQUITY PLUS REFINANCE EQUITY PLUS REVERSION
IRR Percent from Cash Flow 61%
IRR Percent from Reversion 39%
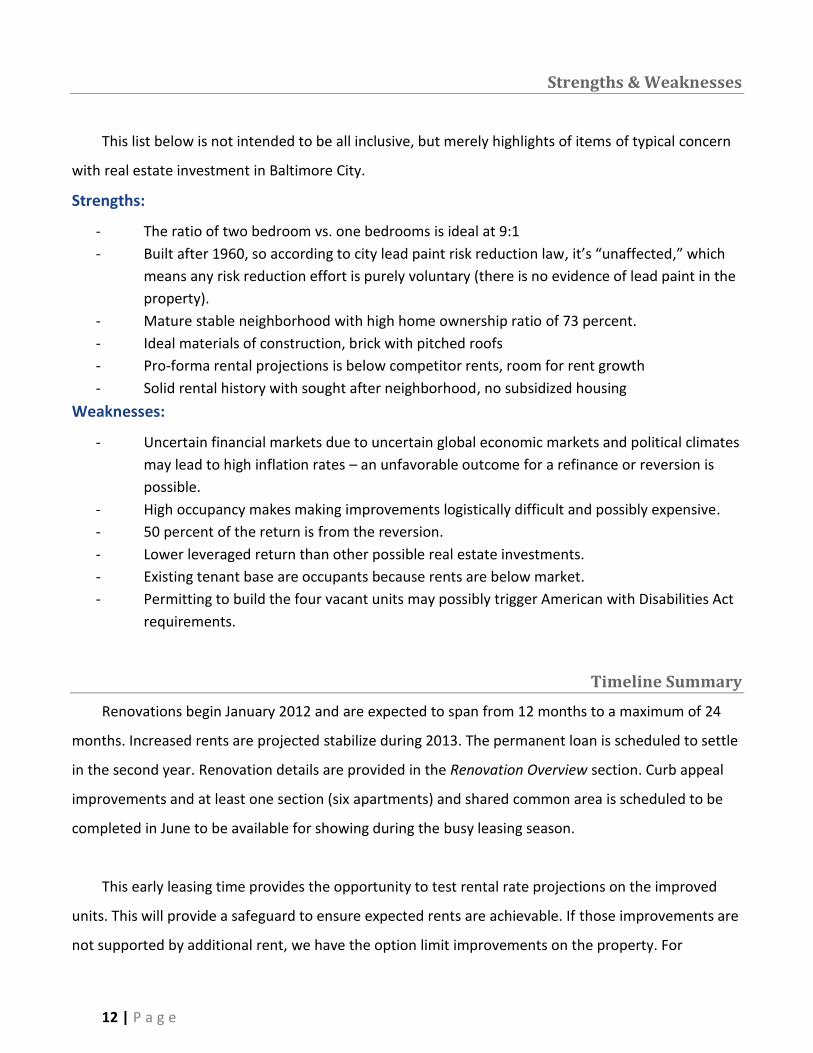
The variables for “Worst Case” are the inverse of “Best Case.” The worst case scenario
demonstrates that an equity call would be required in year two. The Limited Partner does not meet
their minimum preferred return or the lifetime return. Although the General Partner receives no
financial benefit, once consideration is the management fees that will be earned from the investment.
Management fee revenue assists with keeping the organization financially secure providing the means
to find more opportunities.
Worst Case
LIMITED PARTNER RETURNS OVER HOLDING PERIOD
IRR Cash Out Year 1 Year 2 Year 3 Year 4 Year 5
7.52% ($882,624) $78,463 $0 $89,321 $91,347 $961,864
Equity Multiplier 1.38 X EQUITY PLUS REFINANCE EQUITY PLUS REVERSION
IRR Percent from Cash Flow 29%
IRR Percent from Reversion 71%
GENERAL PARTNER RETURNS OVER HOLDING PERIOD
IRR Cash Out Year 1 Year 2 Year 3 Year 4 Year 5
- ($31,483) $11,780 ($12,961) $0 $0 $0
Equity Multiplier -.04 X EQUITY PLUS REFINANCE EQUITY PLUS REVERSION
IRR Percent from Cash Flow 100%
IRR Percent from Reversion 0%
This investment yields a higher return than treasuries, CD’s, and beats the one and five year
averages of the major US stock indices (Wall Street Journal). Financially it is a good investment that has
to be weighed against the strengths and weaknesses of using real estate as the financial vehicle for the
individual investor.
12 | P a g e
Strengths & Weaknesses
This list below is not intended to be all inclusive, but merely highlights of items of typical concern
with real estate investment in Baltimore City.
Strengths:
- The ratio of two bedroom vs. one bedrooms is ideal at 9:1
- Built after 1960, so according to city lead paint risk reduction law, it’s “unaffected,” which
means any risk reduction effort is purely voluntary (there is no evidence of lead paint in the
property).
- Mature stable neighborhood with high home ownership ratio of 73 percent.
- Ideal materials of construction, brick with pitched roofs
- Pro-forma rental projections is below competitor rents, room for rent growth
- Solid rental history with sought after neighborhood, no subsidized housing
Weaknesses:
- Uncertain financial markets due to uncertain global economic markets and political climates
may lead to high inflation rates – an unfavorable outcome for a refinance or reversion is
possible.
- High occupancy makes making improvements logistically difficult and possibly expensive.
- 50 percent of the return is from the reversion.
- Lower leveraged return than other possible real estate investments.
- Existing tenant base are occupants because rents are below market.
- Permitting to build the four vacant units may possibly trigger American with Disabilities Act
requirements.
Timeline Summary
Renovations begin January 2012 and are expected to span from 12 months to a maximum of 24
months. Increased rents are projected stabilize during 2013. The permanent loan is scheduled to settle
in the second year. Renovation details are provided in the Renovation Overview section. Curb appeal
improvements and at least one section (six apartments) and shared common area is scheduled to be
completed in June to be available for showing during the busy leasing season.
This early leasing time provides the opportunity to test rental rate projections on the improved
units. This will provide a safeguard to ensure expected rents are achievable. If those improvements are
not supported by additional rent, we have the option limit improvements on the property. For
13 | P a g e
example, if rents do not support the breakfast bar installation, it will be removed from the scope of
improvements.
PROPERTY OVERVIEW
Background and History
The Property has been family owned since 1989. It was operated by the late Emmanuel Kalathas
until 2005. Historically he ran it at 100% occupancy at less than market rent. His objective was to
maintain 100% occupancy and develop a loyal resident base, at below market rent. He was a hands-on
manager who personally collected rent door to door, month to month. The property has since
benefited from many long term tenants who take care of the place they call home. Unfortunately,
these units have not been updated or refreshed since occupancy. Roughly 50% of the tenant base has
been in the units longer than 10 years, several of them longer than 15 years. After the passing of
Emmanuel in 2005, the property then was managed from 2006-2007 by the heirs, with Nicholas
Kalathas serving as Managing Partner between the three sibling partners.
During 2005 through 2007, Nicholas Kalathas ran operations while doing consulting work and
working at the Navy, the other two sibling partners assisted. After some time, it was realized more
attention was needed on the property. Nicholas Kalathas was selected for a high level appointment in
the Navy, and knew appropriate time wouldn’t be devoted to efficiently run Tiffany. In 2008, after
several interviews, they decided to hire The Signature Group as their property management company.
Signature Group had an interest to profit from the sale of the properties. At first they appeared to
be doing the right things. They were helping sell off other portfolio properties, and were filling the few
vacancies that remained at Tiffany. In time, patterns emerged with certain losses in revenue, and then
extraordinary expenses developed. They filled vacancies with bad tenants to make the property look
full, with a goal to increase the sale price. The tenants they placed weren’t paying rent, and caused
extraordinary amounts of damage to the property. Signature Group withheld about $40K of rents and
numerous security deposits as they coasted into Chapter 11 bankruptcy. All of the Signature Group
placed tenants have either moved or been evicted, each owing anywhere from $1K-$6K each; all
unrecoverable losses.
14 | P a g e
In July 2009, Tiffany hired Wojo Realty Group., operated by, Brian Wojcik. Occupancy was at 67
percent. Vacant units were in need of significant repair. It was a hostile takeover. There were no
accurate rent rolls, no keys, no maintenance records, and volumes of promised work to residents that
was never completed. Phase one was triage to stabilize the property. Rent was discounted in July 2009
by $100 per resident as a show of good faith and intention to ensure rents were sent to the ownership,
and not Signature. Without records, it was unknown who was behind in rent – resulting in a loss of
revenue. Tiffany began to recover; Wojo improved tenant relations, improved collections, and slowly
funded turnovers through cash flow and savings. Within 18 months, Tiffany realized 100% occupancy
(May 2011), with 96.5 percent collections compared to 72 percent collections. Average rent increased
almost $100 to its current average of $683 per month. Available cash was used to work through a
backlog of over 200 work orders of promised repairs, maintenance and equipment deficiencies,
appliances purchased as needed, minor upgrades where appropriate and cosmetic improvements in
order to regain the confidence of the current resident base. Wojo has implemented the use of
technology to assist in this effort. Online software manages and prioritizes work orders, offers
residents the option to pay rent online, and is used to facilitate all leases that are currently held with
Wojo Realty Group.
There are currently three vacant units, all of which are from long term residents of 10-18 years
that have had no upgrades or improvements during that period. The average turnover for minimal
updates cost $3,500 to make it rentable, which covers essentials. Two of these units will be more costly
due to heavier estimated repairs. Also, the common areas have been neglected – mainly by necessity
of established work priorities. They are beginning to show signs of wear and dissuading new
prospective residents. Comments are “nice apartment, except the common areas look bad.” This leads
them to incorrectly believe the owner/management doesn’t care. It has been more difficult to rent as
a result, and reduced rental rates than we previously experienced when the common areas were in
better condition. The floor plans are open and spacious, and they are not functionally obsolescent.
The graph below depicts the background and history graphically. It show stability before Signature
Group took over management in 2008. It demonstrates the loss in rent, collections, along with the
lagging expenses that ensued to recover from deferred maintenance and extraordinary repairs. The
recovery began in 2009 with improved cash flows financing the heavy expenses needed to make
15 | P a g e
necessary repairs ($42,000 in turnovers in 2010 alone.) Estimates are made for 2010 as a result of filing
for an extension, and then projections are made for 2011 – 2013 with improvements as outlined.
History of Expenses
The Kalathas family admits several personal and family expenses were booked to Tiffany
Apartments. From 2005 to 2009, there was $54,638.97 of family auto and office expenses charged
against Tiffany. Additionally, during this same period there was $65,222 of legal and accounting
expenses, much of which paid the handling the estate after the passing of the late Emmanuel Kalathas.
Additionally, $150,000 was loaned to repair townhomes that were part of the original estate that were
later sold, of which the loan was not repaid. An additional $100,000 loan was made to another
property within the estate for repairs, which too was not paid back in full yet either.
16 | P a g e
Historical Timeline Snapshot
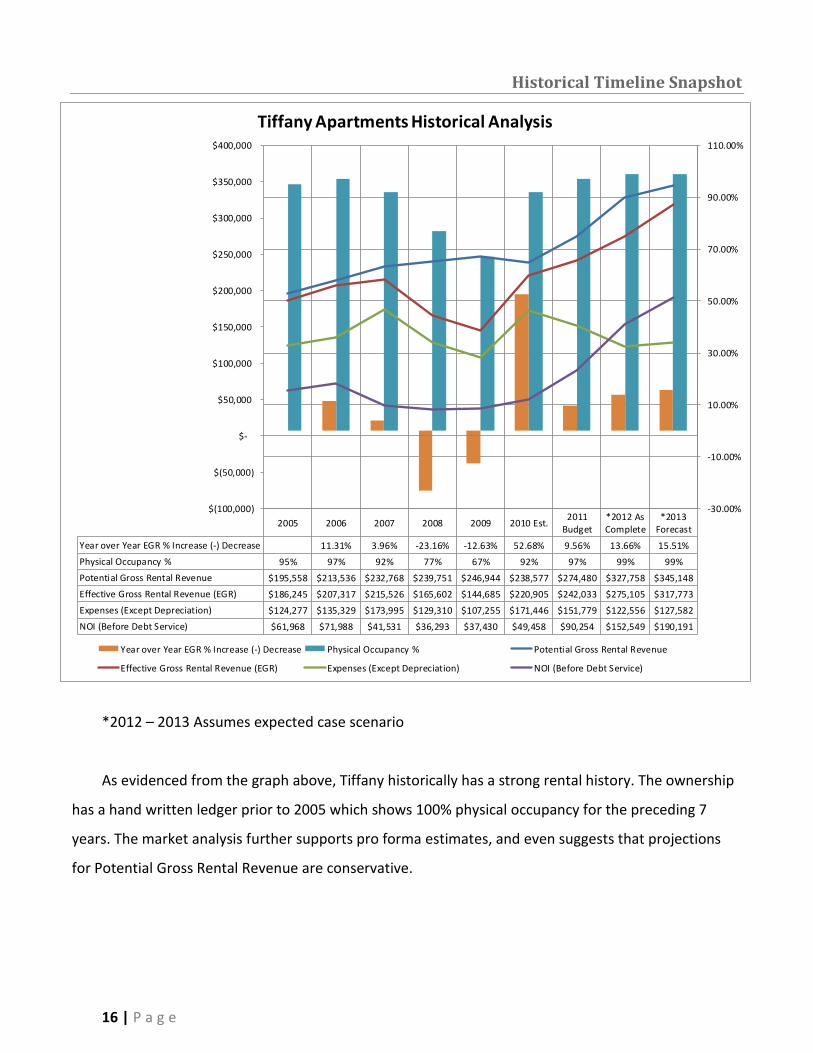
*2012 – 2013 Assumes expected case scenario
As evidenced from the graph above, Tiffany historically has a strong rental history. The ownership
has a hand written ledger prior to 2005 which shows 100% physical occupancy for the preceding 7
years. The market analysis further supports pro forma estimates, and even suggests that projections
for Potential Gross Rental Revenue are conservative.
2005 2006 2007 2008 2009 2010 Est.2011
Budget*2012 AsComplete
*2013Forecast
Year over Year EGR % Increase (-) Decrease 11.31% 3.96% -23.16% -12.63% 52.68% 9.56% 13.66% 15.51%
Physical Occupancy % 95% 97% 92% 77% 67% 92% 97% 99% 99%
Potential Gross Rental Revenue $195,558 $213,536 $232,768 $239,751 $246,944 $238,577 $274,480 $327,758 $345,148
Effective Gross Rental Revenue (EGR) $186,245 $207,317 $215,526 $165,602 $144,685 $220,905 $242,033 $275,105 $317,773
Expenses (Except Depreciation) $124,277 $135,329 $173,995 $129,310 $107,255 $171,446 $151,779 $122,556 $127,582
NOI (Before Debt Service) $61,968 $71,988 $41,531 $36,293 $37,430 $49,458 $90,254 $152,549 $190,191
-30.00%
-10.00%
10.00%
30.00%
50.00%
70.00%
90.00%
110.00%
$(100,000)
$(50,000)
$-
$50,000
$100,000
$150,000
$200,000
$250,000
$300,000
$350,000
$400,000
Tiffany Apartments Historical Analysis
Year over Year EGR % Increase (-) Decrease Physical Occupancy % Potential Gross Rental Revenue
Effective Gross Rental Revenue (EGR) Expenses (Except Depreciation) NOI (Before Debt Service)
17 | P a g e
Highlights
Location
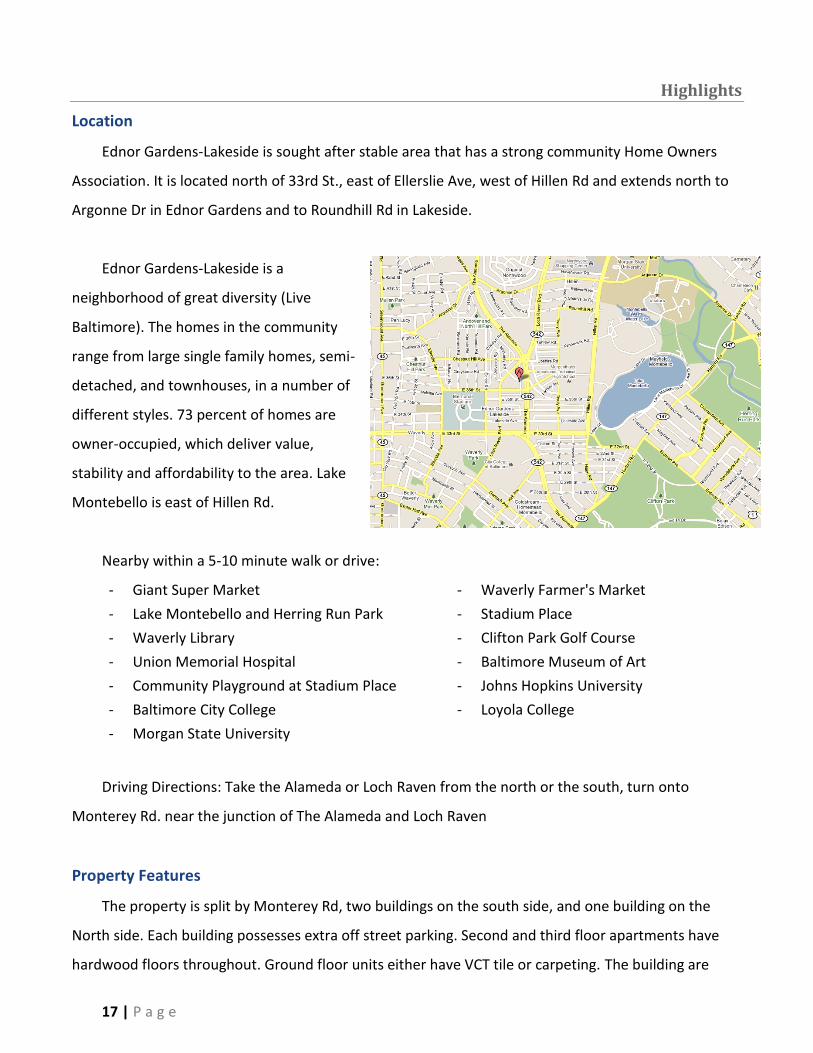
Ednor Gardens-Lakeside is sought after stable area that has a strong community Home Owners
Association. It is located north of 33rd St., east of Ellerslie Ave, west of Hillen Rd and extends north to
Argonne Dr in Ednor Gardens and to Roundhill Rd in Lakeside.
Ednor Gardens-Lakeside is a
neighborhood of great diversity (Live
Baltimore). The homes in the community
range from large single family homes, semi-
detached, and townhouses, in a number of
different styles. 73 percent of homes are
owner-occupied, which deliver value,
stability and affordability to the area. Lake
Montebello is east of Hillen Rd.
Nearby within a 5-10 minute walk or drive:
- Giant Super Market
- Harry and Jeanette Weinberg YMCA at
Stadium Place
- Waverly Farmer's Market
- Good Samaritan Hospital and several
large drug stores
- Lake Montebello and Herring Run Park - Stadium Place
- Waverly Library - Clifton Park Golf Course
- Union Memorial Hospital - Baltimore Museum of Art
- Community Playground at Stadium Place - Johns Hopkins University
- Baltimore City College - Loyola College
- Morgan State University
Driving Directions: Take the Alameda or Loch Raven from the north or the south, turn onto
Monterey Rd. near the junction of The Alameda and Loch Raven
Property Features
The property is split by Monterey Rd, two buildings on the south side, and one building on the
North side. Each building possesses extra off street parking. Second and third floor apartments have
hardwood floors throughout. Ground floor units either have VCT tile or carpeting. The building are
18 | P a g e
nestled away from crowded streets on a large grass lots, with access to bus lines 3, 22, 36, & 104 (MTA)
within a few blocks providing access to the Inner Harbor, to Hopkins & Bayview hospitals, to Northern
Ave & York Road.
Features Include:
- Secure Entry - Garbage Disposal
- Full bath w/Linen Closet - Central Air Conditioning
- Dishwasher - Washer/Dryer in Building
- Heat: Gas: Forced Air - Gas Cooking Stove
- Refrigerator - Hardwood Floors
- Stove Exhaust Hood - 2 Bedroom ~ 900 sf
- Extra Storage Closet - 1 Bedroom ~ 750 sf
- Separate dining apart from kitchen area
Rental Apartment Market
Apartment living is once again in high demand, a result partially from the housing crisis. Location is
a primary factor with prospects in choosing a place to live, and Tiffany Apartments is nicely located
near 4 bus routes. We’ve experienced some rental rate compression as compared to 2010, but pricing
is mainly a consideration of property condition which is a reason for the cash out funding request. Our
biggest competition is not from other apartments, but from single family home rentals, town homes
and row-homes being re-habbed and made available for rent.
Value Add Opportunity
Cosmetic repairs and curb appeal are essential components to yield higher effective average rents.
Tiffany Apartments offers numerous upside opportunities through conservation of utilities (current
water/sewer usage), water/sewer flat rate monthly surcharge, implementation of a utility pass through
or sub-metering system, curb appeal initiatives, maintenance expense reductions, minor interior bath
and kitchen renovations such as tub resurfacing, shower wall liner installation, medicine cabinet/vanity
upgrades, kitchen cabinet re-facing, and countertop replacements – some which have demonstrated
monthly rent increases from $100 to $200 more per month per unit.
19 | P a g e
An additional opportunity is to complete the build-out on the four apartments that have not been
finished. They are each a one bedroom apartment shell, which provides opportunity to create a
modern and open floor plan which, will likely achieve higher than average rents. Currently, one of
those units serves as a shop area and parts storage – this can be relocated.
Current rents are underpriced; a function of the lackluster curb appeal of the property and
outdated internal finishes. After making upgrades inside, the property has demonstrated the ability to
rent at market rate. With curb appeal and common area improvements, market rate rents are
expected. Due to a more open and larger floor plan compared to surrounding communities, it may
even be possible to charge slightly above market rents (this has not been tested). The pro-forma
estimates are conservative, at market rent or slightly below. With some in unit updates, competing
rents from similar apartments are achieving $0.91 -$0.98 per SF as compared to the current $0.77 -
$0.85 per SF at Tiffany (See Appendix X for comparable properties).
Address
3602-08 Monterey Rd.
Baltimore, MD 21218
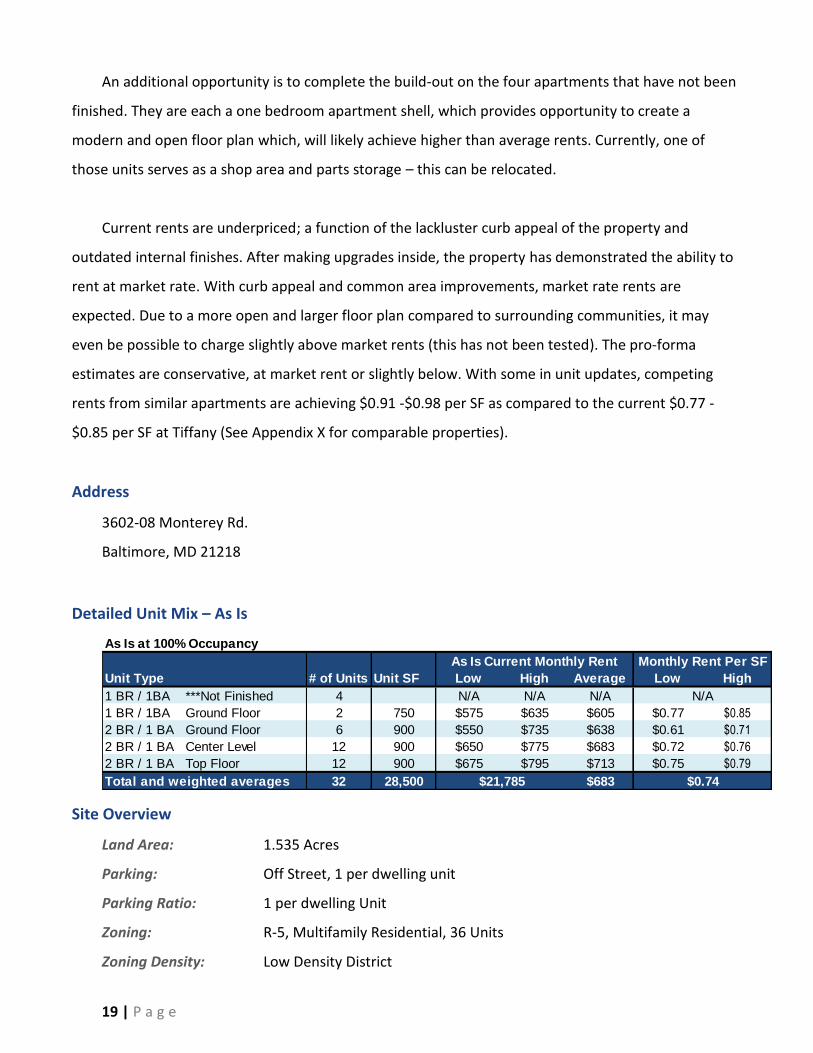
Detailed Unit Mix – As Is
As Is at 100% Occupancy
As Is Current Monthly Rent Monthly Rent Per SF
Unit Type # of Units Unit SF Low High Average Low High
1 BR / 1BA ***Not Finished 4 N/A N/A N/A N/A
1 BR / 1BA Ground Floor 2 750 $575 $635 $605 $0.77 $0.85
2 BR / 1 BA Ground Floor 6 900 $550 $735 $638 $0.61 $0.71
2 BR / 1 BA Center Level 12 900 $650 $775 $683 $0.72 $0.76
2 BR / 1 BA Top Floor 12 900 $675 $795 $713 $0.75 $0.79
Total and weighted averages 32 28,500 $683$21,785 $0.74
Site Overview
Land Area: 1.535 Acres
Parking: Off Street, 1 per dwelling unit
Parking Ratio: 1 per dwelling Unit
Zoning: R-5, Multifamily Residential, 36 Units
Zoning Density: Low Density District
20 | P a g e
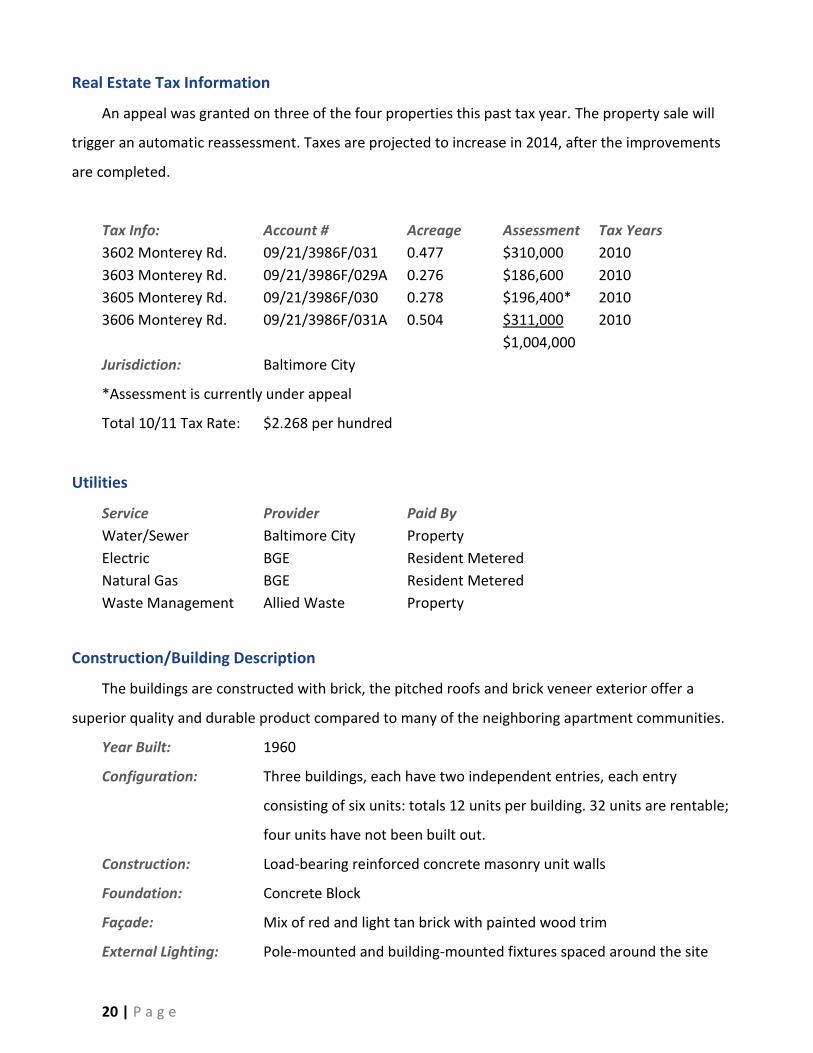
Real Estate Tax Information
An appeal was granted on three of the four properties this past tax year. The property sale will
trigger an automatic reassessment. Taxes are projected to increase in 2014, after the improvements
are completed.
Tax Info: Account # Acreage Assessment Tax Years
3602 Monterey Rd. 09/21/3986F/031 0.477 $310,000 2010
3603 Monterey Rd. 09/21/3986F/029A 0.276 $186,600 2010
3605 Monterey Rd. 09/21/3986F/030 0.278 $196,400* 2010
3606 Monterey Rd. 09/21/3986F/031A 0.504 $311,000 2010
$1,004,000
Jurisdiction: Baltimore City
*Assessment is currently under appeal
Total 10/11 Tax Rate: $2.268 per hundred
Utilities
Service Provider Paid By
Water/Sewer Baltimore City Property
Electric BGE Resident Metered
Natural Gas BGE Resident Metered
Waste Management Allied Waste Property
Construction/Building Description
The buildings are constructed with brick, the pitched roofs and brick veneer exterior offer a
superior quality and durable product compared to many of the neighboring apartment communities.
Year Built: 1960
Configuration: Three buildings, each have two independent entries, each entry
consisting of six units: totals 12 units per building. 32 units are rentable;
four units have not been built out.
Construction: Load-bearing reinforced concrete masonry unit walls
Foundation: Concrete Block
Façade: Mix of red and light tan brick with painted wood trim
External Lighting: Pole-mounted and building-mounted fixtures spaced around the site
21 | P a g e
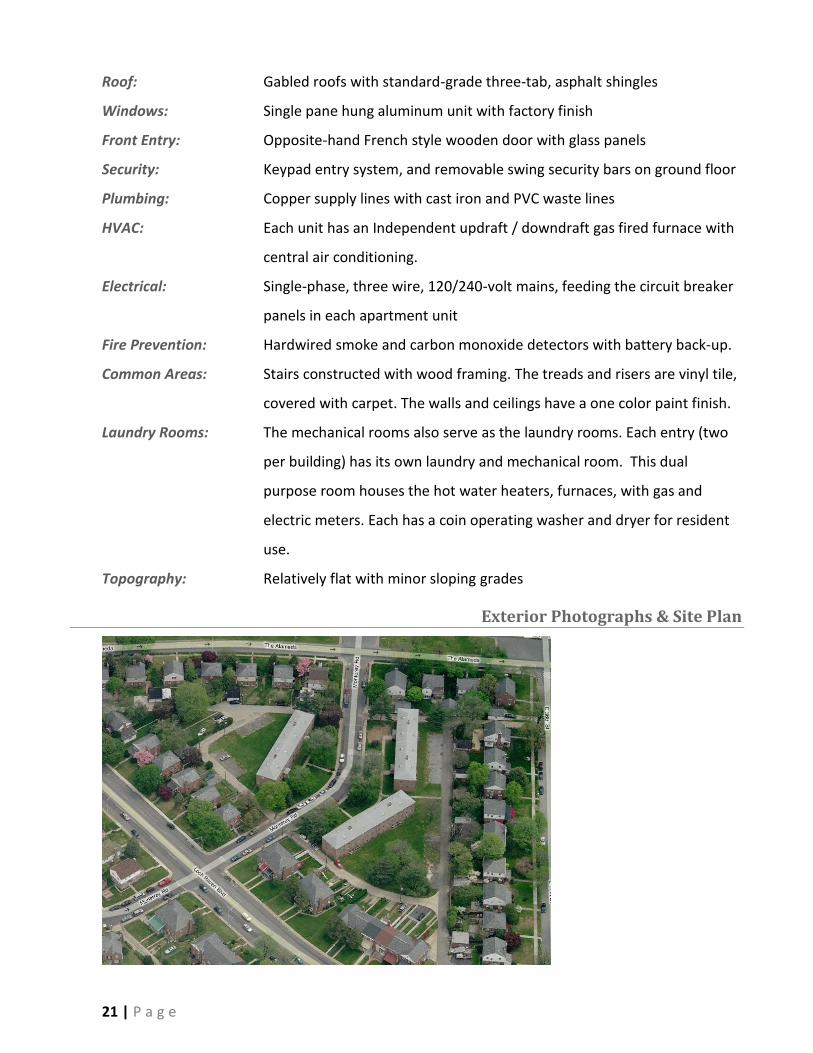
Roof: Gabled roofs with standard-grade three-tab, asphalt shingles
Windows: Single pane hung aluminum unit with factory finish
Front Entry: Opposite-hand French style wooden door with glass panels
Security: Keypad entry system, and removable swing security bars on ground floor
Plumbing: Copper supply lines with cast iron and PVC waste lines
HVAC: Each unit has an Independent updraft / downdraft gas fired furnace with
central air conditioning.
Electrical: Single-phase, three wire, 120/240-volt mains, feeding the circuit breaker
panels in each apartment unit
Fire Prevention: Hardwired smoke and carbon monoxide detectors with battery back-up.
Common Areas: Stairs constructed with wood framing. The treads and risers are vinyl tile,
covered with carpet. The walls and ceilings have a one color paint finish.
Laundry Rooms: The mechanical rooms also serve as the laundry rooms. Each entry (two
per building) has its own laundry and mechanical room. This dual
purpose room houses the hot water heaters, furnaces, with gas and
electric meters. Each has a coin operating washer and dryer for resident
use.
Topography: Relatively flat with minor sloping grades
Exterior Photographs & Site Plan
22 | P a g e
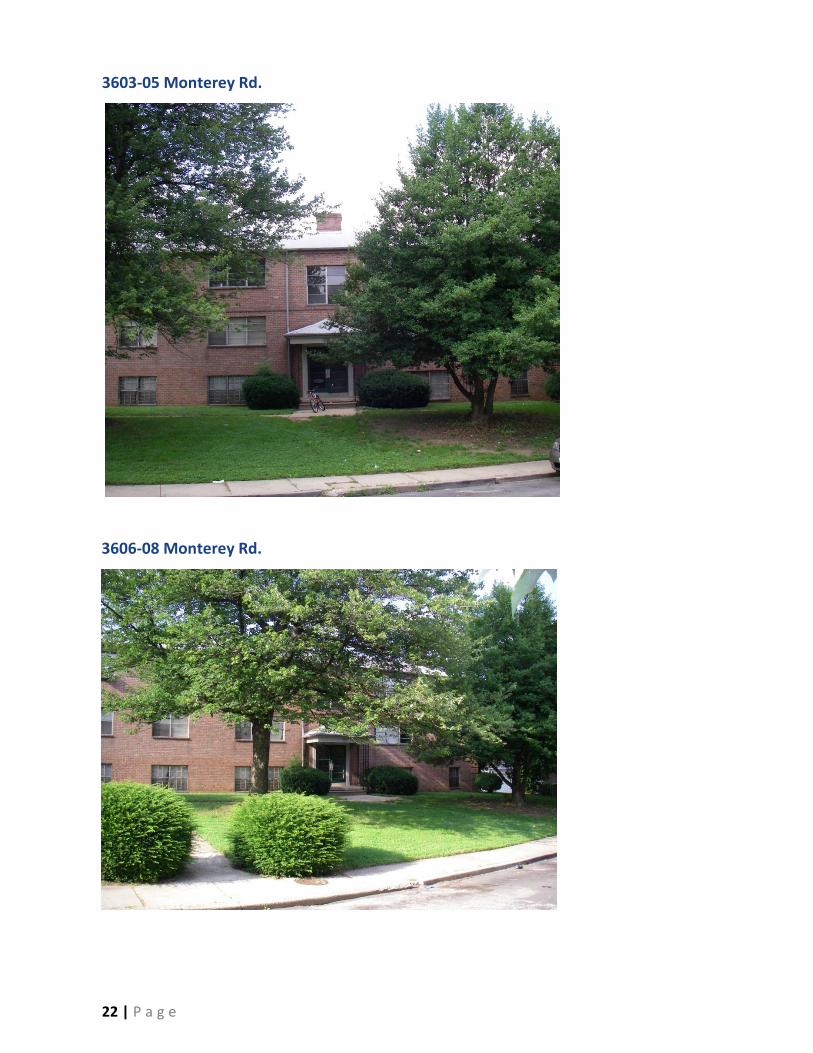
3603-05 Monterey Rd.
3606-08 Monterey Rd.
23 | P a g e
MARKET ANALYSIS
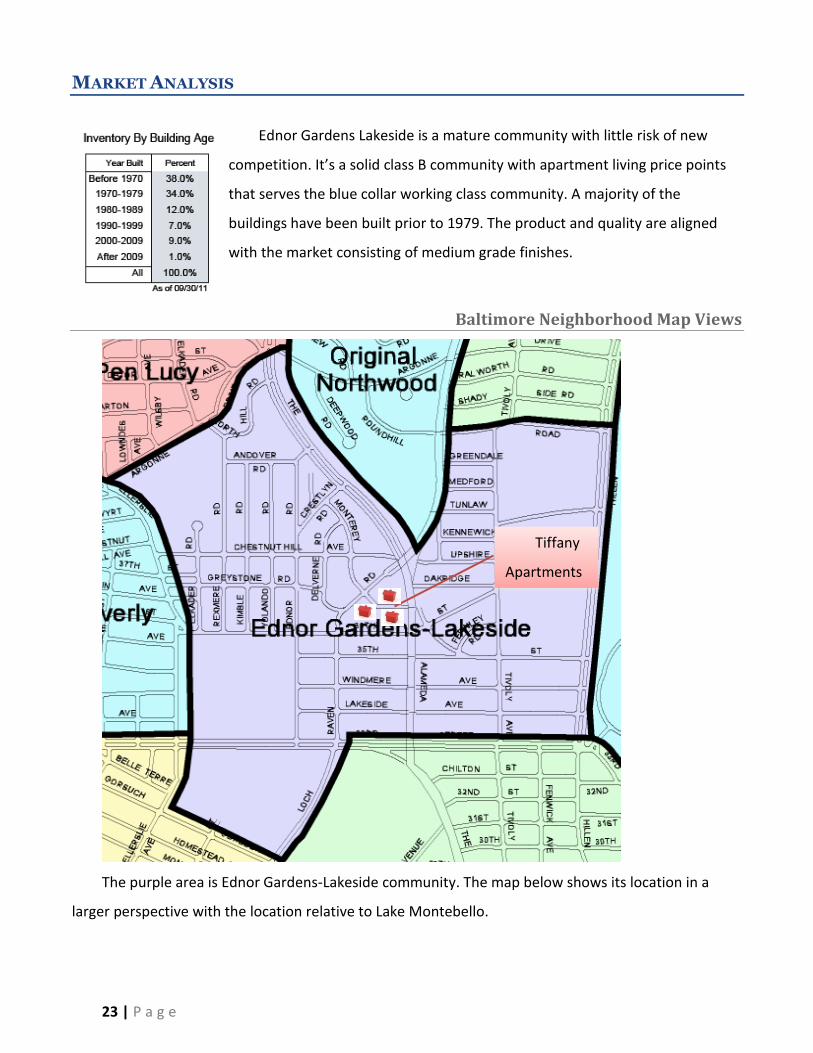
Ednor Gardens Lakeside is a mature community with little risk of new
competition. It’s a solid class B community with apartment living price points
that serves the blue collar working class community. A majority of the
buildings have been built prior to 1979. The product and quality are aligned
with the market consisting of medium grade finishes.
Baltimore Neighborhood Map Views
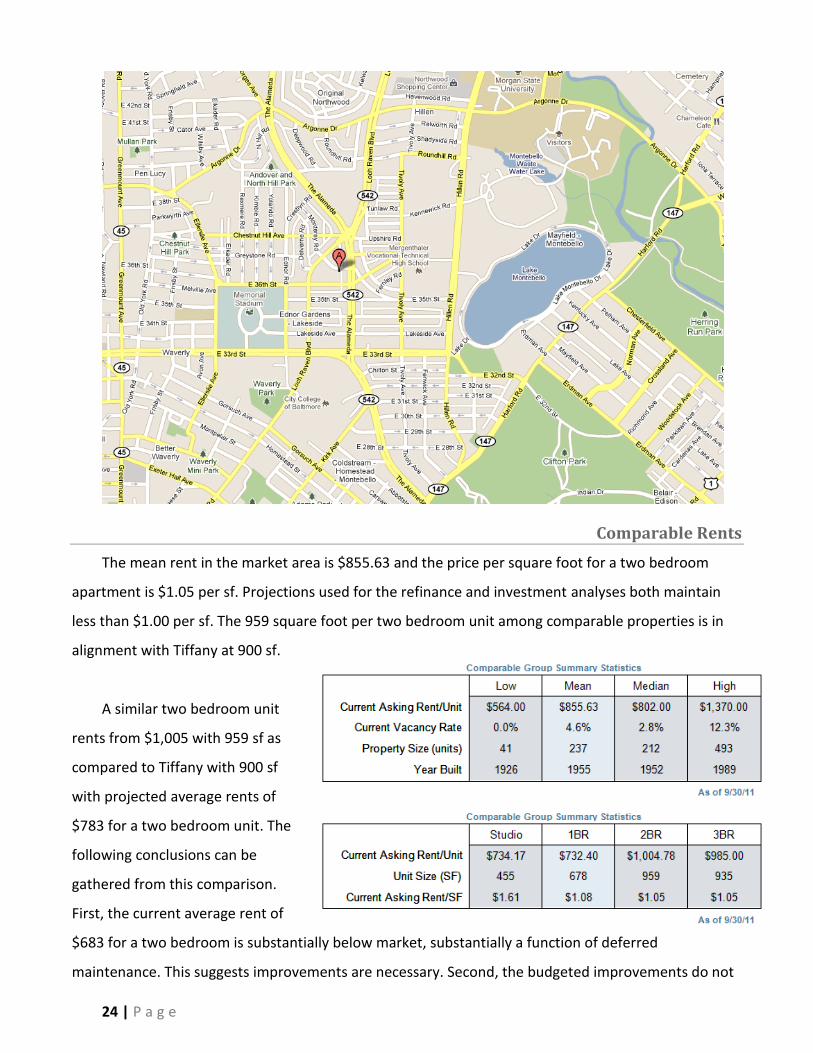
The purple area is Ednor Gardens-Lakeside community. The map below shows its location in a
larger perspective with the location relative to Lake Montebello.
Tiffany
Apartments
24 | P a g e
Comparable Rents
The mean rent in the market area is $855.63 and the price per square foot for a two bedroom
apartment is $1.05 per sf. Projections used for the refinance and investment analyses both maintain
less than $1.00 per sf. The 959 square foot per two bedroom unit among comparable properties is in
alignment with Tiffany at 900 sf.
A similar two bedroom unit
rents from $1,005 with 959 sf as
compared to Tiffany with 900 sf
with projected average rents of
$783 for a two bedroom unit. The
following conclusions can be
gathered from this comparison.
First, the current average rent of
$683 for a two bedroom is substantially below market, substantially a function of deferred
maintenance. This suggests improvements are necessary. Second, the budgeted improvements do not
25 | P a g e
require substantial rent increases to be cost effective – which indicates the project is not at risk of over
improving the property. Third, projected average rent of $783 after improvements is conservative and
substantially less than comparable two bedrooms. An argument can be made with a conservative
estimate of $1.00 per sf, rents could possibly be driven to $900 per unit, which is still $100 less than
the comparable average. Details of comparable properties can be found in Appendix 3.
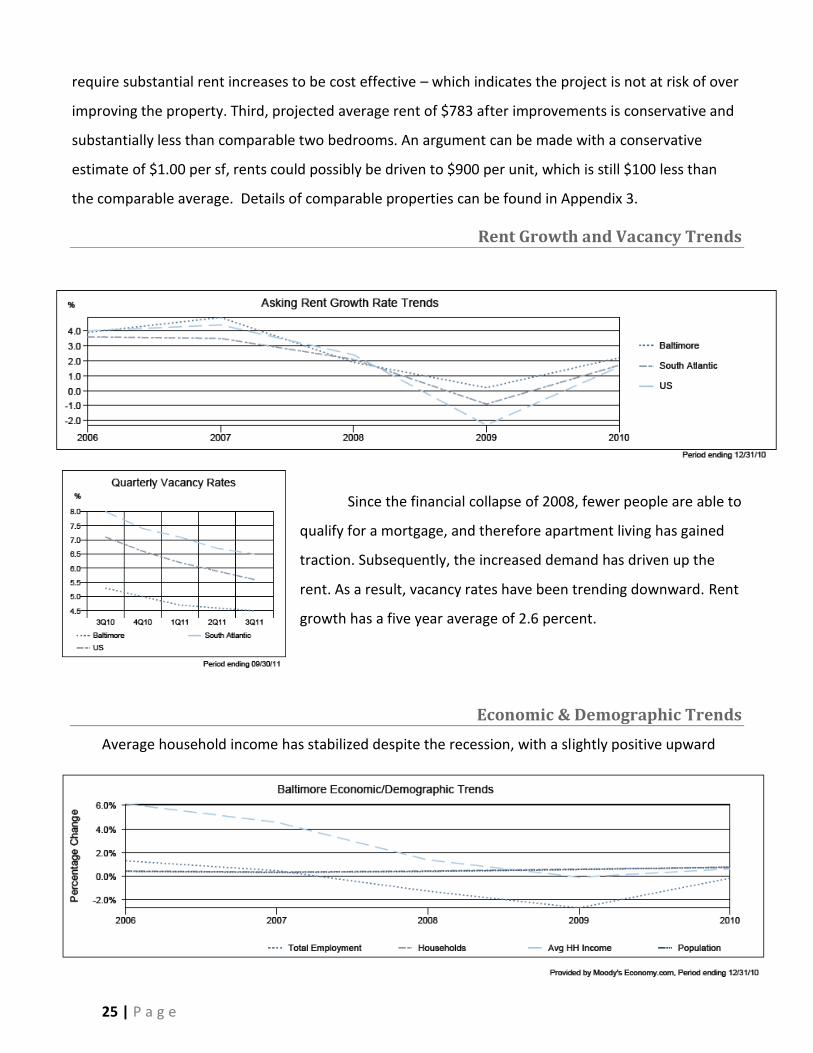
Rent Growth and Vacancy Trends
Since the financial collapse of 2008, fewer people are able to
qualify for a mortgage, and therefore apartment living has gained
traction. Subsequently, the increased demand has driven up the
rent. As a result, vacancy rates have been trending downward. Rent
growth has a five year average of 2.6 percent.
Economic & Demographic Trends
Average household income has stabilized despite the recession, with a slightly positive upward
26 | P a g e
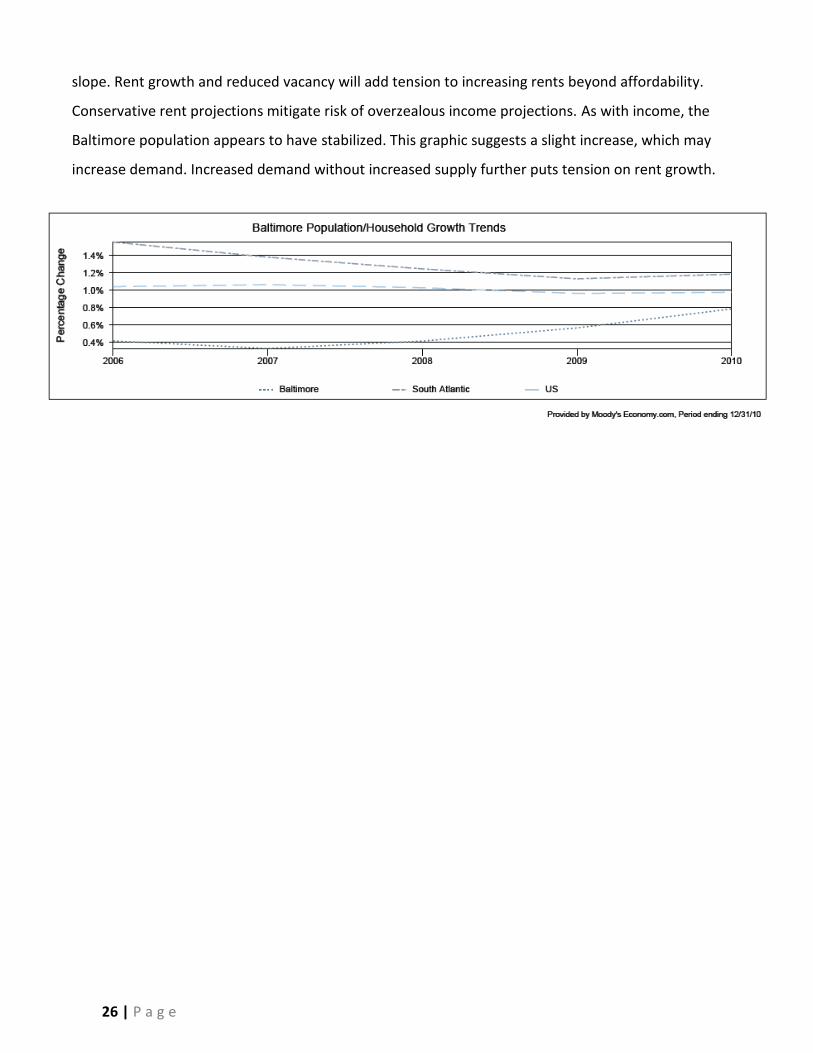
slope. Rent growth and reduced vacancy will add tension to increasing rents beyond affordability.
Conservative rent projections mitigate risk of overzealous income projections. As with income, the
Baltimore population appears to have stabilized. This graphic suggests a slight increase, which may
increase demand. Increased demand without increased supply further puts tension on rent growth.
27 | P a g e
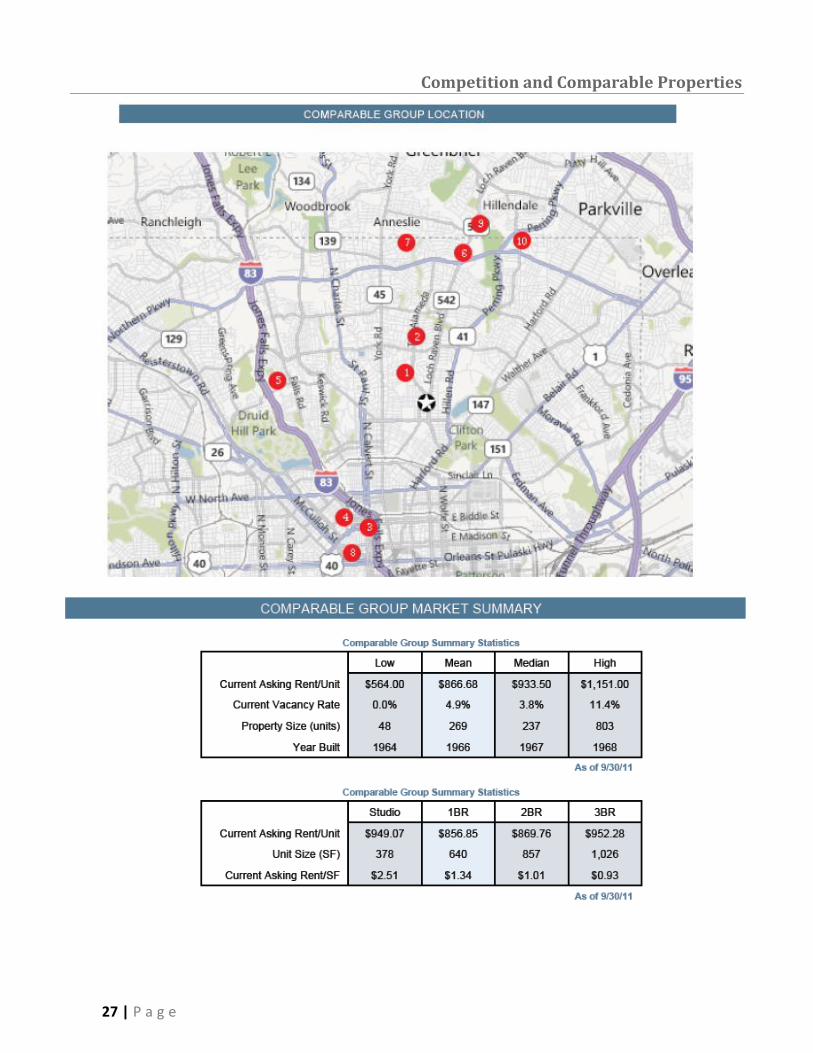
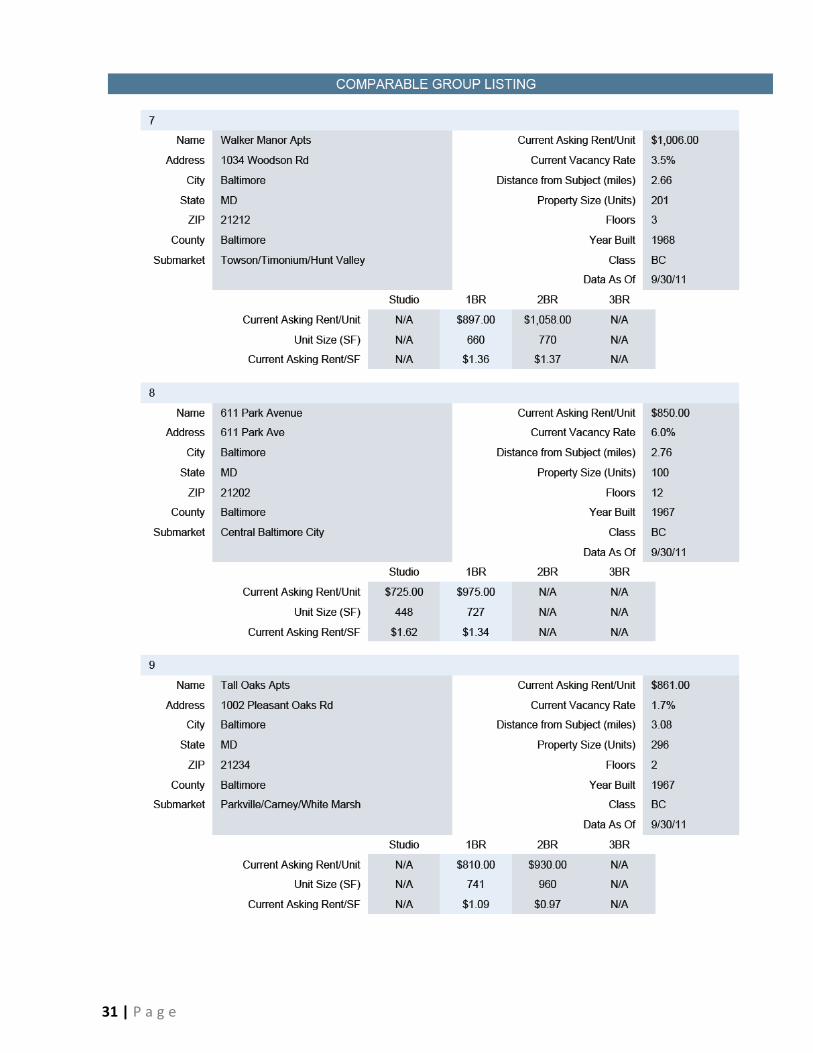
Competition and Comparable Properties
28 | P a g e
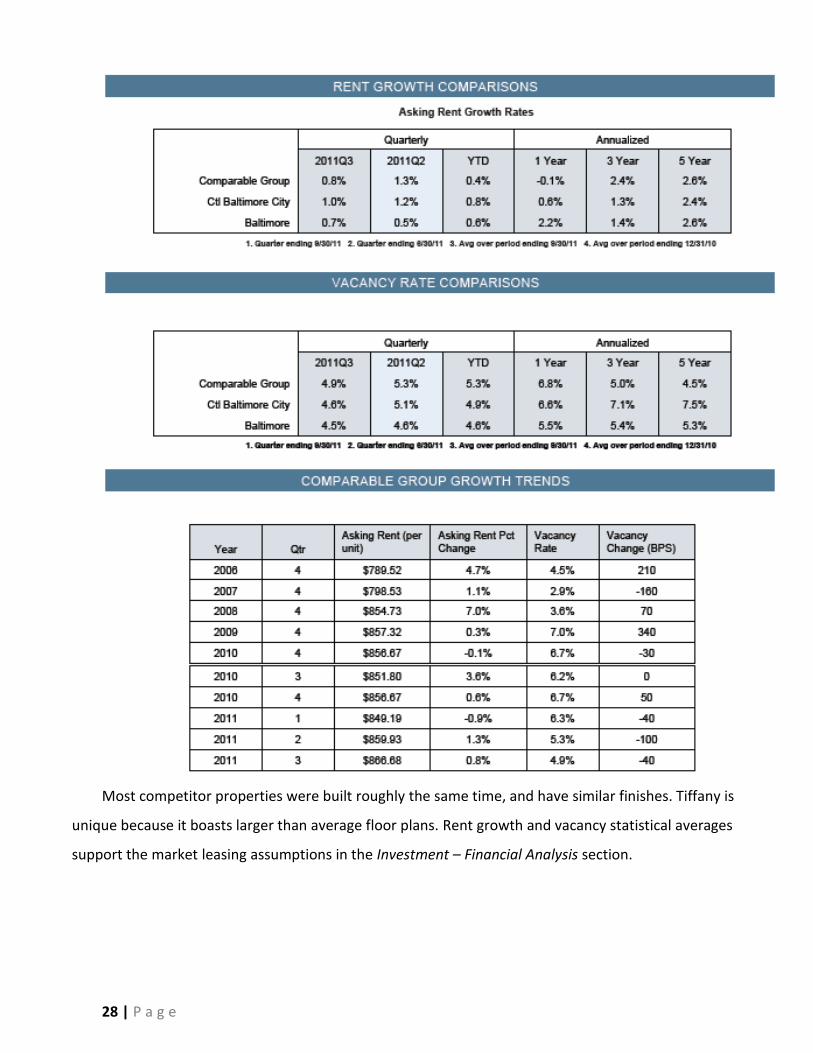
Most competitor properties were built roughly the same time, and have similar finishes. Tiffany is
unique because it boasts larger than average floor plans. Rent growth and vacancy statistical averages
support the market leasing assumptions in the Investment – Financial Analysis section.
29 | P a g e
30 | P a g e
31 | P a g e
32 | P a g e
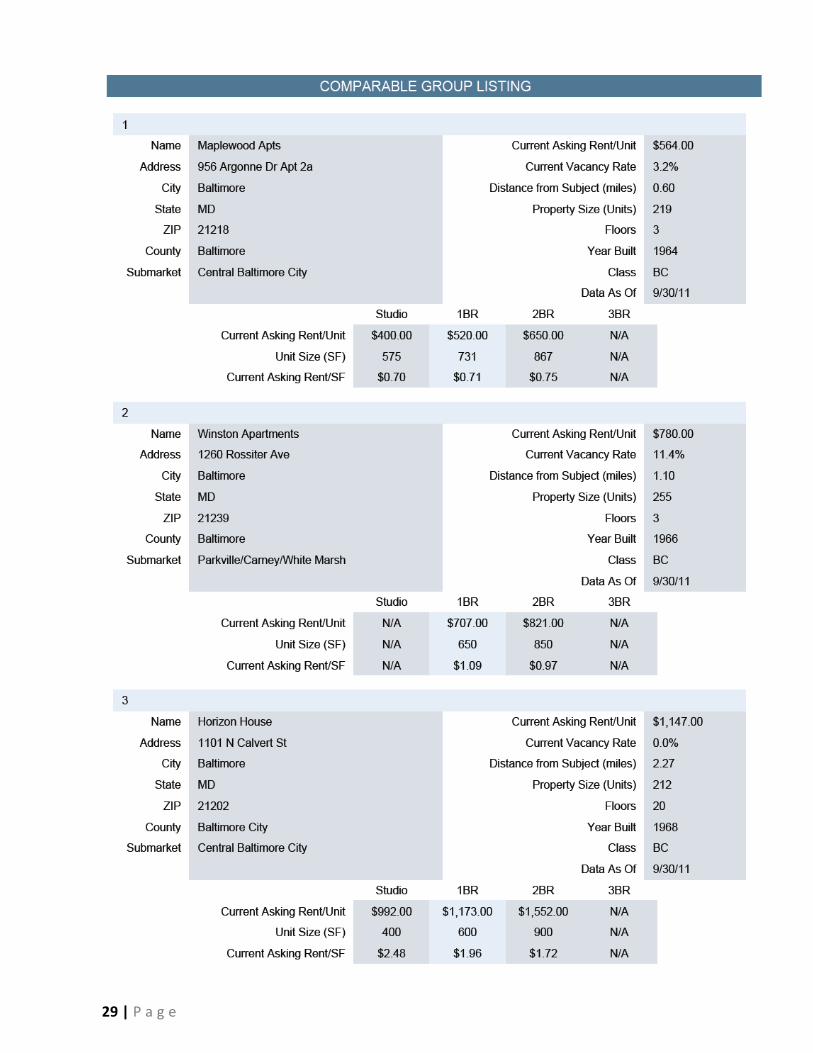
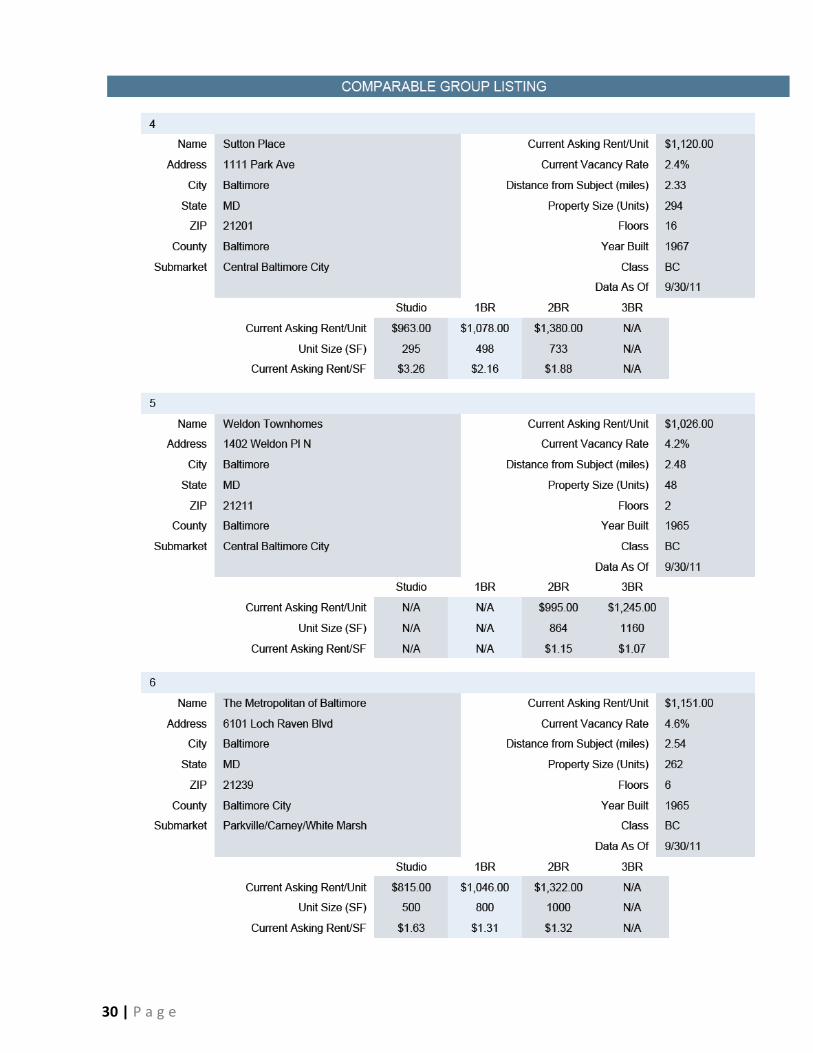
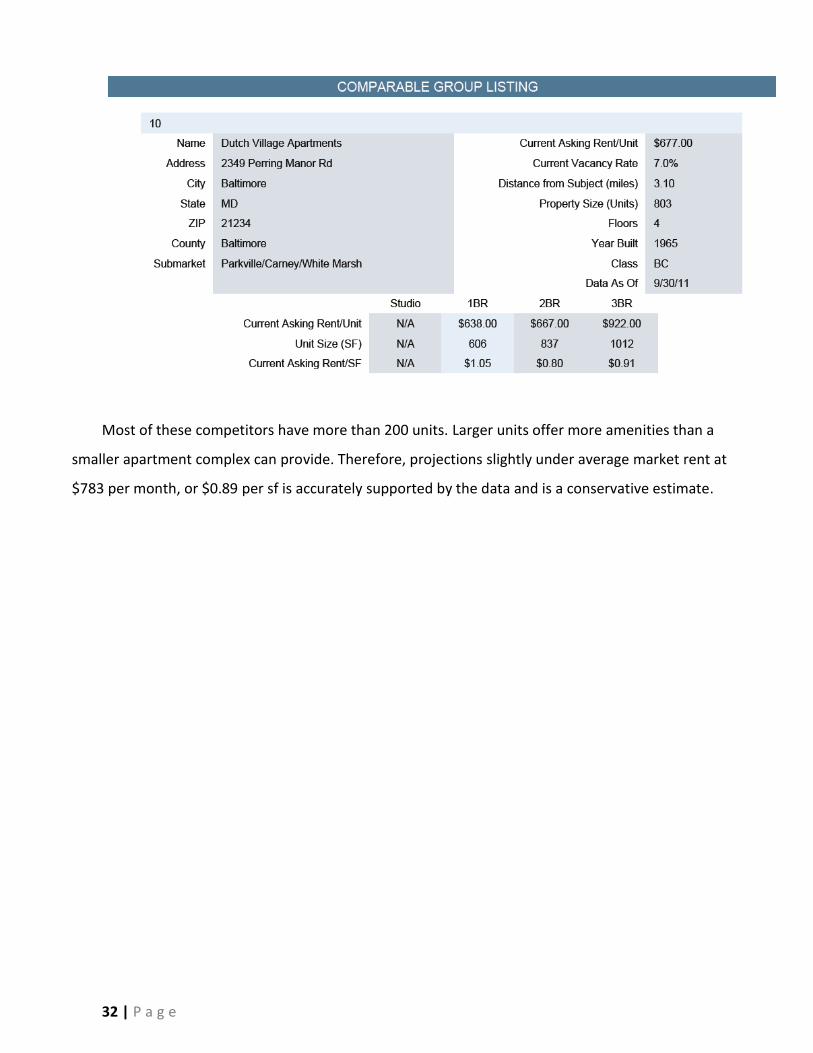
Most of these competitors have more than 200 units. Larger units offer more amenities than a
smaller apartment complex can provide. Therefore, projections slightly under average market rent at
$783 per month, or $0.89 per sf is accurately supported by the data and is a conservative estimate.
33 | P a g e
RENOVATION OVERVIEW
A detailed timeline and draw schedule is not part of this investment analysis. Renovations will
occur using the most qualified lowest bid contractor. The intent is to have contractors bid the total
project scope so the investment will benefit from economy of scale, even if executed in phases.
Qualified contractors, such as mold remediation and asbestos removal contractors will be hired on an
as needed basis. The scope of renovations does not plan to disturb any known areas of asbestos, and
therefore do not have this broken out as a major line item in the budget. The following provides an
overview of the project plan. The detailed supporting budget is provided in the Investment – Financial
Analysis section.
Project Timeline
Renovations begin January 2012 and are expected to span from 12 to a maximum of 24 months.
Curb appeal improvements and at least one section (six units) and common area is scheduled to be
completed in June to take advantage of the busy leasing season.
The renovation process will begin immediately on the four unfinished units, and the two termite
damaged basement units. A detailed logistics plan to update aging units will be developed once work
commences in January. Work on the oldest units will take priority, and common areas will be finished
as we work through each section of six units. The newly finished units (which total six) will serve as
temporary living quarters for the existing residents. This will provide the opportunity to update their
baths and kitchens, replace hardware, install the breakfast bar, and paint the oldest units. Landscape
and curb appeal improvement plans will be developed during February and March and are scheduled
to begin in April finishing in May to take advantage of the beginning of the busy leasing time.
If new leases support rental projections, upgrades and renovations will proceed as quickly as time
will allow, scheduled for an additional six months with the goal of having 100 percent physical
occupancy in year two.
Value-Add Strategy
The property is performing as a class C property within a Class B neighborhood. Significant upside
potential is provided below in an outline of how funds will be managed and used to realize projections.
34 | P a g e
The property offers opportunity to significantly increase NOI through:
1.) Decrease turnover time to 10 days,
2.) Cosmetic repairs to buildings /common area’s including exterior curb appeal enhancements all
which will allow for market rate rents,
3.) Capital investment, utility, and operational maintenance expense reduction,
4.) Rent growth fueled by interior renovation upgrades, and
5.) Complete the construction and rent the remaining four one bedroom units.
The renovation budget in the Investment – Financial Analysis section lists line item expenses for
each of the categories below. They are categorized as cosmetic, capital expenditure, or rent growth.
Cosmetic Repairs and Curb Appeal Initiatives
These repairs will help the property achieve market rent, will improve the lead to lease ratio
decreasing time to sign leases with new residents and therefore reduce turnover time.
- Landscape and curb appeal improvements
- Paint long term resident apartments
- Remove / Replace / Modify ground floor Security bars
- Laundry Room Rahab (Patch & paint, floor resurface/paint)
- Dryer Vent Duct Repair / Replace
- Sidewalk / Portico concrete patch & repair
- Portico Paint / Repair
- Common Area Repair, Paint, Re-floor
Rent Growth Initiatives
The following will be done to aid in achieving above market rent, help reduce utility costs, and will
improve the lead to lease ratio decreasing time to sign leases with new residents and therefore reduce
turnover time.
- Kitchen upgrades; Cabinet re-facing, floor replacement, countertop replacement, water
saving kitchen faucet
- Bath upgrades; tub re-surfacing, install new vanity, sink, medicine cabinet, light, shower
wall liners, water saving faucet, showerhead, and toilet
- Breakfast bar installation between dining and kitchen for a rent premium
35 | P a g e
Capital Improvement Expenditures
The following will be done to aid in achieving above market rent, help reduce utility costs and
routine maintenance and operational expenses. Although the property has no lead paint, there is a risk
reduction measure listed to limit liability exposure and reduce operational cost as a result of highly
intensive paint reduction mandates required by the EPA (if the property is not certified lead free).
- Lead Free Certification
- Level and install pads on outdoor AC units
- Re-grade, add fill dirt to slope away from building
- Re-seal / caulk, re-mortar brick window sills
- Gutter Repairs / Replacement
- Roof vent pipe shingle / seal repair
- Kitchen and Bath window replacement
- Common area window replacement
- Apartment / dwelling window replacement
- 22 HVAC internal and external unit replacements
- Main power supply line to building have worn insulation, replace as needed
- Water saving Faucet and Toilet replacements
- Initiate project for Utility Water/Sewer Flat Surcharge or Ratio Utility Billing (RUB) System
Capital Project Improvement Strategy
Outlined below is the strategy to be deployed for capital intensive repairs and upgrades that may
be cost prohibitive initially, but are scheduled for a one to two year replacement.
Window replacement program
Existing windows are single pane hung aluminum units with factory finish. They have created
significant problems in both summer and winter months. In the winter, maintenance calls are received
with complaints of drafty and cold windows. Many of the ballasts no longer function properly and
turnovers costs increase $350 for each apartment for repairs necessary to make the windows operable.
The windows also significantly sweat during the summer months, where condensate runs onto the sill
and creates mold problems; results in timely and costly rent escrow court cases. As a temporary
measure, for those who complain, we’ve capped the internal sills with a plastic laminate to prevent the
condensation from absorbing into the wood. Lastly, the kitchen and bath windows open and close on a
crank system – virtually none of the windows operate correctly and has also been the source of timely
36 | P a g e
and costly rent escrow cases. Some have been replaced on an as needed basis. All remaining kitchen
and bath windows require immediate replacement.
Replacements will be phased in as follows as capital and budget allow: 1.) All kitchen and bath
windows, 2.) Common area windows (including laundry rooms), 3.) Rented Apartment Windows
NOTE: Apartment windows will be replaced last because the residents are responsible for heating
and cooling their own space. A replacement schedule will be communicated to residents to prevent
uncertainty and mitigate risk of rent escrow cases.
HVAC System replacement program
Ten complete HVAC systems have been replaced by necessity over the last two years; 22 aging
systems remain. Among those remaining, the furnaces and air handling units are original. Most of the
condensing and evaporator coils are also original. These systems are aging and have been nursed
beyond usable life. They are significant contributors to costly maintenance expenses during summer
and winter months and have been the source of timely and costly rent escrow cases. Replacement will
be phased in over a two to three year period as capital and budget allows. Significant maintenance
costs will be offset through this initiative.
INVESTMENT - FINANCIAL ANALYSIS
The investment has a five year horizon, with a reversion occurring on the last day of the fifth year.
The analysis has a specific investment partner who seeks non-recourse debt financing. The equity
requirement from the lender for non-recourse debt is a minimum 50 percent of stabilized value. The
Equity investor is the Limited Partner, and the Managing Member is the General Partner.
Since non-recourse debt will be used, there will be no personal guarantees. Distribution details are
stated in the following graphic.
37 | P a g e
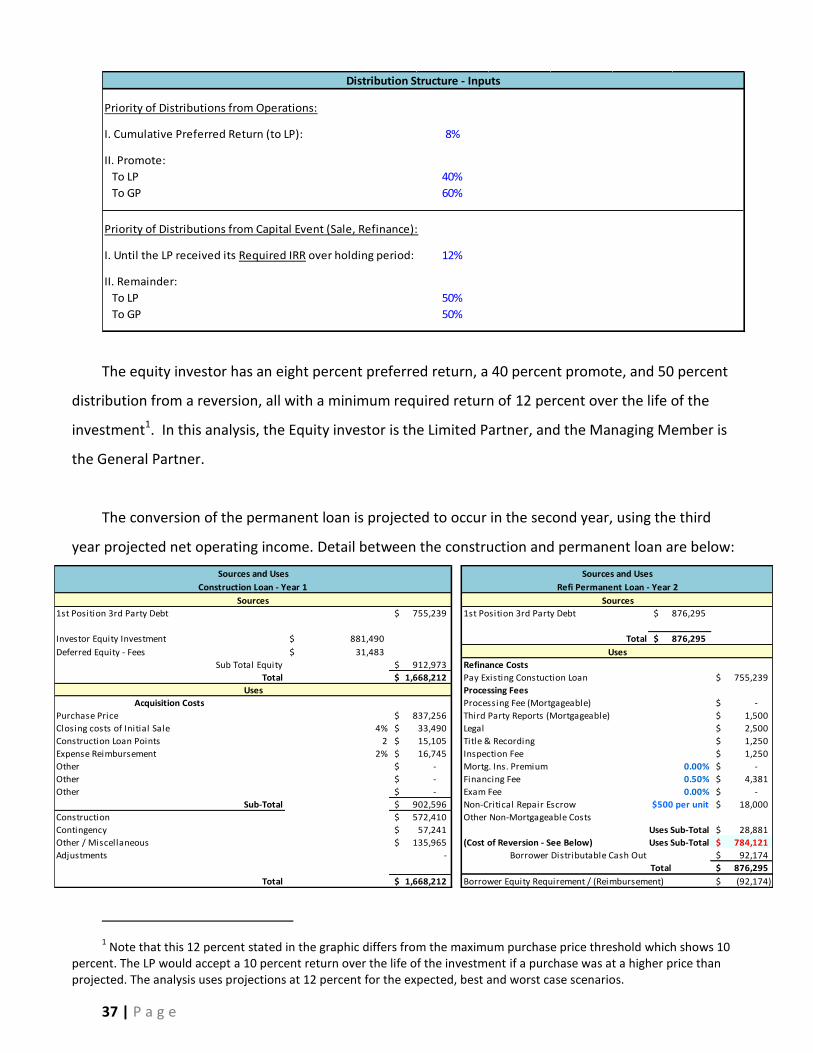
Distribution Structure - Inputs
Priority of Distributions from Operations:
I. Cumulative Preferred Return (to LP): 8%
II. Promote:
To LP 40%
To GP 60%
Priority of Distributions from Capital Event (Sale, Refinance):
I. Until the LP received its Required IRR over holding period: 12%
II. Remainder:
To LP 50%
To GP 50%
The equity investor has an eight percent preferred return, a 40 percent promote, and 50 percent
distribution from a reversion, all with a minimum required return of 12 percent over the life of the
investment1. In this analysis, the Equity investor is the Limited Partner, and the Managing Member is
the General Partner.
The conversion of the permanent loan is projected to occur in the second year, using the third
year projected net operating income. Detail between the construction and permanent loan are below:
1st Position 3rd Party Debt 755,239$ 1st Position 3rd Party Debt 876,295$
Investor Equity Investment 881,490$ Total 876,295$
Deferred Equity - Fees 31,483$
Sub Total Equity 912,973$ Refinance Costs
Total 1,668,212$ Pay Existing Constuction Loan 755,239$
Processing Fees
Acquisition Costs Processing Fee (Mortgageable) -$
Purchase Price 837,256$ Third Party Reports (Mortgageable) 1,500$
Closing costs of Initial Sale 4% 33,490$ Legal 2,500$
Construction Loan Points 2 15,105$ Title & Recording 1,250$
Expense Reimbursement 2% 16,745$ Inspection Fee 1,250$
Other -$ Mortg. Ins. Premium 0.00% -$
Other -$ Financing Fee 0.50% 4,381$
Other -$ Exam Fee 0.00% -$
Sub-Total 902,596$ Non-Critical Repair Escrow $500 per unit 18,000$
Construction 572,410$ Other Non-Mortgageable Costs
Contingency 57,241$ Uses Sub-Total 28,881$
Other / Miscellaneous 135,965$ (Cost of Reversion - See Below) Uses Sub-Total 784,121$
Adjustments - Borrower Distributable Cash Out 92,174$
Total 876,295$
Total 1,668,212$ Borrower Equity Requirement / (Reimbursement) (92,174)$
Uses
Uses
Sources and Uses Sources and Uses
Construction Loan - Year 1 Refi Permanent Loan - Year 2
Sources Sources
1 Note that this 12 percent stated in the graphic differs from the maximum purchase price threshold which shows 10
percent. The LP would accept a 10 percent return over the life of the investment if a purchase was at a higher price than projected. The analysis uses projections at 12 percent for the expected, best and worst case scenarios.
38 | P a g e
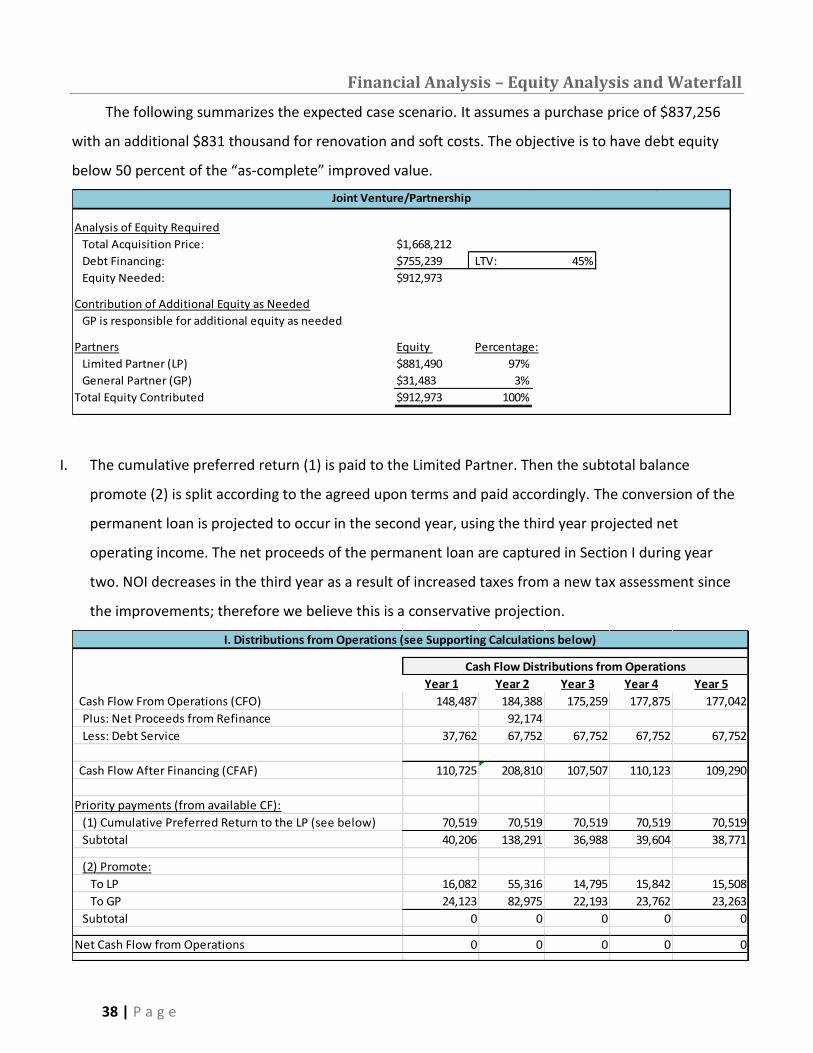
Financial Analysis – Equity Analysis and Waterfall
The following summarizes the expected case scenario. It assumes a purchase price of $837,256
with an additional $831 thousand for renovation and soft costs. The objective is to have debt equity
below 50 percent of the “as-complete” improved value.
Joint Venture/Partnership
Analysis of Equity Required
Total Acquisition Price: $1,668,212
Debt Financing: $755,239 LTV: 45%
Equity Needed: $912,973
Contribution of Additional Equity as Needed
GP is responsible for additional equity as needed
Partners Equity Percentage:
Limited Partner (LP) $881,490 97%
General Partner (GP) $31,483 3%
Total Equity Contributed $912,973 100%
I. The cumulative preferred return (1) is paid to the Limited Partner. Then the subtotal balance
promote (2) is split according to the agreed upon terms and paid accordingly. The conversion of the
permanent loan is projected to occur in the second year, using the third year projected net
operating income. The net proceeds of the permanent loan are captured in Section I during year
two. NOI decreases in the third year as a result of increased taxes from a new tax assessment since
the improvements; therefore we believe this is a conservative projection.
I. Distributions from Operations (see Supporting Calculations below)
Year 1 Year 2 Year 3 Year 4 Year 5
Cash Flow From Operations (CFO) 148,487 184,388 175,259 177,875 177,042
Plus: Net Proceeds from Refinance 92,174
Less: Debt Service 37,762 67,752 67,752 67,752 67,752
Cash Flow After Financing (CFAF) 110,725 208,810 107,507 110,123 109,290
Priority payments (from available CF):
(1) Cumulative Preferred Return to the LP (see below) 70,519 70,519 70,519 70,519 70,519
Subtotal 40,206 138,291 36,988 39,604 38,771
(2) Promote:
To LP 16,082 55,316 14,795 15,842 15,508
To GP 24,123 82,975 22,193 23,762 23,263
Subtotal 0 0 0 0 0
Net Cash Flow from Operations 0 0 0 0 0
Cash Flow Distributions from Operations
39 | P a g e
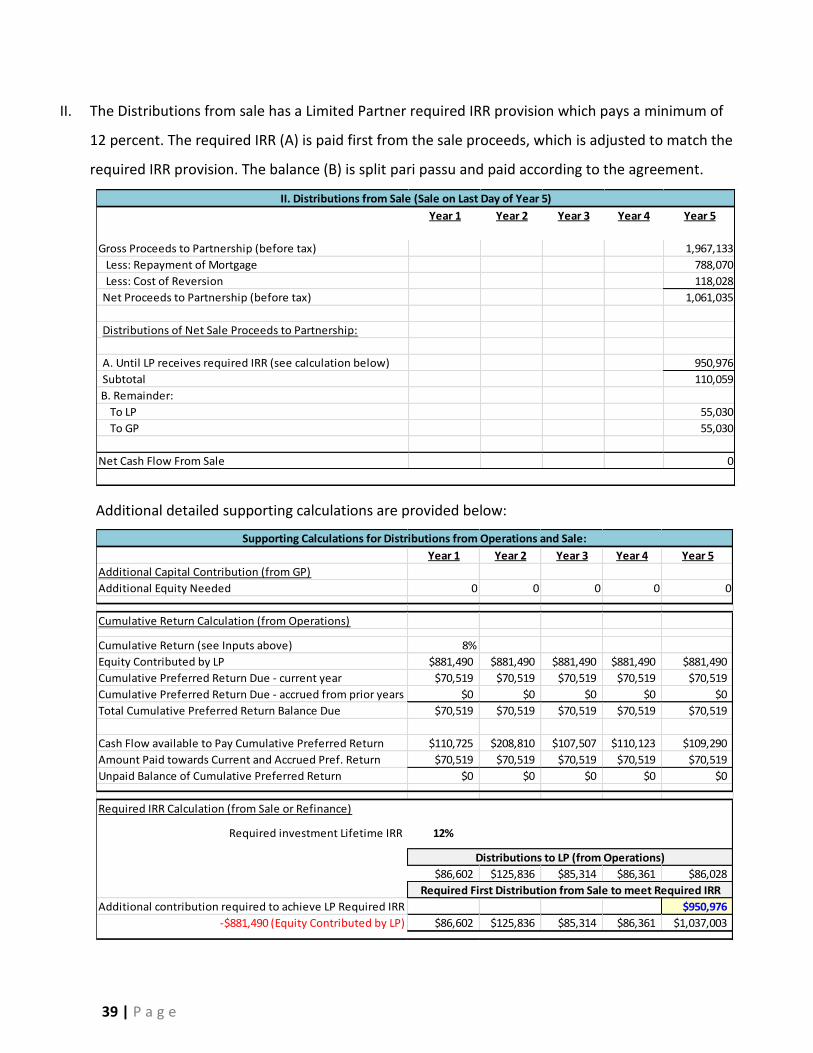
II. The Distributions from sale has a Limited Partner required IRR provision which pays a minimum of
12 percent. The required IRR (A) is paid first from the sale proceeds, which is adjusted to match the
required IRR provision. The balance (B) is split pari passu and paid according to the agreement.
Additional detailed supporting calculations are provided below:
Supporting Calculations for Distributions from Operations and Sale:
Year 1 Year 2 Year 3 Year 4 Year 5
Additional Capital Contribution (from GP)
Additional Equity Needed 0 0 0 0 0
Cumulative Return Calculation (from Operations)
Cumulative Return (see Inputs above) 8%
Equity Contributed by LP $881,490 $881,490 $881,490 $881,490 $881,490
Cumulative Preferred Return Due - current year $70,519 $70,519 $70,519 $70,519 $70,519
Cumulative Preferred Return Due - accrued from prior years $0 $0 $0 $0 $0
Total Cumulative Preferred Return Balance Due $70,519 $70,519 $70,519 $70,519 $70,519
Cash Flow available to Pay Cumulative Preferred Return $110,725 $208,810 $107,507 $110,123 $109,290
Amount Paid towards Current and Accrued Pref. Return $70,519 $70,519 $70,519 $70,519 $70,519
Unpaid Balance of Cumulative Preferred Return $0 $0 $0 $0 $0
Required IRR Calculation (from Sale or Refinance)
Required investment Lifetime IRR 12%
$86,602 $125,836 $85,314 $86,361 $86,028
Additional contribution required to achieve LP Required IRR $950,976
-$881,490 (Equity Contributed by LP) $86,602 $125,836 $85,314 $86,361 $1,037,003
Distributions to LP (from Operations)
Required First Distribution from Sale to meet Required IRR
II. Distributions from Sale (Sale on Last Day of Year 5)
Year 1 Year 2 Year 3 Year 4 Year 5
Gross Proceeds to Partnership (before tax) 1,967,133
Less: Repayment of Mortgage 788,070
Less: Cost of Reversion 118,028
Net Proceeds to Partnership (before tax) 1,061,035
Distributions of Net Sale Proceeds to Partnership:
A. Until LP receives required IRR (see calculation below) 950,976
Subtotal 110,059
B. Remainder:
To LP 55,030
To GP 55,030
Net Cash Flow From Sale 0
40 | P a g e
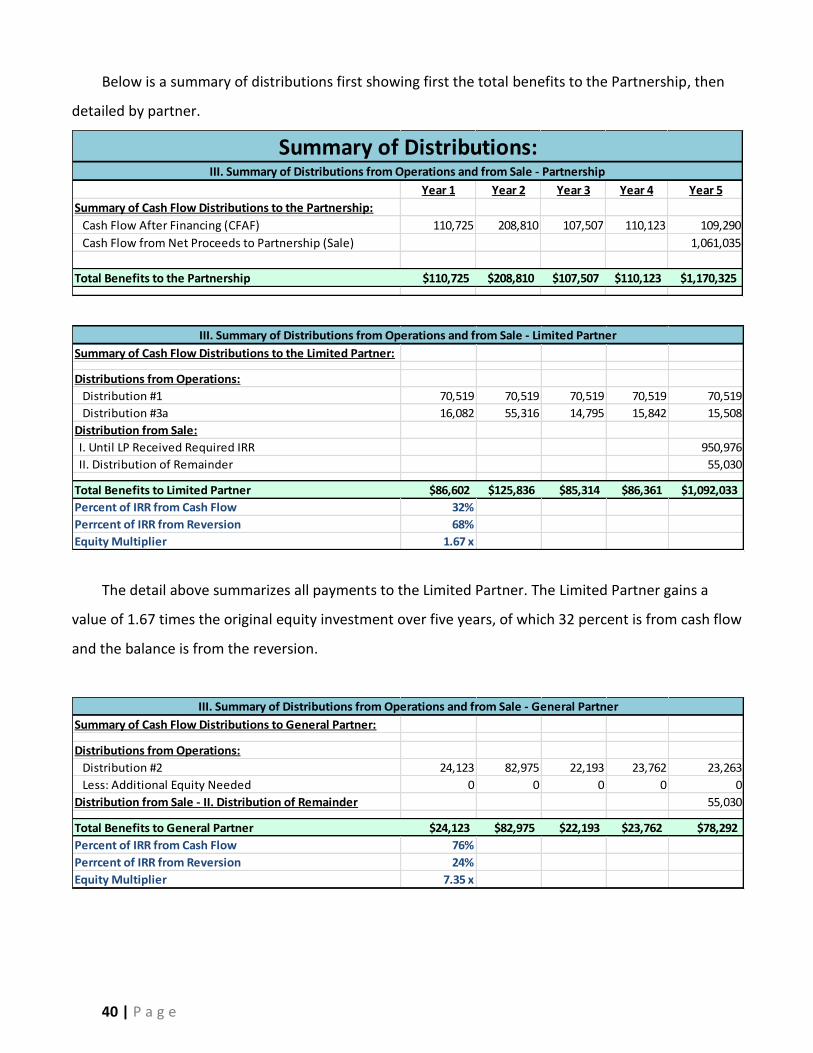
Below is a summary of distributions first showing first the total benefits to the Partnership, then
detailed by partner.
Summary of Distributions:III. Summary of Distributions from Operations and from Sale - Partnership
Year 1 Year 2 Year 3 Year 4 Year 5
Summary of Cash Flow Distributions to the Partnership:
Cash Flow After Financing (CFAF) 110,725 208,810 107,507 110,123 109,290
Cash Flow from Net Proceeds to Partnership (Sale) 1,061,035
Total Benefits to the Partnership $110,725 $208,810 $107,507 $110,123 $1,170,325
III. Summary of Distributions from Operations and from Sale - Limited Partner
Summary of Cash Flow Distributions to the Limited Partner:
Distributions from Operations:
Distribution #1 70,519 70,519 70,519 70,519 70,519
Distribution #3a 16,082 55,316 14,795 15,842 15,508
Distribution from Sale:
I. Until LP Received Required IRR 950,976
II. Distribution of Remainder 55,030
Total Benefits to Limited Partner $86,602 $125,836 $85,314 $86,361 $1,092,033
Percent of IRR from Cash Flow 32%
Perrcent of IRR from Reversion 68%
Equity Multiplier 1.67 x
The detail above summarizes all payments to the Limited Partner. The Limited Partner gains a
value of 1.67 times the original equity investment over five years, of which 32 percent is from cash flow
and the balance is from the reversion.
III. Summary of Distributions from Operations and from Sale - General Partner
Summary of Cash Flow Distributions to General Partner:
Distributions from Operations:
Distribution #2 24,123 82,975 22,193 23,762 23,263
Less: Additional Equity Needed 0 0 0 0 0
Distribution from Sale - II. Distribution of Remainder 55,030
Total Benefits to General Partner $24,123 $82,975 $22,193 $23,762 $78,292
Percent of IRR from Cash Flow 76%
Perrcent of IRR from Reversion 24%
Equity Multiplier 7.35 x
41 | P a g e
The detail above summarizes all payments to the General Partner. The Limited Partner gains a
value of 7.35 times the original equity investment over five years, of which 76 percent is from cash flow
and the balance is from the reversion.
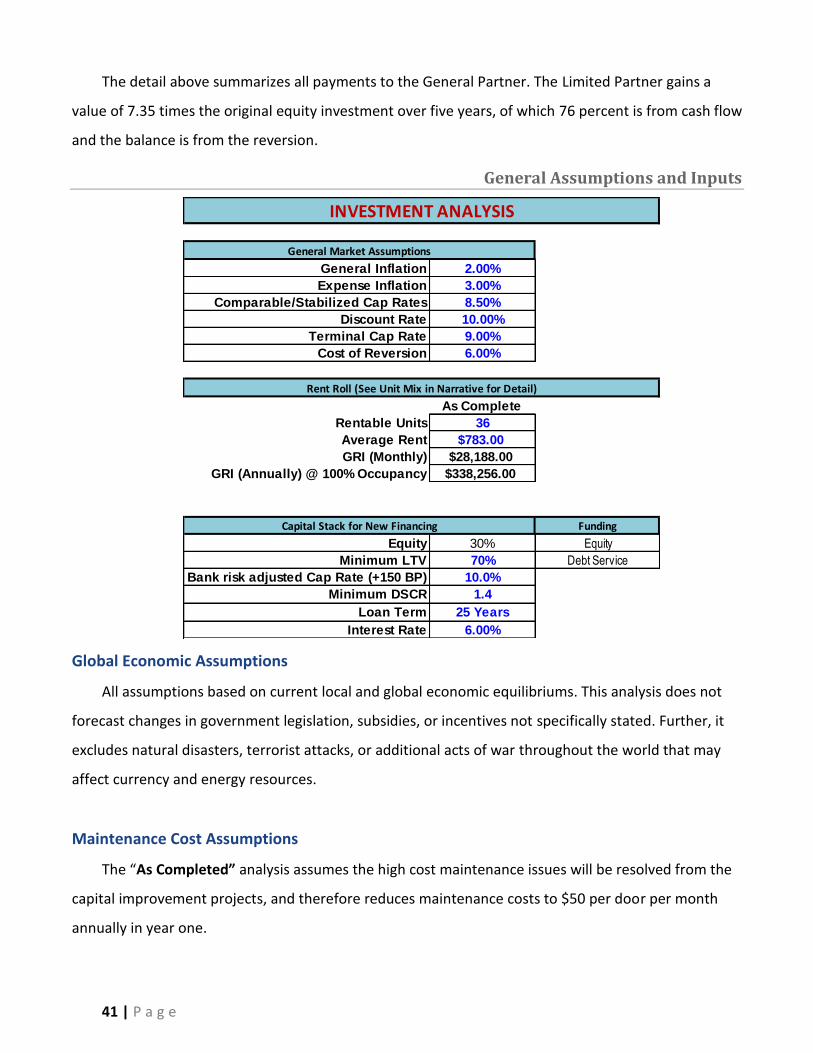
General Assumptions and Inputs
General Market Assumptions
General Inflation 2.00%
Expense Inflation 3.00%
Comparable/Stabilized Cap Rates 8.50%
Discount Rate 10.00%
Terminal Cap Rate 9.00%
Cost of Reversion 6.00%
As Complete
Rentable Units 36
Average Rent $783.00
GRI (Monthly) $28,188.00
GRI (Annually) @ 100% Occupancy $338,256.00
Capital Stack for New Financing Funding
Equity 30% Equity
Minimum LTV 70% Debt Service
Bank risk adjusted Cap Rate (+150 BP) 10.0%
Minimum DSCR 1.4
Loan Term 25 Years
Interest Rate 6.00%
INVESTMENT ANALYSIS
Rent Roll (See Unit Mix in Narrative for Detail)
Global Economic Assumptions
All assumptions based on current local and global economic equilibriums. This analysis does not
forecast changes in government legislation, subsidies, or incentives not specifically stated. Further, it
excludes natural disasters, terrorist attacks, or additional acts of war throughout the world that may
affect currency and energy resources.
Maintenance Cost Assumptions
The “As Completed” analysis assumes the high cost maintenance issues will be resolved from the
capital improvement projects, and therefore reduces maintenance costs to $50 per door per month
annually in year one.
42 | P a g e
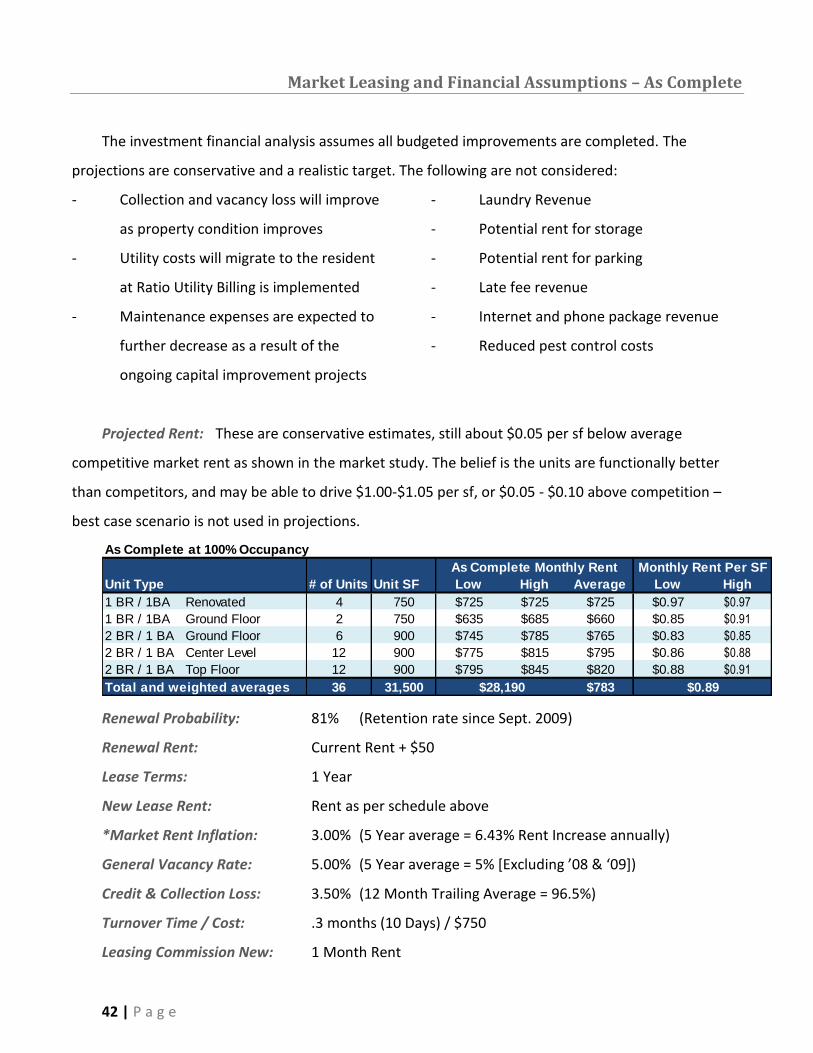
Market Leasing and Financial Assumptions – As Complete
The investment financial analysis assumes all budgeted improvements are completed. The
projections are conservative and a realistic target. The following are not considered:
- Collection and vacancy loss will improve
as property condition improves
- Utility costs will migrate to the resident
at Ratio Utility Billing is implemented
- Maintenance expenses are expected to
further decrease as a result of the
ongoing capital improvement projects
- Laundry Revenue
- Potential rent for storage
- Potential rent for parking
- Late fee revenue
- Internet and phone package revenue
- Reduced pest control costs
Projected Rent: These are conservative estimates, still about $0.05 per sf below average
competitive market rent as shown in the market study. The belief is the units are functionally better
than competitors, and may be able to drive $1.00-$1.05 per sf, or $0.05 - $0.10 above competition –
best case scenario is not used in projections.
As Complete at 100% Occupancy
As Complete Monthly Rent Monthly Rent Per SF
Unit Type # of Units Unit SF Low High Average Low High
1 BR / 1BA Renovated 4 750 $725 $725 $725 $0.97 $0.97
1 BR / 1BA Ground Floor 2 750 $635 $685 $660 $0.85 $0.91
2 BR / 1 BA Ground Floor 6 900 $745 $785 $765 $0.83 $0.85
2 BR / 1 BA Center Level 12 900 $775 $815 $795 $0.86 $0.88
2 BR / 1 BA Top Floor 12 900 $795 $845 $820 $0.88 $0.91
Total and weighted averages 36 31,500 $783$28,190 $0.89
Renewal Probability: 81% (Retention rate since Sept. 2009)
Renewal Rent: Current Rent + $50
Lease Terms: 1 Year
New Lease Rent: Rent as per schedule above
*Market Rent Inflation: 3.00% (5 Year average = 6.43% Rent Increase annually)
General Vacancy Rate: 5.00% (5 Year average = 5% [Excluding ’08 & ‘09])
Credit & Collection Loss: 3.50% (12 Month Trailing Average = 96.5%)
Turnover Time / Cost: .3 months (10 Days) / $750
Leasing Commission New: 1 Month Rent
43 | P a g e
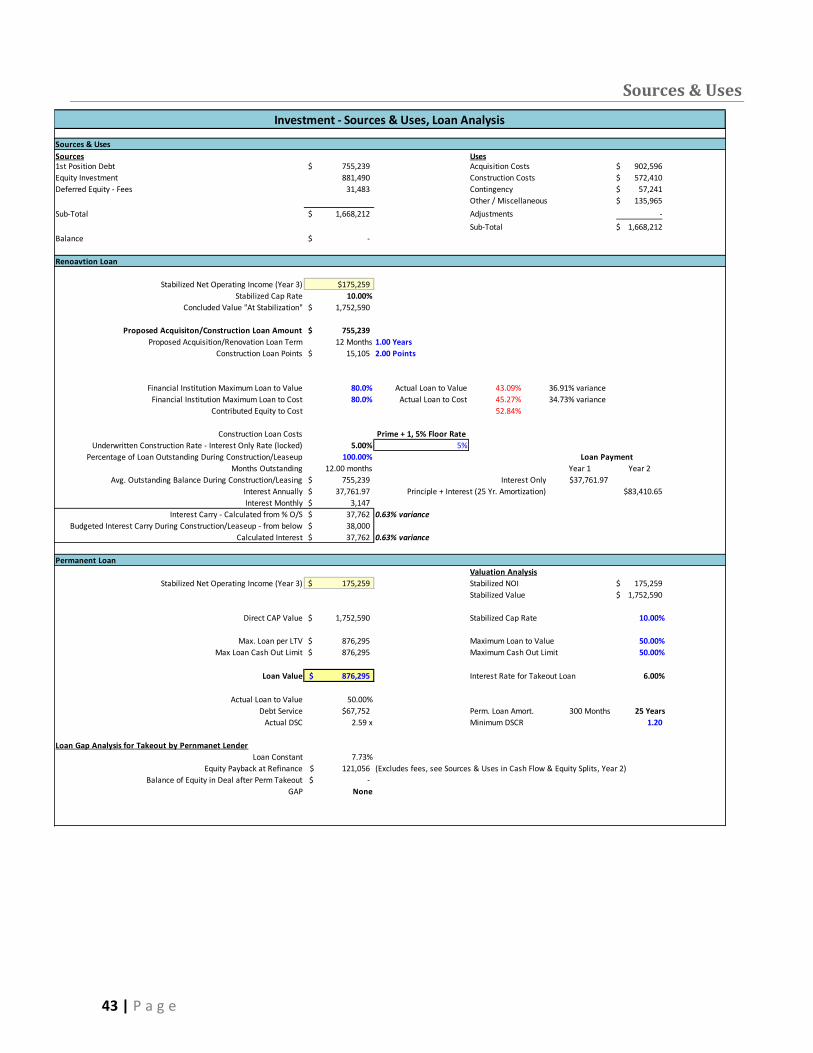
Sources & Uses
Investment - Sources & Uses, Loan Analysis
Sources & Uses
Sources Uses1st Position Debt 755,239$ Acquisition Costs 902,596$
Equity Investment 881,490 Construction Costs 572,410$
Deferred Equity - Fees 31,483 Contingency 57,241$
Other / Miscellaneous 135,965$
Sub-Total 1,668,212$ Adjustments -
Sub-Total 1,668,212$
Balance -$
Renoavtion Loan
Stabilized Net Operating Income (Year 3) $175,259
Stabilized Cap Rate 10.00%
Concluded Value "At Stabilization" 1,752,590$
Proposed Acquisiton/Construction Loan Amount 755,239$
Proposed Acquisition/Renovation Loan Term 12 Months 1.00 Years
Construction Loan Points 15,105$ 2.00 Points
Financial Institution Maximum Loan to Value 80.0% Actual Loan to Value 43.09% 36.91% variance
Financial Institution Maximum Loan to Cost 80.0% Actual Loan to Cost 45.27% 34.73% variance
Contributed Equity to Cost 52.84%
Construction Loan Costs Prime + 1, 5% Floor Rate
Underwritten Construction Rate - Interest Only Rate (locked) 5.00% 5%
Percentage of Loan Outstanding During Construction/Leaseup 100.00% Loan Payment
Months Outstanding 12.00 months Year 1 Year 2
Avg. Outstanding Balance During Construction/Leasing 755,239$ Interest Only $37,761.97
Interest Annually 37,761.97$ Principle + Interest (25 Yr. Amortization) $83,410.65
Interest Monthly 3,147$
Interest Carry - Calculated from % O/S 37,762$ 0.63% variance
Budgeted Interest Carry During Construction/Leaseup - from below 38,000$
Calculated Interest 37,762$ 0.63% variance
Permanent Loan
Valuation Analysis
Stabilized Net Operating Income (Year 3) 175,259$ Stabilized NOI 175,259$
Stabilized Value 1,752,590$
Direct CAP Value 1,752,590$ Stabilized Cap Rate 10.00%
Max. Loan per LTV 876,295$ Maximum Loan to Value 50.00%
Max Loan Cash Out Limit 876,295$ Maximum Cash Out Limit 50.00%
Loan Value 876,295$ Interest Rate for Takeout Loan 6.00%
Actual Loan to Value 50.00%
Debt Service $67,752 Perm. Loan Amort. 300 Months 25 Years
Actual DSC 2.59 x Minimum DSCR 1.20
Loan Gap Analysis for Takeout by Pernmanet Lender
Loan Constant 7.73%
Equity Payback at Refinance 121,056$ (Excludes fees, see Sources & Uses in Cash Flow & Equity Splits, Year 2)
Balance of Equity in Deal after Perm Takeout -$
GAP None
44 | P a g e
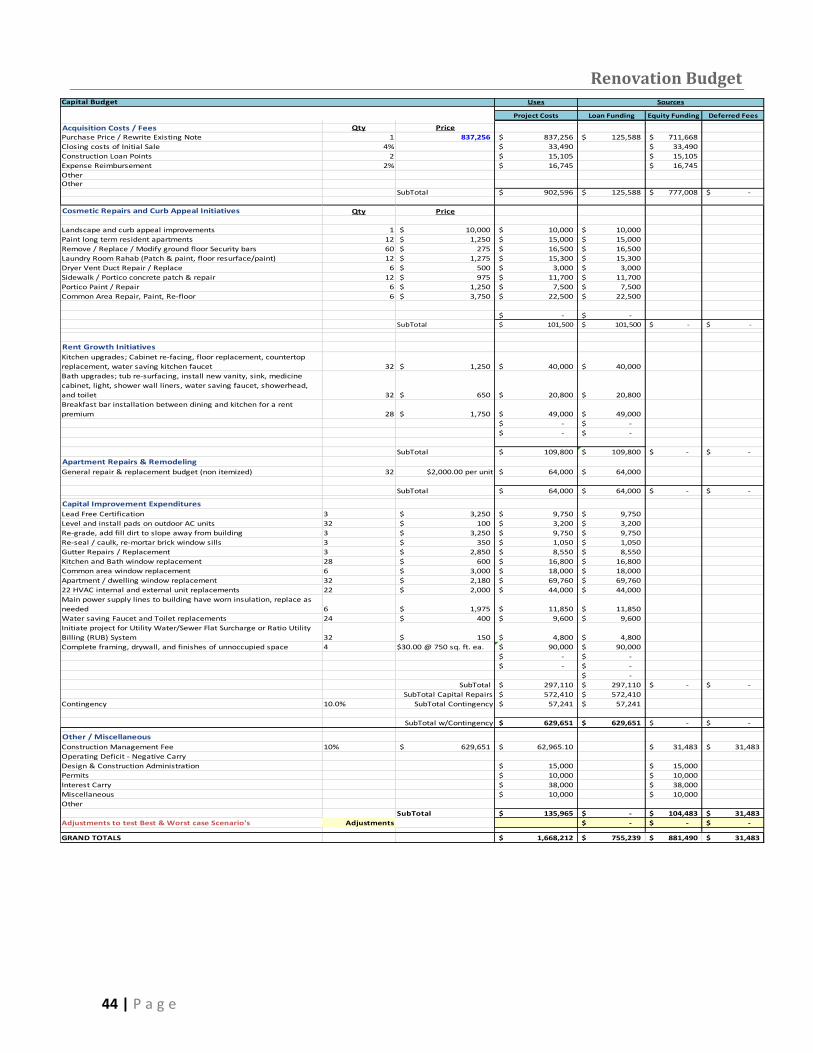
Renovation Budget Capital Budget Uses Sources
Project Costs Loan Funding Equity Funding Deferred Fees
Acquisition Costs / Fees Qty Price
Purchase Price / Rewrite Existing Note 1 837,256 837,256$ 125,588$ 711,668$
Closing costs of Initial Sale 4% 33,490$ 33,490$
Construction Loan Points 2 15,105$ 15,105$
Expense Reimbursement 2% 16,745$ 16,745$
OtherOther
SubTotal 902,596$ 125,588$ 777,008$ -$
Cosmetic Repairs and Curb Appeal Initiatives Qty Price
Landscape and curb appeal improvements 1 10,000$ 10,000$ 10,000$
Paint long term resident apartments 12 1,250$ 15,000$ 15,000$
Remove / Replace / Modify ground floor Security bars 60 275$ 16,500$ 16,500$
Laundry Room Rahab (Patch & paint, floor resurface/paint) 12 1,275$ 15,300$ 15,300$
Dryer Vent Duct Repair / Replace 6 500$ 3,000$ 3,000$
Sidewalk / Portico concrete patch & repair 12 975$ 11,700$ 11,700$
Portico Paint / Repair 6 1,250$ 7,500$ 7,500$
Common Area Repair, Paint, Re-floor 6 3,750$ 22,500$ 22,500$
-$ -$
SubTotal 101,500$ 101,500$ -$ -$
Rent Growth Initiatives
Kitchen upgrades; Cabinet re-facing, floor replacement, countertop
replacement, water saving kitchen faucet 32 1,250$ 40,000$ 40,000$
Bath upgrades; tub re-surfacing, install new vanity, sink, medicine
cabinet, light, shower wall liners, water saving faucet, showerhead,
and toilet 32 650$ 20,800$ 20,800$
Breakfast bar installation between dining and kitchen for a rent
premium 28 1,750$ 49,000$ 49,000$
-$ -$
-$ -$
SubTotal 109,800$ 109,800$ -$ -$
Apartment Repairs & Remodeling
General repair & replacement budget (non itemized) 32 $2,000.00 per unit 64,000$ 64,000$
SubTotal 64,000$ 64,000$ -$ -$
Capital Improvement Expenditures
Lead Free Certification 3 3,250$ 9,750$ 9,750$
Level and install pads on outdoor AC units 32 100$ 3,200$ 3,200$
Re-grade, add fill dirt to slope away from building 3 3,250$ 9,750$ 9,750$
Re-seal / caulk, re-mortar brick window sills 3 350$ 1,050$ 1,050$
Gutter Repairs / Replacement 3 2,850$ 8,550$ 8,550$
Kitchen and Bath window replacement 28 600$ 16,800$ 16,800$
Common area window replacement 6 3,000$ 18,000$ 18,000$
Apartment / dwelling window replacement 32 2,180$ 69,760$ 69,760$
22 HVAC internal and external unit replacements 22 2,000$ 44,000$ 44,000$
Main power supply lines to building have worn insulation, replace as
needed 6 1,975$ 11,850$ 11,850$
Water saving Faucet and Toilet replacements 24 400$ 9,600$ 9,600$
Initiate project for Utility Water/Sewer Flat Surcharge or Ratio Utility
Billing (RUB) System 32 150$ 4,800$ 4,800$
Complete framing, drywall, and finishes of unnoccupied space 4 $30.00 @ 750 sq. ft. ea. 90,000$ 90,000$
-$ -$
-$ -$
-$
SubTotal 297,110$ 297,110$ -$ -$
SubTotal Capital Repairs 572,410$ 572,410$
Contingency 10.0% SubTotal Contingency 57,241$ 57,241$
SubTotal w/Contingency 629,651$ 629,651$ -$ -$
Other / Miscellaneous
Construction Management Fee 10% 629,651$ 62,965.10$ 31,483$ 31,483$
Operating Deficit - Negative Carry
Design & Construction Administration 15,000$ 15,000$
Permits 10,000$ 10,000$
Interest Carry 38,000$ 38,000$
Miscellaneous 10,000$ 10,000$
Other
SubTotal 135,965$ -$ 104,483$ 31,483$
Adjustments to test Best & Worst case Scenario's Adjustments -$ -$ -$
GRAND TOTALS 1,668,212$ 755,239$ 881,490$ 31,483$
45 | P a g e
Government Support for Project
The efficacy of this investment supports itself without any special government programs or grants.
Several were investigated, and there are a couple of viable options that may help improve the financial
performance of the investment. First, the Baltimore City Department of Housing and Community
Development has a Community Development Block Grant Program requiring an application process
(Baltimore Housing) that may be viable. Also, the Federal Low Income Housing Tax Credit Program may
provide some expense relief. The concern with such programs is rent control, however it doesn’t
appear this program controls rent. The owner of a qualified low-income building must rent either 20
percent of the units to households with incomes of 50 percent or less of the area median income or 40
percent of the units to households with incomes of 60 percent or less of the area median income (MD
Housing). An initial search of demographics suggests it may qualify because the median income of the
area is $51,816 (Baltimore Cityview). That would require that we rent 7 units to persons with an
income of less than $25,908, or $2,159 monthly. This currently is within our income requirement
threshold of three times monthly rent (average rent is $683).
Any benefit without rent controls that will improve the financial performance will be pursued in
order to enhance the return to investors.
BUSINESS, PROPERTY AND ASSET MANAGEMENT PLAN
Wojo Realty Group serves as the Managing Member (General Partner) of an investment
partnership with an equity investor (Limited Partner) using a preferred equitable split of cash flow and
reversion based on a negotiated operating agreement. Unique to this investment is the Limited Partner
requires non-recourse financing. Therefore maximum leverage cannot be used and consequently
returns are less than typical alternative leveraged real estate. Therefore equity splits are negotiated to
serve each Partners interest and investment objectives and are not based on the amount of respective
capital investments into the project by each of the two partners. The MM receives a nominal seven
percent management fee of Gross Rental Income and is incentivized to improve financial performance
and value of the property for the reversionary splits. No fees will be earned for acquisition or by
obtaining financing. Disposition fees are earned in the event a sale was to take place.
46 | P a g e
Wojo Realty Group assigns a project manager to oversee and manage renovations, and property
manager to lease and manage maintenance, and an asset manager to ensure the property achieves
investment objectives and to provide necessary reporting statements. All staffing fees are either
carried by the company or reimbursed in the renovation budget.
Wojo Realty Group will continue to manage and lease this property after renovations are
complete. It has a 2.5 year history of management with this property and the investment benefits from
its working knowledge and relationship with the existing residents. As renovations improve the
property, the leasing objective is to attract a higher income and potentially higher quality resident. The
objective is to be fully occupied by the end of the second year. Wojo Realty Group has been successful
with quickly leasing without on-site staff. Advertising through its property management software
system and leasing signs have provided an adequate number of leads. Leads are prequalified on the
phone and then complete an application online or in person at the appointment. Minimum income is
three times rent, and they cannot have a criminal background nor have been evicted.
Wojo Realty Group has been successful with resident placement averaging a 7:1 lead to lease
close ratio. It has had to evict less than 5% of its placed residents and collections are at 97%.
CONCLUSION
The ownership has two viable exit strategies: reposition the property (which is possible only if the
Columbia Bank loan application is approved), or to sell the property As-Is. Repositioning and selling will
benefit the ownership equity through increased property value after improvements. If the ownership
refinance application is not approved, then selling is the alternative. An appropriate listing price is
$1,175,588 to provide adequate negotiation margin. If the ownership provides seller financing, they
have potential to achieve a slightly higher closing price than would otherwise likely be offered.
A buyer will derive a value of $837,256 using a direct capitalization method at a 10 percent cap
rate after adjustments in order to provide an acceptable return to investors. The expected, best and
worst case scenarios are based on that purchase price. The maximum acceptable offering price is $1
million that will provide a reduced, but acceptable return of 10 percent to the Limited Partner.
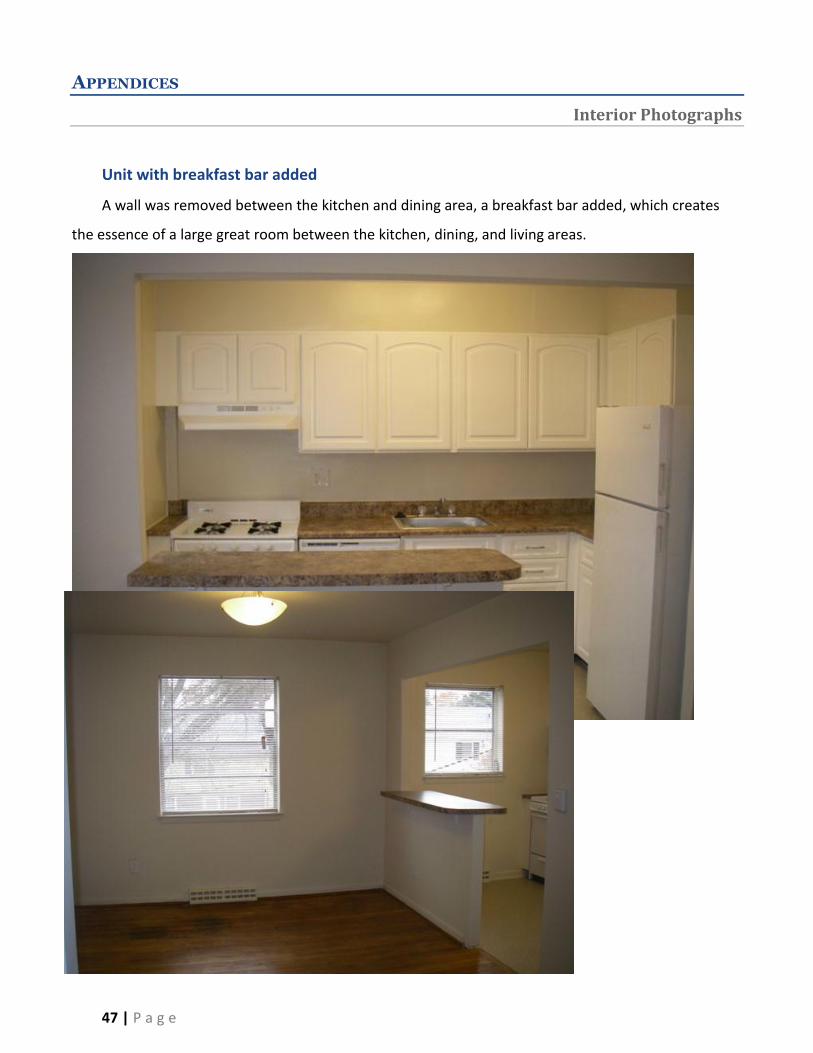
47 | P a g e
APPENDICES
Interior Photographs
Unit with breakfast bar added
A wall was removed between the kitchen and dining area, a breakfast bar added, which creates
the essence of a large great room between the kitchen, dining, and living areas.
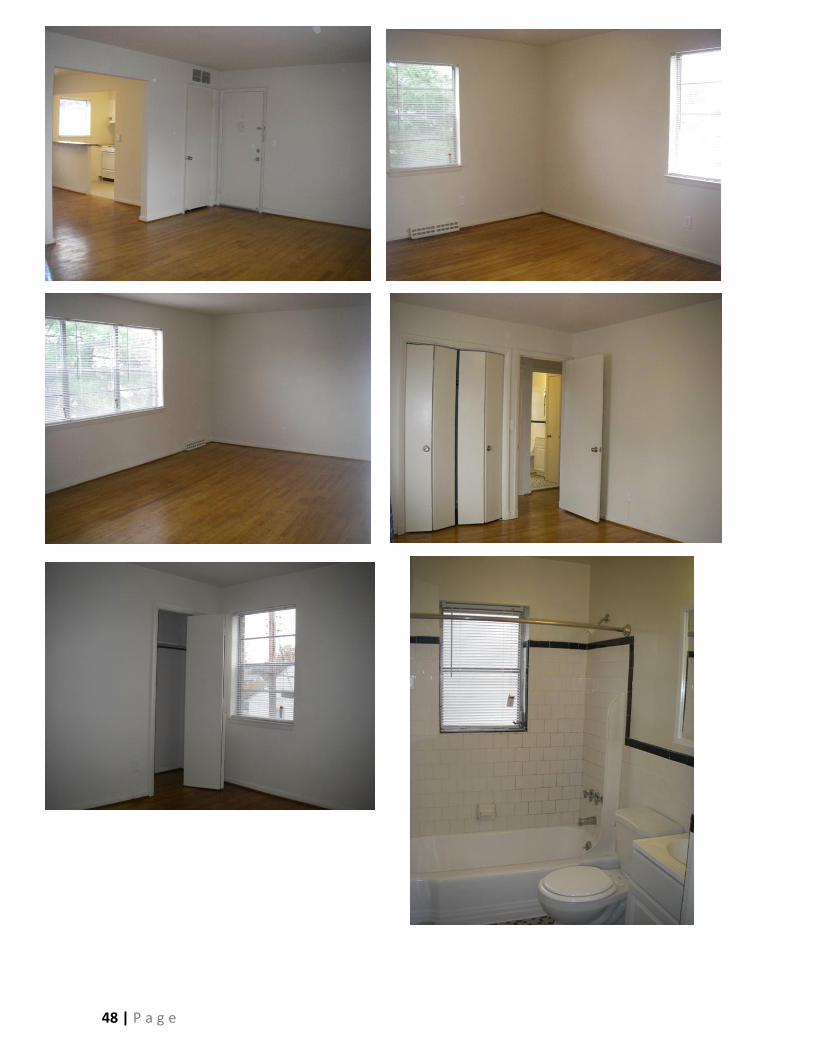
48 | P a g e
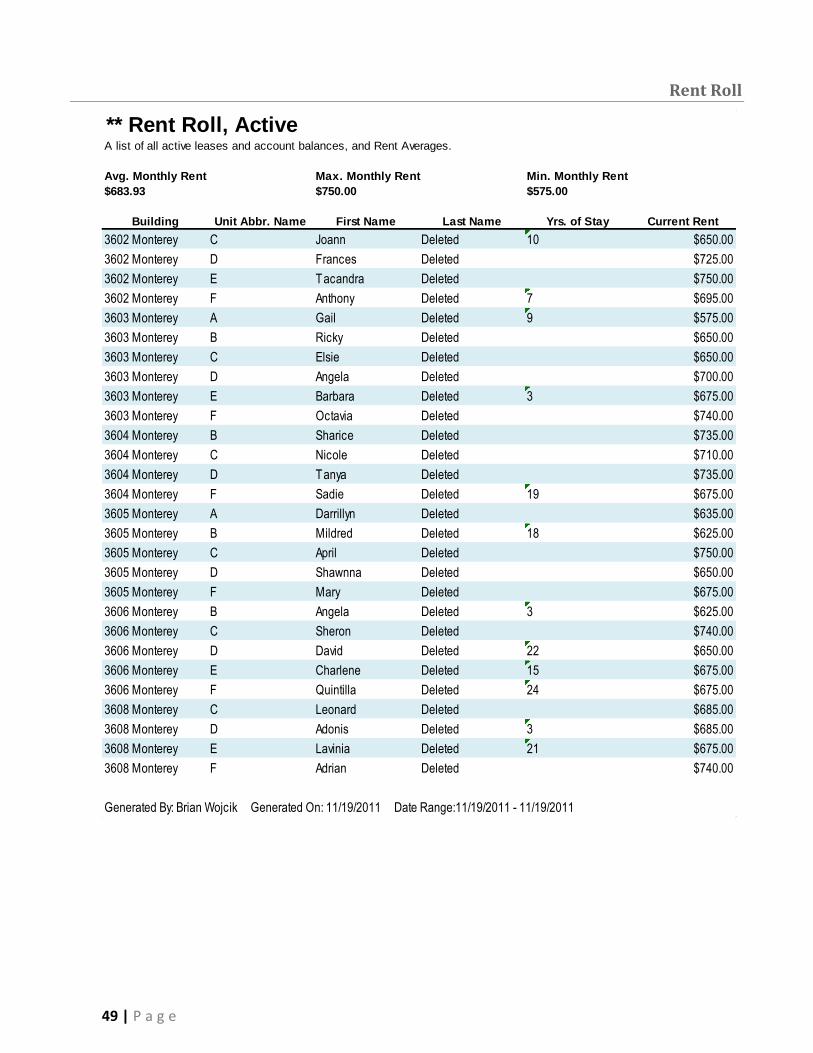
49 | P a g e
Rent Roll
A list of all active leases and account balances, and Rent Averages.
Avg. Monthly Rent Max. Monthly Rent Min. Monthly Rent
$683.93 $750.00 $575.00
Building Unit Abbr. Name First Name Last Name Yrs. of Stay Current Rent
3602 Monterey C Joann Deleted 10 $650.00
3602 Monterey D Frances Deleted $725.00
3602 Monterey E Tacandra Deleted $750.00
3602 Monterey F Anthony Deleted 7 $695.00
3603 Monterey A Gail Deleted 9 $575.00
3603 Monterey B Ricky Deleted $650.00
3603 Monterey C Elsie Deleted $650.00
3603 Monterey D Angela Deleted $700.00
3603 Monterey E Barbara Deleted 3 $675.00
3603 Monterey F Octavia Deleted $740.00
3604 Monterey B Sharice Deleted $735.00
3604 Monterey C Nicole Deleted $710.00
3604 Monterey D Tanya Deleted $735.00
3604 Monterey F Sadie Deleted 19 $675.00
3605 Monterey A Darrillyn Deleted $635.00
3605 Monterey B Mildred Deleted 18 $625.00
3605 Monterey C April Deleted $750.00
3605 Monterey D Shawnna Deleted $650.00
3605 Monterey F Mary Deleted $675.00
3606 Monterey B Angela Deleted 3 $625.00
3606 Monterey C Sheron Deleted $740.00
3606 Monterey D David Deleted 22 $650.00
3606 Monterey E Charlene Deleted 15 $675.00
3606 Monterey F Quintilla Deleted 24 $675.00
3608 Monterey C Leonard Deleted $685.00
3608 Monterey D Adonis Deleted 3 $685.00
3608 Monterey E Lavinia Deleted 21 $675.00
3608 Monterey F Adrian Deleted $740.00
Generated By: Brian Wojcik Generated On: 11/19/2011 Date Range:11/19/2011 - 11/19/2011
** Rent Roll, Active
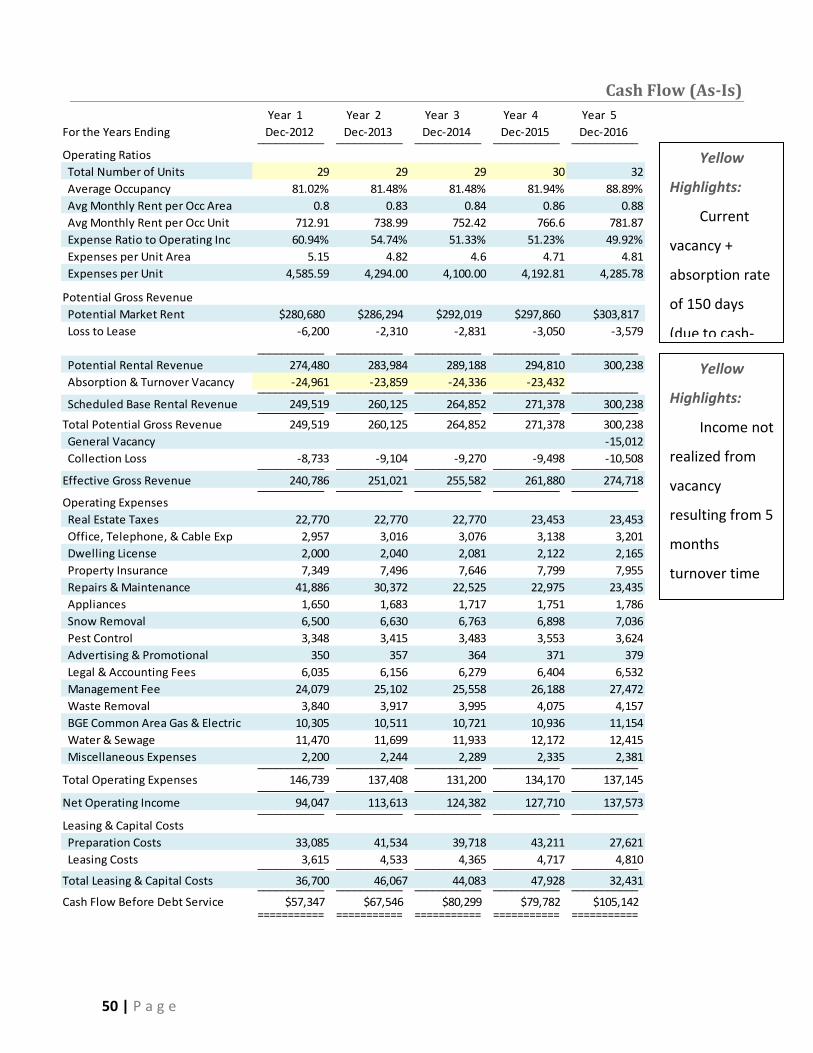
50 | P a g e
Cash Flow (As-Is)
Year 1 Year 2 Year 3 Year 4 Year 5
For the Years Ending Dec-2012 Dec-2013 Dec-2014 Dec-2015 Dec-2016 ___________ ___________ ___________ ___________ ___________
Operating Ratios
Total Number of Units 29 29 29 30 32
Average Occupancy 81.02% 81.48% 81.48% 81.94% 88.89%
Avg Monthly Rent per Occ Area 0.8 0.83 0.84 0.86 0.88
Avg Monthly Rent per Occ Unit 712.91 738.99 752.42 766.6 781.87
Expense Ratio to Operating Inc 60.94% 54.74% 51.33% 51.23% 49.92%
Expenses per Unit Area 5.15 4.82 4.6 4.71 4.81
Expenses per Unit 4,585.59 4,294.00 4,100.00 4,192.81 4,285.78
Potential Gross Revenue
Potential Market Rent $280,680 $286,294 $292,019 $297,860 $303,817
Loss to Lease -6,200 -2,310 -2,831 -3,050 -3,579
___________ ___________ ___________ ___________ ___________
Potential Rental Revenue 274,480 283,984 289,188 294,810 300,238
Absorption & Turnover Vacancy -24,961 -23,859 -24,336 -23,432 ___________ ___________ ___________ ___________ ___________
Scheduled Base Rental Revenue 249,519 260,125 264,852 271,378 300,238 ___________ ___________ ___________ ___________ ___________
Total Potential Gross Revenue 249,519 260,125 264,852 271,378 300,238
General Vacancy -15,012
Collection Loss -8,733 -9,104 -9,270 -9,498 -10,508 ___________ ___________ ___________ ___________ ___________
Effective Gross Revenue 240,786 251,021 255,582 261,880 274,718 ___________ ___________ ___________ ___________ ___________
Operating Expenses
Real Estate Taxes 22,770 22,770 22,770 23,453 23,453
Office, Telephone, & Cable Exp 2,957 3,016 3,076 3,138 3,201
Dwelling License 2,000 2,040 2,081 2,122 2,165
Property Insurance 7,349 7,496 7,646 7,799 7,955
Repairs & Maintenance 41,886 30,372 22,525 22,975 23,435
Appliances 1,650 1,683 1,717 1,751 1,786
Snow Removal 6,500 6,630 6,763 6,898 7,036
Pest Control 3,348 3,415 3,483 3,553 3,624
Advertising & Promotional 350 357 364 371 379
Legal & Accounting Fees 6,035 6,156 6,279 6,404 6,532
Management Fee 24,079 25,102 25,558 26,188 27,472
Waste Removal 3,840 3,917 3,995 4,075 4,157
BGE Common Area Gas & Electric 10,305 10,511 10,721 10,936 11,154
Water & Sewage 11,470 11,699 11,933 12,172 12,415
Miscellaneous Expenses 2,200 2,244 2,289 2,335 2,381 ___________ ___________ ___________ ___________ ___________
Total Operating Expenses 146,739 137,408 131,200 134,170 137,145 ___________ ___________ ___________ ___________ ___________
Net Operating Income 94,047 113,613 124,382 127,710 137,573 ___________ ___________ ___________ ___________ ___________
Leasing & Capital Costs
Preparation Costs 33,085 41,534 39,718 43,211 27,621
Leasing Costs 3,615 4,533 4,365 4,717 4,810 ___________ ___________ ___________ ___________ ___________
Total Leasing & Capital Costs 36,700 46,067 44,083 47,928 32,431 ___________ ___________ ___________ ___________ ___________
Cash Flow Before Debt Service $57,347 $67,546 $80,299 $79,782 $105,142 =========== =========== =========== =========== ===========
Yellow
Highlights:
Income not
realized from
vacancy
resulting from 5
months
turnover time
by funding
Yellow
Highlights:
Current
vacancy +
absorption rate
of 150 days
(due to cash-
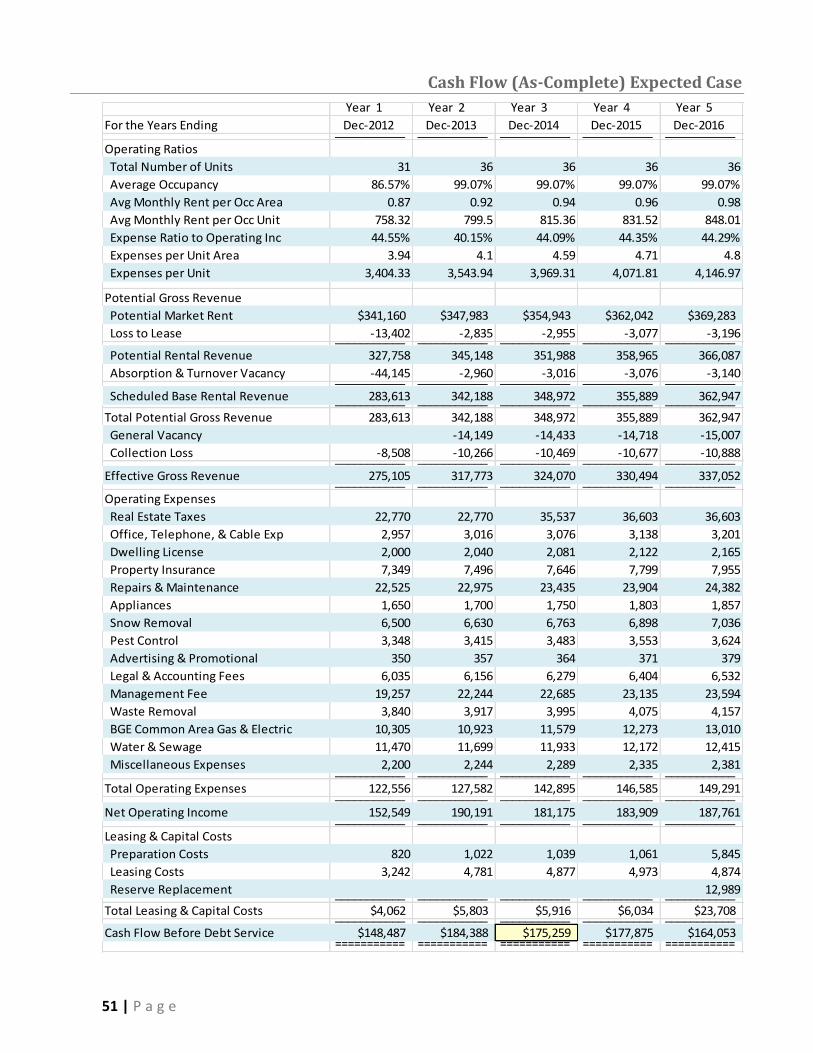
51 | P a g e
Cash Flow (As-Complete) Expected Case
Year 1 Year 2 Year 3 Year 4 Year 5
For the Years Ending Dec-2012 Dec-2013 Dec-2014 Dec-2015 Dec-2016 ___________ ___________ ___________ ___________ ___________
Operating Ratios
Total Number of Units 31 36 36 36 36
Average Occupancy 86.57% 99.07% 99.07% 99.07% 99.07%
Avg Monthly Rent per Occ Area 0.87 0.92 0.94 0.96 0.98
Avg Monthly Rent per Occ Unit 758.32 799.5 815.36 831.52 848.01
Expense Ratio to Operating Inc 44.55% 40.15% 44.09% 44.35% 44.29%
Expenses per Unit Area 3.94 4.1 4.59 4.71 4.8
Expenses per Unit 3,404.33 3,543.94 3,969.31 4,071.81 4,146.97
Potential Gross Revenue
Potential Market Rent $341,160 $347,983 $354,943 $362,042 $369,283
Loss to Lease -13,402 -2,835 -2,955 -3,077 -3,196 ___________ ___________ ___________ ___________ ___________
Potential Rental Revenue 327,758 345,148 351,988 358,965 366,087
Absorption & Turnover Vacancy -44,145 -2,960 -3,016 -3,076 -3,140 ___________ ___________ ___________ ___________ ___________
Scheduled Base Rental Revenue 283,613 342,188 348,972 355,889 362,947 ___________ ___________ ___________ ___________ ___________
Total Potential Gross Revenue 283,613 342,188 348,972 355,889 362,947
General Vacancy -14,149 -14,433 -14,718 -15,007
Collection Loss -8,508 -10,266 -10,469 -10,677 -10,888 ___________ ___________ ___________ ___________ ___________
Effective Gross Revenue 275,105 317,773 324,070 330,494 337,052 ___________ ___________ ___________ ___________ ___________
Operating Expenses
Real Estate Taxes 22,770 22,770 35,537 36,603 36,603
Office, Telephone, & Cable Exp 2,957 3,016 3,076 3,138 3,201
Dwelling License 2,000 2,040 2,081 2,122 2,165
Property Insurance 7,349 7,496 7,646 7,799 7,955
Repairs & Maintenance 22,525 22,975 23,435 23,904 24,382
Appliances 1,650 1,700 1,750 1,803 1,857
Snow Removal 6,500 6,630 6,763 6,898 7,036
Pest Control 3,348 3,415 3,483 3,553 3,624
Advertising & Promotional 350 357 364 371 379
Legal & Accounting Fees 6,035 6,156 6,279 6,404 6,532
Management Fee 19,257 22,244 22,685 23,135 23,594
Waste Removal 3,840 3,917 3,995 4,075 4,157
BGE Common Area Gas & Electric 10,305 10,923 11,579 12,273 13,010
Water & Sewage 11,470 11,699 11,933 12,172 12,415
Miscellaneous Expenses 2,200 2,244 2,289 2,335 2,381 ___________ ___________ ___________ ___________ ___________
Total Operating Expenses 122,556 127,582 142,895 146,585 149,291 ___________ ___________ ___________ ___________ ___________
Net Operating Income 152,549 190,191 181,175 183,909 187,761 ___________ ___________ ___________ ___________ ___________
Leasing & Capital Costs
Preparation Costs 820 1,022 1,039 1,061 5,845
Leasing Costs 3,242 4,781 4,877 4,973 4,874
Reserve Replacement 12,989 ___________ ___________ ___________ ___________ ___________
Total Leasing & Capital Costs $4,062 $5,803 $5,916 $6,034 $23,708 ___________ ___________ ___________ ___________ ___________
Cash Flow Before Debt Service $148,487 $184,388 $175,259 $177,875 $164,053 =========== =========== =========== =========== ===========
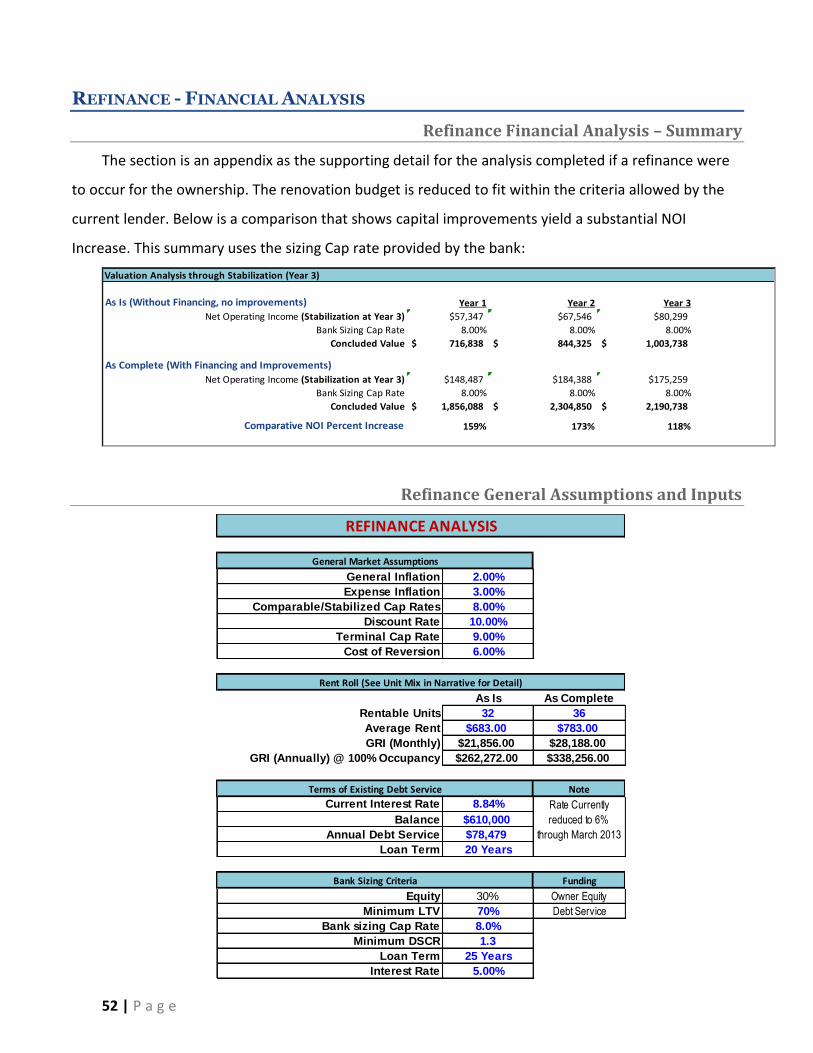
52 | P a g e
REFINANCE - FINANCIAL ANALYSIS
Refinance Financial Analysis – Summary
The section is an appendix as the supporting detail for the analysis completed if a refinance were
to occur for the ownership. The renovation budget is reduced to fit within the criteria allowed by the
current lender. Below is a comparison that shows capital improvements yield a substantial NOI
Increase. This summary uses the sizing Cap rate provided by the bank:
Valuation Analysis through Stabilization (Year 3)
As Is (Without Financing, no improvements) Year 1 Year 2 Year 3
Net Operating Income (Stabilization at Year 3) $57,347 $67,546 $80,299
Bank Sizing Cap Rate 8.00% 8.00% 8.00%
Concluded Value 716,838$ 844,325$ 1,003,738$
As Complete (With Financing and Improvements)
Net Operating Income (Stabilization at Year 3) $148,487 $184,388 $175,259
Bank Sizing Cap Rate 8.00% 8.00% 8.00%
Concluded Value 1,856,088$ 2,304,850$ 2,190,738$
Comparative NOI Percent Increase 159% 173% 118%
Refinance General Assumptions and Inputs
General Market Assumptions General Market Assumptions
General Inflation 2.00%
Expense Inflation 3.00%
Comparable/Stabilized Cap Rates 8.00%
Discount Rate 10.00%
Terminal Cap Rate 9.00%
Cost of Reversion 6.00%
As Is As Complete
Rentable Units 32 36
Average Rent $683.00 $783.00
GRI (Monthly) $21,856.00 $28,188.00
GRI (Annually) @ 100% Occupancy $262,272.00 $338,256.00
Note
Current Interest Rate 8.84%
Balance $610,000
Annual Debt Service $78,479
Loan Term 20 Years
Bank Sizing Criteria Funding
Equity 30% Owner Equity
Minimum LTV 70% Debt Service
Bank sizing Cap Rate 8.0%
Minimum DSCR 1.3
Loan Term 25 Years
Interest Rate 5.00%
Rate Currently
reduced to 6%
through March 2013
REFINANCE ANALYSIS
Rent Roll (See Unit Mix in Narrative for Detail)
Terms of Existing Debt Service
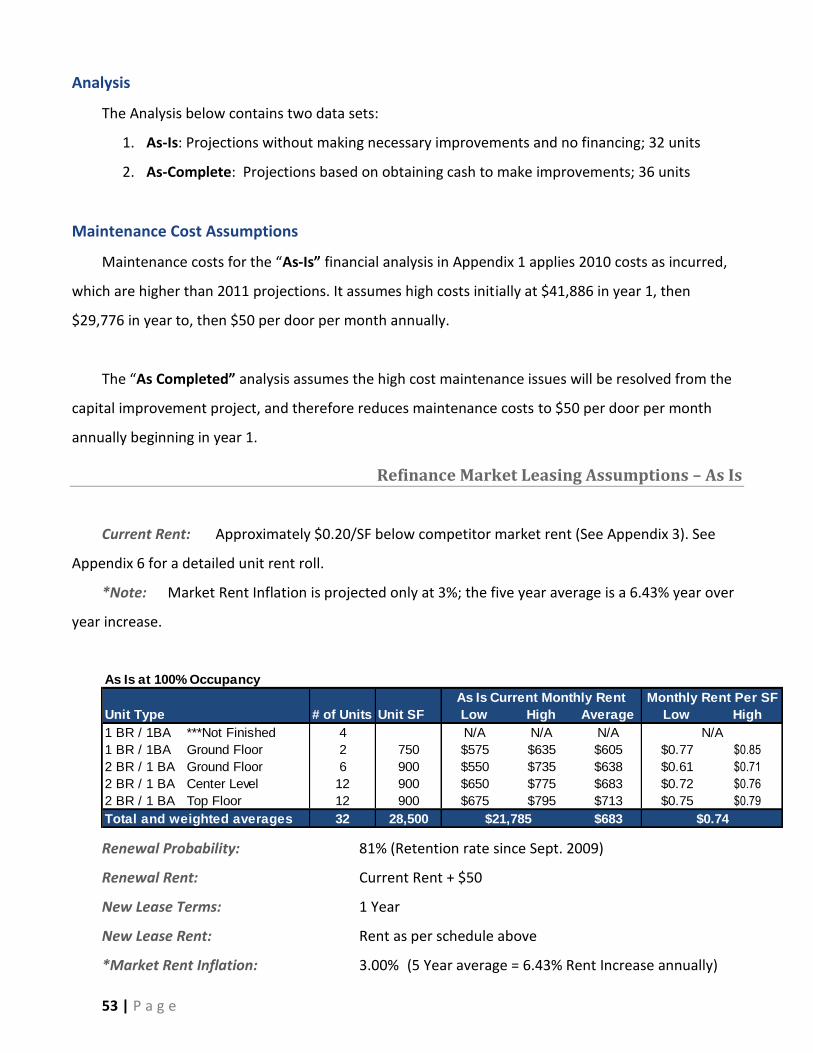
53 | P a g e
Analysis
The Analysis below contains two data sets:
1. As-Is: Projections without making necessary improvements and no financing; 32 units
2. As-Complete: Projections based on obtaining cash to make improvements; 36 units
Maintenance Cost Assumptions
Maintenance costs for the “As-Is” financial analysis in Appendix 1 applies 2010 costs as incurred,
which are higher than 2011 projections. It assumes high costs initially at $41,886 in year 1, then
$29,776 in year to, then $50 per door per month annually.
The “As Completed” analysis assumes the high cost maintenance issues will be resolved from the
capital improvement project, and therefore reduces maintenance costs to $50 per door per month
annually beginning in year 1.
Refinance Market Leasing Assumptions – As Is
Current Rent: Approximately $0.20/SF below competitor market rent (See Appendix 3). See
Appendix 6 for a detailed unit rent roll.
*Note: Market Rent Inflation is projected only at 3%; the five year average is a 6.43% year over
year increase.
Renewal Probability: 81% (Retention rate since Sept. 2009)
Renewal Rent: Current Rent + $50
New Lease Terms: 1 Year
New Lease Rent: Rent as per schedule above
*Market Rent Inflation: 3.00% (5 Year average = 6.43% Rent Increase annually)
As Is at 100% Occupancy
As Is Current Monthly Rent Monthly Rent Per SF
Unit Type # of Units Unit SF Low High Average Low High
1 BR / 1BA ***Not Finished 4 N/A N/A N/A N/A
1 BR / 1BA Ground Floor 2 750 $575 $635 $605 $0.77 $0.85
2 BR / 1 BA Ground Floor 6 900 $550 $735 $638 $0.61 $0.71
2 BR / 1 BA Center Level 12 900 $650 $775 $683 $0.72 $0.76
2 BR / 1 BA Top Floor 12 900 $675 $795 $713 $0.75 $0.79
Total and weighted averages 32 28,500 $683$21,785 $0.74
54 | P a g e
General Vacancy Rate: 5.00% (5 Year average = 5% [Excluding ’08 & ‘09])
Credit & Collection Loss: 3.50% (12 Month Trailing Average = 96.5%)
Turnover Time / Cost: 5 months / $3,500 (Current Average Time & Cost)
Leasing Commission New: 1 Month Rent
Debt Service
Existing Monthly Payment: $7,343 (currently reduced to $6,539.89 through March 2013 for
an interest rate reduction due to result of owner military service deployment overseas)
Interest Rate: 8.84% (Currently reduce to 6% as indicated above)
Amortization: 20
Existing 1st Balance: $610,000
Refinance Market Leasing and Financial Assumptions – As Complete
The only variables changed are average rents, the reduction in time and cost for a turnover, and
the projection of maintenance expenses as stated in the Maintenance Cost Assumptions. All other
market leasing assumptions remain the same. Therefore, the “As-Complete” projections are
conservative and a realistic target. The following are not considered:
- Collection and vacancy loss will improve
as property condition improves
- Utility costs will migrate to the resident
at Ratio Utility Billing is implemented
- Maintenance expenses are expected to
further decrease as a result of the
ongoing capital improvement projects
- Laundry Revenue
- Potential rent for storage
- Potential rent for parking
- Late fee revenue
- Internet and phone package revenue
- Reduced pest control costs
Projected Rent: These are conservative estimates, still about $0.10 per sf below average
competitive market rent as shown in Appendix 3. The belief is the units are functionally better than
competitors, and may be able to drive $1.05 - $1.10 / SF, or $0.05 - $0.10 above competition – best
case scenario is not used in projections.
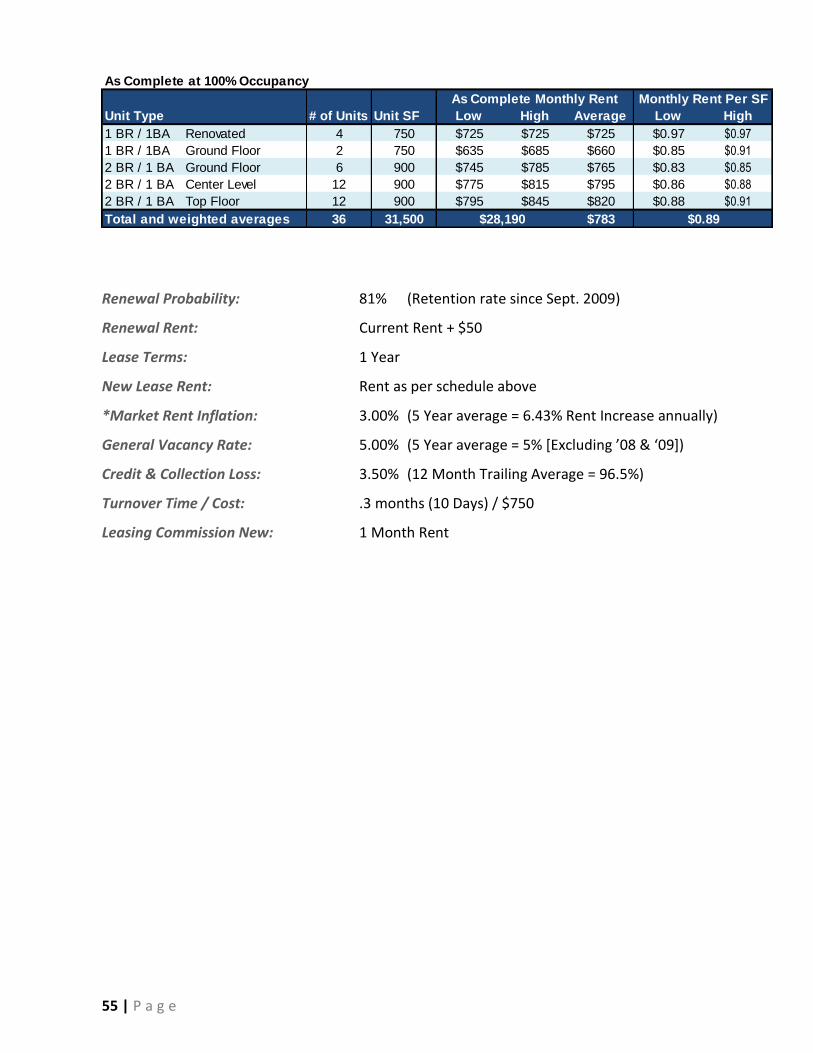
55 | P a g e
Renewal Probability: 81% (Retention rate since Sept. 2009)
Renewal Rent: Current Rent + $50
Lease Terms: 1 Year
New Lease Rent: Rent as per schedule above
*Market Rent Inflation: 3.00% (5 Year average = 6.43% Rent Increase annually)
General Vacancy Rate: 5.00% (5 Year average = 5% [Excluding ’08 & ‘09])
Credit & Collection Loss: 3.50% (12 Month Trailing Average = 96.5%)
Turnover Time / Cost: .3 months (10 Days) / $750
Leasing Commission New: 1 Month Rent
As Complete at 100% Occupancy
As Complete Monthly Rent Monthly Rent Per SF
Unit Type # of Units Unit SF Low High Average Low High
1 BR / 1BA Renovated 4 750 $725 $725 $725 $0.97 $0.97
1 BR / 1BA Ground Floor 2 750 $635 $685 $660 $0.85 $0.91
2 BR / 1 BA Ground Floor 6 900 $745 $785 $765 $0.83 $0.85
2 BR / 1 BA Center Level 12 900 $775 $815 $795 $0.86 $0.88
2 BR / 1 BA Top Floor 12 900 $795 $845 $820 $0.88 $0.91
Total and weighted averages 36 31,500 $783$28,190 $0.89
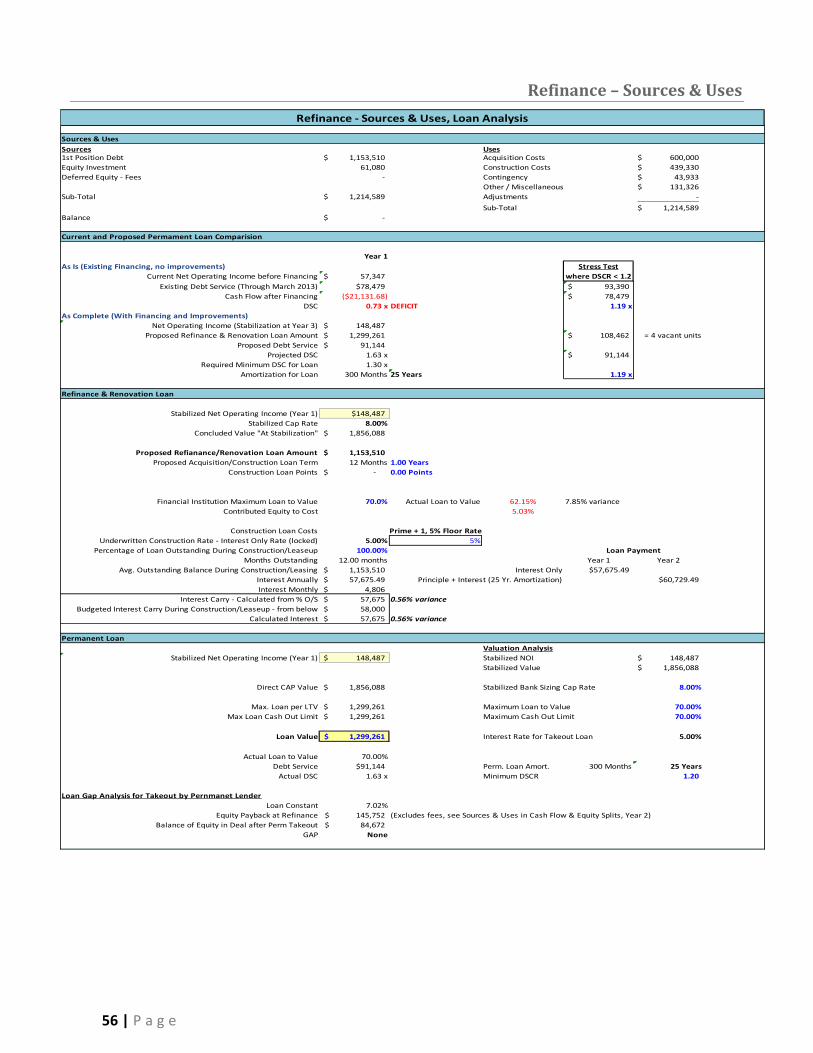
56 | P a g e
Refinance – Sources & Uses
Refinance - Sources & Uses, Loan Analysis
Sources & Uses
Sources Uses1st Position Debt 1,153,510$ Acquisition Costs 600,000$
Equity Investment 61,080 Construction Costs 439,330$
Deferred Equity - Fees - Contingency 43,933$
Other / Miscellaneous 131,326$
Sub-Total 1,214,589$ Adjustments -
Sub-Total 1,214,589$
Balance -$
Current and Proposed Permament Loan Comparision
Year 1
As Is (Existing Financing, no improvements) Stress Test
Current Net Operating Income before Financing 57,347$ where DSCR < 1.2
Existing Debt Service (Through March 2013) $78,479 93,390$
Cash Flow after Financing ($21,131.68) 78,479$
DSC 0.73 x DEFICIT 1.19 x
As Complete (With Financing and Improvements)
Net Operating Income (Stabilization at Year 3) 148,487$
Proposed Refinance & Renovation Loan Amount 1,299,261$ 108,462$ = 4 vacant units
Proposed Debt Service 91,144$
Projected DSC 1.63 x 91,144$
Required Minimum DSC for Loan 1.30 x
Amortization for Loan 300 Months 25 Years 1.19 x
Refinance & Renovation Loan
Stabilized Net Operating Income (Year 1) $148,487
Stabilized Cap Rate 8.00%
Concluded Value "At Stabilization" 1,856,088$
Proposed Refianance/Renovation Loan Amount 1,153,510$
Proposed Acquisition/Construction Loan Term 12 Months 1.00 Years
Construction Loan Points -$ 0.00 Points
Financial Institution Maximum Loan to Value 70.0% Actual Loan to Value 62.15% 7.85% variance
Contributed Equity to Cost 5.03%
Construction Loan Costs Prime + 1, 5% Floor Rate
Underwritten Construction Rate - Interest Only Rate (locked) 5.00% 5%
Percentage of Loan Outstanding During Construction/Leaseup 100.00% Loan Payment
Months Outstanding 12.00 months Year 1 Year 2
Avg. Outstanding Balance During Construction/Leasing 1,153,510$ Interest Only $57,675.49
Interest Annually 57,675.49$ Principle + Interest (25 Yr. Amortization) $60,729.49
Interest Monthly 4,806$
Interest Carry - Calculated from % O/S 57,675$ 0.56% variance
Budgeted Interest Carry During Construction/Leaseup - from below 58,000$
Calculated Interest 57,675$ 0.56% variance
Permanent Loan
Valuation Analysis
Stabilized Net Operating Income (Year 1) 148,487$ Stabilized NOI 148,487$
Stabilized Value 1,856,088$
Direct CAP Value 1,856,088$ Stabilized Bank Sizing Cap Rate 8.00%
Max. Loan per LTV 1,299,261$ Maximum Loan to Value 70.00%
Max Loan Cash Out Limit 1,299,261$ Maximum Cash Out Limit 70.00%
Loan Value 1,299,261$ Interest Rate for Takeout Loan 5.00%
Actual Loan to Value 70.00%
Debt Service $91,144 Perm. Loan Amort. 300 Months 25 Years
Actual DSC 1.63 x Minimum DSCR 1.20
Loan Gap Analysis for Takeout by Pernmanet Lender
Loan Constant 7.02%
Equity Payback at Refinance 145,752$ (Excludes fees, see Sources & Uses in Cash Flow & Equity Splits, Year 2)
Balance of Equity in Deal after Perm Takeout 84,672$
GAP None
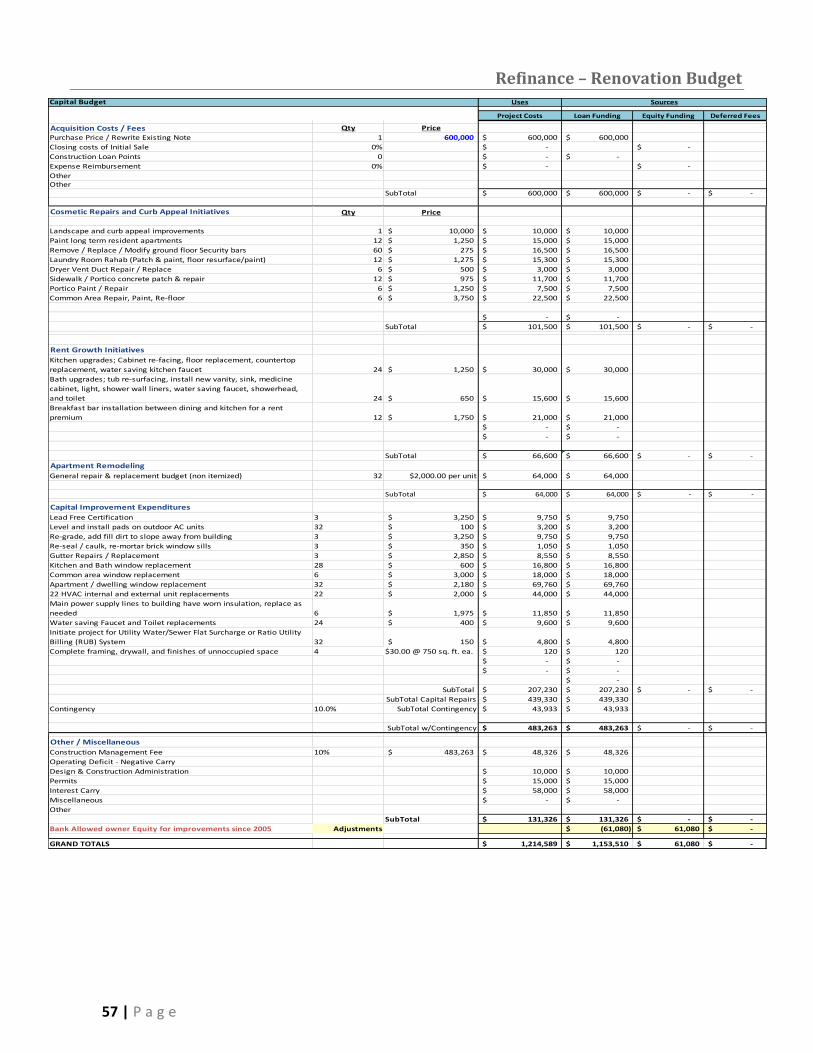
57 | P a g e
Refinance – Renovation Budget Capital Budget Uses Sources
Project Costs Loan Funding Equity Funding Deferred Fees
Acquisition Costs / Fees Qty Price
Purchase Price / Rewrite Existing Note 1 600,000 600,000$ 600,000$
Closing costs of Initial Sale 0% -$ -$
Construction Loan Points 0 -$ -$
Expense Reimbursement 0% -$ -$
OtherOther
SubTotal 600,000$ 600,000$ -$ -$
Cosmetic Repairs and Curb Appeal Initiatives Qty Price
Landscape and curb appeal improvements 1 10,000$ 10,000$ 10,000$
Paint long term resident apartments 12 1,250$ 15,000$ 15,000$
Remove / Replace / Modify ground floor Security bars 60 275$ 16,500$ 16,500$
Laundry Room Rahab (Patch & paint, floor resurface/paint) 12 1,275$ 15,300$ 15,300$
Dryer Vent Duct Repair / Replace 6 500$ 3,000$ 3,000$
Sidewalk / Portico concrete patch & repair 12 975$ 11,700$ 11,700$
Portico Paint / Repair 6 1,250$ 7,500$ 7,500$
Common Area Repair, Paint, Re-floor 6 3,750$ 22,500$ 22,500$
-$ -$
SubTotal 101,500$ 101,500$ -$ -$
Rent Growth Initiatives
Kitchen upgrades; Cabinet re-facing, floor replacement, countertop
replacement, water saving kitchen faucet 24 1,250$ 30,000$ 30,000$
Bath upgrades; tub re-surfacing, install new vanity, sink, medicine
cabinet, light, shower wall liners, water saving faucet, showerhead,
and toilet 24 650$ 15,600$ 15,600$
Breakfast bar installation between dining and kitchen for a rent
premium 12 1,750$ 21,000$ 21,000$
-$ -$
-$ -$
SubTotal 66,600$ 66,600$ -$ -$
Apartment Remodeling
General repair & replacement budget (non itemized) 32 $2,000.00 per unit 64,000$ 64,000$
SubTotal 64,000$ 64,000$ -$ -$
Capital Improvement Expenditures
Lead Free Certification 3 3,250$ 9,750$ 9,750$
Level and install pads on outdoor AC units 32 100$ 3,200$ 3,200$
Re-grade, add fill dirt to slope away from building 3 3,250$ 9,750$ 9,750$
Re-seal / caulk, re-mortar brick window sills 3 350$ 1,050$ 1,050$
Gutter Repairs / Replacement 3 2,850$ 8,550$ 8,550$
Kitchen and Bath window replacement 28 600$ 16,800$ 16,800$
Common area window replacement 6 3,000$ 18,000$ 18,000$
Apartment / dwelling window replacement 32 2,180$ 69,760$ 69,760$
22 HVAC internal and external unit replacements 22 2,000$ 44,000$ 44,000$
Main power supply lines to building have worn insulation, replace as
needed 6 1,975$ 11,850$ 11,850$
Water saving Faucet and Toilet replacements 24 400$ 9,600$ 9,600$
Initiate project for Utility Water/Sewer Flat Surcharge or Ratio Utility
Billing (RUB) System 32 150$ 4,800$ 4,800$
Complete framing, drywall, and finishes of unnoccupied space 4 $30.00 @ 750 sq. ft. ea. 120$ 120$
-$ -$
-$ -$
-$
SubTotal 207,230$ 207,230$ -$ -$
SubTotal Capital Repairs 439,330$ 439,330$
Contingency 10.0% SubTotal Contingency 43,933$ 43,933$
SubTotal w/Contingency 483,263$ 483,263$ -$ -$
Other / Miscellaneous
Construction Management Fee 10% 483,263$ 48,326$ 48,326$
Operating Deficit - Negative Carry
Design & Construction Administration 10,000$ 10,000$
Permits 15,000$ 15,000$
Interest Carry 58,000$ 58,000$
Miscellaneous -$ -$
Other
SubTotal 131,326$ 131,326$ -$ -$
Bank Allowed owner Equity for improvements since 2005 Adjustments (61,080)$ 61,080$ -$
GRAND TOTALS 1,214,589$ 1,153,510$ 61,080$ -$
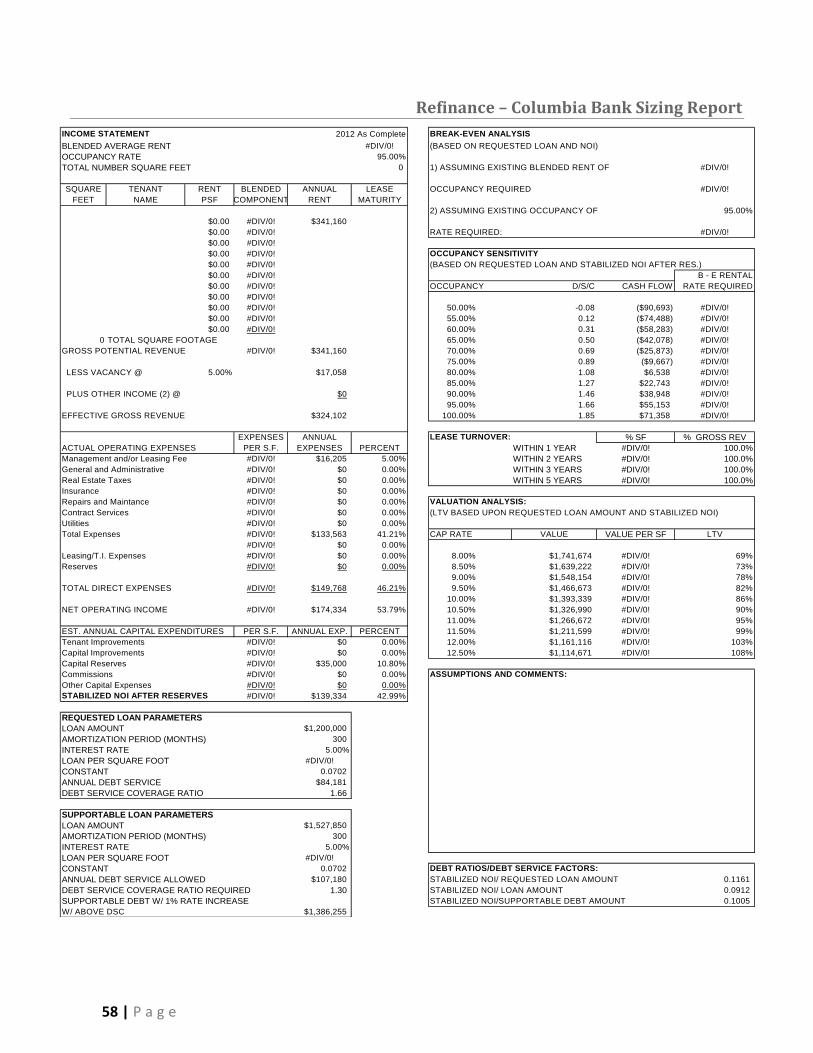
58 | P a g e
Refinance – Columbia Bank Sizing Report
INCOME STATEMENT 2012 As Complete BREAK-EVEN ANALYSIS
BLENDED AVERAGE RENT #DIV/0! (BASED ON REQUESTED LOAN AND NOI)
OCCUPANCY RATE 95.00%
TOTAL NUMBER SQUARE FEET 0 1) ASSUMING EXISTING BLENDED RENT OF #DIV/0!
SQUARE TENANT RENT BLENDED ANNUAL LEASE OCCUPANCY REQUIRED #DIV/0!
FEET NAME PSF COMPONENT RENT MATURITY
2) ASSUMING EXISTING OCCUPANCY OF 95.00%
$0.00 #DIV/0! $341,160
$0.00 #DIV/0! RATE REQUIRED: #DIV/0!
$0.00 #DIV/0!
$0.00 #DIV/0! OCCUPANCY SENSITIVITY
$0.00 #DIV/0! (BASED ON REQUESTED LOAN AND STABILIZED NOI AFTER RES.)
$0.00 #DIV/0! B - E RENTAL
$0.00 #DIV/0! OCCUPANCY D/S/C CASH FLOW RATE REQUIRED
$0.00 #DIV/0!
$0.00 #DIV/0! 50.00% -0.08 ($90,693) #DIV/0!
$0.00 #DIV/0! 55.00% 0.12 ($74,488) #DIV/0!
$0.00 #DIV/0! 60.00% 0.31 ($58,283) #DIV/0!
0 TOTAL SQUARE FOOTAGE 65.00% 0.50 ($42,078) #DIV/0!
GROSS POTENTIAL REVENUE #DIV/0! $341,160 70.00% 0.69 ($25,873) #DIV/0!
75.00% 0.89 ($9,667) #DIV/0!
LESS VACANCY @ 5.00% $17,058 80.00% 1.08 $6,538 #DIV/0!
85.00% 1.27 $22,743 #DIV/0!
PLUS OTHER INCOME (2) @ $0 90.00% 1.46 $38,948 #DIV/0!
95.00% 1.66 $55,153 #DIV/0!
EFFECTIVE GROSS REVENUE $324,102 100.00% 1.85 $71,358 #DIV/0!
EXPENSES ANNUAL LEASE TURNOVER: % SF % GROSS REV
ACTUAL OPERATING EXPENSES PER S.F. EXPENSES PERCENT WITHIN 1 YEAR #DIV/0! 100.0%
Management and/or Leasing Fee #DIV/0! $16,205 5.00% WITHIN 2 YEARS #DIV/0! 100.0%
General and Administrative #DIV/0! $0 0.00% WITHIN 3 YEARS #DIV/0! 100.0%
Real Estate Taxes #DIV/0! $0 0.00% WITHIN 5 YEARS #DIV/0! 100.0%
Insurance #DIV/0! $0 0.00%
Repairs and Maintance #DIV/0! $0 0.00% VALUATION ANALYSIS:
Contract Services #DIV/0! $0 0.00% (LTV BASED UPON REQUESTED LOAN AMOUNT AND STABILIZED NOI)
Utilities #DIV/0! $0 0.00%
Total Expenses #DIV/0! $133,563 41.21% CAP RATE VALUE VALUE PER SF LTV
#DIV/0! $0 0.00%
Leasing/T.I. Expenses #DIV/0! $0 0.00% 8.00% $1,741,674 #DIV/0! 69%
Reserves #DIV/0! $0 0.00% 8.50% $1,639,222 #DIV/0! 73%
9.00% $1,548,154 #DIV/0! 78%
TOTAL DIRECT EXPENSES #DIV/0! $149,768 46.21% 9.50% $1,466,673 #DIV/0! 82%
10.00% $1,393,339 #DIV/0! 86%
NET OPERATING INCOME #DIV/0! $174,334 53.79% 10.50% $1,326,990 #DIV/0! 90%
11.00% $1,266,672 #DIV/0! 95%
EST. ANNUAL CAPITAL EXPENDITURES PER S.F. ANNUAL EXP. PERCENT 11.50% $1,211,599 #DIV/0! 99%
Tenant Improvements #DIV/0! $0 0.00% 12.00% $1,161,116 #DIV/0! 103%
Capital Improvements #DIV/0! $0 0.00% 12.50% $1,114,671 #DIV/0! 108%
Capital Reserves #DIV/0! $35,000 10.80%
Commissions #DIV/0! $0 0.00% ASSUMPTIONS AND COMMENTS:
Other Capital Expenses #DIV/0! $0 0.00%
STABILIZED NOI AFTER RESERVES #DIV/0! $139,334 42.99%
REQUESTED LOAN PARAMETERS
LOAN AMOUNT $1,200,000
AMORTIZATION PERIOD (MONTHS) 300
INTEREST RATE 5.00%
LOAN PER SQUARE FOOT #DIV/0!
CONSTANT 0.0702
ANNUAL DEBT SERVICE $84,181
DEBT SERVICE COVERAGE RATIO 1.66
SUPPORTABLE LOAN PARAMETERS
LOAN AMOUNT $1,527,850
AMORTIZATION PERIOD (MONTHS) 300
INTEREST RATE 5.00%
LOAN PER SQUARE FOOT #DIV/0!
CONSTANT 0.0702 DEBT RATIOS/DEBT SERVICE FACTORS:
ANNUAL DEBT SERVICE ALLOWED $107,180 STABILIZED NOI/ REQUESTED LOAN AMOUNT 0.1161
DEBT SERVICE COVERAGE RATIO REQUIRED 1.30 STABILIZED NOI/ LOAN AMOUNT 0.0912
SUPPORTABLE DEBT W/ 1% RATE INCREASE STABILIZED NOI/SUPPORTABLE DEBT AMOUNT 0.1005
W/ ABOVE DSC $1,386,255
59 | P a g e
BIBLIOGRAPHY Baltimore Cityview. (n.d.). Retrieved from Baltimore Cityview:
http://cityview.baltimorecity.gov/CityView/
Baltimore Housing. (n.d.). Retrieved December 2011, from Community Development Block Grant
Program: http://www.baltimorehousing.org/cdbg
Live Baltimore. (n.d.). Retrieved June 2011, from Ednore Gardens Lakeside:
http://www.livebaltimore.com/neighborhoods/list/ednorgardenslakeside/
MD Housing. (n.d.). Retrieved December 2011, from Federal Low Income Housing Tax Credit
Program Fact Sheet (LIHTC): http://www.mdhousing.org/Website/programs/lihtc/factsheet.aspx
MTA. (n.d.). Retrieved December 2011, from Maryland Transit Administration:
http://mta.maryland.gov/local-bus
Wall Street Journal. (n.d.). Retrieved December 2011, from U.S. Stocks:
http://online.wsj.com/mdc/public/page/mdc_us_stocks.html?refresh=on