Embed Size (px)
Citation preview
Multi-Factor Sector Based Investment Strategy (MFSS)
Team Ichiban:
Wei Fu, Dingyi Li, Fei Ni, Taliya Perera, Benjamin Tang
28th November 2011
STAT 682 Quantitative Financial Analytics STATISTICS
1
STAT 682 Quantitative Financial Analytics STATISTICS
Scope:
i.Fund Investment Strategy
ii.Dataset Management Process
iii.Portfolio Selection Mechanism
iv.Benchmarks & Back-testing the Fund’s Strategy
v.Returns and Results
vi.Conclusion
2
STAT 682 Quantitative Financial Analytics STATISTICS
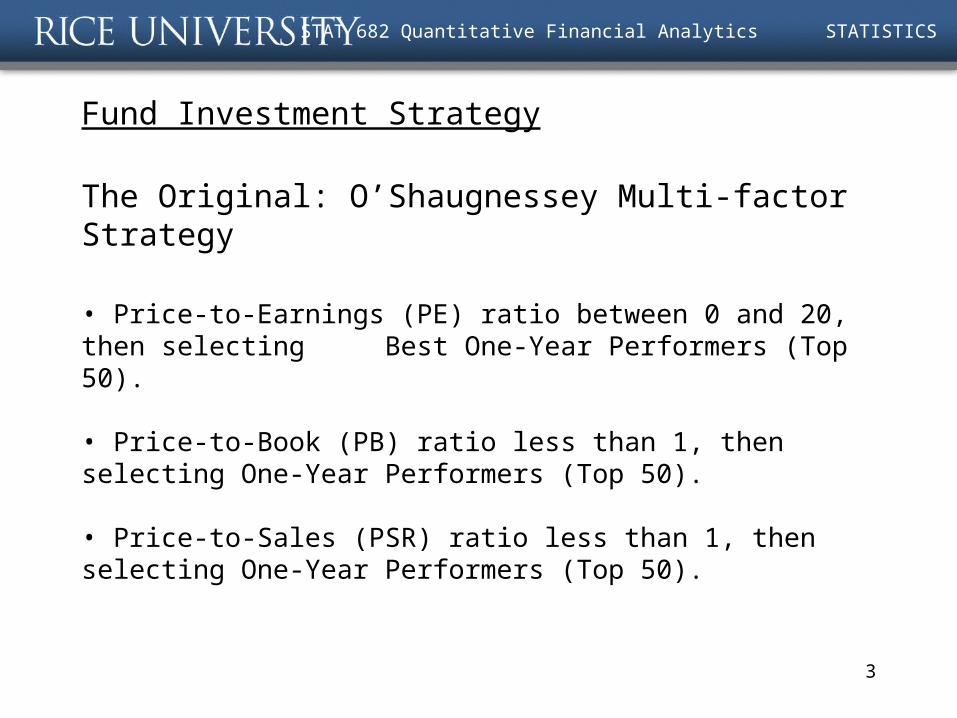
Fund Investment Strategy
The Original: O’Shaugnessey Multi-factor Strategy
• Price-to-Earnings (PE) ratio between 0 and 20, then selecting Best One-Year Performers (Top 50).
• Price-to-Book (PB) ratio less than 1, then selecting One-Year Performers (Top 50).
• Price-to-Sales (PSR) ratio less than 1, then selecting One-Year Performers (Top 50).
3
STAT 682 Quantitative Financial Analytics STATISTICS
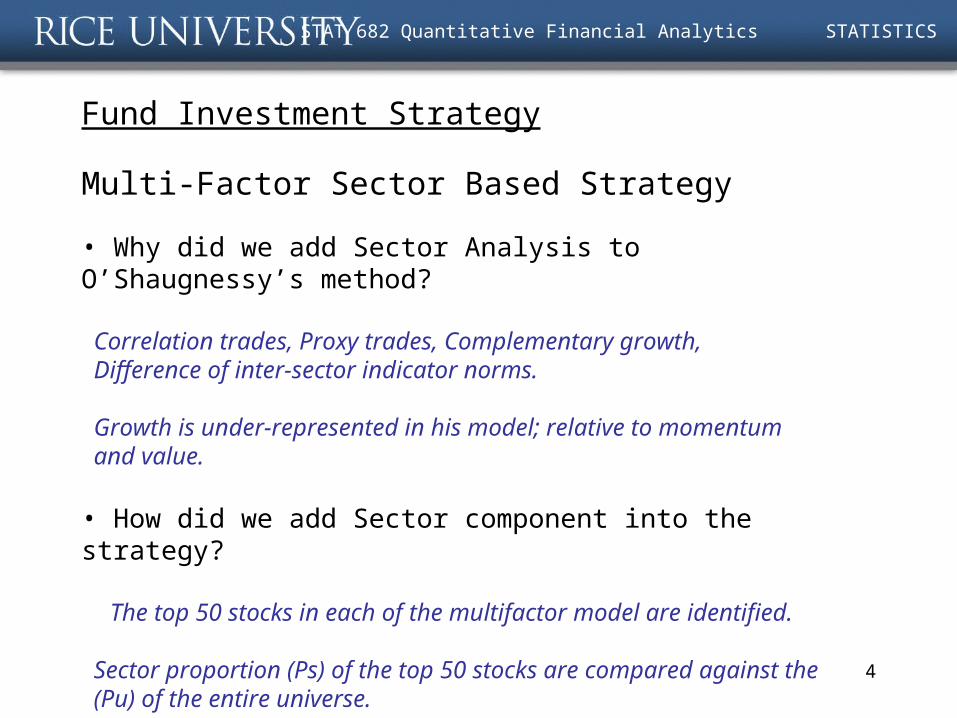
Fund Investment Strategy
Multi-Factor Sector Based Strategy
• Why did we add Sector Analysis to O’Shaugnessy’s method?
Correlation trades, Proxy trades, Complementary growth, Difference of inter-sector indicator norms.
Growth is under-represented in his model; relative to momentum and value.
• How did we add Sector component into the strategy?
The top 50 stocks in each of the multifactor model are identified.
Sector proportion (Ps) of the top 50 stocks are compared against the (Pu) of the entire universe.
Sectors are then ranked by highest “Ps - Pu”.
4
STAT 682 Quantitative Financial Analytics STATISTICS
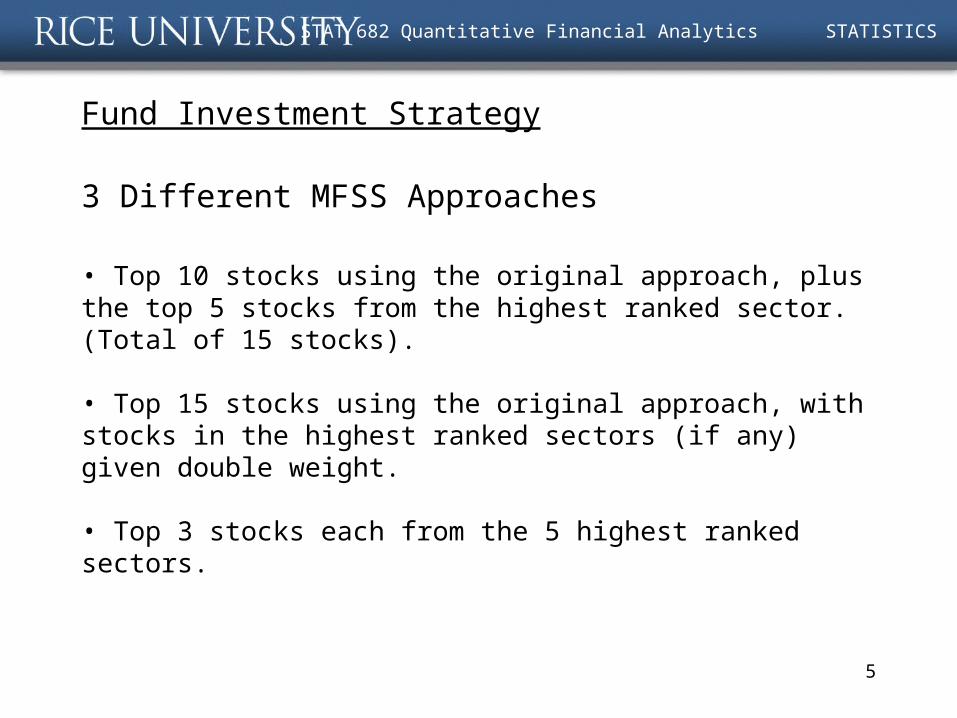
Fund Investment Strategy
3 Different MFSS Approaches
• Top 10 stocks using the original approach, plus the top 5 stocks from the highest ranked sector. (Total of 15 stocks).
• Top 15 stocks using the original approach, with stocks in the highest ranked sectors (if any) given double weight.
• Top 3 stocks each from the 5 highest ranked sectors.
5
STAT 682 Quantitative Financial Analytics STATISTICS
Scope:
i.Fund Investment Strategy
ii.Dataset Management Process
iii.Portfolio Selection Mechanism
iv.Benchmarks & Back-testing the Fund’s Strategy
v.Returns and Results
vi.Conclusion
6
STAT 682 Quantitative Financial Analytics STATISTICS
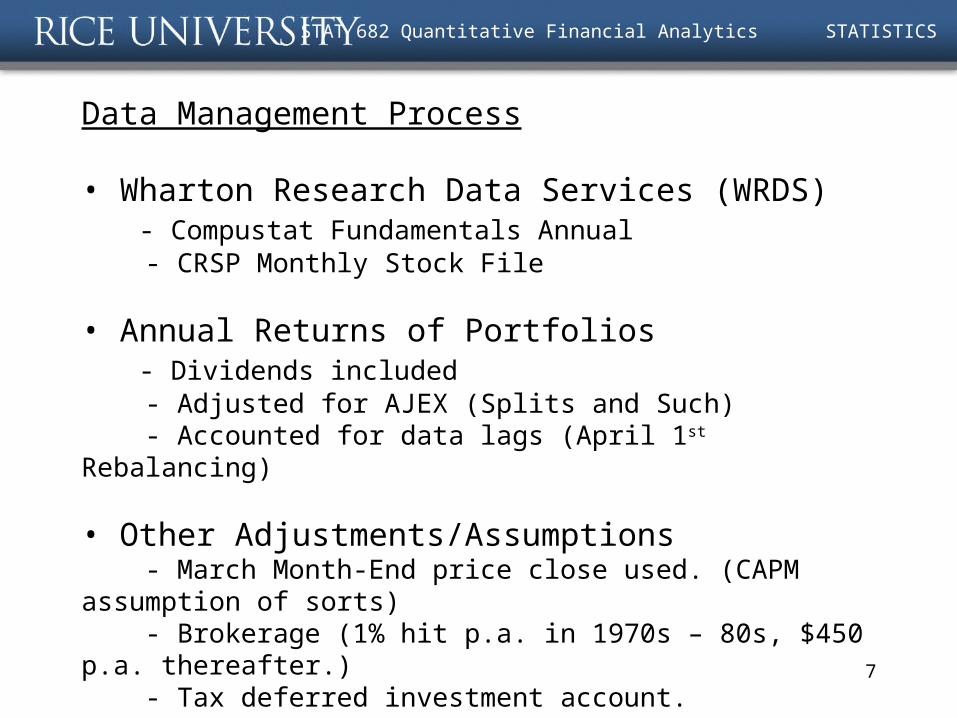
Data Management Process
• Wharton Research Data Services (WRDS) - Compustat Fundamentals Annual - CRSP Monthly Stock File
• Annual Returns of Portfolios - Dividends included - Adjusted for AJEX (Splits and Such) - Accounted for data lags (April 1st Rebalancing)
• Other Adjustments/Assumptions - March Month-End price close used. (CAPM assumption of sorts) - Brokerage (1% hit p.a. in 1970s – 80s, $450 p.a. thereafter.) - Tax deferred investment account. - Delisting and Acquisitions
7
STAT 682 Quantitative Financial Analytics STATISTICS
Scope:
i.Fund Investment Strategy
ii.Dataset Management Process
iii.Portfolio Selection Mechanism
iv.Benchmarks & Back-testing the Fund’s Strategy
v.Returns and Results
vi.Conclusion
8
STAT 682 Quantitative Financial Analytics STATISTICS
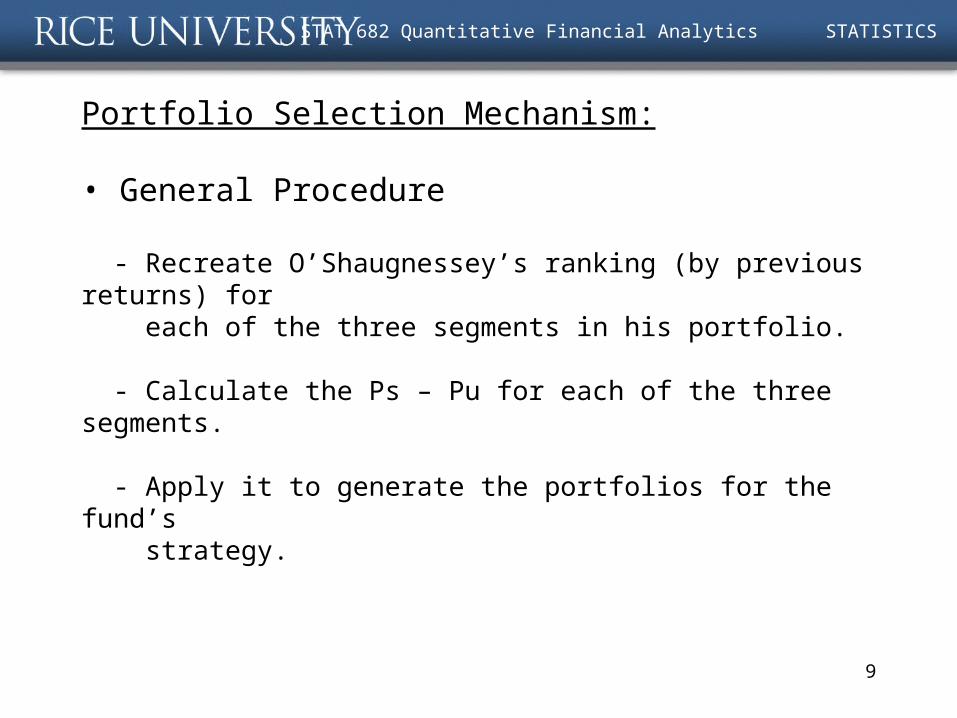
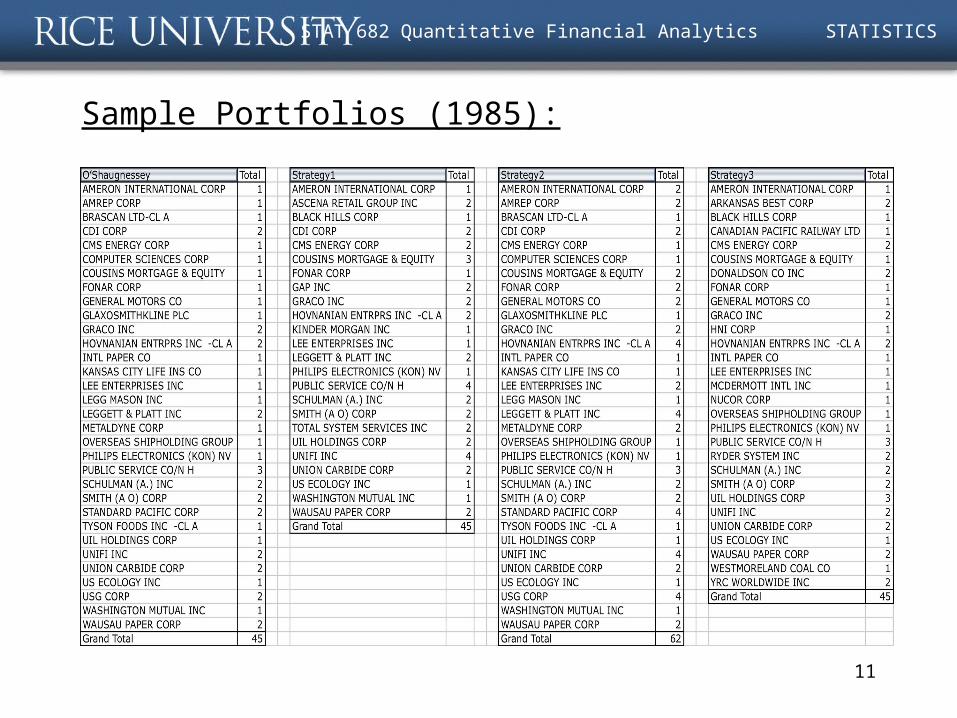
Portfolio Selection Mechanism:
• General Procedure
- Recreate O’Shaugnessey’s ranking (by previous returns) for each of the three segments in his portfolio.
- Calculate the Ps – Pu for each of the three segments.
- Apply it to generate the portfolios for the fund’s strategy.
9
STAT 682 Quantitative Financial Analytics STATISTICS
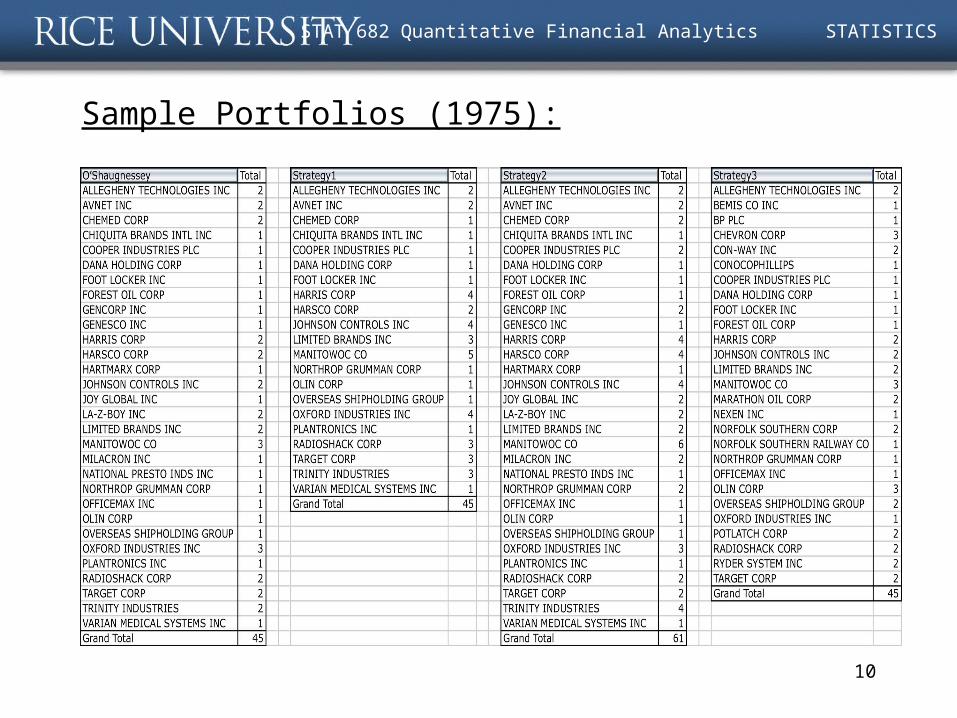
Sample Portfolios (1975):
10
STAT 682 Quantitative Financial Analytics STATISTICS
Sample Portfolios (1985):
11
STAT 682 Quantitative Financial Analytics STATISTICS
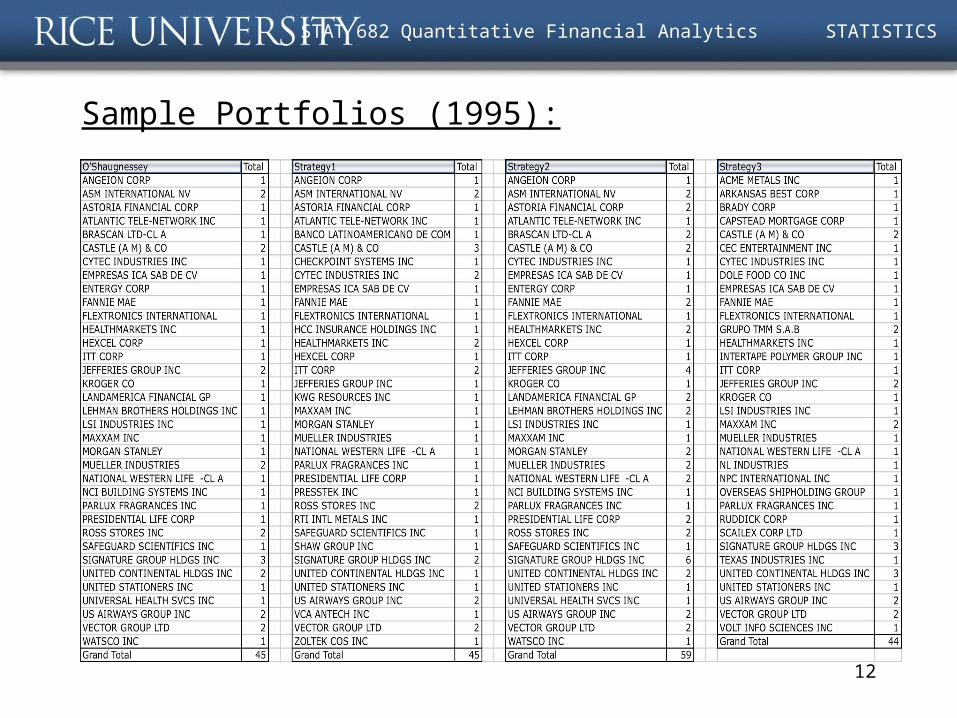
Sample Portfolios (1995):
12
STAT 682 Quantitative Financial Analytics STATISTICS
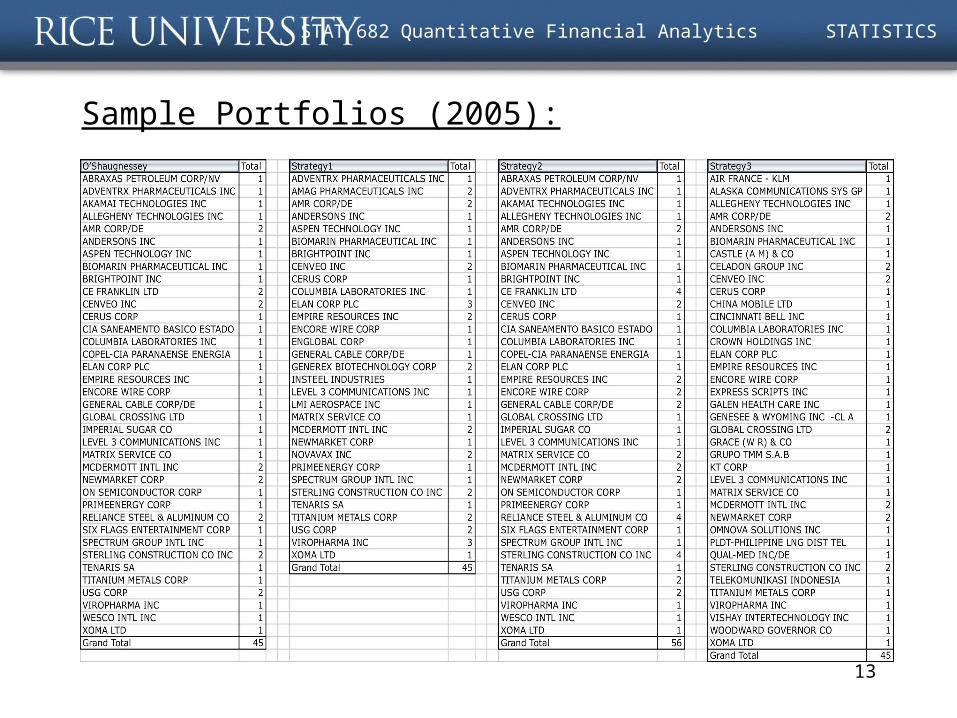
Sample Portfolios (2005):
13
STAT 682 Quantitative Financial Analytics STATISTICS
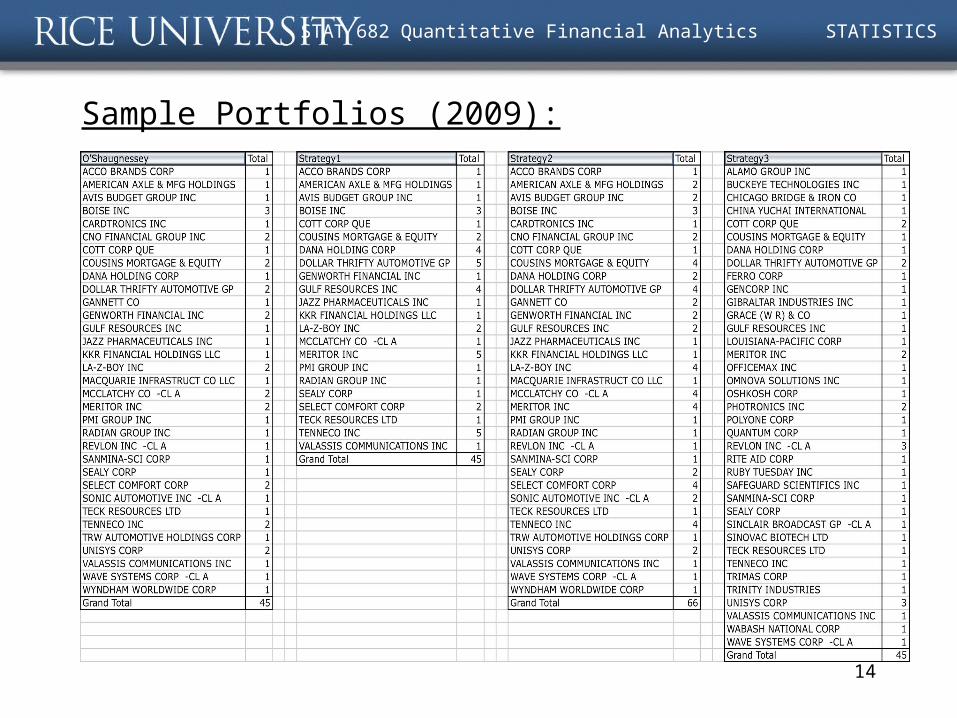
Sample Portfolios (2009):
14
STAT 682 Quantitative Financial Analytics STATISTICS
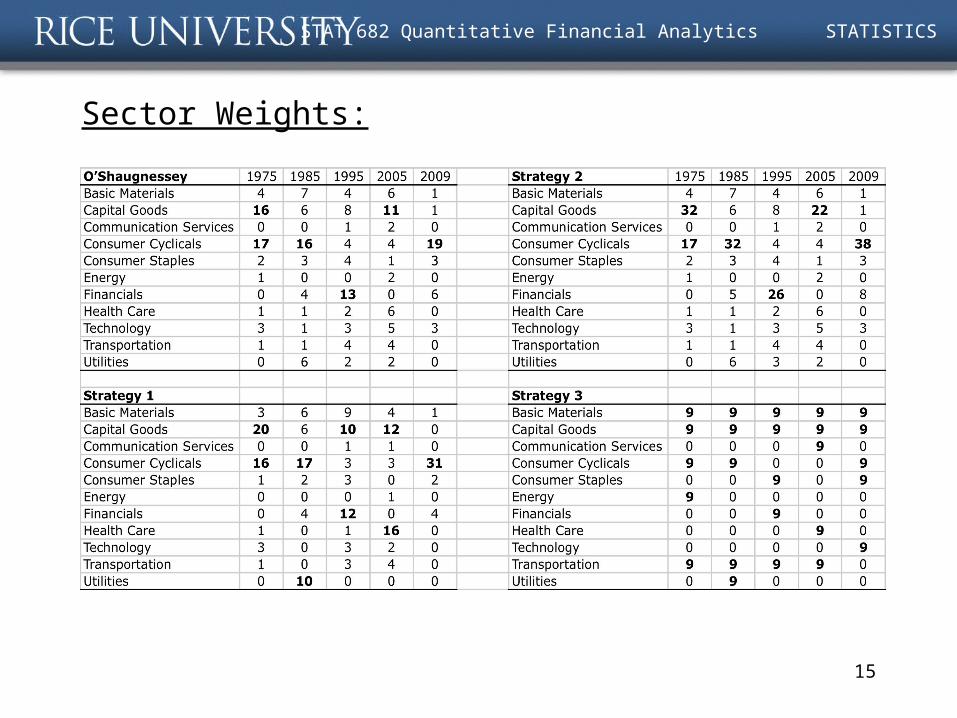
Sector Weights:
15
STAT 682 Quantitative Financial Analytics STATISTICS
Scope:
i.Fund Investment Strategy
ii.Dataset Management Process
iii.Portfolio Selection Mechanism
iv.Benchmarks & Back-testing the Fund’s Strategy
v.Returns and Results
vi.Conclusion
16
STAT 682 Quantitative Financial Analytics STATISTICS
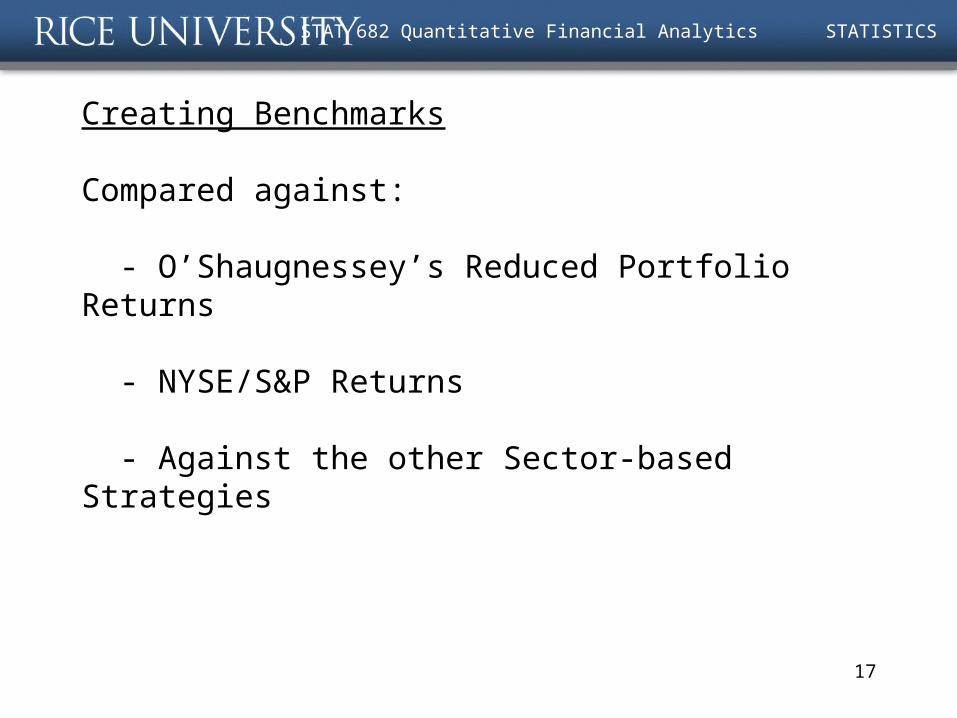
Creating Benchmarks
Compared against:
- O’Shaugnessey’s Reduced Portfolio Returns
- NYSE/S&P Returns
- Against the other Sector-based Strategies
17
STAT 682 Quantitative Financial Analytics STATISTICS
Scope:
i.Fund Investment Strategy
ii.Dataset Management Process
iii.Portfolio Selection Mechanism
iv.Benchmarks & Back-testing the Fund’s Strategy
v.Returns and Results
vi.Conclusion
18
STAT 682 Quantitative Financial Analytics STATISTICS
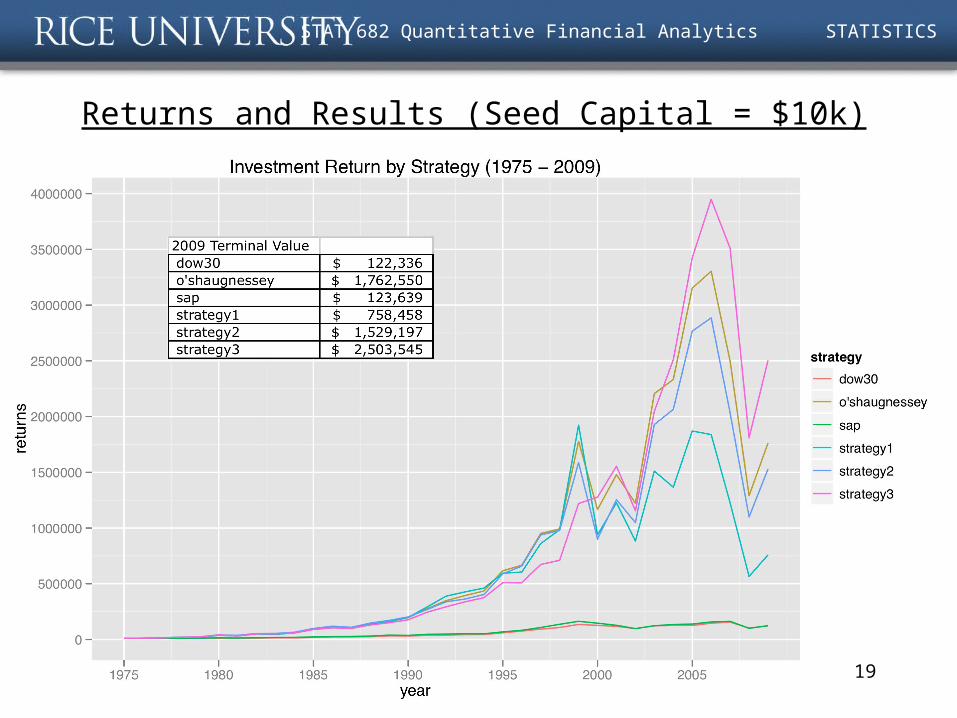
Returns and Results (Seed Capital = $10k)
19
STAT 682 Quantitative Financial Analytics STATISTICS
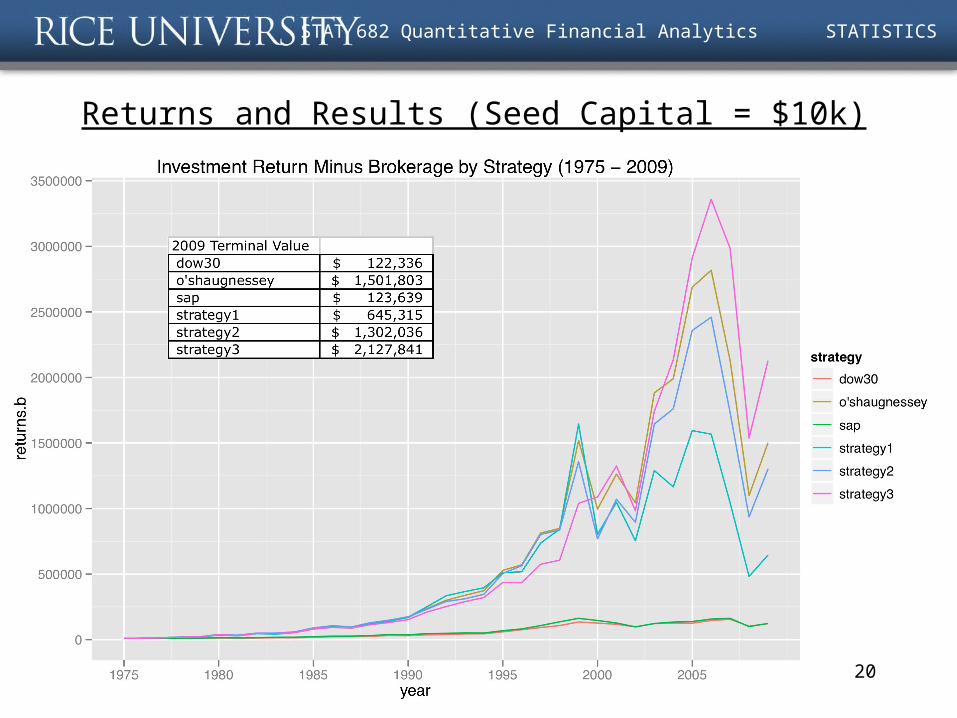
Returns and Results (Seed Capital = $10k)
20
STAT 682 Quantitative Financial Analytics STATISTICS
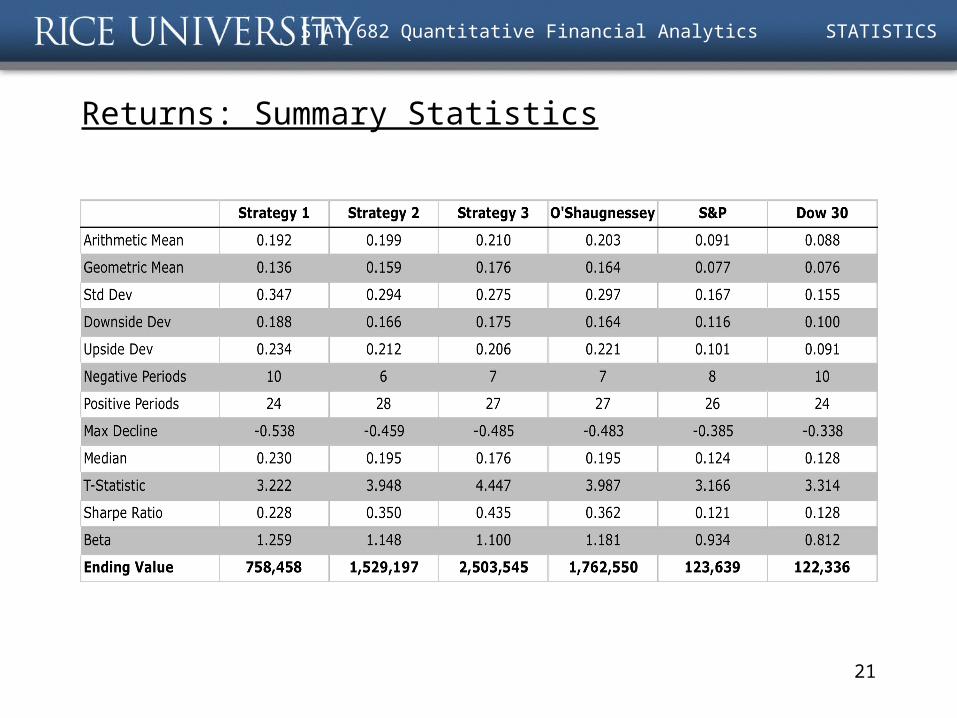
Returns: Summary Statistics
21
STAT 682 Quantitative Financial Analytics STATISTICS
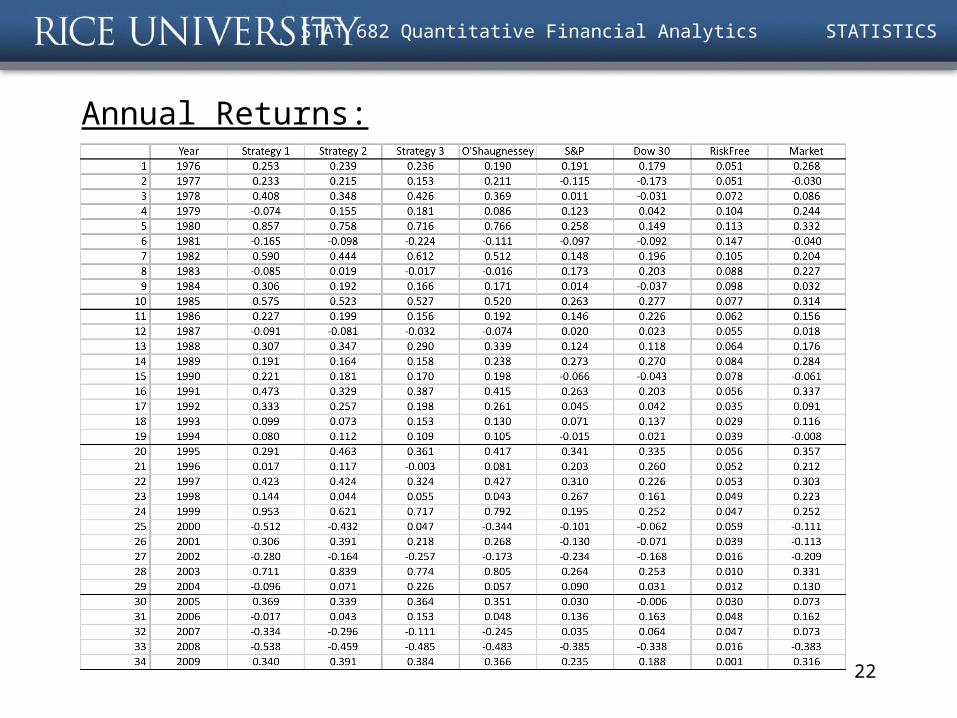
Annual Returns:
22
STAT 682 Quantitative Financial Analytics STATISTICS
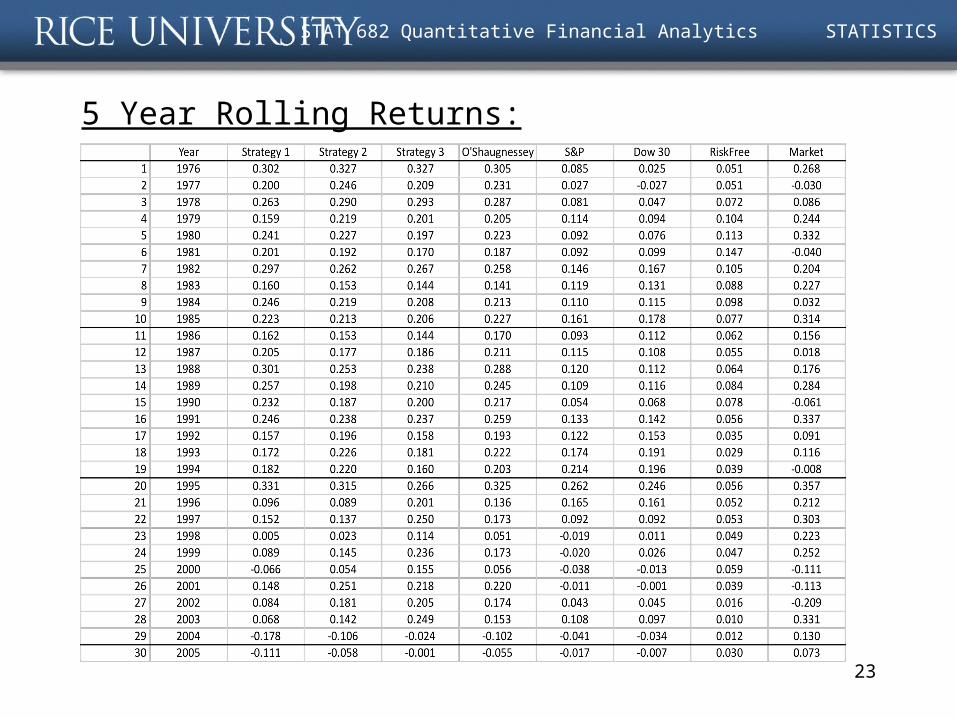
5 Year Rolling Returns:
23
STAT 682 Quantitative Financial Analytics STATISTICS
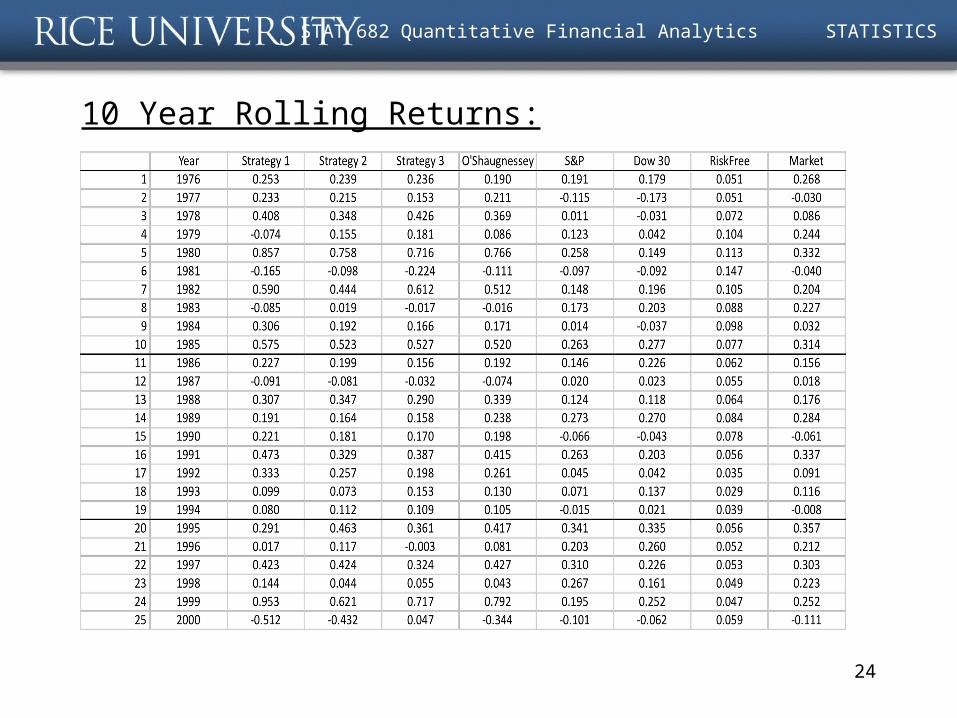
10 Year Rolling Returns:
24
STAT 682 Quantitative Financial Analytics STATISTICS
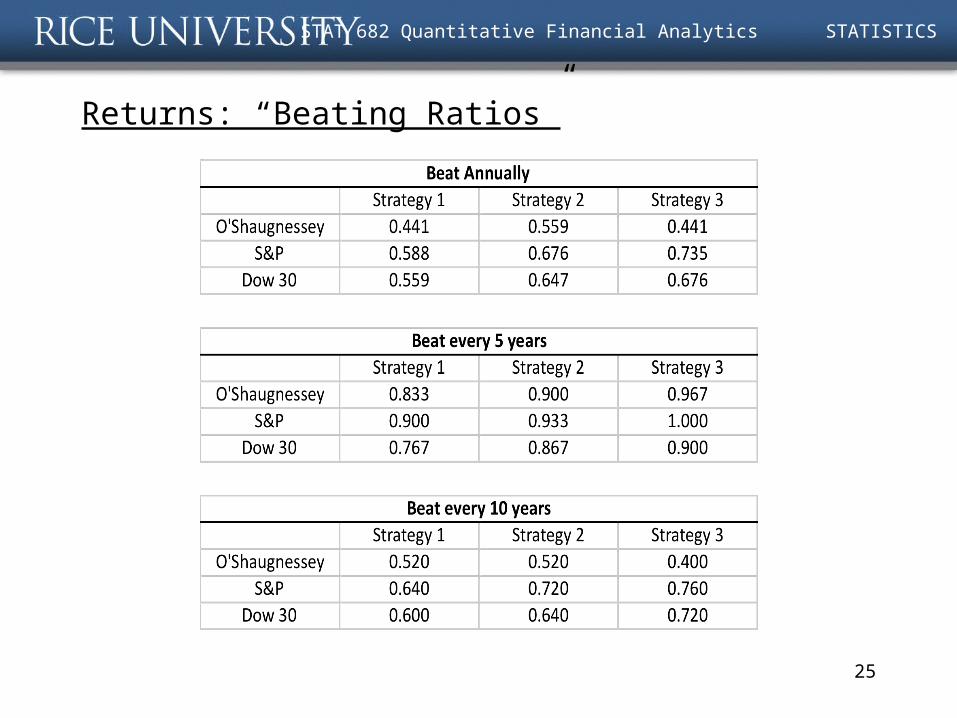
Returns: “Beating Ratios”
25
STAT 682 Quantitative Financial Analytics STATISTICS
Scope:
i.Fund Investment Strategy
ii.Dataset Management Process
iii.Portfolio Selection Mechanism
iv.Creating Benchmarks
v.Back-testing the Fund’s Strategy
vi.Conclusion
26
STAT 682 Quantitative Financial Analytics STATISTICS
Conclusion:
i.Advantages of the MFSS Investment Strategies
ii.Downside Risks
iii.Schumpeterian Theory of Growth
iv.Back-testing as Optimization of Hindsight
v.Leverage as a matter of Preference
27
STAT 682 Quantitative Financial Analytics STATISTICS
Questions?
28


![One Page Summary: Twinningdsun/docs/Notes_Twinning.pdf · Research One Page Summary: Twinning Dingyi Sun Updated: December 15, 2016 References [1] Y.B. Wang, M.L. Sui, and E. Ma](https://img.pdfslide.us/doc/110x75/5a8f2b447f8b9ac87a8dfe5f/one-page-summary-dsundocsnotestwinningpdfresearch-one-page-summary-twinning.jpg)