Embed Size (px)
Citation preview
See discussions, stats, and author profiles for this publication at: https://www.researchgate.net/publication/254217987
Multivariate statistical analysis for race variation from foot anthropometry in
the Malaysian population
Article in Australian Journal of Forensic Sciences · September 2012
DOI: 10.1080/00450618.2012.657682
CITATIONS
7
READS
108
3 authors, including:
Some of the authors of this publication are also working on these related projects:
Forensic Sciences View project
Salina Hisham
University of Western Australia
23 PUBLICATIONS 25 CITATIONS
SEE PROFILE
Che Rozid Mamat
Universiti Teknologi Malaysia
18 PUBLICATIONS 56 CITATIONS
SEE PROFILE
All content following this page was uploaded by Salina Hisham on 19 October 2016.
The user has requested enhancement of the downloaded file.
This article was downloaded by: [Universiti Teknologi Malaysia]On: 24 March 2014, At: 20:35Publisher: Taylor & FrancisInforma Ltd Registered in England and Wales Registered Number: 1072954 Registeredoffice: Mortimer House, 37-41 Mortimer Street, London W1T 3JH, UK
Australian Journal of Forensic SciencesPublication details, including instructions for authors andsubscription information:http://www.tandfonline.com/loi/tajf20
Multivariate statistical analysis for racevariation from foot anthropometry inthe Malaysian populationSalina Hisham a , Che Rozid Mamat b & Mohamad Azaini Ibrahim ca Hospital Sultanah Aminah, Department of Forensic Medicine ,Jalan Abu Bakar, Johor Bahru , 80100 , Malaysiab Universiti Teknologi Malaysia, Department of Chemistry Facultyof Science , Skudai , 81310 , Malaysiac Hospital Melaka, Department of Forensic Medicine , Melaka ,75400 , MalaysiaPublished online: 19 Mar 2012.
To cite this article: Salina Hisham , Che Rozid Mamat & Mohamad Azaini Ibrahim(2012) Multivariate statistical analysis for race variation from foot anthropometry inthe Malaysian population, Australian Journal of Forensic Sciences, 44:3, 285-293, DOI:10.1080/00450618.2012.657682
To link to this article: http://dx.doi.org/10.1080/00450618.2012.657682
PLEASE SCROLL DOWN FOR ARTICLE
Taylor & Francis makes every effort to ensure the accuracy of all the information (the“Content”) contained in the publications on our platform. However, Taylor & Francis,our agents, and our licensors make no representations or warranties whatsoever as tothe accuracy, completeness, or suitability for any purpose of the Content. Any opinionsand views expressed in this publication are the opinions and views of the authors,and are not the views of or endorsed by Taylor & Francis. The accuracy of the Contentshould not be relied upon and should be independently verified with primary sourcesof information. Taylor and Francis shall not be liable for any losses, actions, claims,proceedings, demands, costs, expenses, damages, and other liabilities whatsoever orhowsoever caused arising directly or indirectly in connection with, in relation to or arisingout of the use of the Content.
This article may be used for research, teaching, and private study purposes. Anysubstantial or systematic reproduction, redistribution, reselling, loan, sub-licensing,systematic supply, or distribution in any form to anyone is expressly forbidden. Terms &

Conditions of access and use can be found at http://www.tandfonline.com/page/terms-and-conditions
Dow
nloa
ded
by [
Uni
vers
iti T
ekno
logi
Mal
aysi
a] a
t 20:
35 2
4 M
arch
201
4
Multivariate statistical analysis for race variation from foot
anthropometry in the Malaysian population
Salina Hishama*, Che Rozid Mamatb and Mohamad Azaini Ibrahimc
aHospital Sultanah Aminah, Department of Forensic Medicine, Jalan Abu Bakar, Johor Bahru,80100 Malaysia; bUniversiti Teknologi Malaysia, Department of Chemistry Faculty of Science,Skudai, 81310 Malaysia; cHospital Melaka, Department of Forensic Medicine, Melaka, 75400
Malaysia
(Received 23 October 2011; final version received 4 January 2012)
Dismembered human remains are frequently found in cases of mass disasters andcriminal mutilation. In order to establish personal identity, race is among themajor categories of the basic biological profile, apart from sex, age, stature,anomalies and pathologies. This is the first systematic study conducted for theassessment of race variations in the Malaysian population from foot measure-ments. In the present study, 232 Malay (112 males and 120 females) individuals,213 Chinese (107 males and 106 females) individuals and 204 Indian (102 malesand 102 females) individuals (all consenting) who were 20 to 69 years old wererandomly selected and their stature, foot length and foot breadth were measured.This study investigated the application of discriminant function analysis,principal component analysis and hierarchical cluster analysis to assess thevariations in stature and foot dimensions in the Malay, Chinese and Indiansubpopulations in Malaysia. Foot measurements are found to yield importantpredictive information about an individual’s race in the Malaysian population.
Keywords: forensic anthropology; race; foot measurements; Malaysianpopulation; multivariate analysis
Introduction
In forensic anthropology, race is among the major categories of the basic biologicalprofile. This profile also includes sex, age, stature, anomalies and pathologies. Onecritical role of race estimation today lies in the forensic identification of crime victimsand missing persons. Physical characteristics are often used to describe missingpeople, and the documentation of these is the first step towards visual identificationof a crime body1.
Forensic anthropologists need to answer the practical question of race toconstruct the biological profile. Identifying social race, available in missingperson reports, would be the aim. Konigsberg et al.2 has shown that priorinformation can be very important both in estimation of race and evidentiaryproblems.
*Corresponding author. Email: [email protected]
Australian Journal of Forensic Sciences
Vol. 44, No. 3, September 2012, 285–293
ISSN 0045-0618 print/ISSN 1834-562X online
� 2012 Australian Academy of Forensic Sciences
http://dx.doi.org/10.1080/00450618.2012.657682
http://www.tandfonline.com
Dow
nloa
ded
by [
Uni
vers
iti T
ekno
logi
Mal
aysi
a] a
t 20:
35 2
4 M
arch
201
4
Rosnah et al.3 has demonstrated that there are significant differences in many ofthe measurements between the Malays and non-Malays. Often being classified asMongoloid or Asians, this study investigated the application of multivariatestatistics to express the variations in stature and foot dimensions in the Malay,Chinese and Indian subpopulations in Malaysia.
Material and methods
This study was carried out on a total sample of 649 healthy Malaysians, whichcomprised 232 Malays (112 males and 120 females), 213 Chinese (107 males and 106females) and 204 Indians (102 males and 102 females). According to the ‘PreliminaryCount Report, Population and Housing Census, Malaysia, 2010’ by the Departmentof Statistics Malaysia, the total population of Malaysia was 27,565,821 whichcomprises 14,112,667 males and 13,453,154 females. Malays and other Bumiputeragroups make up 60.3% of the population, Chinese 22.9% and Indians 6.8%4.
Malays are an ethnic group who predominantly inhabit the Malay Peninsular,the east coast of Sumatra and the coast of Borneo and who speak a Malayo-Polynesian language, which is a member of the Austronesian family5. The MalaysianChinese, on the other hand, are actually a heterogeneous group made up of variousdialect groups who have intermarried extensively with each other, and are largelydescendants of immigrants who arrived between the fifteenth and the mid-twentiethcenturies from various areas of China6. And last but not least, the Malaysian Indiansare largely descended from southern India as they were brought by the British duringthe colonization of Malaya7.
Subjects who were pregnant, with any disease, physical impairment, orthopaedicdeformity, injury, fracture, amputation or history of any surgical procedures,metabolic or developmental disorders were excluded from the study. Foot lengthdoes not typically stabilize until adulthood is reached so only individuals who wereabove 20 years of age, the age at which a person’s foot attains its full length wereinvited to participate in this study.
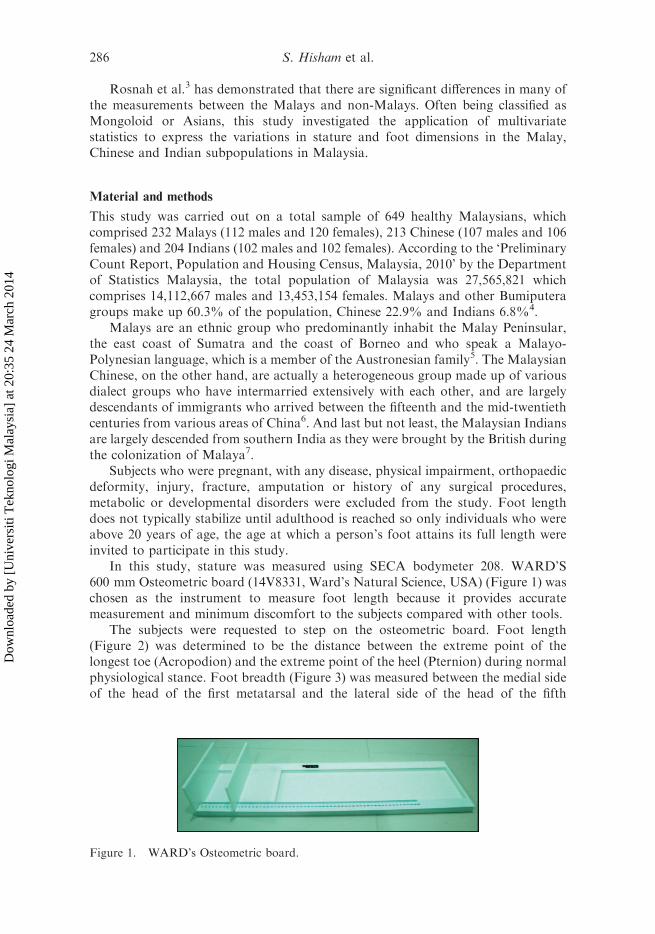
In this study, stature was measured using SECA bodymeter 208. WARD’S600 mm Osteometric board (14V8331, Ward’s Natural Science, USA) (Figure 1) waschosen as the instrument to measure foot length because it provides accuratemeasurement and minimum discomfort to the subjects compared with other tools.
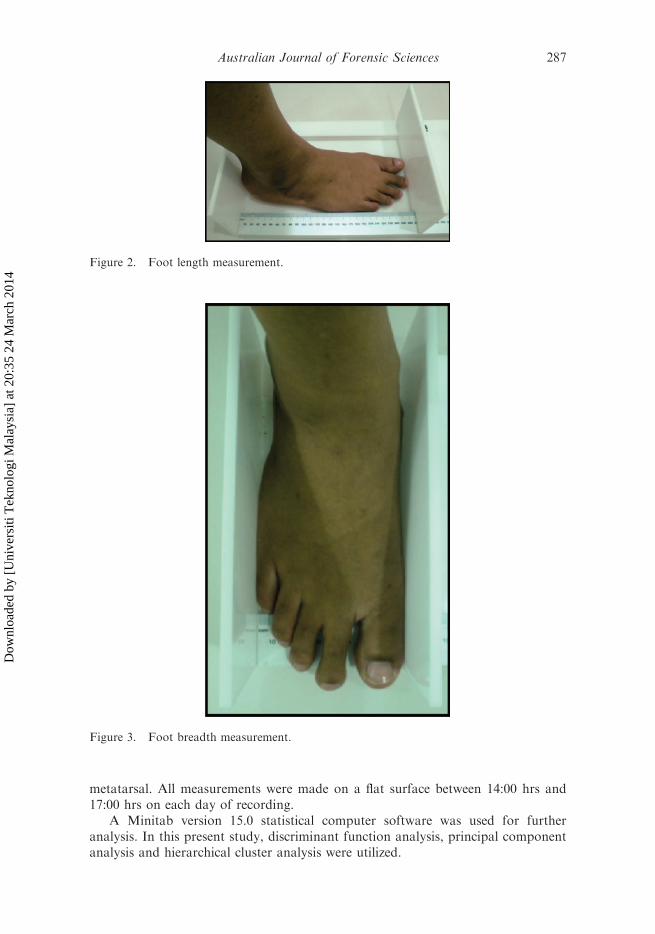
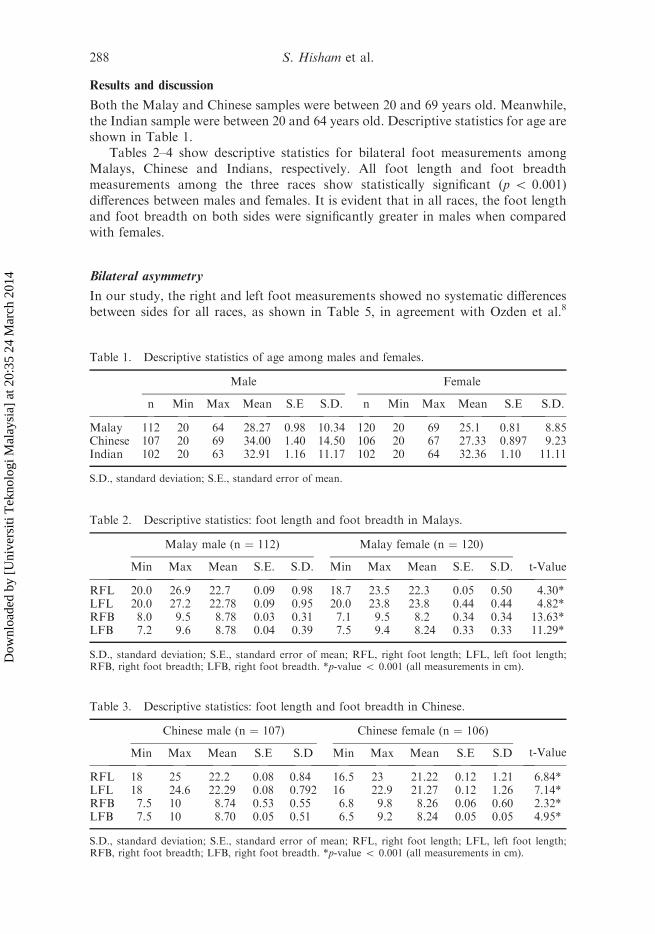
The subjects were requested to step on the osteometric board. Foot length(Figure 2) was determined to be the distance between the extreme point of thelongest toe (Acropodion) and the extreme point of the heel (Pternion) during normalphysiological stance. Foot breadth (Figure 3) was measured between the medial sideof the head of the first metatarsal and the lateral side of the head of the fifth
Figure 1. WARD’s Osteometric board.
286 S. Hisham et al.
Dow
nloa
ded
by [
Uni
vers
iti T
ekno
logi
Mal
aysi
a] a
t 20:
35 2
4 M
arch
201
4
metatarsal. All measurements were made on a flat surface between 14:00 hrs and17:00 hrs on each day of recording.
A Minitab version 15.0 statistical computer software was used for furtheranalysis. In this present study, discriminant function analysis, principal componentanalysis and hierarchical cluster analysis were utilized.
Figure 2. Foot length measurement.
Figure 3. Foot breadth measurement.
Australian Journal of Forensic Sciences 287
Dow
nloa
ded
by [
Uni
vers
iti T
ekno
logi
Mal
aysi
a] a
t 20:
35 2
4 M
arch
201
4
Results and discussion
Both the Malay and Chinese samples were between 20 and 69 years old. Meanwhile,the Indian sample were between 20 and 64 years old. Descriptive statistics for age areshown in Table 1.
Tables 2–4 show descriptive statistics for bilateral foot measurements amongMalays, Chinese and Indians, respectively. All foot length and foot breadthmeasurements among the three races show statistically significant (p 5 0.001)differences between males and females. It is evident that in all races, the foot lengthand foot breadth on both sides were significantly greater in males when comparedwith females.
Bilateral asymmetry
In our study, the right and left foot measurements showed no systematic differencesbetween sides for all races, as shown in Table 5, in agreement with Ozden et al.8
Table 1. Descriptive statistics of age among males and females.
Male Female
n Min Max Mean S.E S.D. n Min Max Mean S.E S.D.
Malay 112 20 64 28.27 0.98 10.34 120 20 69 25.1 0.81 8.85Chinese 107 20 69 34.00 1.40 14.50 106 20 67 27.33 0.897 9.23Indian 102 20 63 32.91 1.16 11.17 102 20 64 32.36 1.10 11.11
S.D., standard deviation; S.E., standard error of mean.
Table 2. Descriptive statistics: foot length and foot breadth in Malays.
Malay male (n ¼ 112) Malay female (n ¼ 120)
Min Max Mean S.E. S.D. Min Max Mean S.E. S.D. t-Value
RFL 20.0 26.9 22.7 0.09 0.98 18.7 23.5 22.3 0.05 0.50 4.30*LFL 20.0 27.2 22.78 0.09 0.95 20.0 23.8 23.8 0.44 0.44 4.82*RFB 8.0 9.5 8.78 0.03 0.31 7.1 9.5 8.2 0.34 0.34 13.63*LFB 7.2 9.6 8.78 0.04 0.39 7.5 9.4 8.24 0.33 0.33 11.29*
S.D., standard deviation; S.E., standard error of mean; RFL, right foot length; LFL, left foot length;RFB, right foot breadth; LFB, right foot breadth. *p-value 5 0.001 (all measurements in cm).
Table 3. Descriptive statistics: foot length and foot breadth in Chinese.
Chinese male (n ¼ 107) Chinese female (n ¼ 106)
t-ValueMin Max Mean S.E S.D Min Max Mean S.E S.D
RFL 18 25 22.2 0.08 0.84 16.5 23 21.22 0.12 1.21 6.84*LFL 18 24.6 22.29 0.08 0.792 16 22.9 21.27 0.12 1.26 7.14*RFB 7.5 10 8.74 0.53 0.55 6.8 9.8 8.26 0.06 0.60 2.32*LFB 7.5 10 8.70 0.05 0.51 6.5 9.2 8.24 0.05 0.05 4.95*
S.D., standard deviation; S.E., standard error of mean; RFL, right foot length; LFL, left foot length;RFB, right foot breadth; LFB, right foot breadth. *p-value 5 0.001 (all measurements in cm).
288 S. Hisham et al.
Dow
nloa
ded
by [
Uni
vers
iti T
ekno
logi
Mal
aysi
a] a
t 20:
35 2
4 M
arch
201
4
Krishan et al.9 had stated that none of the lower limb measurements showed anysignificant bilateral variation in relation to the weight bearing and locomotorfunction of the lower extremities.
Discriminant function analysis
Discriminant function analysis (DFA) maximizes the differences among groups, so itprovides a best case classification method if within group variation is similar, butexaggerates underlying differences among groups10. This classification methodrecords classification error rates for each group. The error rate is important becausea classification procedure is best judged on how well it classifies known referencegroups.
Correct classification rates that are a little better than random mean that thereis no appreciable intergroup variation in the variables used. Accordingly,classification rates at a far greater rate than expected, based on random allocation,will be considered as support for the hypothesis that differences exist amonggroups.
Table 6 shows the linear and quadratic discriminant function classification ofraces in the Malaysian population. DFA using five variables – which are stature,right foot length, left foot length, right foot breadth and left foot breadth –separates Malaysian Malay, Chinese and Indian more than 50% correctly. Forthese groups, there is a fair concordance between social race and biologicaldifferences.
Table 4. Descriptive statistics: foot length and foot breadth in Indians.
Indian male (n ¼ 102) Indian female (n ¼ 102)
t-ValueMin Max Mean S.E. S.D. Min Max Mean S.E. S.D.
RFL 20.5 26.0 22.39 0.12 1.2 19.0 23.8 22.05 0.1 0.99 2.20**LFL 21.0 26.0 22.4 0.12 1.22 20 23.8 22.03 0.09 0.88 2.48**RFB 7.8 11.0 8.62 0.05 0.53 5.9 10 8.25 0.06 0.57 4.83*LFB 7.8 10.6 8.66 0.05 0.50 6.4 9.7 8.31 0.06 0.58 4.67*
S.D., standard deviation; S.E., standard error of mean; RFL, right foot length; LFL, left foot length;RFB, right foot breadth; LFB, right foot breadth. *p-value 5 0.001, **p-value 5 0.05 (all measurementsin cm).
Table 5. Bilateral differences in foot dimensions among males and females.
Foot length Foot breadth
Right-left Mean S.D. t-Value p-Value Mean S.D. t-Value p-Value
Malay male 70.032 0.97 70.25 0.8 0.001 0.35 0.02 0.99Malay female 70.002 0.47 70.03 0.98 70.04 0.34 71.00 0.32Chinese male 70.101 0.82 70.91 0.37 70.05 0.53 70.79 0.431Chinese female 70.045 1.35 70.27 0.79 0.12 8.3 1.49 0.137Indian male 70.007 22.4 70.04 0.97 70.04 0.52 70.56 0.578Indian female 70.025 0.94 0.19 0.85 70.06 0.57 70.70 0.485
S.D., standard deviation (all measurments in cm)
Australian Journal of Forensic Sciences 289
Dow
nloa
ded
by [
Uni
vers
iti T
ekno
logi
Mal
aysi
a] a
t 20:
35 2
4 M
arch
201
4
Principal component analysis
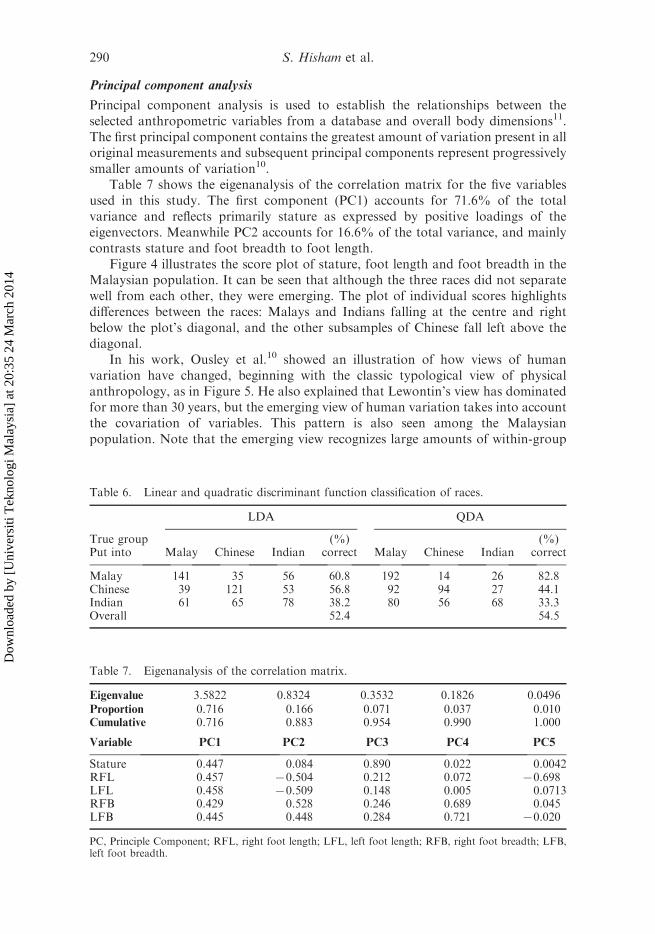
Principal component analysis is used to establish the relationships between theselected anthropometric variables from a database and overall body dimensions11.The first principal component contains the greatest amount of variation present in alloriginal measurements and subsequent principal components represent progressivelysmaller amounts of variation10.
Table 7 shows the eigenanalysis of the correlation matrix for the five variablesused in this study. The first component (PC1) accounts for 71.6% of the totalvariance and reflects primarily stature as expressed by positive loadings of theeigenvectors. Meanwhile PC2 accounts for 16.6% of the total variance, and mainlycontrasts stature and foot breadth to foot length.
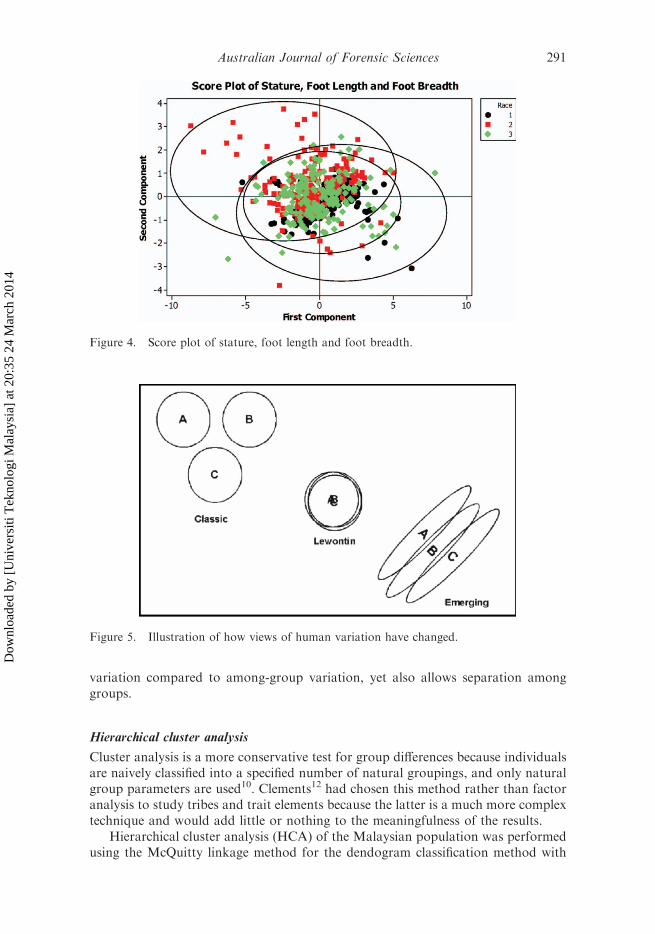
Figure 4 illustrates the score plot of stature, foot length and foot breadth in theMalaysian population. It can be seen that although the three races did not separatewell from each other, they were emerging. The plot of individual scores highlightsdifferences between the races: Malays and Indians falling at the centre and rightbelow the plot’s diagonal, and the other subsamples of Chinese fall left above thediagonal.
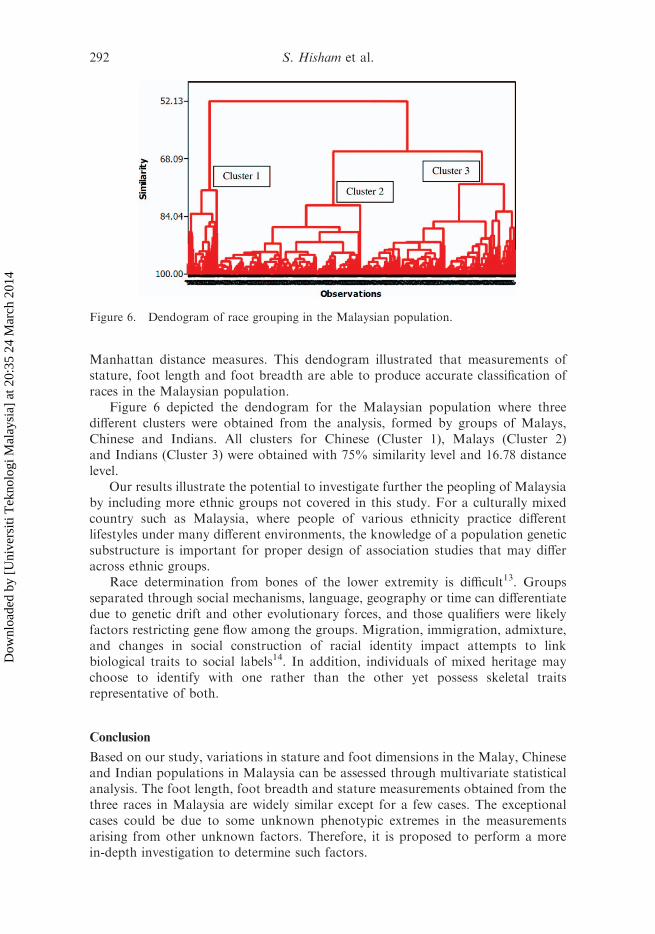
In his work, Ousley et al.10 showed an illustration of how views of humanvariation have changed, beginning with the classic typological view of physicalanthropology, as in Figure 5. He also explained that Lewontin’s view has dominatedfor more than 30 years, but the emerging view of human variation takes into accountthe covariation of variables. This pattern is also seen among the Malaysianpopulation. Note that the emerging view recognizes large amounts of within-group
Table 7. Eigenanalysis of the correlation matrix.
Eigenvalue 3.5822 0.8324 0.3532 0.1826 0.0496Proportion 0.716 0.166 0.071 0.037 0.010Cumulative 0.716 0.883 0.954 0.990 1.000
Variable PC1 PC2 PC3 PC4 PC5
Stature 0.447 0.084 0.890 0.022 0.0042RFL 0.457 70.504 0.212 0.072 70.698LFL 0.458 70.509 0.148 0.005 0.0713RFB 0.429 0.528 0.246 0.689 0.045LFB 0.445 0.448 0.284 0.721 70.020
PC, Principle Component; RFL, right foot length; LFL, left foot length; RFB, right foot breadth; LFB,left foot breadth.
Table 6. Linear and quadratic discriminant function classification of races.
LDA QDA
True groupPut into Malay Chinese Indian
(%)correct Malay Chinese Indian
(%)correct
Malay 141 35 56 60.8 192 14 26 82.8Chinese 39 121 53 56.8 92 94 27 44.1Indian 61 65 78 38.2 80 56 68 33.3Overall 52.4 54.5
290 S. Hisham et al.
Dow
nloa
ded
by [
Uni
vers
iti T
ekno
logi
Mal
aysi
a] a
t 20:
35 2
4 M
arch
201
4
variation compared to among-group variation, yet also allows separation amonggroups.
Hierarchical cluster analysis
Cluster analysis is a more conservative test for group differences because individualsare naively classified into a specified number of natural groupings, and only naturalgroup parameters are used10. Clements12 had chosen this method rather than factoranalysis to study tribes and trait elements because the latter is a much more complextechnique and would add little or nothing to the meaningfulness of the results.
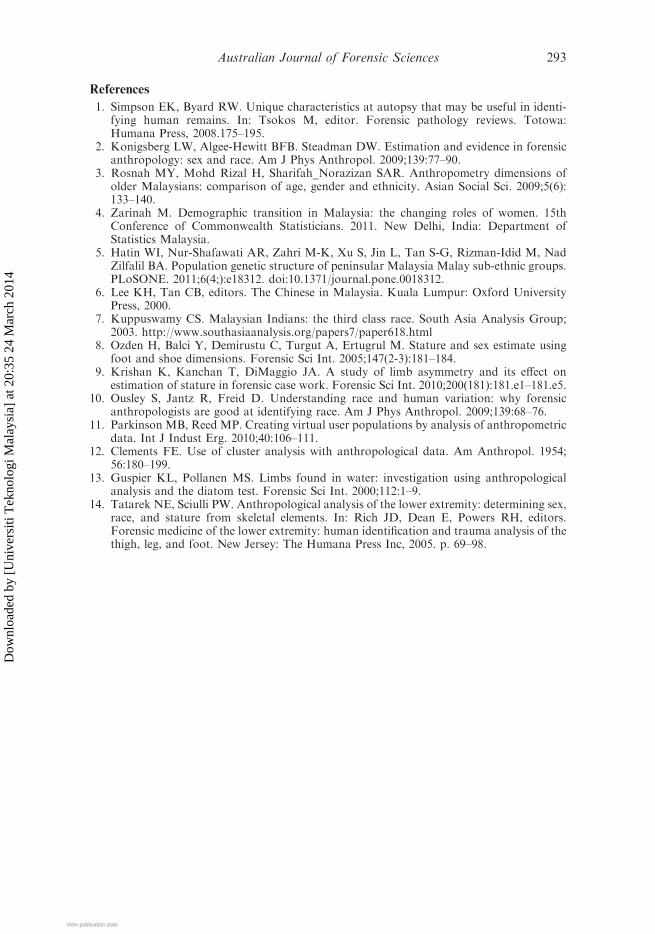
Hierarchical cluster analysis (HCA) of the Malaysian population was performedusing the McQuitty linkage method for the dendogram classification method with
Figure 4. Score plot of stature, foot length and foot breadth.
Figure 5. Illustration of how views of human variation have changed.
Australian Journal of Forensic Sciences 291
Dow
nloa
ded
by [
Uni
vers
iti T
ekno
logi
Mal
aysi
a] a
t 20:
35 2
4 M
arch
201
4
Manhattan distance measures. This dendogram illustrated that measurements ofstature, foot length and foot breadth are able to produce accurate classification ofraces in the Malaysian population.
Figure 6 depicted the dendogram for the Malaysian population where threedifferent clusters were obtained from the analysis, formed by groups of Malays,Chinese and Indians. All clusters for Chinese (Cluster 1), Malays (Cluster 2)and Indians (Cluster 3) were obtained with 75% similarity level and 16.78 distancelevel.
Our results illustrate the potential to investigate further the peopling of Malaysiaby including more ethnic groups not covered in this study. For a culturally mixedcountry such as Malaysia, where people of various ethnicity practice differentlifestyles under many different environments, the knowledge of a population geneticsubstructure is important for proper design of association studies that may differacross ethnic groups.
Race determination from bones of the lower extremity is difficult13. Groupsseparated through social mechanisms, language, geography or time can differentiatedue to genetic drift and other evolutionary forces, and those qualifiers were likelyfactors restricting gene flow among the groups. Migration, immigration, admixture,and changes in social construction of racial identity impact attempts to linkbiological traits to social labels14. In addition, individuals of mixed heritage maychoose to identify with one rather than the other yet possess skeletal traitsrepresentative of both.
Conclusion
Based on our study, variations in stature and foot dimensions in the Malay, Chineseand Indian populations in Malaysia can be assessed through multivariate statisticalanalysis. The foot length, foot breadth and stature measurements obtained from thethree races in Malaysia are widely similar except for a few cases. The exceptionalcases could be due to some unknown phenotypic extremes in the measurementsarising from other unknown factors. Therefore, it is proposed to perform a morein-depth investigation to determine such factors.
Figure 6. Dendogram of race grouping in the Malaysian population.
292 S. Hisham et al.
Dow
nloa
ded
by [
Uni
vers
iti T
ekno
logi
Mal
aysi
a] a
t 20:
35 2
4 M
arch
201
4
References
1. Simpson EK, Byard RW. Unique characteristics at autopsy that may be useful in identi-fying human remains. In: Tsokos M, editor. Forensic pathology reviews. Totowa:Humana Press, 2008.175–195.
2. Konigsberg LW, Algee-Hewitt BFB. Steadman DW. Estimation and evidence in forensicanthropology: sex and race. Am J Phys Anthropol. 2009;139:77–90.
3. Rosnah MY, Mohd Rizal H, Sharifah_Norazizan SAR. Anthropometry dimensions ofolder Malaysians: comparison of age, gender and ethnicity. Asian Social Sci. 2009;5(6):133–140.
4. Zarinah M. Demographic transition in Malaysia: the changing roles of women. 15thConference of Commonwealth Statisticians. 2011. New Delhi, India: Department ofStatistics Malaysia.
5. Hatin WI, Nur-Shafawati AR, Zahri M-K, Xu S, Jin L, Tan S-G, Rizman-Idid M, NadZilfalil BA. Population genetic structure of peninsular Malaysia Malay sub-ethnic groups.PLoSONE. 2011;6(4;):e18312. doi:10.1371/journal.pone.0018312.
6. Lee KH, Tan CB, editors. The Chinese in Malaysia. Kuala Lumpur: Oxford UniversityPress, 2000.
7. Kuppuswamy CS. Malaysian Indians: the third class race. South Asia Analysis Group;2003. http://www.southasiaanalysis.org/papers7/paper618.html
8. Ozden H, Balci Y, Demirustu C, Turgut A, Ertugrul M. Stature and sex estimate usingfoot and shoe dimensions. Forensic Sci Int. 2005;147(2-3):181–184.
9. Krishan K, Kanchan T, DiMaggio JA. A study of limb asymmetry and its effect onestimation of stature in forensic case work. Forensic Sci Int. 2010;200(181):181.e1–181.e5.
10. Ousley S, Jantz R, Freid D. Understanding race and human variation: why forensicanthropologists are good at identifying race. Am J Phys Anthropol. 2009;139:68–76.
11. Parkinson MB, Reed MP. Creating virtual user populations by analysis of anthropometricdata. Int J Indust Erg. 2010;40:106–111.
12. Clements FE. Use of cluster analysis with anthropological data. Am Anthropol. 1954;56:180–199.
13. Guspier KL, Pollanen MS. Limbs found in water: investigation using anthropologicalanalysis and the diatom test. Forensic Sci Int. 2000;112:1–9.
14. Tatarek NE, Sciulli PW. Anthropological analysis of the lower extremity: determining sex,race, and stature from skeletal elements. In: Rich JD, Dean E, Powers RH, editors.Forensic medicine of the lower extremity: human identification and trauma analysis of thethigh, leg, and foot. New Jersey: The Humana Press Inc, 2005. p. 69–98.
Australian Journal of Forensic Sciences 293
Dow
nloa
ded
by [
Uni
vers
iti T
ekno
logi
Mal
aysi
a] a
t 20:
35 2
4 M
arch
201
4
View publication statsView publication stats


![· PDF fileStilul educativ al fiec\ruia dintre p\rin]i [i al familiei ca unitate educativ\ poate explica distribu]ia diferen]iat\ a delincven]ei juvenile (St\nciulescu, 1997: 108)](https://img.pdfslide.us/doc/110x75/5a7de0e17f8b9a49588df202/educativ-al-fiecruia-dintre-prini-i-al-familiei-ca-unitate-educativ-poate-explica.jpg)


![APOSTOLIC SUCCESSIONanglicanministries.org/wp-content/uploads/APOSTOLIC_SUCCESSIO… · 37. St. Damasus [I] 366 38. St. Siricius 384 39. St. Anastasius [I] 399 40. St. Innocent [I]](https://img.pdfslide.us/doc/110x75/60eb4325da822a370c1d6274/apostolic-successi-37-st-damasus-i-366-38-st-siricius-384-39-st-anastasius.jpg)