Embed Size (px)
Citation preview

MTN SATim Lowry
VP SEA Region & MD SA
2
Agenda
1. Introduction – Tim Lowry, MD
2. Unpacking the financials – Zunaid Bulbulia, CFO
3. People and organisation – Tim Lowry, MD
4. Brand and value propositions – Pieter Verkade, CMO
5. Distribution and customer experience – Brian Gouldie, CSSO
6. Quality network and IT – Sameer Dave, CTO
7. Regulatory – Zunaid Bulbulia, CFO
8. In summary – Tim Lowry, MD

3
Introduction
IntroductionTim Lowry
MD
4
Strategy going forward
Preparing for increase in market maturity
Balance between financial efficiency and market effectiveness
Opportunities
• Market still growing both in terms of subscribers and revenues
• Low residential fixed line penetration giving- Mobile a strong position
- Wireless data opportunities
• Business- Fixed-mobile convergence
- SME opportunity
• Class mobility
5
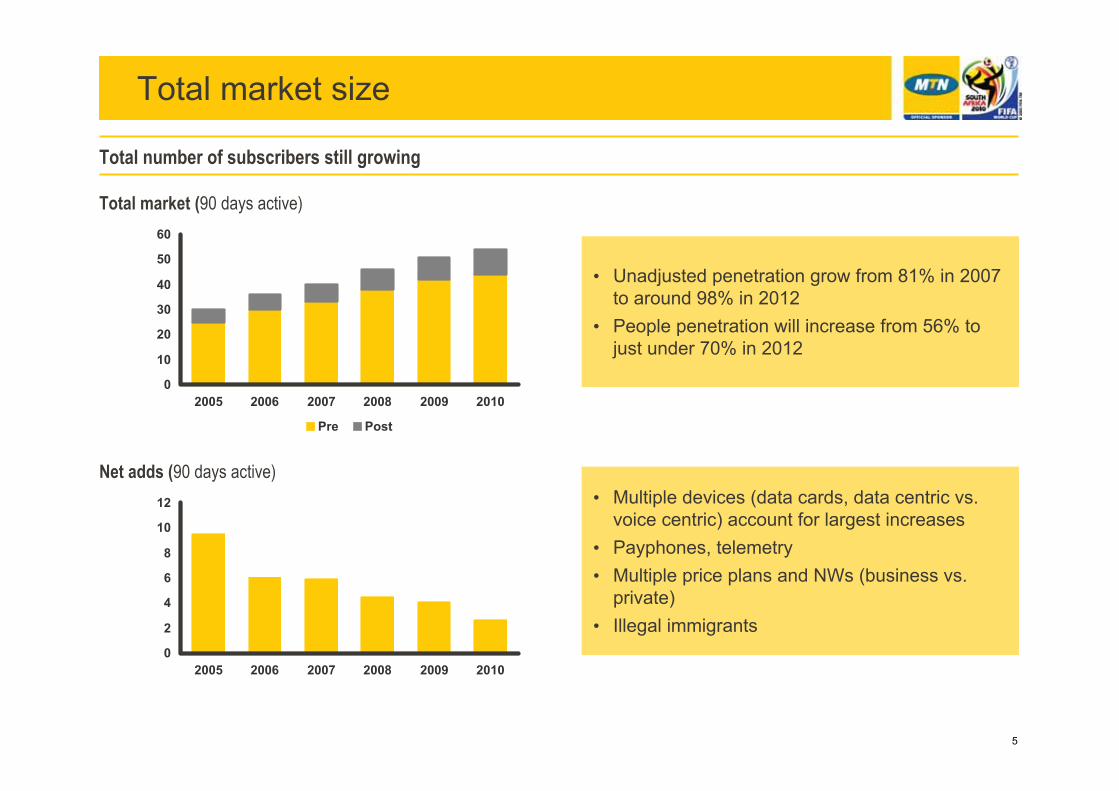
Total market size
Total number of subscribers still growing
0
10
20
30
40
50
60
2005 2006 2007 2008 2009 2010
Pre Post
Total market (90 days active)
0
2
4
6
8
10
12
2005 2006 2007 2008 2009 2010
Net adds (90 days active)
• Unadjusted penetration grow from 81% in 2007 to around 98% in 2012
• People penetration will increase from 56% to just under 70% in 2012
• Multiple devices (data cards, data centric vs. voice centric) account for largest increases
• Payphones, telemetry• Multiple price plans and NWs (business vs.
private)• Illegal immigrants
6
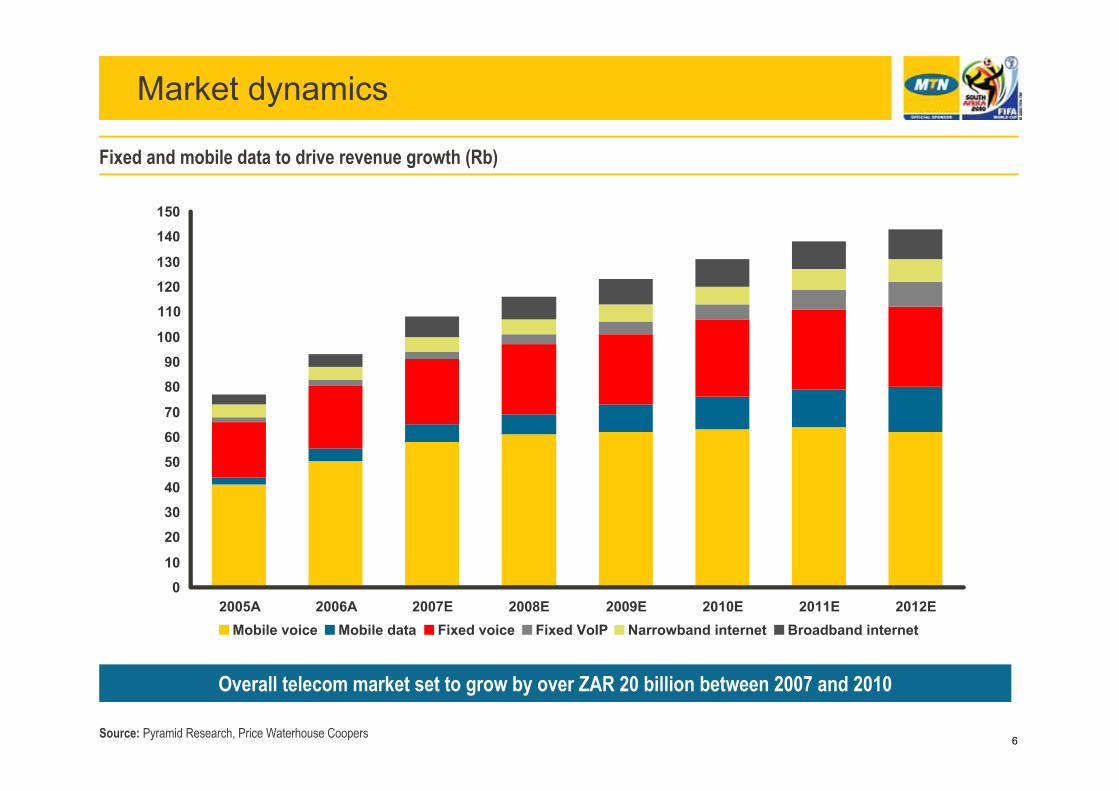
Market dynamics
Fixed and mobile data to drive revenue growth (Rb)
0
10
20
30
40
50
60
70
80
90
100
110
120
130
140
150
2005A 2006A 2007E 2008E 2009E 2010E 2011E 2012EMobile voice Mobile data Fixed voice Fixed VoIP Narrowband internet Broadband internet
Overall telecom market set to grow by over ZAR 20 billion between 2007 and 2010
Source: Pyramid Research, Price Waterhouse Coopers
7
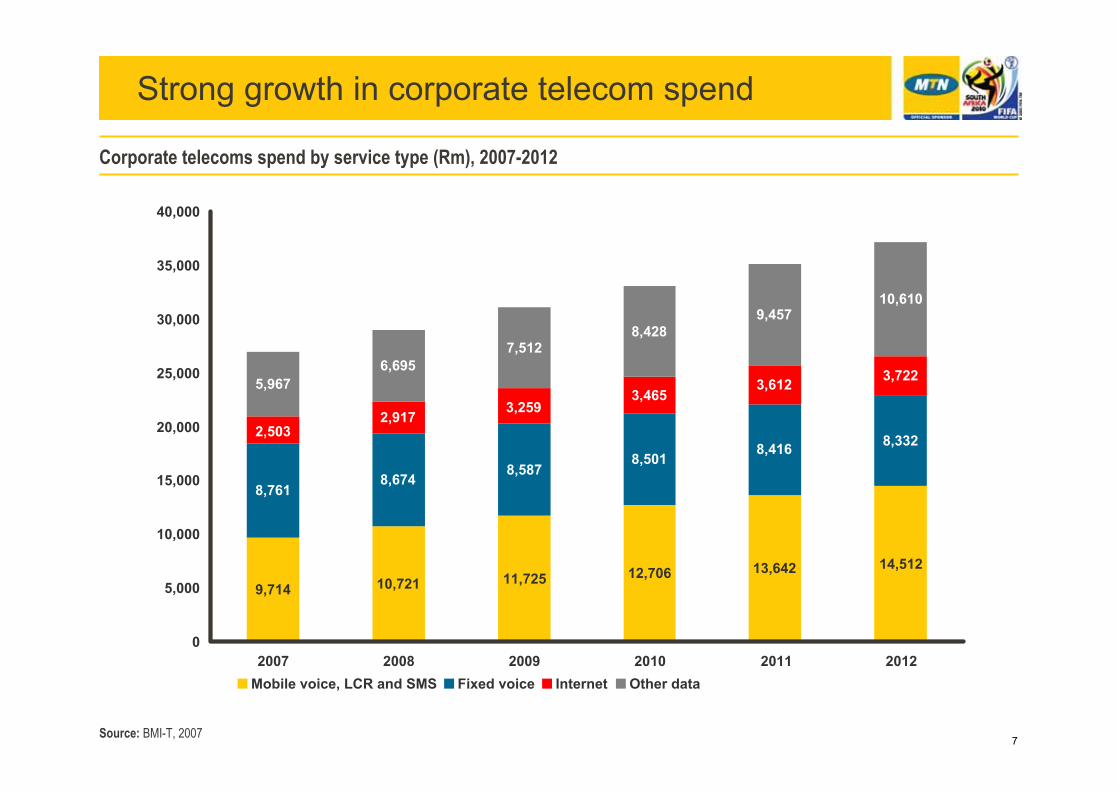
Strong growth in corporate telecom spend
9,714 10,721 11,725 12,706 13,642 14,512
8,7618,674
8,5878,501
8,416 8,332
3,4653,612 3,7225,967
6,6957,512
8,4289,457
10,610
3,2592,917
2,503
0
5,000
10,000
15,000
20,000
25,000
30,000
35,000
40,000
2007 2008 2009 2010 2011 2012Mobile voice, LCR and SMS Fixed voice Internet Other data
Source: BMI-T, 2007
Corporate telecoms spend by service type (Rm), 2007-2012
8
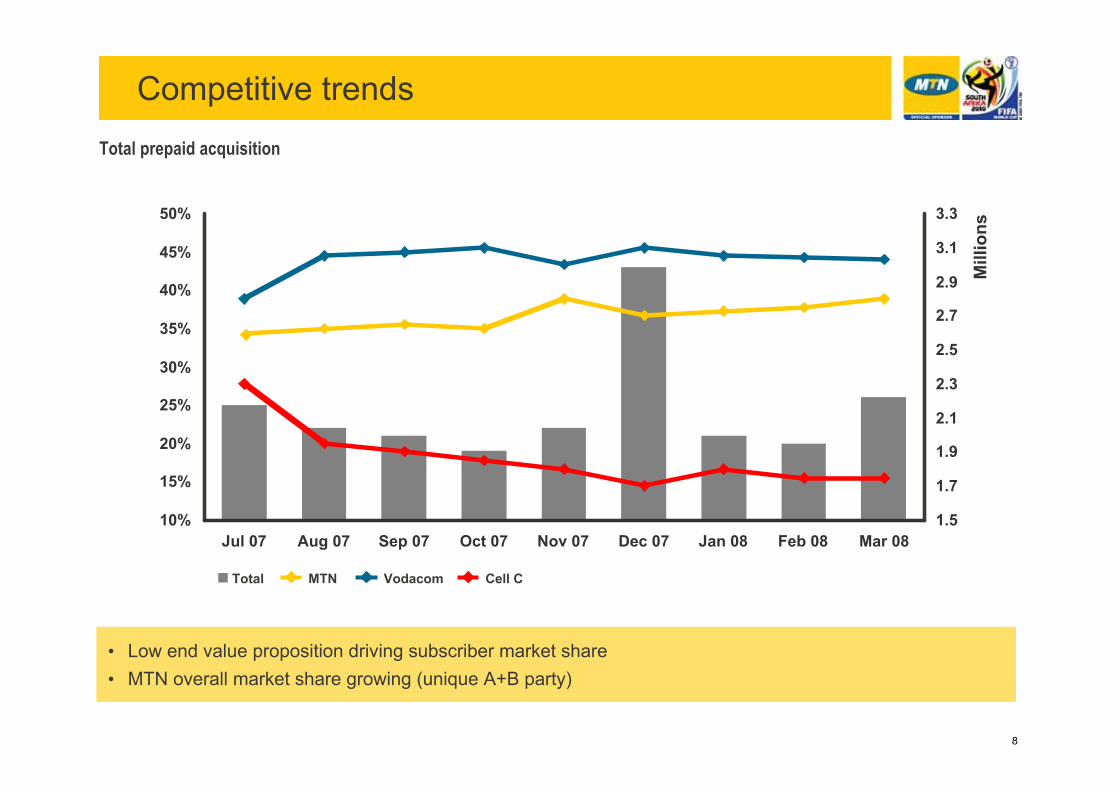
Competitive trends
Total MTN Vodacom Cell C
10%
15%
20%
25%
30%
35%
40%
45%
50%
Jul 07 Aug 07 Sep 07 Oct 07 Nov 07 Dec 07 Jan 08 Feb 08 Mar 081.5
1.7
1.9
2.1
2.3
2.5
2.7
2.9
3.1
3.3
Mill
ions
Total prepaid acquisition
• Low end value proposition driving subscriber market share• MTN overall market share growing (unique A+B party)
9
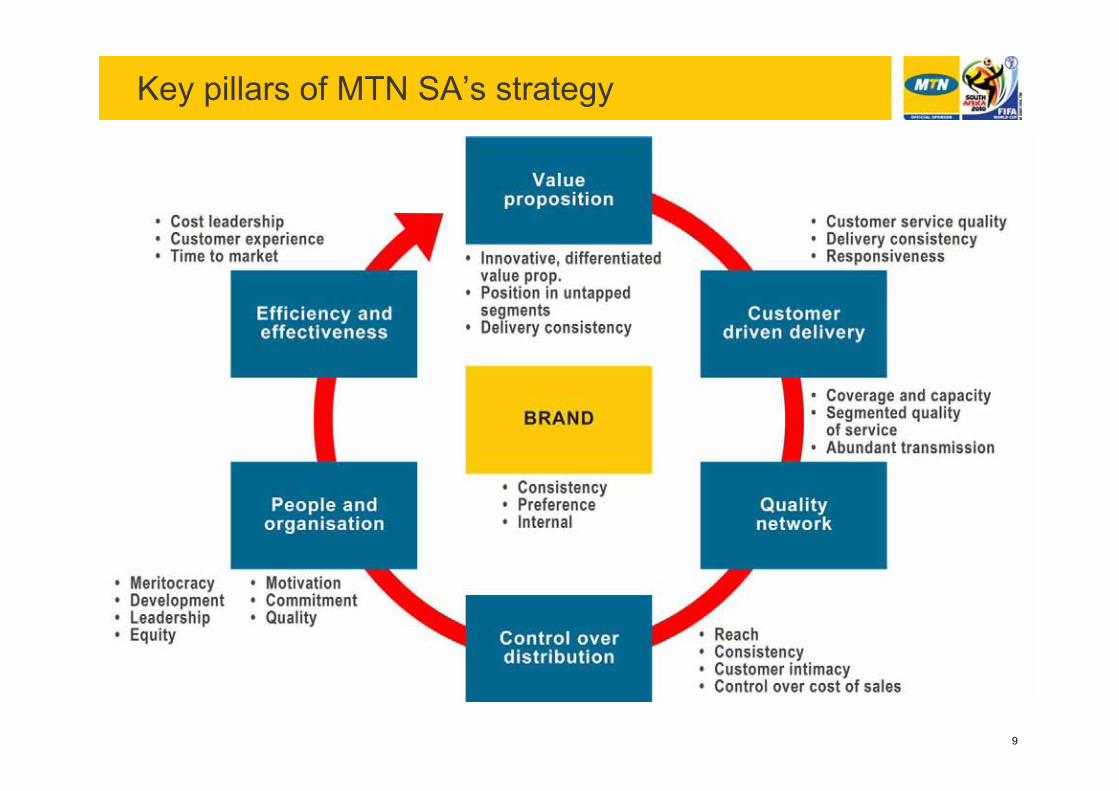
Key pillars of MTN SA’s strategy
10
Unpacking the financials
Unpacking the financialsZunaid Bulbulia
CFO
11
Overview
• Prepaid voice is still key revenue driver
• Data increasingly important
• Interconnect
• Current investment programme:- Quality network
- Distribution
- Customer service
• Continued strong cost control
Balance between financial efficiency and market effectiveness
12
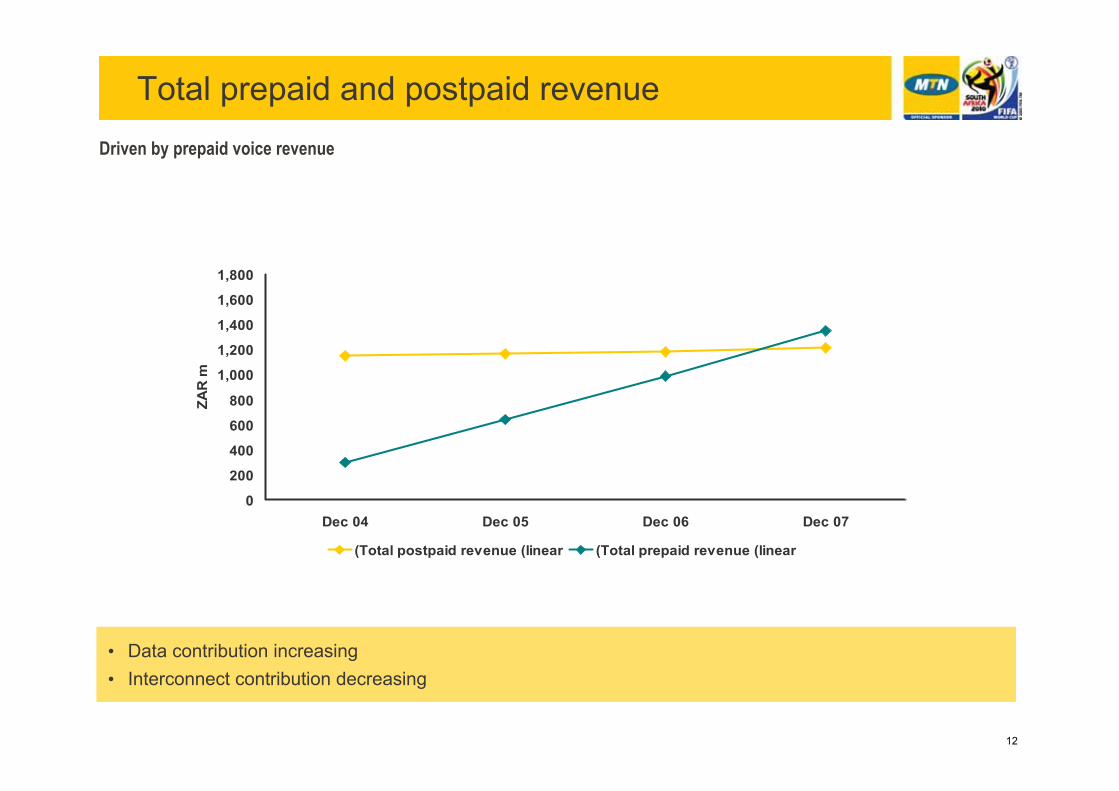
• Data contribution increasing• Interconnect contribution decreasing
Total prepaid and postpaid revenue
0
200
400
600
800
1,000
1,200
1,400
1,600
1,800
Dec 04 Dec 05 Dec 06 Dec 07
ZAR
m
0000000000
(Total postpaid revenue (linear (Total prepaid revenue (linear
Driven by prepaid voice revenue
13
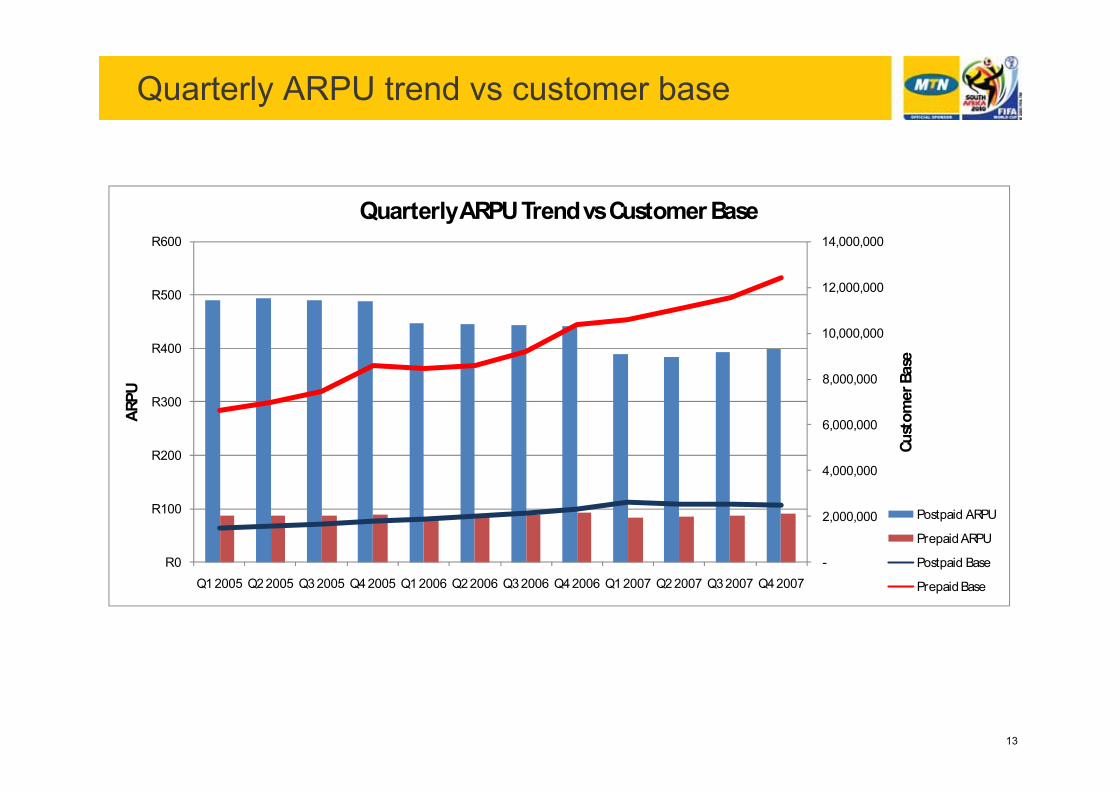
Quarterly ARPU trend vs customer base
-
2,000,000
4,000,000
6,000,000
8,000,000
10,000,000
12,000,000
14,000,000
R 0
R 100
R 200
R 300
R 400
R 500
R 600
Q1 2005 Q2 2005 Q3 2005 Q4 2005 Q1 2006 Q2 2006 Q3 2006 Q4 2006 Q1 2007 Q2 2007 Q3 2007 Q4 2007
Cust
omer
Bas
e
ARPU
Quarterly ARPU Trend vs Customer Base
Postpaid ARPU
Prepaid ARPU
Postpaid Base
Prepaid Base
14
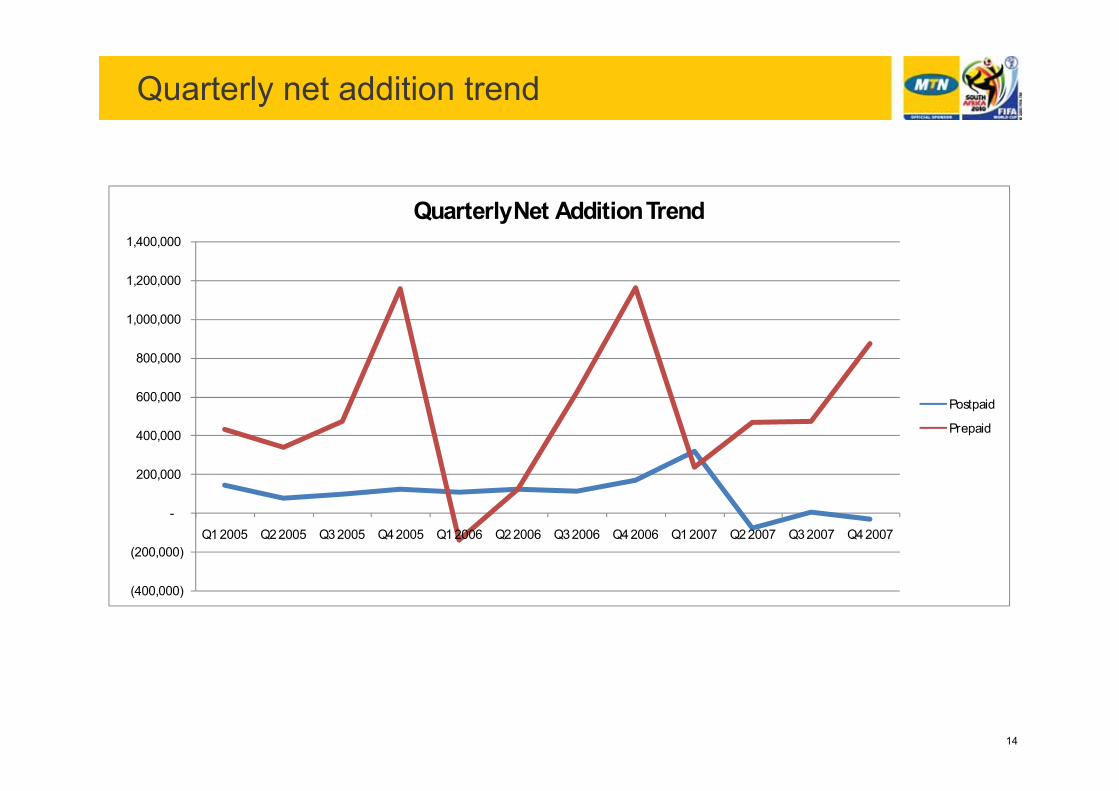
Quarterly net addition trend
(400,000)
(200,000)
-
200,000
400,000
600,000
800,000
1,000,000
1,200,000
1,400,000
Q1 2005 Q2 2005 Q3 2005 Q4 2005 Q1 2006 Q2 2006 Q3 2006 Q4 2006 Q1 2007 Q2 2007 Q3 2007 Q4 2007
Quarterly Net Addition Trend
Postpaid
Prepaid
15
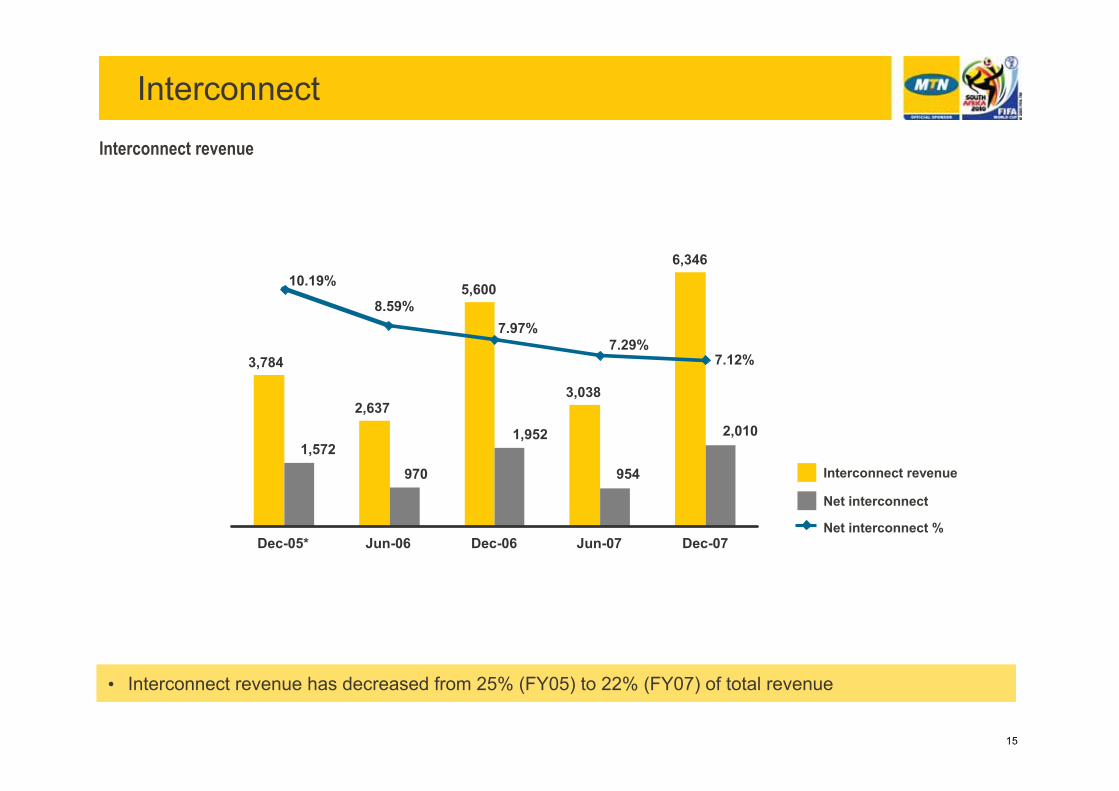
InterconnectInterconnect revenue
3,784
2,637
5,600
3,038
6,346
2,010
954
1,952
970
1,572
7.12%7.29%
8.59%
10.19%
7.97%
0
1,000
2,000
3,000
4,000
5,000
6,000
7,000
Dec-05* Jun-06 Dec-06 Jun-07 Dec-070.00%
2.00%
4.00%
6.00%
8.00%
10.00%
12.00%
Interconnect revenue
Net interconnect
Net interconnect %
• Interconnect revenue has decreased from 25% (FY05) to 22% (FY07) of total revenue
16
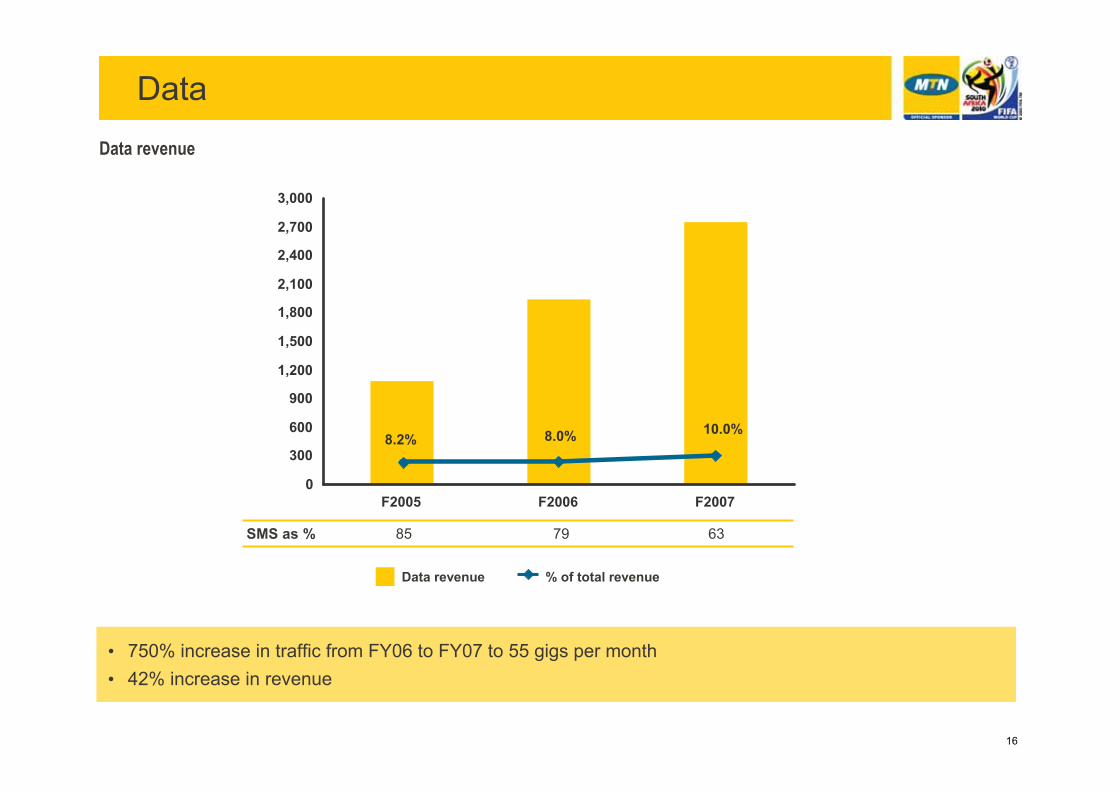
DataData revenue
8.2% 8.0% 10.0%
0
300
600
900
1,200
1,500
1,800
2,100
2,400
2,700
3,000
F2005 F2006 F20070%
10%
20%
30%
40%
50%
60%
70%
80%
90%
100%
Data revenue % of total revenue
SMS as % 85 79 63
• 750% increase in traffic from FY06 to FY07 to 55 gigs per month• 42% increase in revenue
17
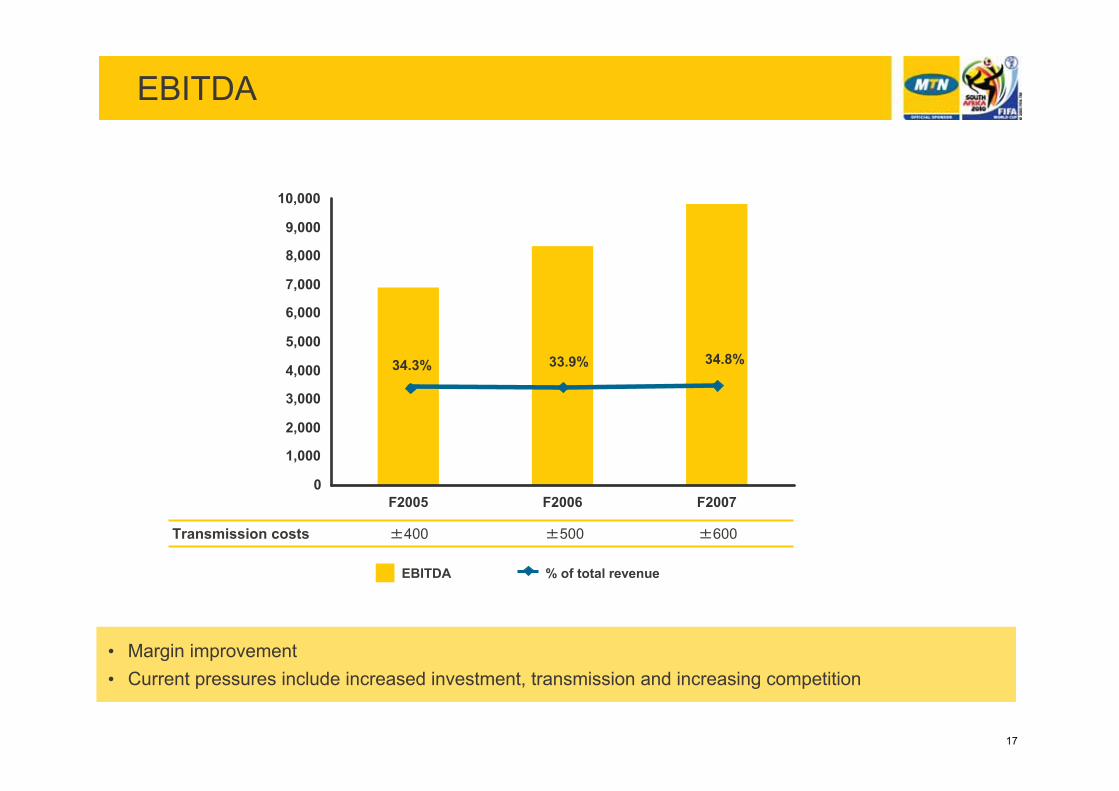
EBITDA
34.3% 33.9% 34.8%
0
1,000
2,000
3,000
4,000
5,000
6,000
7,000
8,000
9,000
10,000
F2005 F2006 F20070%
10%
20%
30%
40%
50%
60%
70%
80%
90%
100%
EBITDA % of total revenue
• Margin improvement• Current pressures include increased investment, transmission and increasing competition
Transmission costs 400 500 600
18
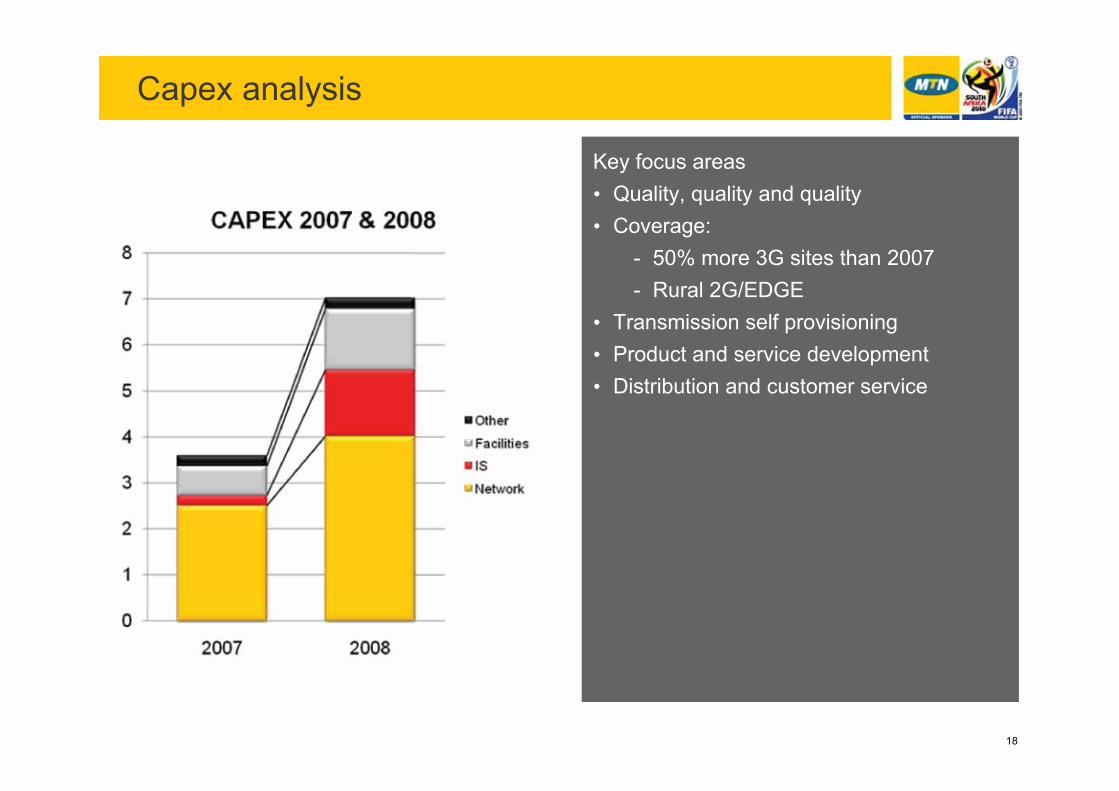
Capex analysis
Key focus areas• Quality, quality and quality• Coverage:
- 50% more 3G sites than 2007- Rural 2G/EDGE
• Transmission self provisioning• Product and service development• Distribution and customer service

19
People and organisation
People and organisationTim Lowry
MD
20
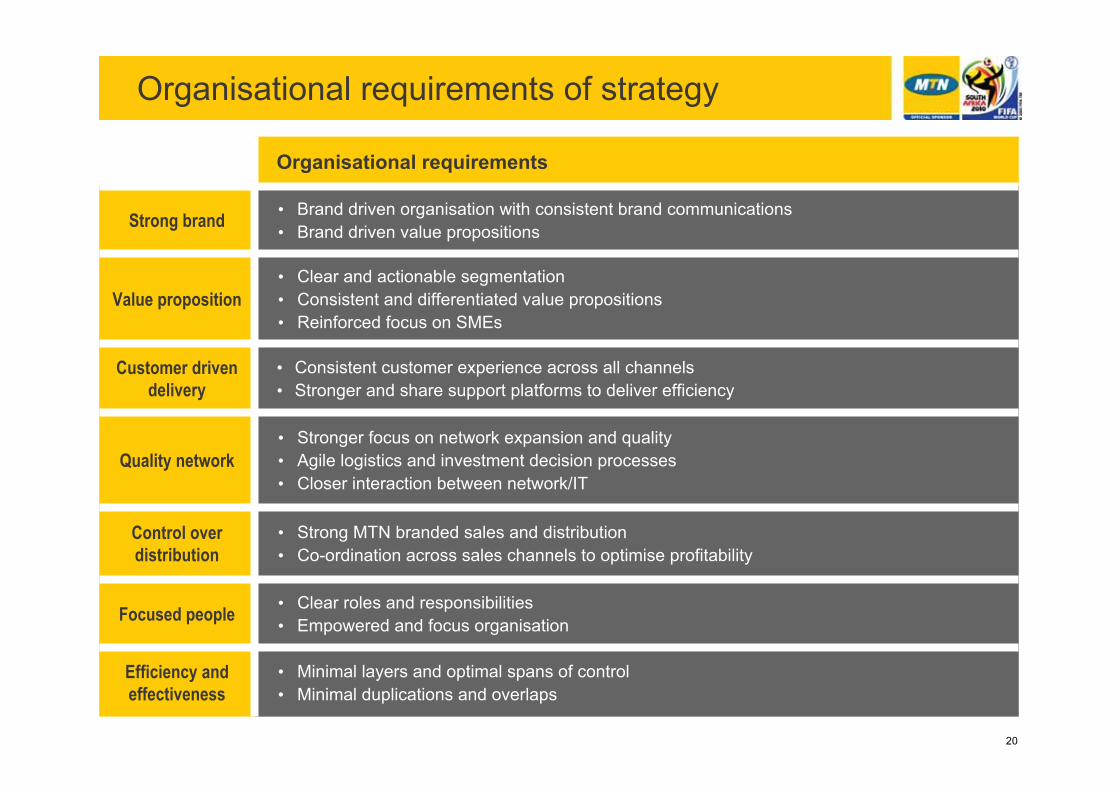
Organisational requirements of strategy
Organisational requirements
Strong brand • Brand driven organisation with consistent brand communications• Brand driven value propositions
Value proposition• Clear and actionable segmentation• Consistent and differentiated value propositions• Reinforced focus on SMEs
Customer driven delivery
• Consistent customer experience across all channels• Stronger and share support platforms to deliver efficiency
Quality network• Stronger focus on network expansion and quality• Agile logistics and investment decision processes• Closer interaction between network/IT
Control over distribution
• Strong MTN branded sales and distribution• Co-ordination across sales channels to optimise profitability
Focused people • Clear roles and responsibilities• Empowered and focus organisation
Efficiency and effectiveness
• Minimal layers and optimal spans of control• Minimal duplications and overlaps
21
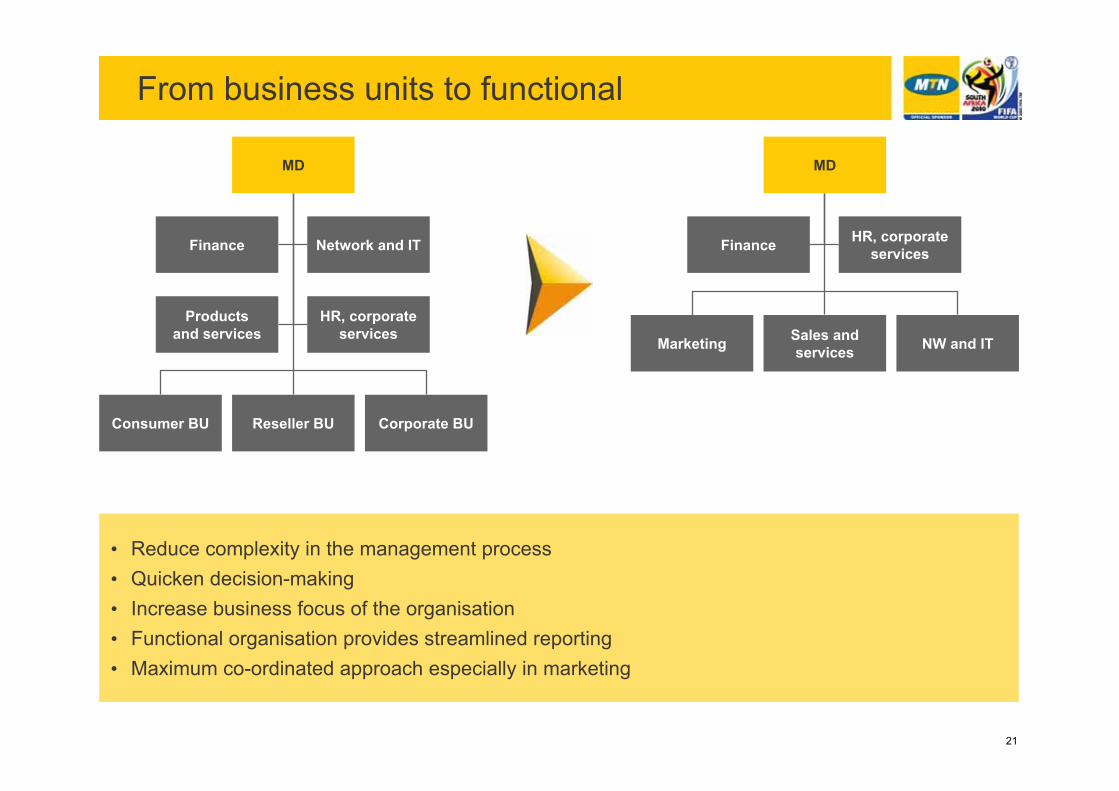
Marketing Sales and services NW and IT
Finance HR, corporate services
From business units to functional
Consumer BU Reseller BU Corporate BU
MD
Finance
Productsand services
Network and IT
HR, corporate services
MD
• Reduce complexity in the management process• Quicken decision-making• Increase business focus of the organisation• Functional organisation provides streamlined reporting• Maximum co-ordinated approach especially in marketing
22
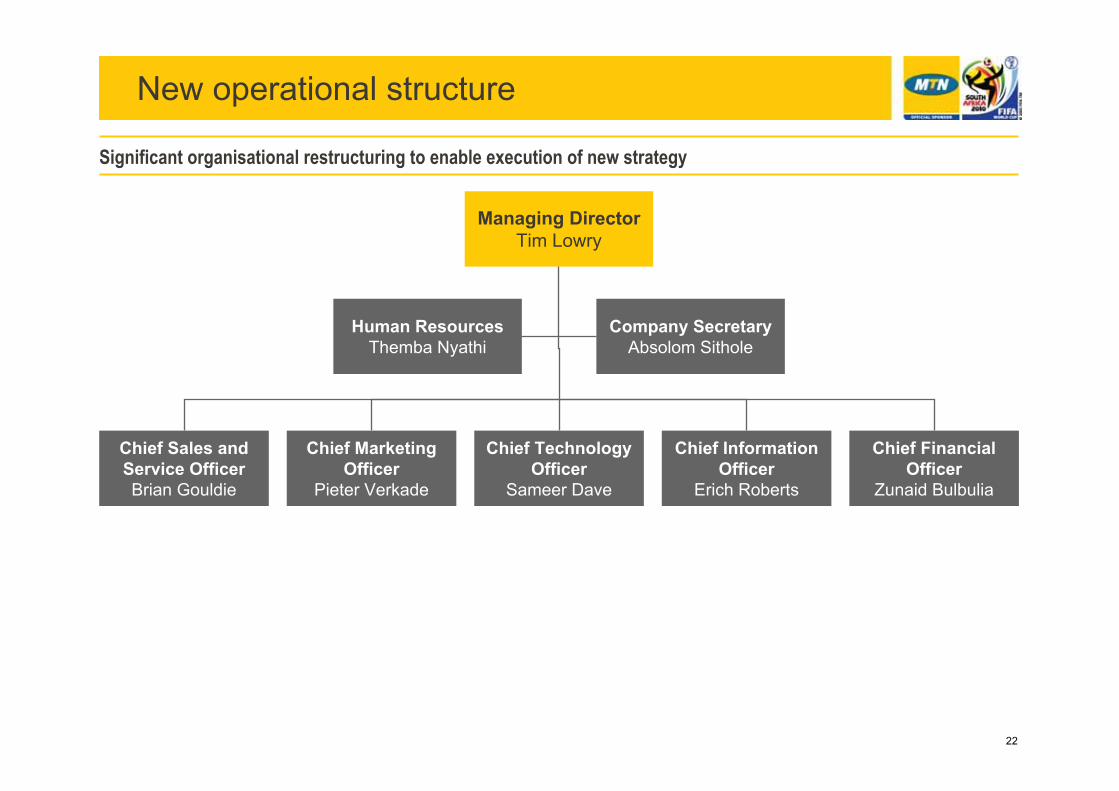
New operational structure
Managing DirectorTim Lowry
Significant organisational restructuring to enable execution of new strategy
Chief Sales and Service OfficerBrian Gouldie
Chief Financial Officer
Zunaid Bulbulia
Chief Information Officer
Erich Roberts
Chief Technology Officer
Sameer Dave
Chief Marketing Officer
Pieter Verkade
Human ResourcesThemba Nyathi
Company SecretaryAbsolom Sithole
23
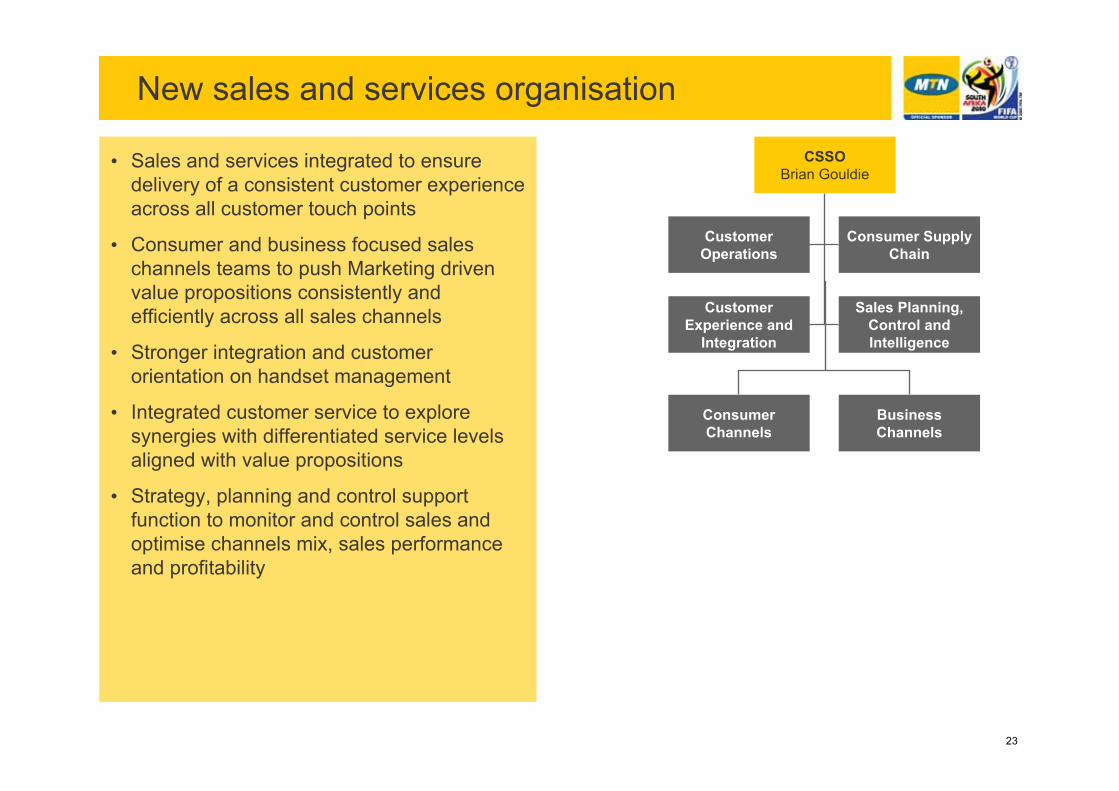
New sales and services organisation
Consumer Channels
BusinessChannels
CSSOBrian Gouldie
CustomerOperations
CustomerExperience and
Integration
Consumer Supply Chain
Sales Planning, Control and Intelligence
• Sales and services integrated to ensure delivery of a consistent customer experience across all customer touch points
• Consumer and business focused sales channels teams to push Marketing driven value propositions consistently and efficiently across all sales channels
• Stronger integration and customer orientation on handset management
• Integrated customer service to explore synergies with differentiated service levels aligned with value propositions
• Strategy, planning and control support function to monitor and control sales and optimise channels mix, sales performance and profitability
24
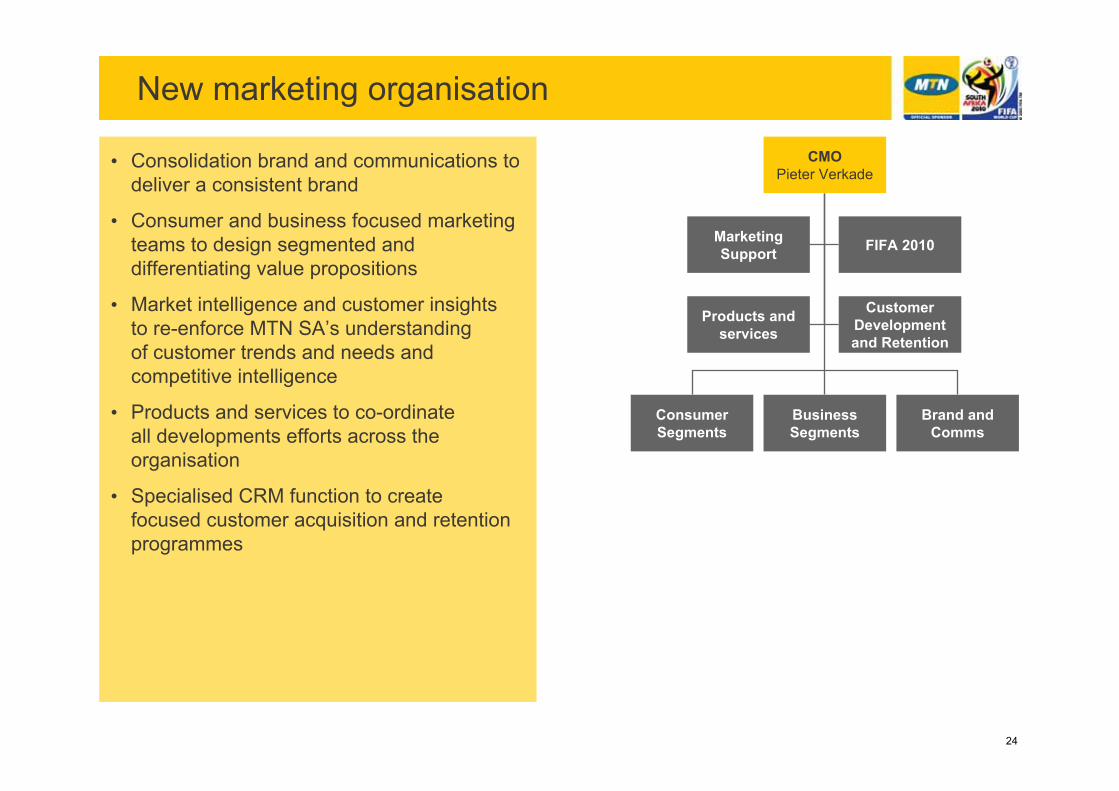
New marketing organisation
• Consolidation brand and communications to deliver a consistent brand
• Consumer and business focused marketing teams to design segmented and differentiating value propositions
• Market intelligence and customer insightsto re-enforce MTN SA’s understandingof customer trends and needs and competitive intelligence
• Products and services to co-ordinateall developments efforts across the organisation
• Specialised CRM function to createfocused customer acquisition and retention programmes
Consumer Segments
BusinessSegments
Brand and Comms
CMOPieter Verkade
MarketingSupport
Products and services
FIFA 2010
CustomerDevelopment and Retention
25
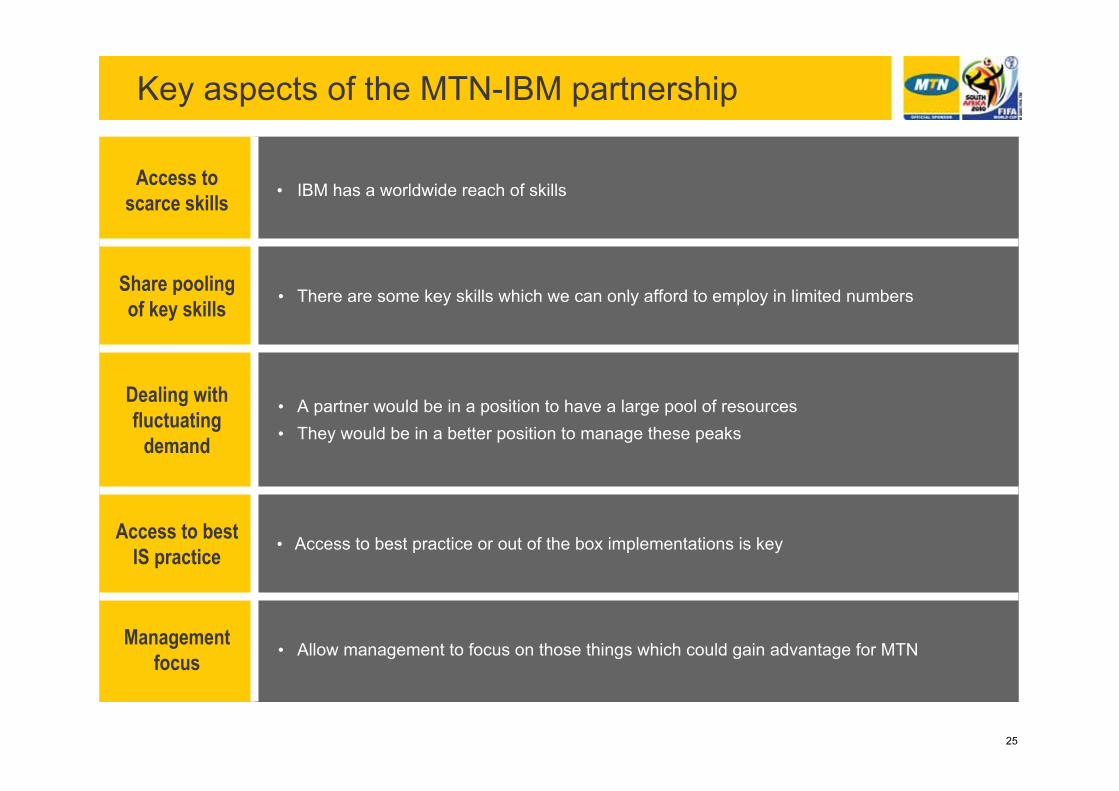
Key aspects of the MTN-IBM partnership
Access to scarce skills • IBM has a worldwide reach of skills
Share pooling of key skills • There are some key skills which we can only afford to employ in limited numbers
Dealing with fluctuating
demand
• A partner would be in a position to have a large pool of resources• They would be in a better position to manage these peaks
Access to best IS practice • Access to best practice or out of the box implementations is key
Managementfocus • Allow management to focus on those things which could gain advantage for MTN

26
Brand and value propositions
Brand and value propositionsPieter Verkade
CMO
27
Key focus items on the brand
• Consistency: Messages
• Consistency: Tone of voice
• Consistency: Look and feel
• Honour our brand values
• Do what we promise internally and externally
28
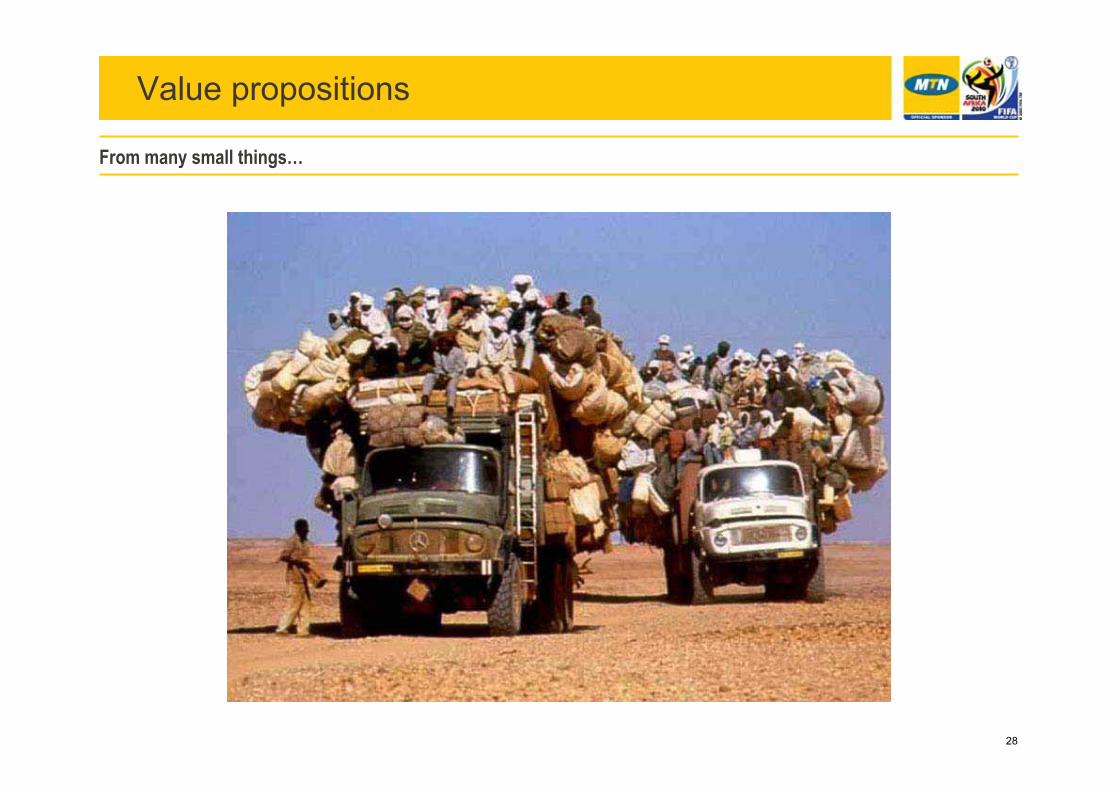
Value propositions
From many small things…
29
Value propositions
…to a few big ones
30
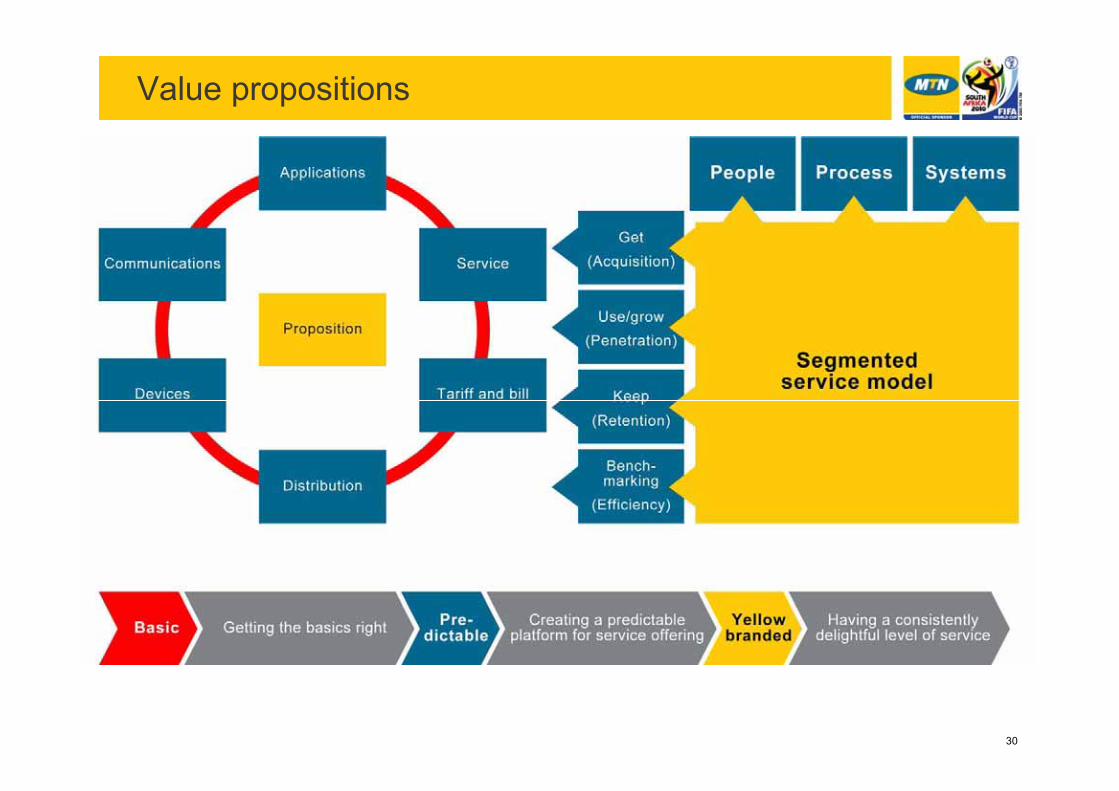
Value propositions

31
The MTN Zone price plan
32
MTN Zone – the results
• ~400k “new” customers
• 35% of prepaid base, 39% prepaid revenue
• Churn 1.2% per month
MTN Zone customers call more

33
1400 town stormers
34
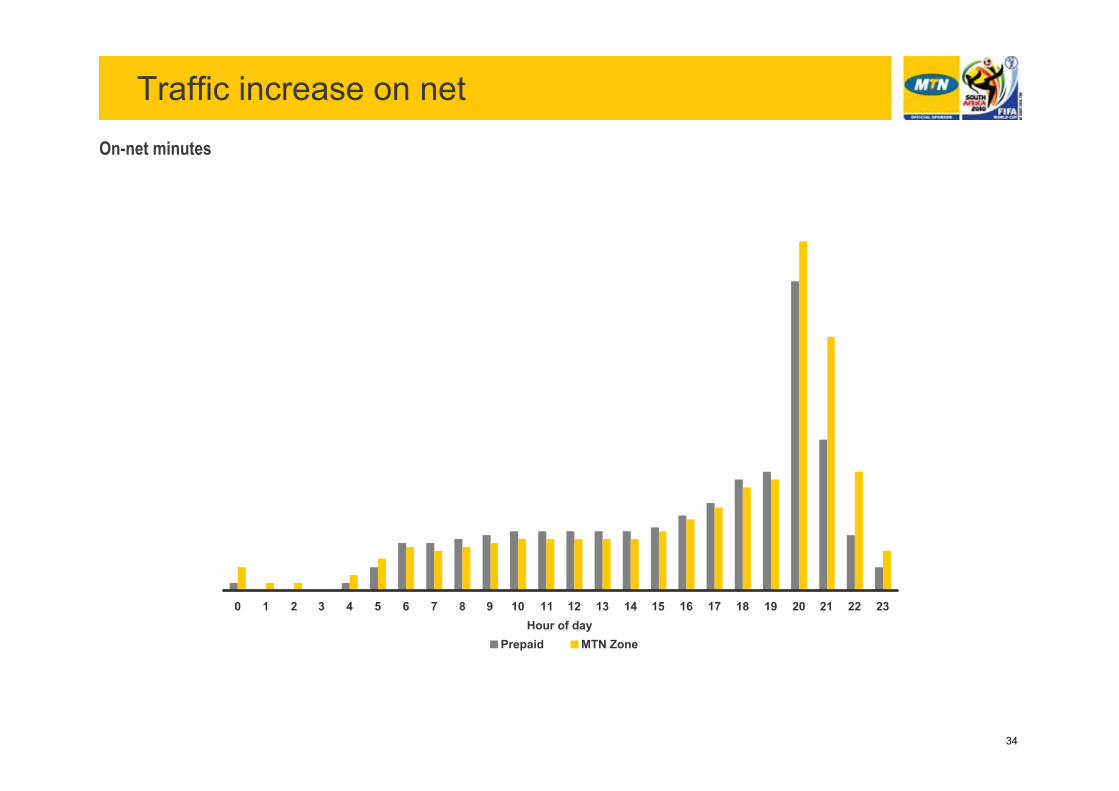
Traffic increase on net
0.00
0.50
1.00
1.50
2.00
2.50
3.00
3.50
4.00
4.50
5.00
0 1 2 3 4 5 6 7 8 9 10 11 12 13 14 15 16 17 18 19 20 21 22 23Hour of day
Prepaid MTN Zone
On-net minutes
35
Corporate value proposition
36
ISP and MTN
The combination of an ISP and MTN creates a strong proposition
• The transaction is in line with MTN’s stated strategy to provide integrated communications solutions in all of its markets and follows similar acquisitions by MTN subsidiaries in Nigeria, Cameroon, Cyprus and Cote d’Ivoire.
• Supports MTN’s strong customer focus and commitment to providing greater choice and a broad range of communication offerings beyond its strong mobile services.
37
MTN’s corporate value proposition
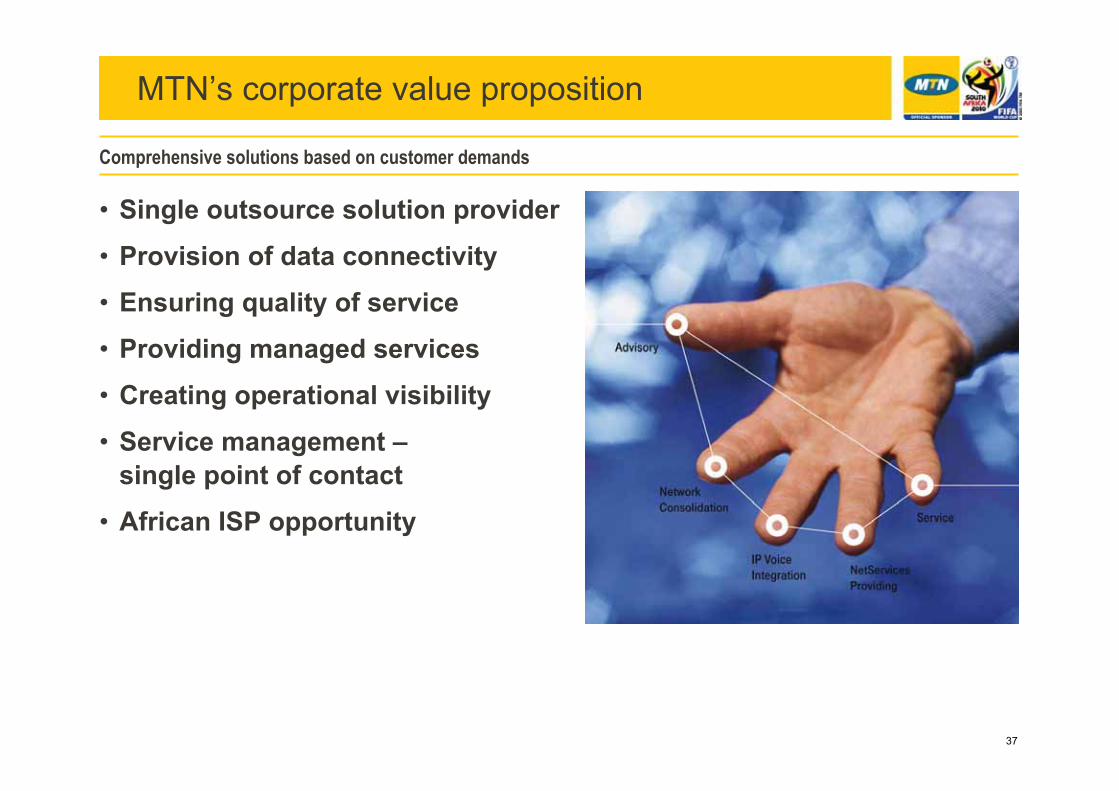
Comprehensive solutions based on customer demands
• Single outsource solution provider
• Provision of data connectivity
• Ensuring quality of service
• Providing managed services
• Creating operational visibility
• Service management –single point of contact
• African ISP opportunity
38
Distribution and customer experience
Distribution and customer experienceBrian Gouldie
Chief Sales and Services Officer
39
Distribution
Changing market environment requires adjustments in distribution strategy
• South African market will steadily move from acquisition to retention- Upgrades and churners will increasingly drive market share movement
- Therefore MTN South Africa’s distribution strategy has been revised to enhance it sales effectiveness and profitability
- In a retention market (and increasingly sophisticated products) it is essential to build a more intimate customer relationship
• Our key initiatives include- Extending our own distribution footprint
- Realigning our channel mix
- Improving the customer experience (people, systems, facilities)
40
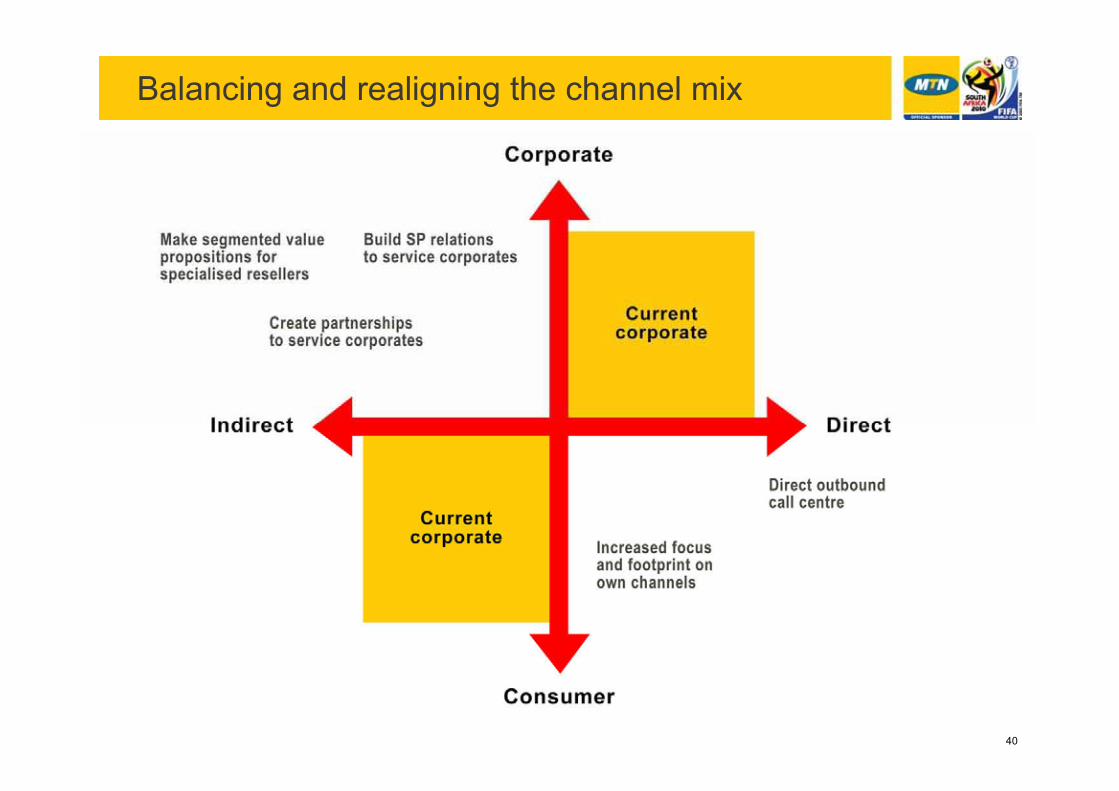
Balancing and realigning the channel mix
41
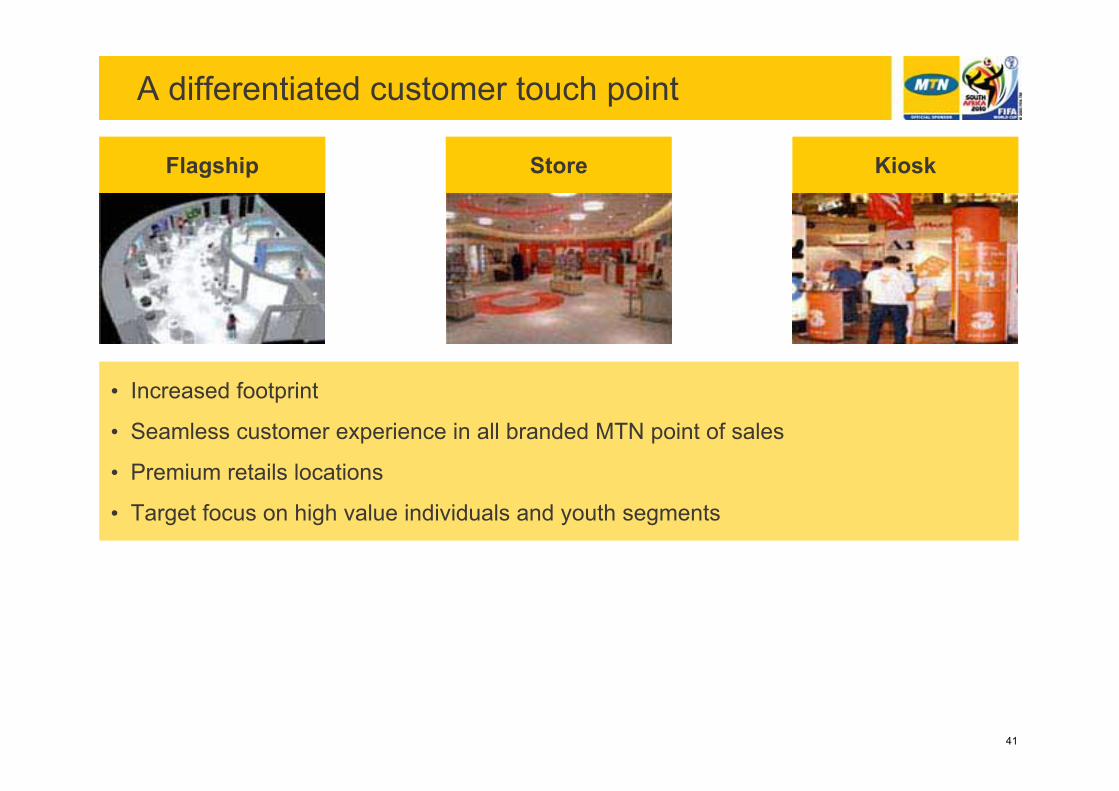
A differentiated customer touch point
• Increased footprint
• Seamless customer experience in all branded MTN point of sales
• Premium retails locations
• Target focus on high value individuals and youth segments
Flagship Store Kiosk
42
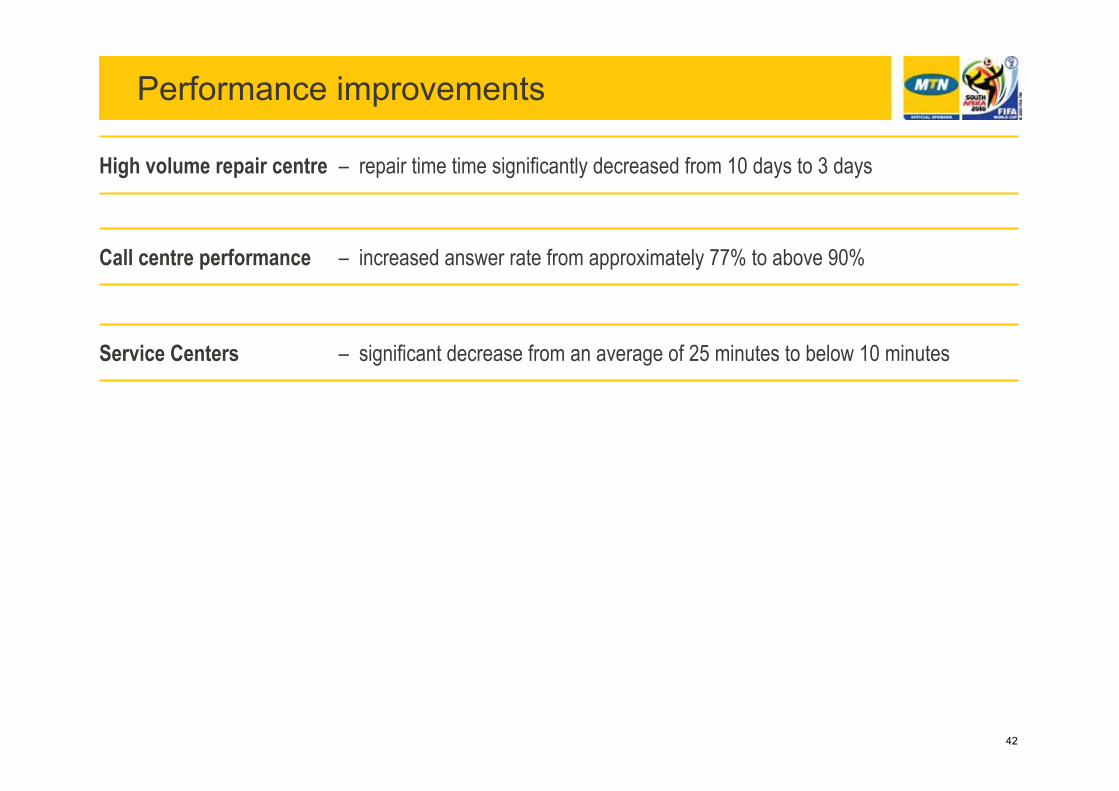
Performance improvements
High volume repair centre – repair time time significantly decreased from 10 days to 3 days
Call centre performance – increased answer rate from approximately 77% to above 90%
Service Centers – significant decrease from an average of 25 minutes to below 10 minutes
43
Building a quality network
Building a quality networkSameer Dave
CTO
44
Quality network
• Coverage and capacity
• Segmented quality of service
• Abundant transmission- Self provisioning
- International cabling
45
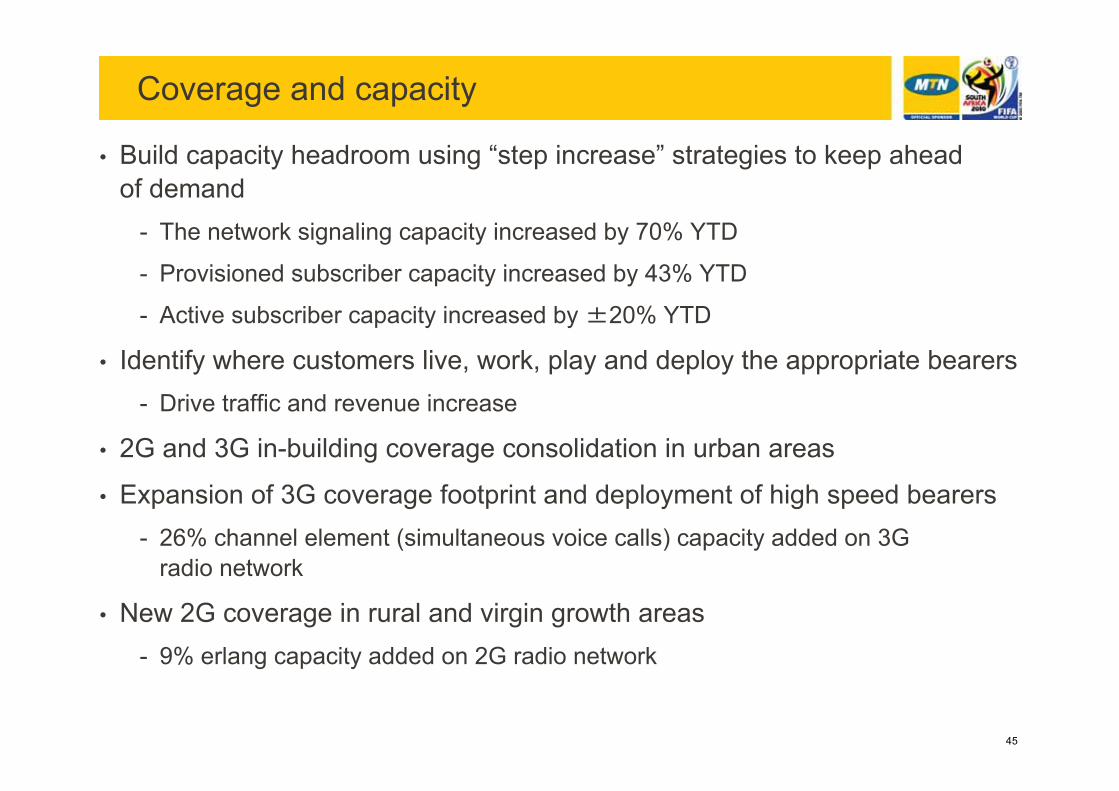
Coverage and capacity
• Build capacity headroom using “step increase” strategies to keep aheadof demand
- The network signaling capacity increased by 70% YTD
- Provisioned subscriber capacity increased by 43% YTD
- Active subscriber capacity increased by 20% YTD
• Identify where customers live, work, play and deploy the appropriate bearers- Drive traffic and revenue increase
• 2G and 3G in-building coverage consolidation in urban areas
• Expansion of 3G coverage footprint and deployment of high speed bearers- 26% channel element (simultaneous voice calls) capacity added on 3G
radio network
• New 2G coverage in rural and virgin growth areas- 9% erlang capacity added on 2G radio network
46
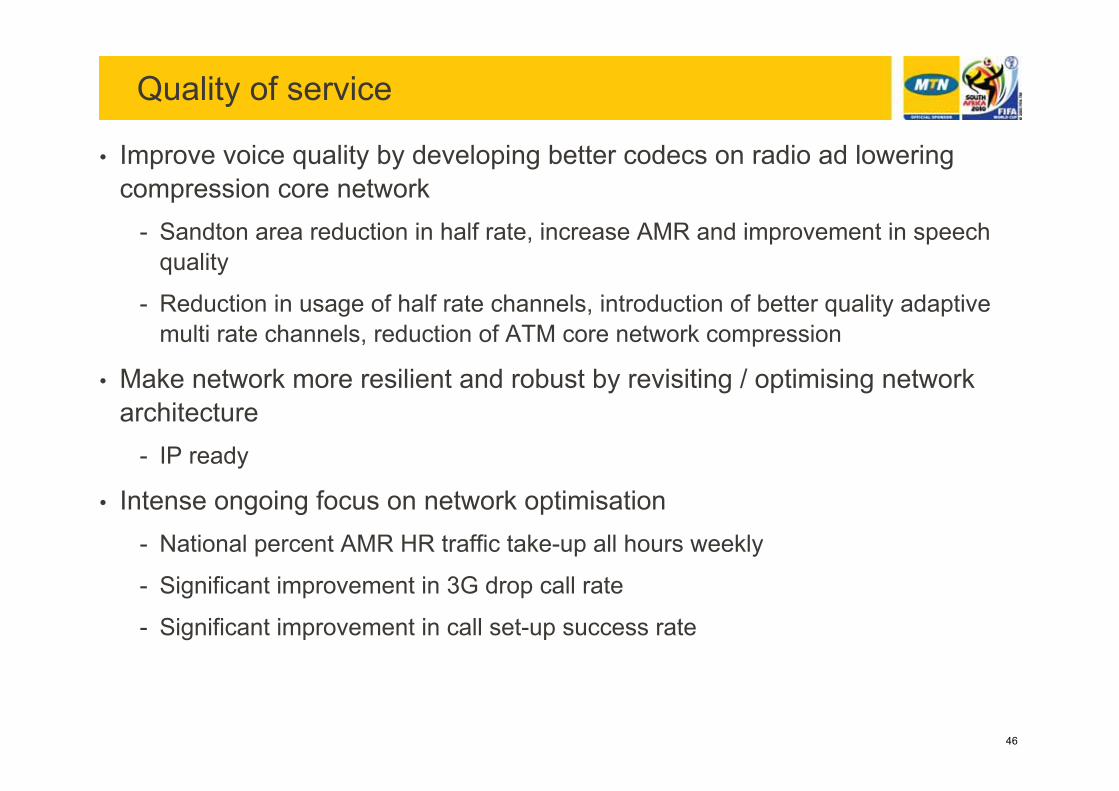
Quality of service
• Improve voice quality by developing better codecs on radio ad lowering compression core network
- Sandton area reduction in half rate, increase AMR and improvement in speech quality
- Reduction in usage of half rate channels, introduction of better quality adaptive multi rate channels, reduction of ATM core network compression
• Make network more resilient and robust by revisiting / optimising network architecture
- IP ready
• Intense ongoing focus on network optimisation- National percent AMR HR traffic take-up all hours weekly
- Significant improvement in 3G drop call rate
- Significant improvement in call set-up success rate
47
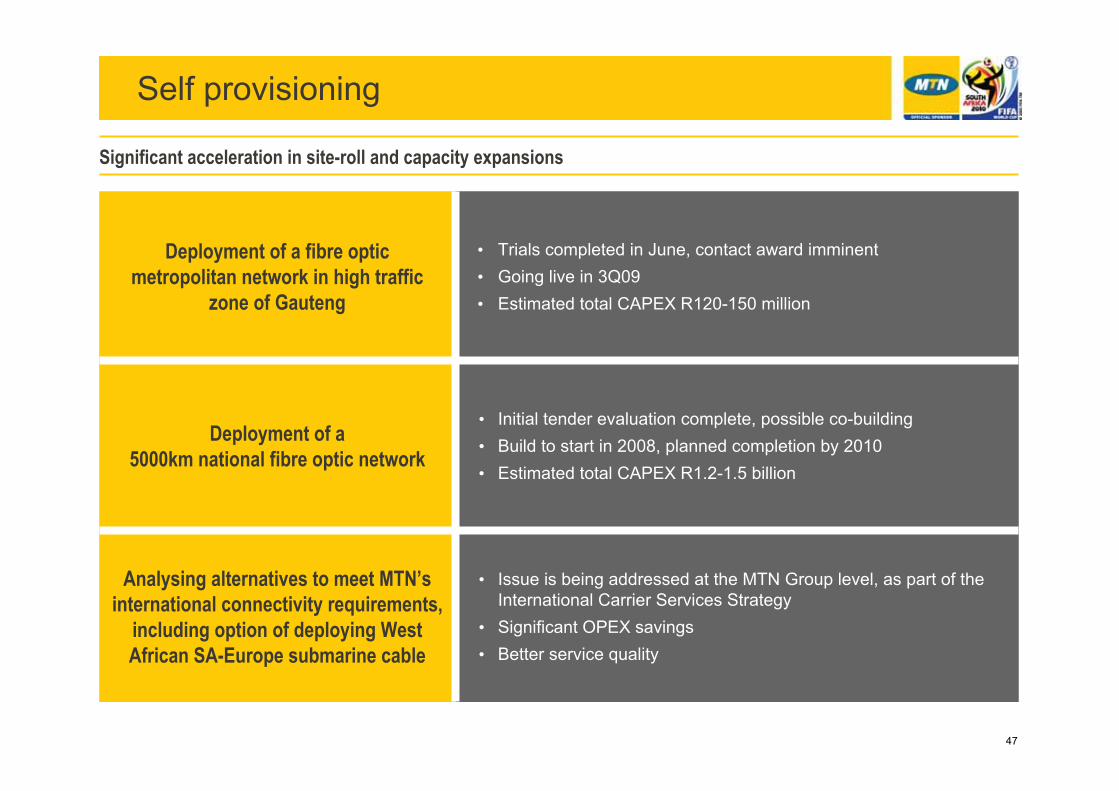
Self provisioning
Deployment of a fibre optic metropolitan network in high traffic
zone of Gauteng
• Trials completed in June, contact award imminent• Going live in 3Q09• Estimated total CAPEX R120-150 million
Deployment of a5000km national fibre optic network
• Initial tender evaluation complete, possible co-building• Build to start in 2008, planned completion by 2010• Estimated total CAPEX R1.2-1.5 billion
Analysing alternatives to meet MTN’sinternational connectivity requirements,
including option of deploying West African SA-Europe submarine cable
• Issue is being addressed at the MTN Group level, as part of the International Carrier Services Strategy
• Significant OPEX savings• Better service quality
Significant acceleration in site-roll and capacity expansions
48
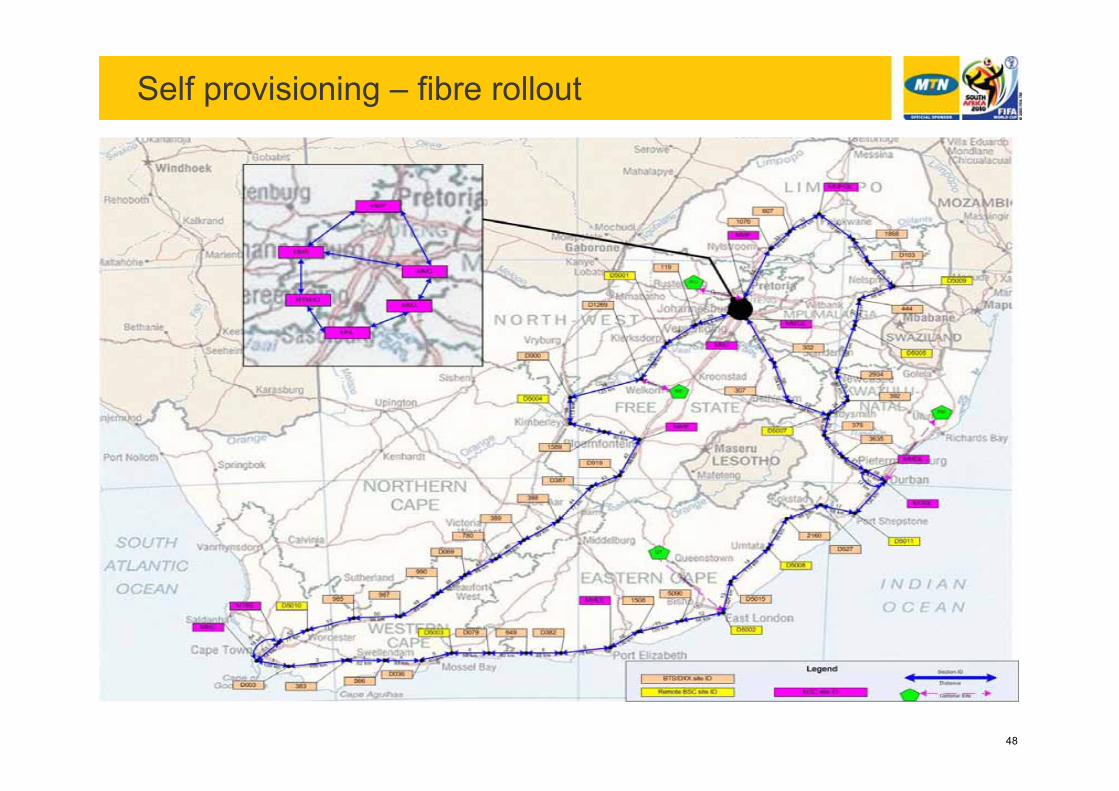
Self provisioning – fibre rollout
49
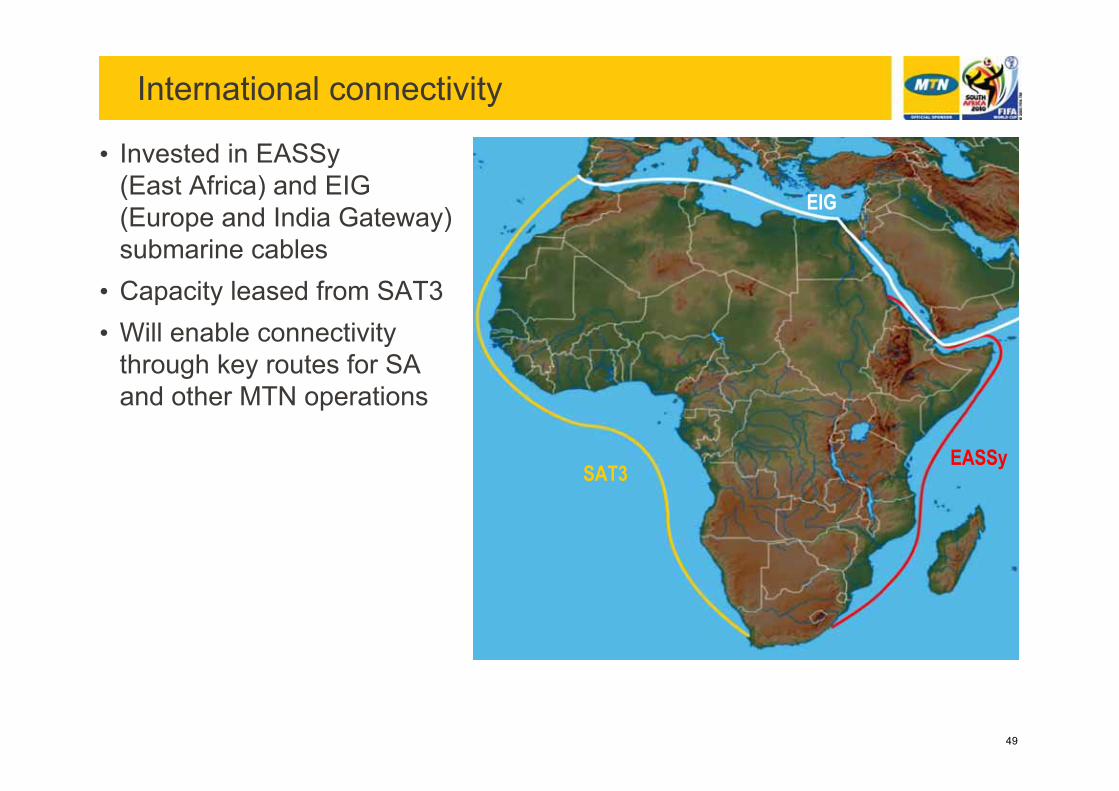
International connectivity
SAT3EASSy
EIG
• Invested in EASSy(East Africa) and EIG(Europe and India Gateway)submarine cables• Capacity leased from SAT3• Will enable connectivity
through key routes for SAand other MTN operations

50
Regulatory issues
RegulatoryZunaid Bulbulia
CFO
51
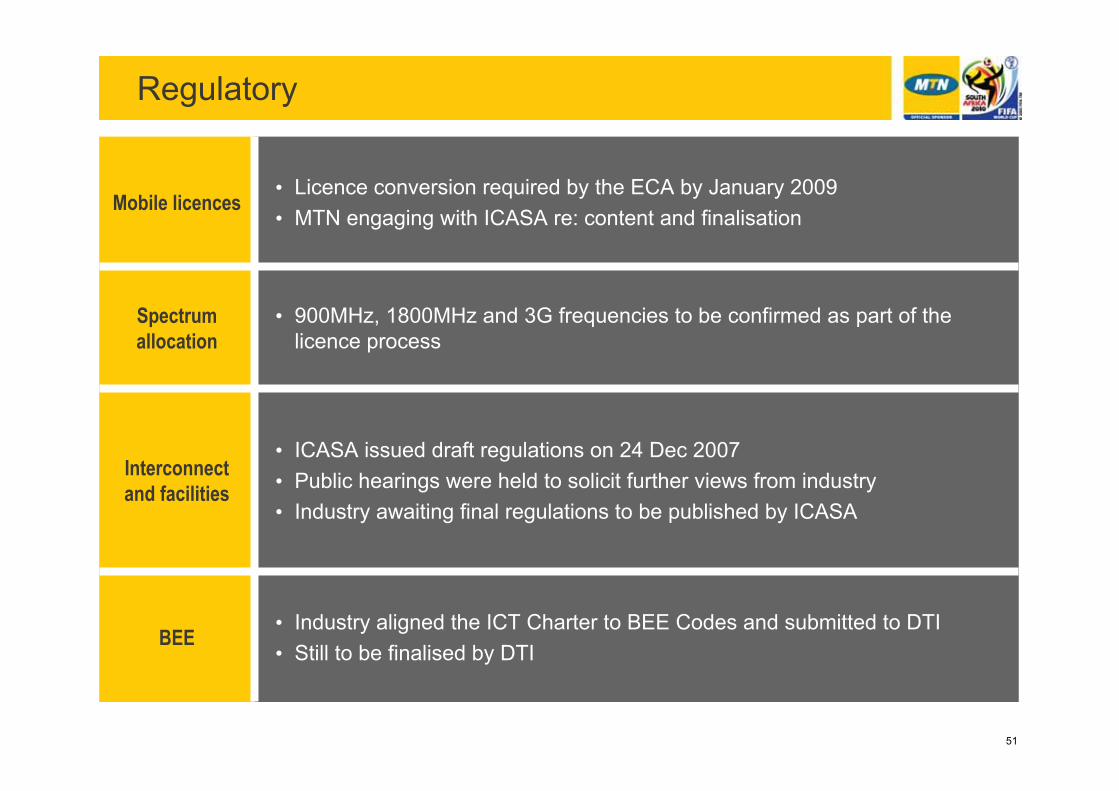
Regulatory
Mobile licences• Licence conversion required by the ECA by January 2009• MTN engaging with ICASA re: content and finalisation
Spectrumallocation
• 900MHz, 1800MHz and 3G frequencies to be confirmed as part of the licence process
Interconnectand facilities
• ICASA issued draft regulations on 24 Dec 2007• Public hearings were held to solicit further views from industry• Industry awaiting final regulations to be published by ICASA
BEE• Industry aligned the ICT Charter to BEE Codes and submitted to DTI• Still to be finalised by DTI
52
Summary
SummaryTim Lowry
MD
53
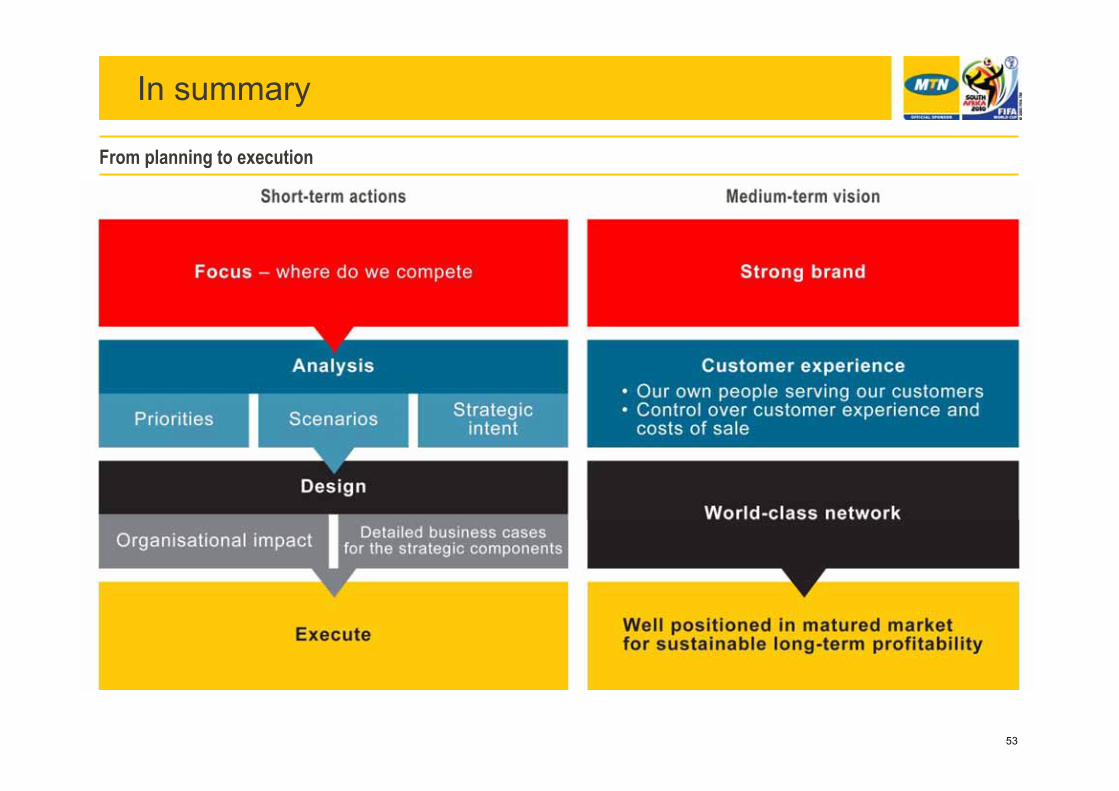
In summary
From planning to execution

54
DIVIDER: Thank you
Thank youQuestions?

![INDEX [] Company Profile-2019_v2.pdf · 2015–MTN Wi-Fi 2015–MTN Network Upgrade 2015–MTN Managed Services 2016-VDC Site Maintenance 2017–Huawei MTN ... - Battery Rundown Tests](https://img.pdfslide.us/doc/110x75/5e2c34df1f19803daa225a55/index-company-profile-2019v2pdf-2015amtn-wi-fi-2015amtn-network-upgrade.jpg)