Embed Size (px)
Citation preview

2017-18 School Accountability Report Card for Mt. Pleasant High School Page 1 of 11
Mt. Pleasant High School
1750 South White Rd. • San Jose, CA, 95127 • 408.937.2800 • Grades Martha Guerrero, Principal
[email protected] mtpleasant.esuhsd.org
2017-18 School Accountability Report Card
Published During the 2018-19 School Year
----
----
East Side Union High School District
830 N. Capitol Avenue San Jose, CA 95133
(408) 347-5000 www.esuhsd.org
District Governing Board
Frank Biehl
J. Manuel Herrera
Van Thi Le
Pattie Cortese
Lan Nguyen
District Administration
Chris D. Funk Superintendent
Glenn Vander Zee Assistant Superintendent
Educational Services
Chris Jew Associate Superintendent
Business Services
Dr. John Rubio Associate Superintendent
Human Resources
---- ----
School Description The Mission of Mt. Pleasant High School is to make a difference in the lives of our students by providing an academically challenging, supportive, and safe environment, and to prepare them for college and career. To meet this mission we operate on a two-semester system with a school day of seven 55-minute periods four days per week and a shortened day with 44 minute periods to allow for a teacher/staff collaboration of 75 minutes on Mondays. This collaboration time allows the staff to address the goals listed in our School Plan for Student Achievement which 1)increasing the percentage of students ready for college and career, 2) increasing the percentage of students who graduate high school, 3) decreasing the percentage of truant/absent students, 4) decreasing the percentage of yearly suspensions, and 5) improvement the academic success of our English Learner population. We are very proud of the work done in our subject area departments to incorporate the Common Core Standards' instructional shifts in English, Math and Literacy into all subject areas. We offer a varied curricular program to address the needs of our diverse student population. These offerings include AP courses in all subject areas, dual enrollment courses through a partnership with San Jose State University, as well as Specialized Academic Instruction courses to serve the needs of our students receiving Special Education services, and Sheltered courses for our English Learner students. We also offer three Career Academies to prepare our students for college and career: Animation, Manufacturing Academy and Engineering Academies. Furthermore, to meet our school mission and address the varied needs of our student population, Mt. Pleasant High School provides interventions and supports to all our students through our partnerships with Goodwill ASSETs and Foothill Community Health Center.
2017-18 School Accountability Report Card for Mt. Pleasant High School Page 2 of 11
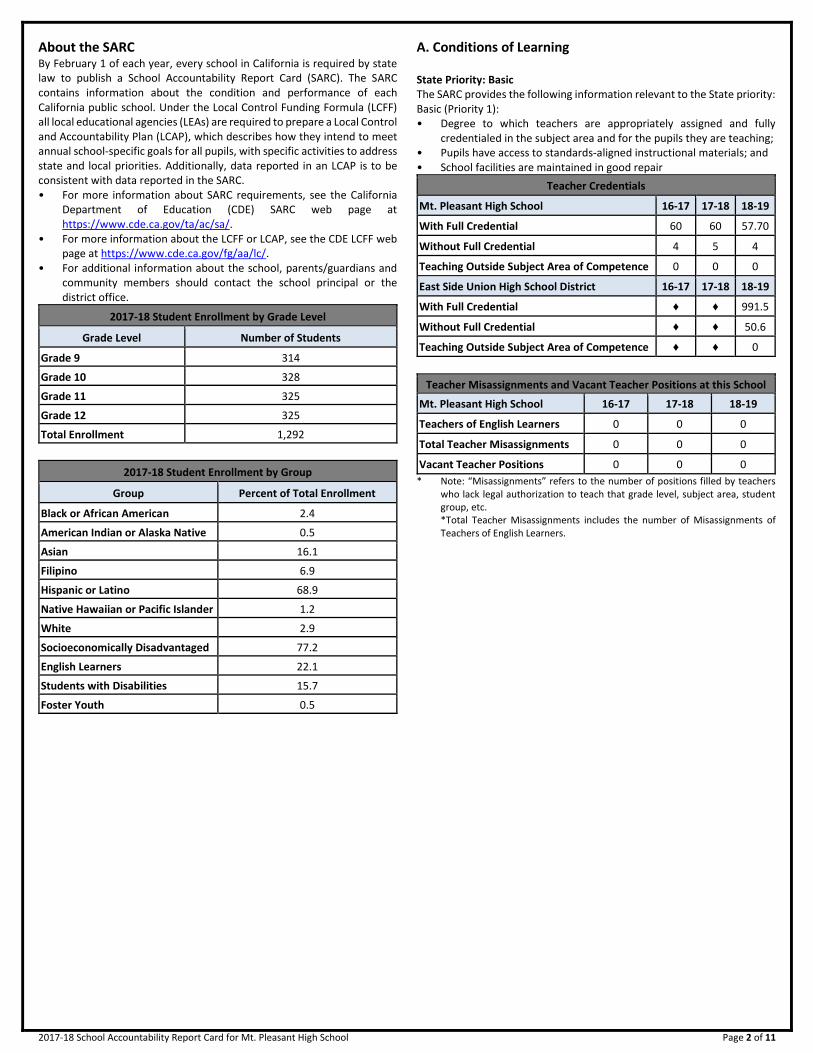
About the SARC By February 1 of each year, every school in California is required by state law to publish a School Accountability Report Card (SARC). The SARC contains information about the condition and performance of each California public school. Under the Local Control Funding Formula (LCFF) all local educational agencies (LEAs) are required to prepare a Local Control and Accountability Plan (LCAP), which describes how they intend to meet annual school-specific goals for all pupils, with specific activities to address state and local priorities. Additionally, data reported in an LCAP is to be consistent with data reported in the SARC. • For more information about SARC requirements, see the California
Department of Education (CDE) SARC web page at https://www.cde.ca.gov/ta/ac/sa/.
• For more information about the LCFF or LCAP, see the CDE LCFF web page at https://www.cde.ca.gov/fg/aa/lc/.
• For additional information about the school, parents/guardians and community members should contact the school principal or the district office.
2017-18 Student Enrollment by Grade Level
Grade Level Number of Students
Grade 9 314
Grade 10 328
Grade 11 325
Grade 12 325
Total Enrollment 1,292
2017-18 Student Enrollment by Group
Group Percent of Total Enrollment
Black or African American 2.4
American Indian or Alaska Native 0.5
Asian 16.1
Filipino 6.9
Hispanic or Latino 68.9
Native Hawaiian or Pacific Islander 1.2
White 2.9
Socioeconomically Disadvantaged 77.2
English Learners 22.1
Students with Disabilities 15.7
Foster Youth 0.5
A. Conditions of Learning State Priority: Basic The SARC provides the following information relevant to the State priority: Basic (Priority 1): • Degree to which teachers are appropriately assigned and fully
credentialed in the subject area and for the pupils they are teaching; • Pupils have access to standards-aligned instructional materials; and • School facilities are maintained in good repair
Teacher Credentials
Mt. Pleasant High School 16-17 17-18 18-19
With Full Credential 60 60 57.70
Without Full Credential 4 5 4
Teaching Outside Subject Area of Competence 0 0 0
East Side Union High School District 16-17 17-18 18-19
With Full Credential ♦ ♦ 991.5
Without Full Credential ♦ ♦ 50.6
Teaching Outside Subject Area of Competence ♦ ♦ 0
Teacher Misassignments and Vacant Teacher Positions at this School
Mt. Pleasant High School 16-17 17-18 18-19
Teachers of English Learners 0 0 0
Total Teacher Misassignments 0 0 0
Vacant Teacher Positions 0 0 0
* Note: “Misassignments” refers to the number of positions filled by teachers who lack legal authorization to teach that grade level, subject area, student group, etc. *Total Teacher Misassignments includes the number of Misassignments of Teachers of English Learners.

2017-18 School Accountability Report Card for Mt. Pleasant High School Page 3 of 11
Quality, Currency, Availability of Textbooks and Instructional Materials (School Year 2018-19)
Textbooks and Instructional Materials
Year and month in which data were collected: October 2018
Core Curriculum Area Textbooks and Instructional Materials/Year of Adoption
Reading/Language Arts English 1 – “The Language of Literature" Grade 9 McDougal Littell 2002 English 2 – “The Language of Literature” Grade 10 McDougal Littell 2002 English 3 –MyPerspectives: American Literature//Pearson ERWC (English 4)-- Expository Reading and Writing Course Student Reader 2013 AP Composition and Language-- The Norton Reader AP Composition and Literature--The Intro to Literature
The textbooks listed are from most recent adoption: Yes
Percent of students lacking their own assigned textbook: 0%
Mathematics CCSS Math 1 – "Big Ideas Integrated Mathematics I," Big Ideas Learning, LLC 2016 CCSS Math 2 – "Big Ideas Integrated Mathematics II," Big Ideas Learning, LLC 2016 CCSS Math 3 – "Big Ideas Integrated Mathematics III," Big Ideas Learning, LLC 2016 Math Analysis – “Precalculus With Limits A Graphing Approach” Brooks/Cole Cengage Learning 2012 AP Calculus AB - Calculus w/Analytic Geometry, 9th ed: Houghton Mifflin Harcourt; 2010 AP Calculus BC - Calculus w/Analytic Geometry, 9th ed: Houghton Mifflin Harcourt; 2010 AP Statistics - The Practice of Statistics, 4th ed: Freeman; 2010 Mathematical Reasoning with Connections - MRWC materials
The textbooks listed are from most recent adoption: Yes
Percent of students lacking their own assigned textbook: 0%
Science A Hands on Introduction to Forensic science 2014 Biology – NGSS Biology - The Living Earth -- STEMscopes, eTextbook and Web-based resources Chemistry – “Chemistry: Connections to our Changing World” Prentice-Hall 2000/2002 Physics - "Conceptual Physics" Addison-Wesley 1999 AP Physics 1 and 2- Physics AP- Wiley 2012
The textbooks listed are from most recent adoption: Yes
Percent of students lacking their own assigned textbook: 0%
History-Social Science World History – “Modern World History” McDougal-Littell 2003 US History – “The American Vision” Glencoe/McGraw Hill 2006 American Government – "Government Alive! Power, Politics and You" TCI 2014 Economics – “Econ Alive! The Power to Choose" TCI 2015 AP World History - "The Earth and Its Peoples AP Edition" Cengage Learning 2018 AP US History - "America's History for the AP Course" Bedford 2014 AP Government - "Government in America" Pearson Learning 2014 AP Macro/Micro Economics - "Economics (AP)" McGraw Hill 2014 AP Human Geography - "The Cultural Landscape: An Introduction" Prentice Hall 2014 AP Psychology - "Psychology for AP" Worth 2015 World Geography - "Geography Alive!" TCI 2011
The textbooks listed are from most recent adoption: Yes
Percent of students lacking their own assigned textbook: 0%
Foreign Language Textbooks and Instructional Materials in use are standards aligned and officially adopted
The textbooks listed are from most recent adoption: Yes
Percent of students lacking their own assigned textbook: 0%
Health Textbooks and Instructional Materials in use are standards aligned and officially adopted
The textbooks listed are from most recent adoption: Yes
Percent of students lacking their own assigned textbook: 0%
Visual and Performing Arts Textbooks and Instructional Materials in use are standards aligned and officially adopted
The textbooks listed are from most recent adoption: Yes
Percent of students lacking their own assigned textbook: 0%
Science Laboratory Equipment N/A
The textbooks listed are from most recent adoption: N/A
Percent of students lacking their own assigned textbook: 0%
Note: Cells with N/A values do not require data.
2017-18 School Accountability Report Card for Mt. Pleasant High School Page 4 of 11
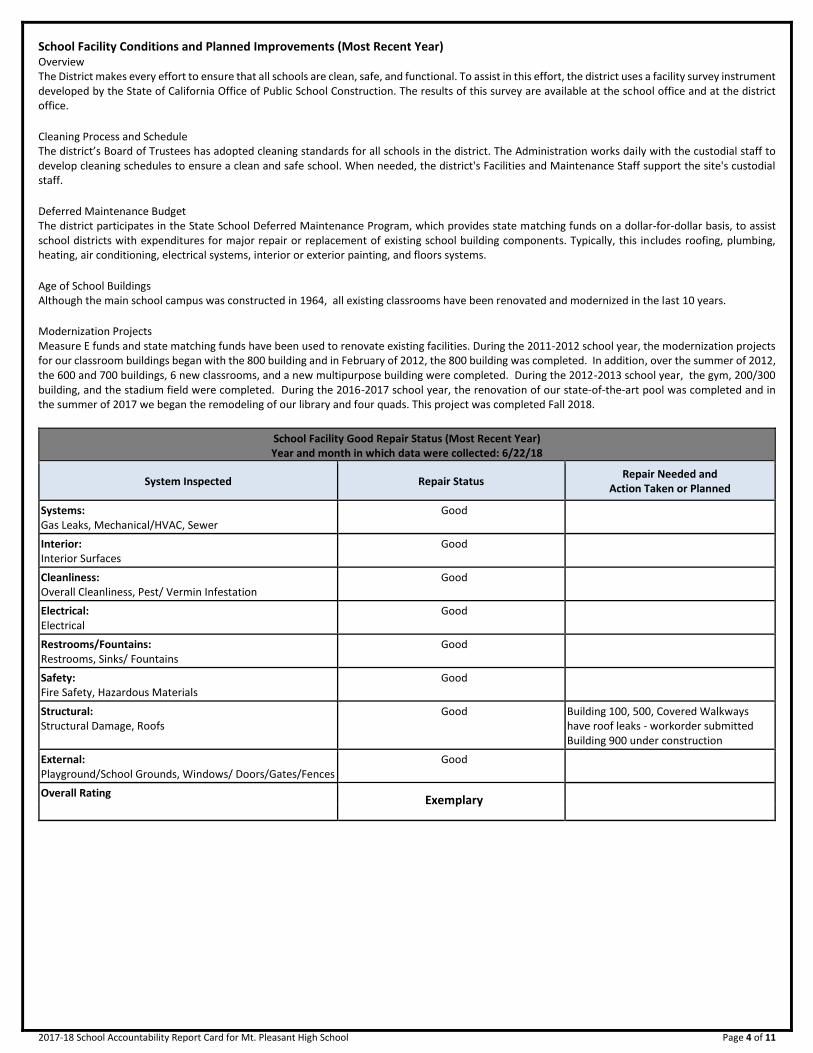
School Facility Conditions and Planned Improvements (Most Recent Year) Overview The District makes every effort to ensure that all schools are clean, safe, and functional. To assist in this effort, the district uses a facility survey instrument developed by the State of California Office of Public School Construction. The results of this survey are available at the school office and at the district office. Cleaning Process and Schedule The district’s Board of Trustees has adopted cleaning standards for all schools in the district. The Administration works daily with the custodial staff to develop cleaning schedules to ensure a clean and safe school. When needed, the district's Facilities and Maintenance Staff support the site's custodial staff. Deferred Maintenance Budget The district participates in the State School Deferred Maintenance Program, which provides state matching funds on a dollar-for-dollar basis, to assist school districts with expenditures for major repair or replacement of existing school building components. Typically, this includes roofing, plumbing, heating, air conditioning, electrical systems, interior or exterior painting, and floors systems. Age of School Buildings Although the main school campus was constructed in 1964, all existing classrooms have been renovated and modernized in the last 10 years. Modernization Projects Measure E funds and state matching funds have been used to renovate existing facilities. During the 2011-2012 school year, the modernization projects for our classroom buildings began with the 800 building and in February of 2012, the 800 building was completed. In addition, over the summer of 2012, the 600 and 700 buildings, 6 new classrooms, and a new multipurpose building were completed. During the 2012-2013 school year, the gym, 200/300 building, and the stadium field were completed. During the 2016-2017 school year, the renovation of our state-of-the-art pool was completed and in the summer of 2017 we began the remodeling of our library and four quads. This project was completed Fall 2018.
School Facility Good Repair Status (Most Recent Year) Year and month in which data were collected: 6/22/18
System Inspected Repair Status Repair Needed and
Action Taken or Planned
Systems: Gas Leaks, Mechanical/HVAC, Sewer
XGood
Interior: Interior Surfaces
XGood
Cleanliness: Overall Cleanliness, Pest/ Vermin Infestation
XGood
Electrical: Electrical
XGood
Restrooms/Fountains: Restrooms, Sinks/ Fountains
XGood
Safety: Fire Safety, Hazardous Materials
XGood
Structural: Structural Damage, Roofs
XGood
Building 100, 500, Covered Walkways have roof leaks - workorder submitted Building 900 under construction
External: Playground/School Grounds, Windows/ Doors/Gates/Fences
XGood
Overall Rating XExemplary
----------
2017-18 School Accountability Report Card for Mt. Pleasant High School Page 5 of 11
B. Pupil Outcomes
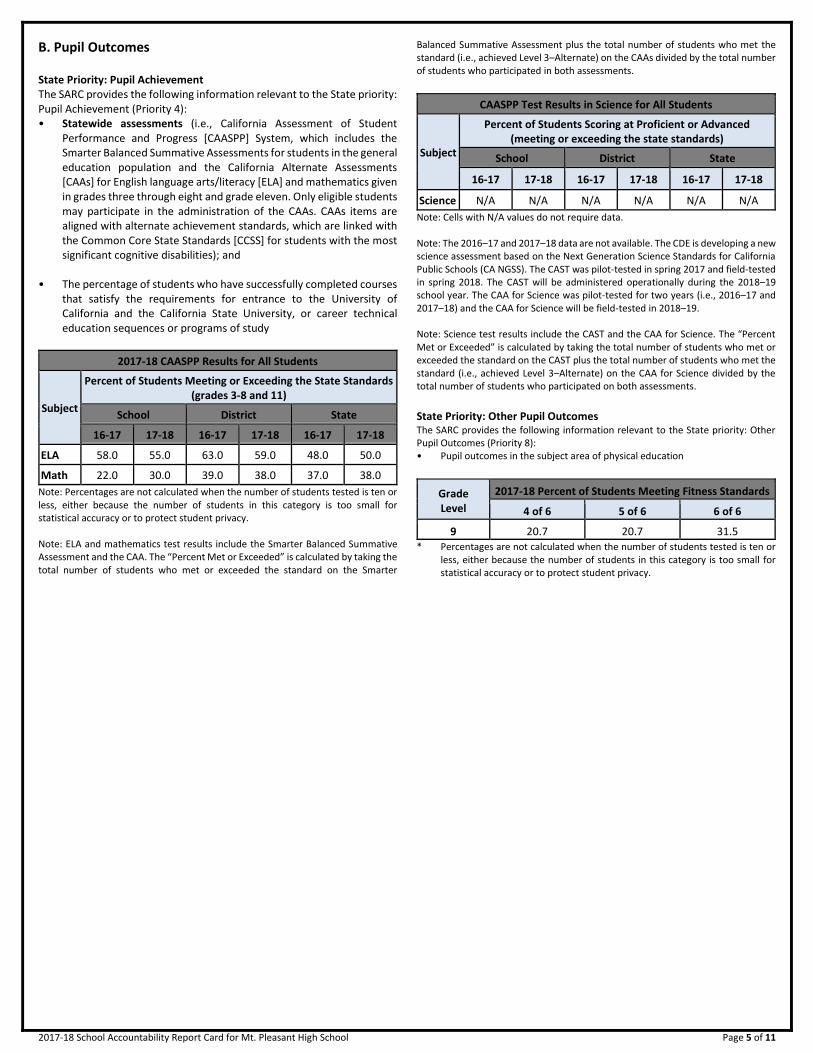
State Priority: Pupil Achievement The SARC provides the following information relevant to the State priority: Pupil Achievement (Priority 4): • Statewide assessments (i.e., California Assessment of Student
Performance and Progress [CAASPP] System, which includes the Smarter Balanced Summative Assessments for students in the general education population and the California Alternate Assessments [CAAs] for English language arts/literacy [ELA] and mathematics given in grades three through eight and grade eleven. Only eligible students may participate in the administration of the CAAs. CAAs items are aligned with alternate achievement standards, which are linked with the Common Core State Standards [CCSS] for students with the most significant cognitive disabilities); and
• The percentage of students who have successfully completed courses
that satisfy the requirements for entrance to the University of California and the California State University, or career technical education sequences or programs of study
2017-18 CAASPP Results for All Students
Subject
Percent of Students Meeting or Exceeding the State Standards (grades 3-8 and 11)
School District State
16-17 17-18 16-17 17-18 16-17 17-18
ELA 58.0 55.0 63.0 59.0 48.0 50.0
Math 22.0 30.0 39.0 38.0 37.0 38.0
Note: Percentages are not calculated when the number of students tested is ten or less, either because the number of students in this category is too small for statistical accuracy or to protect student privacy. Note: ELA and mathematics test results include the Smarter Balanced Summative Assessment and the CAA. The “Percent Met or Exceeded” is calculated by taking the total number of students who met or exceeded the standard on the Smarter
Balanced Summative Assessment plus the total number of students who met the standard (i.e., achieved Level 3–Alternate) on the CAAs divided by the total number of students who participated in both assessments.
CAASPP Test Results in Science for All Students
Subject
Percent of Students Scoring at Proficient or Advanced (meeting or exceeding the state standards)
School District State
16-17 17-18 16-17 17-18 16-17 17-18
Science N/A N/A N/A N/A N/A N/A
Note: Cells with N/A values do not require data. Note: The 2016–17 and 2017–18 data are not available. The CDE is developing a new science assessment based on the Next Generation Science Standards for California Public Schools (CA NGSS). The CAST was pilot-tested in spring 2017 and field-tested in spring 2018. The CAST will be administered operationally during the 2018–19 school year. The CAA for Science was pilot-tested for two years (i.e., 2016–17 and 2017–18) and the CAA for Science will be field-tested in 2018–19. Note: Science test results include the CAST and the CAA for Science. The “Percent Met or Exceeded” is calculated by taking the total number of students who met or exceeded the standard on the CAST plus the total number of students who met the standard (i.e., achieved Level 3–Alternate) on the CAA for Science divided by the total number of students who participated on both assessments.
State Priority: Other Pupil Outcomes The SARC provides the following information relevant to the State priority: Other Pupil Outcomes (Priority 8): • Pupil outcomes in the subject area of physical education
Grade Level
2017-18 Percent of Students Meeting Fitness Standards
4 of 6 5 of 6 6 of 6
---9--- 20.7 20.7 31.5 * Percentages are not calculated when the number of students tested is ten or
less, either because the number of students in this category is too small for statistical accuracy or to protect student privacy.

2017-18 School Accountability Report Card for Mt. Pleasant High School Page 6 of 11
School Year 2017-18 CAASPP Assessment Results - English Language Arts (ELA) Disaggregated by Student Groups, Grades Three through Eight and Eleven
Student Group Total
Enrollment Number Tested
Percent Tested
Percent Met or Exceeded
All Students 305 280 91.80 55.36
Male 156 141 90.38 53.19
Female 149 139 93.29 57.55
Black or African American -- -- -- --
Asian 69 62 89.86 70.97
Filipino 20 19 95.00 78.95
Hispanic or Latino 199 182 91.46 47.25
Native Hawaiian or Pacific Islander -- -- -- --
White -- -- -- --
Two or More Races -- -- -- --
Socioeconomically Disadvantaged 208 192 92.31 50.52
English Learners 115 101 87.83 28.71
Students with Disabilities 37 33 89.19 9.09
Students Receiving Migrant Education Services -- -- -- --
Foster Youth -- -- -- --
Note: ELA test results include the Smarter Balanced Summative Assessment and the CAA. The “Percent Met or Exceeded” is calculated by taking the total number of students who met or exceeded the standard on the Smarter Balanced Summative Assessment plus the total number of students who met the standard (i.e., achieved Level 3–Alternate) on the CAAs divided by the total number of students who participated in both assessments. Note: Double dashes (--) appear in the table when the number of students is ten or less, either because the number of students in this category is too small for statistical accuracy or to protect student privacy. Note: The number of students tested includes all students who participated in the test whether they received a score or not; however, the number of students tested is not the number that was used to calculate the achievement level percentages. The achievement level percentages are calculated using only students who received scores.
2017-18 School Accountability Report Card for Mt. Pleasant High School Page 7 of 11
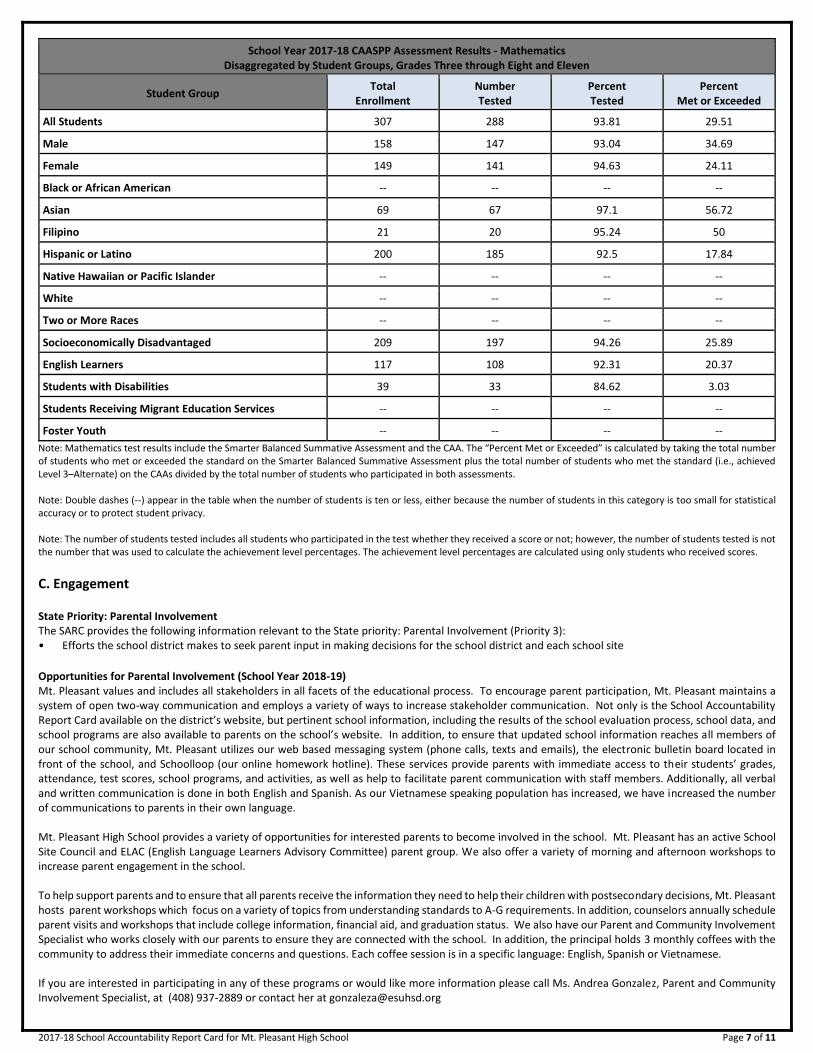
School Year 2017-18 CAASPP Assessment Results - Mathematics Disaggregated by Student Groups, Grades Three through Eight and Eleven
Student Group Total
Enrollment Number Tested
Percent Tested
Percent Met or Exceeded
All Students 307 288 93.81 29.51
Male 158 147 93.04 34.69
Female 149 141 94.63 24.11
Black or African American -- -- -- --
Asian 69 67 97.1 56.72
Filipino 21 20 95.24 50
Hispanic or Latino 200 185 92.5 17.84
Native Hawaiian or Pacific Islander -- -- -- --
White -- -- -- --
Two or More Races -- -- -- --
Socioeconomically Disadvantaged 209 197 94.26 25.89
English Learners 117 108 92.31 20.37
Students with Disabilities 39 33 84.62 3.03
Students Receiving Migrant Education Services -- -- -- --
Foster Youth -- -- -- --
Note: Mathematics test results include the Smarter Balanced Summative Assessment and the CAA. The “Percent Met or Exceeded” is calculated by taking the total number of students who met or exceeded the standard on the Smarter Balanced Summative Assessment plus the total number of students who met the standard (i.e., achieved Level 3–Alternate) on the CAAs divided by the total number of students who participated in both assessments. Note: Double dashes (--) appear in the table when the number of students is ten or less, either because the number of students in this category is too small for statistical accuracy or to protect student privacy. Note: The number of students tested includes all students who participated in the test whether they received a score or not; however, the number of students tested is not the number that was used to calculate the achievement level percentages. The achievement level percentages are calculated using only students who received scores.
C. Engagement
State Priority: Parental Involvement The SARC provides the following information relevant to the State priority: Parental Involvement (Priority 3): • Efforts the school district makes to seek parent input in making decisions for the school district and each school site
Opportunities for Parental Involvement (School Year 2018-19) Mt. Pleasant values and includes all stakeholders in all facets of the educational process. To encourage parent participation, Mt. Pleasant maintains a system of open two-way communication and employs a variety of ways to increase stakeholder communication. Not only is the School Accountability Report Card available on the district’s website, but pertinent school information, including the results of the school evaluation process, school data, and school programs are also available to parents on the school’s website. In addition, to ensure that updated school information reaches all members of our school community, Mt. Pleasant utilizes our web based messaging system (phone calls, texts and emails), the electronic bulletin board located in front of the school, and Schoolloop (our online homework hotline). These services provide parents with immediate access to their students’ grades, attendance, test scores, school programs, and activities, as well as help to facilitate parent communication with staff members. Additionally, all verbal and written communication is done in both English and Spanish. As our Vietnamese speaking population has increased, we have increased the number of communications to parents in their own language. Mt. Pleasant High School provides a variety of opportunities for interested parents to become involved in the school. Mt. Pleasant has an active School Site Council and ELAC (English Language Learners Advisory Committee) parent group. We also offer a variety of morning and afternoon workshops to increase parent engagement in the school. To help support parents and to ensure that all parents receive the information they need to help their children with postsecondary decisions, Mt. Pleasant hosts parent workshops which focus on a variety of topics from understanding standards to A-G requirements. In addition, counselors annually schedule parent visits and workshops that include college information, financial aid, and graduation status. We also have our Parent and Community Involvement Specialist who works closely with our parents to ensure they are connected with the school. In addition, the principal holds 3 monthly coffees with the community to address their immediate concerns and questions. Each coffee session is in a specific language: English, Spanish or Vietnamese. If you are interested in participating in any of these programs or would like more information please call Ms. Andrea Gonzalez, Parent and Community Involvement Specialist, at (408) 937-2889 or contact her at [email protected]

2017-18 School Accountability Report Card for Mt. Pleasant High School Page 8 of 11
State Priority: School Climate The SARC provides the following information relevant to the State priority: School Climate (Priority 6): • Pupil suspension rates; • Pupil expulsion rates; and • Other local measures on the sense of safety.
School Safety Plan Mt. Pleasant has a very detailed, comprehensive Safety Plan that outlines protocol to be used, systems that must be in place, and procedures that must be followed in the event of an emergency. This Safety Plan is a general guideline to assist school administrators, Emergency Services (first responders), and others in the event of an incident at Mt. Pleasant High School. These procedures cover everything from an intruder on campus to a natural disaster. This Safety Plan has been designed to complement the District’s Emergency Disaster Preparedness Plan and Manual, which provides more detail on procedures and preparedness. The guidelines contained within this plan can vary based on the nature of the incident, structural integrity, water and power supplies, and, most importantly, the safety of the staff, students, and school community. Finally, this plan contains a variety of other information including but not limited to: Exposure control for blood borne pathogens Safety Drills and procedures Emergency communications Child abuse reporting Hate motivated crimes Medical emergencies Hostage situations This plan also contains the yearly safety goals as determined by the students, staff, and parents. School Site Council also serves as our School Safety Committee and helps write and approve the yearly Safety Plan. Our Safety Plan is reviewed by the District Safety Committee before it is presented to the East Side Union High School District Board of Trustees for adoption. The Safety Plan and drill procedures are reviewed during the year with all staff. Throughout the school year, safety alerts are shared with all staff as needed. In addition, all required drills are scheduled and completed, and the results are communicated with certificated and classified staff. The 2017-2018 Mt. Pleasant High School Site Safety Plan outlines comprehensive, enforceable, and consistent policies on student behavior, attendance, dress code, etc. It also delineates protocol for partnerships with community agencies, including City of San Jose, San Jose Police Department, and other community based organizations that offer support school services and programs.
Suspensions and Expulsions
School 2015-16 2016-17 2017-18
Suspensions Rate 6.1 6.9 5.5
Expulsions Rate 0.1 0.0 0.0
District 2015-16 2016-17 2017-18
Suspensions Rate 3.8 4.0 3.7
Expulsions Rate 0.1 0.1 0.1
State 2015-16 2016-17 2017-18
Suspensions Rate 3.7 3.7 3.5
Expulsions Rate 0.1 0.1 0.1
2017-18 School Accountability Report Card for Mt. Pleasant High School Page 9 of 11
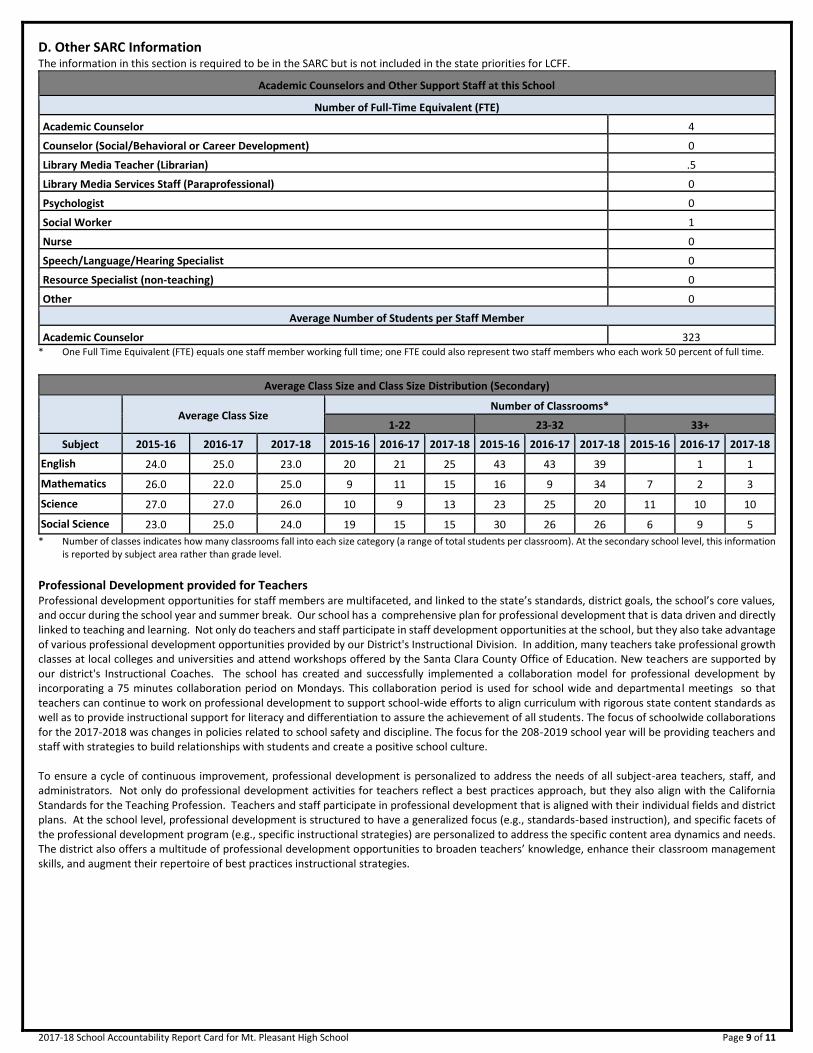
D. Other SARC Information
The information in this section is required to be in the SARC but is not included in the state priorities for LCFF.
Academic Counselors and Other Support Staff at this School
Number of Full-Time Equivalent (FTE)
Academic Counselor------- 4
Counselor (Social/Behavioral or Career Development) 0
Library Media Teacher (Librarian) .5
Library Media Services Staff (Paraprofessional) 0
Psychologist------- 0
Social Worker------- 1
Nurse------- 0
Speech/Language/Hearing Specialist 0
Resource Specialist (non-teaching)------- 0
Other------- 0
Average Number of Students per Staff Member
Academic Counselor------- 323 * One Full Time Equivalent (FTE) equals one staff member working full time; one FTE could also represent two staff members who each work 50 percent of full time.
Average Class Size and Class Size Distribution (Secondary)
Average Class Size Number of Classrooms*
1-22 23-32 33+
Subject 2015-16 2016-17 2017-18 2015-16 2016-17 2017-18 2015-16 2016-17 2017-18 2015-16 2016-17 2017-18
English------- ----------
24.0 25.0 23.0 20 21 25 43 43 39 1 1
Mathematics ----------
26.0 22.0 25.0 9 11 15 16 9 34 7 2 3
Science------- ----------
27.0 27.0 26.0 10 9 13 23 25 20 11 10 10
Social Science ----------
23.0 25.0 24.0 19 15 15 30 26 26 6 9 5
* Number of classes indicates how many classrooms fall into each size category (a range of total students per classroom). At the secondary school level, this information is reported by subject area rather than grade level.
Professional Development provided for Teachers Professional development opportunities for staff members are multifaceted, and linked to the state’s standards, district goals, the school’s core values, and occur during the school year and summer break. Our school has a comprehensive plan for professional development that is data driven and directly linked to teaching and learning. Not only do teachers and staff participate in staff development opportunities at the school, but they also take advantage of various professional development opportunities provided by our District's Instructional Division. In addition, many teachers take professional growth classes at local colleges and universities and attend workshops offered by the Santa Clara County Office of Education. New teachers are supported by our district's Instructional Coaches. The school has created and successfully implemented a collaboration model for professional development by incorporating a 75 minutes collaboration period on Mondays. This collaboration period is used for school wide and departmental meetings so that teachers can continue to work on professional development to support school-wide efforts to align curriculum with rigorous state content standards as well as to provide instructional support for literacy and differentiation to assure the achievement of all students. The focus of schoolwide collaborations for the 2017-2018 was changes in policies related to school safety and discipline. The focus for the 208-2019 school year will be providing teachers and staff with strategies to build relationships with students and create a positive school culture. To ensure a cycle of continuous improvement, professional development is personalized to address the needs of all subject-area teachers, staff, and administrators. Not only do professional development activities for teachers reflect a best practices approach, but they also align with the California Standards for the Teaching Profession. Teachers and staff participate in professional development that is aligned with their individual fields and district plans. At the school level, professional development is structured to have a generalized focus (e.g., standards-based instruction), and specific facets of the professional development program (e.g., specific instructional strategies) are personalized to address the specific content area dynamics and needs. The district also offers a multitude of professional development opportunities to broaden teachers’ knowledge, enhance their classroom management skills, and augment their repertoire of best practices instructional strategies.
2017-18 School Accountability Report Card for Mt. Pleasant High School Page 10 of 11
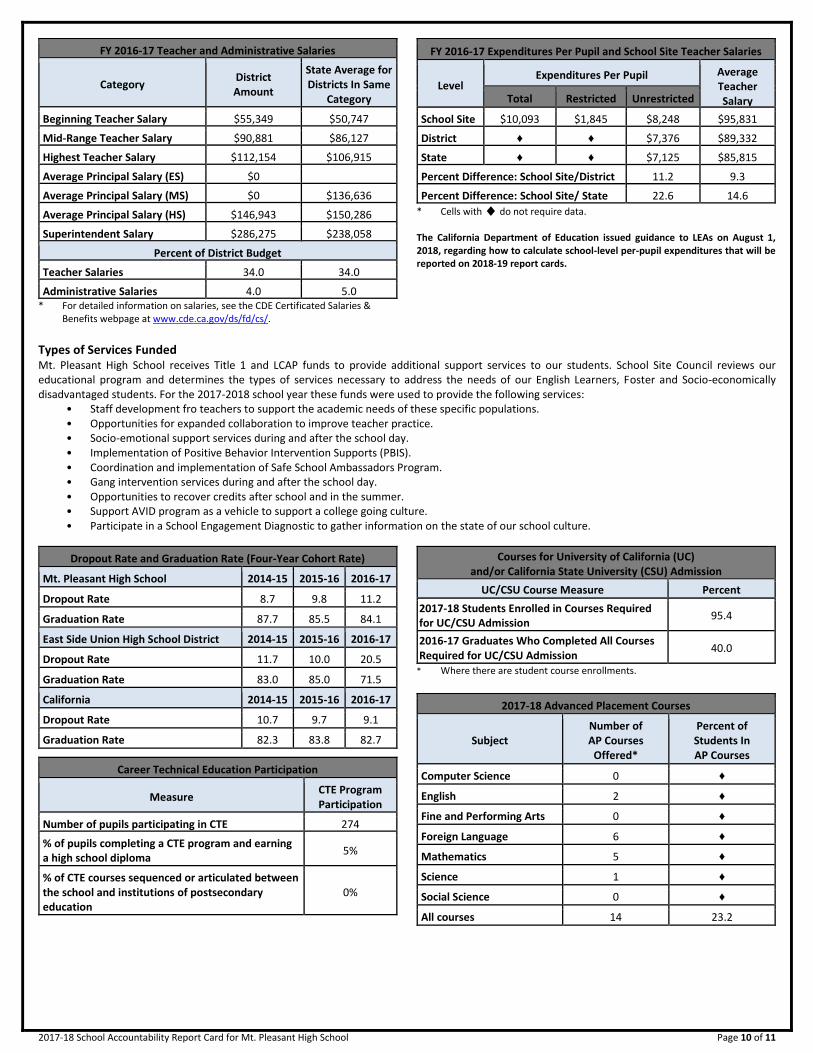
FY 2016-17 Teacher and Administrative Salaries
Category District Amount
State Average for Districts In Same
Category
Beginning Teacher Salary $55,349 $50,747
Mid-Range Teacher Salary $90,881 $86,127
Highest Teacher Salary $112,154 $106,915
Average Principal Salary (ES) $0
Average Principal Salary (MS) $0 $136,636
Average Principal Salary (HS) $146,943 $150,286
Superintendent Salary $286,275 $238,058
Percent of District Budget
Teacher Salaries 34.0 34.0
Administrative Salaries 4.0 5.0 * For detailed information on salaries, see the CDE Certificated Salaries &
Benefits webpage at www.cde.ca.gov/ds/fd/cs/.
FY 2016-17 Expenditures Per Pupil and School Site Teacher Salaries
Level Expenditures Per Pupil Average
Teacher Salary Total Restricted Unrestricted
School Site-------
$10,093 $1,845 $8,248 $95,831
District-------
♦ ♦ $7,376 $89,332
State------- ♦ ♦ $7,125 $85,815
Percent Difference: School Site/District 11.2 9.3
Percent Difference: School Site/ State 22.6 14.6
* Cells with ♦ do not require data. The California Department of Education issued guidance to LEAs on August 1, 2018, regarding how to calculate school-level per-pupil expenditures that will be reported on 2018-19 report cards.
Types of Services Funded
Mt. Pleasant High School receives Title 1 and LCAP funds to provide additional support services to our students. School Site Council reviews our educational program and determines the types of services necessary to address the needs of our English Learners, Foster and Socio-economically disadvantaged students. For the 2017-2018 school year these funds were used to provide the following services:
• Staff development fro teachers to support the academic needs of these specific populations. • Opportunities for expanded collaboration to improve teacher practice. • Socio-emotional support services during and after the school day. • Implementation of Positive Behavior Intervention Supports (PBIS). • Coordination and implementation of Safe School Ambassadors Program. • Gang intervention services during and after the school day. • Opportunities to recover credits after school and in the summer. • Support AVID program as a vehicle to support a college going culture. • Participate in a School Engagement Diagnostic to gather information on the state of our school culture.
Dropout Rate and Graduation Rate (Four-Year Cohort Rate)
Mt. Pleasant High School 2014-15 2015-16 2016-17
Dropout Rate 8.7 9.8 11.2
Graduation Rate 87.7 85.5 84.1
East Side Union High School District 2014-15 2015-16 2016-17
Dropout Rate 11.7 10.0 20.5
Graduation Rate 83.0 85.0 71.5
California 2014-15 2015-16 2016-17
Dropout Rate 10.7 9.7 9.1
Graduation Rate 82.3 83.8 82.7
Career Technical Education Participation
Measure CTE Program Participation
Number of pupils participating in CTE 274
% of pupils completing a CTE program and earning a high school diploma
5%
% of CTE courses sequenced or articulated between the school and institutions of postsecondary education
0%
Courses for University of California (UC) and/or California State University (CSU) Admission
UC/CSU Course Measure Percent
2017-18 Students Enrolled in Courses Required for UC/CSU Admission
95.4
2016-17 Graduates Who Completed All Courses Required for UC/CSU Admission
40.0
* Where there are student course enrollments.
2017-18 Advanced Placement Courses
Subject Number of AP Courses
Offered*
Percent of Students In AP Courses
Computer Science 0 ♦
English------- 2 ♦
Fine and Performing Arts 0 ♦
Foreign Language 6 ♦
Mathematics 5 ♦
Science------- 1 ♦
Social Science 0 ♦
All courses 14 23.2
2017-18 School Accountability Report Card for Mt. Pleasant High School Page 11 of 11
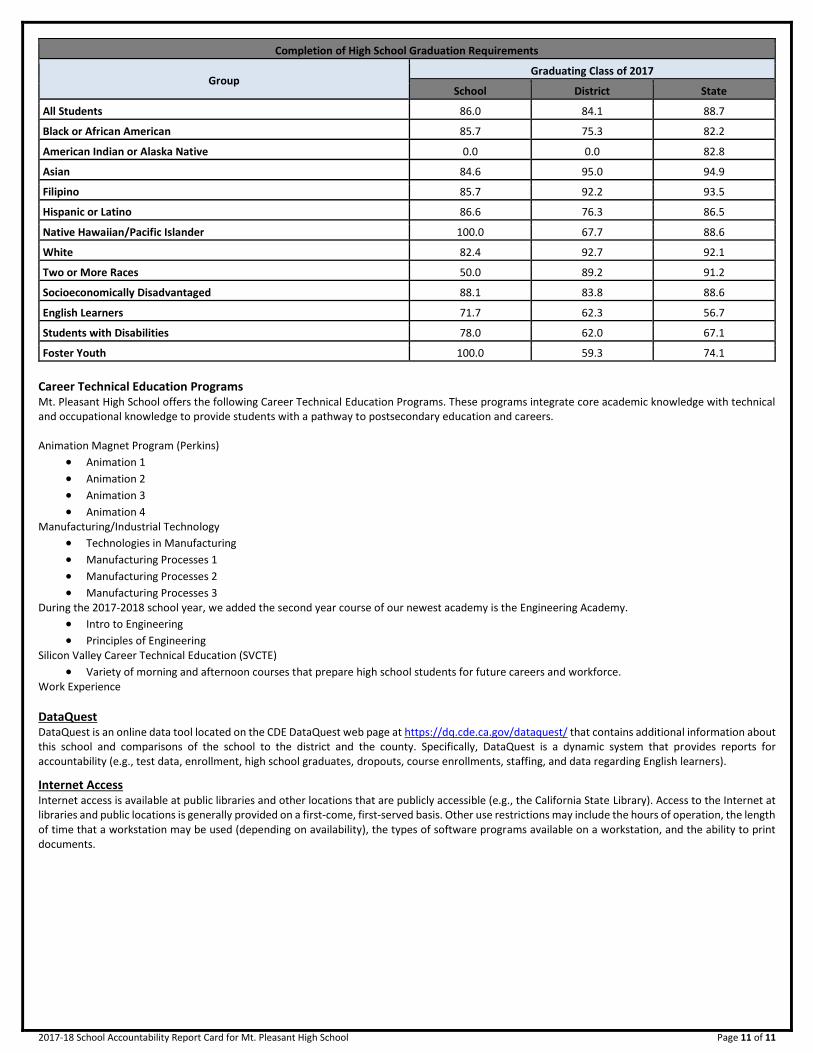
Completion of High School Graduation Requirements
Group Graduating Class of 2017
School District State
All Students 86.0 84.1 88.7
Black or African American 85.7 75.3 82.2
American Indian or Alaska Native 0.0 0.0 82.8
Asian 84.6 95.0 94.9
Filipino 85.7 92.2 93.5
Hispanic or Latino 86.6 76.3 86.5
Native Hawaiian/Pacific Islander 100.0 67.7 88.6
White 82.4 92.7 92.1
Two or More Races 50.0 89.2 91.2
Socioeconomically Disadvantaged 88.1 83.8 88.6
English Learners 71.7 62.3 56.7
Students with Disabilities 78.0 62.0 67.1
Foster Youth 100.0 59.3 74.1
Career Technical Education Programs
Mt. Pleasant High School offers the following Career Technical Education Programs. These programs integrate core academic knowledge with technical and occupational knowledge to provide students with a pathway to postsecondary education and careers. Animation Magnet Program (Perkins)
Animation 1
Animation 2
Animation 3
Animation 4 Manufacturing/Industrial Technology
Technologies in Manufacturing
Manufacturing Processes 1
Manufacturing Processes 2
Manufacturing Processes 3 During the 2017-2018 school year, we added the second year course of our newest academy is the Engineering Academy.
Intro to Engineering
Principles of Engineering Silicon Valley Career Technical Education (SVCTE)
Variety of morning and afternoon courses that prepare high school students for future careers and workforce. Work Experience
DataQuest DataQuest is an online data tool located on the CDE DataQuest web page at https://dq.cde.ca.gov/dataquest/ that contains additional information about this school and comparisons of the school to the district and the county. Specifically, DataQuest is a dynamic system that provides reports for accountability (e.g., test data, enrollment, high school graduates, dropouts, course enrollments, staffing, and data regarding English learners).
Internet Access Internet access is available at public libraries and other locations that are publicly accessible (e.g., the California State Library). Access to the Internet at libraries and public locations is generally provided on a first-come, first-served basis. Other use restrictions may include the hours of operation, the length of time that a workstation may be used (depending on availability), the types of software programs available on a workstation, and the ability to print documents.