Embed Size (px)
Citation preview
MSE Performance Metrics and Tentative Results Summary
Joint Technical CommitteeNorthwest Fisheries Science Center, NOAA
Pacific Biological Station, DFOSchool of Resource and Environmental Management, SFU
Outline
• Review of MSE• Graphics of preliminary results
– Omniscient case– Annual case– Biennial case
• Key performance statistics– discussion
Objectives of the MSE
• Use the 2012 base case as the operating model.
• As defined in May 2120– Evaluate the performance of the harvest control
rule– Evaluate the performance of annual, relative to
biennial survey frequency.
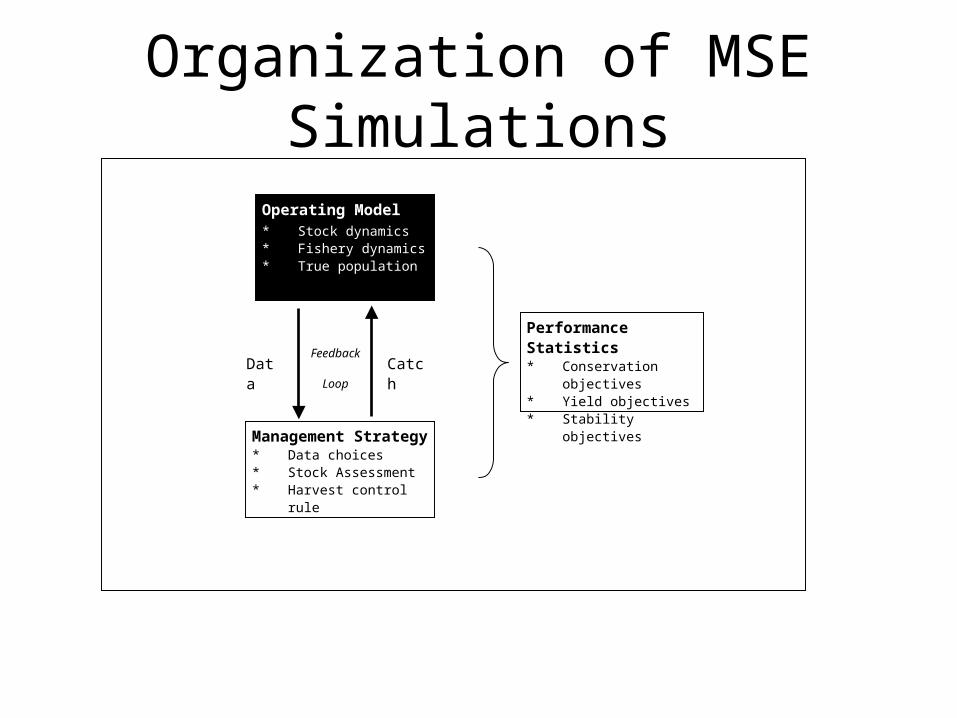
Organization of MSE Simulations
Operating Model* Stock dynamics* Fishery dynamics* True population
Management Strategy* Data choices* Stock Assessment* Harvest control rule
CatchData
Performance Statistics* Conservation
objectives* Yield objectives* Stability objectives
Feedback
Loop
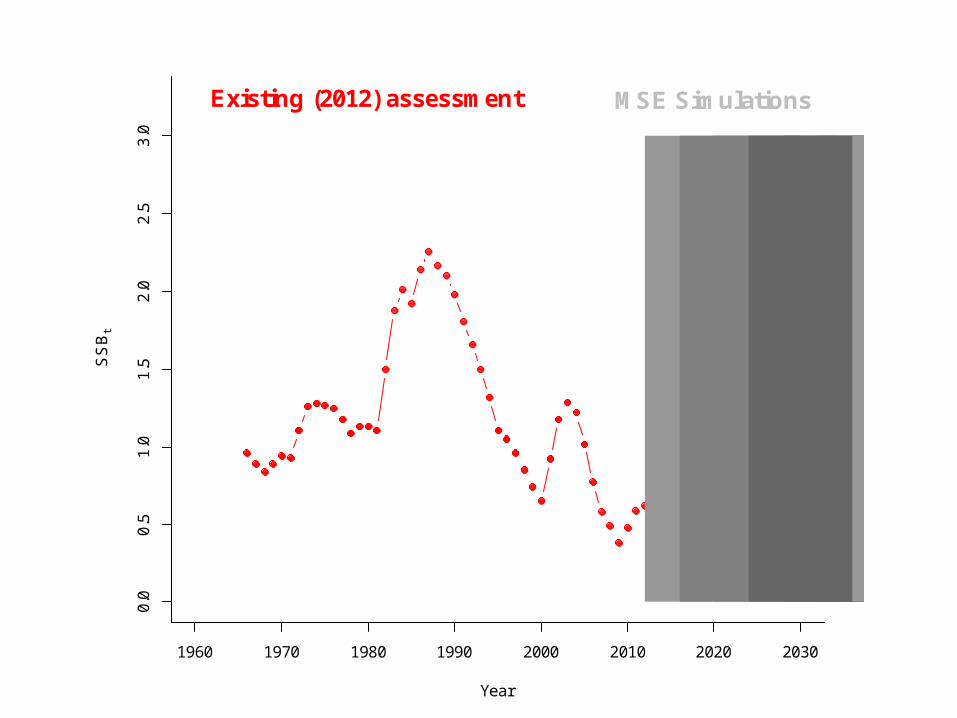
1960 1970 1980 1990 2000 2010 2020 2030
0.0
0.5
1.0
1.5
2.0
2.5
3.0
Year
SS
Bt
Existing (2012) assessment MSE Simulations
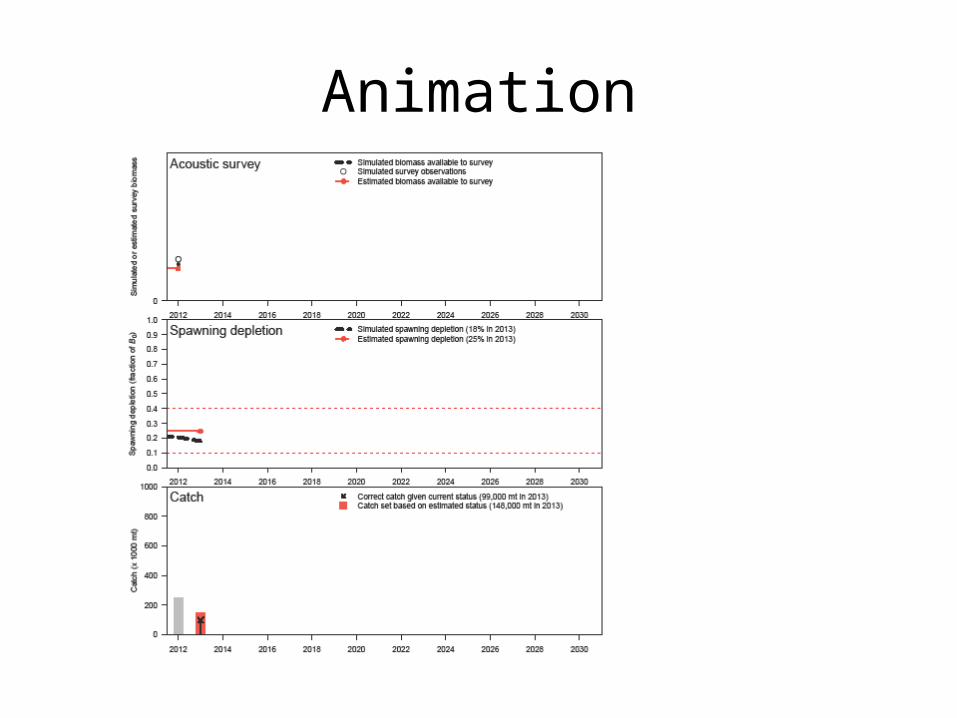
Animation
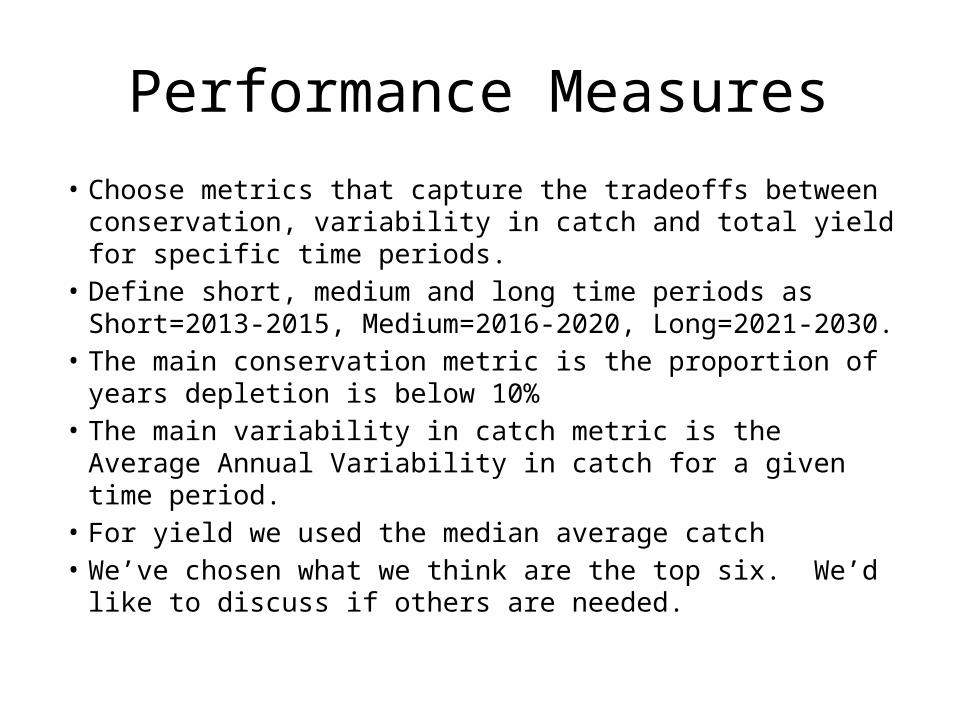
Performance Measures
• Choose metrics that capture the tradeoffs between conservation, variability in catch and total yield for specific time periods.
• Define short, medium and long time periods as Short=2013-2015, Medium=2016-2020, Long=2021-2030.
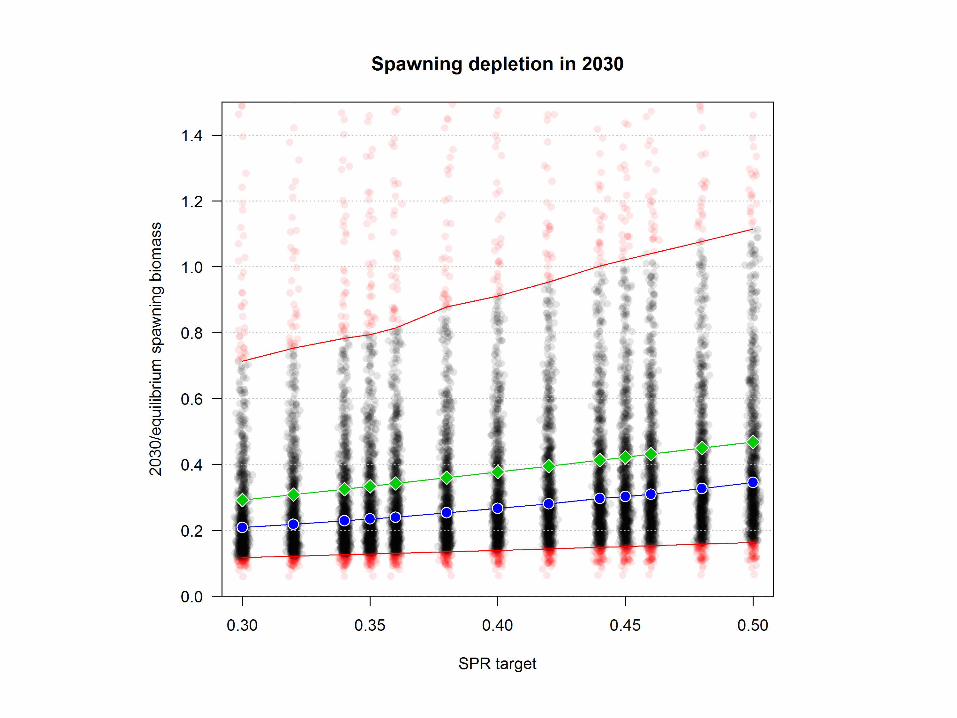
• The main conservation metric is the proportion of years depletion is below 10%
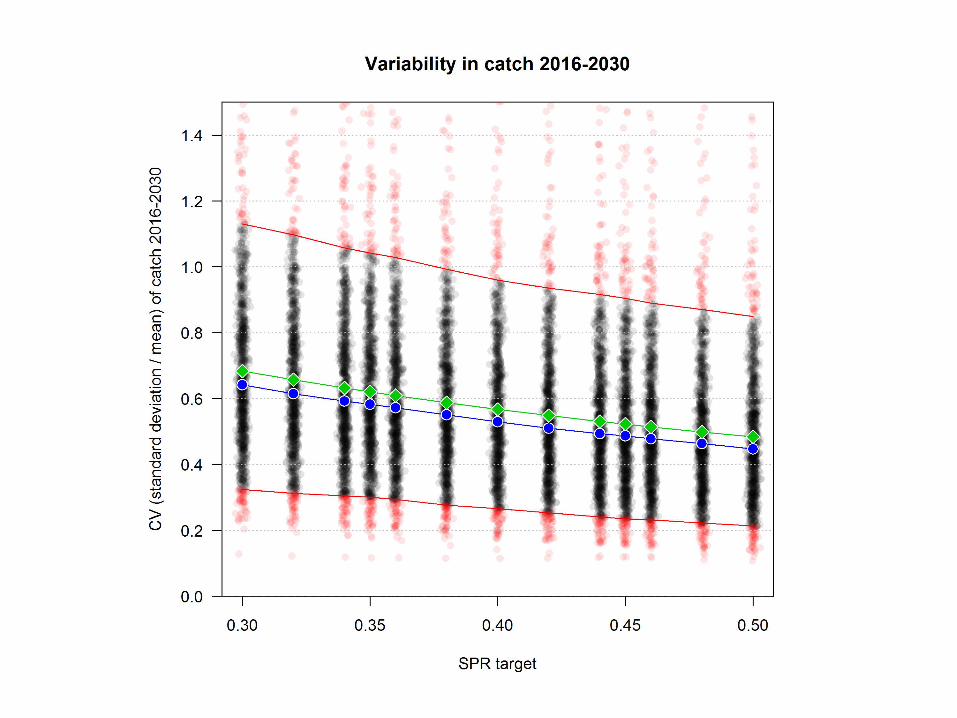
• The main variability in catch metric is the Average Annual Variability in catch for a given time period.
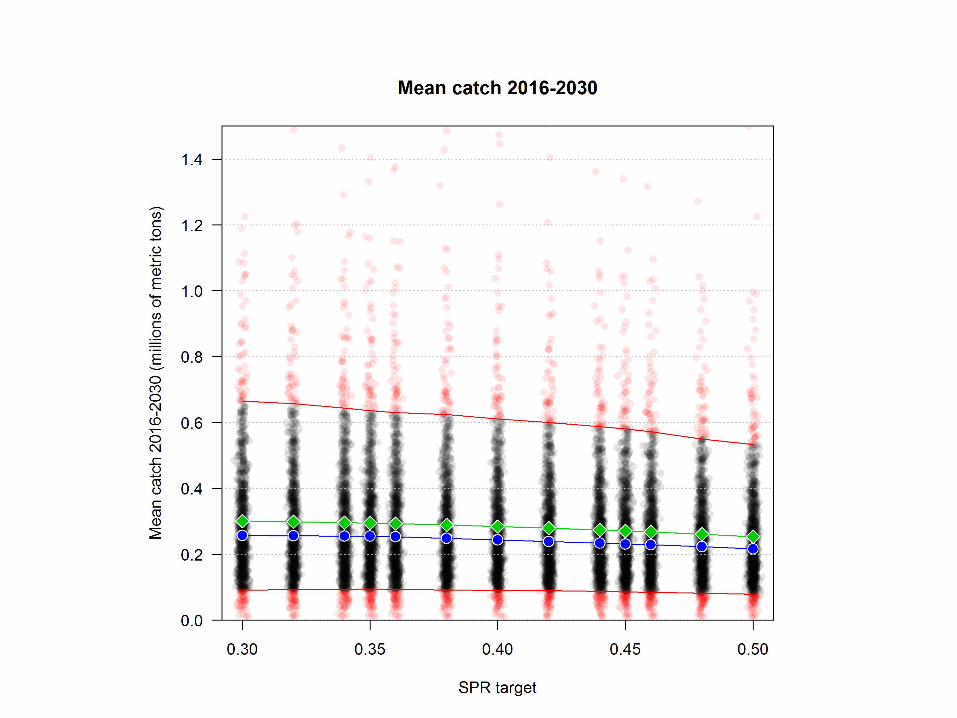
• For yield we used the median average catch• We’ve chosen what we think are the top six. We’d like to
discuss if others are needed.
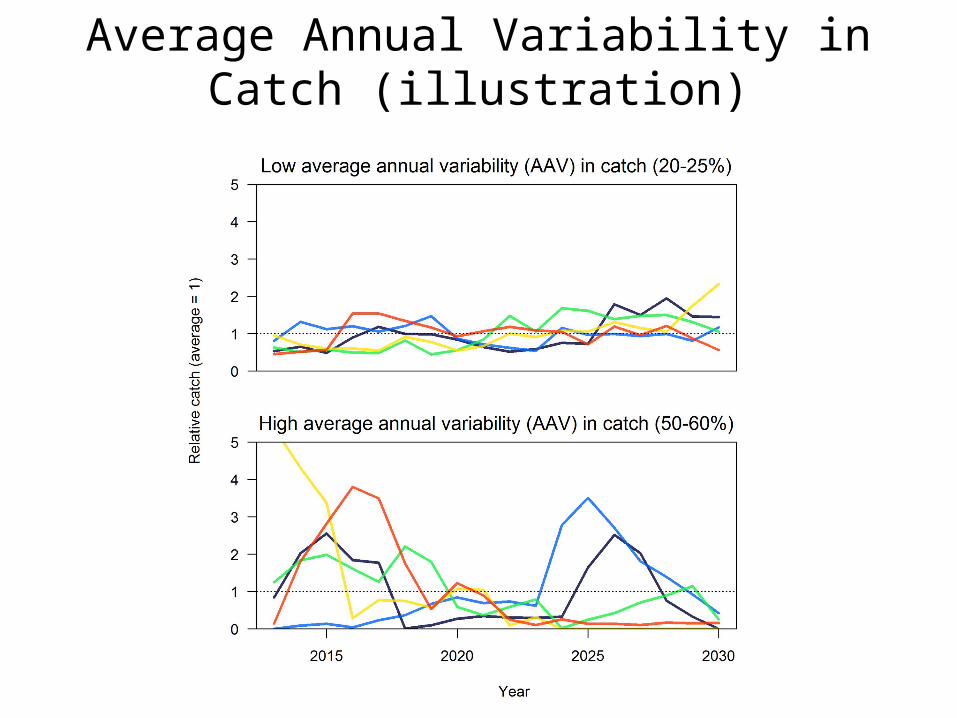
Average Annual Variability in Catch (illustration)
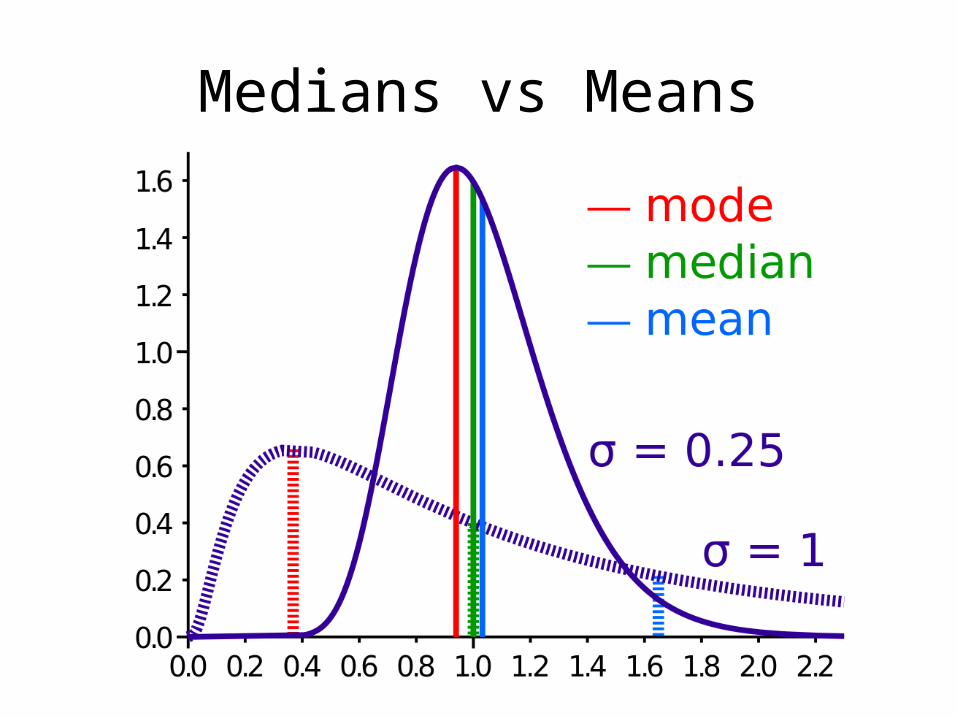
Medians vs Means
Perfect Information Case
• We created a reference, perfect information case where we simulated data with no error
• The purpose of the perfect information case was to provide:– Separate observation vs process error i.e. variable
data don’t affect management procedure performance
– a reference to compare the annual/biennial survey cases to.
Perfect information (con’t)
Annual Survey Case
Biennial Survey Case
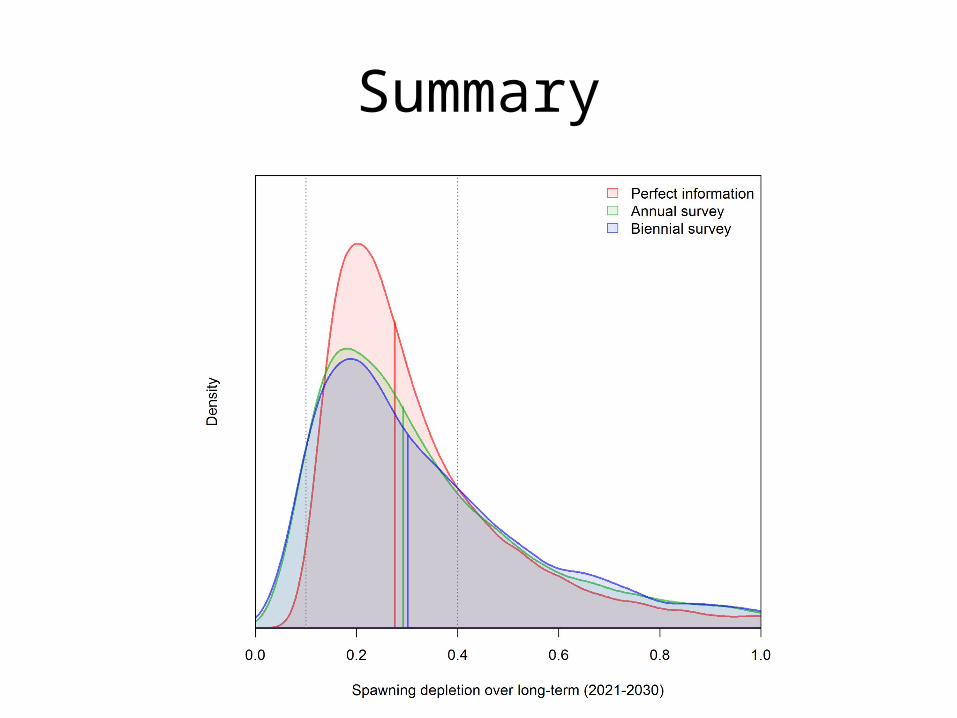
Summary