Embed Size (px)
Citation preview

Methodology Book
MSCI Index Calculation
Methodology
L a s t U p d a t e d i n M a y 2 0 0 6
Index Calculation Methodology
Notice and Disclaimer Copyright © 2006 by Morgan Stanley Capital International Inc. ("MSCI"). All rights reserved.
This document and all of the information contained in it, including all text, data, graphs, charts and all other information (collectively, the “Information”) may not be reproduced or redisseminated in whole or in part without prior written permission from MSCI. Any use of MSCI indices, data or other information requires a license from MSCI. The Information is for informational purposes only and does not form a part of the terms or conditions of any agreement you have or may enter into with MSCI. The Information may not be used to verify or correct other data, to create indices, or in connection with offering, sponsoring, managing or marketing any securities, portfolios, financial instruments or products. • None of the Information constitutes an offer to buy or sell, or a promotion or recommendation of, any security,
financial instrument or product or trading strategy, and MSCI does not endorse, approve or otherwise express any opinion regarding any issuer, securities, financial products or instruments or trading strategies that may be described or mentioned herein. Further, none of the Information is intended to constitute investment advice or a recommendation to make (or refrain from making) any kind of investment decision and may not be relied on as such.
• The user of the Information assumes the entire risk of any use it may make or permit to be made of it. • NEITHER MSCI, ANY OF ITS AFFILIATES OR ANY OTHER THIRD PARTY INVOLVED IN MAKING OR
COMPILING ANY OF THE INFORMATION MAKES ANY EXPRESS OR IMPLIED WARRANTIES OR REPRESENTATIONS WITH RESPECT TO THE INFORMATION (OR THE RESULTS TO BE OBTAINED BY THE USE THEREOF), AND MSCI, ITS AFFILIATES AND EACH SUCH OTHER THIRD PARTY HEREBY EXPRESSLY DISCLAIM ALL IMPLIED WARRANTIES (INCLUDING, WITHOUT LIMITATION, ANY IMPLIED WARRANTIES OF ORIGINALITY, ACCURACY, TIMELINESS, NON-INFRINGEMENT, COMPLETENESS, MERCHANTABILITY AND FITNESS FOR A PARTICULAR PURPOSE) WITH RESPECT TO ANY OF THE INFORMATION.
• Without limiting any of the foregoing, in no event shall MSCI, any of its affiliates or any other third party involved in making or compiling any of the Information have any liability regarding any of the Information for any direct, indirect, special, punitive, consequential or any other damages (including lost profits) even if notified of the possibility of such damages.
• Morgan Stanley Capital International, MSCI®, ACWI, EAFE® and all other service marks referred to herein are the exclusive property of MSCI or its affiliates. All MSCI indices are the exclusive property of MSCI and may not be used in any way without the express written permission of MSCI.

- i -
Index Calculation Methodology
Table of Content
INTRODUCTION................................................................................................................................. 1 MSCI EQUITY INDICES ..................................................................................................................... 1 SECTION 1: MSCI PRICE INDEX METHODOLOGY .....................................................................2
1.1 Price Index Level .....................................................................................................................................2 1.2 Index Market Capitalization...................................................................................................................2 1.3 Price Index Level (from Security Information)...................................................................................5 1.4 Security Contribution to the Index .......................................................................................................5 1.5 Today’s Initial Security Weight..............................................................................................................5 1.6 Next Day Initial Security Weight ..........................................................................................................6 1.7 Closing Index Market Capitalization today USD (Unadjusted Market Cap today USD) .............7
SECTION 2: MSCI DAILY TOTAL RETURN (DTR) INDEX METHODOLOGY ........................8 2.1 Calculation Methodology .......................................................................................................................8 2.1.1 Dividend Impact ..................................................................................................................................9 2.1.2 DTR Index Level from Security Information (Security DTR) .....................................................9 2.1.3 Security Contribution to the Index ...................................................................................................9 2.1.4 Initial Security Weight ...................................................................................................................... 10 2.1.5 Currency ............................................................................................................................................. 10 2.1.6 Number of Shares and Index Weighting Factor .......................................................................... 10 2.2 Reinvestment Methodology ................................................................................................................ 11 2.2.1 Timing of re-investment .................................................................................................................. 11 2.2.2 Re-Investment Rules ........................................................................................................................ 11 2.2.3 Dividends Resulting in a Reinvestment Only............................................................................... 11 2.2.4 Dividends Resulting in a Reinvestment or in a Price Adjustment ............................................ 12 2.2.5 Dividends Resulting in a Price Adjustment Only ........................................................................ 13 2.3 Processing Rules ................................................................................................................................... 13 2.3.1 Dividend Data ................................................................................................................................... 13 2.3.2 Corporate Actions ............................................................................................................................ 13 2.3.3 Corrections ........................................................................................................................................ 14 2.3.4 Payment Default ............................................................................................................................... 14 2.3.5 Late Dividends .................................................................................................................................. 14 2.3.6 Country Exceptions.......................................................................................................................... 14 2.3.7 Taxes................................................................................................................................................... 15 2.3.8 Definitions ......................................................................................................................................... 16
SECTION 3: ALTERNATIVE INDEX CALCULATIONS............................................................... 17 3.1 Gross Domestic Product (GDP) Weighted Indices........................................................................ 17 3.2 Daily Hedged Indices........................................................................................................................... 18 3.2.1 Overview............................................................................................................................................ 18 3.2.2 Daily Hedged Indices based on 1-Month Forwards.................................................................... 19 3.2.3 Calculation of Odd-Days Forwards Using a Linear Interpolation............................................ 19 3.2.4 Daily Hedged Index Calculation Formula .................................................................................... 20 3.2.5 Daily Hedged Index Example......................................................................................................... 21

- ii -
Index Calculation Methodology
APPENDIX I: MSCI GCC COUNTRY INDICES: SATURDAY/SUNDAY INDEX CALCULATION .................................................................................................................................. 22 APPENDIX II: EXCHANGE RATES ................................................................................................ 24 APPENDIX III: SINGAPORE & MALAYSIA - A HISTORY OF INCLUSION IN THE MSCI EMERGING AND DEVELOPPED MARKETS INDICES .............................................................. 25 APPENDIX IV: WITHHOLDING TAX RATES............................................................................... 28 APPENDIX V: CLOSING PRICES POLICY ..................................................................................... 29 APPENDIX VI: COUNTRY COMPOSITION OF MSCI REGIONAL INDICES.......................... 37 APPENDIX VII: FREQUENTLY ASKED QUESTIONS................................................................. 41 MSCI INDEX CALCULATION METHODOLOGY BOOK TACKED CHANGES ....................... 42

1
Index Calculation Methodology
Introduction This methodology book describes MSCI’s general index calculation methodology for the MSCI Equtiy indices, as well as alternative index calculations such as MSCI’s Daily Hedged Indices and Daily Total Return (DTR) Indices. These policies and guidelines affect all securities across the MSCI Equity Index series and products. Unless otherwise stated the policies and guidelines apply therefore to all securities in the MSCI Equity universe. Please note that the index construction methodology and other guiding principles for the MSCI Standard Index Series can be found in MSCI’s Standard Index Series methodology book, available at www.msci.com
MSCI Equity Indices The MSCI Equity Indices measure the performance of a set of equity securities over time. The MSCI Equity Indices are calculated using the Laspeyres’ concept of a weighted arithmetic average together with the concept of chain-linking. MSCI country and regional equity indices are calculated in “local currency” as well as in USD, with price, gross and net returns. Index levels are also available in several other currencies such as GBP, EUR, JPY, CAD, CHF and AUD. While the local currency series of regional indices cannot be replicated in the real world, it represents the theoretical performance of an index without any impact from foreign exchange fluctuations — a continuously hedged portfolio. Indices are calculated 5 days a week, from Monday to Friday with the exception of a selection of indices impacted by the Gulf Cooperation Council (GCC) countries that have Saturday and Sunday calculations available.

2
Index Calculation Methodology
Section 1: MSCI Price Index Methodology Price indices measure the market prices performance for a selection of securities. They are calculated daily and, for a majority, on real time. Each index captures the market capitalization weighted return of all constituents included in the index. 1.1 Price Index Level As a general principle, today’s index level is obtained by applying the change in the market performance to the previous period index level.
t
ttt pUSDalMarketCaIndexIniti
apUSDtedMarketCIndexAdjusvelUSDiceIndexLevelUSDiceIndexLe *PrPr 1−=
t
ttt pUSDalMarketCaIndexIniti
apForLocaltedMarketCIndexAdjusvelLocaliceIndexLevelLocaliceIndexLe *PrPr 1−=
Where: • 1Pr −tvelUSDiceIndexLe is the Price Index level in USD at time t-1 • tapUSDtedMarketCIndexAdjus is the Adjusted Market Capitalization of the index in USD at time t • tpUSDalMarketCaIndexIniti is the Initial Market Capitalization of the index in USD at time t • 1Pr −tvelLocaliceIndexLe is the Price Index level in local currency at time t-1 • tapForLocaltedMarketCIndexAdjus is the Adjusted Market Capitalization of the index in USD
converted using FX rate as of t-1 and used for local currency index at time t Note: pUSDalMarketCaIndexIniti was previously called eviousUSDtCapustedMarkeIndexUnadj Pr
1.2 Index Market Capitalization
∑∈
−
=
tIs t
tttt
t
FXratePAFactorInclusionFeicePerSharrOfSharesIndexNumbe
apUSDtedMarketCIndexAdjus
,
1 **Pr*
)***Pr*
(1, 1
1
−∈ −
−∑
=
t
t
tIs t
tttt
t
ICIICI
FXratePAFactorInclusionFeicePerSharrOfSharesIndexNumbe
apForLocaltedMarketCIndexAdjus
∑∈ −
−−
=
tIs t
ttt
t
FXrateactorInclusionFeicePerSharrOfSharesIndexNumbe
pUSDalMarketCaIndexIniti
, 1
11 *Pr*

3
Index Calculation Methodology
Where: • 1−trOfSharesIndexNumbe is the number of shares of security s at time t-1. • teicePerSharPr is the price per share of the security s at time t. • 1Pr −teicePerShar is the price per share of security s at time t-1. • tactorInclusionF is the inclusion factor (e.g. Foreign Inclusion Factor, Domestic Inclusion Factor,
Growth Inclusion Factor, Value Inclusion Factor) of the security s at time t. • tPAF is the Price Adjustment Factor of the security s at time t. • tFXrate is the FX rate of the price currency of security s vs USD at time t. It is the value of 1 USD
in foreign currency. • 1−tFXrate is the FX rate of the price currency of security s vs USD at time t-1. It is the value of 1
USD in foreign currency. • tICI is the Internal Currency Index of price currency at time t. The ICI is different than 1 when a
country changes the internal value of its currency (e.g. from Turkish Lira to New Turkish Lira – ICI = 1,000,000).
• 1−tICI is the Internal Currency Index of price currency at time t-1. Note: The only difference in the formulas between USD and local currency indices calculation is that the same exchange rate is used in the numerator and denominator for local currency, which means that there is no impact of currency change in the performance. Time variant exchange rates are used for the USD calculation.

4
Index Calculation Methodology
Example of Index Calculation.
Day 1
NumberOfShares t-1
PricePer Share t
PricePer Share t-1
Inclusion Factor t PAF t
FXrate t
FXrate t-1 AdjMcapUSD t
InitialMCap USD t
AdjMcapFor Local t
Security A 150000 152.60 154.00 0.75 1 1.50 1.49 11,445,000 11,627,517 11,521,812 Security B 26000 98.40 105.00 1.00 1 1.15 1.14 2,224,696 2,394,737 2,244,211 Security C 290000 1592.60 1603.50 0.60 1 125.00 125.50 2,216,899 2,223,179 2,208,067 Security D 360000 268.00 265.30 0.85 1 1.50 1.50 54,672,000 54,121,200 54,672,000
Total Index 70,558,595 70,366,633 70,646,090
t t-1 daily perfPriceIndexLevelUSD 100.273 100.000 0.27%PriceIndexLevelLocal 100.397 100.000 0.40%
Day 2
NumberOfShares t-1
PricePer Share t
PricePer Share t-1
Inclusion Factor t PAF t
FXrate t
FXrate t-1 AdjMcapUSD t
InitialMCap USD t
AdjMcapFor Local t
Security A 150000 160.00 152.60 0.75 1 1.51 1.50 11,920,530 11,445,000 12,000,000 Security B 26000 95.00 98.40 1.00 1 1.16 1.15 2,129,310 2,224,696 2,147,826 Security C 290000 1450.00 1592.60 0.60 1.1012 124.50 125.00 2,231,497 2,216,899 2,222,571 Security D 360000 265.00 268.00 0.85 1 1.51 1.50 53,701,987 54,672,000 54,060,000
Total Index 69,983,323 70,558,595 70,430,397
t t-1 daily perfPriceIndexLevelUSD 99.455 100.273 -0.82%PriceIndexLevelLocal 100.215 100.397 -0.18%
Day 3
NumberOfShares t-1
PricePer Share t
PricePer Share t-1
Inclusion Factor t PAF t
FXrate t
FXrate t-1 AdjMcapUSD t
InitialMCap USD t
AdjMcapFor Local t
Security A 150000 165.00 160.00 0.75 1 1.50 1.51 12,375,000 11,920,530 12,293,046 Security B 26000 102.00 95.00 1.00 1 1.17 1.16 2,266,667 2,129,310 2,286,207 Security C 580000 1545.00 1450.00 0.60 1 124.45 124.50 4,320,289 4,053,012 4,318,554 Security D 360000 266.00 265.00 0.85 1 1.50 1.51 54,264,000 53,701,987 53,904,636
Total Index 73,225,956 71,804,839 72,802,443 t t-1 daily perf
PriceIndexLevelUSD 101.424 99.455 1.98%PriceIndexLevelLocal 101.607 100.215 1.39%

5
Index Calculation Methodology
1.3 Price Index Level (from Security Information) Another way to calculate the index level would be to use the initial weight and price return of the individual securities included in the index:
∑∈
− +=tIs
ttt exUSDutionToIndiceContribSecurityvelUSDiceIndexLevelUSDiceIndexLe,
1 )Pr1(*PrPr
∑∈
− +=tIs
ttt exLocalutionToIndiceContribSecurityvelLocaliceIndexLevelLocaliceIndexLe,
1 )Pr1(*PrPr
1.4 Security Contribution to the Index
ttt turnUSDiceilySecurityDaturityWeighInitialSecIndexUSDutionToiceContribSecurity RePr*Pr =
ttt turnLocaliceilySecurityDaturityWeighInitialSecIndexLocalutionToiceContribSecurity RePr*Pr = Where:
• tturnUSDiceilySecurityDa RePr is the price return in USD of security s at time t. • tturnLocaliceilySecurityDa RePr is the price return of security s at time t converted using FX rate
as of t-1 and used for local currency calculation at time t. 1.5 Today’s Initial Security Weight
100*
100*)*(
*
100*)*
Pr*(
*Pr*
,
, 1
11
1
11
t
t
tIstt
tt
tIst
t
tt
tt
tt
t
pUSDalMarketCaIndexInititCapUSDitialMarkeSecurityIn
actorInclusionFDarketCapUSitialFullMSecurityIn
actorInclusionFDarketCapUSitialFullMSecurityIn
actorInclusionFFXrate
eicePerSharrOfSharesIndexNumbe
actorInclusionFFXrate
eicePerSharrOfSharesIndexNumbe
turityWeighInitialSec
=
=
=
∑
∑
∈
∈ −
−−
−
−−
6
Index Calculation Methodology
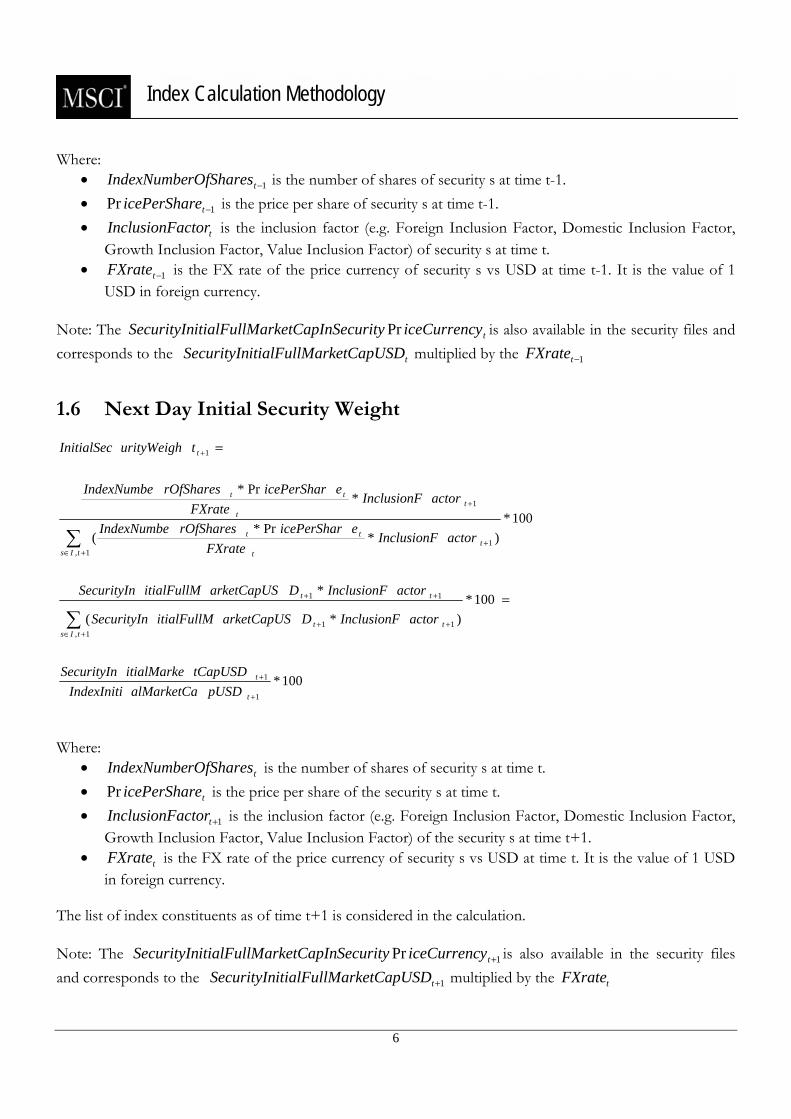
Where: • 1−trOfSharesIndexNumbe is the number of shares of security s at time t-1. • 1Pr −teicePerShar is the price per share of security s at time t-1. • tactorInclusionF is the inclusion factor (e.g. Foreign Inclusion Factor, Domestic Inclusion Factor,
Growth Inclusion Factor, Value Inclusion Factor) of security s at time t. • 1−tFXrate is the FX rate of the price currency of security s vs USD at time t-1. It is the value of 1
USD in foreign currency. Note: The tyiceCurrencSecurityarketCapInitialFullMSecurityIn Pr is also available in the security files and corresponds to the tDarketCapUSitialFullMSecurityIn multiplied by the 1−tFXrate 1.6 Next Day Initial Security Weight
100*
100*)*(
*
100*)*
Pr*(
*Pr*
1
1
1,11
11
1,1
1
1
+
+
+∈++
++
+∈+
+
+
=
=
∑
∑
t
t
tIstt
tt
tIst
t
tt
tt
tt
t
pUSDalMarketCaIndexInititCapUSDitialMarkeSecurityIn
actorInclusionFDarketCapUSitialFullMSecurityIn
actorInclusionFDarketCapUSitialFullMSecurityIn
actorInclusionFFXrate
eicePerSharrOfSharesIndexNumbe
actorInclusionFFXrate
eicePerSharrOfSharesIndexNumbe
turityWeighInitialSec
Where:
• trOfSharesIndexNumbe is the number of shares of security s at time t. • teicePerSharPr is the price per share of the security s at time t. • 1+tactorInclusionF is the inclusion factor (e.g. Foreign Inclusion Factor, Domestic Inclusion Factor,
Growth Inclusion Factor, Value Inclusion Factor) of the security s at time t+1. • tFXrate is the FX rate of the price currency of security s vs USD at time t. It is the value of 1 USD
in foreign currency. The list of index constituents as of time t+1 is considered in the calculation. Note: The 1Pr +tyiceCurrencSecurityarketCapInitialFullMSecurityIn is also available in the security files and corresponds to the 1+tDarketCapUSitialFullMSecurityIn multiplied by the tFXrate

7
Index Calculation Methodology
1.7 Closing Index Market Capitalization today USD (Unadjusted Market Cap today USD)
The value of the index market capitalization as of the close of a day is calculated as follows:
∑∈
=tIs t
tttt FXrate
actorInclusionFeicePerSharharesgNumberOfSCloUSDgMarketCapIndexClo
,
*Pr*sinsin
Where • tharesgNumberOfSClosin is the number of shares of security s at the close of t. • teicePerSharPr is the security price per share of security s at time t. • tactorInclusionF is the inclusion factor (e.g. Foreign Inclusion Factor, Domestic Inclusion Factor,
Growth Inclusion Factor, Value Inclusion Factor) of the security s at time t. • tFXrate is the FX rate of the price currency of security s vs USD at time t. It is the value of 1 USD
in foreign currency.
The list of index constituents as of time t should be considered in the calculation. Effectively this figure represents the shares at the close on t, and does not include any of the effects of corporate actions due at the open of the market the next day. The closing market capitalization uses today’s price, t, as it represents the market capitalization at the close of the calculation day t.

8
Index Calculation Methodology
Section 2: MSCI Daily Total Return (DTR) Index Methodology Total return indices measure the market performance, including price performance and income from dividend payments. A dividend is a distribution of cash (or securities) made by a company to its shareholders. The funds are taken from annual operating profits (regular dividend), from capital and/or reserves, or from extraordinary earnings. This income is reinvested in the index and thus makes up part of the total index performance. MSCI’s Daily Total Return (DTR) methodology reinvests cash dividends in indices the day the security is quoted ex-dividend (ex-date). It applies to all index families. Cash dividends are not considered in price indices, except for special dividends in certain circumstances described below. The standard Daily Total Return (DTR) indices are calculated and distributed on a daily basis. The indices are available in USD and local currency (no currency impact), with gross and net total return.
2.1 Calculation Methodology
t
ttt
t
pUSDalMarketCaIndexInitipactUSDendIndexDividapUSDtedMarketCIndexAdjus
velUSDDTRIndexLe
velUSDDTRIndexLe)Im(
*1+
=
−
t
ttt
t
pUSDalMarketCaIndexInitialpactForLocendIndexDividapForLocaltedMarketCIndexAdjus
velLocalDTRIndexLe
velLocalDTRIndexLe)Im(
*1+
=
−
Where: • 1−tvelUSDDTRIndexLe is the Daily Total Return index level in USD at time t-1 • tpactUSDendIndexDivid Im is the amount of dividends in USD to be reinvested in the index in USD at
time t • talpactForLocendIndexDivid Im is the amount of dividend in USD converted using FX rate as of t-1 to
be reinvested in the local currency index at time t • 1−tvelLocalDTRIndexLe the Daily Total Return index level in local currency at time t-1

9
Index Calculation Methodology
2.1.1 Dividend Impact
∑∈
−−
=
tIs t
ttdateex
t
FXrateactorInclusionFrShareDividendPerOfSharesIndexNumbe
pactUSDendIndexDivid
,
1 **Im
)***
(
Im
1, 1
1
−∈ −
−−∑
=
t
t
tIs t
ttdateex
t
ICIICI
FxrateactorInclusionFrShareDividendPerOfSharesIndexNumbe
alpactForLocendIndexDivid
Where:
• 1−−dateexrOfSharesIndexNumbe is the number of shares of the security s at the dividend ex-date-1. • trShareDividendPe is the dividend per share expressed in the same currency unit as the price per share
of the security s to be reinvested at time t.
2.1.2 DTR Index Level from Security Information (Security DTR) Another way to calculate a DTR Index would be to use the security initial weight and security total return:
∑∈
− +=tIs
ttt dexUSDbutionToInturnContritalSecurityTovelUSDDTRIndexLevelUSDDTRIndexLe,
1 )Re1(*
∑∈
− +=tIs
ttt dexLocalbutionToInturnContritalSecurityTovelLocalDTRIndexLevelLocalDTRIndexLe,
1 )Re1(*
2.1.3 Security Contribution to the Index Calculation Formulas:
ttt turnUSDilyTotalSecurityDaturityWeighInitialSecIndexUSDbutionToturnContritalSecurityTo Re*Re =
ttt turnLocalilyTotalSecurityDaturityWeighInitialSecIndexLocalbutionToturnContritalSecurityTo Re*Re = Where:
• tturnUSDilyTotalSecurityDa Re is the gross or net return in USD of security s at time t. • tturnLocalilyTotalSecurityDa Re is the gross or net return of security s at time t converted using the
FX rate as of t-1 and used for local currency calculation at time t.
10
Index Calculation Methodology
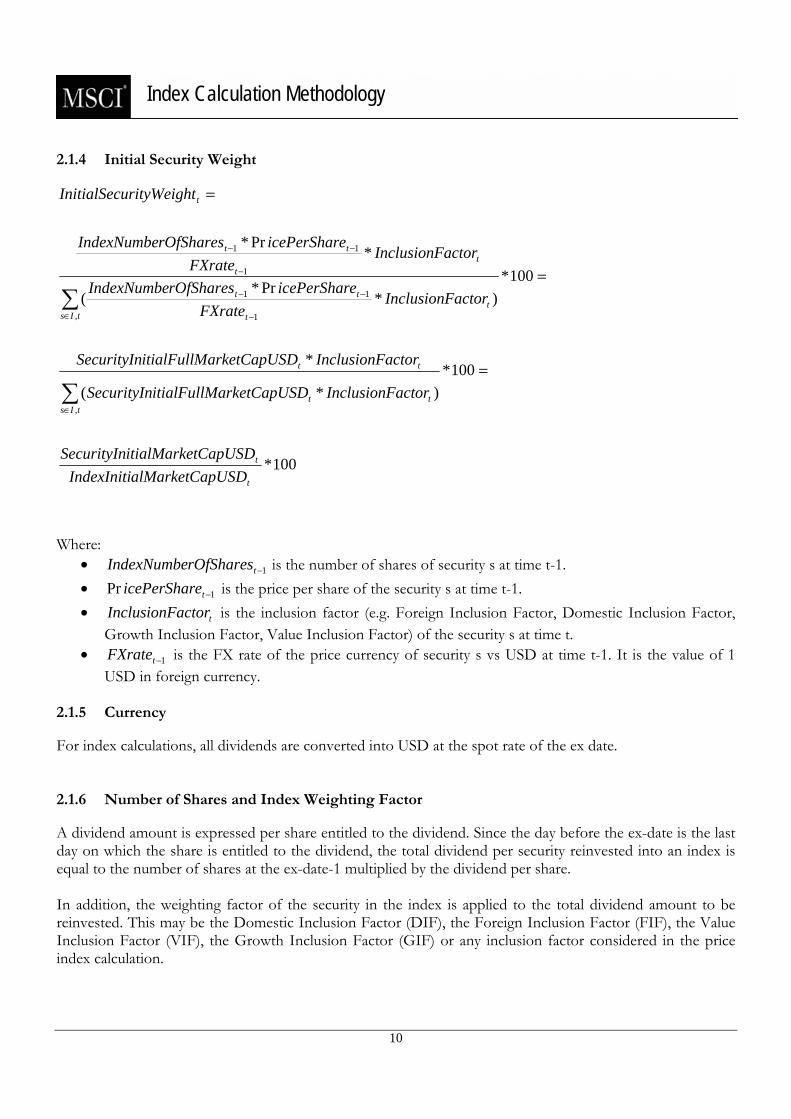
2.1.4 Initial Security Weight
100*
100*)*(
*
100*)*
Pr*(
*Pr*
,
, 1
11
1
11
t
t
tIstt
tt
tIst
t
tt
tt
tt
t
pUSDalMarketCaIndexInititCapUSDitialMarkeSecurityIn
actorInclusionFDarketCapUSitialFullMSecurityIn
actorInclusionFDarketCapUSitialFullMSecurityIn
actorInclusionFFXrate
eicePerSharrOfSharesIndexNumbe
actorInclusionFFXrate
eicePerSharrOfSharesIndexNumbe
turityWeighInitialSec
=
=
=
∑
∑
∈
∈ −
−−
−
−−
Where:
• 1−trOfSharesIndexNumbe is the number of shares of security s at time t-1. • 1Pr −teicePerShar is the price per share of the security s at time t-1. • tactorInclusionF is the inclusion factor (e.g. Foreign Inclusion Factor, Domestic Inclusion Factor,
Growth Inclusion Factor, Value Inclusion Factor) of the security s at time t. • 1−tFXrate is the FX rate of the price currency of security s vs USD at time t-1. It is the value of 1
USD in foreign currency. 2.1.5 Currency For index calculations, all dividends are converted into USD at the spot rate of the ex date. 2.1.6 Number of Shares and Index Weighting Factor A dividend amount is expressed per share entitled to the dividend. Since the day before the ex-date is the last day on which the share is entitled to the dividend, the total dividend per security reinvested into an index is equal to the number of shares at the ex-date-1 multiplied by the dividend per share. In addition, the weighting factor of the security in the index is applied to the total dividend amount to be reinvested. This may be the Domestic Inclusion Factor (DIF), the Foreign Inclusion Factor (FIF), the Value Inclusion Factor (VIF), the Growth Inclusion Factor (GIF) or any inclusion factor considered in the price index calculation.

11
Index Calculation Methodology
2.2 Reinvestment Methodology Gross Daily Total Return This series approximates the maximum possible dividend reinvestment. The amount reinvested is the dividend distributed to individuals resident in the country of the company, but does not include tax credits. Net Daily Total Return This series approximates the minimum possible dividend reinvestment. The dividend is reinvested after deduction of withholding tax, applying the maximum rate applicable to institutional investors. MSCI uses different withholding tax depending if the index series is international or domestic:
• International index series: the maximum rate applicable to non-resident institutional investors who do not benefit from double taxation treaties.
• Domestic index series: the maximum rate applicable to resident institutional investors For more information on how taxes are applicable to dividends, please refer to the Appendix for details about the withholding tax rates for the various countries. 2.2.1 Timing of re-investment The amount of an announced dividend is re-invested on the day the security is quoted ex-dividend on its principal exchange. For securities trading on more than one exchange, MSCI uses the ex-date at the exchange from which MSCI sources the security’s price. If a security does not trade on the day it is quoted ex-dividend, the re-investment is postponed to the day when the security resumes trading. 2.2.2 Re-Investment Rules There are two principal guidelines in accounting for dividends in MSCI’s DTR indices:
• A recurring standard dividend paid out of current earnings will be reinvested among all the constituents in an index. It is not considered in price indices
• A dividend that is unusually large, i.e. greater than 5% of the security cum price, or otherwise unlikely to recur on a regular basis or any dividend that is paid for with extraordinary profits is handled by applying a price adjustment factor and is hence taken into account in price indices as well as DTR indices.
These guidelines are discussed in greater detail below. 2.2.3 Dividends Resulting in a Reinvestment Only The following dividends are reinvested in the DTR Index: Regular Cash Dividend A regular cash dividend is paid out from operating profits: the company distributes a part of the current year’s operating profits to its shareholders.

12
Index Calculation Methodology
Optional Dividend The company offers shareholders the choice of receiving the dividend either in cash or in shares. For dividend reinvestment purposes, MSCI assumes that investors elect the cash option, therefore, the dividend is reinvested in the DTR indices and a price adjustment is not necessary. If some shareholders choose to take the stock option, when it is confirmed, the number of shares will be increased accordingly at the next regularly scheduled quarterly index review. Interest on Capital The ‘interest on capital’ dividend is a cash payment to shareholders accounted for as a pre-tax interest expense by the company. The balance sheet and the book value do not change. Interests on capital are common in Brazil. 2.2.4 Dividends Resulting in a Reinvestment or in a Price Adjustment The dividends below are reinvested in the DTR Index if, a day prior to the ex-date, the dividend impact on the price is less than 5%. However, if the impact is greater than 5%, the dividend will be reflected in the index through a price adjustment. Special/Extra Dividend The company declares the dividend as special or extraordinary. It is usually funded by a special event or from extraordinary profits. MSCI may consider irregular and unusually large dividends as special even if they are not declared as such by the company. Commemorative Dividend (memorial) A company declares a dividend as commemorative/memorial. The funds come from extraordinary profit or cash generated by a special event. Retroactive/Arrears Dividend Retroactive dividends are paid in Italy when a company has to pay a dividend to revenue-guaranteed (RISP) shares to make up for previous years’ non-payments. Special Dividend to Non-Domestic Shareholders A company pays its non-domestic shareholders a bonus dividend to compensate for the tax credit distributed to domestic shareholders. This is a common practice in New Zealand. Note that a special dividend is considered a regular cash dividend (‘regular special’) after being distributed for three consecutive years, and if it is proven to have been taken out of recurring operating profits.
13
Index Calculation Methodology
2.2.5 Dividends Resulting in a Price Adjustment Only A specific price adjustment is always applied to the security in the following cases: Stock Dividend (stock bonus/gratis issue) The company issues shares at no direct cost to the shareholders. The funds are taken out from the current year’s earnings. In the case of a stock bonus/gratis issue, the company distributes a part of the reserves (retained earnings from previous years) to its shareholders. Capital Repayment (return of capital) The company reduces its capital by paying shareholders a cash return, which is a portion of their original investment. It is neither a dividend nor a capital gain, and the shareholders may not have to pay income or capital gains tax. The balance sheet and the book value will decrease. Dividend Paid in Shares of another Company The company distributes stock of another company as a dividend. The number of shares held remains the same, but the price will decrease by the value of the distributed security. MSCI considers other cash payments related to Corporate Events, such as mergers, acquisitions, liquidations, etc. on a case-by-case basis.
2.3 Processing Rules 2.3.1 Dividend Data Raw dividend data is provided by multiple electronic data feeds and is checked for completeness and correctness. MSCI’s Daily Total Return process requires that dividends be confirmed by at least two distinct data sources. Most dividends are received and validated through electronic feeds, but some events may require confirmation from other sources, such as stock exchanges or the company. In addition, MSCI monitors securities for which a dividend is expected based on previous dividend announcement frequency, but which has not yet been received through the regular data sources. 2.3.2 Corporate Actions A corporate action, which changes the number of shares outstanding for a company, may take place between the dividend’s announcement date and its ex-date. As the number of shares on the day preceding the ex-date is used to calculate the dividend amount to be reinvested, MSCI will adjust the dividend to reflect the number of shares on that day. Following certain corporate events, the number of shares used in MSCI index calculations on the day prior to the ex-date may include shares that are not issued yet or that are not entitled to the dividend. In those cases, MSCI reinvests the dividend on the ex-date as if all shares included in MSCI index calculations were entitled to the dividend.

14
Index Calculation Methodology
2.3.3 Corrections A dividend that has been reinvested may need to be amended, due to an error in its ex-date, in the dividend amount, or in the dividend currency. The following rules apply: • Action is taken only if the error is discovered within 12 months of the ex date and is in line with the price
index correction policy, where MSCI applies a 12 month correction period. • In the case of a correction, MSCI will use the number of shares effective on the day prior to the ex-date.
The correction amount is reinvested on the day it is discovered. The day’s spot rate is used for currency conversion.
• A historical correction will be applied to all indices impacted by more than 50 basis points1 if the impact on a country or World / EM industry group index is over 50 basis points.
• The security that needs a dividend correction may have changed its status for index inclusion between the ex-date and the correction date. For example, this may be due to the security’s subsequent exclusion from the index, or a change in its industry or country classification. Applying the correction with the current status may reinvest dividends into the wrong index. If there is a change in the security status between the ex-date and the correction date, no correction amount will be reinvested.
2.3.4 Payment Default A correction will be applied when a dividend is declared unpaid (payment default). This may result in a negative reinvestment. Past index values (history) are not corrected. The following rules apply: • Action is taken only if the payment default is discovered within 12 months of the ex-date and is in line
with the price index correction policy, where MSCI applies a 12 month correction period. • MSCI uses the number of shares effective on the day prior to the original ex-date. • The default amount is reinvested on the day it is announced. The day’s spot rate is used for currency
conversion. 2.3.5 Late Dividends A late dividend is a dividend that is only known after its ex-date. It is processed under the correction policy. 2.3.6 Country Exceptions Korea: Late Dividend Korean companies declare their dividends after their ex-date. As no estimated dividends are available before the ex-date and no fluctuation in the price (due to the dividend) is visible on the ex-date, the dividends are reinvested on the reception date from the data sources without any correction. MSCI will use the number of shares effective on the day prior to the ex-date.
1 The 50 basis point limit is linked to the price index correction policy and will be revised accordingly to reflect any changes in this policy.

15
Index Calculation Methodology
Japan: Late Dividend Many Japanese companies declare their dividends after the ex-date. As estimated dividends are available before the ex-date and are broadly used, an estimation of the dividend is reinvested on the ex-date. When a company does not declare an estimated dividend, MSCI will use the previous year amount as the estimation. Should the difference between the estimated and ratified dividend amount warrant correction, it will be processed as a payment default (reinvestment without correcting past index levels). USA: Redemption Right When a company redeems shares distributed to shareholders due to a poison pill rights issue (applies mainly in USA), there may be a change in the company’s capital structure. In this case MSCI will apply a price adjustment. 2.3.7 Taxes Taxes are applied to dividend payments and vary depending on the company’s and shareholders’ country of domicile. Tax data is monitored on a regular basis and is updated when necessary. Tax Credit: The tax credit (voucher) can be considered as a reimbursement of tax already received by the fiscal administration. The company’s annual earnings are taxed before distribution to the shareholders, and then the shareholders pay taxes on the dividend. Some countries consider it unfair to pay taxes twice on the same income and therefore distribute a tax credit. The tax credit is excluded from both MSCI gross and net dividends. Withholding Tax The withholding tax is a tax on income at source, retained by the company when the dividend is paid to a shareholder. The withholding tax rate depends on the tax status of the shareholder. MSCI excludes the maximum withholding tax rate applicable to institutional investors from MSCI net dividends. A non-resident shareholder must also pay taxes on dividends in their domestic country, together with their income taxes. To avoid this double taxation, countries may sign ‘bi-lateral’ double taxation treaties.. In the calculation of the net DTR MSCI international index series, MSCI uses the withholding tax rate applicable to foreign non-resident institutional investors that do not benefit from double taxation treaties. In the calculation of the net DTR MSCI domestic index series, MSCI used the withholding tax rate applicable to domestic resident institutional investors Corporate Tax Credit A corporate tax credit is a domestic tax applicable to the dividends of the company. In Malaysia and Singapore it is a tax paid by the company and not by the shareholders. This tax is excluded from both gross and net dividends.

16
Index Calculation Methodology
Anticipated Tax An anticipated tax is retained when the dividend is paid to shareholders. This tax is reimbursed when domestic shareholders pay taxes on their annual income. Foreign investors may be able to reclaim part of the tax, depending on the specific terms of the applicable double taxation treaty. Anticipated tax is not a tax credit, and it is included in both MSCI gross and net dividends. 2.3.8 Definitions • Announcement date - the date on which the company announces its next dividend payment. • Reception date - the date on which the information about the dividend is received by MSCI from its
data sources. • Record date - the date on which an individual must own shares (be the holder of record) in order to
receive a declared dividend or capital gains distribution. • Ex-date - the first day on which, if an investor buys the security, the security no longer carries the right
to the declared dividend.

17
Index Calculation Methodology
Section 3: Alternative Index Calculations
3.1 Gross Domestic Product (GDP) Weighted Indices
The MSCI GDP Index Series offers an alternative to market capitalization-weighted indices for global and regional asset allocation purposes. In the MSCI GDP Index Series, country weights are based on the size of the country’s economy rather than the size of its equity market. While equity markets can have performance-related peaks and troughs, GDP figures are more stable over time. The MSCI GDP Index Series includes the MSCI GDP ACWI, World, EAFE, Europe, EMU and EM Indices.
Annual Index Review and Country Weights The MSCI GDP Index Series is rebalanced annually in May. The rebalancing date has been changed in 2002 to May from June to coincide with the annual full index review of the MSCI Standard Index Series.
The country weights of the MSCI GDP Index Series are reset every year on the basis of the previous year’s GDP figures. Afterwards, the country weights fluctuate with changes in performance and market capitalization in the MSCI Standard Country Indices until the next rebalancing.
The primary sources for GDP data are the Organization for Economic Cooperation and Development (OECD), the International Monetary Fund (IMF) and other various government organizations. In some cases, GDP estimates may be used if final figures are not available at the time of the rebalancing. MSCI uses GDP figures for the calculation of the GDP weighted indices.
GDP figures provided by the OECD are in USD at current prices and current exchanges rates. IMF GDP figures are provided in local currency and converted in USD at the period average market rate. For GDP figures in local currency provided by other sources, MSCI applies an average of the previous year’s daily exchange rates to calculate the USD-equivalent GDP figures.
For the Emerging Markets (EM) GDP Index as well as All Country World Index (ACWI) GDP Index, MSCI provides historical index levels back to June 30, 2000. Prior historical index levels for these indices are only available on a custom basis. Changes in country indices within EM and ACWI or migrations from Emerging to Developed Market indices are implemented to coincide with the Annual GDP Index Review. As such, as of the close of June 29, 2001, MSCI Egypt and Morocco were added to the EM and ACWI GDP indices whilst MSCI Sri Lanka was removed. Simultaneously, MSCI Greece migrated from the Emerging to the Developed Markets GDP indices.
As a reminder, Developed Markets (DM) GDP Indices, such as The World Index, EAFE and Europe have a price index level history available since December 31, 1969 on a monthly basis, and since December 31, 1987 on a daily basis, whereas EMU’s entire index level history goes back to June 30, 1998. In addition to the country migrations mentioned above, the most recent country level changes include the inclusion of MSCI Portugal into the Developed Markets GDP indices as of the close of June 30, 1998, and the removal of MSCI Malaysia as of the close of September 30, 1998.

18
Index Calculation Methodology
Security level Weights The weight of a security in the GDP Index Series is determined by multiplying the weight of the security in the MSCI Standard Country Index by the current weight of the country in the regional MSCI GDP Index.
SW GDP = SW STD * CW GDP_CUR
Where: SW GDP security weight in the regional MSCI GDP Index SW STD security weight in the MSCI Standard Country Index CW GDP_CUR current country weight in the regional MSCI GDP Index Current country weight:
(CountryGDPINI * McapCountry CUR/McapCountry INI)
SUM (CountryGDPINI * McapCountry CUR/McapCountry INI)
Where: CW GDP_INI initial country weight in the regional MSCI GDP Index at the last rebalancing McapCountry CUR current country market capitalization in the MSCI Standard Index McapCountry INI initial country market capitalization at the last rebalancing in the MSCI Standard Index 3.2 Daily Hedged Indices 3.2.1 Overview MSCI calculates currency hedged indices for each developed market country as well as several emerging markets (on a custom basis) and for developed markets regional indices, including MSCI EAFE®. Daily hedged indices represent a close estimation of the return that can be achieved by hedging the currency exposures of the index in the one-month forward market at each end of day. The MSCI Hedged Indices integrate the hedging of each currency in the index for one month against the base currency by selling the base currency at the one-month Forward rate. The amount of Forwards sold represents the value (or the market capitalization) of the index as of the close of the last trading day of the month, i.e. reflecting changes in the composition of the index implemented as of the close of that day. This approach is designed to replicate the hedging process of portfolio managers who typically sell Forwards for an amount corresponding to the value of their portfolio as of the close of the last trading day of the month. After one month, a similar transaction is then set up for an amount representing the new month-end value of the index. No adjustment to the hedge is done during the month to account for changes in the indices due to price movement of securities, corporate events, addition, deletions or any other changes. In other words the amount hedged – equal to the value of the index as of the close of the last trading day of the month – is kept constant over the whole month. This simple approach replicates the hedging process in place in many actual portfolios. The Spot and 1-month Forward exchange rates used are those published by WM/Reuters at 4:00 p.m. London time. Before May 2002, the MSCI Hedged Indices were computed on a monthly basis. The daily indices have been back-calculated to the end of December 2001, using the daily hedged methodology described below.
CW GDP_CUR =

19
Index Calculation Methodology
3.2.2 Daily Hedged Indices based on 1-Month Forwards Marking to market the Forward contract on a daily basis After consulting with investors, MSCI has come to the conclusion that the most appropriate approach to compute daily hedged indices is to derive them from the current monthly hedged indices by marking to market the Forwards on a daily basis. This is based on the consideration that MSCI’s current approach which uses a monthly hedging is well accepted, as it replicates the process that investors most commonly use to hedge their portfolios. This means that daily hedged indices need to be based on a daily evaluation of the existing monthly hedged indices. This can be calculated by marking to market the 1-month Forward on a daily basis. A relatively precise way of marking the Forward to market is to use an equal and offsetting Forward position. For instance, after 8 days, the Forward would be marked to market using a 22-days offsetting Forward in the case of a month when the last business day of the month is the 30th (i.e. 30 – 8 = 22). This approach is more precise than an alternative that would use the Spot exchange rate to mark to market the Forward, as it takes into account the interest rate differential between the hedged currency and the base currency for the remaining part of the month. MSCI has implemented this more exact approach. Pricing the Offsetting Forward In theory the value of the offsetting Forward could either be obtained from the market or calculated with a linear interpolation. However, typically, only a limited number of standard duration of Forwards is available in the market. These rates are called “tenors”, and represent one day, one week, one month, etc. This means that other durations for Forwards (called odd-days Forwards) are generally not available but must be calculated by interpolation. For the sake of simplicity, MSCI uses a linear interpolation based solely on the 1-month Forwards to estimate the value of odd-days Forwards every day during the whole month. Odd-days Forwards are computed simply as the Spot rate plus the premium or discount between the Spot and the 1-month Forward, pro rated for the number of days until the last business day of the month. Missing Forward Rates If the Forward rate is missing on a given day, the previous day’s premium or discount of the Forward rate over the Spot rate will be added to the current Spot exchange rate. If there is a disruption in the Forward market, MSCI will analyze the situation and a decision to continue or discontinue the computation of the hedged indices will be made on a case by case basis. 3.2.3 Calculation of Odd-Days Forwards Using a Linear Interpolation MSCI use a linear interpolation formula to compute odd-days forwards. The general formula is as follows:
( ) ⎟⎟⎠
⎞⎜⎜⎝
⎛ −−+= −− gMonthrDaysDurinrOfCalendaTotalNumbe
daysOddFXRateFFRateFXRateFFRate t
tmonthtttdaysodd *)1(
To compute a linear interpolation, the following process is used, using as an example data as of February 12, 2002: a) Check if today is the last business day of the month, in which case, the Spot exchange rate is used and there is no need to compute a linear interpolation.

20
Index Calculation Methodology
b) Obtain the date of the last business day of the month, in our example February 28, 2002. c) Obtain the 1-month Forward rate as of today, i.e. February 12, 2002, for example 1.5915 CAD / USD. This Forward settles in one month. d) Compute the price difference between the Spot and the 1-month Forward, as of today, February 12, 2002, called the premium (or discount). In this example, the Spot is at 1.5912, so the premium is 0.0003. e) Using a linear interpolation, compute the value, as of today, February 12, 2002, of a Forward with a duration equal to the number of days until the last business day of the month. In our example, the last business day of the month is the 28th, so the duration of the Forward is 28-12 = 16 days. The value of a 16 day Forward is estimated as the Spot rate plus the premium pro rated for the period. The total number of days taken into account is the number of days in the month, in our example 28, as there are 28 days in February 2002. Interpolated value of a Forward for 16 days = 1.5912 + 0.0003*(16 / 28) = 1.5912 + 0.00017 = 1.59137 3.2.4 Daily Hedged Index Calculation Formula There are three components to a security’s hedged returns: 1. The performance of the unhedged security in the hedged currency (for example U.S. dollars) 2. The cost to hedge on the Forward contract 3. The gain or loss on the Spot exchange rate The hedge impact, expressed in percent, is calculated as the difference between the cost to hedge on the Forward contract and the actual gain or loss on the Spot exchange rate. That is:
Percent Hedge Impact Securityi = ⎥⎥⎦
⎤
⎢⎢⎣
⎡−⎥
⎦
⎤⎢⎣
⎡
− tdayodd
M
M
M
FFRateFXRate
FFRateFXRate 1
1
1
Where FXRate M1= Spot FX Rate (currency/USD) at the close of previous month FFRate M1= Forward exchange rate (currency/USD) at the close of previous month FFRate odd-dayt= Interpolated odd-days Forward Rate (currency/USD) The total impact of the hedge for the index is computed as:
Hedge Impact Index =∑=
N
iiWeight
1* Hedge Impact Securityi
The hedged performance is the combination of the unhedged performance and the percent hedged impact. If IndexM1 and Indexodd-dayst denote the unhedged index levels in USD at the close of the previous month and at the odd-dayst, respectively, then:
Cost to hedge on the fwd contract
Estimated gain or loss when marking to market

21
Index Calculation Methodology
Performance of Hedged Index at the end of the month = 11
−⎥⎦
⎤⎢⎣
⎡ −
M
daysodd
IndexIndex
t + Hedge Impact
If all securities in the index trade in the same currency, the hedge impact is the same for all securities and the formula can be simplified to:
Estimation of the performance of the monthly Hedged Index after t days =
⎥⎥⎦
⎤
⎢⎢⎣
⎡−⎥
⎦
⎤⎢⎣
⎡+−⎥
⎦
⎤⎢⎣
⎡
−
−
t
t
dayodd
M
M
M
M
daysodd
FFRateFXRate
FFRateFXRate
IndexIndex
1
1
1
1
1
3.2.5 Daily Hedged Index Example This example is similar to the example for the monthly Hedged Indices, except that we have, after 8 days, the following figures (numbers are not real figures). All securities trade in the same currency and the simplified formula can again be used in this example. The Forward rate is the same, as we still use a 1-month Forward to hedge. Spot and Forward Rates Index Levels in USD FXRate 1= 8.439200 Kroner/USD Index 1 =100 FFRate 1= 8.436850 Kroner/USD Index days 8 =94.54 FFRate duration days 22 = 8.900000 Kroner/USD Index Hedged 1 = 100 Estimated Percent Hedged Impact = [8.439200/8.436850 – 8.439200/8.90000] = 5.205% Performance of Hedged Index = 94.54/100 + [8.439200/8.436850 – 8.439200/8.90000] – 1= -0.255% Estimated Hedged Index 1w = 100 * (1-0.00255) = 99.745 After 8 days, investors can estimate that the return on their investment is –0.255% by marking it to market, but this is only an interim estimation after 8 days, while the Forward still has 22 days to go. As has been shown above, the realized return at the end of the month is –0.337%.

22
Index Calculation Methodology
Appendix I: MSCI GCC Country Indices: Saturday/Sunday Index Calculation Calculation Methodology Available in MSCI products starting June 12, 2006. The MSCI Gulf Cooperation Council (GCC) Country Indices and the MSCI Arabian Markets Indices are calculated on Saturdays and Sundays to reflect the performance of the markets open on these days. In order to preserve compatibility with the other MSCI International indices, which are calculated from Monday to Friday, MSCI will use the concept of a Monday pre-opening (intermediate) calculation for the Saturday and Sunday calculation. The Saturday and Sunday index performances capture the price changes and reflect corporate events2 effective on these days. The index constituent list is the same as the one to be used for the Monday calculation. WM/Reuters spot FX rates as of the previous Friday will be carried forward to the Saturday and Sunday in order to perform the index calculation in USD. No dividends are reinvested on Saturdays or Sundays. Consequently, the Daily Total Return (DTR) index performances for these 2 days are equal to the ones of the price index. The chain-linking for these index series can be summarized as follows:
• Saturday’s daily index performance is computed by comparing Saturday’s adjusted prices and the previous Friday’s unadjusted prices
• Sunday’s daily index performance is computed by comparing Sunday’s adjusted prices and the previous Friday’s unadjusted prices
• Monday’s daily index performance is computed, as currently, by comparing Monday’s adjusted prices and the previous Friday’s unadjusted prices
Initial Weights Constituents
Monday
Friday calculation
Monday calculation
Saturday calculation
Sunday calculation
Thursday Friday Saturday Sunday
2 In case of a corporate event occurring on a Saturday, a Price Adjustments Factor (PAF) will be applied to the security market capitalizations on Saturday, Sunday and Monday. In case of a corporate event occurring on a Sunday, a PAF will be applied to the security market capitalization on Sunday and Monday.

23
Index Calculation Methodology
Index Calculation Formulas
( )( )∑
∑
∈
∈
=
MondayIsMondaySundaySaturday
MondayIsMondaySundaySaturday
Friday
SundaySaturday
actorInclusionFDarketCapUSitialFullMSecurityIn
actorInclusionForLocalMarketCapFjustedFullSecurityAdLocalIndexLevel
LocalIndexLevel
,/
,/
/
*
**
( )( )∑
∑
∈
∈
=
MondayIsMondaySundaySaturday
MondayIsMondaySundaySaturday
Friday
SundaySaturday
actorInclusionFDarketCapUSitialFullMSecurityIn
actorInclusionFSDMarketCapUjustedFullSecurityAdUSDIndexLevel
USDIndexLevel
,/
,/
/
*
**
Where:
• MondayactorInclusionF is the inclusion factor (e.g. Foreign Inclusion Factor, Domestic Inclusion Factor, Growth Inclusion Factor, Value Inclusion Factor) of the security s as of the following Monday.
The Security Full Market Caps are calculated as follows:
Friday
Friday
MondaySundaySaturdaySundaySaturdayFriday
SundaySaturday
FXrateICIICI
PAFeicePerSharrOfSharesIndexNumbe
orLocalMarketCapFjustedFullSecurityAd
**Pr* //
/ =
SundaySaturday
SundaySaturdaySundaySaturdayFriday
SundaySaturday
FXratePAFeicePerSharrOfSharesIndexNumbe
SDMarketCapUjustedFullSecurityAd
/
//
/
*Pr*
=
Friday
FridayFriday
SundaySaturday
FXrateeicePerSharrOfSharesIndexNumbe
DarketCapUSitialFullMSecurityInPr*
/ =
Where:
• FridayrOfSharesIndexNumbe is the number of shares of security s as of the previous Friday. • SundaySaturdayeicePerShar /Pr is the price per share of the security s as of Saturday or Sunday.

24
Index Calculation Methodology
• FridayeicePerSharPr is the price per share of security s as of the previous Friday. • SundaySaturdayPAF / is the Price Adjustment Factor of the security s as of Saturday or Sunday. • SundaySaturdayFXrate / is the FX rate of the price currency of security s vs USD as of Saturday or
Sunday. It is the value of 1 USD in foreign currency. • FridayFXrate is the FX rate of the price currency of security s vs USD as of the previous Friday. It is
the value of 1 USD in foreign currency. • MondayICI is the Internal Currency Index of price currency as of Monday. The ICI is different than 1
when a country changes the internal value of its currency (e.g. from Turkish Lira to New Turkish Lira – ICI = 1,000,000).
• FridayICI is the Internal Currency Index of price currency as of previous Friday.
Appendix II: Exchange Rates
Closing Spot Rates Until December 30, 1993, MSCI used the exchange rates taken from the Reuters multi contributor pages at 4.00p.m. CET. Since December 31st, 1993, MSCI has been using the WM/Reuters Closing Spot Rates, taken at 4pm London time, for all the countries for which it provides indices, except for the Latin American countries. At the time, MSCI established a special foreign exchange policy for Latin American countries in view of the risks of important movement of currencies in some of these markets between the 4pm London closing and the close of the respective Latin American markets. Starting July 26, 2000, MSCI began to use the WM/Reuters Closing Spot Rates for all the countries it provides indices including Latin American countries. MSCI independently monitors the exchange rates on all its index series. MSCI may under exceptional circumstances elect to use alternative sources of exchange rates if the WM/Reuters rates are not available, or if MSCI determines that the WM/Reuters rates are not reflective of market circumstances for a given currency on a particular day. Forward Rates MSCI uses the spot and 1-month premium/discount as provided by WM/Reuters to compute the 1-month Forward exchange rates. These values are taken at 4pm London time.

25
Index Calculation Methodology
Appendix III: Singapore & Malaysia - A History of Inclusion in the MSCI Emerging and Developed Markets Indices Stock Markets Stock trading has a long history in Singapore dating back to the 1930’s. In 1960 the Malayan Stock Exchange started trading shares publicly. There were trading floors in both Singapore and Kuala Lumpur linked as a single market. When Singapore split from Malaysia the stock exchange continued to operate as one under the name Stock Exchange of Malaysia and Singapore (SEMS). In 1973 the accord that allowed for the convertibility at par between the Singapore Dollar and Malaysian Ringgit was terminated. This led to the separation of SEMS into the Kuala Lumpur Stock Exchange (KLSE) and the Stock Exchange of Singapore (SES). Malaysian companies continued to trade heavily in Singapore. MSCI Indices On December 1st 1972, the MSCI Singapore/Malaysia Index was added to the World Index. The index was developed in cooperation with the Overseas-Chinese Banking Corporation, which published the same index under the name O.C.B.C. Index. As is the case with other MSCI indices the purpose was to track those securities representative of Singapore. However as approximately half the market capitalization and liquidity of the SES was due to Malaysian shares the index was designed to incorporate both Singaporean companies as well as those Malaysian shares that traded in Singapore. This aspect was different from other MSCI indices, as the norm is to only include domestically listed shares. In light of the long integrated history of the Malay Peninsula and Singapore, and the continued dual listing of shares, it was deemed to be more representative to include these Malaysian companies as representative of the opportunity set of the SES. MSCI launched its emerging market series on January 1, 1988. Among other country indices was an index of Malaysia with 59 securities. As MSCI was now covering emerging markets the MSCI Mexico index was pulled out of MSCI World. The World Index was to be considered a developed market index. In 1989 the Malaysian government announced that Malaysian companies would be asked to delist their shares from the SES. Previously the government had prohibited newly listed shares of Malaysian companies from listing on the SES. In November 1989, reacting to the Malaysian government announcement, MSCI initially announced its intention to remove Malaysian securities from the Singapore/Malaysia index. The following month MSCI announced that the terms and timing of the Malaysian delisting were too ambiguous. As a result MSCI would take a wait and see approach prior to removing any Malaysian securities from the Singapore/Malaysia index. As a result the Malaysian shares in the MSCI Singapore/Malaysia Index were effectively frozen or grandfathered. Over time, some of these shares were no longer listed on Singapore but continued to be included in the index using the Ringgit price at which they were traded in Kuala Lumpur. In January 1992 MSCI announced a change. The Singapore/Malaysia Index was now composed of a representative sampling of Singaporean companies coupled with grandfathered Malaysian securities that used to trade in Singapore but were no longer trading there as a result of the delisting requirement. Malaysia was clearly an emerging market, for example its GDP per capita was $2,340 considerably below that of Spain ($10,920), the lowest country that was currently in the MSCI World Index. Nonetheless many developed market investors had historically purchased Malaysian companies as a result of some Malaysian companies being included in the MSCI World and EAFE Indices. Deleting all Malaysian companies from the developed market indices could have been very disruptive to the markets. As a result of this dilemma MSCI decided to

26
Index Calculation Methodology
add Malaysia as a country to the World and related developed market indices while continuing to include Malaysia in the emerging market series. One could not have a credible emerging market series without the continued inclusion of Malaysia in that series. Thus Malaysia was to be represented in both the developed and emerging market series. At the time MSCI acknowledged that the existence of Malaysia in both the developed and emerging market series was less than ideal. As of April 30th 1993 Malaysia was fully added to the developed market series, resulting in the addition of approximately 40 securities. This was because the MSCI Malaysia index was designed to represent the profile of the entire Malaysian market whereas the current Malaysian stocks in the World and EAFE Indices were selected to reflect the composition of those Malaysian stocks trading in Singapore. ACWI clients would not have to worry about double counting as Malaysia was represented at its appropriate market cap weight. The index of Singapore represented the continuation of the Singapore/Malaysia Index and therefore retains its base date of December 31, 1969. Developed and emerging market indices excluding Malaysia were calculated for those clients who preferred a different classification. The Asian Crisis The “Asian Crisis”, starting in 1997 with the devaluation of the Thai Baht eventually spread to Malaysia. On September 1st 1998 Malaysia imposed a series of restrictions on the convertibility of the Ringgit. These controls effectively prohibited the repatriation of funds. On Sept 4th, 1998 MSCI announced that effective Sept 30th Malaysia would be removed from the EAFE and World Indices and that its status in EMF was under review. In the MSCI announcement of the change it was stated “…the limitations in repatriating investment proceeds would seriously challenge the objective and integrity of the MSCI Developed Markets indices, were the Malaysian securities to remain in these indices.” These restrictions imposed by the government of Malaysia thus ended the legacy issue of Malaysian securities appearing in both the developed and emerging market series. On Sept 28th, 1998 MSCI announced that Malaysia would be removed from the MSCI EMF and ACWI Free series as of the close of November 30th, 1998. As part of the capital controls imposed, foreign investors became obligated to hold Malaysian securities for a period of one-year commencing Sept 1st, 1998, before any possible capital repatriation. The authorities also imposed a fixed exchange rate of 3.8 Ringgit to the US dollar. The measures taken by the government along with the lack of transparency meant that Malaysia’s inclusion in the Free series of indices was no longer justified. A discount of 30% was applied to the valuation of the MSCI Malaysia Index in US dollars, effective Sept 30th, 1998. The discount was applied because market forces no longer determined the official exchange rate. On February 5th, 1999 MSCI announced that effective February 26th, 1999 the discount would be reduced to 15%. This followed the Malaysian Government announcement on the previous day that it was alleviating the restrictions on the repatriation of investments. As a result of the removal of the restrictions on the repatriation of capital, MSCI announced on August 12, 1999, the removal of the 15% discount effective August 30, 1999. On November 23, 1999, MSCI announced that Malaysia would be re-included fully at 100% in the EMF and All Country Free index series of indices as of May 31, 2000. MSCI Malaysia indices will be removed from the MSCI Emerging Markets Free (EMF) series and the MSCI All Country (AC) Free Indices effective as of the close of 30th November, 1998 Of course Malaysia was not

27
Index Calculation Methodology
readmitted to the developed market series, as its inclusion there was a result of the previously explained anomaly. Quick Facts Malaysia was part of the Developed Market indices: • From December 1, 1972 to May 2, 1993, MSCI calculated a combined index, the Singapore/Malaysia
index - due to the history of Malaysian securities trading in Singapore. • From May 3, 1993 up to the close of Sep 30, 1998, Malaysia was part of DM as an individual country
(separated from Singapore). Malaysia has been part of the Emerging Market indices from 1987 to present: • With a discount of 30% from Sep 30, 1998 to Feb 25, 1999 • With a discount of 15% from Feb 26, 1999 to Aug 29, 1999 • With no discount since Aug 30, 1999 Malaysia has been part of the EMF index: • From 1987 to Nov 30, 1998 • And since June 1, 2000

28
Index Calculation Methodology
Appendix IV: Withholding Tax Rates
Code Name ISO Name Foreign Domestic
AR ARGENTINA ARS ARGENTINE PESO 0AT AUSTRIA EUR EURO 25AU AUSTRALIA AUD AUSTRALIAN DOLLAR 30BE BELGIUM EUR EURO 25BR BRAZIL (2) BRL BRAZILIAN REAL 0CA CANADA CAD CANADIAN DOLLAR 25CH SWITZERLAND CHF SWISS FRANC 35CL CHILE CLP CHILEAN PESO 21.69CN CHINA CNY YUAN RENMINBI 0 10CO COLOMBIA COP COLOMBIAN PESO 7CZ CZECH REPUBLIC CZK CZECH KORUNA 15DE GERMANY EUR EURO 21.1DK DENMARK DKK DANISH KRONE 28EG EGYPT EGP EGYPTIAN POUND 0ES SPAIN EUR EURO 15FI FINLAND EUR EURO 28FR FRANCE EUR EURO 25GB UNITED KINGDOM GBP POUND STERLING 0GR GREECE EUR EURO 0HK HONG KONG HKD HONG KONG DOLLAR 0HU HUNGARY HUF FORINT 0ID INDONESIA IDR RUPIAH 20IE IRELAND EUR EURO 20IL ISRAEL ILS NEW ISRAELI SHEQEL 20IN INDIA INR INDIAN RUPEE 0IT ITALY (3) EUR EURO 27JO JORDAN JOD JORDANIAN DINAR 0JP JAPAN JPY YEN 7 10KR KOREA KRW WON 27.5LK SRI LANKA LKR SRI LANKA RUPEE 10MA MOROCCO MAD MOROCCAN DIRHAM 10MX MEXICO MXN MEXICAN NUEVO PESO 0MY MALAYSIA MYR MALAYSIAN RINGGIT 0NL NETHERLANDS EUR EURO 25NO NORWAY NOK NORWEGIAN KRONE 25NZ NEW ZEALAND NZD NEW ZEALAND DOLLAR 15KW KUWAIT KWD KUWAITI DINAR 0 0OM OMAN OMR RIAL OMANI 0 0QA QATAR QAR QATARI RIAL 0 0SA SAUDI ARABIA SAR SAUDI RIYAL 5 0AE UNITED ARAB EMIRATES AED UAE DIRHAM 0 0BH BAHRAIN BHD BAHRAINI DINAR 0 0PE PERU PEN NUEVO SOL 4.1PH PHILIPPINES PHP PHILIPPINE PESO 35PK PAKISTAN PKR PAKISTAN RUPEE 10PL POLAND PLN ZLOTY 19PT PORTUGAL EUR EURO 20RU RUSSIA RUB RUSSIAN RUBLE 15SE SWEDEN SEK SWEDISH KRONA 30SG SINGAPORE (4) SGD SINGAPORE DOLLAR 0TH THAILAND THB BAHT 10TR TURKEY TRY NEW TURKISH LIRA 10TW TAIWAN TWD NEW TAIWAN DOLLAR 20US USA (5) USD US DOLLAR 30 30VE VENEZUELA VEB BOLIVAR 0ZA SOUTH AFRICA ZAR RAND 0
1 Used in the calculation of the MSCI net total return series. Withholding tax rates used are the maximum rates applicable to institutional investors.Foreign rates, used in the international index series, are applicable to non-resident who do not benefit from double taxation treaties. Domestic rates are used in the MSCI domestic index series2 Interest on capital is subject to a 15% withholding tax3 Dividends on Saving shares are subject to a 12.5% withholding tax4 Dividends on Real Estate Investment Trusts (REITS) are subject to a 10% withholding tax5 Exceptionally, US domestic net DTR indices are calculated using the international withholding tax rate of 30%. The domestic withholding tax rate for US is 0%
COUNTRY Withholding Tax Rates (%)1CURRENCY
29
Index Calculation Methodology
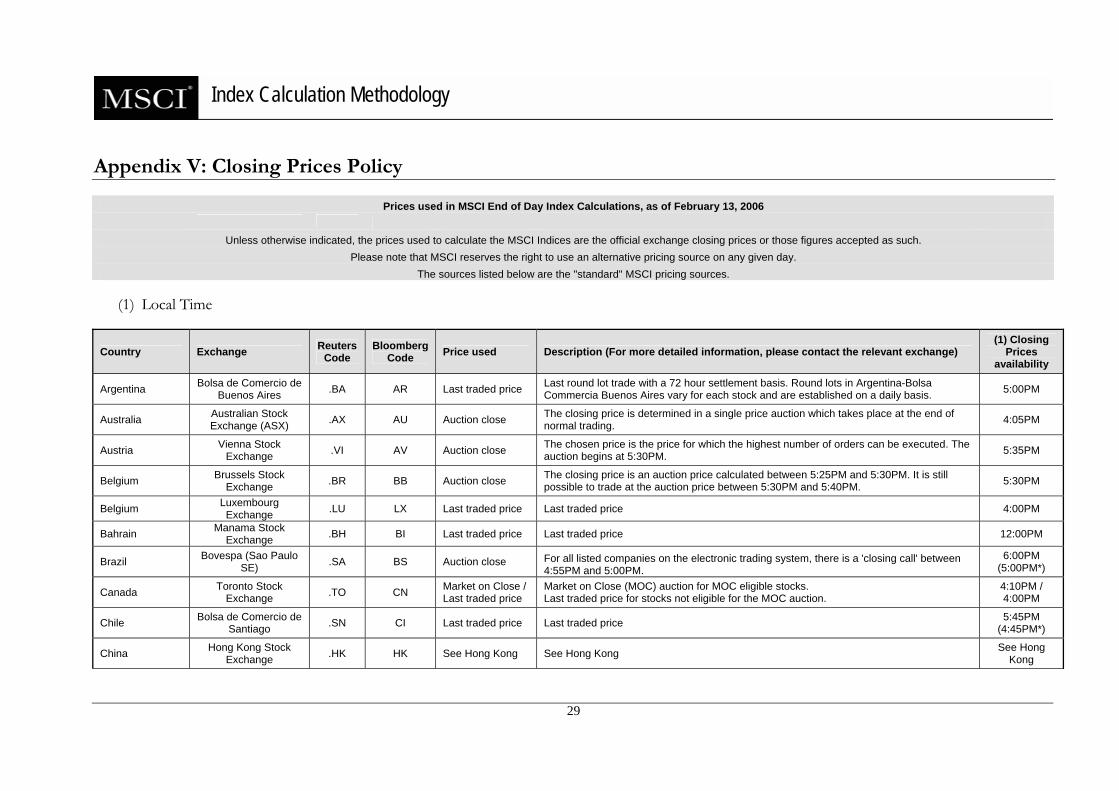
Appendix V: Closing Prices Policy
Prices used in MSCI End of Day Index Calculations, as of February 13, 2006
Unless otherwise indicated, the prices used to calculate the MSCI Indices are the official exchange closing prices or those figures accepted as such. Please note that MSCI reserves the right to use an alternative pricing source on any given day.
The sources listed below are the "standard" MSCI pricing sources. (1) Local Time
Country Exchange Reuters Code
Bloomberg Code Price used Description (For more detailed information, please contact the relevant exchange)
(1) Closing Prices
availability
Argentina Bolsa de Comercio de Buenos Aires .BA AR Last traded price Last round lot trade with a 72 hour settlement basis. Round lots in Argentina-Bolsa
Commercia Buenos Aires vary for each stock and are established on a daily basis. 5:00PM
Australia Australian Stock Exchange (ASX) .AX AU Auction close The closing price is determined in a single price auction which takes place at the end of
normal trading. 4:05PM
Austria Vienna Stock Exchange .VI AV Auction close The chosen price is the price for which the highest number of orders can be executed. The
auction begins at 5:30PM. 5:35PM
Belgium Brussels Stock Exchange .BR BB Auction close The closing price is an auction price calculated between 5:25PM and 5:30PM. It is still
possible to trade at the auction price between 5:30PM and 5:40PM. 5:30PM
Belgium Luxembourg Exchange .LU LX Last traded price Last traded price 4:00PM
Bahrain Manama Stock Exchange .BH BI Last traded price Last traded price 12:00PM
Brazil Bovespa (Sao Paulo SE) .SA BS Auction close For all listed companies on the electronic trading system, there is a 'closing call' between
4:55PM and 5:00PM. 6:00PM
(5:00PM*)
Canada Toronto Stock Exchange .TO CN Market on Close /
Last traded price Market on Close (MOC) auction for MOC eligible stocks. Last traded price for stocks not eligible for the MOC auction.
4:10PM / 4:00PM
Chile Bolsa de Comercio de Santiago .SN CI Last traded price Last traded price 5:45PM
(4:45PM*)
China Hong Kong Stock Exchange .HK HK See Hong Kong See Hong Kong See Hong
Kong

30
Index Calculation Methodology
Country Exchange Reuters Code
Bloomberg Code Price used Description (For more detailed information, please contact the relevant exchange)
(1) Closing Prices
availability
China Shanghai Stock Exchange .SS CG VWAP
Volume Weighted Average Price of all trades conducted in the last minute of trading prior to the close (including the last trade). If there is no concluded transaction on that day, the previous closing price is used as the day's closing price.
4:05PM
China Shenzhen Stock Exchange .SZ CS VWAP
Volume Weighted Average Price of all trades conducted in the last minute of trading prior to the close (including the last trade). If there is no concluded transaction on that day, the previous closing price is used as the day's closing price.
4:05PM
China NYSE .N UN See USA (NYSE) See USA (NYSE) See USA (NYSE)
Colombia Bolsa de Valores de Colombia .CN CB Last traded price
The closing price is the price of the last transaction which meets a number of shares threshold between 9:30AM and 12:00PM (11:30AM at the end of the month). The exchange defines the threshold based on price ranges.
1:00PM (12:00PM*) /
12:30AM (11.30PM*)
Czech Republic Prague Stock Exchange .PR CP Last traded price
For SPAD trading, closing price is defined as the middle of the high limit and low limit at the end of open phase trading at 4:00PM (local time). For continuous trading (AOS), the closing price is defined as the last traded price. Trading ends at 4:00PM local time, but the Official Closing Price is published at 5:00PM (local time).
5:00PM
Denmark Copenhagen Stock Exchange .CO DC Auction close
The closing call auction will begin when the trading session ends at 4:50PM. It will run until 5:00PM. The closing price will be generated in the closing call auction. If no trades are executed during the closing call auction, the closing price will correspond to the last transaction.
5:00PM
Egypt Cairo Stock Exchange .CA EY VWAP
The closing price of a security traded on CASE (Cairo Stock Exchange) is the Volume Weighted Average Price which is equal to the total value traded of the security divided by the total volume traded of the same security, provided that the security trades at least 100 shares in the daily trading session. In case the security trades less than 100 shares, the previous day's closing price is considered to be the official closing price.
3:30PM
Finland Helsinki Stock Exchange .HE FH Auction close
As of Sep 27 2004, the official closing price is the result of the closing call which occurs during the last 10 minutes of trading. If no trades are matched in the closing call then the last trade prior to the auction will be defined as the closing price.
6:30PM
France Paris Stock Exchange .PA FP Auction close The closing price is an auction price calculated between 5:25PM and 5:30PM. It is still possible to trade at the auction price between 5:30PM and 5:40PM. 5:30PM
Germany (XETRA) XETRA Exchange .DE GY Auction close The Auction price is defined during the auction that closes the trading session. The chosen
price is the price for which the highest number of orders can be executed. 5:30PM
31
Index Calculation Methodology
Country Exchange Reuters Code
Bloomberg Code Price used Description (For more detailed information, please contact the relevant exchange)
(1) Closing Prices
availability
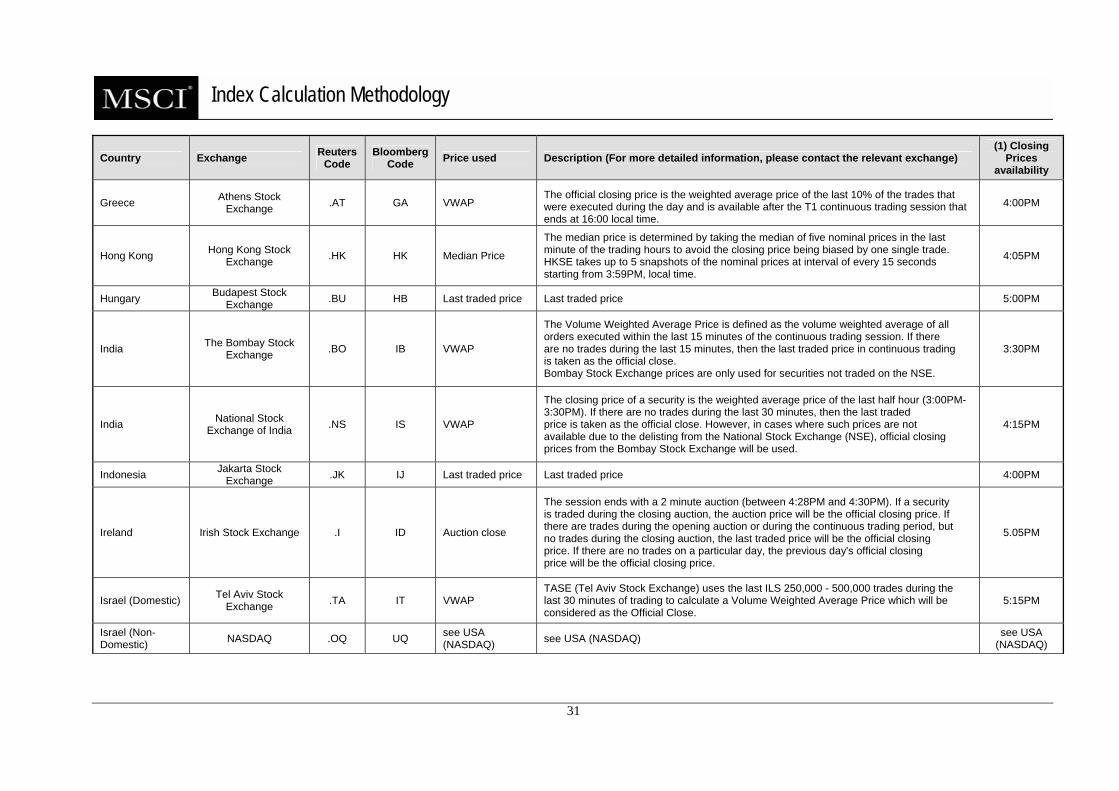
Greece Athens Stock Exchange .AT GA VWAP
The official closing price is the weighted average price of the last 10% of the trades that were executed during the day and is available after the T1 continuous trading session that ends at 16:00 local time.
4:00PM
Hong Kong Hong Kong Stock Exchange .HK HK Median Price
The median price is determined by taking the median of five nominal prices in the last minute of the trading hours to avoid the closing price being biased by one single trade. HKSE takes up to 5 snapshots of the nominal prices at interval of every 15 seconds starting from 3:59PM, local time.
4:05PM
Hungary Budapest Stock Exchange .BU HB Last traded price Last traded price 5:00PM
India The Bombay Stock Exchange .BO IB VWAP
The Volume Weighted Average Price is defined as the volume weighted average of all orders executed within the last 15 minutes of the continuous trading session. If there are no trades during the last 15 minutes, then the last traded price in continuous trading is taken as the official close. Bombay Stock Exchange prices are only used for securities not traded on the NSE.
3:30PM
India National Stock Exchange of India .NS IS VWAP
The closing price of a security is the weighted average price of the last half hour (3:00PM-3:30PM). If there are no trades during the last 30 minutes, then the last traded price is taken as the official close. However, in cases where such prices are not available due to the delisting from the National Stock Exchange (NSE), official closing prices from the Bombay Stock Exchange will be used.
4:15PM
Indonesia Jakarta Stock Exchange .JK IJ Last traded price Last traded price 4:00PM
Ireland Irish Stock Exchange .I ID Auction close
The session ends with a 2 minute auction (between 4:28PM and 4:30PM). If a security is traded during the closing auction, the auction price will be the official closing price. If there are trades during the opening auction or during the continuous trading period, but no trades during the closing auction, the last traded price will be the official closing price. If there are no trades on a particular day, the previous day's official closing price will be the official closing price.
5.05PM
Israel (Domestic) Tel Aviv Stock Exchange .TA IT VWAP
TASE (Tel Aviv Stock Exchange) uses the last ILS 250,000 - 500,000 trades during the last 30 minutes of trading to calculate a Volume Weighted Average Price which will be considered as the Official Close.
5:15PM
Israel (Non- Domestic) NASDAQ .OQ UQ see USA
(NASDAQ) see USA (NASDAQ) see USA (NASDAQ)

32
Index Calculation Methodology
Country Exchange Reuters Code
Bloomberg Code Price used Description (For more detailed information, please contact the relevant exchange)
(1) Closing Prices
availability
Italy Italian Stock Exchange .MI IM Auction close
The closing auction, including a pre-auction phase that can end at any time within the last minutes of that actual pre-auction phase. Closing auction, comprising the closing phases and validation, will end at 5.40PM local time. Where no auction price is available, the reference price, defined by the exchange as the Volume Weighted average of the last 10% of the day's trading volume, will be used.
5:40PM
Japan Nagoya Stock Exchange .NG JN Auction close
The closing price is determined during a price auction which takes place at the end of the normal trading day. During this auction, all orders entered in the individual order book are aggregated before the execution, and treated as simultaneous orders. In accordance with the principle of price priority, each buy order is compared with sell orders until its volume and price are matched. By this method, a single price is determined and this price makes up the closing price. In the event of a closing auction not happening for a particular day, the last price (Itayose or special quote method) will be used instead.
3:15PM
Japan Osaka Securitites Exchange .OS JO Auction close
The closing price is determined during a price auction which takes place at the end of the normal trading day. During this auction, all orders entered in the individual order book are aggregated before the execution, and treated as simultaneous orders. In accordance with the principle of price priority, each buy order is compared with sell orders until its volume and price are matched. By this method, a single price is determined and this price makes up the closing price. In the event of a closing auction not happening for a particular day, the last price (Itayose or special quote method) will be used instead.
3:10PM
Japan Tokyo Stock Exchange .T JT Auction close
The closing price is determined during a price auction which takes place at the end of the normal trading day. During this auction, all orders entered in the individual order book are aggregated before the execution, and treated as simultaneous orders. In accordance with the principle of price priority, each buy order is compared with sell orders until its volume and price are matched. By this method, a single price is determined and this price makes up the closing price. In the event of a closing auction not happening for a particular day, the last price (Itayose or special quote method) will be used instead.
3:00PM
Japan JASDAQ .OQ JQ Auction close
The closing price is determined during a price auction which takes place at the end of the normal trading day. During this auction, all orders entered in the individual order book are aggregated before the execution, and treated as simultaneous orders. In accordance with the principle of price priority, each buy order is compared with sell orders until its volume and price are matched. By this method, a single price is determined and this price makes up the closing price. In the event of a closing auction not happening for a particular day, the last price (Itayose or special quote method) will be used instead.
3:00PM
Jordan Amman Stock Exchange .AM JR Last traded price Last traded price 12:00PM

33
Index Calculation Methodology
Country Exchange Reuters Code
Bloomberg Code Price used Description (For more detailed information, please contact the relevant exchange)
(1) Closing Prices
availability
Korea KSE .KS KS Auction close The closing price is the price for which the highest number of orders can be executed during the auction. The auction starts 10 minutes before the official close at 3:00PM. 3:00PM
Korea KOSDAQ .KQ KQ Auction close The closing price is the price for which the highest number of orders can be executed during the auction. The auction starts 10 minutes before the official close at 3:00PM. 3:00PM
Kuwait Kuwait Stock Exchange .KW KK Last traded price Last traded price 12:30PM
Malaysia Kuala Lumpur Stock Exchange .KL MK Last traded price Last traded price 5:00PM
Mexico Bolsa Mexicanan de Valores .MX MM Weighted average
price Weighted Average Price of the last 10 minutes of trading 3:00PM
Morocco Bourse De Casablanca .CS MC Last traded price Last traded price 3:30PM
Netherlands EuroNext Amsterdam .AS NA Auction price The Closing price is an Auction price calculated between 5:25PM and 5:30PM. It is still possible to trade at the Auction price between 5:30PM and 5:40PM. 5:30PM
New Zealand New Zealand Exchange Limited .NZ NZ Last traded price Last traded price 5:00PM
Norway Oslo Stock Exchange .OL NO Auction close
The official closing prices is determined during a closing auction which takes place at the end of the continuous trading between 16:20 and 16:30. When the closing auction for a particular security cannot be completed, the last traded price before the start of the auction will be used.
4:30PM
Oman Oman Muscat Exchange .OM OM Last traded price Last traded price 1:00PM
Pakistan Karachi Stock Exchange .KA PA Last traded price Last traded price
2:15PM (Mon-Thu), 1:15PM
(Fri)
Peru Bolsa De Valores de Lima .LM PE Last traded price Last round lot regular trade 4:00PM
Philippines Philippine Stock Exchange .PS PM Last traded price Last traded price 12:10PM
Poland Warsaw Stock Exchange .WA PW Auction Close
The closing price is determined in an auction procedure in which the closing price will be based on orders submitted during the closing phase. If no orders are placed during the closing phase then the closing price will be that of the last transaction.
4:30PM
Portugal EuroNext Libson .LS PL Auction close Auction close 4:30PM
Qatar Doha Securities Market .QA QD VWAP The closing price is calculated electronically and is the value weighted average of the stock
price with a 5% limit of price fluctuation up and down. 11:30AM

34
Index Calculation Methodology
Country Exchange Reuters Code
Bloomberg Code Price used Description (For more detailed information, please contact the relevant exchange)
(1) Closing Prices
availability
Russia Russian Trading System (RTS) .RTS RU Last traded price Last traded price 4:00PM
Russia Moscow Interbank
Currency Exchange (MICEX)
.MM RM Last traded price Last traded price 4:00PM
Russia (US listed Depository Receipts)
New York Stock Exchange .N UN see USA (NYSE) see USA (NYSE) see USA
(NYSE)
Russia (UK listed Depository Receipts)
London Stock Exchange .L LN see UK (SETS) see UK (SETS) see UK
(SETS)
Saudi Arabia Saudi SE (Tadawul) .SE AB Last traded price Last traded price 12:00PM
Singapore Singapore Exchange Securities Trading .SI SP Auction close
At 5:00PM, all unmatched orders are carried forward to Pre-Close Routine, which runs for 6 minutes and consists of a Pre-Close Period and a Non-Cancel Period. Similarly, orders can be entered, amended or cancelled during the Pre-Close Period (5:00PM - 5:05PM). During the Non-Cancel Period (5:05PM - 5:06PM), orders are matched and executed at a Closing price computed for the day, while unmatched orders will become void.
5:06PM
South Africa Jonannesburg Stock Exchange .J SJ Last traded price /
VWAP
The closing prices on securities traded on the South Africa Exchange will be calculated based on the price at which trades occurred in a closing execution. In this closing execution, the last traded price will be the official closing price, unless there is a higher bid price or a lower ask offer, which will then be used as the closing price. In the event that there is no closing execution, then a Volume Weighted Average Price (VWAP) taken over the last 10 minutes of trading leading up to the "closing auction" is used.
5:05PM
Spain Mercado Continuo CATS .MC SM Auction price
The session ends with a 5 minute auction (between 5:30PM and 5:35PM) and a random closing of 30 seconds. The resulting auction price will be the session's Closing price. In case an Auction price does not exist, the closing price will be the price of the last 500 traded units closest to their weighted average. If two prices have the same difference with respect to this weighted price, the price will be the last one executed. If 500 units have not been traded, the closing price will be the price of the previous session.
5:35PM
Sri Lanka Colombo Stock Exchange .CM SL VWAP
Closing price is defined as the Volume Weighted Average Price (VWAP) of trades executed during the last one hour of trading of the specific security. If the security does not trade during such one hour the closing price will be the VWAP calculated for the period of time it has traded.
2:30PM

35
Index Calculation Methodology
Country Exchange Reuters Code
Bloomberg Code Price used Description (For more detailed information, please contact the relevant exchange)
(1) Closing Prices
availability
Sweden Stockholm Stock Exchange .ST SS Auction price
The official closing price is the result of the closing call which occurs during the last 10 minutes of trading. If no trades are matched in the closing call then the last trade prior to the auction will be defined as the closing price.
5:30PM
Switzerland The Swiss Exchange
(SWX) Virt-X
.S .VX
SE VX Auction price
Closing price is the result of the closing auction (the auction pre-opening starting at 5:20PM, and the auction being run at 5:30PM). If no price update occurs during that auction, the last paid price on the exchange will represent the reference price. If there is no paid price for the given security that day, the reference price will be calculated by either taking the bid-price, if the bid is higher than the reference price, or it will take the ask-price if the ask is lower than the reference price.
5:30PM
Taiwan Taiwan Stock Exchange .TW TT Auction price
The closing price is determined by a closing call auction. The Exchange will accumulate orders for 5 minutes (from 1:25 p.m. to 1:30 p.m.) before the closing call auction. If there is no closing auction for a security, the last traded price will be used.
1:30PM
Thailand The Stock Exchange Of Thailand .BK TB Auction price The closing price is defined by using the random call auction method. The closing auction
can take place anytime between 4:35PM and 4:40PM local time. 4:40PM
Turkey Istanbul Stock Exchange .IS TI Last traded price Last traded price 4:30PM
United Arab Emirates
Abu Dhabi Securities Market .AD UH VWAP The closing price is the value weighted average of the stock price for the day. There is
currently no minimum volume restrictions. 12:00PM
United Arab Emirates Abu Dhabi .DU UH VWAP The closing price is the value weighted average of the stock price for the day. 1:00PM
United Kingdom London Stock Exchange .L LN Auction price
For SETS, the closing trade price is the uncrossing trade price at which orders execute during an auction, or a Volume Weighted Average Price (VWAP), or the last automatic trade price. If a closing auction fails to take place, then the VWAP of the last 10 minutes of trading will be used to set the closing price. If however, no trading has occurred during the VWAP period, then the last automatic trade price will be used as the official closing price.
4:35PM
United Kingdom London Stock Exchange .L LN Mid price For SEAQ, SEATS and AIM securities the closing price is the mid price of the best bid and
best offer calculated from market maker quotes at the end of the mandatory quote period. 4:35PM
USA NASDAQ .OQ UQ NOCP
The NOCP is either determined using the normalized price of the last trade reported to NASDAQ's proprietary trade reporting system or, for selected securities, using the newly introduced NASDAQ Closing Cross. The normalized NASDAQ Official Closing Price (NOCP) adjusts reported trade price outside the closing bid-ask spread, "moving up" to the bid whenever the last sale is below the bid or "moving down" to the ask whenever the last sale is above the ask.
4:02PM
USA NYSE .N UN Last traded price Last traded price 4:00PM

36
Index Calculation Methodology
Country Exchange Reuters Code
Bloomberg Code Price used Description (For more detailed information, please contact the relevant exchange)
(1) Closing Prices
availability
USA AMEX .A UA Last traded price Last traded price 4:00PM
Venezuela Bolsa De Valores De Caracas .CR VC Last traded price Last traded price 2:30PM
* Refers to price availability times during DST period in the US.

37
Index Calculation Methodology
Appendix VI: Country Composition of MSCI Regional Indices MSCI Region Index / Country Index Inclusion Matrix
INDEX NAME 8924
00 A
CW
I (fo
rmer
AC
WIF
)
8918
00 E
M
(form
er E
MF)
9901
00
TH
E W
OR
LD
IND
EX
(3)
9903
00
EAF
E
9905
00
EU
RO
PE
1064
00
EM
U
3022
00
AC E
UR
OPE
&
MID
DLE
EAS
T
3020
00
AC A
SIA
PAC
IFIC
8999
02
AC A
ME
RIC
AS
ARGENTINA 1-Jan-1988 1-Jan-1988 - - - - - - 1-Jan-1988 AUSTRALIA 1-Jan-1988 - 1-Jan-1970 1-Jan-1970 - - - 1-Jan-1988 - AUSTRIA 1-Jan-1988 - 1-Jan-1970 1-Jan-1970 1-Jan-1970 1-Jan-1988 1-Jan-1988 - - BELGIUM 1-Jan-1988 - 1-Jan-1970 1-Jan-1970 1-Jan-1970 1-Jan-1988 1-Jan-1988 - - BRAZIL 1-Jan-1988 1-Jan-1988 - - - - - - 1-Jan-1988 CANADA (3) 1-Jan-1988 - 1-Jan-1970 - - - - - 1-Jan-1988 CHILE 1-Jan-1988 1-Jan-1988 - - - - - - 1-Jan-1988 CHINA 3-Sep-1996 3-Sep-1996 - - - - - 3-Sep-1996 - COLOMBIA 2-Feb-1994 2-Feb-1994 - - - - - - 2-Feb-1994 CZECH REPUBLIC 3-Sep-1996 3-Sep-1996 - - - - 3-Sep-1996 - - DENMARK 1-Jan-1988 - 1-Jan-1970 1-Jan-1970 1-Jan-1970 - 1-Jan-1988 - - EGYPT 1-Jun-2001 1-Jun-2001 - - - - - - - FINLAND 18-Jan-1993 - 1-Jan-1988 1-Jan-1988 1-Jan-1988 1-Jan-1988 1-Jan-1988 - - FINLAND FREE 1-Jan-1988 to
17-Jan-1993- - - - - - - -
FRANCE 1-Jan-1988 - 1-Jan-1970 1-Jan-1970 1-Jan-1970 1-Jan-1988 1-Jan-1988 - - GERMANY 1-Jan-1988 - 1-Jan-1970 1-Jan-1970 1-Jan-1970 1-Jan-1988 1-Jan-1988 - - GREECE 1-Jan-1988 1-Jan-1988 to
31-May-20011-Jun-2001 1-Jun-2001 1-Jun-2001 1-Jun-2001 1-Jan-1988 - -
HONG KONG 1-Jan-1988 - 1-Dec-1972 1-Dec-1972 - - - 1-Jan-1988 - HUNGARY 3-Sep-1996 3-Sep-1996 - - - - 3-Sep-1996 - - INDIA 2-Feb-1994 2-Feb-1994 - - - - - 2-Feb-1994 -

38
Index Calculation Methodology
INDEX NAME 8924
00 A
CW
I (fo
rmer
AC
WIF
)
8918
00 E
M
(form
er E
MF)
9901
00
TH
E W
OR
LD
IND
EX
(3)
9903
00
EAF
E
9905
00
EU
RO
PE
1064
00
EM
U
3022
00
AC E
UR
OPE
&
MID
DLE
EAS
T
3020
00
AC A
SIA
PAC
IFIC
8999
02
AC A
ME
RIC
AS
INDONESIA FORMER 1-Sep-1989 to 1-Jun-1997
1-Sep-1989 to 1-Jun-1997
- - - - - 1-Sep-1989 to 1-Jun-1997
-
INDONESIA 2-Jun-1997 2-Jun-1997 - - - - - 2-Jun-1997 - IRELAND (2) 1-Jan-1988 - 3-May-1993 3-May-1993 3-May-1993 3-May-1993 1-Jan-1988 - - ISRAEL 2-Feb-1994 2-Mar-1995 - - - - 2-Mar-1995 - - ITALY 1-Jan-1988 - 1-Jan-1970 1-Jan-1970 1-Jan-1970 1-Jan-1988 1-Jan-1988 - - JAPAN 1-Jan-1988 - 1-Jan-1970 1-Jan-1970 - - - 1-Jan-1988 - JORDAN 1-Jan-1988 1-Jan-1988 - - - - 1-Jan-1988 - - KOREA 1-Sep-1998 1-Sep-1998 - - - - - 1-Sep-1998 - KOREA (FORMER)(7) 7-Jan-1992 to
31-Aug-19987-Jan-1992 to 31-Aug-1998
- - - - - 7-Jan-1992 to 31-Aug-1998
-
LUXEMBOURG (2) 1-Jan-1988 to 30-Sep-1996
- - - - - 1-Jan-1988 to 30-Sep-
1996
- -
MALAYSIA 2-Jun-1997 to 30-Nov-1998 & 1-Jun-2000
2-Jun-1997 to 30-Nov-1998 & 1-Jun-2000
- - - - - 2-Jun-1997 to 30-Nov-1998 & 1-Jun-2000
-
MALAYSIA FORMER 1-Jan-1988 to 1-Jun-1997
1-Jan-1988 to 1-Jun-1997
3-May-1993 to 30-Sep-98
3-May-1993 to 30-Sep-98
- - - 1-Jan-1988 to 1-Jun-1997
-
MEXICO 1-Jan-1988 1-Jan-1988 - - - - - - 1-Jan-1988 MEXICO FORMER - - 5-Nov-1981 to
31-Dec-1987- - - - - -
MOROCCO 1-Jun-2001 1-Jun-2001 - - - - - - - NETHERLANDS 1-Jan-1988 - 1-Jan-1970 1-Jan-1970 1-Jan-1970 1-Jan-1988 1-Jan-1988 - - NEW ZEALAND 1-Jan-1988 - 1-Jan-1988 1-Jan-1988 - - - 1-Jan-1988 - NORWAY 1-Feb-1995 - 1-Jan-1970 1-Jan-1970 1-Jan-1970 - 1-Jan-1988 - -

39
Index Calculation Methodology
INDEX NAME 8924
00 A
CW
I (fo
rmer
AC
WIF
)
8918
00 E
M
(form
er E
MF)
9901
00
TH
E W
OR
LD
IND
EX
(3)
9903
00
EAF
E
9905
00
EU
RO
PE
1064
00
EM
U
3022
00
AC E
UR
OPE
&
MID
DLE
EAS
T
3020
00
AC A
SIA
PAC
IFIC
8999
02
AC A
ME
RIC
AS
NORWAY FREE (4) 1-Jan-1988 to 31-Jan-1995
- - - - - - - -
PAKISTAN 2-Feb-1994 2-Feb-1994 - - - - - 2-Feb-1994 - PERU 2-Feb-1994 2-Feb-1994 - - - - - - 2-Feb-1994 PHILIPPINES 1-Jan-1988 1-Jan-1988 - - - - - 1-Jan-1988 - PHILIPPINES FORMER - - - - - - - - - POLAND 2-Mar-1995 2-Mar-1995 - - - - 2-Mar-1995 - -
PORTUGAL 1-Jan-1988 1-Jan-1988 to 30-Nov-1997
01-Dec-1997 01-Dec-1997 01-Dec-1997 01-Dec-1997 1-Jan-1988 - -
RUSSIA 01-Dec-1997 01-Dec-1997 - - - - 01-Dec-1997
- -
SINGAPORE (SINGAPORE/MALAYSIA)
1-Dec-1999 - 01-Dec-1972 01-Dec-1972 - - - 1-Dec-1999 -
SINGAPORE (FORMER) 1-Jan-1988 to 30-Apr-1993
- - - - - - 1-Jan-1988 to 30-Apr-1993
-
SINGAPORE FREE (5) 3-May-1993 to 30-Nov-1999
- - - - - - 3-May-1993 to 30-Nov-
1999
-
SOUTH AFRICA 2-Mar-1995 2-Mar-1995 - - - - - - - SOUTH AFRICAN GOLD MINES (1)
1-Jan-1988 to 1-Mar-1995
- 2-Dec-1974 to 1-Mar-1995
- - - - - -
SPAIN 1-Jan-1988 - 1-Jan-1970 1-Jan-1970 1-Jan-1970 1-Jan-1988 1-Jan-1988 - - SRI LANKA 2-Feb-1994 to
31-May-20012-Feb-1994 to 31-May-2001
- - - - - 2-Feb-1994 to 31-May-2001
-
SWEDEN 18-Jan-1993 - 1-Jan-1970 1-Jan-1970 1-Jan-1970 - 1-Jan-1988 - -

40
Index Calculation Methodology
INDEX NAME 8924
00 A
CW
I (fo
rmer
AC
WIF
)
8918
00 E
M
(form
er E
MF)
9901
00
TH
E W
OR
LD
IND
EX
(3)
9903
00
EAF
E
9905
00
EU
RO
PE
1064
00
EM
U
3022
00
AC E
UR
OPE
&
MID
DLE
EAS
T
3020
00
AC A
SIA
PAC
IFIC
8999
02
AC A
ME
RIC
AS
SWEDEN FREE 1-Jan-1988 to 17-Jan-1993
- - - - - - -
SWITZERLAND 16-Jul-1992 - 1-Jan-1970 1-Jan-1970 1-Jan-1970 - 1-Jan-1988 - - SWITZERLAND FREE 1-Jan-1988 to
15-Jul-1992- - - - - - - -
TAIWAN 3-Jun-2002 3-Jun-2002 - - - - - 3-Jun-2002 - TAIWAN @ 50/65/80%(6) 3-Sep-1996 to
2-Jun-20023-Sep-1996 to
2-Jun-2002- - - - - 3-Sep-1996 to
2-Jun-2002-
THAILAND FORMER 1-Jan-1988 to 1-Jun-1997
1-Jan-1988 to 1-Jun-1997
- - - - - 1-Jan-1988 to 1-Jun-1997
-
THAILAND 2-Jun-1997 2-Jun-1997 - - - - - 2-Jun-1997 - TURKEY 1-Sep-1989 1-Sep-1989 - - - - 1-Oct-1996 - - UNITED KINGDOM 1-Jan-1988 - 1-Jan-1970 1-Jan-1970 1-Jan-1970 - 1-Jan-1988 - - USA (3) 1-Jan-1988 - 1-Jan-1970 - - - - - 1-Jan-1988 VENEZUELA 2-Feb-1994 to
31-May-20062-Feb-1994 to 31-May-2006
- - - - - - 2-Feb-1994 to 31-May-2006
(1) excluded from all total return indices. (2) Luxembourg has been excluded from total return indices since 01-Jan-1993 and Ireland prior to 03-May-1993. (3) Until 29-Nov-1974, the World Index was a weighted arithmetic average of the MSCI EAFE, of the NYSE and the TSE indices. (4) Restrictions appeared since 01-Dec-1989. (5) No more foreign quotation since 01-Dec-1999. Prices taken from the foreign board between 04-May-1988 and 30-Nov-1999. (6) Taiwan was included at 50% of market cap from 03-Sep-1996 to 31-May-2000, at 65% from 01-Jun-2000 to 30-Nov-2000 and at 80% from 01-Dec-2000 to 02-Jun-2002. (7) Korea was included at 20% of market cap from 07-Jan-1992 to 02-Sep-1996 and at 50% from 03-Sep-1996 to 31-Aug-1998.

41
Index Calculation Methodology
Appendix VII: Frequently Asked Questions What is the difference between the MSCI Singapore and the MSCI Singapore Free; the MSCI EAFE® and the MSCI EAFE Free; the MSCI World and the MSCI World Free Indices? In the 1990s, Singapore enacted a system to prevent companies in strategic industries (mainly banks, airlines and the media) from being controlled by foreigners. Certain shares had limits on the percent that could be purchased by foreigners. Once the limit was reached, these shares traded at a premium price. The MSCI Singapore Free Index used the prices at which foreigners could trade. MSCI also started calculating the regional indices, MSCI World Free, MSCI EAFE Free and MSCI Pacific Free Indices to include the MSCI Singapore Free Index as well as to reflect investment restrictions in some of the Nordic countries and Switzerland. The MSCI Singapore Index (non-free version) reflected the investment opportunities applicable to domestic investors. In May of 1999, the foreign ownership restrictions in Singapore were lifted and as of that date, the MSCI Singapore and MSCI Singapore Free Indices and the corresponding regional developed market Free and non-Free indices have had the same constituent market caps and performance. Only the absolute index levels continue to differ. MSCI will continue both the Free and Non-Free versions of MSCI Singapore, MSCI EAFE and MSCI World Indices to reflect the differing history. What is the difference between the MSCI Israel Domestic and the MSCI Israel Non-Domestic Indices? The Israeli universe includes companies listed in Tel Aviv, New York and the Nasdaq, due to the fact that some important Israeli incorporated companies are only listed outside of Israel. To reflect this, MSCI calculates three standard indices for Israel: MSCI Israel Non-Domestic that contains Israeli securities quoted outside of Israel, MSCI Israel Domestic that contains Israeli securities quoted on the Tel-Aviv exchange and MSCI Israel is a combination of both indices. While there are instances in other countries where some companies are listed exclusively outside their domestic market, in Israel these companies are large relative to the total market capitalization of the country. For those companies that trade both in Tel Aviv and in the US, MSCI always uses the Tel Aviv exchange price to be consistent with our policy in other countries where companies can be listed outside the home market.

42
Index Calculation Methodology
MSCI Index Calculation Methodology Book Tacked Changes The following sections and appendix have been updated since February 13, 2006, date of the last version of the methodology book. Section 1: MSCI Price Index Methodology
• The ‘Unadjusted previous Market Cap’ has been renamed to ‘Initial Market Capitalization’ without impacting the calculation methodology (this market caps will be available in MSCI Product in July 2006)
• New sub-sections added to reflect enhancements to be implemented in MSCI products in July 2006:
1.3 Price Index Level (from Security Information) 1.4 Security Contribution to the Index 1.5 Today Initial Security Weight
Section 2: MSCI Daily Total Return (DTR) Index Methodology
• The ‘Unadjusted previous Market Cap’ has been renamed to ‘Initial Market Capitalization’ without impacting the calculation methodology (this market caps will be available in MSCI Product in July 2006)
• New sub-sections added to reflect enhancements to be implemented in MSCI products in July 2006:
2.1.2 DTR Index Level from Security Information (Security DTR) 2.1.3 Security Contribution to the Index
Appendix I: MSCI GCC Country Indices: Saturday/Sunday Index Calculation • New Appendix added covering GCC Countries Saturday and Sunday performance data to be available in
MSCI product in May 2006